full
TRANSCRIPT
14 March 2012
HIGHLIGHTS • Oil futures prices moved higher in tandem with escalating supply‐
side risks. Geopolitical tension and unplanned outages in non‐OPEC countries dented oil supply, while potential additional losses relating to Iran add more uncertainty for the crude outlook. Futures prices were last trading around $125/bbl (Brent) and $106/bbl (WTI).
• Global demand is expected to grow by 0.8 mb/d (+0.9%) in 2012 to 89.9 mb/d, unchanged from last month’s projection. The relatively subdued economic backdrop – with a global GDP expansion of 3.3% foreseen for 2012 (3.8% in 2011) – and high oil prices both restrain any upside momentum for consumption.
• Non‐OPEC supply grew by only 0.3 mb/d annually for 1Q12, as geopolitical and technical outages dented growth. Unplanned outages in the North Sea and Canada as well as geopolitical disputes in Africa and the Middle East reduced output. The Americas and the Former Soviet Union support overall growth for 2012 at 0.7 mb/d.
• OPEC crude supply rose by 315 kb/d February, led by a three‐decade peak in Saudi output and a sharp recovery in Libyan production. Output of 31.42 mb/d was the highest level since mid‐2008. The ‘call on OPEC crude and stock change’ for 2012 is raised by 0.2 mb/d for 2Q12 and 3Q12, to average of 30.1 mb/d, due to lower forecast non‐OPEC supplies.
• Global refinery crude throughputs are largely unchanged for 1Q12, as weaker‐than‐expected non‐OECD readings were offset by a counter‐seasonal increase in US runs in February. 4Q11 runs, however, were a sizable 300 kb/d lower, falling 120 kb/d y‐o‐y. Runs should rise 180 kb/d in 1Q12 and 600 kb/d in 2Q12, to 74.9 mb/d and 74.5 mb/d, respectively.
• OECD industry oil stocks increased by a muted 13.6 mb to 2 614 mb in January, remaining below the five‐year average for a seventh consecutive month. Forward demand cover rose to 57.8 days. February preliminary data indicate a seasonal 12.6 mb drop in OECD industry stocks.
TABLE OF CONTENTS
HIGHLIGHTS ....................................................................................................................................................................................... 1
A HEADY BREW ................................................................................................................................................................................ 4
DEMAND ............................................................................................................................................................................................. 5 Summary ........................................................................................................................................................................................... 5 Global Overview ............................................................................................................................................................................ 5 OECD ............................................................................................................................................................................................... 6
North America .......................................................................................................................................................................... 7 Europe ......................................................................................................................................................................................... 8 Pacific ........................................................................................................................................................................................... 9
Non-OECD ................................................................................................................................................................................... 10 China .......................................................................................................................................................................................... 12 Other Non-OECD .................................................................................................................................................................. 13
Brazilian Gasoline: A Bitter Mix ..................................................................................................................................... 14
SUPPLY ................................................................................................................................................................................................ 15 Summary ......................................................................................................................................................................................... 15 OPEC Crude Oil Supply ............................................................................................................................................................. 16
European Refiners Tapped Other OPEC Supply to Replace Lost Libyan Barrels ..................................................... 19 OECD ............................................................................................................................................................................................. 20
North America ........................................................................................................................................................................ 20 North Sea .................................................................................................................................................................................. 21 Other OECD ........................................................................................................................................................................... 22
Non-OECD ................................................................................................................................................................................... 23 Former Soviet Union .............................................................................................................................................................. 23 Latin America ........................................................................................................................................................................... 24 Asia ............................................................................................................................................................................................. 25 Africa .......................................................................................................................................................................................... 25 Middle East ................................................................................................................................................................................ 26
OECD STOCKS ................................................................................................................................................................................ 27 Summary ......................................................................................................................................................................................... 27 OECD Inventories at End-January and Revisions to Preliminary Data .................................................................... 27 Analysis of Recent OECD Industry Stock Changes .............................................................................................................. 28
OECD North America ........................................................................................................................................................... 28 OECD Europe .......................................................................................................................................................................... 29 OECD Pacific ........................................................................................................................................................................... 30
Recent Developments in Singapore and China Stocks ......................................................................................................... 31
PRICES ................................................................................................................................................................................................. 33 Summary ......................................................................................................................................................................................... 33 Market Overview ......................................................................................................................................................................... 33 Futures Markets ............................................................................................................................................................................ 35
Activity Levels .......................................................................................................................................................................... 35 Market Regulation ................................................................................................................................................................... 37
High Frequency Traders: Flash Crashers or Liquidity Providers? ........................................................................... 38 Spot Crude Oil Prices ................................................................................................................................................................. 40
REFINING ........................................................................................................................................................................................... 45 Summary ......................................................................................................................................................................................... 45 Global Refining Overview ........................................................................................................................................................... 45 OECD Refinery Throughput ...................................................................................................................................................... 47
Petroplus Assets Back in Action .......................................................................................................................................... 51 Non-OECD Refinery Throughput ............................................................................................................................................ 52
Russian Refinery Runs Boosted by Higher Prices ............................................................................................................. 53
TABLES ................................................................................................................................................................................................ 56

The IEA is Seeking to Recruit a Head of the Oil Industry and Markets Division
The International Energy Agency (IEA) is seeking a dynamic and experienced energy expert to serve as the Editor of the IEA Oil Market Report as well as leading its Oil Industry and Markets Division. He or she will supervise and co‐ordinate the IEA's work on the monitoring of and reporting on oil industry and market developments.
Major responsibilities include:
• Plan, lead and co‐ordinate the preparation of the IEA's monthly Oil Market Report, annual Medium‐Term Oil Market Report and Annual Statistical Supplement, the presentation of results for the Governing Board and the Standing Group on the Oil Market (SOM), and follow up with media, governments and the oil industry.
• Advise Governments on recent trends in the global oil market and medium‐term developments and analysis on the role of physical and financial markets in oil price formation, particularly highlighting policy‐related issues and recommending appropriate action; plan and coordinate meetings of the Standing Group on the Oil Market.
• Supervise the work of professional and support staff and consultants.
• Develop and maintain close contacts with government officials on important policy developments, as well as with oil companies and consultants.
• Co‐operate with other Divisions in the IEA on, inter alia, oil industry aspects of their work, country reviews, the development of long‐range energy outlooks and environmental issues.
• Provide market information and expertise during oil emergencies and support and participate in exercises related to maintaining emergency response capabilities.
The ideal candidate will possess:
• An advanced university degree in economics, science, engineering, or a related discipline.
• Ten to fifteen years' experience in the international oil industry with experience in the field of oil and energy policy. Specific areas of expertise include any or all of the following: oil production, refining and distribution, oil trade, oil stock policy or product quality issues.
• Strong analytical, communication and interpersonal skills, political sensitivity and ability to establish and maintain effective working relations with senior government and industry officials.
• Proven ability in team‐building as well as in planning, co‐ordinating and supervising team work. Strong achievement orientation and personal initiative, as well as the ability to work under pressure, often to tight deadlines.
• An excellent level of oral and written communication skills and excellent drafting ability in English; working knowledge of French and other languages would be an advantage.
The IEA operates as an autonomous agency within the Organisation for Economic Co‐operation and Development (OECD).
The full vacancy note and on‐line application form is available on the OECD website at www.oecd.org. Click on Job Vacancies ‐ Head of Division: Oil industry & Markets Division ‐ Job Reference No. 08112. The position will start 1 July 2012.
On‐line applications (in English or French) from nationals of OECD member countries should be submitted by no later than midnight (CET) on 25 March 2012.
The OECD is an equal opportunity employer offering an attractive remuneration package and encourages applications from all qualified candidates.
ORGANISATION FOR ECONOMIC CO-OPERATION AND DEVELOPMENT Organisation de coopération et de développement économiques

MARKET OVERVIEW INTERNATIONAL ENERGY AGENCY ‐ OIL MARKET REPORT
4 14 MARCH 2011
A HEADY BREW Geopolitical risks are ever‐present in the oil market, and prompt fierce debate about the degree of risk premium in prevailing price levels. However, quantifying a risk premium is a lot harder than surmising that one exists. Current market dynamics are highly complex, and include a heady brew of both real and anticipated supply‐side risks, alongside a very evident tightening in actual market fundamentals that has been underway since mid‐2010. Concerns over dislocations to normal inter‐regional trade deriving from the economic measures taken against Iran, and this more prosaic ongoing tightening in the supply/demand balance, have combined to lead prices higher by 20% since December. Last month, we focused on some of the midstream and downstream ‘micro’ factors currently at play in the oil market, and which are influencing price differentials and arbitrage flows. This month, it seems appropriate to stand back and acknowledge a big picture that, arguably, explains more of the price strength seen in recent months than does ‘speculation’ about real and perceived geopolitical risks.
Put simply, a post‐recession OECD industrial stock overhang has gradually been whittled away. Inventories, notably crude in Europe and the Pacific, look very tight in absolute terms. Some analysts identify 58 days of OECD forward stock cover as painting a less troubling picture than implied by absolute stocks. That argument falls down on three counts, as a) absolute stocks provide a better measure of the system’s flexibility to adjust to supply or demand shocks, b) excluding North America, OECD cover stands two days below the five‐year average, and c) stock cover itself has fallen by around a day in the last six months. Perhaps more importantly, while China and other emerging consumers are building new strategic and industrial storage capacity, their actual holdings provide less domestic demand cover than those in the OECD. So the global ‘cushion’ is smaller than the OECD metric suggests.
0
1
2
3
4
5
6
7
8
9
2000 2001 2002 2003 2004 2005 2006 2007 2008 2009 2010 2011 2012
mb/d OPEC Spare Capacity
OPEC Effective Spare Capacity Iraq Ven/Nig Libya
Market focus shifted some time ago from demand to supply (as demand growth in 2011 and 2012 will likely average only 30% of 2010’s 2.7 mb/d). There may be no actual physical supply disruption at present deriving from the Iranian ‘issue’. But there are ongoing non‐OPEC outages totalling around 750 kb/d, as a slew of technical and political factors continue to hobble non‐OPEC supply, otherwise expected to rebound after a feeble 2011. Demand growth will likely remain stunted by weaker economic prospects (the more so if prices stay high), but a real risk of another year of underperforming non‐OPEC supply shines a spotlight once more on OPEC spare capacity. It is no coincidence that the last time effective spare capacity headed south of 3 mb/d, prices too were on a sustained rise. Temperatures surrounding the Iranian issue may well cool, and non‐OPEC output should recover as 2012 progresses. Until then, the market’s relatively slim ‘buffer’ suggests a bumpy ride in the months ahead.
OECD Industry Total Oil StocksRelative to Five-Year Average
-150-100-50
050
100150200
Jan 10 Jul 10 Jan 11 Jul 11 Jan 12
mb
Pacific North AmericaEurope OECD
INTERNATIONAL ENERGY AGENCY ‐ OIL MARKET REPORT DEMAND
14 MARCH 2012 5
DEMAND Summary • High oil prices and a subdued global economic backdrop are expected to contain demand for oil in
2012. Global oil consumption is seen reaching 89.9 mb/d in 2012, a gain of 0.8 mb/d (or 0.9%) on 2011. Estimates for absolute demand and growth for 2011 and 2012 are largely unchanged compared to last month’s report.
• The preliminary data series for January indicates global oil demand of 88.4 mb/d, 0.7 mb/d more
than assumed last month. Significantly stronger data from China (up 475 kb/d on our month earlier estimate), Germany (+115 kb/d) and Japan (+110 kb/d) lead the revision, although higher prices limit feed through to the rest of 2012.
• OECD demand growth continues to lag that in the non‐OECD. Oil consumption in the OECD fell by
0.5 mb/d in 2011 to 45.6 mb/d, whereas non‐OECD demand rose by 1.3 mb/d, to 43.5 mb/d. Partly a consequence of the OECD’s weaker macroeconomic underpinnings, the divergent trend is magnified by the presence of subsidies in the non‐OECD. The IMF assumes OECD GDP growth of 1.1% in 2012 (1.6% in 2011) versus 5.7% in the non‐OECD (6.2% in 2011). OECD demand is expected to fall by a further 0.4 mb/d to 45.2 mb/d in 2012. Non‐OECD consumption should rise further in 2012, up by 1.2 mb/d to 44.7 mb/d.
Global Oil Demand (2010-2012)
(million barrels per day)
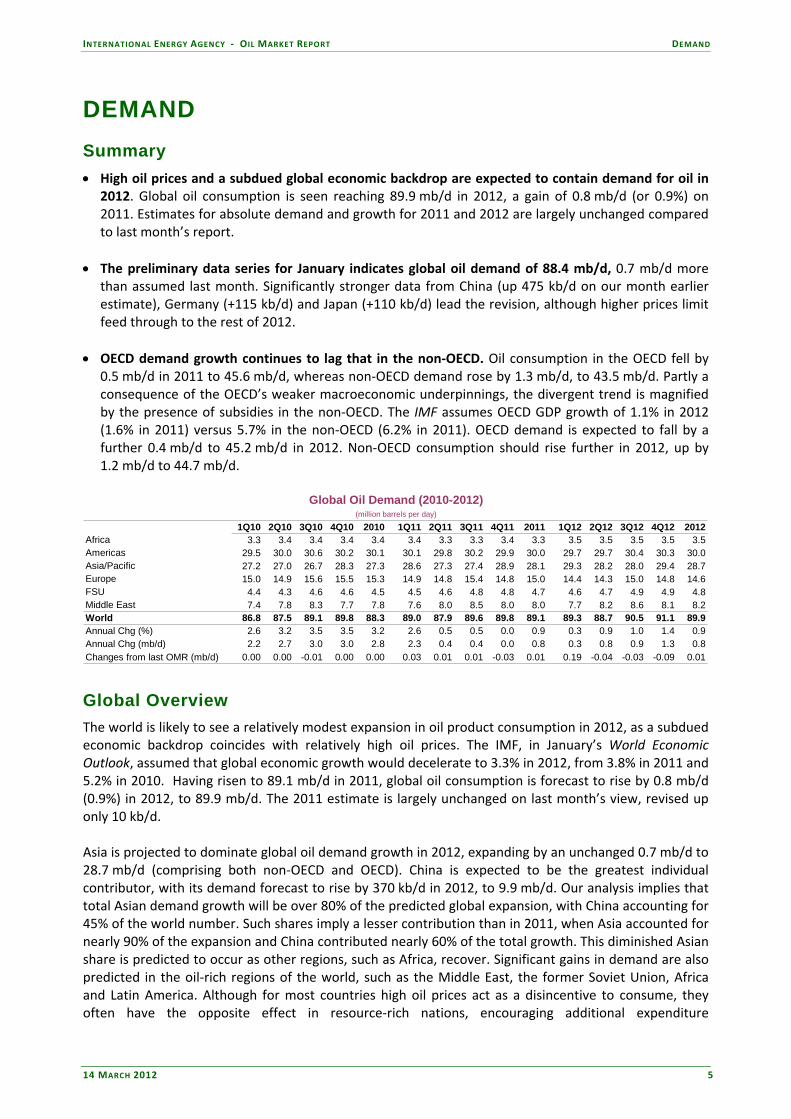
1Q10 2Q10 3Q10 4Q10 2010 1Q11 2Q11 3Q11 4Q11 2011 1Q12 2Q12 3Q12 4Q12 2012Africa 3.3 3.4 3.4 3.4 3.4 3.4 3.3 3.3 3.4 3.3 3.5 3.5 3.5 3.5 3.5Americas 29.5 30.0 30.6 30.2 30.1 30.1 29.8 30.2 29.9 30.0 29.7 29.7 30.4 30.3 30.0Asia/Pacific 27.2 27.0 26.7 28.3 27.3 28.6 27.3 27.4 28.9 28.1 29.3 28.2 28.0 29.4 28.7Europe 15.0 14.9 15.6 15.5 15.3 14.9 14.8 15.4 14.8 15.0 14.4 14.3 15.0 14.8 14.6FSU 4.4 4.3 4.6 4.6 4.5 4.5 4.6 4.8 4.8 4.7 4.6 4.7 4.9 4.9 4.8Middle East 7.4 7.8 8.3 7.7 7.8 7.6 8.0 8.5 8.0 8.0 7.7 8.2 8.6 8.1 8.2World 86.8 87.5 89.1 89.8 88.3 89.0 87.9 89.6 89.8 89.1 89.3 88.7 90.5 91.1 89.9Annual Chg (%) 2.6 3.2 3.5 3.5 3.2 2.6 0.5 0.5 0.0 0.9 0.3 0.9 1.0 1.4 0.9Annual Chg (mb/d) 2.2 2.7 3.0 3.0 2.8 2.3 0.4 0.4 0.0 0.8 0.3 0.8 0.9 1.3 0.8Changes from last OMR (mb/d) 0.00 0.00 -0.01 0.00 0.00 0.03 0.01 0.01 -0.03 0.01 0.19 -0.04 -0.03 -0.09 0.01
Global Overview The world is likely to see a relatively modest expansion in oil product consumption in 2012, as a subdued economic backdrop coincides with relatively high oil prices. The IMF, in January’s World Economic Outlook, assumed that global economic growth would decelerate to 3.3% in 2012, from 3.8% in 2011 and 5.2% in 2010. Having risen to 89.1 mb/d in 2011, global oil consumption is forecast to rise by 0.8 mb/d (0.9%) in 2012, to 89.9 mb/d. The 2011 estimate is largely unchanged on last month’s view, revised up only 10 kb/d. Asia is projected to dominate global oil demand growth in 2012, expanding by an unchanged 0.7 mb/d to 28.7 mb/d (comprising both non‐OECD and OECD). China is expected to be the greatest individual contributor, with its demand forecast to rise by 370 kb/d in 2012, to 9.9 mb/d. Our analysis implies that total Asian demand growth will be over 80% of the predicted global expansion, with China accounting for 45% of the world number. Such shares imply a lesser contribution than in 2011, when Asia accounted for nearly 90% of the expansion and China contributed nearly 60% of the total growth. This diminished Asian share is predicted to occur as other regions, such as Africa, recover. Significant gains in demand are also predicted in the oil‐rich regions of the world, such as the Middle East, the former Soviet Union, Africa and Latin America. Although for most countries high oil prices act as a disincentive to consume, they often have the opposite effect in resource‐rich nations, encouraging additional expenditure
DEMAND INTERNATIONAL ENERGY AGENCY ‐ OIL MARKET REPORT
6 14 MARCH 2012
programmes. Oil consumption can be stimulated either directly through subsidising domestic oil prices, indirectly through investment in relatively oil‐intensive projects or may simply increase in line with rising incomes. The Middle East is a prime example, notably Saudi Arabia, as numerous infrastructural and social spending programmes have been confirmed for 2012.
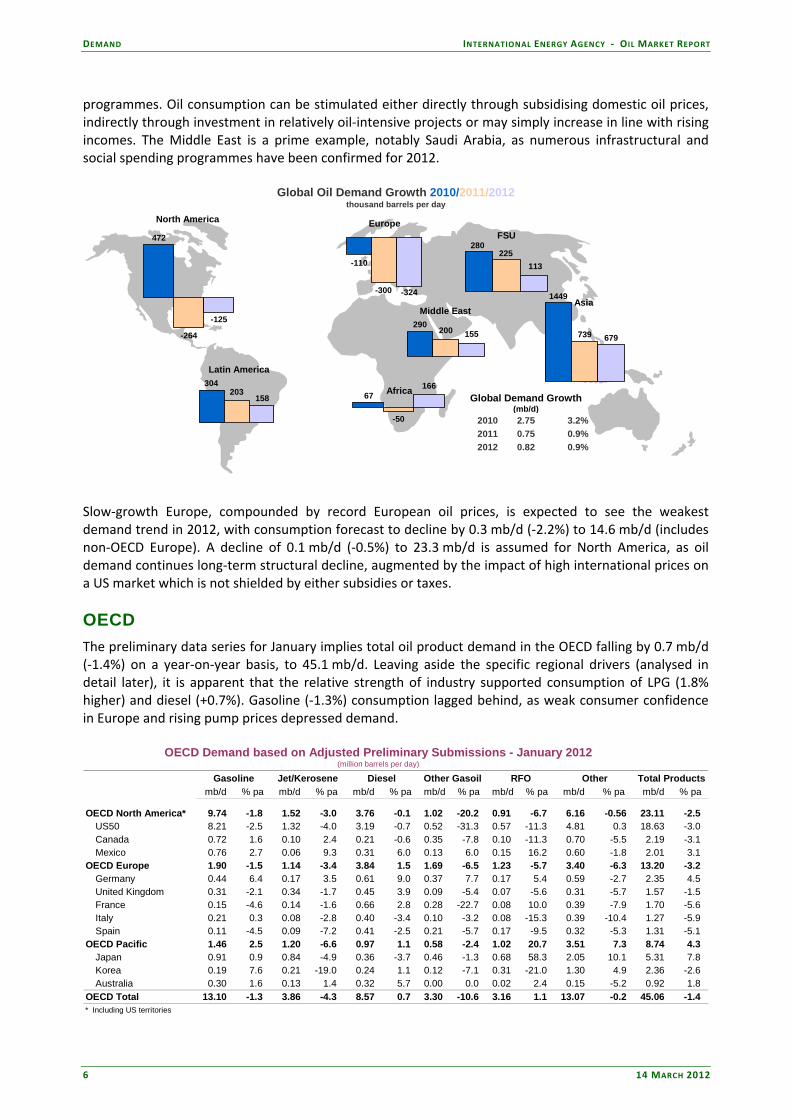
Global Oil Demand Growth 2010/2011/2012thousand barrels per day
(mb/d)2010 2.75 3.2%2011 0.75 0.9%2012 0.82 0.9%
Global Demand Growth203304
158
200290
155
-50
16667
North America
Latin America
Africa
Middle East
Europe
1449
739 679
Asia
-110
-300 -324
280225
113
FSU472
-264
-125
Slow‐growth Europe, compounded by record European oil prices, is expected to see the weakest demand trend in 2012, with consumption forecast to decline by 0.3 mb/d (‐2.2%) to 14.6 mb/d (includes non‐OECD Europe). A decline of 0.1 mb/d (‐0.5%) to 23.3 mb/d is assumed for North America, as oil demand continues long‐term structural decline, augmented by the impact of high international prices on a US market which is not shielded by either subsidies or taxes. OECD The preliminary data series for January implies total oil product demand in the OECD falling by 0.7 mb/d (‐1.4%) on a year‐on‐year basis, to 45.1 mb/d. Leaving aside the specific regional drivers (analysed in detail later), it is apparent that the relative strength of industry supported consumption of LPG (1.8% higher) and diesel (+0.7%). Gasoline (‐1.3%) consumption lagged behind, as weak consumer confidence in Europe and rising pump prices depressed demand.
OECD Demand based on Adjusted Preliminary Submissions - January 2012(million barrels per day)
mb/d % pa mb/d % pa mb/d % pa mb/d % pa mb/d % pa mb/d % pa mb/d % pa
OECD North America* 9.74 -1.8 1.52 -3.0 3.76 -0.1 1.02 -20.2 0.91 -6.7 6.16 -0.56 23.11 -2.5 US50 8.21 -2.5 1.32 -4.0 3.19 -0.7 0.52 -31.3 0.57 -11.3 4.81 0.3 18.63 -3.0 Canada 0.72 1.6 0.10 2.4 0.21 -0.6 0.35 -7.8 0.10 -11.3 0.70 -5.5 2.19 -3.1 Mexico 0.76 2.7 0.06 9.3 0.31 6.0 0.13 6.0 0.15 16.2 0.60 -1.8 2.01 3.1
OECD Europe 1.90 -1.5 1.14 -3.4 3.84 1.5 1.69 -6.5 1.23 -5.7 3.40 -6.3 13.20 -3.2 Germany 0.44 6.4 0.17 3.5 0.61 9.0 0.37 7.7 0.17 5.4 0.59 -2.7 2.35 4.5 United Kingdom 0.31 -2.1 0.34 -1.7 0.45 3.9 0.09 -5.4 0.07 -5.6 0.31 -5.7 1.57 -1.5 France 0.15 -4.6 0.14 -1.6 0.66 2.8 0.28 -22.7 0.08 10.0 0.39 -7.9 1.70 -5.6 Italy 0.21 0.3 0.08 -2.8 0.40 -3.4 0.10 -3.2 0.08 -15.3 0.39 -10.4 1.27 -5.9 Spain 0.11 -4.5 0.09 -7.2 0.41 -2.5 0.21 -5.7 0.17 -9.5 0.32 -5.3 1.31 -5.1
OECD Pacific 1.46 2.5 1.20 -6.6 0.97 1.1 0.58 -2.4 1.02 20.7 3.51 7.3 8.74 4.3 Japan 0.91 0.9 0.84 -4.9 0.36 -3.7 0.46 -1.3 0.68 58.3 2.05 10.1 5.31 7.8 Korea 0.19 7.6 0.21 -19.0 0.24 1.1 0.12 -7.1 0.31 -21.0 1.30 4.9 2.36 -2.6 Australia 0.30 1.6 0.13 1.4 0.32 5.7 0.00 0.0 0.02 2.4 0.15 -5.2 0.92 1.8
OECD Total 13.10 -1.3 3.86 -4.3 8.57 0.7 3.30 -10.6 3.16 1.1 13.07 -0.2 45.06 -1.4 * Including US territories
RFO Other Total ProductsGasoline Jet/Kerosene Diesel Other Gasoil
INTERNATIONAL ENERGY AGENCY ‐ OIL MARKET REPORT DEMAND
14 MARCH 2012 7
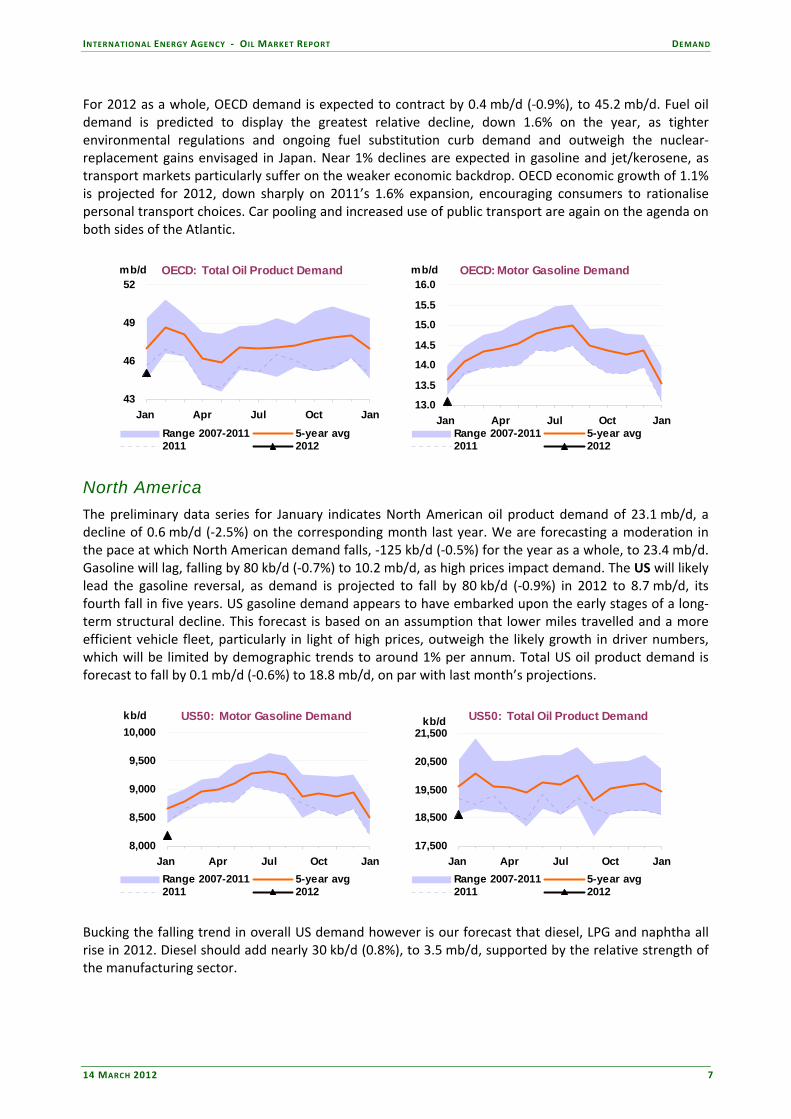
For 2012 as a whole, OECD demand is expected to contract by 0.4 mb/d (‐0.9%), to 45.2 mb/d. Fuel oil demand is predicted to display the greatest relative decline, down 1.6% on the year, as tighter environmental regulations and ongoing fuel substitution curb demand and outweigh the nuclear‐replacement gains envisaged in Japan. Near 1% declines are expected in gasoline and jet/kerosene, as transport markets particularly suffer on the weaker economic backdrop. OECD economic growth of 1.1% is projected for 2012, down sharply on 2011’s 1.6% expansion, encouraging consumers to rationalise personal transport choices. Car pooling and increased use of public transport are again on the agenda on both sides of the Atlantic.
OECD: Total Oil Product Demand
43
46
49
52
Jan Apr Jul Oct Jan
mb/d
Range 2007-2011 5-year avg2011 2012
OECD: Motor Gasoline Demand
13.0
13.5
14.0
14.5
15.0
15.5
16.0
Jan Apr Jul Oct Jan
mb/d
Range 2007-2011 5-year avg2011 2012
North America The preliminary data series for January indicates North American oil product demand of 23.1 mb/d, a decline of 0.6 mb/d (‐2.5%) on the corresponding month last year. We are forecasting a moderation in the pace at which North American demand falls, ‐125 kb/d (‐0.5%) for the year as a whole, to 23.4 mb/d. Gasoline will lag, falling by 80 kb/d (‐0.7%) to 10.2 mb/d, as high prices impact demand. The US will likely lead the gasoline reversal, as demand is projected to fall by 80 kb/d (‐0.9%) in 2012 to 8.7 mb/d, its fourth fall in five years. US gasoline demand appears to have embarked upon the early stages of a long‐term structural decline. This forecast is based on an assumption that lower miles travelled and a more efficient vehicle fleet, particularly in light of high prices, outweigh the likely growth in driver numbers, which will be limited by demographic trends to around 1% per annum. Total US oil product demand is forecast to fall by 0.1 mb/d (‐0.6%) to 18.8 mb/d, on par with last month’s projections.
US50: Motor Gasoline Demand
8,000
8,500
9,000
9,500
10,000
Jan Apr Jul Oct Jan
kb/d
Range 2007-2011 5-year avg2011 2012
US50: Total Oil Product Demand
17,500
18,500
19,500
20,500
21,500
Jan Apr Jul Oct Jan
kb/d
Range 2007-2011 5-year avg2011 2012
Bucking the falling trend in overall US demand however is our forecast that diesel, LPG and naphtha all rise in 2012. Diesel should add nearly 30 kb/d (0.8%), to 3.5 mb/d, supported by the relative strength of the manufacturing sector.

DEMAND INTERNATIONAL ENERGY AGENCY ‐ OIL MARKET REPORT
8 14 MARCH 2012
In Mexico, oil demand grew by 3.1% y‐o‐y in January. Strong growth in industrial activity and high levels of consumer confidence gave support to all products, bar LPG and naphtha. Despite this, demand in 2012 is forecast to remain flat versus 2011 overall, at 2.1 mb/d, with downside risks associated with an economic slowdown in the US. Europe European debt concerns escalated throughout 2011, depressing consumer and business confidence alike, resulting in falling GDP in much of Europe in 4Q11. A prevailing European oil demand decline accelerated, with 0.8 mb/d of consumption removed in 4Q11 (down 5.1% on 4Q10), to 14.1 mb/d. The greatest falls were in the more heavily indebted economies of southern Europe, with 4Q11 demand down by 14.4% year‐on‐year in Greece, 7.2% lower in Spain and 8.2% down in Italy. For 2011, European oil consumption in total fell by 0.3 mb/d (‐2.2%) to 14.3 mb/d.
Despite a reprieve in February – as colder‐than‐normal weather stimulated heating oil demand – the boost in demand is expected to be temporary, as normal temperatures are assumed for the remainder of 2012. European oil demand is therefore forecast to fall to 13.9 mb/d in 2012, a further 0.3 mb/d contraction (‐2.3%).
(150)
(100)
(50)
-
50
100
Feb 11 May 11 Aug 11 Nov 11 Feb 12
DaysHeating Degree Days -OECD EuropeDiff. to 10-Year Average and Last Year
Diff to 10-year Avg Diff to Previous Year
OECD Europe:Total Oil Product Demand
13.013.514.014.515.015.516.016.5
Jan Apr Jul Oct Jan
mb/d
Range 2007-2011 5-year avg2011 2012
Even relatively robust economies like Germany, which have provided an element of economic support to Europe as a whole, saw demand fall in the second half of 2011, with year‐on‐year declines of 0.1 mb/d in both 3Q11 and 4Q11. Preliminary January data depicted a 4.5% year‐on‐year gain of 0.1 mb/d, to 2.3 mb/d, but the forecast for 2012 German demand remains on a downward trend, down by 0.4% to 2.4 mb/d.
OECD Europe: Total Demand Growthby Fuel, 2010-2012
(0.3)
(0.2)
(0.1)
-
0.1
0.2
2010 2011 2012
mb/d
Gasoline Diesel Other
German: Total Oil Product Demand
2,1002,2002,3002,4002,5002,6002,7002,8002,900
Jan Apr Jul Oct Jan
kb/d
Range 2007-2011 5-year avg2011 2012
Consolidated data for Spain in December showed a 7.5% year‐on‐year demand contraction, to 1.3 mb/d. Consumption fell as the unemployment rate rose to a 15‐year high of 21.5% in the same month. All the major product categories saw sharp declines, although the key transportation fuel markets fared the

INTERNATIONAL ENERGY AGENCY ‐ OIL MARKET REPORT DEMAND
14 MARCH 2012 9
worst. Gasoline demand fell 6.6% y‐o‐y, while consumption of diesel dropped 5.4%. Reports of warmer‐than‐normal weather in December further curtailed heating oil demand, which was down 11.3%. Other Mediterranean economies, such as Italy, Portugal and Greece, also saw sharp drops in demand. The preliminary series for Italy fell by 6% y‐o‐y in January, to 1.3 mb/d. Big falls in naphtha (‐19.8%), gasoil (‐3.4%) and jet/kerosene (‐2.8%) outweighed gains in LPG (3.4%) and gasoline (0.3%). A slight moderation in weakening Italian demand is expected for 2012, averaging ‐4.8%, as the worst of the economic malaise eases running from the first to the second half of the year. Portuguese demand fell by 19.7% in December and Greek demand by 14.1%. The preliminary data series for France depicted a 5.6% decline in January, to 1.7 mb/d, as unseasonably warm early winter weather resulted in a 22.7% decline in heating oil. December saw limited gains in demand in the UK, Turkey and the Netherlands, with UK consumption up 0.5% y‐o‐y to 1.5 mb/d, having fallen in eight of the preceding ten months. UK diesel consumption (+13.5% y‐o‐y) provided the majority of the momentum, as the seasonal dip in diesel demand in December proved much less steep than usual. As the UK economy struggles with near‐recessionary conditions and record high oil prices however, demand is forecast to fall by 2.2% (‐34 kb/d) in 2012, to 1.6 mb/d.
UK: Total Oil Product Demand
1,5001,5501,6001,6501,7001,7501,8001,8501,900
Jan Apr Jul Oct Jan
kb/d
Range 2007-2011 5-year avg2011 2012
UK: Diesel Demand
360380400420440460480500
Jan Apr Jul Oct Jan
kb/d
Range 2007-2011 5-year avg2011 2012
Demand for oil products in the Netherlands in December returned to the rising trend that has predominated since 2Q11, up 4.3% on a year earlier to 1.0 mb/d. Underpinning stronger Dutch demand were the sharp gains in the transportation fuel markets, with diesel demand up 13.5% and gasoline surpassing this, rising by 14.6%. These rises were, however, largely attributable to the particularly pronounced lows a year earlier. Turkish demand also held up remarkably well in December, gaining 9.3% to 0.7 mb/d, although once again very low consumption a year earlier flattered the annual trend. All told, exceptionally mild December European temperatures, while limiting heating demand, may have stimulated transport fuel demand relative to weather‐affected December 2010 levels. Pacific Preliminary data for the OECD Pacific in January highlighted the region’s buoyancy, as year‐on‐year demand growth came in at 4.3%, to average 8.7 mb/d. Big gains in fuel oil (+20.7%), ‘other products’ (+20.4%) and LPG (+10.7%) outweighed contractions in jet/kerosene (‐6.6%) and the heating oil category (‐2.4%). Ongoing closures in the Japanese nuclear sector continue to support demand for fuel oil and ‘other products’ (which includes crude oil for direct burn), acting as replacement fuels (alongside coal and natural gas) in the electricity sector.

DEMAND INTERNATIONAL ENERGY AGENCY ‐ OIL MARKET REPORT
10 14 MARCH 2012
OECD Pacific:Total Oil Product Demand
7.0
7.5
8.0
8.5
9.0
9.5
Jan Apr Jul Oct Jan
mb/d
Range 2007-2011 5-year avg2011 2012
(60)(40)(20)
-20 40 60 80
Feb 11 May 11 Aug 11 Nov 11 Feb 12
Days Heating Degree Days -OECD PacificDiff. to 10-Year Average and Last Year
Diff to 10-year Avg Diff to Previous Year
Although warmer temperatures than a year earlier suppressed heating oil demand in January, the onset of colder conditions in February likely saw growth resume. Demand growth of around 60 kb/d (0.9%) is envisaged for 2012, taking consumption in the OECD Pacific region to 7.9 mb/d in 2012.
OECD Pacific:Residual Fuel Oil Demand
0.50.60.70.80.91.01.11.2
Jan Apr Jul Oct Jan
mb/d
Range 2007-2011 5-year avg2011 2012
Korea: Total Oil Product Demand
1,900
2,000
2,100
2,200
2,300
2,400
2,500
Jan Apr Jul Oct Jan
kb/d
Range 2007-2011 5-year avg2011 2012
South Korean consumption fell by 2.6% in January, according to preliminary data, continuing the declining trend into a third month. It is important to put these falls in context, as they represent a decline on the previous year’s exceptionally strong demand, and potentially signal moves by cost‐conscious Korean consumers towards greater efficiency gains in the face of relentlessly high prices. Weaker manufacturing sentiment – as depicted by HSBC’s South Korean Manufacturing PMI falling to 49.2 (whereby a number below 50 implies a contraction) – has undermined Korean consumption of gasoil (‐1.7%), fuel oil (‐21.0%) and jet/kerosene (‐19.0%) in January. Robust domestic demand continued to support gasoline, with growth up to a six‐month high of 7.6%. Oil demand growth is expected to resume for the year as a whole, up by 0.5% to 2.2 mb/d in 2012, as the underlying economic picture remains supportive, with real GDP growth of around 3.5% envisaged. Japanese oil product demand rose by 0.4 mb/d, or 7.9% year‐on‐year, in December on the back of strong gains in residual fuel oil (+170 kb/d), ‘other products’ (+250 kb/d) and LPG (+60 kb/d). Partially offsetting these gains were the big declines seen in naphtha, gasoil and diesel. Japanese oil demand in 2012 is expected at 4.5 mb/d with annual growth of 40 kb/d or 0.9%. The power sector has dominated Japanese oil demand growth since mid‐March 2011’s nuclear closures, burning 165 kb/d of crude oil in 2011 (up 135.5%) and 160 kb/d of fuel oil (+48.3%). Non-OECD Leading the world’s growth momentum, as has been the case since the mid‐1990s, non‐OECD oil demand is forecast to outpace the OECD, supported by stronger economic underpinnings and a generally higher income elasticity. Economic growth of 5.7% is foreseen in the non‐OECD in 2012 (6.2% in 2011), whilst the
INTERNATIONAL ENERGY AGENCY ‐ OIL MARKET REPORT DEMAND
14 MARCH 2012 11
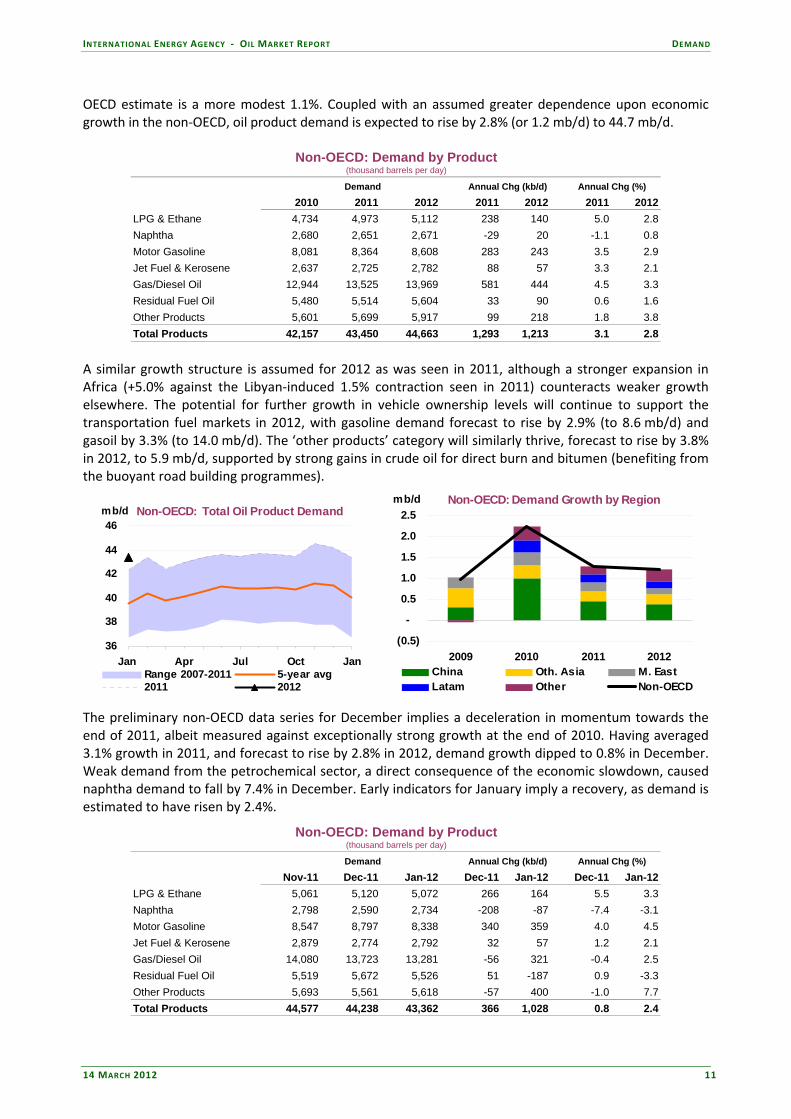
OECD estimate is a more modest 1.1%. Coupled with an assumed greater dependence upon economic growth in the non‐OECD, oil product demand is expected to rise by 2.8% (or 1.2 mb/d) to 44.7 mb/d.
Non-OECD: Demand by Product(thousand barrels per day)
Annual Chg (kb/d) Annual Chg (%)
2010 2011 2012 2011 2012 2011 2012LPG & Ethane 4,734 4,973 5,112 238 140 5.0 2.8Naphtha 2,680 2,651 2,671 -29 20 -1.1 0.8Motor Gasoline 8,081 8,364 8,608 283 243 3.5 2.9Jet Fuel & Kerosene 2,637 2,725 2,782 88 57 3.3 2.1Gas/Diesel Oil 12,944 13,525 13,969 581 444 4.5 3.3Residual Fuel Oil 5,480 5,514 5,604 33 90 0.6 1.6Other Products 5,601 5,699 5,917 99 218 1.8 3.8Total Products 42,157 43,450 44,663 1,293 1,213 3.1 2.8
Demand
A similar growth structure is assumed for 2012 as was seen in 2011, although a stronger expansion in Africa (+5.0% against the Libyan‐induced 1.5% contraction seen in 2011) counteracts weaker growth elsewhere. The potential for further growth in vehicle ownership levels will continue to support the transportation fuel markets in 2012, with gasoline demand forecast to rise by 2.9% (to 8.6 mb/d) and gasoil by 3.3% (to 14.0 mb/d). The ‘other products’ category will similarly thrive, forecast to rise by 3.8% in 2012, to 5.9 mb/d, supported by strong gains in crude oil for direct burn and bitumen (benefiting from the buoyant road building programmes).
Non-OECD: Total Oil Product Demand
36
38
40
42
44
46
Jan Apr Jul Oct Jan
mb/d
Range 2007-2011 5-year avg2011 2012
Non-OECD: Demand Growth by Region
(0.5)
-
0.5
1.0
1.5
2.0
2.5
2009 2010 2011 2012
mb/d
China Oth. Asia M. EastLatam Other Non-OECD
The preliminary non‐OECD data series for December implies a deceleration in momentum towards the end of 2011, albeit measured against exceptionally strong growth at the end of 2010. Having averaged 3.1% growth in 2011, and forecast to rise by 2.8% in 2012, demand growth dipped to 0.8% in December. Weak demand from the petrochemical sector, a direct consequence of the economic slowdown, caused naphtha demand to fall by 7.4% in December. Early indicators for January imply a recovery, as demand is estimated to have risen by 2.4%.
Non-OECD: Demand by Product(thousand barrels per day)
Annual Chg (kb/d) Annual Chg (%)
Nov-11 Dec-11 Jan-12 Dec-11 Jan-12 Dec-11 Jan-12LPG & Ethane 5,061 5,120 5,072 266 164 5.5 3.3Naphtha 2,798 2,590 2,734 -208 -87 -7.4 -3.1Motor Gasoline 8,547 8,797 8,338 340 359 4.0 4.5Jet Fuel & Kerosene 2,879 2,774 2,792 32 57 1.2 2.1Gas/Diesel Oil 14,080 13,723 13,281 -56 321 -0.4 2.5Residual Fuel Oil 5,519 5,672 5,526 51 -187 0.9 -3.3Other Products 5,693 5,561 5,618 -57 400 -1.0 7.7Total Products 44,577 44,238 43,362 366 1,028 0.8 2.4
Demand
DEMAND INTERNATIONAL ENERGY AGENCY ‐ OIL MARKET REPORT
12 14 MARCH 2012
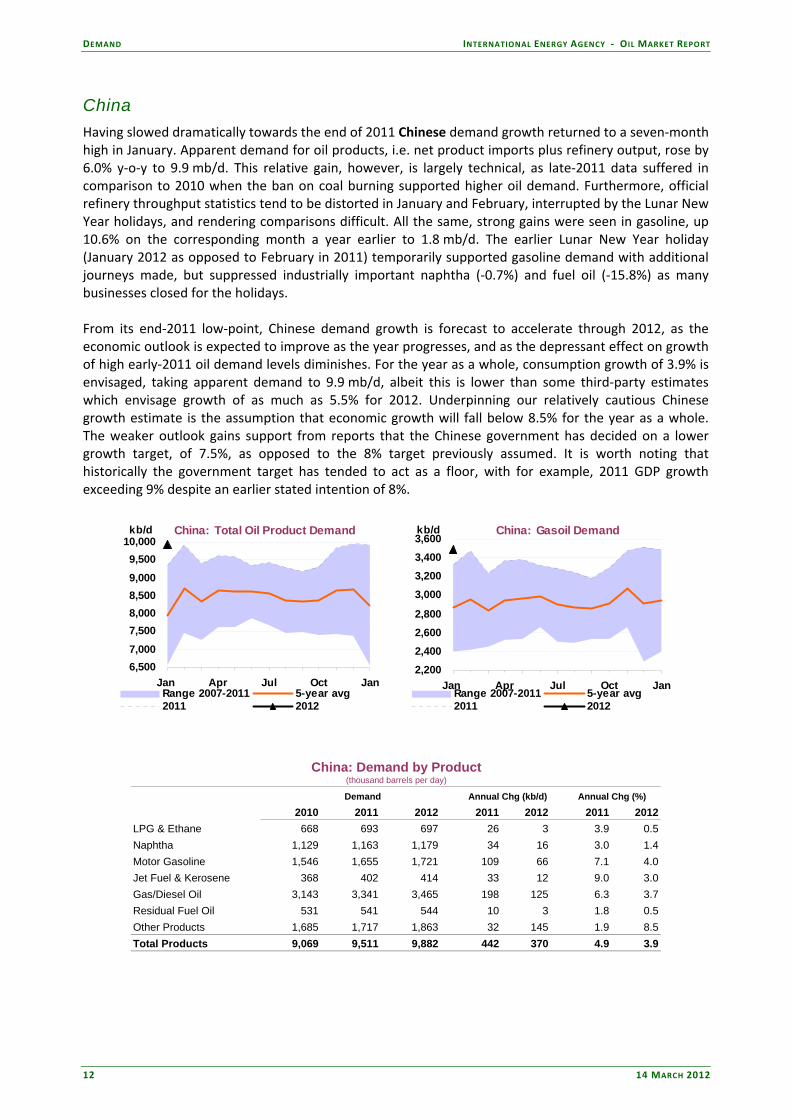
China Having slowed dramatically towards the end of 2011 Chinese demand growth returned to a seven‐month high in January. Apparent demand for oil products, i.e. net product imports plus refinery output, rose by 6.0% y‐o‐y to 9.9 mb/d. This relative gain, however, is largely technical, as late‐2011 data suffered in comparison to 2010 when the ban on coal burning supported higher oil demand. Furthermore, official refinery throughput statistics tend to be distorted in January and February, interrupted by the Lunar New Year holidays, and rendering comparisons difficult. All the same, strong gains were seen in gasoline, up 10.6% on the corresponding month a year earlier to 1.8 mb/d. The earlier Lunar New Year holiday (January 2012 as opposed to February in 2011) temporarily supported gasoline demand with additional journeys made, but suppressed industrially important naphtha (‐0.7%) and fuel oil (‐15.8%) as many businesses closed for the holidays. From its end‐2011 low‐point, Chinese demand growth is forecast to accelerate through 2012, as the economic outlook is expected to improve as the year progresses, and as the depressant effect on growth of high early‐2011 oil demand levels diminishes. For the year as a whole, consumption growth of 3.9% is envisaged, taking apparent demand to 9.9 mb/d, albeit this is lower than some third‐party estimates which envisage growth of as much as 5.5% for 2012. Underpinning our relatively cautious Chinese growth estimate is the assumption that economic growth will fall below 8.5% for the year as a whole. The weaker outlook gains support from reports that the Chinese government has decided on a lower growth target, of 7.5%, as opposed to the 8% target previously assumed. It is worth noting that historically the government target has tended to act as a floor, with for example, 2011 GDP growth exceeding 9% despite an earlier stated intention of 8%.
China: Total Oil Product Demand
6,5007,000
7,5008,0008,5009,0009,500
10,000
Jan Apr Jul Oct Jan
kb/d
Range 2007-2011 5-year avg2011 2012
China: Gasoil Demand
2,2002,4002,6002,800
3,0003,2003,4003,600
Jan Apr Jul Oct Jan
kb/d
Range 2007-2011 5-year avg2011 2012
China: Demand by Product(thousand barrels per day)
Annual Chg (kb/d) Annual Chg (%)
2010 2011 2012 2011 2012 2011 2012LPG & Ethane 668 693 697 26 3 3.9 0.5Naphtha 1,129 1,163 1,179 34 16 3.0 1.4Motor Gasoline 1,546 1,655 1,721 109 66 7.1 4.0Jet Fuel & Kerosene 368 402 414 33 12 9.0 3.0Gas/Diesel Oil 3,143 3,341 3,465 198 125 6.3 3.7Residual Fuel Oil 531 541 544 10 3 1.8 0.5Other Products 1,685 1,717 1,863 32 145 1.9 8.5Total Products 9,069 9,511 9,882 442 370 4.9 3.9
Demand

INTERNATIONAL ENERGY AGENCY ‐ OIL MARKET REPORT DEMAND
14 MARCH 2012 13
Other Non-OECD Preliminary estimates for Indian oil product demand in January point towards demand growth of 2.7% on a year‐on‐year basis. The demand expansion has subsided to its weakest pace since July 2011, as big declines in fuel oil (‐16.9%), naphtha (‐4.0%) and jet/kerosene (‐3.2%) outweighed the persistent gains seen in gas/diesel oil (+7.6%) and gasoline (+1.6%). Gas/diesel oil is outpacing gasoline – a trend embedded since mid‐2011 – as the relative subsidies now strongly favour diesel propulsion. The gasoline price in Mumbai, as of mid‐February, was 70 rupees/litre ($1.42/litre) whereas diesel cost Rs45.3/litre. Within our 2012 forecast for total Indian oil demand growth of 3.2%, we are assuming diesel growth will outpace gasoline by 5.0% to 4.1%. Fuel oil demand will fall by 0.4% in 2012, as bunker demand from the shipping industry falls back, partly due to a ban on iron ore exports.
India: Total Oil Product Demand
2,5002,7002,9003,1003,3003,5003,7003,900
Jan Apr Jul Oct Jan
kb/d
Range 2007-2011 5-year avg2011 2012
India: Total Oil Product Demand
-
1
2
3
4
5
2009 2010 2011 2012
Y-o-Y % Chg
Early indicators of Russian demand in 2012 depict a resilient year‐on‐year growth rate of nearly 4% for January, with demand for motor gasoline dominating, up by 5.8%. The Russian demand picture is far from clear, as large declines were seen in gasoil (‐4.5%), naphtha (‐4.5%) and jet/kerosene (‐4.3%). Such wide discrepancies place an additional uncertainty burden on forecasts, but based on GDP growth of 3.5%, Russian oil product demand is expected to rise by 2.6% (+90 kb/d) in 2012 to 3.6 mb/d.
Russia: Total Oil Product Demand
2,5002,7002,9003,1003,3003,5003,7003,900
Jan Apr Jul Oct Jan
kb/d
Range 2007-2011 5-year avg2011 2012
So urce: P etro market R G, IEA
Russia: Motor Gasoline Demand
550600650700750800850900
Jan Apr Jul Oct Jan
kb/d
Range 2007-2011 5-year avg2011 2012
So urce: P etro market R G, IEA
In Brazil, oil demand grew by 1.5% year‐on‐year in December, led by jet fuel/kerosene (+8.3%) and gasoil (+2.9%). Motor gasoline remained flat during the month, masking offsetting movements from anhydrous ethanol to unblended gasoline (as the government reduced the ethanol requirement in the gasoline blend, from 25% to 20%). The Brazilian economy slowed at the end of 2011, bringing annual GDP growth to 2.7%, not far off the 2.5% gain seen in oil product demand. Demand is expected to rise by a further 1.3% in 2012, to 2.8 mb/d on an assumption of 3.4% GDP growth.
DEMAND INTERNATIONAL ENERGY AGENCY ‐ OIL MARKET REPORT
14 14 MARCH 2012
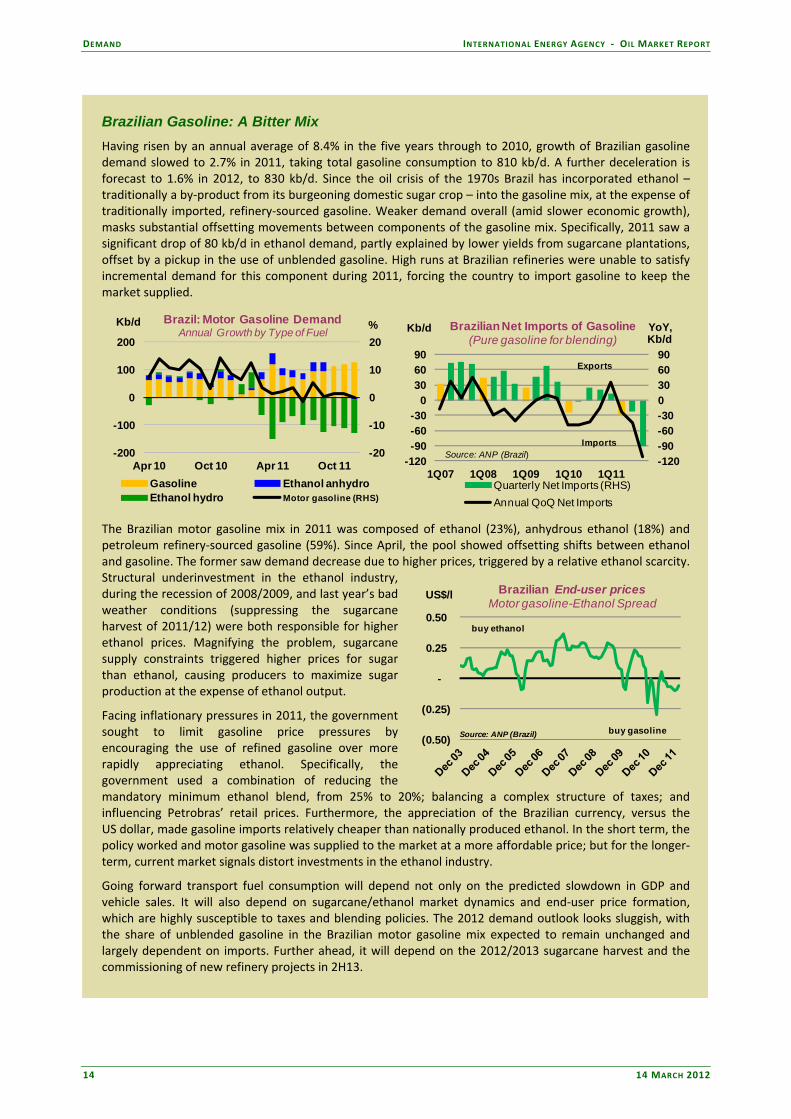
Brazilian Gasoline: A Bitter Mix Having risen by an annual average of 8.4% in the five years through to 2010, growth of Brazilian gasoline demand slowed to 2.7% in 2011, taking total gasoline consumption to 810 kb/d. A further deceleration is forecast to 1.6% in 2012, to 830 kb/d. Since the oil crisis of the 1970s Brazil has incorporated ethanol – traditionally a by‐product from its burgeoning domestic sugar crop – into the gasoline mix, at the expense of traditionally imported, refinery‐sourced gasoline. Weaker demand overall (amid slower economic growth), masks substantial offsetting movements between components of the gasoline mix. Specifically, 2011 saw a significant drop of 80 kb/d in ethanol demand, partly explained by lower yields from sugarcane plantations, offset by a pickup in the use of unblended gasoline. High runs at Brazilian refineries were unable to satisfy incremental demand for this component during 2011, forcing the country to import gasoline to keep the market supplied.
-20
-10
0
10
20
-200
-100
0
100
200
Apr 10 Oct 10 Apr 11 Oct 11
%Kb/d Brazil: Motor Gasoline DemandAnnual Growth by Type of Fuel
Gasoline Ethanol anhydroEthanol hydro Motor gasoline (RHS)
-120-90-60-300306090
-120-90-60-30
0306090
1Q07 1Q08 1Q09 1Q10 1Q11
YoY,Kb/d
Kb/d Brazilian Net Imports of Gasoline(Pure gasoline for blending)
Quarterly Net Imports (RHS)Annual QoQ Net Imports
Source: ANP (Brazil)
Exports
Imports
The Brazilian motor gasoline mix in 2011 was composed of ethanol (23%), anhydrous ethanol (18%) and petroleum refinery‐sourced gasoline (59%). Since April, the pool showed offsetting shifts between ethanol and gasoline. The former saw demand decrease due to higher prices, triggered by a relative ethanol scarcity. Structural underinvestment in the ethanol industry, during the recession of 2008/2009, and last year’s bad weather conditions (suppressing the sugarcane harvest of 2011/12) were both responsible for higher ethanol prices. Magnifying the problem, sugarcane supply constraints triggered higher prices for sugar than ethanol, causing producers to maximize sugar production at the expense of ethanol output.
Facing inflationary pressures in 2011, the government sought to limit gasoline price pressures by encouraging the use of refined gasoline over more rapidly appreciating ethanol. Specifically, the government used a combination of reducing the mandatory minimum ethanol blend, from 25% to 20%; balancing a complex structure of taxes; and influencing Petrobras’ retail prices. Furthermore, the appreciation of the Brazilian currency, versus the US dollar, made gasoline imports relatively cheaper than nationally produced ethanol. In the short term, the policy worked and motor gasoline was supplied to the market at a more affordable price; but for the longer‐term, current market signals distort investments in the ethanol industry.
Going forward transport fuel consumption will depend not only on the predicted slowdown in GDP and vehicle sales. It will also depend on sugarcane/ethanol market dynamics and end‐user price formation, which are highly susceptible to taxes and blending policies. The 2012 demand outlook looks sluggish, with the share of unblended gasoline in the Brazilian motor gasoline mix expected to remain unchanged and largely dependent on imports. Further ahead, it will depend on the 2012/2013 sugarcane harvest and the commissioning of new refinery projects in 2H13.
(0.50)
(0.25)
-
0.25
0.50
US$/l Brazilian End-user pricesMotor gasoline-Ethanol Spread
Source: ANP (Brazil) buy gasoline
buy ethanol

INTERNATIONAL ENERGY AGENCY ‐ OIL MARKET REPORT SUPPLY
14 MARCH 2012 15
SUPPLY Summary • Global oil supply fell by 0.2 mb/d to 90.4 mb/d in February, with rising OPEC NGL and crude
production only partially offsetting a 0.5 mb/d decline from non‐OPEC countries. Compared to a year ago, global oil production stood 1.7 mb/d higher, 90% of which stemmed from increasing output of OPEC crude and NGLs.
• Non‐OPEC supply fell by 0.5 mb/d to 52.8 mb/d in February. Supplies declined in all regions last month but most notably in South Sudan and in Latin America. North Sea production continued to falter in 1Q12, falling by 0.3 mb/d from 1Q11, paring annual non‐OPEC supply gains to only 0.3 mb/d. Continued violence in Syria and the unresolved transit dispute between Sudan and South Sudan are the primary contributors to a ‐0.2 mb/d revision to non‐OPEC supply this month. This leaves growth for 2012 at 0.7 mb/d, deriving largely from the Americas and the Former Soviet Union.
• OPEC crude oil supply in February rose for the fifth month running, led higher by Saudi output at a
three‐decade peak and a sharp recovery in Libyan production so far this year. Output rose by 315 kb/d to 31.42 mb/d, the highest level since October, 2008. February’s high production levels led to a decline in OPEC’s ‘effective’ spare capacity, to 2.75 mb/d from 2.85 mb/d in January. The ‘call on OPEC crude and stock change’ for 2012 has been raised by 200 kb/d for both 2Q12 and 3Q12, to an average of 30 mb/d, due to lower forecast supplies from non‐OPEC.
• Market attention has been focused on the potential disruption in Iranian crude flows in coming
months as the EU’s 1 July embargo nears, with industry analysts expecting exports of Iranian crude to ultimately be curtailed by around 800 kb/d to 1 mb/d from mid‐year onwards. However, almost all of Iran’s buyers will inevitably scale back volumes in order to avoid falling foul of sanctions.
OPEC and Non-OPEC Oil Supply Year-on-Year Change
-0.50.00.51.01.52.02.53.03.5
Nov 10 Feb 11 May 11 Aug 11 Nov 11 Feb 12
mb/d
OPEC Crude Non-OPECOPEC NGLs Total Supply
OPEC and Non-OPEC Oil Supply
50525456586062
Jan 11 Jul 11 Jan 12 Jul 12
mb/d
28.028.529.029.530.030.531.031.532.0mb/d
Non-OPEC OPEC NGLsOPEC Crude - RS
All world oil supply figures for February discussed in this report are IEA estimates. Estimates for OPEC countries, some US states, and Russia are supported by preliminary February supply data. Note: Random events present downside risk to the non‐OPEC production forecast contained in this report. These events can include accidents, unplanned or unannounced maintenance, technical problems, labour strikes, political unrest, guerrilla activity, wars and weather‐related supply losses. Specific allowance has been made in the forecast for scheduled maintenance in all regions and for typical seasonal supply outages (including hurricane‐related stoppages) in North America. In addition, from July 2007, a nationally allocated (but not field‐specific) reliability adjustment has also been applied for the non‐OPEC forecast to reflect a historical tendency for unexpected events to reduce actual supply compared with the initial forecast. This totals ‒200 kb/d for non‐OPEC as a whole, with downward adjustments focused in the OECD.
SUPPLY INTERNATIONAL ENERGY AGENCY ‐ OIL MARKET REPORT
16 14 MARCH 2012
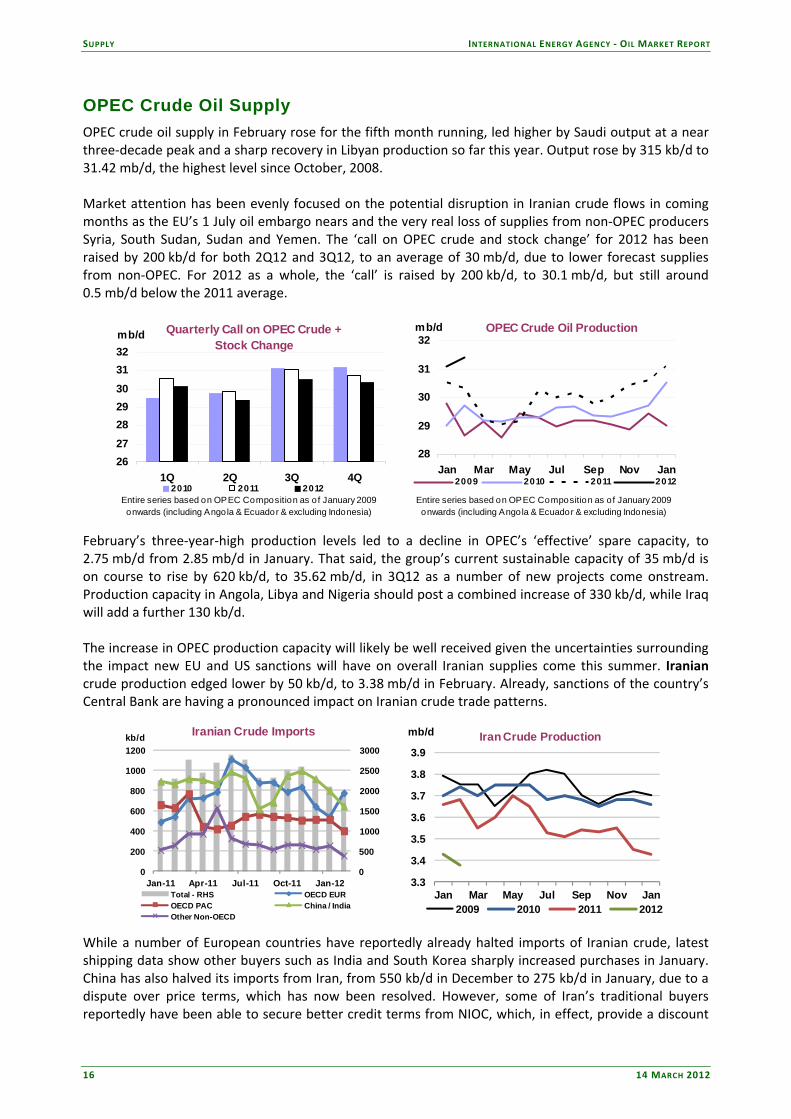
OPEC Crude Oil Supply OPEC crude oil supply in February rose for the fifth month running, led higher by Saudi output at a near three‐decade peak and a sharp recovery in Libyan production so far this year. Output rose by 315 kb/d to 31.42 mb/d, the highest level since October, 2008. Market attention has been evenly focused on the potential disruption in Iranian crude flows in coming months as the EU’s 1 July oil embargo nears and the very real loss of supplies from non‐OPEC producers Syria, South Sudan, Sudan and Yemen. The ‘call on OPEC crude and stock change’ for 2012 has been raised by 200 kb/d for both 2Q12 and 3Q12, to an average of 30 mb/d, due to lower forecast supplies from non‐OPEC. For 2012 as a whole, the ‘call’ is raised by 200 kb/d, to 30.1 mb/d, but still around 0.5 mb/d below the 2011 average.
Quarterly Call on OPEC Crude + Stock Change
26272829303132
1Q 2Q 3Q 4Q
mb/d
2010 2011 2012Entire series based on OPEC Composition as of January 2009 onwards (including Angola & Ecuador & excluding Indonesia)
OPEC Crude Oil Production
28
29
30
31
32
Jan Mar May Jul Sep Nov Jan
mb/d
2009 2010 2011 2012
Entire series based on OPEC Composition as of January 2009 onwards (including Angola & Ecuador & excluding Indonesia)
February’s three‐year‐high production levels led to a decline in OPEC’s ‘effective’ spare capacity, to 2.75 mb/d from 2.85 mb/d in January. That said, the group’s current sustainable capacity of 35 mb/d is on course to rise by 620 kb/d, to 35.62 mb/d, in 3Q12 as a number of new projects come onstream. Production capacity in Angola, Libya and Nigeria should post a combined increase of 330 kb/d, while Iraq will add a further 130 kb/d. The increase in OPEC production capacity will likely be well received given the uncertainties surrounding the impact new EU and US sanctions will have on overall Iranian supplies come this summer. Iranian crude production edged lower by 50 kb/d, to 3.38 mb/d in February. Already, sanctions of the country’s Central Bank are having a pronounced impact on Iranian crude trade patterns.
0
500
1000
1500
2000
2500
3000
0
200
400
600
800
1000
1200
Jan-11 Apr-11 Jul-11 Oct-11 Jan-12
kb/d Iranian Crude Imports
Total - RHS OECD EUROECD PAC China / IndiaOther Non-OECD
3.3
3.4
3.5
3.6
3.7
3.8
3.9
Jan Mar May Jul Sep Nov Jan
mb/d Iran Crude Production
2009 2010 2011 2012
While a number of European countries have reportedly already halted imports of Iranian crude, latest shipping data show other buyers such as India and South Korea sharply increased purchases in January. China has also halved its imports from Iran, from 550 kb/d in December to 275 kb/d in January, due to a dispute over price terms, which has now been resolved. However, some of Iran’s traditional buyers reportedly have been able to secure better credit terms from NIOC, which, in effect, provide a discount

INTERNATIONAL ENERGY AGENCY ‐ OIL MARKET REPORT SUPPLY
14 MARCH 2012 17
for lifters. Going forward, a number of European buyers have expressed concern that they will have difficulty finding replacement barrels of similar quality to Iran’s heavier crudes, especially Italian refiners who process the grades for asphalt. This time a year ago, European refiners were suddenly confronted with similar concerns, but over the loss of light, sweet Libyan crude. Latest data show lighter Libyan crudes were ultimately replaced with more imports of heavier, sour crudes from OPEC’s Middle East producers (see ‘European Refiners Tapped Other OPEC Supply to Replace Lost Libyan Barrels’). Exports of Iranian crude could ultimately be curtailed by around 800 kb/d to 1 mb/d from mid‐year onwards, on the basis of the EU embargo and assuming China, India, Japan and South Korea continue to purchase lower levels of Iranian crude. Almost all of the country’s current lifters will inevitably scale back volumes in order to avoid falling foul of US sanctions. The most immediate impact so far has been on the shipping industry, which has seen EU insurance companies announce suspension of coverage for tankers that call at Iranian ports. Chinese vessels are largely the exception. State National Iranian Tanker Co (NITC) has also enlisted its own vessels for deliveries to buyers unable to secure insurance coverage. As a result, the number of NITC vessels available for floating storage has been sharply reduced.
Dec 2011 Jan 2012 Feb 2012Supply Supply Supply
Algeria 1.29 1.29 1.27 1.30 0.03 1.37 0.06
Angola 1.75 1.70 1.76 1.91 0.15 2.10 0.19
Ecuador 0.48 0.48 0.48 0.52 0.04 0.54 0.02
Iran 3.45 3.43 3.38 3.51 0.13 3.56 0.04
Kuwait2 2.56 2.65 2.60 2.84 0.24 2.84 0.00
Libya 0.75 1.15 1.30 1.30 0.00 1.37 0.07
Nigeria3 2.06 2.04 2.14 2.48 0.34 2.55 0.07
Qatar 0.82 0.82 0.81 0.90 0.09 0.90 0.00
Saudi Arabia2 9.80 9.85 10.00 11.88 1.88 11.88 0.00
UAE 2.58 2.58 2.59 2.79 0.20 2.79 0.00
Venezuela4 2.38 2.47 2.48 2.60 0.12 2.63 0.03
OPEC-11 27.92 28.46 28.81 32.02 3.21 32.51 0.49
Iraq 2.69 2.65 2.61 3.00 0.39 3.13 0.13
Total OPEC 30.61 31.11 31.42 35.02 3.60 35.63 0.62
(excluding Iraq, Nigeria, Venezuela and Libya 2.75)1 Capacity levels can be reached within 30 days and sustained for 90 days.2 Includes half of Neutral Zone production.3 Nigeria's current capacity estimate excludes some 200 kb/d of shut-in capacity. 4 Includes upgraded Orinoco extra-heavy oil assumed at 410 kb/d in February.
OPEC Crude Production(million barrels per day)
Sustainable Production Capacity1
Spare Capacity vs Feb 2012
Supply
3Q12 Average Sustainable Production
Capacity
3Q12 Production Capacity Versus 1Q12 Capacity
Saudi Arabian crude oil supplies were estimated at a heady 10 mb/d, up 150 kb/d over January levels. Preliminary tanker data show Saudi Aramco increased exports volumes by between 150‐300 kb/d in February, with scant sign of any offsetting reduction in domestic refinery use. The increased Saudi volumes in February were heading to Europe and Africa, tanker data indicate. Rather than Asia as might be expected. That said, in early March, China’s Sinochem reportedly lifted a Saudi cargo held in storage at Okinawa, Japan due to congestion and shipping delays at the Kingdom’s largest export terminal at Ras Tanura. As a result, some of the additional output may be used for replenishing storage tanks. Indeed, market reports suggest Saudi output will increase in coming months based on customer discussions and allocations, although higher April price differentials for sales into Asia suggest incremental volumes might be targeted at Atlantic Basin customers.
7.5
8.0
8.5
9.0
9.5
10.0
10.5
Jan Mar May Jul Sep Nov Jan
mb/d Saudi Arabian Crude Production
2009 2010 2011 2012
SUPPLY INTERNATIONAL ENERGY AGENCY ‐ OIL MARKET REPORT
18 14 MARCH 2012
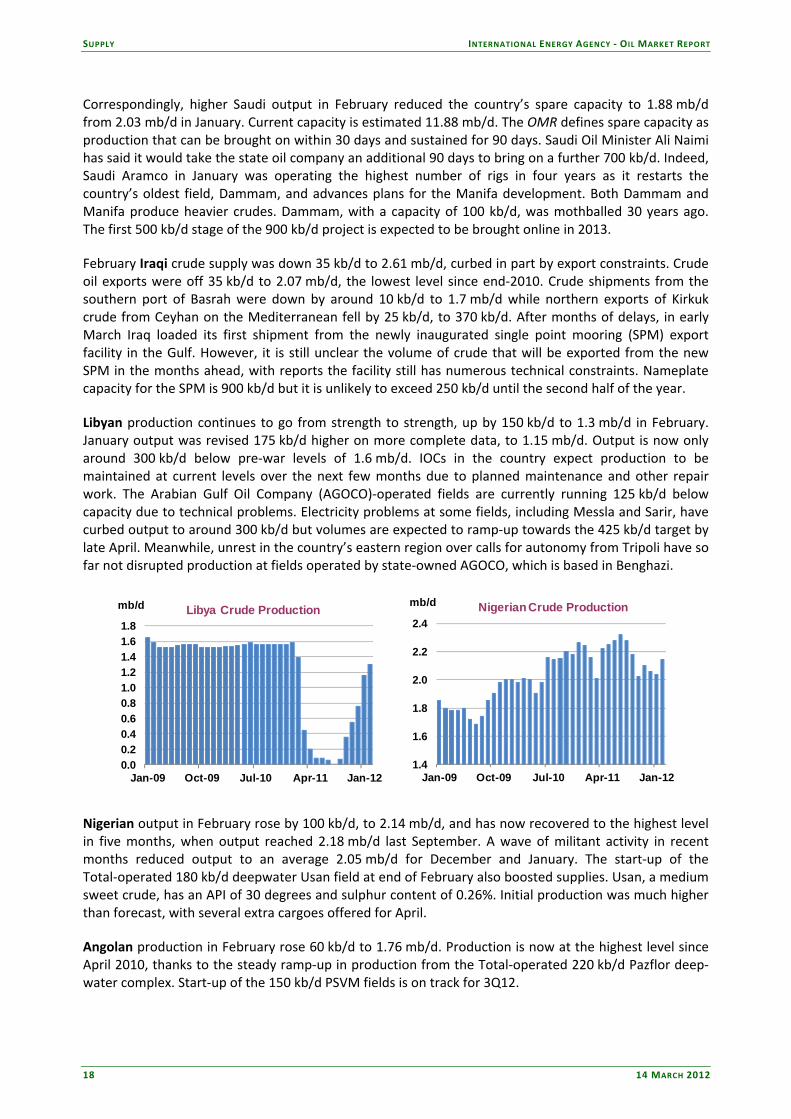
Correspondingly, higher Saudi output in February reduced the country’s spare capacity to 1.88 mb/d from 2.03 mb/d in January. Current capacity is estimated 11.88 mb/d. The OMR defines spare capacity as production that can be brought on within 30 days and sustained for 90 days. Saudi Oil Minister Ali Naimi has said it would take the state oil company an additional 90 days to bring on a further 700 kb/d. Indeed, Saudi Aramco in January was operating the highest number of rigs in four years as it restarts the country’s oldest field, Dammam, and advances plans for the Manifa development. Both Dammam and Manifa produce heavier crudes. Dammam, with a capacity of 100 kb/d, was mothballed 30 years ago. The first 500 kb/d stage of the 900 kb/d project is expected to be brought online in 2013. February Iraqi crude supply was down 35 kb/d to 2.61 mb/d, curbed in part by export constraints. Crude oil exports were off 35 kb/d to 2.07 mb/d, the lowest level since end‐2010. Crude shipments from the southern port of Basrah were down by around 10 kb/d to 1.7 mb/d while northern exports of Kirkuk crude from Ceyhan on the Mediterranean fell by 25 kb/d, to 370 kb/d. After months of delays, in early March Iraq loaded its first shipment from the newly inaugurated single point mooring (SPM) export facility in the Gulf. However, it is still unclear the volume of crude that will be exported from the new SPM in the months ahead, with reports the facility still has numerous technical constraints. Nameplate capacity for the SPM is 900 kb/d but it is unlikely to exceed 250 kb/d until the second half of the year. Libyan production continues to go from strength to strength, up by 150 kb/d to 1.3 mb/d in February. January output was revised 175 kb/d higher on more complete data, to 1.15 mb/d. Output is now only around 300 kb/d below pre‐war levels of 1.6 mb/d. IOCs in the country expect production to be maintained at current levels over the next few months due to planned maintenance and other repair work. The Arabian Gulf Oil Company (AGOCO)‐operated fields are currently running 125 kb/d below capacity due to technical problems. Electricity problems at some fields, including Messla and Sarir, have curbed output to around 300 kb/d but volumes are expected to ramp‐up towards the 425 kb/d target by late April. Meanwhile, unrest in the country’s eastern region over calls for autonomy from Tripoli have so far not disrupted production at fields operated by state‐owned AGOCO, which is based in Benghazi.
0.00.20.40.60.81.01.21.41.61.8
Jan-09 Oct-09 Jul-10 Apr-11 Jan-12
mb/d Libya Crude Production
1.4
1.6
1.8
2.0
2.2
2.4
Jan-09 Oct-09 Jul-10 Apr-11 Jan-12
mb/d Nigerian Crude Production
Nigerian output in February rose by 100 kb/d, to 2.14 mb/d, and has now recovered to the highest level in five months, when output reached 2.18 mb/d last September. A wave of militant activity in recent months reduced output to an average 2.05 mb/d for December and January. The start‐up of the Total‐operated 180 kb/d deepwater Usan field at end of February also boosted supplies. Usan, a medium sweet crude, has an API of 30 degrees and sulphur content of 0.26%. Initial production was much higher than forecast, with several extra cargoes offered for April. Angolan production in February rose 60 kb/d to 1.76 mb/d. Production is now at the highest level since April 2010, thanks to the steady ramp‐up in production from the Total‐operated 220 kb/d Pazflor deep‐water complex. Start‐up of the 150 kb/d PSVM fields is on track for 3Q12.
INTERNATIONAL ENERGY AGENCY ‐ OIL MARKET REPORT SUPPLY
14 MARCH 2012 19
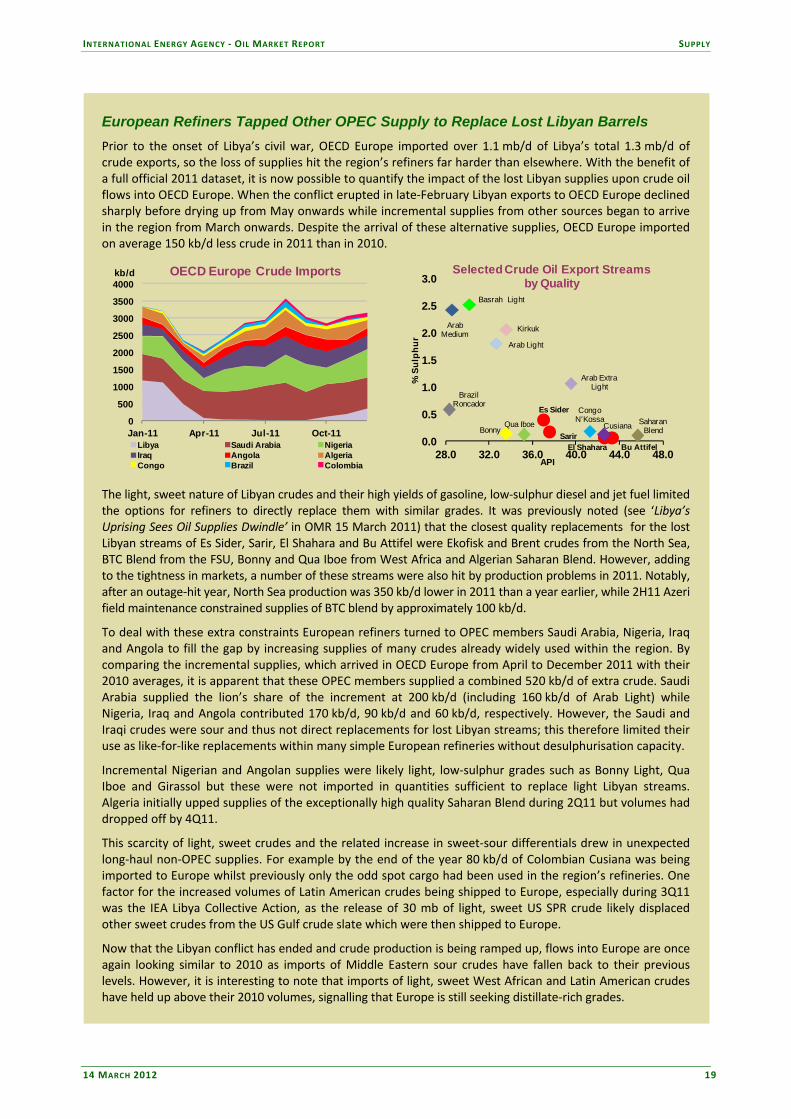
European Refiners Tapped Other OPEC Supply to Replace Lost Libyan Barrels Prior to the onset of Libya’s civil war, OECD Europe imported over 1.1 mb/d of Libya’s total 1.3 mb/d of crude exports, so the loss of supplies hit the region’s refiners far harder than elsewhere. With the benefit of a full official 2011 dataset, it is now possible to quantify the impact of the lost Libyan supplies upon crude oil flows into OECD Europe. When the conflict erupted in late‐February Libyan exports to OECD Europe declined sharply before drying up from May onwards while incremental supplies from other sources began to arrive in the region from March onwards. Despite the arrival of these alternative supplies, OECD Europe imported on average 150 kb/d less crude in 2011 than in 2010.
0
500
1000
1500
2000
2500
3000
3500
4000
Jan-11 Apr-11 Jul-11 Oct-11
kb/d OECD Europe Crude Imports
Libya Saudi Arabia NigeriaIraq Angola AlgeriaCongo Brazil Colombia
Bu AttifelEl Shahara
Saharan Blend
Qua IboeBonny
SarirCusiana
Congo N'Kossa
Es Sider
Arab Extra Light
Brazil Roncador
Arab Light
KirkukArab Medium
Basrah Light
0.0
0.5
1.0
1.5
2.0
2.5
3.0
28.0 32.0 36.0 40.0 44.0 48.0
% S
ulph
ur
API
Selected Crude Oil Export Streams by Quality
The light, sweet nature of Libyan crudes and their high yields of gasoline, low‐sulphur diesel and jet fuel limited the options for refiners to directly replace them with similar grades. It was previously noted (see ‘Libya’s Uprising Sees Oil Supplies Dwindle’ in OMR 15 March 2011) that the closest quality replacements for the lost Libyan streams of Es Sider, Sarir, El Shahara and Bu Attifel were Ekofisk and Brent crudes from the North Sea, BTC Blend from the FSU, Bonny and Qua Iboe from West Africa and Algerian Saharan Blend. However, adding to the tightness in markets, a number of these streams were also hit by production problems in 2011. Notably, after an outage‐hit year, North Sea production was 350 kb/d lower in 2011 than a year earlier, while 2H11 Azeri field maintenance constrained supplies of BTC blend by approximately 100 kb/d.
To deal with these extra constraints European refiners turned to OPEC members Saudi Arabia, Nigeria, Iraq and Angola to fill the gap by increasing supplies of many crudes already widely used within the region. By comparing the incremental supplies, which arrived in OECD Europe from April to December 2011 with their 2010 averages, it is apparent that these OPEC members supplied a combined 520 kb/d of extra crude. Saudi Arabia supplied the lion’s share of the increment at 200 kb/d (including 160 kb/d of Arab Light) while Nigeria, Iraq and Angola contributed 170 kb/d, 90 kb/d and 60 kb/d, respectively. However, the Saudi and Iraqi crudes were sour and thus not direct replacements for lost Libyan streams; this therefore limited their use as like‐for‐like replacements within many simple European refineries without desulphurisation capacity.
Incremental Nigerian and Angolan supplies were likely light, low‐sulphur grades such as Bonny Light, Qua Iboe and Girassol but these were not imported in quantities sufficient to replace light Libyan streams. Algeria initially upped supplies of the exceptionally high quality Saharan Blend during 2Q11 but volumes had dropped off by 4Q11.
This scarcity of light, sweet crudes and the related increase in sweet‐sour differentials drew in unexpected long‐haul non‐OPEC supplies. For example by the end of the year 80 kb/d of Colombian Cusiana was being imported to Europe whilst previously only the odd spot cargo had been used in the region’s refineries. One factor for the increased volumes of Latin American crudes being shipped to Europe, especially during 3Q11 was the IEA Libya Collective Action, as the release of 30 mb of light, sweet US SPR crude likely displaced other sweet crudes from the US Gulf crude slate which were then shipped to Europe.
Now that the Libyan conflict has ended and crude production is being ramped up, flows into Europe are once again looking similar to 2010 as imports of Middle Eastern sour crudes have fallen back to their previous levels. However, it is interesting to note that imports of light, sweet West African and Latin American crudes have held up above their 2010 volumes, signalling that Europe is still seeking distillate‐rich grades.

SUPPLY INTERNATIONAL ENERGY AGENCY ‐ OIL MARKET REPORT
20 14 MARCH 2012
Non-OPEC Overview Non‐OPEC oil production is estimated to have fallen by 0.5 mb/d to 52.8 mb/d in February, largely due to weather and mechanical‐related field outages in the North Sea and Canada, continued unrest and additional sanctions in Syria, pipeline sabotage and labour strikes in Colombia and Yemen, and the transit dispute between Sudan and South Sudan. The latter dispute is likely to dent non‐OPEC output in 2012 by around 280 kb/d compared to 1H11 levels. These unplanned shut‐ins total more than 750 kb/d in 1Q12. Despite much pessimism about non‐OPEC supply growth, production in 1Q12 is still expected to grow by around 300 kb/d and by around 730 kb/d for the entire year. Weather‐related and mechanical issues continue to hinder output in the North Sea, especially in Denmark and the UK. New outages at oil sands facilities in Canada as well as pipeline sabotage in Colombia are expected to mitigate the strong growth in other parts of the Americas, especially in light tight oil plays in the US.
-500-400-300-200-100
0100200300
1Q11 3Q11 1Q12 3Q12
mb/d Non-OPEC Supply - Revisions
NAM OECD EUR FSUChina Other Asia LAMPG & Biofuels Other Total
-0.6
-0.3
0.0
0.3
0.6
0.9
1.2
1Q11 3Q11 1Q12 3Q12
mb/d Non-OPEC Supply - Yearly Change
Crude NGLProcessing Gains Non-convGlobal Biofuels Total
But the worsening prospects and high uncertainty concerning South Sudan’s and Syria’s output will likely have the largest effect on non‐OPEC supply in coming months. This outlook assumes that Sudan and South Sudan will still contribute 180 kb/d to non‐OPEC output (half of which is from South Sudan) assuming that some production is restarted by 2H12 given severe economic pressures. This outlook now also assumes a gloomier scenario in Syria than last month in which production falls by 150 kb/d to average only 180 kb/d in 2012. A more pessimistic scenario, yet not out of the realm of possibility, which leaves South Sudanese output at minimal levels, shows no improvement for Yemen’s outlook in 2012 from current levels, and constrains Syrian production to around 100 kb/d, would cut overall non‐OPEC output growth in 2012 by 150 kb/d to 590 kb/d.
Revisions for 2011 centre upon delayed data for Azerbaijan, Indonesia, Malaysia, and Africa. These and other baseline revisions result in an overall downward revision of 90 kb/d in 4Q11 to 53.1 mb/d. 2011 non‐OPEC supply growth is revised downwards by less than 10 kb/d to 130 kb/d. In addition to the worsening outlook in the Middle East and Africa, North Sea production continues to underperform expectations in 1Q12 by around 90 kb/d, averaging 3.0 mb/d, and accelerating the year‐on‐year decline to 330 kb/d. In sum, non‐OPEC supply growth is cut by 200 kb/d for 2012 to 53.4 mb/d, with the US as the only bright spot. OECD North America US – January preliminary, Alaska and North Dakota actual, other states estimated: Based on preliminary weekly data, US crude oil supply fell slightly to 5.8 mb/d in January. A small fire at the Prudhoe Bay field reduced output by around 50 kb/d for a couple days, but output has quickly returned to average levels of 350 kb/d. The decline in Alaska in January was mostly offset by rapidly increasing production in light tight oil plays, especially in North Dakota and Texas. We have revised upwards the
INTERNATIONAL ENERGY AGENCY ‐ OIL MARKET REPORT SUPPLY
14 MARCH 2012 21
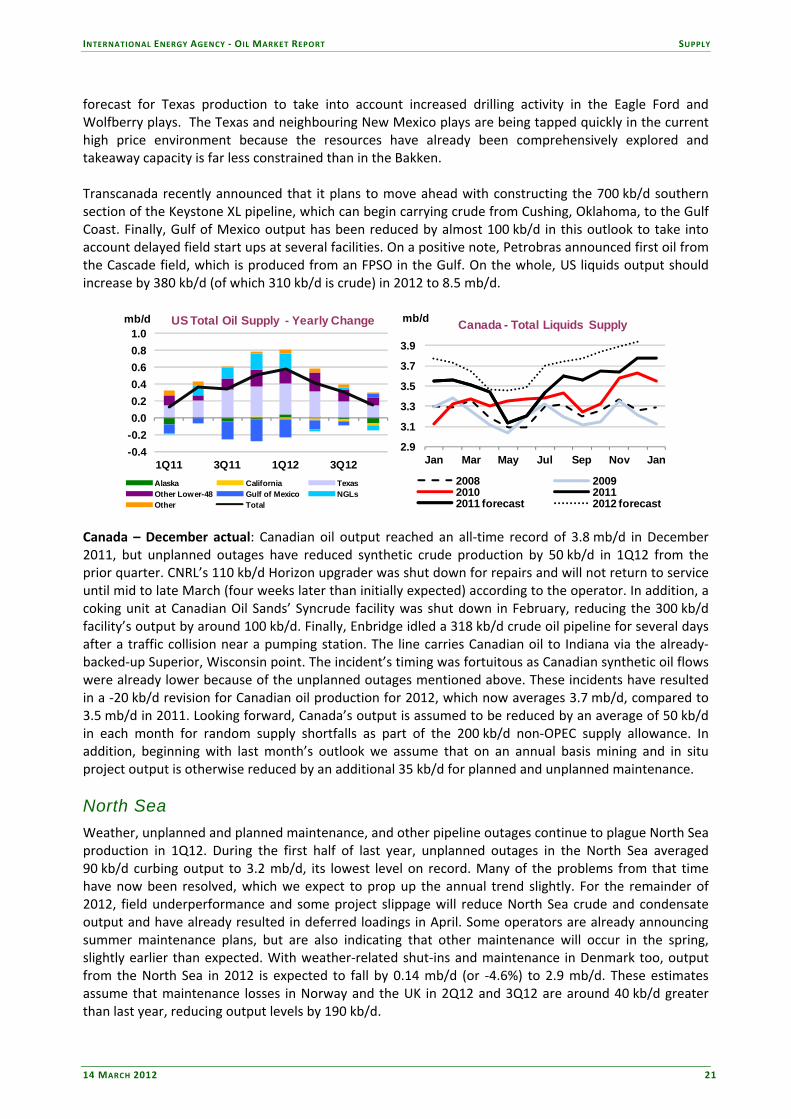
forecast for Texas production to take into account increased drilling activity in the Eagle Ford and Wolfberry plays. The Texas and neighbouring New Mexico plays are being tapped quickly in the current high price environment because the resources have already been comprehensively explored and takeaway capacity is far less constrained than in the Bakken. Transcanada recently announced that it plans to move ahead with constructing the 700 kb/d southern section of the Keystone XL pipeline, which can begin carrying crude from Cushing, Oklahoma, to the Gulf Coast. Finally, Gulf of Mexico output has been reduced by almost 100 kb/d in this outlook to take into account delayed field start ups at several facilities. On a positive note, Petrobras announced first oil from the Cascade field, which is produced from an FPSO in the Gulf. On the whole, US liquids output should increase by 380 kb/d (of which 310 kb/d is crude) in 2012 to 8.5 mb/d.
-0.4-0.20.00.20.40.60.81.0
1Q11 3Q11 1Q12 3Q12
mb/d US Total Oil Supply - Yearly Change
Alaska California TexasOther Lower-48 Gulf of Mexico NGLsOther Total
2.9
3.1
3.3
3.5
3.7
3.9
Jan Mar May Jul Sep Nov Jan
mb/d Canada - Total Liquids Supply
2008 20092010 20112011 forecast 2012 forecast
Canada – December actual: Canadian oil output reached an all‐time record of 3.8 mb/d in December 2011, but unplanned outages have reduced synthetic crude production by 50 kb/d in 1Q12 from the prior quarter. CNRL’s 110 kb/d Horizon upgrader was shut down for repairs and will not return to service until mid to late March (four weeks later than initially expected) according to the operator. In addition, a coking unit at Canadian Oil Sands’ Syncrude facility was shut down in February, reducing the 300 kb/d facility’s output by around 100 kb/d. Finally, Enbridge idled a 318 kb/d crude oil pipeline for several days after a traffic collision near a pumping station. The line carries Canadian oil to Indiana via the already‐backed‐up Superior, Wisconsin point. The incident’s timing was fortuitous as Canadian synthetic oil flows were already lower because of the unplanned outages mentioned above. These incidents have resulted in a ‐20 kb/d revision for Canadian oil production for 2012, which now averages 3.7 mb/d, compared to 3.5 mb/d in 2011. Looking forward, Canada’s output is assumed to be reduced by an average of 50 kb/d in each month for random supply shortfalls as part of the 200 kb/d non‐OPEC supply allowance. In addition, beginning with last month’s outlook we assume that on an annual basis mining and in situ project output is otherwise reduced by an additional 35 kb/d for planned and unplanned maintenance. North Sea Weather, unplanned and planned maintenance, and other pipeline outages continue to plague North Sea production in 1Q12. During the first half of last year, unplanned outages in the North Sea averaged 90 kb/d curbing output to 3.2 mb/d, its lowest level on record. Many of the problems from that time have now been resolved, which we expect to prop up the annual trend slightly. For the remainder of 2012, field underperformance and some project slippage will reduce North Sea crude and condensate output and have already resulted in deferred loadings in April. Some operators are already announcing summer maintenance plans, but are also indicating that other maintenance will occur in the spring, slightly earlier than expected. With weather‐related shut‐ins and maintenance in Denmark too, output from the North Sea in 2012 is expected to fall by 0.14 mb/d (or ‐4.6%) to 2.9 mb/d. These estimates assume that maintenance losses in Norway and the UK in 2Q12 and 3Q12 are around 40 kb/d greater than last year, reducing output levels by 190 kb/d.
SUPPLY INTERNATIONAL ENERGY AGENCY ‐ OIL MARKET REPORT
22 14 MARCH 2012
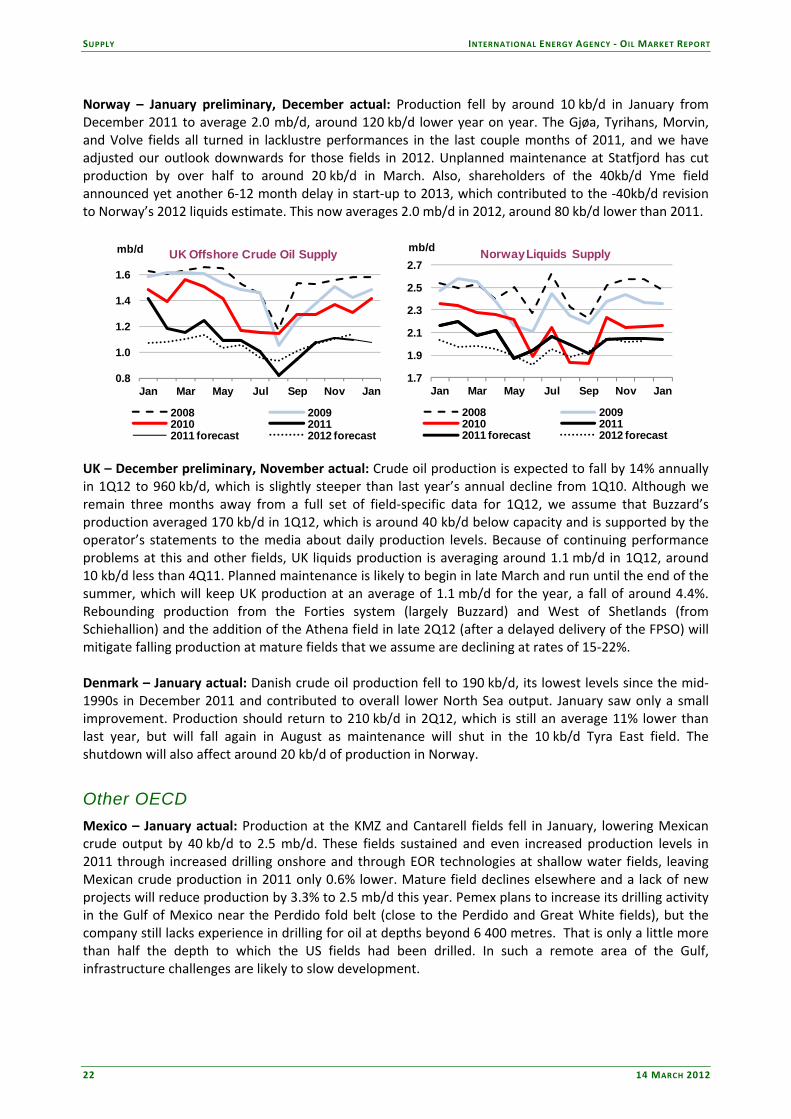
Norway – January preliminary, December actual: Production fell by around 10 kb/d in January from December 2011 to average 2.0 mb/d, around 120 kb/d lower year on year. The Gjøa, Tyrihans, Morvin, and Volve fields all turned in lacklustre performances in the last couple months of 2011, and we have adjusted our outlook downwards for those fields in 2012. Unplanned maintenance at Statfjord has cut production by over half to around 20 kb/d in March. Also, shareholders of the 40kb/d Yme field announced yet another 6‐12 month delay in start‐up to 2013, which contributed to the ‐40kb/d revision to Norway’s 2012 liquids estimate. This now averages 2.0 mb/d in 2012, around 80 kb/d lower than 2011.
0.8
1.0
1.2
1.4
1.6
Jan Mar May Jul Sep Nov Jan
mb/d UK Offshore Crude Oil Supply
2008 20092010 20112011 forecast 2012 forecast
1.7
1.9
2.1
2.3
2.5
2.7
Jan Mar May Jul Sep Nov Jan
mb/d Norway Liquids Supply
2008 20092010 20112011 forecast 2012 forecast
UK – December preliminary, November actual: Crude oil production is expected to fall by 14% annually in 1Q12 to 960 kb/d, which is slightly steeper than last year’s annual decline from 1Q10. Although we remain three months away from a full set of field‐specific data for 1Q12, we assume that Buzzard’s production averaged 170 kb/d in 1Q12, which is around 40 kb/d below capacity and is supported by the operator’s statements to the media about daily production levels. Because of continuing performance problems at this and other fields, UK liquids production is averaging around 1.1 mb/d in 1Q12, around 10 kb/d less than 4Q11. Planned maintenance is likely to begin in late March and run until the end of the summer, which will keep UK production at an average of 1.1 mb/d for the year, a fall of around 4.4%. Rebounding production from the Forties system (largely Buzzard) and West of Shetlands (from Schiehallion) and the addition of the Athena field in late 2Q12 (after a delayed delivery of the FPSO) will mitigate falling production at mature fields that we assume are declining at rates of 15‐22%. Denmark – January actual: Danish crude oil production fell to 190 kb/d, its lowest levels since the mid‐1990s in December 2011 and contributed to overall lower North Sea output. January saw only a small improvement. Production should return to 210 kb/d in 2Q12, which is still an average 11% lower than last year, but will fall again in August as maintenance will shut in the 10 kb/d Tyra East field. The shutdown will also affect around 20 kb/d of production in Norway.
Other OECD Mexico – January actual: Production at the KMZ and Cantarell fields fell in January, lowering Mexican crude output by 40 kb/d to 2.5 mb/d. These fields sustained and even increased production levels in 2011 through increased drilling onshore and through EOR technologies at shallow water fields, leaving Mexican crude production in 2011 only 0.6% lower. Mature field declines elsewhere and a lack of new projects will reduce production by 3.3% to 2.5 mb/d this year. Pemex plans to increase its drilling activity in the Gulf of Mexico near the Perdido fold belt (close to the Perdido and Great White fields), but the company still lacks experience in drilling for oil at depths beyond 6 400 metres. That is only a little more than half the depth to which the US fields had been drilled. In such a remote area of the Gulf, infrastructure challenges are likely to slow development.

INTERNATIONAL ENERGY AGENCY ‐ OIL MARKET REPORT SUPPLY
14 MARCH 2012 23
Non-OECD Former Soviet Union In the Caspian, production fell more sharply than anticipated in Azerbaijan in 4Q11 to 760 kb/d, the lowest level since 4Q08, due to maintenance at the Azeri‐Chirag‐Guneshli (ACG) field. We expect some uptick in production in 1Q11 as this maintenance is completed, but a slower return to normal rates than last month from a lower baseline. As a result, Azerbaijani production in 2012 is revised downwards by 10 kb/d to 990 kb/d, or 60 kb/d higher than 2011. In Kazakhstan, TengizChevroil recently indicated it will carry out maintenance at a field processing line during 2Q12 (reducing output by around 80 kb/d) and in August at its 300 kb/d Second Generation Project. Maintenance also reduced output by as much as 70 kb/d at the Karachaganak field. Overall, Kazakhstan’s output should fall by around 1.0% or 20 kb/d in 2012 to 1.6 mb/d largely unchanged from the forecast last month.
Russia – February actual: Data for February show liquids production unchanged at January levels of 10.6 mb/d. Gazprom’s condensate output fell slightly in February from January, but increased production from Rosneft’s Vankor and PSA output offset the decline. The Vankor field is now producing almost 340 kb/d, compared to 280 kb/d at the same time last year. On average, January and February levels are 1.1% higher than the prior year’s levels. We maintain that increasing condensate volumes, rising output from Eastern Siberian greenfields, and sustained output at brownfields amid this high price environment will contribute to a 1.2% increase in Russian liquids supply in 2012, averaging 10.7 mb/d versus 10.6 mb/d in 2011.
-300-200-100
0100200300400500
1Q09 3Q09 1Q10 3Q10 1Q11 3Q11 1Q12 3Q12
kb/d Annual Growth: Caspian Oil Production
Azerbaijan KazakhstanTurkmenistan Uzbekistan
-100
0
100
200
300
400
1Q09
2Q09
3Q09
4Q09
1Q10
2Q10
3Q10
4Q10
1Q11
2Q11
3Q11
4Q11
1Q12
2Q12
3Q12
4Q12
Annual Growth: Russian Oil Production
Other Russian Liquids Novatek Gazprom
kb/d
FSU net exports rose by 440 kb/d to 9.2 mb/d in January driven by a significant 400 kb/d increase in product shipments. Crude volumes rose by a marginal 10 kb/d after a rebound in Caspian exports offset a 20 kb/d decrease in Transneft flows. Deliveries of Turkmen and Azerbaijani oil through the BTC pipeline increased by 50 kb/d to 700 kb/d upon the completion of maintenance at the ACG complex. CPC flows increased by 40 kb/d to 650 kb/d following rising production at the Tengiz field but volumes remain approximately 150 kb/d below peak levels due to constraints resulting from Phase 1 of the CPC expansion project. Increased CPC flows offset declines elsewhere in the Black Sea as the Ukrainian ports fell out of favour with exporters. Cargoes sent via Primorsk rebounded by 50 kb/d after completion of maintenance on the BPS pipeline with the rise being equally split between Russian and Kazakhstani crudes. Elsewhere, Druzhba pipeline flows fell by 40 kb/d after less Russian Urals was delivered to Poland and shipments of ESPO from Kozmino inched down by 20 kb/d. Increasing refinery runs, coupled with a seasonal dip in demand, were the primary drivers for the exceptional 400 kb/d hike in products shipments, with exports of fuel oil, gasoil and ‘other gasoil’ growing by 180 kb/d, 150 kb/d and 60 kb/d, respectively. Rebounding domestic demand, additional maintenance at Primorsk, and cold weather likely reduced net product exports in February.
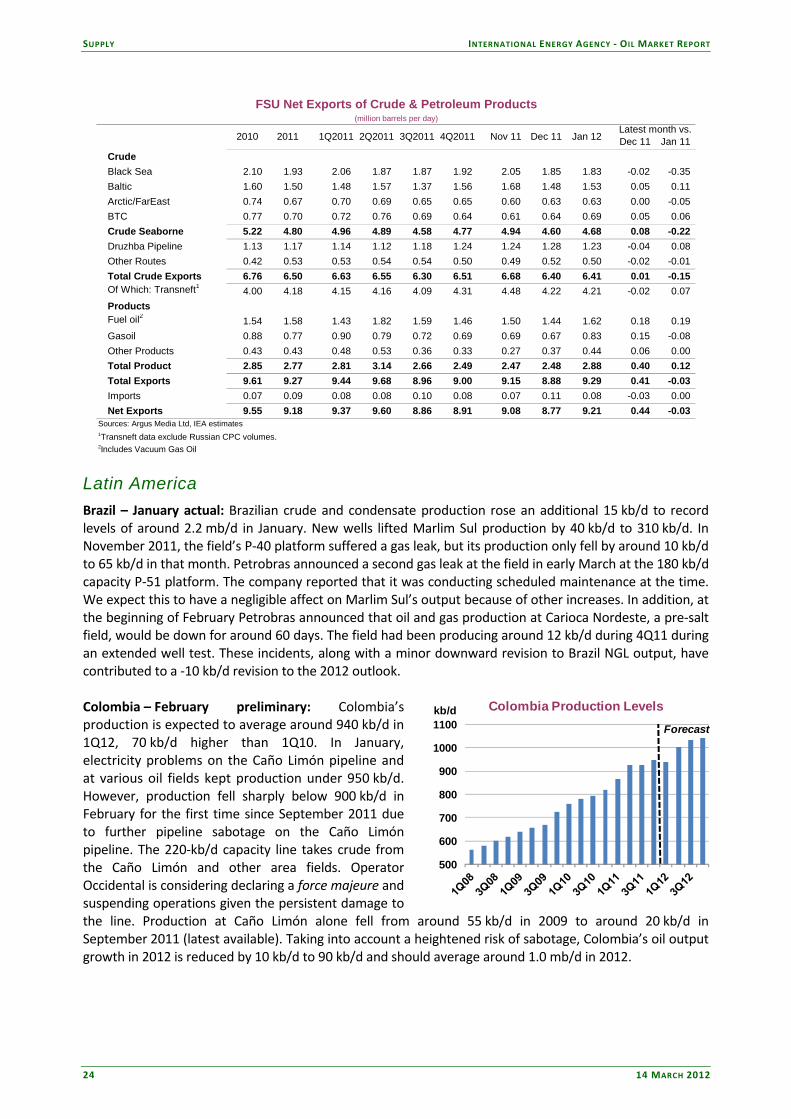
SUPPLY INTERNATIONAL ENERGY AGENCY ‐ OIL MARKET REPORT
24 14 MARCH 2012
Latest month vs. Dec 11 Jan 11
CrudeBlack Sea 2.10 1.93 2.06 1.87 1.87 1.92 2.05 1.85 1.83 -0.02 -0.35 Baltic 1.60 1.50 1.48 1.57 1.37 1.56 1.68 1.48 1.53 0.05 0.11 Arctic/FarEast 0.74 0.67 0.70 0.69 0.65 0.65 0.60 0.63 0.63 0.00 -0.05 BTC 0.77 0.70 0.72 0.76 0.69 0.64 0.61 0.64 0.69 0.05 0.06 Crude Seaborne 5.22 4.80 4.96 4.89 4.58 4.77 4.94 4.60 4.68 0.08 -0.22 Druzhba Pipeline 1.13 1.17 1.14 1.12 1.18 1.24 1.24 1.28 1.23 -0.04 0.08 Other Routes 0.42 0.53 0.53 0.54 0.54 0.50 0.49 0.52 0.50 -0.02 -0.01 Total Crude Exports 6.76 6.50 6.63 6.55 6.30 6.51 6.68 6.40 6.41 0.01 -0.15 Of Which: Transneft1 4.00 4.18 4.15 4.16 4.09 4.31 4.48 4.22 4.21 -0.02 0.07 ProductsFuel oil2 1.54 1.58 1.43 1.82 1.59 1.46 1.50 1.44 1.62 0.18 0.19 Gasoil 0.88 0.77 0.90 0.79 0.72 0.69 0.69 0.67 0.83 0.15 -0.08 Other Products 0.43 0.43 0.48 0.53 0.36 0.33 0.27 0.37 0.44 0.06 0.00 Total Product 2.85 2.77 2.81 3.14 2.66 2.49 2.47 2.48 2.88 0.40 0.12 Total Exports 9.61 9.27 9.44 9.68 8.96 9.00 9.15 8.88 9.29 0.41 -0.03 Imports 0.07 0.09 0.08 0.08 0.10 0.08 0.07 0.11 0.08 -0.03 0.00 Net Exports 9.55 9.18 9.37 9.60 8.86 8.91 9.08 8.77 9.21 0.44 -0.03
Sources: Argus Media Ltd, IEA estimates1Transneft data exclude Russian CPC volumes.2Includes Vacuum Gas Oil
Jan 12
FSU Net Exports of Crude & Petroleum Products(million barrels per day)
2010 2011 1Q2011 2Q2011 3Q2011 4Q2011 Nov 11 Dec 11
Latin America Brazil – January actual: Brazilian crude and condensate production rose an additional 15 kb/d to record levels of around 2.2 mb/d in January. New wells lifted Marlim Sul production by 40 kb/d to 310 kb/d. In November 2011, the field’s P‐40 platform suffered a gas leak, but its production only fell by around 10 kb/d to 65 kb/d in that month. Petrobras announced a second gas leak at the field in early March at the 180 kb/d capacity P‐51 platform. The company reported that it was conducting scheduled maintenance at the time. We expect this to have a negligible affect on Marlim Sul’s output because of other increases. In addition, at the beginning of February Petrobras announced that oil and gas production at Carioca Nordeste, a pre‐salt field, would be down for around 60 days. The field had been producing around 12 kb/d during 4Q11 during an extended well test. These incidents, along with a minor downward revision to Brazil NGL output, have contributed to a ‐10 kb/d revision to the 2012 outlook. Colombia – February preliminary: Colombia’s production is expected to average around 940 kb/d in 1Q12, 70 kb/d higher than 1Q10. In January, electricity problems on the Caño Limón pipeline and at various oil fields kept production under 950 kb/d. However, production fell sharply below 900 kb/d in February for the first time since September 2011 due to further pipeline sabotage on the Caño Limón pipeline. The 220‐kb/d capacity line takes crude from the Caño Limón and other area fields. Operator Occidental is considering declaring a force majeure and suspending operations given the persistent damage to the line. Production at Caño Limón alone fell from around 55 kb/d in 2009 to around 20 kb/d in September 2011 (latest available). Taking into account a heightened risk of sabotage, Colombia’s oil output growth in 2012 is reduced by 10 kb/d to 90 kb/d and should average around 1.0 mb/d in 2012.
500
600
700
800
900
1000
1100Colombia Production Levels
Forecastkb/d
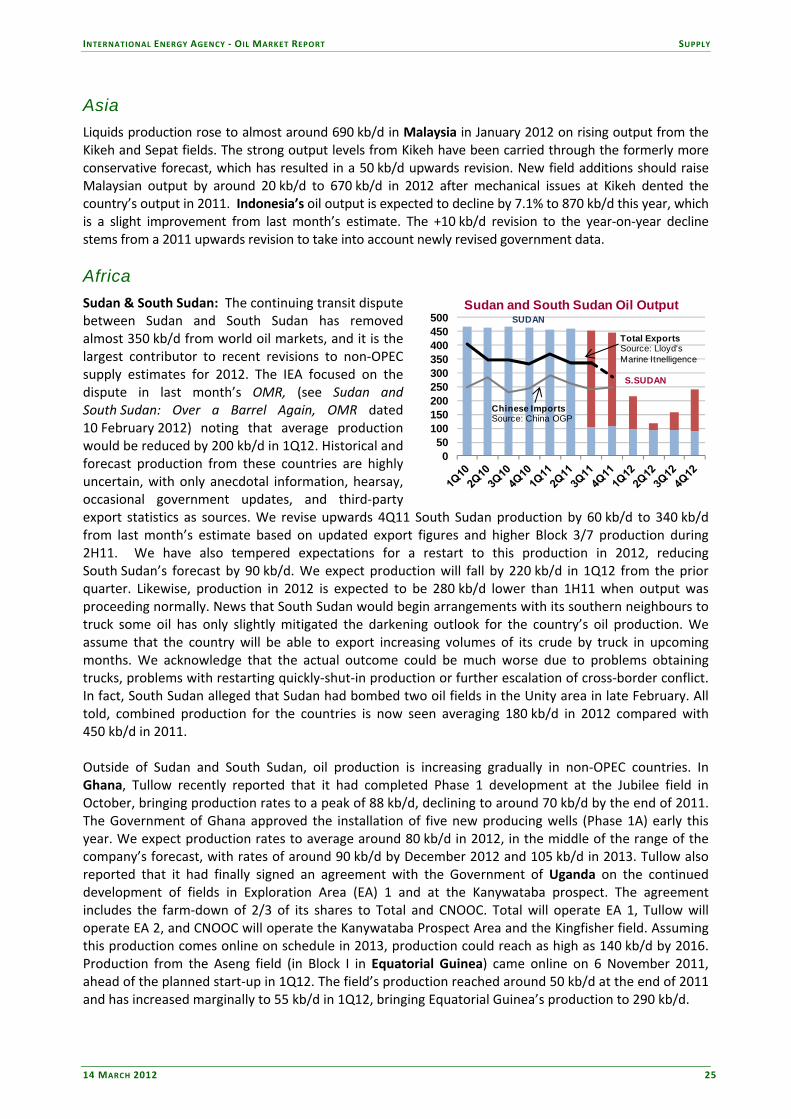
INTERNATIONAL ENERGY AGENCY ‐ OIL MARKET REPORT SUPPLY
14 MARCH 2012 25
Asia Liquids production rose to almost around 690 kb/d in Malaysia in January 2012 on rising output from the Kikeh and Sepat fields. The strong output levels from Kikeh have been carried through the formerly more conservative forecast, which has resulted in a 50 kb/d upwards revision. New field additions should raise Malaysian output by around 20 kb/d to 670 kb/d in 2012 after mechanical issues at Kikeh dented the country’s output in 2011. Indonesia’s oil output is expected to decline by 7.1% to 870 kb/d this year, which is a slight improvement from last month’s estimate. The +10 kb/d revision to the year‐on‐year decline stems from a 2011 upwards revision to take into account newly revised government data. Africa Sudan & South Sudan: The continuing transit dispute between Sudan and South Sudan has removed almost 350 kb/d from world oil markets, and it is the largest contributor to recent revisions to non‐OPEC supply estimates for 2012. The IEA focused on the dispute in last month’s OMR, (see Sudan and South Sudan: Over a Barrel Again, OMR dated 10 February 2012) noting that average production would be reduced by 200 kb/d in 1Q12. Historical and forecast production from these countries are highly uncertain, with only anecdotal information, hearsay, occasional government updates, and third‐party export statistics as sources. We revise upwards 4Q11 South Sudan production by 60 kb/d to 340 kb/d from last month’s estimate based on updated export figures and higher Block 3/7 production during 2H11. We have also tempered expectations for a restart to this production in 2012, reducing South Sudan’s forecast by 90 kb/d. We expect production will fall by 220 kb/d in 1Q12 from the prior quarter. Likewise, production in 2012 is expected to be 280 kb/d lower than 1H11 when output was proceeding normally. News that South Sudan would begin arrangements with its southern neighbours to truck some oil has only slightly mitigated the darkening outlook for the country’s oil production. We assume that the country will be able to export increasing volumes of its crude by truck in upcoming months. We acknowledge that the actual outcome could be much worse due to problems obtaining trucks, problems with restarting quickly‐shut‐in production or further escalation of cross‐border conflict. In fact, South Sudan alleged that Sudan had bombed two oil fields in the Unity area in late February. All told, combined production for the countries is now seen averaging 180 kb/d in 2012 compared with 450 kb/d in 2011. Outside of Sudan and South Sudan, oil production is increasing gradually in non‐OPEC countries. In Ghana, Tullow recently reported that it had completed Phase 1 development at the Jubilee field in October, bringing production rates to a peak of 88 kb/d, declining to around 70 kb/d by the end of 2011. The Government of Ghana approved the installation of five new producing wells (Phase 1A) early this year. We expect production rates to average around 80 kb/d in 2012, in the middle of the range of the company’s forecast, with rates of around 90 kb/d by December 2012 and 105 kb/d in 2013. Tullow also reported that it had finally signed an agreement with the Government of Uganda on the continued development of fields in Exploration Area (EA) 1 and at the Kanywataba prospect. The agreement includes the farm‐down of 2/3 of its shares to Total and CNOOC. Total will operate EA 1, Tullow will operate EA 2, and CNOOC will operate the Kanywataba Prospect Area and the Kingfisher field. Assuming this production comes online on schedule in 2013, production could reach as high as 140 kb/d by 2016. Production from the Aseng field (in Block I in Equatorial Guinea) came online on 6 November 2011, ahead of the planned start‐up in 1Q12. The field’s production reached around 50 kb/d at the end of 2011 and has increased marginally to 55 kb/d in 1Q12, bringing Equatorial Guinea’s production to 290 kb/d.
050
100150200250300350400450500
Sudan and South Sudan Oil Output
Total ExportsSource: Lloyd'sMarine Itnelligence
Chinese ImportsSource: China OGP
SUDAN
S.SUDAN
SUPPLY INTERNATIONAL ENERGY AGENCY ‐ OIL MARKET REPORT
26 14 MARCH 2012
Middle East Yemen’s output averaged around 180 kb/d in 4Q11, around 120 kb/d below 2010 levels of 300 kb/d. Production fared worse in 1Q12 and especially in February and is estimated to have dropped an additional 20 kb/d to 160 kb/d from the prior quarter. The continued targeting of the Marib oil pipeline, which flows 270 miles to the Red Sea port of Ras Issa, has frequently shut in production at the fields in Block 18 and has required the country to import refined products. In February, a four‐day long labour strike at Total’s Block 10 compromised 70 kb/d of production, and a nine day long strike in Block 14 shut in 52 kb/d of production according to media reports. These strikes reduced Yemen’s monthly average by an additional 40 kb/d to less than 140 kb/d in February. All told, Yemen’s liquids production is expected to fall by 50 kb/d to 180 kb/d in 2012 on the assumption that that 2Q12‐4Q12 period sees modest improvements compared to first quarter levels. Syria’s liquids production is expected to fall by around 30 kb/d to 170 kb/d by December 2012, in a marked decrease from last month’s expectations for a rebound to 2011 levels. The attacks on energy infrastructure around Homs have continued although the government has appeared to gain ground against the opposition. Despite these gains, the opposition is likely to continue to sabotage the energy infrastructure, arguably more so. In the medium to long term, new proposed US sanctions against Syria are likely to tighten the screws on potential investment in the energy sector. The House Foreign Affairs committee unanimously passed the Syria Freedom Support Act (H.R. 2106), which still requires passage by the full House and Senate. The bill • Orders the US President to impose sanctions on parties making a single petroleum development
investment of over $5 million or a series of investments that are at least $2 million (and exceed $5 million in the aggregate).
• Directs the President to sanction entities that invest in the maintenance or expansion of refined product production in quantities of more than $1 million.
• Orders the President to impose sanctions on entities that sell refined products with a value of more than $1 million.
• Sanctions entities that finance or insure any Syrian energy shipments in to or out of the country. Oman – December preliminary: Oil production in Oman reached around 900 kb/d in December and is expected to average similar levels for 2012 as a whole. Enhanced oil recovery via steam flood at Oxy’s Mukhaizna project and PDO’s Harwheel miscible gas project will offset declines elsewhere in coming years. In a recent investor presentation, Oxy claimed that additional volumes are soon to come from additional steam flooding. According to newly released data by the Omani Ministry of Oil and Gas, PDO (a consortium led by Shell but with a 60% government share) produced 549 kb/d of crude oil and 94 kb/d of condensate in 2011, roughly 73% of the country’s liquids output. PDO recently noted that it would be turning to unconventional resources in order to fulfil the government’s requirement to keep production above 550 kb/d for over 10 years.
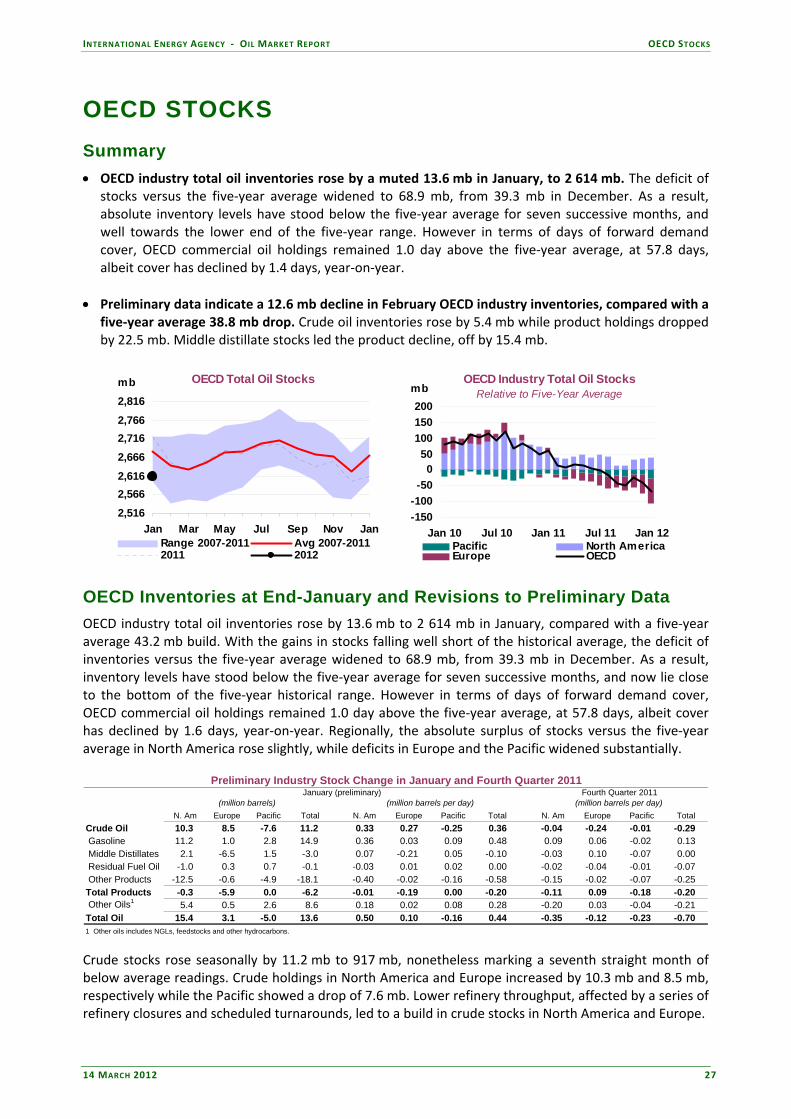
INTERNATIONAL ENERGY AGENCY ‐ OIL MARKET REPORT OECD STOCKS
14 MARCH 2012 27
OECD STOCKS Summary • OECD industry total oil inventories rose by a muted 13.6 mb in January, to 2 614 mb. The deficit of
stocks versus the five‐year average widened to 68.9 mb, from 39.3 mb in December. As a result, absolute inventory levels have stood below the five‐year average for seven successive months, and well towards the lower end of the five‐year range. However in terms of days of forward demand cover, OECD commercial oil holdings remained 1.0 day above the five‐year average, at 57.8 days, albeit cover has declined by 1.4 days, year‐on‐year.
• Preliminary data indicate a 12.6 mb decline in February OECD industry inventories, compared with a five‐year average 38.8 mb drop. Crude oil inventories rose by 5.4 mb while product holdings dropped by 22.5 mb. Middle distillate stocks led the product decline, off by 15.4 mb.
OECD Total Oil Stocks
2,5162,5662,6162,6662,7162,7662,816
Jan Mar May Jul Sep Nov Jan
mb
Range 2007-2011 Avg 2007-20112011 2012
OECD Industry Total Oil StocksRelative to Five-Year Average
-150-100-50
050
100150200
Jan 10 Jul 10 Jan 11 Jul 11 Jan 12
mb
Pacific North AmericaEurope OECD
OECD Inventories at End-January and Revisions to Preliminary Data OECD industry total oil inventories rose by 13.6 mb to 2 614 mb in January, compared with a five‐year average 43.2 mb build. With the gains in stocks falling well short of the historical average, the deficit of inventories versus the five‐year average widened to 68.9 mb, from 39.3 mb in December. As a result, inventory levels have stood below the five‐year average for seven successive months, and now lie close to the bottom of the five‐year historical range. However in terms of days of forward demand cover, OECD commercial oil holdings remained 1.0 day above the five‐year average, at 57.8 days, albeit cover has declined by 1.6 days, year‐on‐year. Regionally, the absolute surplus of stocks versus the five‐year average in North America rose slightly, while deficits in Europe and the Pacific widened substantially.
N. Am Europe Pacific Total N. Am Europe Pacific Total N. Am Europe Pacific TotalCrude Oil 10.3 8.5 -7.6 11.2 0.33 0.27 -0.25 0.36 -0.04 -0.24 -0.01 -0.29 Gasoline 11.2 1.0 2.8 14.9 0.36 0.03 0.09 0.48 0.09 0.06 -0.02 0.13 Middle Distillates 2.1 -6.5 1.5 -3.0 0.07 -0.21 0.05 -0.10 -0.03 0.10 -0.07 0.00 Residual Fuel Oil -1.0 0.3 0.7 -0.1 -0.03 0.01 0.02 0.00 -0.02 -0.04 -0.01 -0.07 Other Products -12.5 -0.6 -4.9 -18.1 -0.40 -0.02 -0.16 -0.58 -0.15 -0.02 -0.07 -0.25 Total Products -0.3 -5.9 0.0 -6.2 -0.01 -0.19 0.00 -0.20 -0.11 0.09 -0.18 -0.20 Other Oils1 5.4 0.5 2.6 8.6 0.18 0.02 0.08 0.28 -0.20 0.03 -0.04 -0.21 Total Oil 15.4 3.1 -5.0 13.6 0.50 0.10 -0.16 0.44 -0.35 -0.12 -0.23 -0.70 1 Other oils includes NGLs, feedstocks and other hydrocarbons.
(million barrels) (million barrels per day) (million barrels per day)
Preliminary Industry Stock Change in January and Fourth Quarter 2011January (preliminary) Fourth Quarter 2011
Crude stocks rose seasonally by 11.2 mb to 917 mb, nonetheless marking a seventh straight month of below average readings. Crude holdings in North America and Europe increased by 10.3 mb and 8.5 mb, respectively while the Pacific showed a drop of 7.6 mb. Lower refinery throughput, affected by a series of refinery closures and scheduled turnarounds, led to a build in crude stocks in North America and Europe.
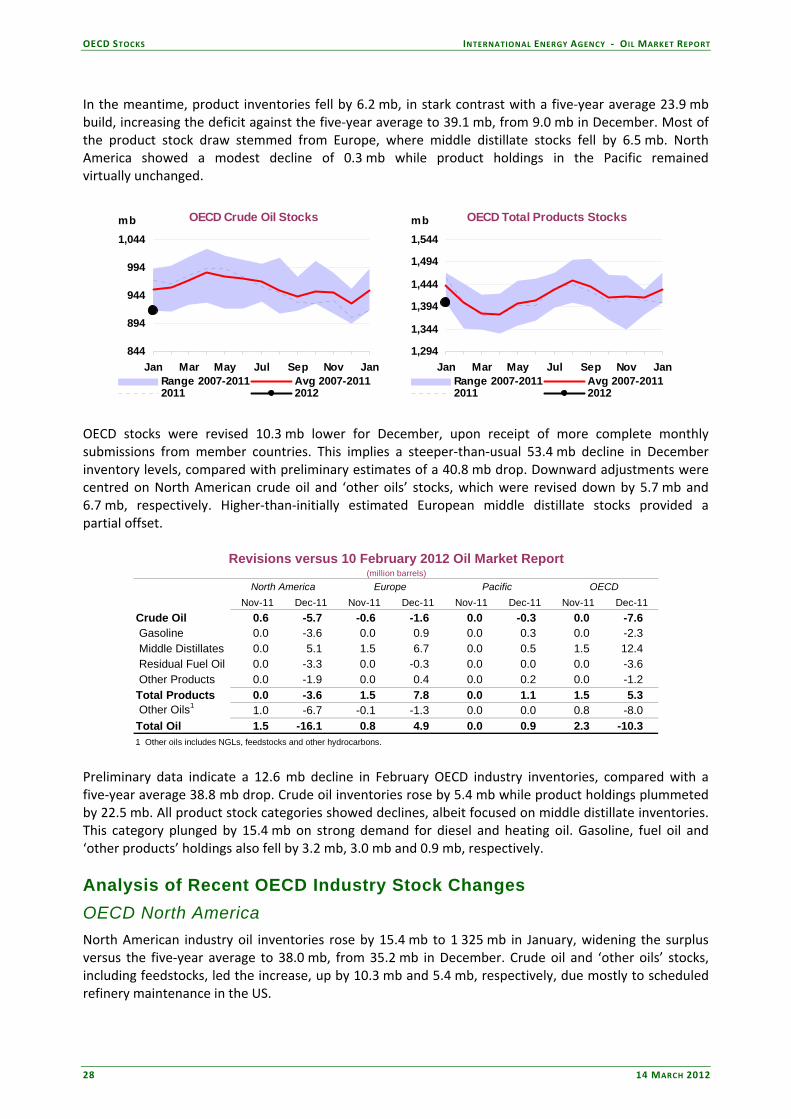
OECD STOCKS INTERNATIONAL ENERGY AGENCY ‐ OIL MARKET REPORT
28 14 MARCH 2012
In the meantime, product inventories fell by 6.2 mb, in stark contrast with a five‐year average 23.9 mb build, increasing the deficit against the five‐year average to 39.1 mb, from 9.0 mb in December. Most of the product stock draw stemmed from Europe, where middle distillate stocks fell by 6.5 mb. North America showed a modest decline of 0.3 mb while product holdings in the Pacific remained virtually unchanged.
OECD Crude Oil Stocks
844
894
944
994
1,044
Jan Mar May Jul Sep Nov Jan
mb
Range 2007-2011 Avg 2007-20112011 2012
OECD Total Products Stocks
1,294
1,344
1,394
1,444
1,494
1,544
Jan Mar May Jul Sep Nov Jan
mb
Range 2007-2011 Avg 2007-20112011 2012
OECD stocks were revised 10.3 mb lower for December, upon receipt of more complete monthly submissions from member countries. This implies a steeper‐than‐usual 53.4 mb decline in December inventory levels, compared with preliminary estimates of a 40.8 mb drop. Downward adjustments were centred on North American crude oil and ‘other oils’ stocks, which were revised down by 5.7 mb and 6.7 mb, respectively. Higher‐than‐initially estimated European middle distillate stocks provided a partial offset.
(million barrels)North America Europe Pacific OECD
Nov-11 Dec-11 Nov-11 Dec-11 Nov-11 Dec-11 Nov-11 Dec-11Crude Oil 0.6 -5.7 -0.6 -1.6 0.0 -0.3 0.0 -7.6 Gasoline 0.0 -3.6 0.0 0.9 0.0 0.3 0.0 -2.3 Middle Distillates 0.0 5.1 1.5 6.7 0.0 0.5 1.5 12.4 Residual Fuel Oil 0.0 -3.3 0.0 -0.3 0.0 0.0 0.0 -3.6 Other Products 0.0 -1.9 0.0 0.4 0.0 0.2 0.0 -1.2 Total Products 0.0 -3.6 1.5 7.8 0.0 1.1 1.5 5.3 Other Oils1 1.0 -6.7 -0.1 -1.3 0.0 0.0 0.8 -8.0 Total Oil 1.5 -16.1 0.8 4.9 0.0 0.9 2.3 -10.3 1 Other oils includes NGLs, feedstocks and other hydrocarbons.
Revisions versus 10 February 2012 Oil Market Report
Preliminary data indicate a 12.6 mb decline in February OECD industry inventories, compared with a five‐year average 38.8 mb drop. Crude oil inventories rose by 5.4 mb while product holdings plummeted by 22.5 mb. All product stock categories showed declines, albeit focused on middle distillate inventories. This category plunged by 15.4 mb on strong demand for diesel and heating oil. Gasoline, fuel oil and ‘other products’ holdings also fell by 3.2 mb, 3.0 mb and 0.9 mb, respectively. Analysis of Recent OECD Industry Stock Changes OECD North America North American industry oil inventories rose by 15.4 mb to 1 325 mb in January, widening the surplus versus the five‐year average to 38.0 mb, from 35.2 mb in December. Crude oil and ‘other oils’ stocks, including feedstocks, led the increase, up by 10.3 mb and 5.4 mb, respectively, due mostly to scheduled refinery maintenance in the US.

INTERNATIONAL ENERGY AGENCY ‐ OIL MARKET REPORT OECD STOCKS
14 MARCH 2012 29
Meanwhile, product inventories edged down by 0.3 mb as a sharp decline in ‘other products’ holdings outweighed an increase in gasoline stocks. ‘Other products’ stocks fell by 12.5 mb on the increased use of propane for heating, while gasoline inventories rose by 11.2 mb due to lower demand. US preliminary data show four‐week average gasoline demand declined to the lowest level since February 2001. Middle distillate stocks rose by 2.1 mb, as heating oil consumption was depressed by warmer‐than‐normal temperatures.
OECD North America Crude Oil Stocks
399419439
459479499
519
Jan Mar May Jul Sep Nov Jan
mb
Range 2007-2011 Avg 2007-20112011 2012
OECD North America Total Products Stocks
599
649
699
749
799
Jan Mar May Jul Sep Nov Jan
mb
Range 2007-2011 Avg 2007-20112011 2012
US weekly data show oil inventories edged down by 0.2 mb in February, compared with a five‐year average 19.7 mb draw. Crude holdings rose by 6.4 mb, most of which stemmed from Cushing, Oklahoma. Crude levels at Cushing surged by 5.5 mb to 35.8 mb, marking their highest level since June 2011 due to the Seaway pipeline purge as well as lower refinery throughputs.
US Weekly Total Industry Stocks
900950
1,0001,0501,1001,1501,200
Jan Apr Jul Oct
mb
Range 2007-2011 5-yr Average2011 2012
Source: EIA
US Weekly Cushing Crude Stocks
1015202530354045
Jan Apr Jul Oct
mb
Range 2007-11 5-yr Average2011 2012
Source: EIA
US product inventories fell by 11.9 mb in February on the back of declines across every product category. Middle distillate holdings took the lead, decreasing by 7.5 mb. However, it was diesel stocks that accounted for most of middle distillates’ decline, off by 5.9 mb. Heating oil stocks edged down by 0.6 mb on unusually mild weather in the Northeast region. Gasoline inventories declined by 1.7 mb as demand rose month‐on‐month, despite remaining weak. ‘Other products’ and fuel oil stocks also fell by 2.4 mb and 0.3 mb, respectively. OECD Europe Industry oil inventories in Europe rose by 3.1 mb in January to 904 mb, a milder increase than the five‐year average build of 21.1 mb, thus widening the deficit versus the five‐year average to 79.4 mb from 61.5 mb in December. European stocks have therefore set new five‐year lows for nine of the last ten months (baring November 2011) Both lower refinery runs and higher regional output drove crude stocks up by 8.5 mb, to 295 mb. However, they are still at the second lowest level since September 1997, and have stayed under the five‐year range for an eleventh straight month. At the same time, scheduled returns on loans from Germany’s stockholding agency, EBV, of at least 0.6 mb of North Sea crude in January may have contributed to a downward trend in European industry crude oil inventories.

OECD STOCKS INTERNATIONAL ENERGY AGENCY ‐ OIL MARKET REPORT
30 14 MARCH 2012
In the meantime, European refined product holdings fell by 5.9 mb in stark contrast with a five‐year average 20.6 mb build. They fell below the five‐year range for the first time since November 2007. However, product stocks look comfortable when measured against forward demand, slightly above the five‐year average at 39.1 days of forward cover. Middle distillates led the decrease, falling by 6.5 mb on strong demand for diesel and heating oil. Notably, German middle distillate holdings were reported to have fallen by 9.0 mb. In contrast, gasoline and fuel oil holdings rose by 1.0 mb and 0.3 mb, respectively. Meanwhile, German end‐user heating oil stocks fell by 3 percentage points to 54% fill at end‐January.
OECD Europe Crude Oil Stocks
282
302
322
342
362
Jan Mar May Jul Sep Nov Jan
mb
Range 2007-2011 Avg 2007-20112011 2012
OECD Europe Total Products Stocks
502522542562582602622
Jan Mar May Jul Sep Nov Jan
mb
Range 2007-2011 Avg 2007-20112011 2012
February preliminary data from Euroilstock point to a seasonal 3.9 mb stock draw, compared with a five‐year average 10.9 mb fall in the EU‐15 and Norway. Both crude oil and product inventories fell by 0.7 mb and 3.3 mb respectively. Middle distillate holdings led the decrease, declining by 2.5 mb. As was the case in January, replenishment of government agency stocks may have contributed to this decrease, with France’s agency purchasing 2.3 mb of diesel. A 0.3 mb decrease in industry gasoline stocks and a 1.4 mb decline in fuel oil holdings also contributed to the overall product stock draws. In the meantime, ‘other products’ inventories rose by 0.9 mb. Refined product stocks held in independent storage in Northwest Europe fell, on sharp draws in gasoline as exports to the United States and other countries rose. OECD Pacific January commercial oil inventories in the Pacific declined by 5.0 mb to 385 mb in contrast with the five‐year average increase of 9.5 mb. The deficit of inventories versus the five‐year average widened to 27.5 mb from 13.1 mb in December, with oil stocks falling below the five‐year range. Crude holdings decreased counter‐seasonally by 7.6 mb to 148 mb, remaining under the five‐year range for a fourth consecutive month. In the meantime, product stocks remained virtually unchanged, as gains in gasoline, middle distillate and fuel oil stocks were offset by a drop in ‘other products’ holdings. However, products stocks remain below their five‐year range. Gasoline, middle distillate, and fuel oil holdings rose by 2.8 mb, 1.5 mb and 0.7 mb, respectively while ‘other products’ stocks fell by 4.9 mb.
OECD Pacific Crude Oil Stocks
144
154
164
174
184
Jan Mar May Jul Sep Nov Jan
mb
Range 2007-2011 Avg 2007-20112011 2012
OECD Pacific Total Products Stocks
154
164
174
184
194
204
Jan Mar May Jul Sep Nov Jan
mb
Range 2007-2011 Avg 2007-20112011 2012

INTERNATIONAL ENERGY AGENCY ‐ OIL MARKET REPORT OECD STOCKS
14 MARCH 2012 31
Japanese industry inventories declined seasonally by 8.5 mb in February, according to weekly data from the Petroleum Association of Japan (PAJ). Crude oil stocks fell by 0.3 mb, likely on lower crude oil imports. Product holdings decreased by 7.3 mb, led by a fall in kerosene inventories. An extremely cold winter drove kerosene stocks down by 3.2 mb, to below the five‐year range. They have been reduced by more than 50% since November last year, dissipating the gradual stock build observed since the catastrophic earthquake and tsunami in March 2011. Gasoline and fuel oil inventories fell by 1.2 mb respectively, while ‘other products’ stocks edged up by 0.7 mb.
Japan Total Industry Stocks (including naphtha)
200210220230240250260270280
Jan Apr Jul Oct
mb
Range 2007-11 5-yr Average2011 2012
Source: PAJ
Japan Weekly Kerosene Stocks
5
10
15
20
25
30
35
Jan Apr Jul Oct
mb
Range 2007-11 5-yr Average2011 2012
Source: PAJ
Recent Developments in Singapore and China Stocks According to China Oil, Gas and Petrochemicals (OGP), Chinese commercial oil inventories surged in January by an equivalent of 19.6 mb (data are reported in terms of percentage stock change). Despite an increase in crude oil throughput, higher imports and strong domestic output drove crude oil holdings up by 1.2% (2.5 mb), putting an end to a three‐month decline. Product inventories skyrocketed by 13.1% (17.1 mb), led by a sharp increase in diesel stocks. In the midst of higher refinery throughput boosting the levels of refined product stocks in general, two long holidays (the New Year holiday and the Spring Festival holiday) that lasted 10 days in January had an impact on product demand ‐ gasoline demand rose while diesel demand slumped. Gasoline inventories fell by 4.0% (2.2 mb) while diesel and kerosene inventories increased by 29.1% (18.8 mb) and 4.7% (0.5 mb), respectively.
China Monthly Oil Stock Change*
(10)
(5)
0
5
10
15
20
Jul 11 Sep 11 Nov 11 Jan 12
mb
Crude Gasoline Gasoil Kerosene
Source: China Oil, Gas and Petrochemicals
Singapore Weekly Total Product Stocks
202530354045505560
Jan Apr Jul Oct
mb
R ange 2007-2011 5-yr A verage2011 2012
Source: International Enterprise
*Since August 2010, COGP only reports percentage stock change
Singapore onshore inventories surged by 6.0 mb to 44.6 mb in February, well above the five‐year average of 37.6 mb. Fuel oil stocks rose by 2.3 mb for a second consecutive month. Fuel oil holdings have gained 6.4 mb since their two‐and‐a‐half‐year low in the middle of January, due to record‐high Western exports. Middle distillate inventories also increased by 2.1 mb on weak demand. Demand for gasoil and jet fuel in Asia remained subdued, while the arbitrage to send products to Europe remained closed. Gasoline holdings rose by 1.6 mb, to above the five‐year range, as Malaysia and India, among others, increased gasoline exports to Singapore.

OECD STOCKS INTERNATIONAL ENERGY AGENCY ‐ OIL MARKET REPORT
32 14 MARCH 2012
1 Days of forward demand are based on average demand over the next three months
Days1 Million Barrels
Regional OECD End-of-Month Industry Stocks(in days of forward demand and millions barrels of total oil)
OECD Total Oil
50
52
54
56
58
60
62
Jan Mar May Jul Sep Nov Jan
Days
Range 2007-2011 Avg 2007-20112011 2012
North America
4648505254565860
Jan Mar May Jul Sep Nov Jan
Days
Range 2007-2011 Avg 2007-20112011 2012
Europe
5860626466687072
Jan Mar May Jul Sep Nov Jan
Days
Range 2007-2011 Avg 2007-20112011 2012
Pacific
4446485052545658
Jan Mar May Jul Sep Nov Jan
Days
Range 2007-2011 Avg 2007-20112011 2012
North America
1,150
1,200
1,250
1,300
1,350
1,400
1,450
Jan Mar May Jul Sep Nov Jan
mb
Range 2007-2011 Avg 2007-20112011 2012
Europe
880900920940960980
1,0001,020
Jan Mar May Jul Sep Nov Jan
mb
Range 2007-2011 Avg 2007-20112011 2012
Pacific
360
380
400
420
440
460
Jan Mar May Jul Sep Nov Jan
mb
Range 2007-2011 Avg 2007-20112011 2012
OECD Total Oil
2,5002,5502,6002,6502,7002,7502,8002,850
Jan Mar May Jul Sep Nov Jan
mb
Range 2007-2011 Avg 2007-20112011 2012

INTERNATIONAL ENERGY AGENCY ‐ OIL MARKET REPORT PRICES
14 MARCH 2012 33
PRICES Summary • Oil futures prices moved higher in tandem with escalating supply side risks to the market in
February and early March. Geopolitical problems in Syria, South Sudan and Yemen have led to protracted supply disruptions from those countries, removing from the market more than 600 kb/d in 1Q this year. The prospect of additional production outages relating to Iran have added yet more uncertainty for the supply outlook in the coming months. Futures prices for Brent were last trading around $125/bbl and WTI at $106/bbl.
• As tensions in the Middle East spurred prices to a nine‐month peak, open interest in oil derivatives increased in February, despite lingering uncertainties regarding the health of the global economy. Money managers increased their bets on rising oil prices, to the highest levels observed since May 2011, triggered by growing concerns over Iran’s nuclear programme.
• Markets for distillates and fuel oils softened with the end of peak winter season and as earlier
tightness on the product supply side eased. Crack spreads fell for middle distillates and fuel oils in February on weaker fundamentals, with product prices lagging the sharp increase in crude markets. In contrast, gasoline crack spreads continued to show strength, although narrowing from the elevated levels seen in early February.
• Despite buoyant demand for Middle Eastern crudes in Asia, notably from China, vessel oversupply
again weighed heavily, with freight rates on the benchmark Middle East Gulf – Japan route trading flat from mid February onwards. Although rates remain better than the dire levels seen in 3Q11, surging bunker prices have capped earnings.
70
80
90
100
110
120
130
Feb 11 May 11 Aug 11 Nov 11 Feb 12
$/bbl Crude FuturesFront Month Close
NYMEX WTI ICE Brent
Source: ICE, NYMEX
104
108
112
116
120
124
128
M1 2 3 4 5 6 7 8 9 10 11 12
$/bbl NYMEX WTI & ICE BrentForward Price Curves
NYMEX WTI ICE Brent
Source: ICE, NYMEX
9 March 2012
Market Overview February oil futures prices moved higher in tandem with escalating supply side risks to the market. Formidable geopolitical problems in Syria, South Sudan and Yemen have led to protracted supply disruptions from those countries, removing just over 600 kb/d from the market on average in 1Q. Total non‐OPEC unplanned outages, which include the North Sea, equal around 750 kb/d for 1Q12. The prospect of additional supply losses relating to the crisis with OPEC’s second largest producer, Iran, have added yet more uncertainty for the supply outlook in coming months. Oil futures at writing were trading near the 2011 highs posted at the onset of the Libyan crisis in late February, with Brent prices around $125/bbl and WTI about $106/bbl. Month‐on‐month, Brent futures rose by $7.61/bbl, to an average $119.06/bbl in February, gaining a further $6/bbl in early‐March.
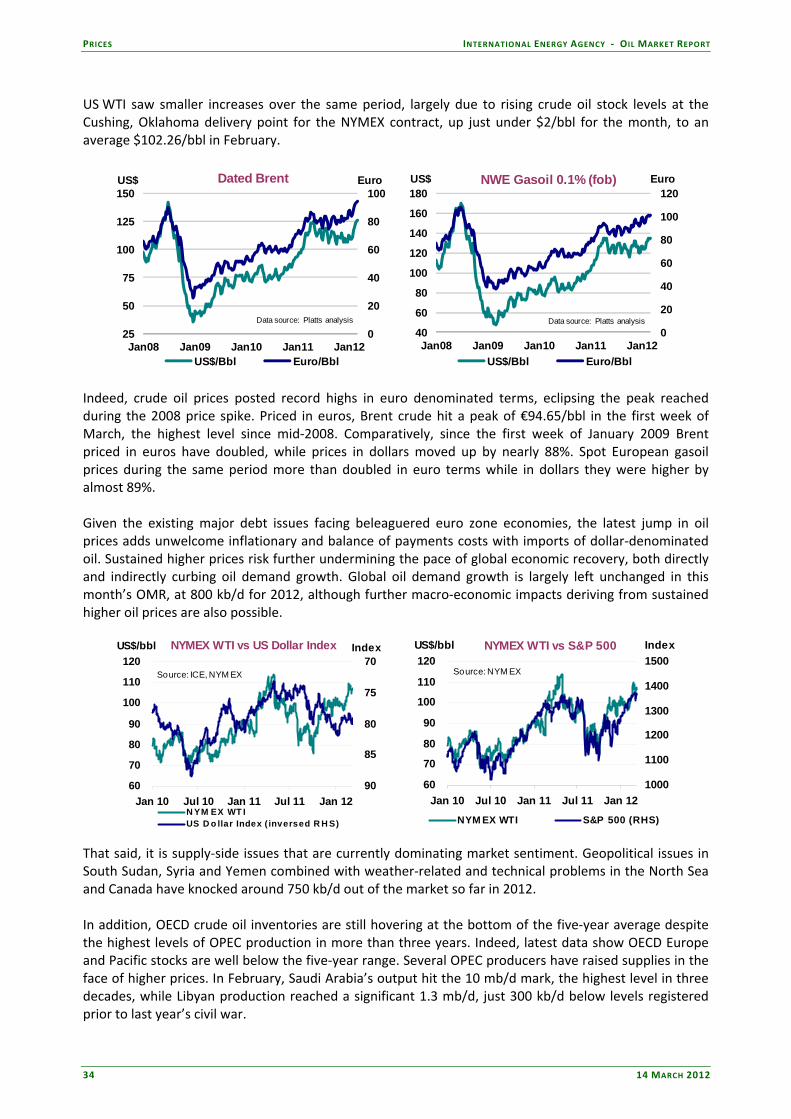
PRICES INTERNATIONAL ENERGY AGENCY ‐ OIL MARKET REPORT
34 14 MARCH 2012
US WTI saw smaller increases over the same period, largely due to rising crude oil stock levels at the Cushing, Oklahoma delivery point for the NYMEX contract, up just under $2/bbl for the month, to an average $102.26/bbl in February.
0
20
40
60
80
100
25
50
75
100
125
150
Jan08 Jan09 Jan10 Jan11 Jan12
EuroUS$ Dated Brent
US$/Bbl Euro/Bbl
Data source: Platts analysis
0
20
40
60
80
100
120
40
60
80
100
120
140
160
180
Jan08 Jan09 Jan10 Jan11 Jan12
EuroUS$ NWE Gasoil 0.1% (fob)
US$/Bbl Euro/Bbl
Data source: Platts analysis
Indeed, crude oil prices posted record highs in euro denominated terms, eclipsing the peak reached during the 2008 price spike. Priced in euros, Brent crude hit a peak of €94.65/bbl in the first week of March, the highest level since mid‐2008. Comparatively, since the first week of January 2009 Brent priced in euros have doubled, while prices in dollars moved up by nearly 88%. Spot European gasoil prices during the same period more than doubled in euro terms while in dollars they were higher by almost 89%. Given the existing major debt issues facing beleaguered euro zone economies, the latest jump in oil prices adds unwelcome inflationary and balance of payments costs with imports of dollar‐denominated oil. Sustained higher prices risk further undermining the pace of global economic recovery, both directly and indirectly curbing oil demand growth. Global oil demand growth is largely left unchanged in this month’s OMR, at 800 kb/d for 2012, although further macro‐economic impacts deriving from sustained higher oil prices are also possible.
NYMEX WTI vs US Dollar Index
60
70
80
90
100
110
120
Jan 10 Jul 10 Jan 11 Jul 11 Jan 12
US$/bbl70
75
80
85
90
Index
N YM EX WT IUS D o llar Index ( inversed R H S)
Source: ICE, NYM EX
NYMEX WTI vs S&P 500
60
70
80
90
100
110
120
Jan 10 Jul 10 Jan 11 Jul 11 Jan 12
US$/bbl
1000
1100
1200
1300
1400
1500Index
NYM EX WTI S&P 500 (RHS)
Source: NYM EX
That said, it is supply‐side issues that are currently dominating market sentiment. Geopolitical issues in South Sudan, Syria and Yemen combined with weather‐related and technical problems in the North Sea and Canada have knocked around 750 kb/d out of the market so far in 2012. In addition, OECD crude oil inventories are still hovering at the bottom of the five‐year average despite the highest levels of OPEC production in more than three years. Indeed, latest data show OECD Europe and Pacific stocks are well below the five‐year range. Several OPEC producers have raised supplies in the face of higher prices. In February, Saudi Arabia’s output hit the 10 mb/d mark, the highest level in three decades, while Libyan production reached a significant 1.3 mb/d, just 300 kb/d below levels registered prior to last year’s civil war.
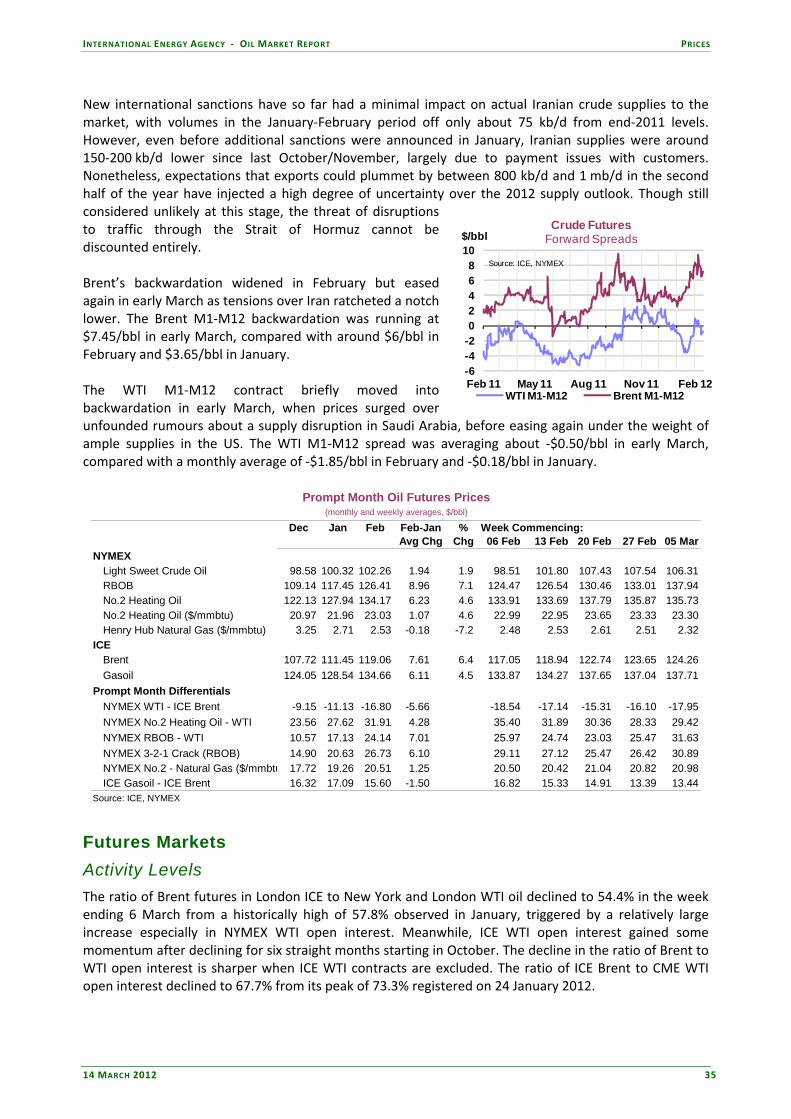
INTERNATIONAL ENERGY AGENCY ‐ OIL MARKET REPORT PRICES
14 MARCH 2012 35
New international sanctions have so far had a minimal impact on actual Iranian crude supplies to the market, with volumes in the January‐February period off only about 75 kb/d from end‐2011 levels. However, even before additional sanctions were announced in January, Iranian supplies were around 150‐200 kb/d lower since last October/November, largely due to payment issues with customers. Nonetheless, expectations that exports could plummet by between 800 kb/d and 1 mb/d in the second half of the year have injected a high degree of uncertainty over the 2012 supply outlook. Though still considered unlikely at this stage, the threat of disruptions to traffic through the Strait of Hormuz cannot be discounted entirely. Brent’s backwardation widened in February but eased again in early March as tensions over Iran ratcheted a notch lower. The Brent M1‐M12 backwardation was running at $7.45/bbl in early March, compared with around $6/bbl in February and $3.65/bbl in January. The WTI M1‐M12 contract briefly moved into backwardation in early March, when prices surged over unfounded rumours about a supply disruption in Saudi Arabia, before easing again under the weight of ample supplies in the US. The WTI M1‐M12 spread was averaging about ‐$0.50/bbl in early March, compared with a monthly average of ‐$1.85/bbl in February and ‐$0.18/bbl in January.
Dec Jan Feb Feb-Jan % Week Commencing:Avg Chg Chg 06 Feb 13 Feb 20 Feb 27 Feb 05 Mar
NYMEXLight Sweet Crude Oil 98.58 100.32 102.26 1.94 1.9 98.51 101.80 107.43 107.54 106.31RBOB 109.14 117.45 126.41 8.96 7.1 124.47 126.54 130.46 133.01 137.94No.2 Heating Oil 122.13 127.94 134.17 6.23 4.6 133.91 133.69 137.79 135.87 135.73No.2 Heating Oil ($/mmbtu) 20.97 21.96 23.03 1.07 4.6 22.99 22.95 23.65 23.33 23.30Henry Hub Natural Gas ($/mmbtu) 3.25 2.71 2.53 -0.18 -7.2 2.48 2.53 2.61 2.51 2.32
ICEBrent 107.72 111.45 119.06 7.61 6.4 117.05 118.94 122.74 123.65 124.26Gasoil 124.05 128.54 134.66 6.11 4.5 133.87 134.27 137.65 137.04 137.71
Prompt Month DifferentialsNYMEX WTI - ICE Brent -9.15 -11.13 -16.80 -5.66 -18.54 -17.14 -15.31 -16.10 -17.95NYMEX No.2 Heating Oil - WTI 23.56 27.62 31.91 4.28 35.40 31.89 30.36 28.33 29.42NYMEX RBOB - WTI 10.57 17.13 24.14 7.01 25.97 24.74 23.03 25.47 31.63NYMEX 3-2-1 Crack (RBOB) 14.90 20.63 26.73 6.10 29.11 27.12 25.47 26.42 30.89NYMEX No.2 - Natural Gas ($/mmbtu 17.72 19.26 20.51 1.25 20.50 20.42 21.04 20.82 20.98ICE Gasoil - ICE Brent 16.32 17.09 15.60 -1.50 16.82 15.33 14.91 13.39 13.44
Source: ICE, NYMEX
Prompt Month Oil Futures Prices(monthly and weekly averages, $/bbl)
Futures Markets Activity Levels The ratio of Brent futures in London ICE to New York and London WTI oil declined to 54.4% in the week ending 6 March from a historically high of 57.8% observed in January, triggered by a relatively large increase especially in NYMEX WTI open interest. Meanwhile, ICE WTI open interest gained some momentum after declining for six straight months starting in October. The decline in the ratio of Brent to WTI open interest is sharper when ICE WTI contracts are excluded. The ratio of ICE Brent to CME WTI open interest declined to 67.7% from its peak of 73.3% registered on 24 January 2012.
-6-4-202468
10
Feb 11 May 11 Aug 11 Nov 11 Feb 12
$/bblCrude Futures
Forward Spreads
WTI M1-M12 Brent M1-M12
Source: ICE, NYMEX

PRICES INTERNATIONAL ENERGY AGENCY ‐ OIL MARKET REPORT
36 14 MARCH 2012
As tensions in the Middle East raised prices to a nine‐month peak, open interest in oil derivatives increased in February, despite lingering uncertainties regarding the health of the global economy. Open interest in New York CME WTI futures and options contracts increased by 11.4% from 31 January 2012 to 6 March 2012 to a four‐month high of 2.58 million contracts. Meanwhile, open interest in futures‐only contracts increased by 13.2% during the same period, from 1.4 million to a seven‐month high of 1.58 million. Over the same period, open interest in London ICE WTI contracts increased to 0.39 million and 0.45 million contracts in futures‐only and combined contracts, respectively. Meanwhile, open interest in ICE Brent contracts also tested new records in February with 1.07 and 1.25 million contracts after peaking at its highest level of 1.0 and 1.12 million contracts in January in futures‐only and combined contracts, respectively. Amid mounting concern about supply outages as well as sanctions on Iranian oil supply and fears about the Strait of Hormuz, money managers increased their bets on rising WTI crude oil prices by 55 471 contracts to reach 228 392 contracts in February, the highest since May 2011. However, in the week ending 6 March 2012, they reduced their long position by 18 857 to 209 535 contracts in response to the fall in WTI prices from $106.55/bbl to $104.7/bbl, triggered by the announcement of renewed talks between Iran and Western powers over Iran’s nuclear programme. Over the same period, money managers also increased their bets on rising Brent prices by 51.7%, from 84 417 to 128 094 futures contracts, the highest level since ICE Futures Europe started publishing information on trading of Brent futures last July.
20
40
60
80
100
120
1,0001,1001,2001,3001,4001,5001,600
Jan 09Jul 09 Jan 10Jul 10 Jan 11Jul 11 Jan 12
'000 Contracts $/bbl
NYMEX WTI Mth1Open Interest
Open Interest NYMEX WTI Mth1
Source: CFTC, NYMEX
85
90
95
100
105
110
-300
-100
100
300
10 Jan 24 Jan 07 Feb 21 Feb 06 Mar
$/bbl'000
ContractsNet Positions in WTI Futures
Producers Swap DealersMoney Managers Other ReportablesNon-Reportables NYMEX WTI
Source: CFTC, NYMEX
Producers reduced their net futures short positions from 85 660 to 74 848 contracts from 31 January 2012 to 6 March 2012; they held 20.88% of the short and 16.16% of the long contracts in CME WTI futures‐only contracts. Swap dealers, who accounted for 22.69% and 35.23% of the open interest on the long side and short side, respectively, increased their net short position by 71.7% to hold 198 772 net short in February. Producers’ trading activity in the London WTI contracts followed an opposite pattern to CME WTI contracts. Producers in the London ICE WTI contracts reduced their net long positions from 20 199 to 12 459 contracts over the same period. Swap dealers also reduced their net short positions during the same period from 47 011 to 30 492 contracts. Meanwhile, NYMEX RBOB futures and combined open interest increased by more than 14.5% over the same period. Open interest in NYMEX heating oil futures contracts increased by almost 4.1% to 286 118 contracts while open interest in natural gas markets increased by 1.1% to reach 1.22 million contracts.
20
40
60
80
Jun-11 Aug-11 Oct-11 Dec-11 Feb-12
%
Brent/WTI (ICE+CME) Brent/WTI (CME)
Percentage of Brent to WTI Open Interest
Source: ICE, CFTC

INTERNATIONAL ENERGY AGENCY ‐ OIL MARKET REPORT PRICES
14 MARCH 2012 37
Index investors’ long exposure in commodities in January 2012 increased by $17.1 billion. However, they cut $6.4 billion from WTI Light Sweet Crude Oil, both on and off futures contracts in January. The number of long futures equivalent contracts dipped to 538 000, the lowest since December of 2008, equivalent to $53.2 billion in notional value.
06 March 2012 Long Short Net Long/Short Δ Net from Prev. Week
Δ Net Vs Last Month
Producers' Positions 256.0 330.9 -74.8 Short 9.9 10.8Swap Dealers' Positions 125.0 323.8 -198.8 Short 8.1 -83.0Money Managers' Positions 255.3 45.7 209.5 Long -18.9 36.6Others' Positions 141.5 114.1 27.4 Long 1.3 29.6Non-Reportable Positions 97.2 60.5 36.7 Long -0.3 5.9Open Interest 1584.8 67.0 185.0Source: CFTC
Thousand ContractsPositions on NYMEX Light Sweet Crude Oil (WTI) Futures Contracts
Market Regulation As mentioned in the OMR of 10 February, the European Council and Parliament reached an agreement on the final draft of the proposed European Markets Infrastructure Regulation (EMIR), which aims to increase transparency and reduce risk in the over‐the‐counter derivatives markets and establishes common rules for Central Counterparty Clearing Houses (CCPs) and trade repositories (TRs). The agreed EMIR calls for clearing of all OTC derivatives through CCPs. The rule extends reporting requirements not only to OTC derivatives, but also to other derivatives contracts. The authority to identify the contracts subject to a clearing obligation is delegated to the European Securities and Markets Authority (ESMA). Furthermore, the final version gives public authorities the right to authorise CCP. However, in case of disputes between public authorities over the authorisation of CCPs, ESMA can play a binding negotiator role or may take a final decision on the authorisation of a CCP if asked by public authorities. Also, CCPs from third countries will be recognised in the European Union if the domestic legal regime has an effective equivalent system for the authorisation of CCPs. The final draft of EMIR is still pending approval from the European Parliament and Council. It is expected to be approved by the European Parliament during its 12‐15 March session, and then the Council will need to formally adopt the rules. Once adopted by the Council, it will be published in the Official Journal and the rules will enter into force 20 days after the publication. The new rules are expected to be effective by the end of 2012. On 23 February 2012, the US CFTC re‐proposed its rule for determining the appropriate block size for different asset classes. As reported in the January OMR, the rule on appropriate block size was removed from the final rule on real‐time reporting of swap trades in December. Several market participants had asked the CFTC to reconsider its rule on timing of public dissemination of details of large trades since they need time to hedge or lay off risk incurred with these large trades before they are reported to trade repositories. The new rule calls for different block sizes for different asset classes. The Commission proposed to adopt a two‐period approach to determine the appropriate block size for different asset classes. In the initial period, which would last for a minimum of one year, the appropriate size is set by the Commission. For example, for NYMEX WTI and ICE Brent oil swaps, the initial appropriate minimum block size is set at 100 000 barrels. In the post‐initial period, the Commission, based on data collected by trade repositories, will establish the appropriate minimum block size using a 75 percent notional amount calculation to establish and update these sizes in no less than one year. On 27 February 2012, a federal court declined ISDA and SIFAM’s request against the implementation of the CFTC’s position limit rule. However, the court expressed concern that the Commission might have overreached its mandate by pre‐emptively setting a position limit on commodity derivatives contracts,

PRICES INTERNATIONAL ENERGY AGENCY ‐ OIL MARKET REPORT
38 14 MARCH 2012
without sufficient cost‐benefit analysis. The court also declared its intention to rule whether to halt temporarily the implementation of the position limit rule. The court, however, might not need to rule on the position limit until June, since the regulators (CFTC and SEC) failed to reach an agreement on the final rule, which defines what a swap is. The position limit rule will be effective sixty days after the term “swap” is defined by the Commission. The earliest estimate for the final rule on the definition of “swap” is for early April, which implies that the position limit will not be effective until June, even if the federal court did not provide a temporary injunction to stop implementation. The US CFTC delayed its vote on the final rule defining swap dealer and major swap participants, which will eventually determine which entities face mandatory capital and margin requirements as well as position limits. The vote had been delayed twice by the Commission on 23 February and 9 March but the CFTC may bring the final rule for voting in its 20 March meeting. Some reports suggest that the CFTC may increase the threshold that determines which market participants are deemed swap dealers from the originally proposed level of $100 million in 2010 to $3 billion, based on the notional value of a company’s annual swaps trade. The prospective increase in threshold will certainly exempt some energy companies, which have long claimed that their use of swaps is to reduce risks tied to oil and natural gas assets, from being classified as swap dealers. The International Organisation of Securities and Commissions (IOSCO) issued a consultation paper on functioning and oversight of oil price reporting agencies (PRAs). This follows the mandate from the G20 Cannes Summit Declaration in November 2011 for “IOSCO, in collaboration with the IEF, the IEA and OPEC, to prepare recommendations to improve their functioning and oversight to our Finance Ministers by mid‐2012”. The consultation paper asked stakeholders’ views on the role and operation of oil price reporting agencies, including the impact of PRAs on physical and paper oil markets, the effects of different methodologies used by different PRAs on market prices, the impact of current functions of the PRAs on price transparency in the physical and paper oil markets, the current governance of PRAs without any independent third party oversight, and the need for public oversight of PRAs. IOSCO has requested responses by 30 March 2012. Based on stakeholder responses, IOSCO will then propose a set of recommendations, in collaboration with the IEA, IEF and OPEC, to be submitted to the G20 Finance Ministers meeting in June 2012 in Mexico.
High Frequency Traders: Flash Crashers or Liquidity Providers? On 6 May 2010, major American stock indices and stock index futures nosedived by more than five percent before sharply recovering in less than 30 minutes. Since that infamous flash crash, high frequency traders (HFTs) have drawn the attention of regulators, exchanges and market participants, despite the fact that the crash was not triggered directly by HFTs, according to an official joint report released by the US CFTC and SEC. Nonetheless, fragmentation of trading venues and the establishment of the US Regulation National Market System and the European Union’s Markets in Financial Instruments Directive (MiFID) in 2007 requiring brokerages to find the best execution for customers, have led to the explosive growth of HFTs.
Some studies suggest that a few high‐frequency trading (HFT) firms now account for more than 70 and 60 percent of overall trading volume on US equities and futures markets, respectively. HFTs’ share in European markets’ trading volume is estimated to be smaller than that of in US trading; however, they have continued to ramp up their activities on exchanges on both sides of the Atlantic.
High Frequency Trading in Energy Markets
According to CME’s algorithmic trading study (HFT is a subset of algorithmic trading) published on 15 July 2010, 35% of crude oil future trading and 71% of message traffic in the first quarter of 2010 came from algorithmic traders. Compared to other asset classes, algorithmic traders’ share in the volume of trade is still low, but in terms of message traffic, crude oil comes second after EuroFX futures. The CME report further suggests that increased algorithmic trading activity correlated with narrower bid/ask spreads, increased market depth and reduced volatility. That is to say, the presence of algorithmic traders substantially improved the quality of market.
INTERNATIONAL ENERGY AGENCY ‐ OIL MARKET REPORT PRICES
14 MARCH 2012 39
High Frequency Traders: Flash Crashers or Liquidity Providers? (continued) Although HFTs presence in futures markets has been on the rise, they are present in limited commodity markets, such as crude oil due to its higher liquidity. Some market participants argued that as more swaps activity shifts to electronic platforms, we should expect to see HFTs dominate in these markets. However, HFTs’ survival depends on the short time delays in trade execution. Therefore, HFTs’ arrival relies on the initial liquidity in the market place. That is to say, the survival or even arrival of HFTs onto swap execution facilities (SEFs) solely depends on the success of SEFs and liquidity in these platforms. As noted in the January OMR, the OTC market is different from the futures markets. Instruments (swaps) in the OTC markets can trade infrequently, often in significant sizes. Therefore, we would not expect to see an influx of order flows from HFTs to SEFs.
High Frequency Traders and Their Impacts
Regulators on both side of the Atlantic, while urging new curbs on high frequency trading, are still debating its definition. The Securities and Exchange Commission refers to them as “professional traders acting in a proprietary capacity that engage in strategies that generate a large number of trades on a daily basis. These traders could be organized in a variety of ways, including as a proprietary trading firm. Other characteristics often attributed to proprietary firms engaged in HFT are: (1) the use of extraordinarily high‐speed and sophisticated computer programs for generating, routing, and executing orders; (2) use of co‐location services and individual data feeds offered by exchanges and others to minimize network and other types of latencies; (3) very short time‐frames for establishing and liquidating positions; (4) the submission of numerous orders that are cancelled shortly after submission; and (5) ending the trading day in as close to a flat position as possible (that is, not carrying significant, unhedged positions over‐night).” However, the term is still relatively new and there is no consensus yet on the definition of HFT. For example, the US CFTC announced in late January 2012 that it is forming a subcommittee that would be tasked with defining and identifying HFTs trading pattern and its possible impact on futures, swaps and options markets.
HFTs use several different strategies to enter the market. Some HFTs can be considered market makers, where they place buy and sell orders continuously throughout the trading day in order to earn bid and ask spreads. Some other HFTs can act as arbitrageurs to make profit from price discrepancies in certain assets trading simultaneously on separate markets. Most studies found that HFTs add substantially to the price discovery process, as well as eliminating any price differential across trading venues. Furthermore, it is argued that the arrival of HFTs and increased low‐latency activity, defined as “strategies that respond to market events in the millisecond environment”, substantially improved the quality of markets by adding liquidity, lowering the trading costs (narrowing bid and ask spread), reducing short‐term volatility and increasing the limit order book depth during normal and heightened uncertain times.
However, some studies suggested that without mandatory obligations to provide liquidity, HFTs may have exacerbated volatility by withdrawing liquidity from the market, especially during severe market episodes such as those experienced during the flash crash. Others also question the liquidity provided by HFTs. Since more than 95% of orders placed by the HFTs are cancelled immediately, some market participants are sceptical that high frequency trading provides liquidity to the markets. Some argue that HFTs provide liquidity when it is not needed. Others further argued that HFTs exhibit trading patterns inconsistent with the traditional definition of market making, in the sense that they aggressively trade in the direction of a price change that does not result in inventory accumulation.
As high frequency trading is becoming increasingly popular, concerns over trading practices and their impact on the quality and volatility of markets have been raised by some regulators and exchanges. For example, US CFTC Commissioner Chilton urges creating a registration category for high‐frequency trading firms and imposing new restrictions on their trading practices if necessary. In the meantime, some exchanges in the US and Europe already took some steps by introducing penalties on high‐frequency traders who place and cancel large number of bids and offers within milliseconds. Some regulators refer to such practices as parasitic trading. Others however, see HFT simply as a logical and inevitable upshot of both increases in risk‐hedging appetite and advances in information technology.

PRICES INTERNATIONAL ENERGY AGENCY ‐ OIL MARKET REPORT
40 14 MARCH 2012
Spot Crude Oil Prices
Spot crude oil prices matched the upward moves in futures markets in February and early March. With existing supply disruptions having the biggest impact on European and Asian markets, prices for Brent and Dubai crudes posted the largest increases over the past six weeks. Spot prices for Dated Brent were up in February by just under $9/bbl, to an average $119.50/bbl, while Dubai rose about $6.35/bbl to $116.15/bbl last month. By contrast, US WTI rose by a smaller $2/bbl to around $102.30/bbl on average in February, with higher stock levels at Cushing, Oklahoma tempering price gains.
70
80
90
100
110
120
130
Feb 11 May 11 Aug 11 Nov 11 Feb 12
$/bbl Benchmark Crude Prices
WTI Cushing Dated Brent Dubai
Data source: Platts analysis
-35
-30
-25
-20
-15
-10
-5
0
Feb 11 May 11 Aug 11 Nov 11 Feb 12
$/bbl WTI vs Dated Brent Differential
Data source: Platts analysis
The price disconnect between the US benchmark crude and global markets saw the price spread between the two benchmark crudes widen to the steepest levels in six months. The spot WTI‐Dated Brent differential was averaging around $19.35/bbl in the first decade of March, compared with an average $17.20/bbl in February and $10.10/bbl in January. The steeper WTI/Brent differential follows the surge in crude oil inventories at the Cushing, Oklahoma storage depot. Cushing stocks jumped to the highest level since last June, following a purge of the Seaway pipeline ahead of its planned reversal as well as reduced refinery runs in the region.
-6-5-4-3-2-101
Feb 11 May 11 Aug 11 Nov 11 Feb 12
$/bbl UralsDifferentials (NWE / Med) vs Brent
Urals (NWE) Urals (Med)
Data source: Platts analysis
-1
0
1
2
3
4
5
Feb 11 May 11 Aug 11 Nov 11 Feb 12
$/bbl NigeriaDifferentials to Dated Brent
Brass River-DB Bonny Light-DBForcados-DB
Data source: Platts analysis
Although European refiners continue to search for replacement grades for heavier Iranian barrels, spot crude markets are currently fairly well‐supplied, especially with lighter crudes. However, Brent prices have remained relatively strong given increased demand from Asia, while demand for Urals and light crudes from Nigeria eased on ample supplies and weak refiner demand. The Brent price differential to distillate‐rich Nigeria crudes tumbled, with the Brent‐Bonny spread falling to just $0.20/bbl in early March compared with $1.10/bbl on average in February and a robust $2.75/bbl in January.
Our usual summary tables of average spot crude oil and products prices, and Table 13, in the subscriber edition of this report have been removed pending further licensing discussions with the data provider.

INTERNATIONAL ENERGY AGENCY ‐ OIL MARKET REPORT PRICES
14 MARCH 2012 41
The Brent‐Urals premium also collapsed in February, in part due to weaker fuel oil crack spreads. Urals was also supported early in the New Year by higher refiner interest in the grade since it is considered a suitable replacement for Iranian crude in Europe. After posting an unusual premium to Brent for several days at the end of January, Urals in the Mediterranean was trading at a $1.10 /bbl discount to Brent on average in February and a sharp $3.30/bbl discount by early March. Brent crude's premium to Dubai widened in February on reduced demand for the latter as the northern hemisphere winter drew to a close and on ample supplies of sour grades. The Brent‐Dubai differential widened to around ‐$3.40/bbl in February compared to around ‐$0.80/bbl in January. Relatively strong Asian demand, however, is keeping a floor under Middle East crude prices, especially given the loss of heavier crude supplies from Syria, South Sudan, Sudan and Yemen. China has reportedly increased purchases of Saudi grades and Russian ESPO crude in recent weeks although there are signs that at least one lengthy pricing dispute that had seen Chinese term purchases of Iranian crude running at half 2011’s 550 kb/d has been resolved. New contracts run from April, although it is thought likely that Chinese refiners will continue to seek alternative Middle East supplies in an effort to be seen to be reducing Iranian offtake in 2012. However, unlike European refiners directly affected by the oil embargo on Iran, including a cut‐off in insurance coverage for tanker liftings, Chinese companies are able to use the domestic fleet, which is less reliant on European insurance. Spot Product Prices Markets for middle distillates and fuel oil softened with the end of the peak winter demand season and as earlier tightness on the supply‐side eased. Crack spreads fell for middle distillates and fuel oil in February on weaker fundamentals and as product prices lagged behind the sharp increase in crude prices. In contrast, gasoline crack spreads continued to show strength, although narrowing from the elevated levels seen in early February. Gasoline crack spreads rose month‐on‐month in all regions. In the US Gulf, gasoline crack spreads increased by $1.52/bbl versus Mars, and in New York Harbour by $6.66/bbl to WTI. The refinery closures both in Europe and the Caribbean supported markets at the beginning of the month. However, crack spreads narrowed throughout February as low demand readings again came into focus, and with increasing stocks as both US refinery runs were high and the arbitrage from Europe was open.
-100
102030405060
Feb 11 May 11 Aug 11 Nov 11 Feb 12
$/bbl GasolineCracks to Benchmark Crudes
NWE Unl 10ppm NYH Unl 93Med Unl 10ppm SP Prem Unl
Data source: Platts analysis
-20
-16
-12
-8
-4
0
4
Feb 11 May 11 Aug 11 Nov 11 Feb 12
$/bblNaphtha
Cracks to Benchmark Crudes
NWE SPMed CIF ME Gulf
Data source: Platts analysis
-4-202468
101214
Feb 11 May 11 Aug 11 Nov 11 Feb 12
$/bbl Brent vs. Dubai
Dated Brent - Dubai Mth1
Data source: Platts analysis
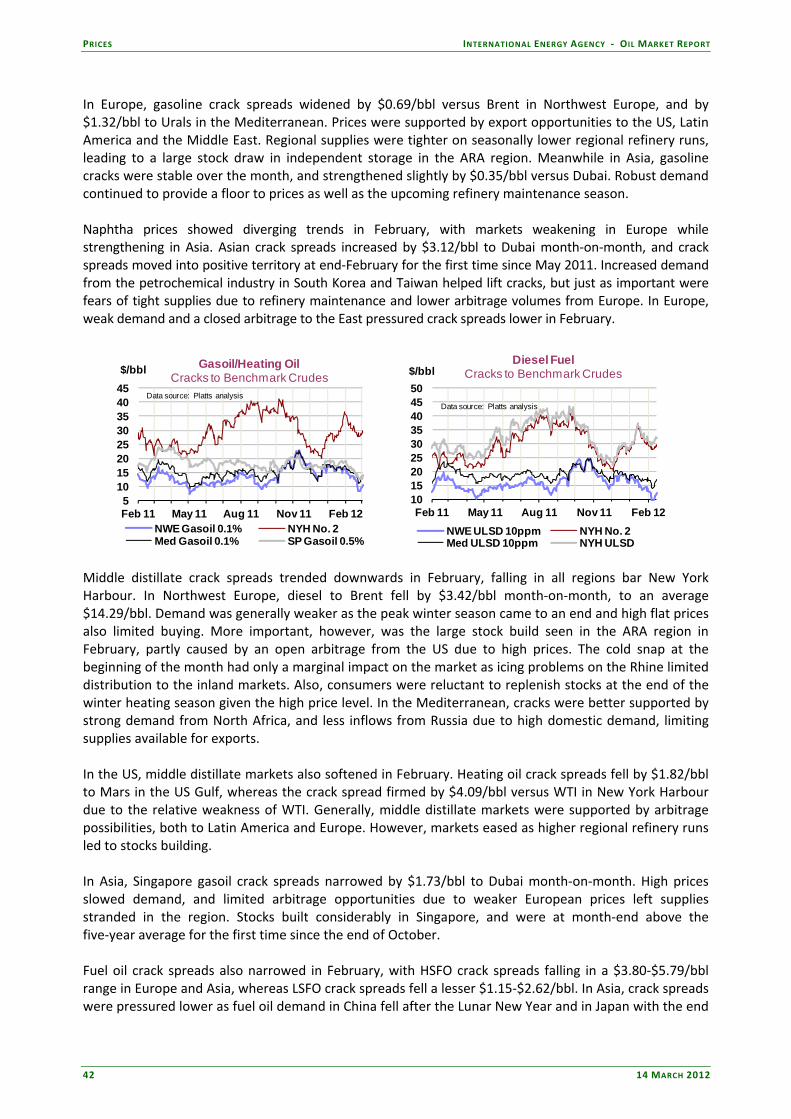
PRICES INTERNATIONAL ENERGY AGENCY ‐ OIL MARKET REPORT
42 14 MARCH 2012
In Europe, gasoline crack spreads widened by $0.69/bbl versus Brent in Northwest Europe, and by $1.32/bbl to Urals in the Mediterranean. Prices were supported by export opportunities to the US, Latin America and the Middle East. Regional supplies were tighter on seasonally lower regional refinery runs, leading to a large stock draw in independent storage in the ARA region. Meanwhile in Asia, gasoline cracks were stable over the month, and strengthened slightly by $0.35/bbl versus Dubai. Robust demand continued to provide a floor to prices as well as the upcoming refinery maintenance season. Naphtha prices showed diverging trends in February, with markets weakening in Europe while strengthening in Asia. Asian crack spreads increased by $3.12/bbl to Dubai month‐on‐month, and crack spreads moved into positive territory at end‐February for the first time since May 2011. Increased demand from the petrochemical industry in South Korea and Taiwan helped lift cracks, but just as important were fears of tight supplies due to refinery maintenance and lower arbitrage volumes from Europe. In Europe, weak demand and a closed arbitrage to the East pressured crack spreads lower in February.
51015202530354045
Feb 11 May 11 Aug 11 Nov 11 Feb 12
$/bbl Gasoil/Heating OilCracks to Benchmark Crudes
NWE Gasoil 0.1% NYH No. 2Med Gasoil 0.1% SP Gasoil 0.5%
Data source: Platts analysis
101520253035404550
Feb 11 May 11 Aug 11 Nov 11 Feb 12
$/bblDiesel Fuel
Cracks to Benchmark Crudes
NWE ULSD 10ppm NYH No. 2Med ULSD 10ppm NYH ULSD
Data source: Platts analysis
Middle distillate crack spreads trended downwards in February, falling in all regions bar New York Harbour. In Northwest Europe, diesel to Brent fell by $3.42/bbl month‐on‐month, to an average $14.29/bbl. Demand was generally weaker as the peak winter season came to an end and high flat prices also limited buying. More important, however, was the large stock build seen in the ARA region in February, partly caused by an open arbitrage from the US due to high prices. The cold snap at the beginning of the month had only a marginal impact on the market as icing problems on the Rhine limited distribution to the inland markets. Also, consumers were reluctant to replenish stocks at the end of the winter heating season given the high price level. In the Mediterranean, cracks were better supported by strong demand from North Africa, and less inflows from Russia due to high domestic demand, limiting supplies available for exports. In the US, middle distillate markets also softened in February. Heating oil crack spreads fell by $1.82/bbl to Mars in the US Gulf, whereas the crack spread firmed by $4.09/bbl versus WTI in New York Harbour due to the relative weakness of WTI. Generally, middle distillate markets were supported by arbitrage possibilities, both to Latin America and Europe. However, markets eased as higher regional refinery runs led to stocks building. In Asia, Singapore gasoil crack spreads narrowed by $1.73/bbl to Dubai month‐on‐month. High prices slowed demand, and limited arbitrage opportunities due to weaker European prices left supplies stranded in the region. Stocks built considerably in Singapore, and were at month‐end above the five‐year average for the first time since the end of October. Fuel oil crack spreads also narrowed in February, with HSFO crack spreads falling in a $3.80‐$5.79/bbl range in Europe and Asia, whereas LSFO crack spreads fell a lesser $1.15‐$2.62/bbl. In Asia, crack spreads were pressured lower as fuel oil demand in China fell after the Lunar New Year and in Japan with the end
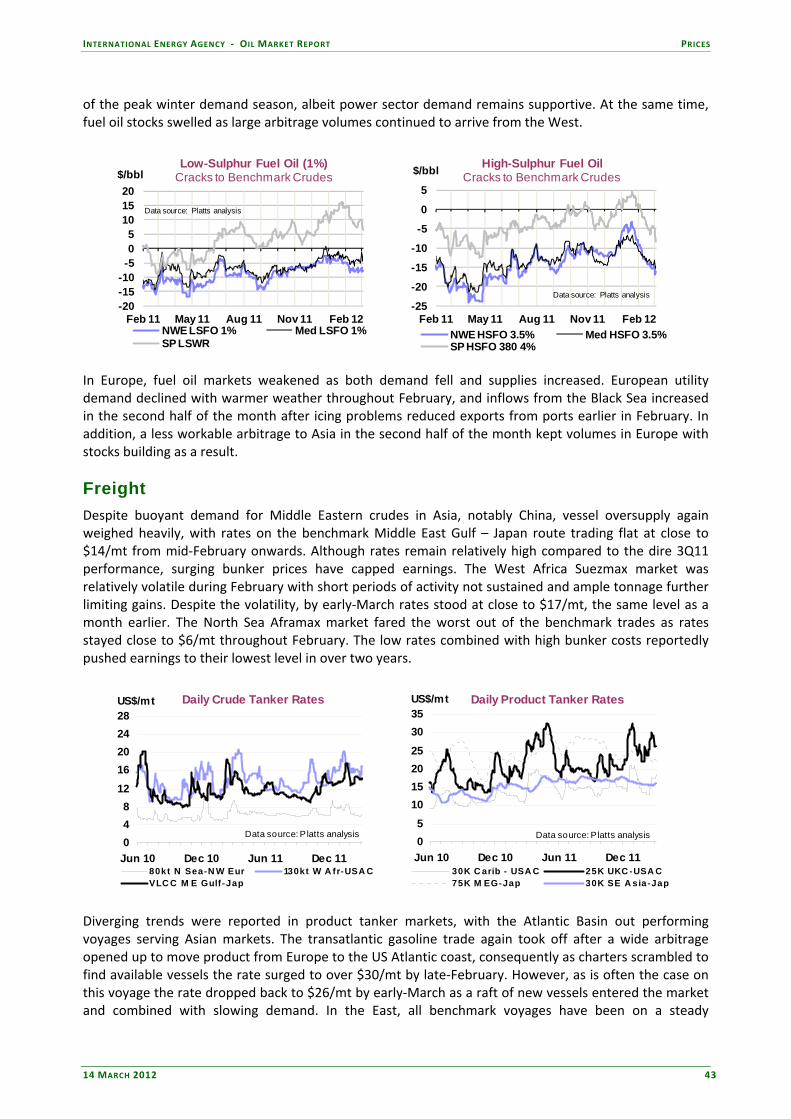
INTERNATIONAL ENERGY AGENCY ‐ OIL MARKET REPORT PRICES
14 MARCH 2012 43
of the peak winter demand season, albeit power sector demand remains supportive. At the same time, fuel oil stocks swelled as large arbitrage volumes continued to arrive from the West.
-20-15-10-505
101520
Feb 11 May 11 Aug 11 Nov 11 Feb 12
$/bblLow-Sulphur Fuel Oil (1%)
Cracks to Benchmark Crudes
NWE LSFO 1% Med LSFO 1%SP LSWR
Data source: Platts analysis
-25
-20
-15
-10
-5
0
5
Feb 11 May 11 Aug 11 Nov 11 Feb 12
$/bbl High-Sulphur Fuel OilCracks to Benchmark Crudes
NWE HSFO 3.5% Med HSFO 3.5%SP HSFO 380 4%
Data source: Platts analysis
In Europe, fuel oil markets weakened as both demand fell and supplies increased. European utility demand declined with warmer weather throughout February, and inflows from the Black Sea increased in the second half of the month after icing problems reduced exports from ports earlier in February. In addition, a less workable arbitrage to Asia in the second half of the month kept volumes in Europe with stocks building as a result. Freight Despite buoyant demand for Middle Eastern crudes in Asia, notably China, vessel oversupply again weighed heavily, with rates on the benchmark Middle East Gulf – Japan route trading flat at close to $14/mt from mid‐February onwards. Although rates remain relatively high compared to the dire 3Q11 performance, surging bunker prices have capped earnings. The West Africa Suezmax market was relatively volatile during February with short periods of activity not sustained and ample tonnage further limiting gains. Despite the volatility, by early‐March rates stood at close to $17/mt, the same level as a month earlier. The North Sea Aframax market fared the worst out of the benchmark trades as rates stayed close to $6/mt throughout February. The low rates combined with high bunker costs reportedly pushed earnings to their lowest level in over two years.
Daily Crude Tanker Rates
048
1216202428
Jun 10 Dec 10 Jun 11 Dec 11
US$/mt
80kt N Sea-N W Eur 130kt W A fr-USA CVLC C M E Gulf -Jap
Data source: P latts analysis
Daily Product Tanker Rates
05
101520253035
Jun 10 Dec 10 Jun 11 Dec 11
US$/mt
30K C arib - USA C 25K UKC -USA C75K M EG-Jap 30K SE A sia-Jap
Data source: Platts analysis
Diverging trends were reported in product tanker markets, with the Atlantic Basin out performing voyages serving Asian markets. The transatlantic gasoline trade again took off after a wide arbitrage opened up to move product from Europe to the US Atlantic coast, consequently as charters scrambled to find available vessels the rate surged to over $30/mt by late‐February. However, as is often the case on this voyage the rate dropped back to $26/mt by early‐March as a raft of new vessels entered the market and combined with slowing demand. In the East, all benchmark voyages have been on a steady
PRICES INTERNATIONAL ENERGY AGENCY ‐ OIL MARKET REPORT
44 14 MARCH 2012
downward trend so far this year as a mixture of sluggish demand and vessel oversupply has pressured rates. The Singapore – Japan short‐haul route languished at close to $16/mt for much of February but some upward momentum was generated in early‐March as increased demand tightened tonnage. An early‐March upturn was also evident on the long range Middle East Gulf – Japan route as increased demand was sufficient to soak up excess tonnage. Market intelligence suggests that our previous assessments of Iranian floating storage at over 30 mb were too high. It is now widely reported that Iranian floating volumes recently sharply declined to 8 mb, stored on 4 vessels after NITC was required to employ more of their tankers to maintain deliveries in the absence of western vessels currently prohibited from calling at Iranian ports due to insurance issues connected to US sanctions. As this situation persists, the potential for a future rise in Iranian floating storage is strongly diminished.

INTERNATIONAL ENERGY AGENCY ‐ OIL MARKET REPORT REFINING
14 MARCH 2012 45
REFINING Summary • Global refinery crude throughputs have been revised slightly lower for 1Q12, on weaker‐than‐
expected non‐OECD readings for a number of countries. A counter‐seasonal increase in US runs in February, however, provided partial offset. In all, 1Q12 global runs are estimated to post annual gains of 180 kb/d, to average 74.9 mb/d, or 35 kb/d less than previously forecast.
• Final data for December for a number of non‐OECD countries led to 4Q11 global refinery crude run
estimates being adjusted lower by 300 kb/d, to 74.6 mb/d, or 120 kb/d below year‐earlier levels. Annual growth is expected to resume in 1Q12 and 2Q12, with global crude throughputs forecast to rise 180 kb/d and 610 kb/d, respectively, to average 74.9 mb/d and 74.5 mb/d.
• OECD refinery runs fell seasonally by 220 kb/d in January, to 36.8 mb/d on average. The start of seasonal maintenance in the US and Europe, and the closure of capacity in Europe brought runs lower in these regions, while Pacific runs inched higher on stronger Japanese throughputs. While preliminary data show US runs rising counter‐seasonally in February, after strong margins in January and amid relatively light turnarounds, throughputs are expected to fall seasonally in coming months.
• Refinery margins plummeted in February, and reached negative territory for most benchmarks
surveyed, after a temporary respite in January. The reported closure of Atlantic Basin capacity had raised margins earlier in the year. Product prices then failed to keep up with crude oil price increases through February, and further downward pressure on margins came from news of the return to operation of capacity (Petroplus) in Europe. Margins on the US West Coast fared better, after a fire and shutdown of BP’s Cherry Point plant in February.
71727374757677
Jan Mar May Jul Sep Nov Jan
mb/dGlobal RefiningCrude Throughput
Range 06-10 Average 06-102010 2011 est.2012 est.
-3.5-2.5-1.5-0.50.51.52.53.5
1Q08 1Q09 1Q10 1Q11 1Q12
mb/d Global Throughputs vs. DemandAnnual growth
Crude Runs Oil Product Demand
Global Refining Overview Global refinery crude throughputs have been revised down by 35 kb/d for 1Q12 following weaker readings for a number of non‐OECD countries for December and January. In fact, December global crude runs were a sizeable 0.6 mb/d weaker than forecast, on lower run estimates for several countries, including Venezuela, Syria, Saudi Arabia, South Africa and Algeria. As a result, global runs contracted by an estimated 1.2 mb/d annually for the month, a level of decline last seen in October 2009. While January estimates have also been reduced, based on the weaker December readings and some additional outage information, runs are expected to return to year‐ago levels before rebounding from March onwards. Growth is seen coming from China, India, Russia, and most recently, the US. US50 crude intake in February was more than 1 mb/d above year‐earlier levels. Improved US Gulf Coast refinery
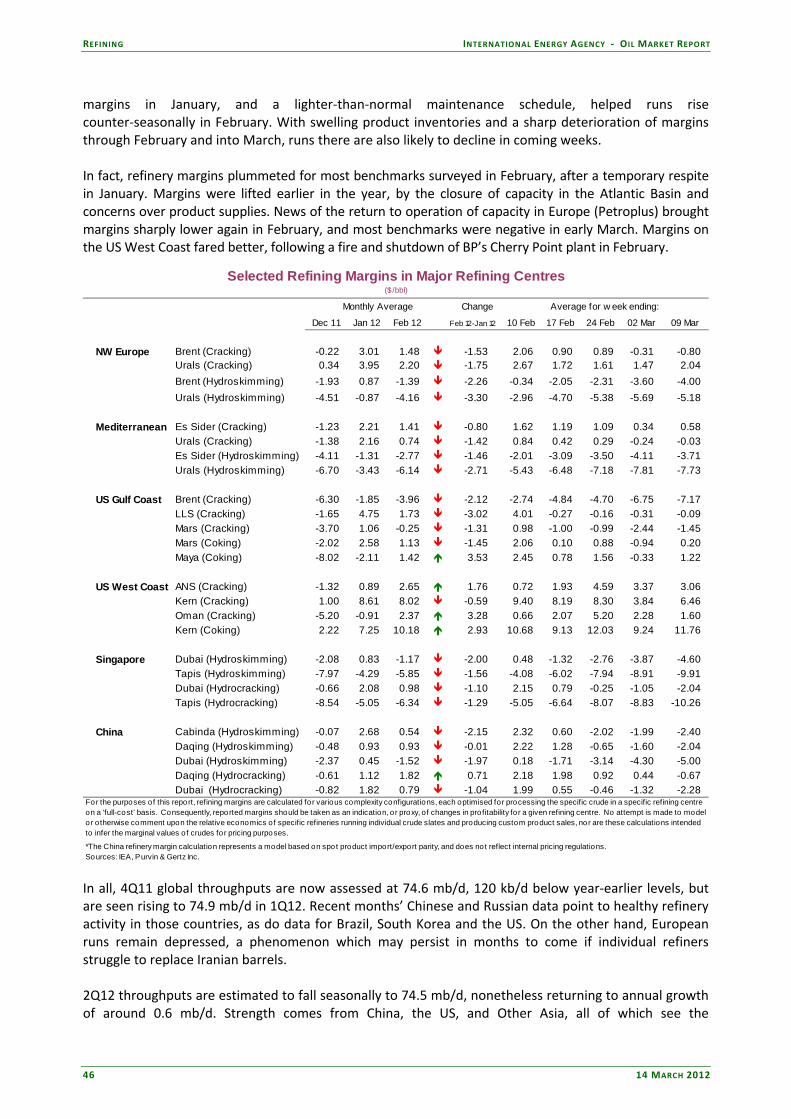
REFINING INTERNATIONAL ENERGY AGENCY ‐ OIL MARKET REPORT
46 14 MARCH 2012
margins in January, and a lighter‐than‐normal maintenance schedule, helped runs rise counter‐seasonally in February. With swelling product inventories and a sharp deterioration of margins through February and into March, runs there are also likely to decline in coming weeks. In fact, refinery margins plummeted for most benchmarks surveyed in February, after a temporary respite in January. Margins were lifted earlier in the year, by the closure of capacity in the Atlantic Basin and concerns over product supplies. News of the return to operation of capacity in Europe (Petroplus) brought margins sharply lower again in February, and most benchmarks were negative in early March. Margins on the US West Coast fared better, following a fire and shutdown of BP’s Cherry Point plant in February.
Selected Refining Margins in Major Refining Centres($ /bbl)
Monthly Average Change Average for w eek ending:
Dec 11 Jan 12 Feb 12 Feb 12-Jan 12 10 Feb 17 Feb 24 Feb 02 Mar 09 Mar
NW Europe Brent (Cracking) -0.22 3.01 1.48 -1.53 2.06 0.90 0.89 -0.31 -0.80 Urals (Cracking) 0.34 3.95 2.20 -1.75 2.67 1.72 1.61 1.47 2.04 Brent (Hydroskimming) -1.93 0.87 -1.39 -2.26 -0.34 -2.05 -2.31 -3.60 -4.00 Urals (Hydroskimming) -4.51 -0.87 -4.16 -3.30 -2.96 -4.70 -5.38 -5.69 -5.18
Mediterranean Es Sider (Cracking) -1.23 2.21 1.41 -0.80 1.62 1.19 1.09 0.34 0.58 Urals (Cracking) -1.38 2.16 0.74 -1.42 0.84 0.42 0.29 -0.24 -0.03 Es Sider (Hydroskimming) -4.11 -1.31 -2.77 -1.46 -2.01 -3.09 -3.50 -4.11 -3.71 Urals (Hydroskimming) -6.70 -3.43 -6.14 -2.71 -5.43 -6.48 -7.18 -7.81 -7.73
US Gulf Coast Brent (Cracking) -6.30 -1.85 -3.96 -2.12 -2.74 -4.84 -4.70 -6.75 -7.17 LLS (Cracking) -1.65 4.75 1.73 -3.02 4.01 -0.27 -0.16 -0.31 -0.09 Mars (Cracking) -3.70 1.06 -0.25 -1.31 0.98 -1.00 -0.99 -2.44 -1.45 Mars (Coking) -2.02 2.58 1.13 -1.45 2.06 0.10 0.88 -0.94 0.20 Maya (Coking) -8.02 -2.11 1.42 3.53 2.45 0.78 1.56 -0.33 1.22
US West Coast ANS (Cracking) -1.32 0.89 2.65 1.76 0.72 1.93 4.59 3.37 3.06 Kern (Cracking) 1.00 8.61 8.02 -0.59 9.40 8.19 8.30 3.84 6.46 Oman (Cracking) -5.20 -0.91 2.37 3.28 0.66 2.07 5.20 2.28 1.60 Kern (Coking) 2.22 7.25 10.18 2.93 10.68 9.13 12.03 9.24 11.76
Singapore Dubai (Hydroskimming) -2.08 0.83 -1.17 -2.00 0.48 -1.32 -2.76 -3.87 -4.60 Tapis (Hydroskimming) -7.97 -4.29 -5.85 -1.56 -4.08 -6.02 -7.94 -8.91 -9.91 Dubai (Hydrocracking) -0.66 2.08 0.98 -1.10 2.15 0.79 -0.25 -1.05 -2.04 Tapis (Hydrocracking) -8.54 -5.05 -6.34 -1.29 -5.05 -6.64 -8.07 -8.83 -10.26
China Cabinda (Hydroskimming) -0.07 2.68 0.54 -2.15 2.32 0.60 -2.02 -1.99 -2.40 Daqing (Hydroskimming) -0.48 0.93 0.93 -0.01 2.22 1.28 -0.65 -1.60 -2.04 Dubai (Hydroskimming) -2.37 0.45 -1.52 -1.97 0.18 -1.71 -3.14 -4.30 -5.00 Daqing (Hydrocracking) -0.61 1.12 1.82 0.71 2.18 1.98 0.92 0.44 -0.67 Dubai (Hydrocracking) -0.82 1.82 0.79 -1.04 1.99 0.55 -0.46 -1.32 -2.28
Sources: IEA, Purvin & Gertz Inc.
For the purposes of this report, refining margins are calculated for various complexity configurations, each optimised for processing the specific crude in a specific refining centre on a 'full-cost' basis. Consequently, reported margins should be taken as an indication, or proxy, of changes in profitability for a given refining centre. No attempt is made to model or otherwise comment upon the relative economics o f specific refineries running individual crude slates and producing custom product sales, nor are these calculations intended to infer the marginal values of crudes for pricing purposes.
*The China refinery margin calculation represents a model based on spot product import/export parity, and does not reflect internal pricing regulations.
In all, 4Q11 global throughputs are now assessed at 74.6 mb/d, 120 kb/d below year‐earlier levels, but are seen rising to 74.9 mb/d in 1Q12. Recent months’ Chinese and Russian data point to healthy refinery activity in those countries, as do data for Brazil, South Korea and the US. On the other hand, European runs remain depressed, a phenomenon which may persist in months to come if individual refiners struggle to replace Iranian barrels. 2Q12 throughputs are estimated to fall seasonally to 74.5 mb/d, nonetheless returning to annual growth of around 0.6 mb/d. Strength comes from China, the US, and Other Asia, all of which see the

INTERNATIONAL ENERGY AGENCY ‐ OIL MARKET REPORT REFINING
14 MARCH 2012 47
commissioning of new capacity. The start‐up of Motiva’s expanded Port Arthur plant on the US Gulf Coast adds an additional 325 kb/d to US distillation capacity. China commissioned new capacity during December and January, which will ramp up over coming months. Despite some delays, new Indian capacity is expected to gradually ramp‐up from March onwards, including MRPL’s Mangalore refinery, the Bathinda grassroots project, Nagarjuna, as well as Essar’s expanded Vadinar plant.
Global Refinery Crude Throughput1(million barrels per day)
Nov 11 Dec 11 4Q2011 Jan 12 Feb 12 Mar 12 1Q2012 Apr 12 May 12 Jun 12 2Q2012
North America 18.0 18.0 17.9 17.7 17.8 17.4 17.6 17.8 18.1 18.3 18.1 Europe 12.1 12.3 12.1 12.1 11.9 11.7 11.9 11.6 11.8 12.1 11.9 Pacif ic 6.6 6.8 6.5 7.0 6.9 6.5 6.8 6.4 6.1 5.9 6.1 Total OECD 36.7 37.0 36.5 36.8 36.6 35.6 36.3 35.8 36.0 36.3 36.0
FSU 6.6 6.6 6.6 6.7 6.8 6.5 6.7 6.4 6.7 6.8 6.6 Non-OECD Europe 0.6 0.6 0.5 0.6 0.5 0.5 0.5 0.5 0.6 0.6 0.6 China 9.2 9.2 9.1 9.3 9.3 9.2 9.3 9.4 9.1 9.2 9.2 Other Asia 9.1 9.1 8.9 9.2 9.2 9.0 9.2 9.0 9.1 9.2 9.1 Latin America 5.1 4.8 5.0 5.0 5.1 4.9 5.0 5.0 4.9 4.9 4.9 Middle East 6.1 5.9 6.0 5.8 5.9 5.5 5.7 5.6 5.9 5.9 5.8 Africa 2.2 2.0 2.1 2.2 2.2 2.2 2.2 2.2 2.1 2.1 2.2 Total Non-OECD 38.7 38.3 38.1 38.9 38.9 37.9 38.6 38.2 38.4 38.7 38.5
Total 75.5 75.3 74.6 75.7 75.5 73.4 74.9 74.0 74.4 75.1 74.5 1 Preliminary and estimated runs based on capacity, know n outages, economic run cuts and global demand forecastNote: US Virgin Islands included in North America and not Latin America as previously OECD Refinery Throughput OECD refinery crude throughputs declined seasonally in January, to 36.8 mb/d from 37.0 mb/d a month earlier, in line with our previous forecast. Runs declined in North America and Europe, while higher runs in the Pacific provided a partial offset. European runs increased their deficit to year‐earlier levels, averaging close to 0.5 mb/d less than the same month in 2011. French and Italian runs in particular were weak compared to year‐earlier levels. US50 runs on the other hand, averaging some 140 kb/d more than a year earlier, continued to benefit from better margins and supportive product exports. South Korean throughputs remained near record levels.
3435363738394041
Jan Mar May Jul Sep Nov Jan
mb/dOECD Total
Crude Throughput
Range 06-10 Average 06-102010 20112012 est.
-3.0
-2.0
-1.0
0.0
1.0
2.0
1Q09 3Q09 1Q10 3Q10 1Q11 3Q11 1Q12
mb/d OECD Demand vs. Crude RunsAnnual Change
Crude Runs Oil Product Demand
Preliminary data for February show total OECD runs slightly lower than January, at 36.6 mb/d, but 350 kb/d higher than previously expected. A counter‐seasonal increase in US crude intake offset lower runs in the Pacific. North American crude runs indeed posted a 0.9 mb/d annual increase in February, on

REFINING INTERNATIONAL ENERGY AGENCY ‐ OIL MARKET REPORT
48 14 MARCH 2012
a light seasonal maintenance schedule and relatively healthy refining margins in January, while both European and Pacific throughputs remained at the bottom of their historical range.
Refinery Crude Throughput and Utilisation in OECD Countries(million barrels per day)
Change from Utilisation rate1
Aug 11 Sep 11 Oct 11 Nov 11 Dec 11 Jan 12 Dec 11 Jan 11 Jan 12 Jan 11
US2 15.59 15.27 14.54 14.96 14.84 14.59 -0.25 0.14 84.8% 82.5%US Virgin Islands 0.30 0.30 0.27 0.27 0.27 0.30 0.03 0.04 86.3% 75.1%Canada 1.68 1.74 1.62 1.63 1.68 1.62 -0.06 -0.17 88.4% 97.9%Mexico 1.24 1.10 1.15 1.18 1.16 1.21 0.06 0.09 73.6% 72.7%
OECD North America 18.81 18.41 17.59 18.04 17.95 17.73 -0.23 0.11 85.7% 84.4%
France 1.37 1.33 1.32 1.38 1.41 1.17 -0.23 -0.25 75.0% 81.3%Germany 2.02 1.91 2.03 1.96 1.95 1.95 0.00 -0.03 91.4% 82.9%Italy 1.66 1.57 1.55 1.52 1.55 1.57 0.03 -0.20 72.0% 77.9%Netherlands 1.04 1.04 0.97 0.97 1.03 1.08 0.06 0.06 84.1% 79.1%Spain 1.07 1.09 1.00 1.10 1.09 1.09 0.00 0.01 71.7% 76.3%United Kingdom 1.51 1.47 1.39 1.45 1.46 1.48 0.02 0.00 81.7% 81.6%Other OECD Europe 3.94 3.76 3.64 3.75 3.83 3.77 -0.07 -0.04 76.4% 77.4%
OECD Europe 12.61 12.18 11.90 12.13 12.30 12.11 -0.19 -0.45 78.5% 79.3%
Japan 3.37 3.14 2.98 3.20 3.37 3.57 0.20 -0.16 77.7% 79.1%South Korea 2.43 2.50 2.63 2.64 2.62 2.65 0.03 0.11 96.8% 93.0%Other OECD Pacif ic 0.74 0.73 0.63 0.72 0.77 0.74 -0.03 0.02 78.9% 76.3%
OECD Pacific 6.54 6.37 6.24 6.56 6.76 6.96 0.20 -0.03 84.1% 83.3%OECD Total 37.96 36.95 35.73 36.73 37.01 36.79 -0.22 -0.38 82.2% 81.7%1 Expressed as a percentage, based on crude throughput and current operable refining capacity
2 US50
North American crude runs fell by 225 kb/d in January, as seasonal maintenance got underway. Scheduled turnarounds were lighter than normal in the US, leaving regional runs 105 kb/d above year‐earlier levels. US50 runs, which are estimated to have outperformed year‐earlier levels by 140 kb/d based on preliminary data, posted gains on the West Coast and in the Midwest, while Gulf and East Coast operations were lower year‐on‐year. Note: from this month’s report we have included the US Virgin Islands in the North American regional breakdown, rather than in Latin America. Hovensa shut its 350 kb/d Caribbean refinery in mid‐February after accumulating losses of $1.3 billion in past three years. The plant supplied the US East Coast in particular, but recently also expanded sales to other markets.
16.517.017.518.018.519.019.5
Jan Mar May Jul Sep Nov Jan
mb/d OECD North AmericaCrude Throughput
Range 06-10 Average 06-102010 2011 est.2011 2012 est.
0.0
0.5
1.0
1.5
2.0
2.5
3.0
Jan Mar May Jul Sep Nov Jan
mb/d OECD North AmericaRefinery Shutdowns
Range 07-11 20102011 reported 2012 Forecast

INTERNATIONAL ENERGY AGENCY ‐ OIL MARKET REPORT REFINING
14 MARCH 2012 49
US Gulf Coast margins improved sharply over January, on higher gasoline cracks following the news of reduced capacity on the East Coast and in the US Virgin Islands. Hovensa announced in early January it would halt operations at its Caribbean plant by mid‐February, further tightening Atlantic Basin product markets. On the East Coast, Sunoco idled its 178 kb/d Marcus Hook refinery in December 2011 following the shutdown of ConocoPhillips’ 185 kb/d Trainer refinery in September 2011. With high throughputs in February, however, margins plummeted on the Gulf Coast again and reached negative territory for all benchmarks surveyed in early March, except for Maya coking. West Coast margins were supported by a 17 February fire at BP’s 220 kb/d Cherry Point refinery, which damaged the plant’s only crude unit and forced the refinery’s shutdown. While the duration of the outage is still not clear, some sources estimated it could be several months before full operations are restored.
US Weekly Refinery Throughput
13.514.014.515.015.516.016.5
Jan Apr Jul Oct
mb/d
Range 2007-2011 5-yr Average2011 2012
Source: EIA
-12-8-4048
1216
Jan 11 Apr 11 Jul 11 Oct 11 Jan 12
$/bbl USGC Margins
Maya Coking LLS CrackingMars Coking Mars CrackingBrent Cracking
US50 crude runs rose counter‐seasonally in February, to an estimated 14.8 mb/d based on adjusted weekly data from the EIA. Higher margins in January and a lighter‐than‐normal maintenance schedule underpinned higher February throughputs. As a result, it is estimated that North American refiners processed almost 0.9 mb/d more crude than a year earlier. Year‐on‐year gains were mostly accounted for by Gulf Coast refiners who added 685 kb/d. Midwest and West Coast refiners were also posting gains, of 160 kb/d and 75 kb/d, respectively, with only the East Coast contracting annually due to the shutdowns mentioned above. Month‐on‐month, US Gulf Coast throughputs rose 235 kb/d in February, to 7.4 mb/d on average. The start‐up of Motiva’s expanded Port Arthur refinery in coming months could further lift runs. The Motiva Port Arthur refinery, which is a 50‐50 joint venture between Saudi Aramco and Shell, is near completion of a $7 billion expansion that will make the plant the largest refinery in the US. Operable capacity will increase from 285 kb/d currently to 600 kb/d, and coking capacity will nearly double to 95 kb/d allowing the plant to process heavier crudes. A new hydrocracker will further increase the plant’s distillate yields while increased reforming capacity will boost high‐octane gasoline component output. We expect the plant to come on stream in 2Q12, but the exact timing of ramp‐up has still not been announced.
US PADD 3 Refinery Throughputs
6.0
6.5
7.0
7.5
8.0
8.5
Jan Apr Jul Oct
mb/d
Range 2007-2011 5-yr Average2011 2012
Source: EIA
US PADD 2 Refinery Throughputs
2.7
2.9
3.1
3.3
3.5
3.7
Jan Apr Jul Oct
mb/d
Range 2007-2011 5-yr Average2011 2012
Source: EIA
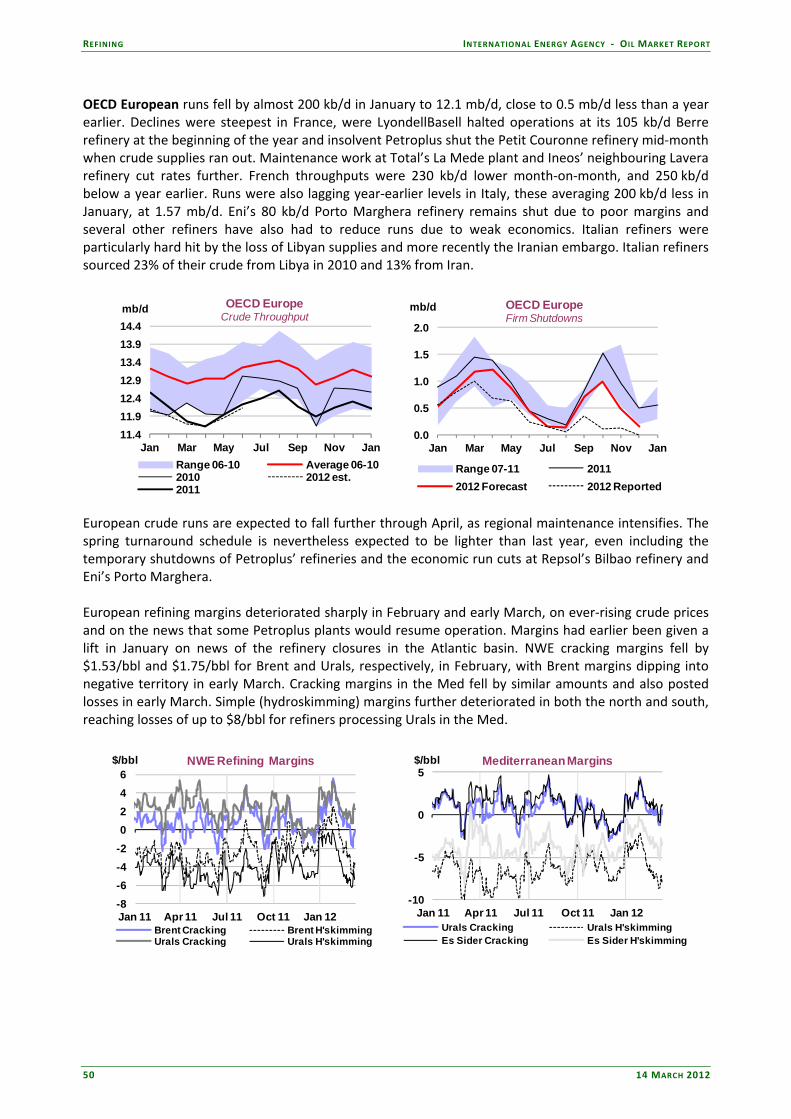
REFINING INTERNATIONAL ENERGY AGENCY ‐ OIL MARKET REPORT
50 14 MARCH 2012
OECD European runs fell by almost 200 kb/d in January to 12.1 mb/d, close to 0.5 mb/d less than a year earlier. Declines were steepest in France, were LyondellBasell halted operations at its 105 kb/d Berre refinery at the beginning of the year and insolvent Petroplus shut the Petit Couronne refinery mid‐month when crude supplies ran out. Maintenance work at Total’s La Mede plant and Ineos’ neighbouring Lavera refinery cut rates further. French throughputs were 230 kb/d lower month‐on‐month, and 250 kb/d below a year earlier. Runs were also lagging year‐earlier levels in Italy, these averaging 200 kb/d less in January, at 1.57 mb/d. Eni’s 80 kb/d Porto Marghera refinery remains shut due to poor margins and several other refiners have also had to reduce runs due to weak economics. Italian refiners were particularly hard hit by the loss of Libyan supplies and more recently the Iranian embargo. Italian refiners sourced 23% of their crude from Libya in 2010 and 13% from Iran.
11.411.912.412.913.413.914.4
Jan Mar May Jul Sep Nov Jan
mb/d OECD Europe Crude Throughput
Range 06-10 Average 06-102010 2012 est.2011
0.0
0.5
1.0
1.5
2.0
Jan Mar May Jul Sep Nov Jan
mb/d OECD EuropeFirm Shutdowns
Range 07-11 20112012 Forecast 2012 Reported
European crude runs are expected to fall further through April, as regional maintenance intensifies. The spring turnaround schedule is nevertheless expected to be lighter than last year, even including the temporary shutdowns of Petroplus’ refineries and the economic run cuts at Repsol’s Bilbao refinery and Eni’s Porto Marghera. European refining margins deteriorated sharply in February and early March, on ever‐rising crude prices and on the news that some Petroplus plants would resume operation. Margins had earlier been given a lift in January on news of the refinery closures in the Atlantic basin. NWE cracking margins fell by $1.53/bbl and $1.75/bbl for Brent and Urals, respectively, in February, with Brent margins dipping into negative territory in early March. Cracking margins in the Med fell by similar amounts and also posted losses in early March. Simple (hydroskimming) margins further deteriorated in both the north and south, reaching losses of up to $8/bbl for refiners processing Urals in the Med.
-8-6-4-20246
Jan 11 Apr 11 Jul 11 Oct 11 Jan 12
$/bbl NWE Refining Margins
Brent Cracking Brent H'skimmingUrals Cracking Urals H'skimming
-10
-5
0
5
Jan 11 Apr 11 Jul 11 Oct 11 Jan 12
$/bbl Mediterranean Margins
Urals Cracking Urals H'skimmingEs Sider Cracking Es Sider H'skimming
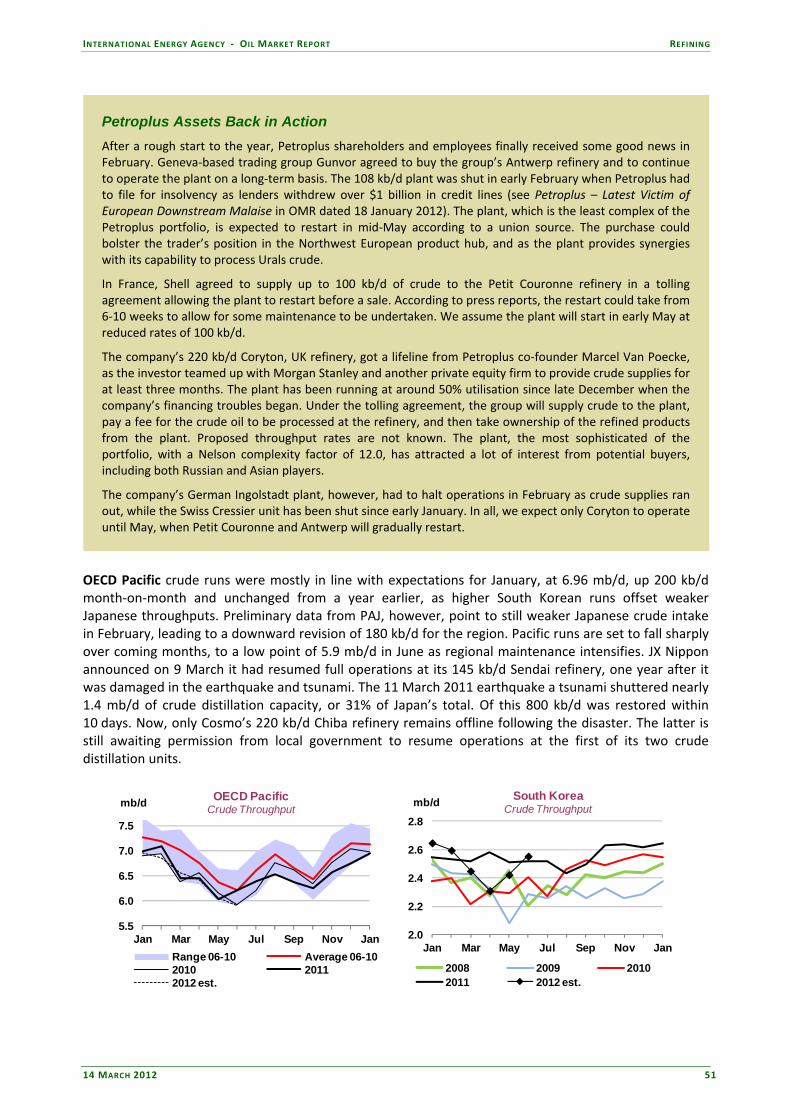
INTERNATIONAL ENERGY AGENCY ‐ OIL MARKET REPORT REFINING
14 MARCH 2012 51
Petroplus Assets Back in Action After a rough start to the year, Petroplus shareholders and employees finally received some good news in February. Geneva‐based trading group Gunvor agreed to buy the group’s Antwerp refinery and to continue to operate the plant on a long‐term basis. The 108 kb/d plant was shut in early February when Petroplus had to file for insolvency as lenders withdrew over $1 billion in credit lines (see Petroplus – Latest Victim of European Downstream Malaise in OMR dated 18 January 2012). The plant, which is the least complex of the Petroplus portfolio, is expected to restart in mid‐May according to a union source. The purchase could bolster the trader’s position in the Northwest European product hub, and as the plant provides synergies with its capability to process Urals crude.
In France, Shell agreed to supply up to 100 kb/d of crude to the Petit Couronne refinery in a tolling agreement allowing the plant to restart before a sale. According to press reports, the restart could take from 6‐10 weeks to allow for some maintenance to be undertaken. We assume the plant will start in early May at reduced rates of 100 kb/d.
The company’s 220 kb/d Coryton, UK refinery, got a lifeline from Petroplus co‐founder Marcel Van Poecke, as the investor teamed up with Morgan Stanley and another private equity firm to provide crude supplies for at least three months. The plant has been running at around 50% utilisation since late December when the company’s financing troubles began. Under the tolling agreement, the group will supply crude to the plant, pay a fee for the crude oil to be processed at the refinery, and then take ownership of the refined products from the plant. Proposed throughput rates are not known. The plant, the most sophisticated of the portfolio, with a Nelson complexity factor of 12.0, has attracted a lot of interest from potential buyers, including both Russian and Asian players.
The company’s German Ingolstadt plant, however, had to halt operations in February as crude supplies ran out, while the Swiss Cressier unit has been shut since early January. In all, we expect only Coryton to operate until May, when Petit Couronne and Antwerp will gradually restart.
OECD Pacific crude runs were mostly in line with expectations for January, at 6.96 mb/d, up 200 kb/d month‐on‐month and unchanged from a year earlier, as higher South Korean runs offset weaker Japanese throughputs. Preliminary data from PAJ, however, point to still weaker Japanese crude intake in February, leading to a downward revision of 180 kb/d for the region. Pacific runs are set to fall sharply over coming months, to a low point of 5.9 mb/d in June as regional maintenance intensifies. JX Nippon announced on 9 March it had resumed full operations at its 145 kb/d Sendai refinery, one year after it was damaged in the earthquake and tsunami. The 11 March 2011 earthquake a tsunami shuttered nearly 1.4 mb/d of crude distillation capacity, or 31% of Japan’s total. Of this 800 kb/d was restored within 10 days. Now, only Cosmo’s 220 kb/d Chiba refinery remains offline following the disaster. The latter is still awaiting permission from local government to resume operations at the first of its two crude distillation units.
5.5
6.0
6.5
7.0
7.5
Jan Mar May Jul Sep Nov Jan
mb/d OECD Pacific Crude Throughput
Range 06-10 Average 06-102010 20112012 est.
2.0
2.2
2.4
2.6
2.8
Jan Mar May Jul Sep Nov Jan
mb/d South KoreaCrude Throughput
2008 2009 20102011 2012 est.

REFINING INTERNATIONAL ENERGY AGENCY ‐ OIL MARKET REPORT
52 14 MARCH 2012
Non-OECD Refinery Throughput Non‐OECD refinery crude runs were revised lower for December and January, based on the most recent available data. 4Q11 non‐OECD runs have been lowered by 320 kb/d to 38.1 mb/d, while 1Q12 estimates have been reduced by 155 kb/d, to 38.6 mb/d. Revisions for December came from a number of countries, including South Africa, Egypt, Algeria, Venezuela, Syria and Saudi Arabia. As a result, annual growth in non‐OECD throughputs slowed to only 90 kb/d in 4Q11, from an average of 1.4 mb/d over the previous eight quarters. Annual growth is expected to pick up in 2012, to 290 kb/d in 1Q12 and rising to 580 kb/d in 2Q12, on stronger growth in China, Other Asia and the FSU.
3334353637383940
Jan Mar May Jul Sep Nov Jan
mb/dNon-OECD Total Crude Throughput
Range 06-10 Average 06-102010 2011 est.2012 est.
5.56.06.57.07.58.08.59.09.5
10.0
Jan Mar May Jul Sep Nov Jan
mb/dChina
Crude Throughput
2008 20092010 20112012 est. 2012
Chinese refinery runs reached another record high in January as refiners ramped up runs to secure adequate product supplies ahead of the Chinese New Year holiday. Throughputs averaged 9.34 mb/d, almost 0.6 mb/d higher than a year earlier, but 50 kb/d less than our previous forecast. As expected, refiners trimmed runs slightly in February, to 9.26 mb/d, with the onset of seasonal maintenance and as increasing crude oil prices cut into operating margins. CNPC shut a 160 kb/d crude unit at its Zhenhai refinery from mid‐February for 50 days, WEPEC were planning slightly lower runs due to maintenance at some secondary units, and Anqing Petrochemical shut a 110 kb/d unit for 45 days from 10 February. Runs have also likely fallen further in March as Sinopec’s Maoming refinery also shut a 50 kb/d crude unit and Dalian is planning to shut one crude unit from late March. Chinese refineries are still loosing money due to government price controls on refined product sales. Other Asian refinery throughputs were largely in line with expectations for December, averaging 9.1 mb/d. January runs, however, were 85 kb/d lower than forecast on weaker‐than‐expected activity in India. Indian crude runs fell by 0.6% monthly and 4.6% annually, to 4.2 mb/d, due to lower year‐on‐year runs at Reliance’s 660 kb/d Jamnagar refinery. The plant’s runs nevertheless stood at 709 kb/d, compared to 690 kb/d in December. Reliance shut a 290 kb/d crude unit at the 580 kb/d export plant from mid‐February for three weeks of maintenance. This is the first scheduled turnaround at the plant since it was commissioned in 2008.
7.5
8.0
8.5
9.0
9.5
Jan Mar May Jul Sep Nov Jan
mb/dOther Asia
Crude Throughput
Range 06-10 Average 06-102010 2011 est.2012 est.
3.03.23.43.63.84.04.24.4
Jan Mar May Jul Sep Nov Jan
mb/d IndiaCrude Throughput
2008 2009 20102011 2012 est.

INTERNATIONAL ENERGY AGENCY ‐ OIL MARKET REPORT REFINING
14 MARCH 2012 53
The start‐up of the new Nagarjuna refinery, which was to be commissioned on 1 March, has been delayed by most likely three months due to damage caused by January’s cyclone Thane. New capacity is still expected to be brought on line in March by MRPL, which is adding a 60 kb/d crude unit to its Mangalore refinery. The company is also adding a 60 kb/d vacuum distillation unit, a diesel hydrotreater, followed by other secondary units, including an FCC, later in the year. Both Indian and Chinese crude oil imports reached all time highs in January. China imported 5.53 mb/d of crude in January, up 7.4% year‐on‐year, while India imported 4 mb/d, an 18.7% annual increase according to official data. Taiwan’s crude intake fell to only 706 kb/d in December, the lowest since April 2011, but in line with forecast. Refinery production at Formosa’s 540 kb/d Mailiao refinery has yet to recover from a series of fires and outages that hit the plant in 2010/2011. The company is undertaking major safety checks, reducing output to differing degrees until at least May. Russian refinery crude intake rose 145 kb/d in January to 5.31 mb/d on average, corresponding to 4.4% annual growth. The monthly increase stemmed mostly from the return to service of TNK‐BP’s Saratov refinery, which halted operations due to maintenance in December. Preliminary data show Russian refinery runs rose further in February, to 5.37 mb/d, up 5.3% annually, and some 140 kb/d above expectations. From March onwards, Russian throughputs are expected to fall sharply as refineries carry out seasonal maintenance. From practically no work in January and February, offline capacity in March is estimated at 335 kb/d, rising to almost 500 kb/d in April. Lukoil’s Nizhny Novogrod, TNK‐BP’s Ryazan, Alliance’s Khaborovsk, Slavneft’s Yaroslav and Rosneft’s Syrzan and Novokyibyshev plants, are among the refineries expected to reduce runs over the March‐April period due to maintenance work.
4.24.44.64.85.05.25.45.6
Jan Mar May Jul Sep Nov Jan
mb/d RussiaCrude Throughput
2008 2009 20102011 2012 est.
5.45.65.86.06.26.46.66.87.0
Jan Mar May Jul Sep Nov Jan
mb/dFSU
Crude Throughput
Range 06-10 Average 06-102010 2011 est.2012 est.
Russian Refinery Runs Boosted by Higher Prices While European competitors are balking at high crude prices and poor refining margins, Russian downstream operators are currently seeing their profits surge. Record‐high crude prices not only mean higher taxes and export duties for the government and increased upstream revenue for operators. Also, the higher the outright crude price, the bigger the incentive for Russian oil companies to refine crude domestically and export products. While higher product exports have not yet materialised, Russian refiners are running at near‐record utilisation rates to feed domestic markets and potentially build product inventories. Higher refinery margins in turn support increased investment in the downstream and higher oil product exports in coming years, one of government’s main motivations for the “60‐66”export duty reform.
Previously, Russian export duties rates were set with a substantial absolute difference between crude and product duties, with the greatest difference between fuel oil and crude, aimed at allowing Russian oil refiners to retain a greater share of their revenue as a means to finance modernisation. In practice, however, the tax rules resulted in higher exports of fuel oil to European refiners and little incentive to invest in upgrading capacity.

REFINING INTERNATIONAL ENERGY AGENCY ‐ OIL MARKET REPORT
54 14 MARCH 2012
Russian Refinery Runs Boosted by Higher Prices (continued)
The 60‐66 tax reform that was introduced on 1 October 2011, lowered the marginal tax rate on the export duty for crude oil from 65% to 60% in an attempt to stimulate upstream investments (See Supply and Refining sections in September 2011 OMR). At the same time, product export duties were aligned at 66% of the export duty for crude, with the exception of naphtha and gasoline duties, which were set at 90% to prevent domestic shortages. This meant that while the duty on gasoil and jet fuel was reduced from 67% of the rate of crude to 66%, the fuel oil duty was increased from 46.7% to 66%. The difference between crude and product duties were designed to cover the difference between transportation costs for crude oil and oil products.
The main objectives of the tax changes were to reduce the incentive for exporting fuel oil relative to lighter products, and incentivising Russian refiners to upgrade more fuel oil at domestic plants. The reduction of the difference in the duty between crude oil and oil products, in theory reduces the overall incentive for refiners. Current higher flat prices of Urals, however, offset the increase in product export duties.
When Prime Minister Vladimir Putin signed the decree introducing the new export duty scheme on 26 August 2011, the price of Urals was $110/bbl. At this price the crude oil export duty was calculated at:
[$110/bbl ‐25] * 0.6 + $4/bbl = $55/bbl
With recent Urals prices approaching $125/bbl, the export duty increases to:
[$125/bbl ‐25] * 0.6 + $4/bbl = $64/bbl
Product duties have increased by less, however, from $38.90/bbl to $45.30/bbl (weighted average, based on current average refinery configurations). Therefore, a $15/bbl increase in the price of crude, has translated into a $9/bbl increase in crude oil export duty, but only a $6.40/bbl increase in product export duties. As a result, the increased refining margin (or refining “tax‐incentive”) increases by $2.60/bbl to $18.70/bbl – by far outweighing any transportation cost differences.
0
20
40
60
80
100
30 50 70 90 110 130 150
Duty $/bbl
Average Urals Price $/bbl
Russian Export Duties
Crude Oil Oil ProductsRefining Tax Incentive*
0
5
10
15
20
25
30
30 50 70 90 110 130 150
$/bbl
Average Urals Price $/bbl
Russian Refining Tax Incentive
*Oil products export duty and refining tax incentive calculated based on current refining configuration (20% naphtha/gasoline yield, 80% other products). Of course, refineries will higher or lower complexity, will pay different product duties and enjoy varying tax incentives. Also, companies with higher fuel oil yield, incur lower margins than before the introduction of 60‐66, though again offset by higher flat prices.
Elsewhere in the FSU, TNK‐BP announced it would suspend supplies of crude to the 320 kb/d Lysychansk refinery in Ukraine from March, because of continuous operating losses. The duration of the shutdown is not known, but we assume it will be shut for at least a month. Despite nameplate capacity of some 800 kb/d, annual data show Ukraine’s refineries were running at very low utilisation rates of around 25% in 2009 (latest available data). Kazakhstani crude runs fell by 27 kb/d in January, to 295 kb/d, down 8.5% from the previous month but 5.8% higher than January 2011. In Lithuania, PKN Orlen’s Mazeikiu Nafta refinery will shut in March for maintenance. Middle Eastern crude runs have been revised lower for 4Q11 following a rare revision to Saudi Arabia’s JODI data. October crude runs were 175 kb/d lower than first published, at 1.8 mb/d. Iraqi crude runs are

INTERNATIONAL ENERGY AGENCY ‐ OIL MARKET REPORT REFINING
14 MARCH 2012 55
assessed at 592 kb/d in January, down from 600 kb/d in December. In Yemen, the Aden refinery remains shut, more than two months after a pipeline explosion halted crude deliveries to the plant. The country is seeking diesel imports to meet domestic demand. Oman is expected to undertake maintenance lasting 45 days at its 85 kb/d Mina al Hahal refinery starting March. While no data is available for Syria’s downstream operations, we assume Homs refinery is running at reduced rates due to pipeline sabotage and reduced domestic production. Current Syrian oil production is estimated at 190 kb/d in 1Q12, all of which is assumed to feed the country’s two domestic refineries with a combined capacity of 240 kb/d.
5.5
5.7
5.9
6.1
6.3
6.5
Jan Mar May Jul Sep Nov Jan
mb/dMiddle East
Crude Throughput
Range 06-10 Average 06-102010 2011 est.2012 est.
1.92.02.12.22.32.42.52.6
Jan Mar May Jul Sep Nov Jan
mb/d AfricaCrude Throughput
Range 06-10 Average 06-102010 2011 est.2012 est.
In Africa, the restart of Libya’s Ras Lanuf plant has again been delayed, due to problems restoring Sarir and Mesla production. We now only expect the plant to resume operations by late‐April. Chad’s refinery output resumed in February, after the government and its Chinese partner, CNPC, reached an agreement over fuel pricing. While there is no monthly data tracking Sudanese crude runs, we assume that runs at the 100 kb/d Khartoum refinery have been reduced due to the shutting in of oil production. In Latin America, Argentinean runs rebounded in December to 530 kb/d, from only 480 kb/d over the two previous months. January Brazilian runs were unchanged from December, at 1.87 mb/d. Regional runs were nevertheless revised down by 185 kb/d in December based on lower Venezuelan throughputs. A fire at the country’s 310 kb/d Cardon refinery in early February could keep runs at reduced levels. We have also lowered our outlook for Aruba after Valero announced it had cut run rates by 50% due to weak margins. As discussed in the North America section, we have moved the US Virgin Islands plant out of the Latin American region and into OECD North America. That said, Hovensa completed the shutdown of its 350 kb/d refinery in mid‐February.
4.64.85.05.25.45.65.8
Jan Mar May Jul Sep Nov Jan
mb/d Latin AmericaCrude Throughput
Range 06-10 Average 06-102010 2011 est.2012 est.
4.24.44.64.85.05.25.4
Jan Mar May Jul Sep Nov Jan
mb/dLatin America excl. US Virgin Islands
Crude Throughput
Range 06-10 Average 06-102010 2011 est.2012 est.
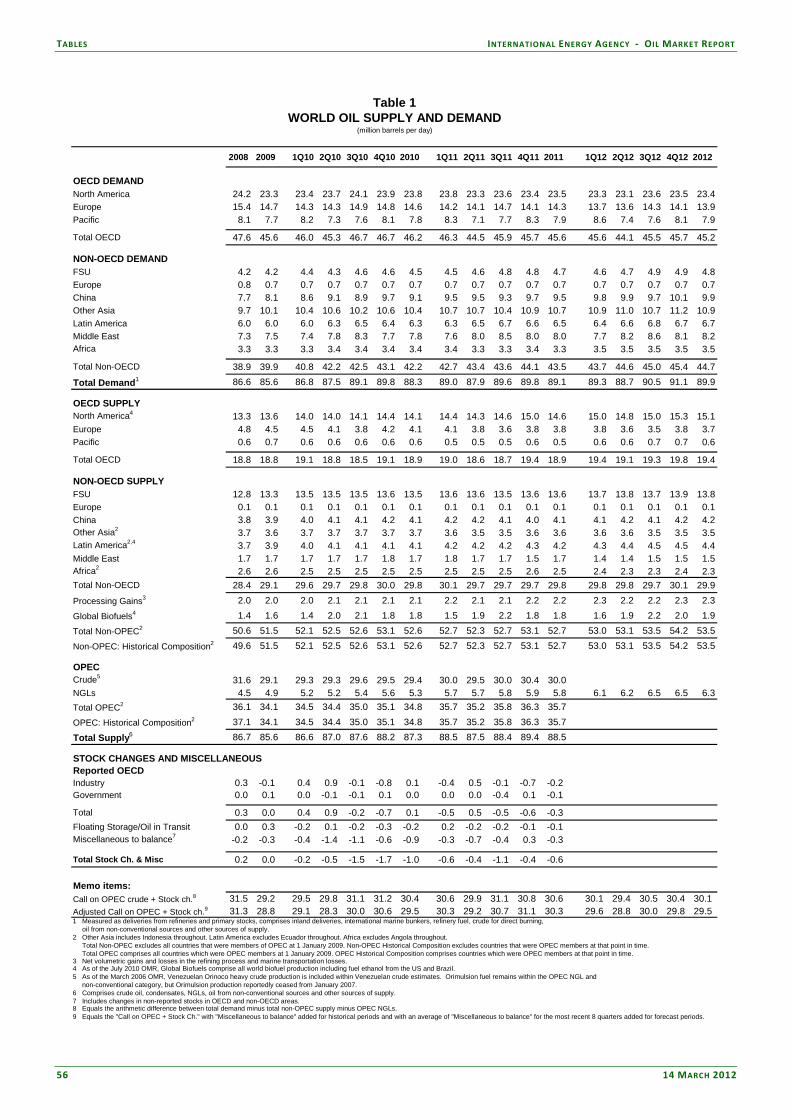
TABLES INTERNATIONAL ENERGY AGENCY ‐ OIL MARKET REPORT
56 14 MARCH 2012
TABLES
Table 1 - World Oil Supply and Demand
Table 1WORLD OIL SUPPLY AND DEMAND
(million barrels per day)
2008 2009 1Q10 2Q10 3Q10 4Q10 2010 1Q11 2Q11 3Q11 4Q11 2011 1Q12 2Q12 3Q12 4Q12 2012
OECD DEMANDNorth America 24.2 23.3 23.4 23.7 24.1 23.9 23.8 23.8 23.3 23.6 23.4 23.5 23.3 23.1 23.6 23.5 23.4Europe 15.4 14.7 14.3 14.3 14.9 14.8 14.6 14.2 14.1 14.7 14.1 14.3 13.7 13.6 14.3 14.1 13.9Pacific 8.1 7.7 8.2 7.3 7.6 8.1 7.8 8.3 7.1 7.7 8.3 7.9 8.6 7.4 7.6 8.1 7.9
Total OECD 47.6 45.6 46.0 45.3 46.7 46.7 46.2 46.3 44.5 45.9 45.7 45.6 45.6 44.1 45.5 45.7 45.2
NON-OECD DEMANDFSU 4.2 4.2 4.4 4.3 4.6 4.6 4.5 4.5 4.6 4.8 4.8 4.7 4.6 4.7 4.9 4.9 4.8Europe 0.8 0.7 0.7 0.7 0.7 0.7 0.7 0.7 0.7 0.7 0.7 0.7 0.7 0.7 0.7 0.7 0.7China 7.7 8.1 8.6 9.1 8.9 9.7 9.1 9.5 9.5 9.3 9.7 9.5 9.8 9.9 9.7 10.1 9.9Other Asia 9.7 10.1 10.4 10.6 10.2 10.6 10.4 10.7 10.7 10.4 10.9 10.7 10.9 11.0 10.7 11.2 10.9Latin America 6.0 6.0 6.0 6.3 6.5 6.4 6.3 6.3 6.5 6.7 6.6 6.5 6.4 6.6 6.8 6.7 6.7Middle East 7.3 7.5 7.4 7.8 8.3 7.7 7.8 7.6 8.0 8.5 8.0 8.0 7.7 8.2 8.6 8.1 8.2Africa 3.3 3.3 3.3 3.4 3.4 3.4 3.4 3.4 3.3 3.3 3.4 3.3 3.5 3.5 3.5 3.5 3.5
Total Non-OECD 38.9 39.9 40.8 42.2 42.5 43.1 42.2 42.7 43.4 43.6 44.1 43.5 43.7 44.6 45.0 45.4 44.7
Total Demand1 86.6 85.6 86.8 87.5 89.1 89.8 88.3 89.0 87.9 89.6 89.8 89.1 89.3 88.7 90.5 91.1 89.9
OECD SUPPLYNorth America4 13.3 13.6 14.0 14.0 14.1 14.4 14.1 14.4 14.3 14.6 15.0 14.6 15.0 14.8 15.0 15.3 15.1Europe 4.8 4.5 4.5 4.1 3.8 4.2 4.1 4.1 3.8 3.6 3.8 3.8 3.8 3.6 3.5 3.8 3.7Pacific 0.6 0.7 0.6 0.6 0.6 0.6 0.6 0.5 0.5 0.5 0.6 0.5 0.6 0.6 0.7 0.7 0.6
Total OECD 18.8 18.8 19.1 18.8 18.5 19.1 18.9 19.0 18.6 18.7 19.4 18.9 19.4 19.1 19.3 19.8 19.4
NON-OECD SUPPLYFSU 12.8 13.3 13.5 13.5 13.5 13.6 13.5 13.6 13.6 13.5 13.6 13.6 13.7 13.8 13.7 13.9 13.8Europe 0.1 0.1 0.1 0.1 0.1 0.1 0.1 0.1 0.1 0.1 0.1 0.1 0.1 0.1 0.1 0.1 0.1China 3.8 3.9 4.0 4.1 4.1 4.2 4.1 4.2 4.2 4.1 4.0 4.1 4.1 4.2 4.1 4.2 4.2Other Asia2 3.7 3.6 3.7 3.7 3.7 3.7 3.7 3.6 3.5 3.5 3.6 3.6 3.6 3.6 3.5 3.5 3.5Latin America2,4 3.7 3.9 4.0 4.1 4.1 4.1 4.1 4.2 4.2 4.2 4.3 4.2 4.3 4.4 4.5 4.5 4.4Middle East 1.7 1.7 1.7 1.7 1.7 1.8 1.7 1.8 1.7 1.7 1.5 1.7 1.4 1.4 1.5 1.5 1.5Africa2 2.6 2.6 2.5 2.5 2.5 2.5 2.5 2.5 2.5 2.5 2.6 2.5 2.4 2.3 2.3 2.4 2.3Total Non-OECD 28.4 29.1 29.6 29.7 29.8 30.0 29.8 30.1 29.7 29.7 29.7 29.8 29.8 29.8 29.7 30.1 29.9
Processing Gains3 2.0 2.0 2.0 2.1 2.1 2.1 2.1 2.2 2.1 2.1 2.2 2.2 2.3 2.2 2.2 2.3 2.3
Global Biofuels4 1.4 1.6 1.4 2.0 2.1 1.8 1.8 1.5 1.9 2.2 1.8 1.8 1.6 1.9 2.2 2.0 1.9
Total Non-OPEC2 50.6 51.5 52.1 52.5 52.6 53.1 52.6 52.7 52.3 52.7 53.1 52.7 53.0 53.1 53.5 54.2 53.5
Non-OPEC: Historical Composition2 49.6 51.5 52.1 52.5 52.6 53.1 52.6 52.7 52.3 52.7 53.1 52.7 53.0 53.1 53.5 54.2 53.5
OPECCrude5 31.6 29.1 29.3 29.3 29.6 29.5 29.4 30.0 29.5 30.0 30.4 30.0NGLs 4.5 4.9 5.2 5.2 5.4 5.6 5.3 5.7 5.7 5.8 5.9 5.8 6.1 6.2 6.5 6.5 6.3Total OPEC2 36.1 34.1 34.5 34.4 35.0 35.1 34.8 35.7 35.2 35.8 36.3 35.7
OPEC: Historical Composition2 37.1 34.1 34.5 34.4 35.0 35.1 34.8 35.7 35.2 35.8 36.3 35.7
Total Supply6 86.7 85.6 86.6 87.0 87.6 88.2 87.3 88.5 87.5 88.4 89.4 88.5
STOCK CHANGES AND MISCELLANEOUSReported OECDIndustry 0.3 -0.1 0.4 0.9 -0.1 -0.8 0.1 -0.4 0.5 -0.1 -0.7 -0.2Government 0.0 0.1 0.0 -0.1 -0.1 0.1 0.0 0.0 0.0 -0.4 0.1 -0.1
Total 0.3 0.0 0.4 0.9 -0.2 -0.7 0.1 -0.5 0.5 -0.5 -0.6 -0.3Floating Storage/Oil in Transit 0.0 0.3 -0.2 0.1 -0.2 -0.3 -0.2 0.2 -0.2 -0.2 -0.1 -0.1Miscellaneous to balance7 -0.2 -0.3 -0.4 -1.4 -1.1 -0.6 -0.9 -0.3 -0.7 -0.4 0.3 -0.3
Total Stock Ch. & Misc 0.2 0.0 -0.2 -0.5 -1.5 -1.7 -1.0 -0.6 -0.4 -1.1 -0.4 -0.6
Memo items:Call on OPEC crude + Stock ch.8 31.5 29.2 29.5 29.8 31.1 31.2 30.4 30.6 29.9 31.1 30.8 30.6 30.1 29.4 30.5 30.4 30.1Adjusted Call on OPEC + Stock ch.9 31.3 28.8 29.1 28.3 30.0 30.6 29.5 30.3 29.2 30.7 31.1 30.3 29.6 28.8 30.0 29.8 29.51 Measured as deliveries from refineries and primary stocks, comprises inland deliveries, international marine bunkers, refinery fuel, crude for direct burning, oil from non-conventional sources and other sources of supply.2 Other Asia includes Indonesia throughout. Latin America excludes Ecuador throughout. Africa excludes Angola throughout. Total Non-OPEC excludes all countries that were members of OPEC at 1 January 2009. Non-OPEC Historical Composition excludes countries that were OPEC members at that point in time. Total OPEC comprises all countries which were OPEC members at 1 January 2009. OPEC Historical Composition comprises countries which were OPEC members at that point in time. 3 Net volumetric gains and losses in the refining process and marine transportation losses.4 As of the July 2010 OMR, Global Biofuels comprise all world biofuel production including fuel ethanol from the US and Brazil.5 As of the March 2006 OMR, Venezuelan Orinoco heavy crude production is included within Venezuelan crude estimates. Orimulsion fuel remains within the OPEC NGL and non-conventional category, but Orimulsion production reportedly ceased from January 2007.6 Comprises crude oil, condensates, NGLs, oil from non-conventional sources and other sources of supply.7 Includes changes in non-reported stocks in OECD and non-OECD areas.8 Equals the arithmetic difference between total demand minus total non-OPEC supply minus OPEC NGLs.9 Equals the "Call on OPEC + Stock Ch." with "Miscellaneous to balance" added for historical periods and with an average of "Miscellaneous to balance" for the most recent 8 quarters added for forecast periods.
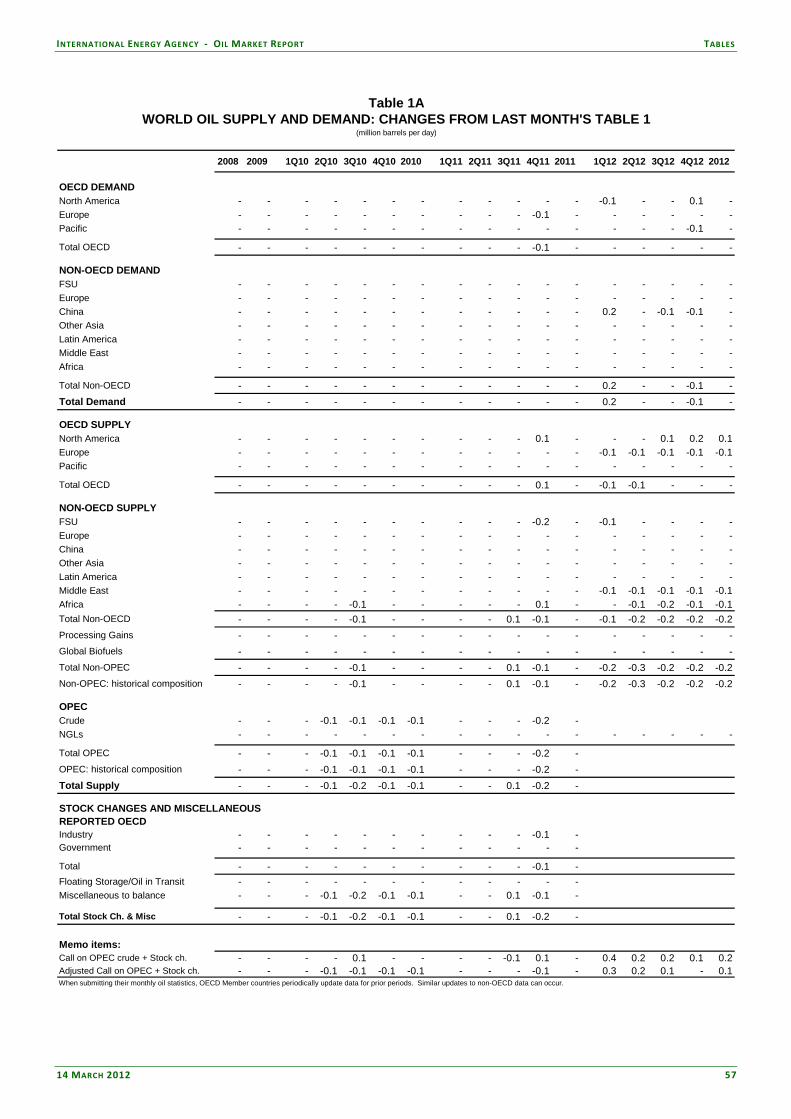
INTERNATIONAL ENERGY AGENCY ‐ OIL MARKET REPORT TABLES
14 MARCH 2012 57
Table 1a - World Oil Supply and Demand: Changes from Last Month’s Table 1 Table 1A
WORLD OIL SUPPLY AND DEMAND: CHANGES FROM LAST MONTH'S TABLE 1(million barrels per day)
2008 2009 1Q10 2Q10 3Q10 4Q10 2010 1Q11 2Q11 3Q11 4Q11 2011 1Q12 2Q12 3Q12 4Q12 2012
OECD DEMANDNorth America - - - - - - - - - - - - -0.1 - - 0.1 -Europe - - - - - - - - - - -0.1 - - - - - -Pacific - - - - - - - - - - - - - - - -0.1 -
Total OECD - - - - - - - - - - -0.1 - - - - - -
NON-OECD DEMANDFSU - - - - - - - - - - - - - - - - -Europe - - - - - - - - - - - - - - - - -China - - - - - - - - - - - - 0.2 - -0.1 -0.1 -Other Asia - - - - - - - - - - - - - - - - -Latin America - - - - - - - - - - - - - - - - -Middle East - - - - - - - - - - - - - - - - -Africa - - - - - - - - - - - - - - - - -
Total Non-OECD - - - - - - - - - - - - 0.2 - - -0.1 -Total Demand - - - - - - - - - - - - 0.2 - - -0.1 -
OECD SUPPLYNorth America - - - - - - - - - - 0.1 - - - 0.1 0.2 0.1Europe - - - - - - - - - - - - -0.1 -0.1 -0.1 -0.1 -0.1Pacific - - - - - - - - - - - - - - - - -
Total OECD - - - - - - - - - - 0.1 - -0.1 -0.1 - - -
NON-OECD SUPPLYFSU - - - - - - - - - - -0.2 - -0.1 - - - -Europe - - - - - - - - - - - - - - - - -China - - - - - - - - - - - - - - - - -Other Asia - - - - - - - - - - - - - - - - -Latin America - - - - - - - - - - - - - - - - -Middle East - - - - - - - - - - - - -0.1 -0.1 -0.1 -0.1 -0.1Africa - - - - -0.1 - - - - - 0.1 - - -0.1 -0.2 -0.1 -0.1Total Non-OECD - - - - -0.1 - - - - 0.1 -0.1 - -0.1 -0.2 -0.2 -0.2 -0.2Processing Gains - - - - - - - - - - - - - - - - -Global Biofuels - - - - - - - - - - - - - - - - -Total Non-OPEC - - - - -0.1 - - - - 0.1 -0.1 - -0.2 -0.3 -0.2 -0.2 -0.2Non-OPEC: historical composition - - - - -0.1 - - - - 0.1 -0.1 - -0.2 -0.3 -0.2 -0.2 -0.2
OPECCrude - - - -0.1 -0.1 -0.1 -0.1 - - - -0.2 -NGLs - - - - - - - - - - - - - - - - -
Total OPEC - - - -0.1 -0.1 -0.1 -0.1 - - - -0.2 -OPEC: historical composition - - - -0.1 -0.1 -0.1 -0.1 - - - -0.2 -Total Supply - - - -0.1 -0.2 -0.1 -0.1 - - 0.1 -0.2 -
STOCK CHANGES AND MISCELLANEOUSREPORTED OECDIndustry - - - - - - - - - - -0.1 -Government - - - - - - - - - - - -
Total - - - - - - - - - - -0.1 -Floating Storage/Oil in Transit - - - - - - - - - - - -Miscellaneous to balance - - - -0.1 -0.2 -0.1 -0.1 - - 0.1 -0.1 -
Total Stock Ch. & Misc - - - -0.1 -0.2 -0.1 -0.1 - - 0.1 -0.2 -
Memo items:Call on OPEC crude + Stock ch. - - - - 0.1 - - - - -0.1 0.1 - 0.4 0.2 0.2 0.1 0.2Adjusted Call on OPEC + Stock ch. - - - -0.1 -0.1 -0.1 -0.1 - - - -0.1 - 0.3 0.2 0.1 - 0.1When submitting their monthly oil statistics, OECD Member countries periodically update data for prior periods. Similar updates to non-OECD data can occur.
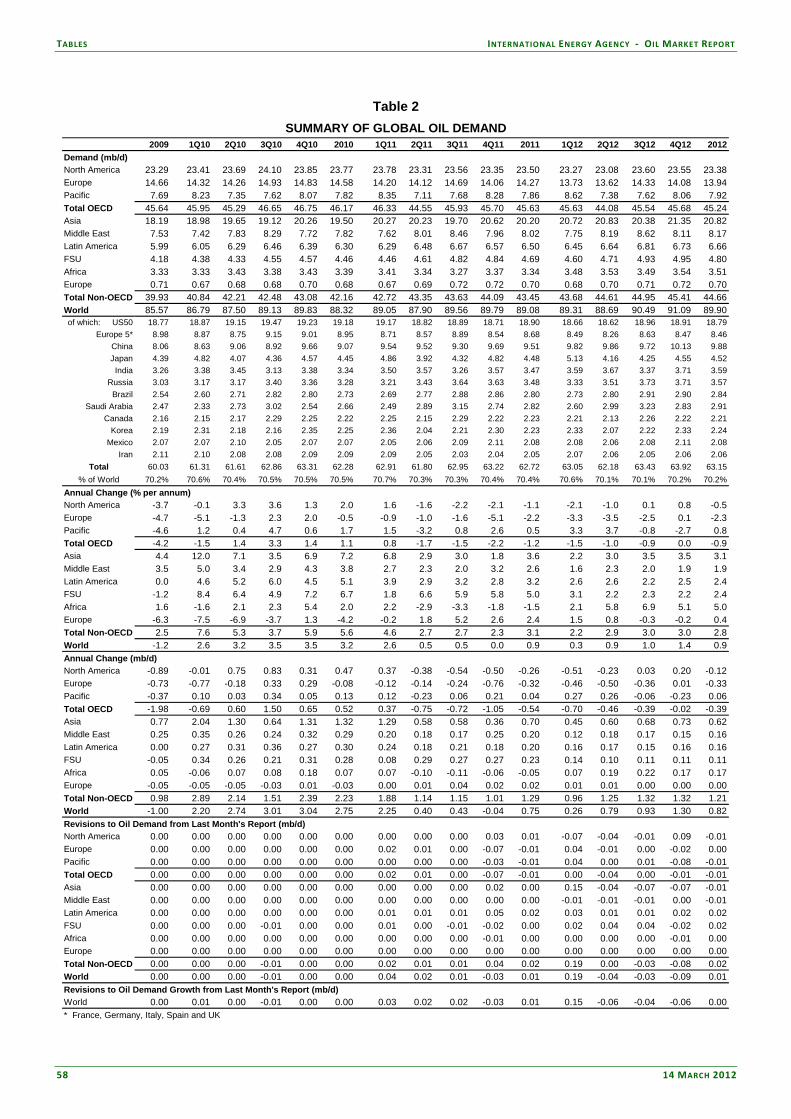
TABLES INTERNATIONAL ENERGY AGENCY ‐ OIL MARKET REPORT
58 14 MARCH 2012
Table 2 - Summary of Global Oil Demand Table 2SUMMARY OF GLOBAL OIL DEMAND
2009 1Q10 2Q10 3Q10 4Q10 2010 1Q11 2Q11 3Q11 4Q11 2011 1Q12 2Q12 3Q12 4Q12 2012Demand (mb/d)North America 23.29 23.41 23.69 24.10 23.85 23.77 23.78 23.31 23.56 23.35 23.50 23.27 23.08 23.60 23.55 23.38Europe 14.66 14.32 14.26 14.93 14.83 14.58 14.20 14.12 14.69 14.06 14.27 13.73 13.62 14.33 14.08 13.94Pacific 7.69 8.23 7.35 7.62 8.07 7.82 8.35 7.11 7.68 8.28 7.86 8.62 7.38 7.62 8.06 7.92Total OECD 45.64 45.95 45.29 46.65 46.75 46.17 46.33 44.55 45.93 45.70 45.63 45.63 44.08 45.54 45.68 45.24Asia 18.19 18.98 19.65 19.12 20.26 19.50 20.27 20.23 19.70 20.62 20.20 20.72 20.83 20.38 21.35 20.82Middle East 7.53 7.42 7.83 8.29 7.72 7.82 7.62 8.01 8.46 7.96 8.02 7.75 8.19 8.62 8.11 8.17Latin America 5.99 6.05 6.29 6.46 6.39 6.30 6.29 6.48 6.67 6.57 6.50 6.45 6.64 6.81 6.73 6.66FSU 4.18 4.38 4.33 4.55 4.57 4.46 4.46 4.61 4.82 4.84 4.69 4.60 4.71 4.93 4.95 4.80Africa 3.33 3.33 3.43 3.38 3.43 3.39 3.41 3.34 3.27 3.37 3.34 3.48 3.53 3.49 3.54 3.51Europe 0.71 0.67 0.68 0.68 0.70 0.68 0.67 0.69 0.72 0.72 0.70 0.68 0.70 0.71 0.72 0.70Total Non-OECD 39.93 40.84 42.21 42.48 43.08 42.16 42.72 43.35 43.63 44.09 43.45 43.68 44.61 44.95 45.41 44.66World 85.57 86.79 87.50 89.13 89.83 88.32 89.05 87.90 89.56 89.79 89.08 89.31 88.69 90.49 91.09 89.90of which: US50 18.77 18.87 19.15 19.47 19.23 19.18 19.17 18.82 18.89 18.71 18.90 18.66 18.62 18.96 18.91 18.79
Europe 5* 8.98 8.87 8.75 9.15 9.01 8.95 8.71 8.57 8.89 8.54 8.68 8.49 8.26 8.63 8.47 8.46China 8.06 8.63 9.06 8.92 9.66 9.07 9.54 9.52 9.30 9.69 9.51 9.82 9.86 9.72 10.13 9.88Japan 4.39 4.82 4.07 4.36 4.57 4.45 4.86 3.92 4.32 4.82 4.48 5.13 4.16 4.25 4.55 4.52
India 3.26 3.38 3.45 3.13 3.38 3.34 3.50 3.57 3.26 3.57 3.47 3.59 3.67 3.37 3.71 3.59Russia 3.03 3.17 3.17 3.40 3.36 3.28 3.21 3.43 3.64 3.63 3.48 3.33 3.51 3.73 3.71 3.57
Brazil 2.54 2.60 2.71 2.82 2.80 2.73 2.69 2.77 2.88 2.86 2.80 2.73 2.80 2.91 2.90 2.84Saudi Arabia 2.47 2.33 2.73 3.02 2.54 2.66 2.49 2.89 3.15 2.74 2.82 2.60 2.99 3.23 2.83 2.91
Canada 2.16 2.15 2.17 2.29 2.25 2.22 2.25 2.15 2.29 2.22 2.23 2.21 2.13 2.26 2.22 2.21Korea 2.19 2.31 2.18 2.16 2.35 2.25 2.36 2.04 2.21 2.30 2.23 2.33 2.07 2.22 2.33 2.24
Mexico 2.07 2.07 2.10 2.05 2.07 2.07 2.05 2.06 2.09 2.11 2.08 2.08 2.06 2.08 2.11 2.08Iran 2.11 2.10 2.08 2.08 2.09 2.09 2.09 2.05 2.03 2.04 2.05 2.07 2.06 2.05 2.06 2.06
Total 60.03 61.31 61.61 62.86 63.31 62.28 62.91 61.80 62.95 63.22 62.72 63.05 62.18 63.43 63.92 63.15% of World 70.2% 70.6% 70.4% 70.5% 70.5% 70.5% 70.7% 70.3% 70.3% 70.4% 70.4% 70.6% 70.1% 70.1% 70.2% 70.2%
Annual Change (% per annum)North America -3.7 -0.1 3.3 3.6 1.3 2.0 1.6 -1.6 -2.2 -2.1 -1.1 -2.1 -1.0 0.1 0.8 -0.5Europe -4.7 -5.1 -1.3 2.3 2.0 -0.5 -0.9 -1.0 -1.6 -5.1 -2.2 -3.3 -3.5 -2.5 0.1 -2.3Pacific -4.6 1.2 0.4 4.7 0.6 1.7 1.5 -3.2 0.8 2.6 0.5 3.3 3.7 -0.8 -2.7 0.8Total OECD -4.2 -1.5 1.4 3.3 1.4 1.1 0.8 -1.7 -1.5 -2.2 -1.2 -1.5 -1.0 -0.9 0.0 -0.9Asia 4.4 12.0 7.1 3.5 6.9 7.2 6.8 2.9 3.0 1.8 3.6 2.2 3.0 3.5 3.5 3.1Middle East 3.5 5.0 3.4 2.9 4.3 3.8 2.7 2.3 2.0 3.2 2.6 1.6 2.3 2.0 1.9 1.9Latin America 0.0 4.6 5.2 6.0 4.5 5.1 3.9 2.9 3.2 2.8 3.2 2.6 2.6 2.2 2.5 2.4FSU -1.2 8.4 6.4 4.9 7.2 6.7 1.8 6.6 5.9 5.8 5.0 3.1 2.2 2.3 2.2 2.4Africa 1.6 -1.6 2.1 2.3 5.4 2.0 2.2 -2.9 -3.3 -1.8 -1.5 2.1 5.8 6.9 5.1 5.0Europe -6.3 -7.5 -6.9 -3.7 1.3 -4.2 -0.2 1.8 5.2 2.6 2.4 1.5 0.8 -0.3 -0.2 0.4Total Non-OECD 2.5 7.6 5.3 3.7 5.9 5.6 4.6 2.7 2.7 2.3 3.1 2.2 2.9 3.0 3.0 2.8World -1.2 2.6 3.2 3.5 3.5 3.2 2.6 0.5 0.5 0.0 0.9 0.3 0.9 1.0 1.4 0.9Annual Change (mb/d)North America -0.89 -0.01 0.75 0.83 0.31 0.47 0.37 -0.38 -0.54 -0.50 -0.26 -0.51 -0.23 0.03 0.20 -0.12Europe -0.73 -0.77 -0.18 0.33 0.29 -0.08 -0.12 -0.14 -0.24 -0.76 -0.32 -0.46 -0.50 -0.36 0.01 -0.33Pacific -0.37 0.10 0.03 0.34 0.05 0.13 0.12 -0.23 0.06 0.21 0.04 0.27 0.26 -0.06 -0.23 0.06Total OECD -1.98 -0.69 0.60 1.50 0.65 0.52 0.37 -0.75 -0.72 -1.05 -0.54 -0.70 -0.46 -0.39 -0.02 -0.39Asia 0.77 2.04 1.30 0.64 1.31 1.32 1.29 0.58 0.58 0.36 0.70 0.45 0.60 0.68 0.73 0.62Middle East 0.25 0.35 0.26 0.24 0.32 0.29 0.20 0.18 0.17 0.25 0.20 0.12 0.18 0.17 0.15 0.16Latin America 0.00 0.27 0.31 0.36 0.27 0.30 0.24 0.18 0.21 0.18 0.20 0.16 0.17 0.15 0.16 0.16FSU -0.05 0.34 0.26 0.21 0.31 0.28 0.08 0.29 0.27 0.27 0.23 0.14 0.10 0.11 0.11 0.11Africa 0.05 -0.06 0.07 0.08 0.18 0.07 0.07 -0.10 -0.11 -0.06 -0.05 0.07 0.19 0.22 0.17 0.17Europe -0.05 -0.05 -0.05 -0.03 0.01 -0.03 0.00 0.01 0.04 0.02 0.02 0.01 0.01 0.00 0.00 0.00Total Non-OECD 0.98 2.89 2.14 1.51 2.39 2.23 1.88 1.14 1.15 1.01 1.29 0.96 1.25 1.32 1.32 1.21World -1.00 2.20 2.74 3.01 3.04 2.75 2.25 0.40 0.43 -0.04 0.75 0.26 0.79 0.93 1.30 0.82Revisions to Oil Demand from Last Month's Report (mb/d)North America 0.00 0.00 0.00 0.00 0.00 0.00 0.00 0.00 0.00 0.03 0.01 -0.07 -0.04 -0.01 0.09 -0.01Europe 0.00 0.00 0.00 0.00 0.00 0.00 0.02 0.01 0.00 -0.07 -0.01 0.04 -0.01 0.00 -0.02 0.00Pacific 0.00 0.00 0.00 0.00 0.00 0.00 0.00 0.00 0.00 -0.03 -0.01 0.04 0.00 0.01 -0.08 -0.01Total OECD 0.00 0.00 0.00 0.00 0.00 0.00 0.02 0.01 0.00 -0.07 -0.01 0.00 -0.04 0.00 -0.01 -0.01Asia 0.00 0.00 0.00 0.00 0.00 0.00 0.00 0.00 0.00 0.02 0.00 0.15 -0.04 -0.07 -0.07 -0.01Middle East 0.00 0.00 0.00 0.00 0.00 0.00 0.00 0.00 0.00 0.00 0.00 -0.01 -0.01 -0.01 0.00 -0.01Latin America 0.00 0.00 0.00 0.00 0.00 0.00 0.01 0.01 0.01 0.05 0.02 0.03 0.01 0.01 0.02 0.02FSU 0.00 0.00 0.00 -0.01 0.00 0.00 0.01 0.00 -0.01 -0.02 0.00 0.02 0.04 0.04 -0.02 0.02Africa 0.00 0.00 0.00 0.00 0.00 0.00 0.00 0.00 0.00 -0.01 0.00 0.00 0.00 0.00 -0.01 0.00Europe 0.00 0.00 0.00 0.00 0.00 0.00 0.00 0.00 0.00 0.00 0.00 0.00 0.00 0.00 0.00 0.00Total Non-OECD 0.00 0.00 0.00 -0.01 0.00 0.00 0.02 0.01 0.01 0.04 0.02 0.19 0.00 -0.03 -0.08 0.02World 0.00 0.00 0.00 -0.01 0.00 0.00 0.04 0.02 0.01 -0.03 0.01 0.19 -0.04 -0.03 -0.09 0.01Revisions to Oil Demand Growth from Last Month's Report (mb/d)World 0.00 0.01 0.00 -0.01 0.00 0.00 0.03 0.02 0.02 -0.03 0.01 0.15 -0.06 -0.04 -0.06 0.00* France, Germany, Italy, Spain and UK

INTERNATIONAL ENERGY AGENCY ‐ OIL MARKET REPORT TABLES
14 MARCH 2012 59
Table 2a - OECD Regional Oil Demand Table 2a
OECD REGIONAL OIL DEMAND1
(million barrels per day)
2010 2011 1Q11 2Q11 3Q11 4Q11 Oct 11 Nov 11 Dec 11 2 Nov 11 Dec 10
North AmericaLPG&Ethane 2.95 2.97 3.31 2.71 2.76 3.10 2.92 3.05 3.32 0.27 -0.19 Naphtha 0.37 0.35 0.37 0.36 0.34 0.34 0.36 0.34 0.33 -0.01 0.02 Motor Gasoline 10.57 10.33 10.14 10.45 10.49 10.22 10.21 10.14 10.30 0.16 -0.25 Jet/Kerosene 1.65 1.65 1.60 1.68 1.71 1.59 1.56 1.65 1.57 -0.07 -0.06 Gasoil/Diesel Oil 4.82 4.92 5.04 4.77 4.86 5.03 5.05 5.16 4.87 -0.29 -0.37 Residual Fuel Oil 0.93 0.85 0.97 0.87 0.76 0.82 0.77 0.74 0.94 0.21 0.06 Other Products 2.46 2.43 2.35 2.47 2.64 2.26 2.34 2.31 2.13 -0.18 -0.11
Total 23.77 23.50 23.78 23.31 23.56 23.35 23.21 23.38 23.47 0.08 -0.90
EuropeLPG&Ethane 0.96 0.98 1.04 0.96 0.94 0.96 0.91 0.98 1.00 0.02 -0.05 Naphtha 1.26 1.16 1.27 1.18 1.13 1.06 1.03 1.08 1.06 -0.02 -0.20 Motor Gasoline 2.21 2.12 2.02 2.18 2.20 2.06 2.09 2.08 2.00 -0.08 -0.07 Jet/Kerosene 1.27 1.25 1.20 1.27 1.35 1.19 1.28 1.15 1.14 -0.01 -0.07 Gasoil/Diesel Oil 6.13 6.03 6.04 5.73 6.17 6.18 6.31 6.22 6.00 -0.22 -0.41 Residual Fuel Oil 1.27 1.24 1.29 1.22 1.25 1.20 1.23 1.14 1.23 0.08 -0.09 Other Products 1.47 1.49 1.33 1.57 1.63 1.42 1.47 1.50 1.29 -0.21 0.01
Total 14.58 14.27 14.20 14.12 14.69 14.06 14.32 14.16 13.72 -0.44 -0.89
PacificLPG&Ethane 0.84 0.83 0.88 0.81 0.79 0.86 0.78 0.83 0.97 0.14 0.03 Naphtha 1.68 1.69 1.78 1.55 1.73 1.71 1.62 1.74 1.77 0.03 -0.01 Motor Gasoline 1.57 1.54 1.51 1.47 1.61 1.57 1.50 1.56 1.66 0.11 0.02 Jet/Kerosene 0.87 0.85 1.18 0.64 0.63 0.96 0.79 0.88 1.20 0.33 -0.01 Gasoil/Diesel Oil 1.62 1.63 1.67 1.53 1.59 1.71 1.64 1.72 1.77 0.06 0.02 Residual Fuel Oil 0.74 0.76 0.80 0.65 0.76 0.82 0.75 0.81 0.90 0.09 0.11 Other Products 0.49 0.55 0.54 0.47 0.56 0.65 0.64 0.57 0.74 0.17 0.22
Total 7.82 7.86 8.35 7.11 7.68 8.28 7.73 8.09 9.02 0.92 0.38
OECDLPG&Ethane 4.76 4.78 5.23 4.48 4.49 4.92 4.62 4.86 5.29 0.43 -0.21 Naphtha 3.31 3.21 3.43 3.09 3.20 3.11 3.01 3.16 3.16 0.00 -0.19 Motor Gasoline 14.36 13.99 13.67 14.11 14.31 13.85 13.80 13.78 13.96 0.18 -0.29 Jet/Kerosene 3.80 3.75 3.98 3.58 3.70 3.74 3.63 3.68 3.92 0.24 -0.14 Gasoil/Diesel Oil 12.58 12.58 12.75 12.04 12.62 12.91 13.00 13.10 12.64 -0.46 -0.76 Residual Fuel Oil 2.94 2.85 3.06 2.74 2.77 2.84 2.75 2.69 3.07 0.38 0.07 Other Products 4.42 4.48 4.22 4.51 4.83 4.33 4.46 4.37 4.16 -0.22 0.12
Total 46.17 45.63 46.33 44.55 45.93 45.70 45.26 45.64 46.20 0.56 -1.40 1 Demand, measured as deliveries from refineries and primary stocks, comprises inland deliveries, international bunkers and refinery fuel. It includes crude for direct burning, oil from non-conventional sources and other sources of supply. Jet/kerosene comprises jet kerosene and non-aviation kerosene. Gasoil comprises diesel, light heating oil and other gasoils. North America comprises US 50 states, US territories, Mexico and Canada. 2 Latest official OECD submissions (MOS).
Latest month vs.
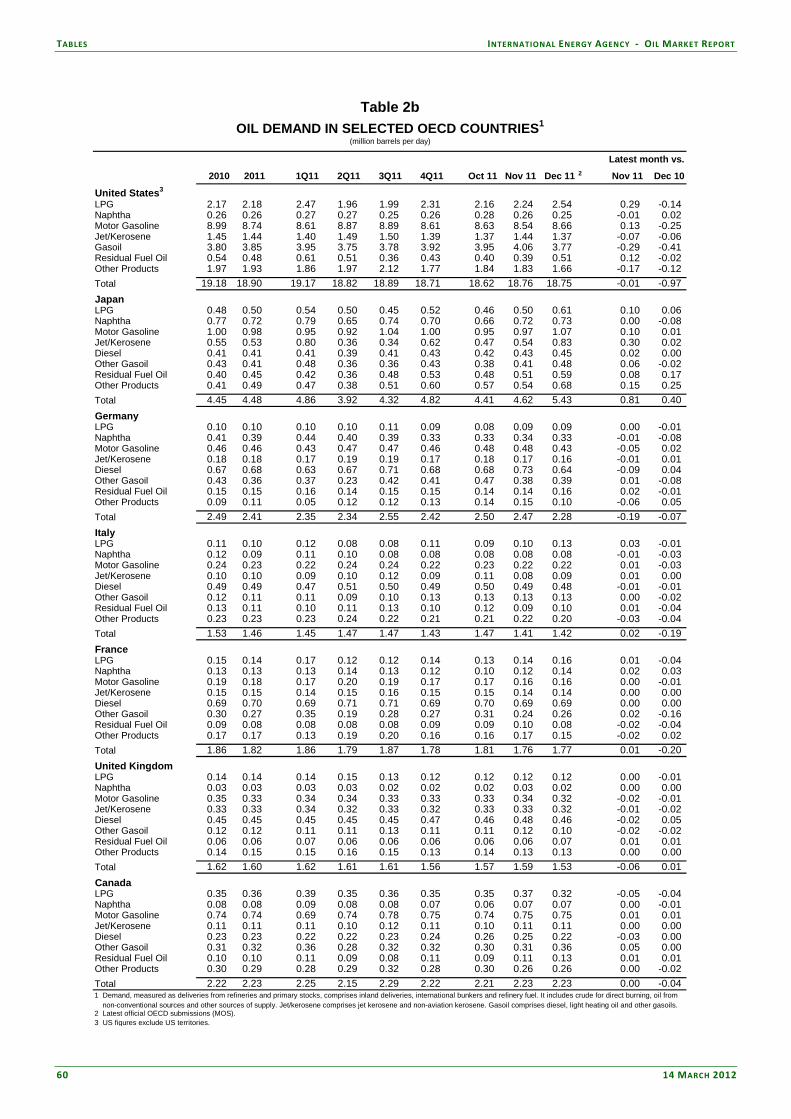
TABLES INTERNATIONAL ENERGY AGENCY ‐ OIL MARKET REPORT
60 14 MARCH 2012
Table 2b - OECD Oil Demand and % Growth in Demand in Selected OECD Countries Table 2bOIL DEMAND IN SELECTED OECD COUNTRIES1
(million barrels per day)
2010 2011 1Q11 2Q11 3Q11 4Q11 Oct 11 Nov 11 Dec 11 2 Nov 11 Dec 10
United States3
LPG 2.17 2.18 2.47 1.96 1.99 2.31 2.16 2.24 2.54 0.29 -0.14 Naphtha 0.26 0.26 0.27 0.27 0.25 0.26 0.28 0.26 0.25 -0.01 0.02 Motor Gasoline 8.99 8.74 8.61 8.87 8.89 8.61 8.63 8.54 8.66 0.13 -0.25 Jet/Kerosene 1.45 1.44 1.40 1.49 1.50 1.39 1.37 1.44 1.37 -0.07 -0.06 Gasoil 3.80 3.85 3.95 3.75 3.78 3.92 3.95 4.06 3.77 -0.29 -0.41 Residual Fuel Oil 0.54 0.48 0.61 0.51 0.36 0.43 0.40 0.39 0.51 0.12 -0.02 Other Products 1.97 1.93 1.86 1.97 2.12 1.77 1.84 1.83 1.66 -0.17 -0.12 Total 19.18 18.90 19.17 18.82 18.89 18.71 18.62 18.76 18.75 -0.01 -0.97 JapanLPG 0.48 0.50 0.54 0.50 0.45 0.52 0.46 0.50 0.61 0.10 0.06 Naphtha 0.77 0.72 0.79 0.65 0.74 0.70 0.66 0.72 0.73 0.00 -0.08 Motor Gasoline 1.00 0.98 0.95 0.92 1.04 1.00 0.95 0.97 1.07 0.10 0.01 Jet/Kerosene 0.55 0.53 0.80 0.36 0.34 0.62 0.47 0.54 0.83 0.30 0.02 Diesel 0.41 0.41 0.41 0.39 0.41 0.43 0.42 0.43 0.45 0.02 0.00 Other Gasoil 0.43 0.41 0.48 0.36 0.36 0.43 0.38 0.41 0.48 0.06 -0.02 Residual Fuel Oil 0.40 0.45 0.42 0.36 0.48 0.53 0.48 0.51 0.59 0.08 0.17 Other Products 0.41 0.49 0.47 0.38 0.51 0.60 0.57 0.54 0.68 0.15 0.25 Total 4.45 4.48 4.86 3.92 4.32 4.82 4.41 4.62 5.43 0.81 0.40 GermanyLPG 0.10 0.10 0.10 0.10 0.11 0.09 0.08 0.09 0.09 0.00 -0.01 Naphtha 0.41 0.39 0.44 0.40 0.39 0.33 0.33 0.34 0.33 -0.01 -0.08 Motor Gasoline 0.46 0.46 0.43 0.47 0.47 0.46 0.48 0.48 0.43 -0.05 0.02 Jet/Kerosene 0.18 0.18 0.17 0.19 0.19 0.17 0.18 0.17 0.16 -0.01 0.01 Diesel 0.67 0.68 0.63 0.67 0.71 0.68 0.68 0.73 0.64 -0.09 0.04 Other Gasoil 0.43 0.36 0.37 0.23 0.42 0.41 0.47 0.38 0.39 0.01 -0.08 Residual Fuel Oil 0.15 0.15 0.16 0.14 0.15 0.15 0.14 0.14 0.16 0.02 -0.01 Other Products 0.09 0.11 0.05 0.12 0.12 0.13 0.14 0.15 0.10 -0.06 0.05 Total 2.49 2.41 2.35 2.34 2.55 2.42 2.50 2.47 2.28 -0.19 -0.07 ItalyLPG 0.11 0.10 0.12 0.08 0.08 0.11 0.09 0.10 0.13 0.03 -0.01 Naphtha 0.12 0.09 0.11 0.10 0.08 0.08 0.08 0.08 0.08 -0.01 -0.03 Motor Gasoline 0.24 0.23 0.22 0.24 0.24 0.22 0.23 0.22 0.22 0.01 -0.03 Jet/Kerosene 0.10 0.10 0.09 0.10 0.12 0.09 0.11 0.08 0.09 0.01 0.00 Diesel 0.49 0.49 0.47 0.51 0.50 0.49 0.50 0.49 0.48 -0.01 -0.01 Other Gasoil 0.12 0.11 0.11 0.09 0.10 0.13 0.13 0.13 0.13 0.00 -0.02 Residual Fuel Oil 0.13 0.11 0.10 0.11 0.13 0.10 0.12 0.09 0.10 0.01 -0.04 Other Products 0.23 0.23 0.23 0.24 0.22 0.21 0.21 0.22 0.20 -0.03 -0.04 Total 1.53 1.46 1.45 1.47 1.47 1.43 1.47 1.41 1.42 0.02 -0.19 FranceLPG 0.15 0.14 0.17 0.12 0.12 0.14 0.13 0.14 0.16 0.01 -0.04 Naphtha 0.13 0.13 0.13 0.14 0.13 0.12 0.10 0.12 0.14 0.02 0.03 Motor Gasoline 0.19 0.18 0.17 0.20 0.19 0.17 0.17 0.16 0.16 0.00 -0.01 Jet/Kerosene 0.15 0.15 0.14 0.15 0.16 0.15 0.15 0.14 0.14 0.00 0.00 Diesel 0.69 0.70 0.69 0.71 0.71 0.69 0.70 0.69 0.69 0.00 0.00 Other Gasoil 0.30 0.27 0.35 0.19 0.28 0.27 0.31 0.24 0.26 0.02 -0.16 Residual Fuel Oil 0.09 0.08 0.08 0.08 0.08 0.09 0.09 0.10 0.08 -0.02 -0.04 Other Products 0.17 0.17 0.13 0.19 0.20 0.16 0.16 0.17 0.15 -0.02 0.02 Total 1.86 1.82 1.86 1.79 1.87 1.78 1.81 1.76 1.77 0.01 -0.20 United KingdomLPG 0.14 0.14 0.14 0.15 0.13 0.12 0.12 0.12 0.12 0.00 -0.01 Naphtha 0.03 0.03 0.03 0.03 0.02 0.02 0.02 0.03 0.02 0.00 0.00 Motor Gasoline 0.35 0.33 0.34 0.34 0.33 0.33 0.33 0.34 0.32 -0.02 -0.01 Jet/Kerosene 0.33 0.33 0.34 0.32 0.33 0.32 0.33 0.33 0.32 -0.01 -0.02 Diesel 0.45 0.45 0.45 0.45 0.45 0.47 0.46 0.48 0.46 -0.02 0.05 Other Gasoil 0.12 0.12 0.11 0.11 0.13 0.11 0.11 0.12 0.10 -0.02 -0.02 Residual Fuel Oil 0.06 0.06 0.07 0.06 0.06 0.06 0.06 0.06 0.07 0.01 0.01 Other Products 0.14 0.15 0.15 0.16 0.15 0.13 0.14 0.13 0.13 0.00 0.00 Total 1.62 1.60 1.62 1.61 1.61 1.56 1.57 1.59 1.53 -0.06 0.01 CanadaLPG 0.35 0.36 0.39 0.35 0.36 0.35 0.35 0.37 0.32 -0.05 -0.04 Naphtha 0.08 0.08 0.09 0.08 0.08 0.07 0.06 0.07 0.07 0.00 -0.01 Motor Gasoline 0.74 0.74 0.69 0.74 0.78 0.75 0.74 0.75 0.75 0.01 0.01 Jet/Kerosene 0.11 0.11 0.11 0.10 0.12 0.11 0.10 0.11 0.11 0.00 0.00 Diesel 0.23 0.23 0.22 0.22 0.23 0.24 0.26 0.25 0.22 -0.03 0.00 Other Gasoil 0.31 0.32 0.36 0.28 0.32 0.32 0.30 0.31 0.36 0.05 0.00 Residual Fuel Oil 0.10 0.10 0.11 0.09 0.08 0.11 0.09 0.11 0.13 0.01 0.01 Other Products 0.30 0.29 0.28 0.29 0.32 0.28 0.30 0.26 0.26 0.00 -0.02 Total 2.22 2.23 2.25 2.15 2.29 2.22 2.21 2.23 2.23 0.00 -0.04 1 Demand, measured as deliveries from refineries and primary stocks, comprises inland deliveries, international bunkers and refinery fuel. It includes crude for direct burning, oil from non-conventional sources and other sources of supply. Jet/kerosene comprises jet kerosene and non-aviation kerosene. Gasoil comprises diesel, light heating oil and other gasoils. 2 Latest official OECD submissions (MOS).3 US figures exclude US territories.
Latest month vs.
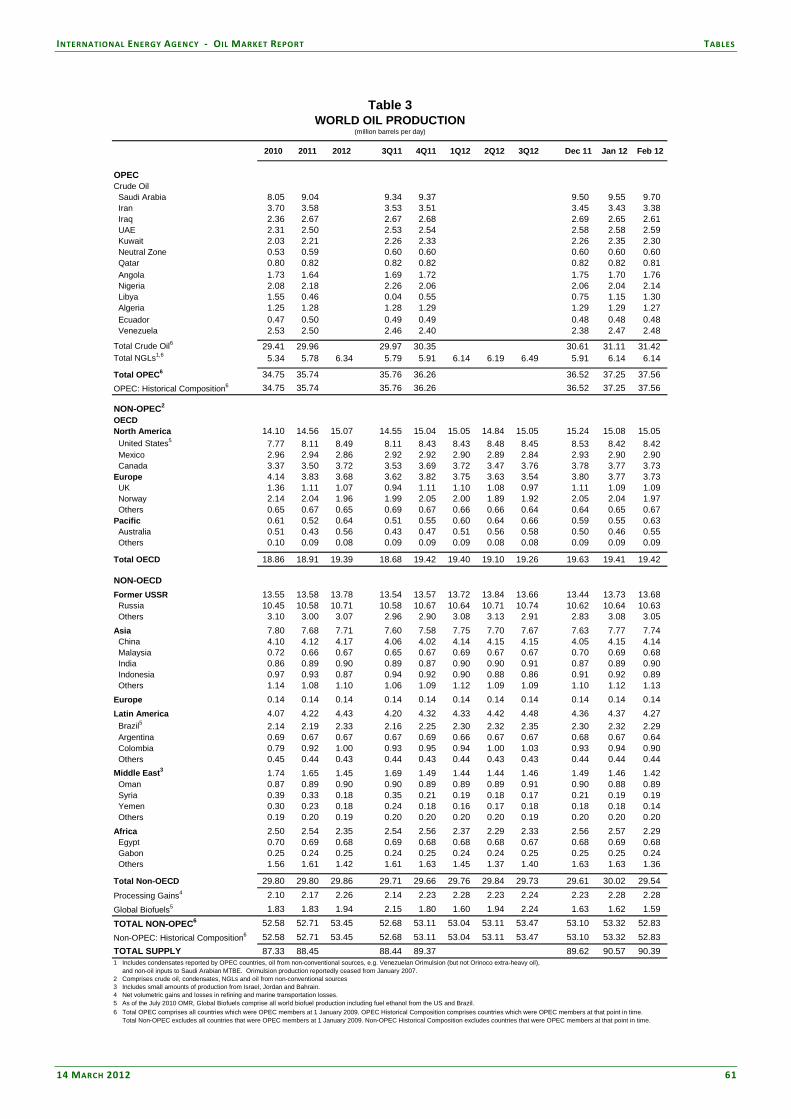
INTERNATIONAL ENERGY AGENCY ‐ OIL MARKET REPORT TABLES
14 MARCH 2012 61
Table 3 - World Oil Production 3a - Oil Supply In OECD Countries
Table 3WORLD OIL PRODUCTION
(million barrels per day)
2010 2011 2012 3Q11 4Q11 1Q12 2Q12 3Q12 Dec 11 Jan 12 Feb 12
OPECCrude Oil Saudi Arabia 8.05 9.04 9.34 9.37 9.50 9.55 9.70 Iran 3.70 3.58 3.53 3.51 3.45 3.43 3.38 Iraq 2.36 2.67 2.67 2.68 2.69 2.65 2.61 UAE 2.31 2.50 2.53 2.54 2.58 2.58 2.59 Kuwait 2.03 2.21 2.26 2.33 2.26 2.35 2.30 Neutral Zone 0.53 0.59 0.60 0.60 0.60 0.60 0.60 Qatar 0.80 0.82 0.82 0.82 0.82 0.82 0.81 Angola 1.73 1.64 1.69 1.72 1.75 1.70 1.76 Nigeria 2.08 2.18 2.26 2.06 2.06 2.04 2.14 Libya 1.55 0.46 0.04 0.55 0.75 1.15 1.30 Algeria 1.25 1.28 1.28 1.29 1.29 1.29 1.27 Ecuador 0.47 0.50 0.49 0.49 0.48 0.48 0.48 Venezuela 2.53 2.50 2.46 2.40 2.38 2.47 2.48
Total Crude Oil6 29.41 29.96 29.97 30.35 30.61 31.11 31.42 Total NGLs1,6 5.34 5.78 6.34 5.79 5.91 6.14 6.19 6.49 5.91 6.14 6.14
Total OPEC6 34.75 35.74 35.76 36.26 36.52 37.25 37.56 OPEC: Historical Composition6 34.75 35.74 35.76 36.26 36.52 37.25 37.56
NON-OPEC2
OECDNorth America 14.10 14.56 15.07 14.55 15.04 15.05 14.84 15.05 15.24 15.08 15.05 United States5 7.77 8.11 8.49 8.11 8.43 8.43 8.48 8.45 8.53 8.42 8.42 Mexico 2.96 2.94 2.86 2.92 2.92 2.90 2.89 2.84 2.93 2.90 2.90 Canada 3.37 3.50 3.72 3.53 3.69 3.72 3.47 3.76 3.78 3.77 3.73 Europe 4.14 3.83 3.68 3.62 3.82 3.75 3.63 3.54 3.80 3.77 3.73 UK 1.36 1.11 1.07 0.94 1.11 1.10 1.08 0.97 1.11 1.09 1.09 Norway 2.14 2.04 1.96 1.99 2.05 2.00 1.89 1.92 2.05 2.04 1.97 Others 0.65 0.67 0.65 0.69 0.67 0.66 0.66 0.64 0.64 0.65 0.67 Pacific 0.61 0.52 0.64 0.51 0.55 0.60 0.64 0.66 0.59 0.55 0.63 Australia 0.51 0.43 0.56 0.43 0.47 0.51 0.56 0.58 0.50 0.46 0.55 Others 0.10 0.09 0.08 0.09 0.09 0.09 0.08 0.08 0.09 0.09 0.09
Total OECD 18.86 18.91 19.39 18.68 19.42 19.40 19.10 19.26 19.63 19.41 19.42
NON-OECDFormer USSR 13.55 13.58 13.78 13.54 13.57 13.72 13.84 13.66 13.44 13.73 13.68 Russia 10.45 10.58 10.71 10.58 10.67 10.64 10.71 10.74 10.62 10.64 10.63 Others 3.10 3.00 3.07 2.96 2.90 3.08 3.13 2.91 2.83 3.08 3.05 Asia 7.80 7.68 7.71 7.60 7.58 7.75 7.70 7.67 7.63 7.77 7.74 China 4.10 4.12 4.17 4.06 4.02 4.14 4.15 4.15 4.05 4.15 4.14 Malaysia 0.72 0.66 0.67 0.65 0.67 0.69 0.67 0.67 0.70 0.69 0.68 India 0.86 0.89 0.90 0.89 0.87 0.90 0.90 0.91 0.87 0.89 0.90 Indonesia 0.97 0.93 0.87 0.94 0.92 0.90 0.88 0.86 0.91 0.92 0.89 Others 1.14 1.08 1.10 1.06 1.09 1.12 1.09 1.09 1.10 1.12 1.13 Europe 0.14 0.14 0.14 0.14 0.14 0.14 0.14 0.14 0.14 0.14 0.14 Latin America 4.07 4.22 4.43 4.20 4.32 4.33 4.42 4.48 4.36 4.37 4.27 Brazil5 2.14 2.19 2.33 2.16 2.25 2.30 2.32 2.35 2.30 2.32 2.29 Argentina 0.69 0.67 0.67 0.67 0.69 0.66 0.67 0.67 0.68 0.67 0.64 Colombia 0.79 0.92 1.00 0.93 0.95 0.94 1.00 1.03 0.93 0.94 0.90 Others 0.45 0.44 0.43 0.44 0.43 0.44 0.43 0.43 0.44 0.44 0.44 Middle East3 1.74 1.65 1.45 1.69 1.49 1.44 1.44 1.46 1.49 1.46 1.42 Oman 0.87 0.89 0.90 0.90 0.89 0.89 0.89 0.91 0.90 0.88 0.89 Syria 0.39 0.33 0.18 0.35 0.21 0.19 0.18 0.17 0.21 0.19 0.19 Yemen 0.30 0.23 0.18 0.24 0.18 0.16 0.17 0.18 0.18 0.18 0.14 Others 0.19 0.20 0.19 0.20 0.20 0.20 0.20 0.19 0.20 0.20 0.20 Africa 2.50 2.54 2.35 2.54 2.56 2.37 2.29 2.33 2.56 2.57 2.29 Egypt 0.70 0.69 0.68 0.69 0.68 0.68 0.68 0.67 0.68 0.69 0.68 Gabon 0.25 0.24 0.25 0.24 0.25 0.24 0.24 0.25 0.25 0.25 0.24 Others 1.56 1.61 1.42 1.61 1.63 1.45 1.37 1.40 1.63 1.63 1.36
Total Non-OECD 29.80 29.80 29.86 29.71 29.66 29.76 29.84 29.73 29.61 30.02 29.54 Processing Gains4 2.10 2.17 2.26 2.14 2.23 2.28 2.23 2.24 2.23 2.28 2.28 Global Biofuels5 1.83 1.83 1.94 2.15 1.80 1.60 1.94 2.24 1.63 1.62 1.59
TOTAL NON-OPEC6 52.58 52.71 53.45 52.68 53.11 53.04 53.11 53.47 53.10 53.32 52.83 Non-OPEC: Historical Composition6 52.58 52.71 53.45 52.68 53.11 53.04 53.11 53.47 53.10 53.32 52.83 TOTAL SUPPLY 87.33 88.45 88.44 89.37 89.62 90.57 90.39 1 Includes condensates reported by OPEC countries, oil from non-conventional sources, e.g. Venezuelan Orimulsion (but not Orinoco extra-heavy oil), and non-oil inputs to Saudi Arabian MTBE. Orimulsion production reportedly ceased from January 2007.2 Comprises crude oil, condensates, NGLs and oil from non-conventional sources3 Includes small amounts of production from Israel, Jordan and Bahrain.4 Net volumetric gains and losses in refining and marine transportation losses.5 As of the July 2010 OMR, Global Biofuels comprise all world biofuel production including fuel ethanol from the US and Brazil.6 Total OPEC comprises all countries which were OPEC members at 1 January 2009. OPEC Historical Composition comprises countries which were OPEC members at that point in time. Total Non-OPEC excludes all countries that were OPEC members at 1 January 2009. Non-OPEC Historical Composition excludes countries that were OPEC members at that point in time.
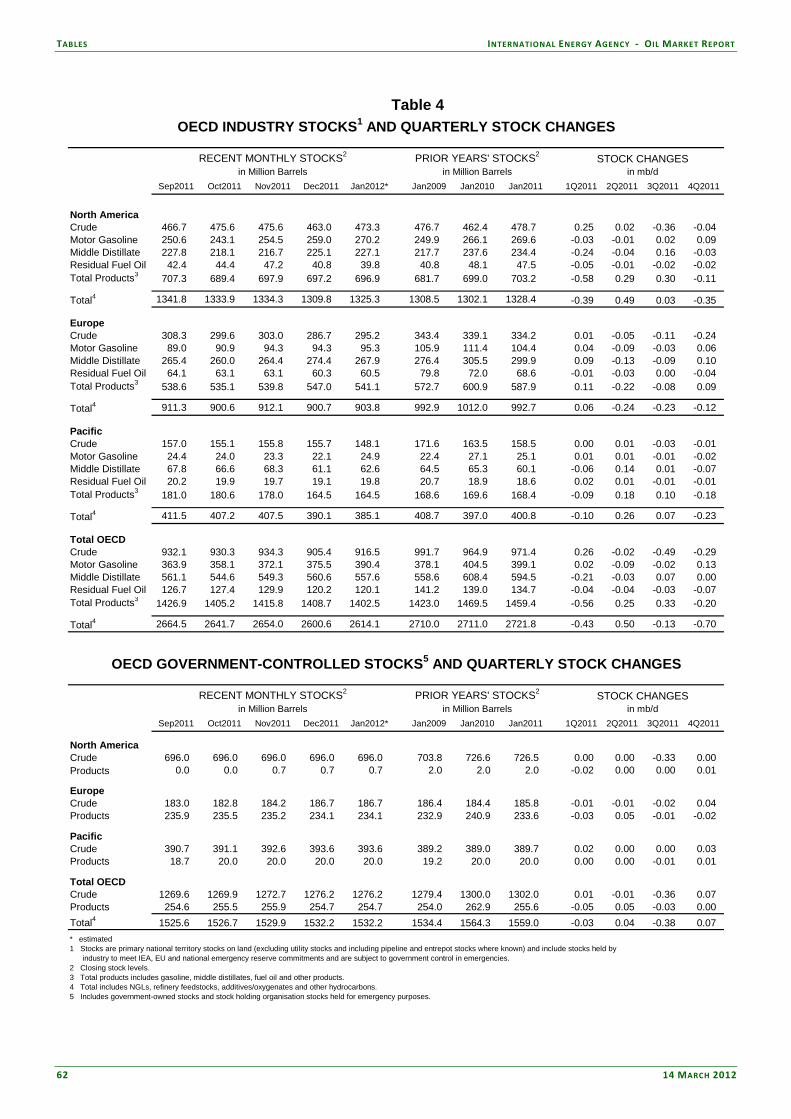
TABLES INTERNATIONAL ENERGY AGENCY ‐ OIL MARKET REPORT
62 14 MARCH 2012
Table 4 - OECD Industry Stocks and Quarterly Stock Changes/OECD Government-Controlled Stocks and Quarterly Stock Changes Table 4a - Industry Stocks on Land in Selected Countries
OECD INDUSTRY STOCKS1 AND QUARTERLY STOCK CHANGES
RECENT MONTHLY STOCKS2 PRIOR YEARS' STOCKS2 STOCK CHANGESin Million Barrels in Million Barrels in mb/d
Sep2011 Oct2011 Nov2011 Dec2011 Jan2012* Jan2009 Jan2010 Jan2011 1Q2011 2Q2011 3Q2011 4Q2011
North AmericaCrude 466.7 475.6 475.6 463.0 473.3 476.7 462.4 478.7 0.25 0.02 -0.36 -0.04 Motor Gasoline 250.6 243.1 254.5 259.0 270.2 249.9 266.1 269.6 -0.03 -0.01 0.02 0.09 Middle Distillate 227.8 218.1 216.7 225.1 227.1 217.7 237.6 234.4 -0.24 -0.04 0.16 -0.03 Residual Fuel Oil 42.4 44.4 47.2 40.8 39.8 40.8 48.1 47.5 -0.05 -0.01 -0.02 -0.02 Total Products3 707.3 689.4 697.9 697.2 696.9 681.7 699.0 703.2 -0.58 0.29 0.30 -0.11
Total4 1341.8 1333.9 1334.3 1309.8 1325.3 1308.5 1302.1 1328.4 -0.39 0.49 0.03 -0.35
EuropeCrude 308.3 299.6 303.0 286.7 295.2 343.4 339.1 334.2 0.01 -0.05 -0.11 -0.24 Motor Gasoline 89.0 90.9 94.3 94.3 95.3 105.9 111.4 104.4 0.04 -0.09 -0.03 0.06 Middle Distillate 265.4 260.0 264.4 274.4 267.9 276.4 305.5 299.9 0.09 -0.13 -0.09 0.10 Residual Fuel Oil 64.1 63.1 63.1 60.3 60.5 79.8 72.0 68.6 -0.01 -0.03 0.00 -0.04 Total Products3 538.6 535.1 539.8 547.0 541.1 572.7 600.9 587.9 0.11 -0.22 -0.08 0.09
Total4 911.3 900.6 912.1 900.7 903.8 992.9 1012.0 992.7 0.06 -0.24 -0.23 -0.12
PacificCrude 157.0 155.1 155.8 155.7 148.1 171.6 163.5 158.5 0.00 0.01 -0.03 -0.01 Motor Gasoline 24.4 24.0 23.3 22.1 24.9 22.4 27.1 25.1 0.01 0.01 -0.01 -0.02 Middle Distillate 67.8 66.6 68.3 61.1 62.6 64.5 65.3 60.1 -0.06 0.14 0.01 -0.07 Residual Fuel Oil 20.2 19.9 19.7 19.1 19.8 20.7 18.9 18.6 0.02 0.01 -0.01 -0.01 Total Products3 181.0 180.6 178.0 164.5 164.5 168.6 169.6 168.4 -0.09 0.18 0.10 -0.18
Total4 411.5 407.2 407.5 390.1 385.1 408.7 397.0 400.8 -0.10 0.26 0.07 -0.23
Total OECDCrude 932.1 930.3 934.3 905.4 916.5 991.7 964.9 971.4 0.26 -0.02 -0.49 -0.29 Motor Gasoline 363.9 358.1 372.1 375.5 390.4 378.1 404.5 399.1 0.02 -0.09 -0.02 0.13 Middle Distillate 561.1 544.6 549.3 560.6 557.6 558.6 608.4 594.5 -0.21 -0.03 0.07 0.00 Residual Fuel Oil 126.7 127.4 129.9 120.2 120.1 141.2 139.0 134.7 -0.04 -0.04 -0.03 -0.07 Total Products3 1426.9 1405.2 1415.8 1408.7 1402.5 1423.0 1469.5 1459.4 -0.56 0.25 0.33 -0.20
Total4 2664.5 2641.7 2654.0 2600.6 2614.1 2710.0 2711.0 2721.8 -0.43 0.50 -0.13 -0.70
OECD GOVERNMENT-CONTROLLED STOCKS5 AND QUARTERLY STOCK CHANGES
RECENT MONTHLY STOCKS2 PRIOR YEARS' STOCKS2 STOCK CHANGESin Million Barrels in Million Barrels in mb/d
Sep2011 Oct2011 Nov2011 Dec2011 Jan2012* Jan2009 Jan2010 Jan2011 1Q2011 2Q2011 3Q2011 4Q2011
North AmericaCrude 696.0 696.0 696.0 696.0 696.0 703.8 726.6 726.5 0.00 0.00 -0.33 0.00 Products 0.0 0.0 0.7 0.7 0.7 2.0 2.0 2.0 -0.02 0.00 0.00 0.01
EuropeCrude 183.0 182.8 184.2 186.7 186.7 186.4 184.4 185.8 -0.01 -0.01 -0.02 0.04 Products 235.9 235.5 235.2 234.1 234.1 232.9 240.9 233.6 -0.03 0.05 -0.01 -0.02
PacificCrude 390.7 391.1 392.6 393.6 393.6 389.2 389.0 389.7 0.02 0.00 0.00 0.03 Products 18.7 20.0 20.0 20.0 20.0 19.2 20.0 20.0 0.00 0.00 -0.01 0.01
Total OECDCrude 1269.6 1269.9 1272.7 1276.2 1276.2 1279.4 1300.0 1302.0 0.01 -0.01 -0.36 0.07 Products 254.6 255.5 255.9 254.7 254.7 254.0 262.9 255.6 -0.05 0.05 -0.03 0.00 Total4 1525.6 1526.7 1529.9 1532.2 1532.2 1534.4 1564.3 1559.0 -0.03 0.04 -0.38 0.07 * estimated1 Stocks are primary national territory stocks on land (excluding utility stocks and including pipeline and entrepot stocks where known) and include stocks held by industry to meet IEA, EU and national emergency reserve commitments and are subject to government control in emergencies. 2 Closing stock levels.3 Total products includes gasoline, middle distillates, fuel oil and other products. 4 Total includes NGLs, refinery feedstocks, additives/oxygenates and other hydrocarbons. 5 Includes government-owned stocks and stock holding organisation stocks held for emergency purposes.
Table 4
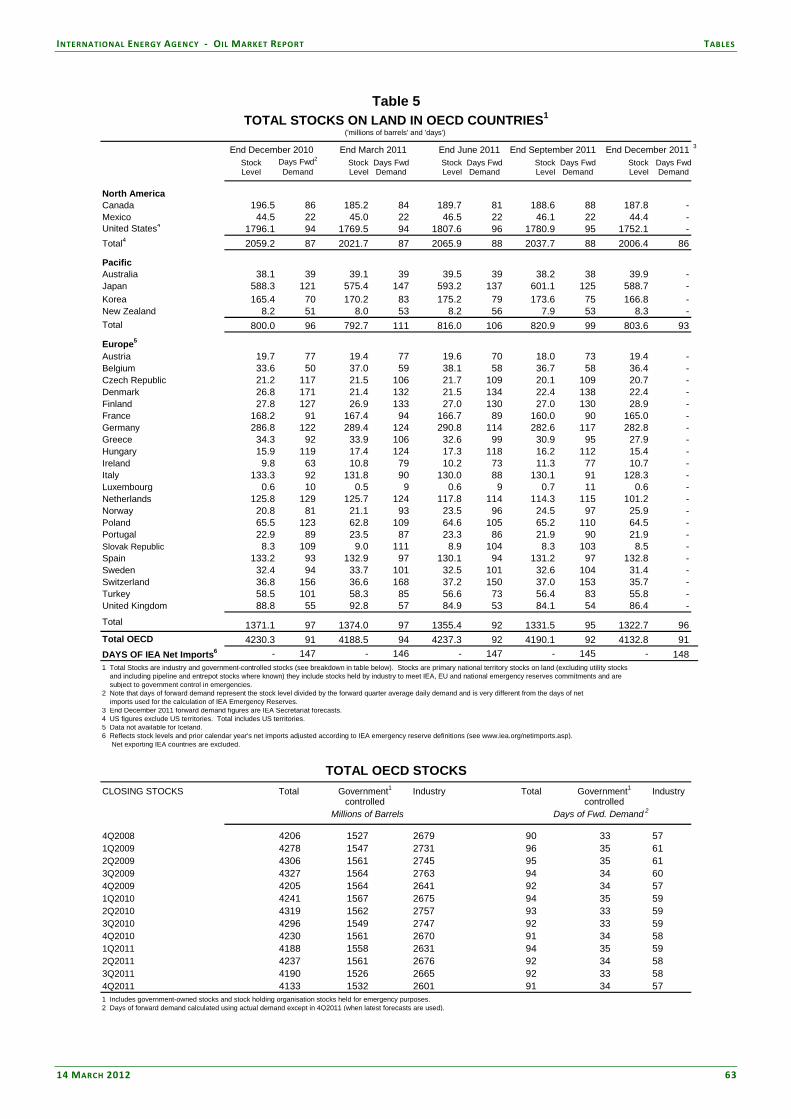
INTERNATIONAL ENERGY AGENCY ‐ OIL MARKET REPORT TABLES
14 MARCH 2012 63
Table 5 - Total Stocks on Land in OECD Countries/Total OECD Stocks Table 5
TOTAL STOCKS ON LAND IN OECD COUNTRIES1
('millions of barrels' and 'days')
3
Stock Days Fwd2 Stock Days Fwd Stock Days Fwd Stock Days Fwd Stock Days FwdLevel Demand Level Demand Level Demand Level Demand Level Demand
North AmericaCanada 196.5 86 185.2 84 189.7 81 188.6 88 187.8 -Mexico 44.5 22 45.0 22 46.5 22 46.1 22 44.4 -United States4 1796.1 94 1769.5 94 1807.6 96 1780.9 95 1752.1 -Total4 2059.2 87 2021.7 87 2065.9 88 2037.7 88 2006.4 86
PacificAustralia 38.1 39 39.1 39 39.5 39 38.2 38 39.9 -Japan 588.3 121 575.4 147 593.2 137 601.1 125 588.7 -Korea 165.4 70 170.2 83 175.2 79 173.6 75 166.8 -New Zealand 8.2 51 8.0 53 8.2 56 7.9 53 8.3 -Total 800.0 96 792.7 111 816.0 106 820.9 99 803.6 93
Europe5
Austria 19.7 77 19.4 77 19.6 70 18.0 73 19.4 -Belgium 33.6 50 37.0 59 38.1 58 36.7 58 36.4 -Czech Republic 21.2 117 21.5 106 21.7 109 20.1 109 20.7 -Denmark 26.8 171 21.4 132 21.5 134 22.4 138 22.4 -Finland 27.8 127 26.9 133 27.0 130 27.0 130 28.9 -France 168.2 91 167.4 94 166.7 89 160.0 90 165.0 -Germany 286.8 122 289.4 124 290.8 114 282.6 117 282.8 -Greece 34.3 92 33.9 106 32.6 99 30.9 95 27.9 -Hungary 15.9 119 17.4 124 17.3 118 16.2 112 15.4 -Ireland 9.8 63 10.8 79 10.2 73 11.3 77 10.7 -Italy 133.3 92 131.8 90 130.0 88 130.1 91 128.3 -Luxembourg 0.6 10 0.5 9 0.6 9 0.7 11 0.6 -Netherlands 125.8 129 125.7 124 117.8 114 114.3 115 101.2 -Norway 20.8 81 21.1 93 23.5 96 24.5 97 25.9 -Poland 65.5 123 62.8 109 64.6 105 65.2 110 64.5 -Portugal 22.9 89 23.5 87 23.3 86 21.9 90 21.9 -Slovak Republic 8.3 109 9.0 111 8.9 104 8.3 103 8.5 -Spain 133.2 93 132.9 97 130.1 94 131.2 97 132.8 -Sweden 32.4 94 33.7 101 32.5 101 32.6 104 31.4 -Switzerland 36.8 156 36.6 168 37.2 150 37.0 153 35.7 -Turkey 58.5 101 58.3 85 56.6 73 56.4 83 55.8 -United Kingdom 88.8 55 92.8 57 84.9 53 84.1 54 86.4 -Total 1371.1 97 1374.0 97 1355.4 92 1331.5 95 1322.7 96Total OECD 4230.3 91 4188.5 94 4237.3 92 4190.1 92 4132.8 91DAYS OF IEA Net Imports6 - 147 - 146 - 147 - 145 - 1481 Total Stocks are industry and government-controlled stocks (see breakdown in table below). Stocks are primary national territory stocks on land (excluding utility stocks and including pipeline and entrepot stocks where known) they include stocks held by industry to meet IEA, EU and national emergency reserves commitments and are subject to government control in emergencies.2 Note that days of forward demand represent the stock level divided by the forward quarter average daily demand and is very different from the days of net imports used for the calculation of IEA Emergency Reserves.3 End December 2011 forward demand figures are IEA Secretariat forecasts. 4 US figures exclude US territories. Total includes US territories.5 Data not available for Iceland.6 Reflects stock levels and prior calendar year's net imports adjusted according to IEA emergency reserve definitions (see www.iea.org/netimports.asp). Net exporting IEA countries are excluded.
TOTAL OECD STOCKSCLOSING STOCKS Total Industry Total Industry
4Q2008 4206 1527 2679 90 33 571Q2009 4278 1547 2731 96 35 612Q2009 4306 1561 2745 95 35 613Q2009 4327 1564 2763 94 34 604Q2009 4205 1564 2641 92 34 571Q2010 4241 1567 2675 94 35 592Q2010 4319 1562 2757 93 33 593Q2010 4296 1549 2747 92 33 594Q2010 4230 1561 2670 91 34 581Q2011 4188 1558 2631 94 35 592Q2011 4237 1561 2676 92 34 583Q2011 4190 1526 2665 92 33 584Q2011 4133 1532 2601 91 34 571 Includes government-owned stocks and stock holding organisation stocks held for emergency purposes.2 Days of forward demand calculated using actual demand except in 4Q2011 (when latest forecasts are used).
End December 2011
Millions of Barrels
Government1controlled
Government1controlled
Days of Fwd. Demand 2
End March 2011 End December 2010 End June 2011 End September 2011
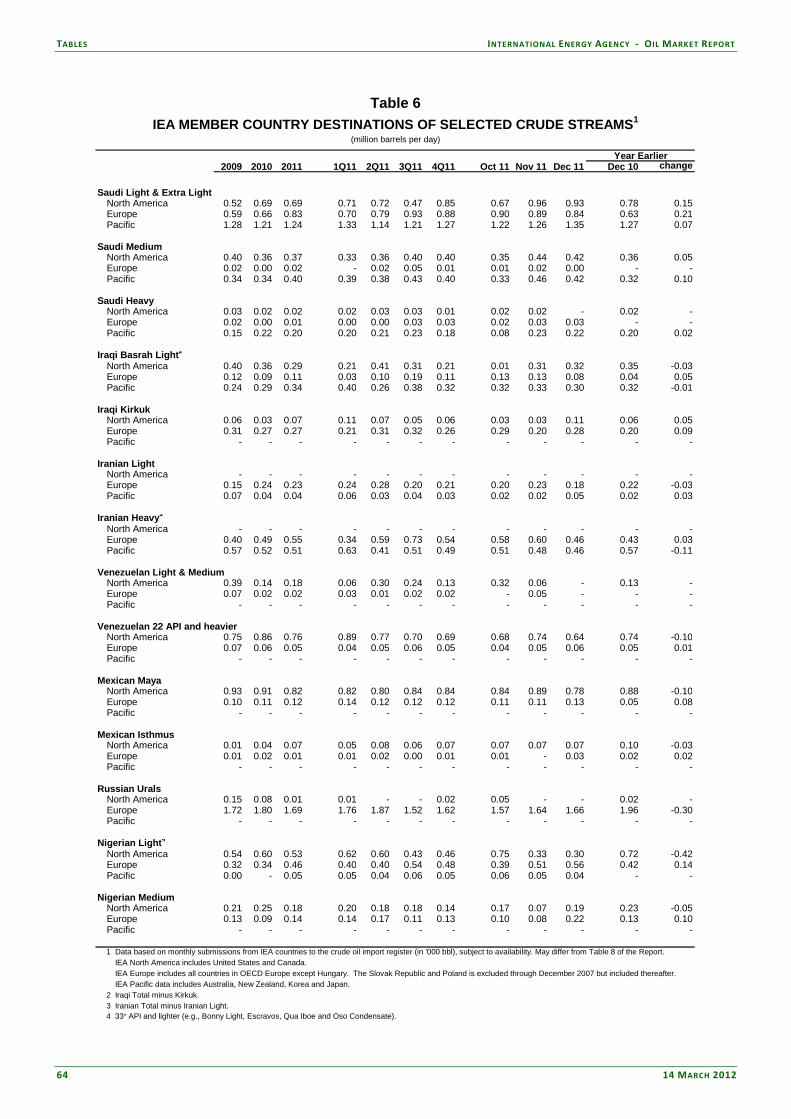
TABLES INTERNATIONAL ENERGY AGENCY ‐ OIL MARKET REPORT
64 14 MARCH 2012
Table 6 - IEA Member Country Destinations of Selected Crude Streams Table 6
IEA MEMBER COUNTRY DESTINATIONS OF SELECTED CRUDE STREAMS1
(million barrels per day)
Year Earlier2009 2010 2011 1Q11 2Q11 3Q11 4Q11 Oct 11 Nov 11 Dec 11 Dec 10 change
Saudi Light & Extra LightNorth America 0.52 0.69 0.69 0.71 0.72 0.47 0.85 0.67 0.96 0.93 0.78 0.15Europe 0.59 0.66 0.83 0.70 0.79 0.93 0.88 0.90 0.89 0.84 0.63 0.21Pacific 1.28 1.21 1.24 1.33 1.14 1.21 1.27 1.22 1.26 1.35 1.27 0.07
Saudi MediumNorth America 0.40 0.36 0.37 0.33 0.36 0.40 0.40 0.35 0.44 0.42 0.36 0.05Europe 0.02 0.00 0.02 - 0.02 0.05 0.01 0.01 0.02 0.00 - -Pacific 0.34 0.34 0.40 0.39 0.38 0.43 0.40 0.33 0.46 0.42 0.32 0.10
Saudi HeavyNorth America 0.03 0.02 0.02 0.02 0.03 0.03 0.01 0.02 0.02 - 0.02 -Europe 0.02 0.00 0.01 0.00 0.00 0.03 0.03 0.02 0.03 0.03 - -Pacific 0.15 0.22 0.20 0.20 0.21 0.23 0.18 0.08 0.23 0.22 0.20 0.02
Iraqi Basrah Light2
North America 0.40 0.36 0.29 0.21 0.41 0.31 0.21 0.01 0.31 0.32 0.35 -0.03Europe 0.12 0.09 0.11 0.03 0.10 0.19 0.11 0.13 0.13 0.08 0.04 0.05Pacific 0.24 0.29 0.34 0.40 0.26 0.38 0.32 0.32 0.33 0.30 0.32 -0.01
Iraqi KirkukNorth America 0.06 0.03 0.07 0.11 0.07 0.05 0.06 0.03 0.03 0.11 0.06 0.05Europe 0.31 0.27 0.27 0.21 0.31 0.32 0.26 0.29 0.20 0.28 0.20 0.09Pacific - - - - - - - - - - - -
Iranian LightNorth America - - - - - - - - - - - -Europe 0.15 0.24 0.23 0.24 0.28 0.20 0.21 0.20 0.23 0.18 0.22 -0.03Pacific 0.07 0.04 0.04 0.06 0.03 0.04 0.03 0.02 0.02 0.05 0.02 0.03
Iranian Heavy3
North America - - - - - - - - - - - -Europe 0.40 0.49 0.55 0.34 0.59 0.73 0.54 0.58 0.60 0.46 0.43 0.03Pacific 0.57 0.52 0.51 0.63 0.41 0.51 0.49 0.51 0.48 0.46 0.57 -0.11
Venezuelan Light & MediumNorth America 0.39 0.14 0.18 0.06 0.30 0.24 0.13 0.32 0.06 - 0.13 -Europe 0.07 0.02 0.02 0.03 0.01 0.02 0.02 - 0.05 - - -Pacific - - - - - - - - - - - -
Venezuelan 22 API and heavierNorth America 0.75 0.86 0.76 0.89 0.77 0.70 0.69 0.68 0.74 0.64 0.74 -0.10Europe 0.07 0.06 0.05 0.04 0.05 0.06 0.05 0.04 0.05 0.06 0.05 0.01Pacific - - - - - - - - - - - -
Mexican MayaNorth America 0.93 0.91 0.82 0.82 0.80 0.84 0.84 0.84 0.89 0.78 0.88 -0.10Europe 0.10 0.11 0.12 0.14 0.12 0.12 0.12 0.11 0.11 0.13 0.05 0.08Pacific - - - - - - - - - - - -
Mexican IsthmusNorth America 0.01 0.04 0.07 0.05 0.08 0.06 0.07 0.07 0.07 0.07 0.10 -0.03Europe 0.01 0.02 0.01 0.01 0.02 0.00 0.01 0.01 - 0.03 0.02 0.02Pacific - - - - - - - - - - - -
Russian UralsNorth America 0.15 0.08 0.01 0.01 - - 0.02 0.05 - - 0.02 -Europe 1.72 1.80 1.69 1.76 1.87 1.52 1.62 1.57 1.64 1.66 1.96 -0.30Pacific - - - - - - - - - - - -
Nigerian Light4
North America 0.54 0.60 0.53 0.62 0.60 0.43 0.46 0.75 0.33 0.30 0.72 -0.42Europe 0.32 0.34 0.46 0.40 0.40 0.54 0.48 0.39 0.51 0.56 0.42 0.14Pacific 0.00 - 0.05 0.05 0.04 0.06 0.05 0.06 0.05 0.04 - -
Nigerian MediumNorth America 0.21 0.25 0.18 0.20 0.18 0.18 0.14 0.17 0.07 0.19 0.23 -0.05Europe 0.13 0.09 0.14 0.14 0.17 0.11 0.13 0.10 0.08 0.22 0.13 0.10Pacific - - - - - - - - - - - -
1 Data based on monthly submissions from IEA countries to the crude oil import register (in '000 bbl), subject to availability. May differ from Table 8 of the Report. IEA North America includes United States and Canada. IEA Europe includes all countries in OECD Europe except Hungary. The Slovak Republic and Poland is excluded through December 2007 but included thereafter. IEA Pacific data includes Australia, New Zealand, Korea and Japan.2 Iraqi Total minus Kirkuk.3 Iranian Total minus Iranian Light.4 33° API and lighter (e.g., Bonny Light, Escravos, Qua Iboe and Oso Condensate).

INTERNATIONAL ENERGY AGENCY ‐ OIL MARKET REPORT TABLES
14 MARCH 2012 65
Table 7 - Regional OECD Imports - Refined Product Yields Based on Total Input
Table 7REGIONAL OECD IMPORTS1,2
(thousand barrels per day)
Year Earlier2009 2010 2011 1Q11 2Q11 3Q11 4Q11 Oct-11 Nov-11 Dec-11 Dec-10 % change
Crude Oil North America 7353 7343 6703 6571 6928 6793 6519 6825 6381 6347 6324 0%Europe 8893 9072 8996 8857 8846 9331 8943 8804 9193 8841 9263 -5%Pacific 6082 6249 6369 6645 6086 6255 6493 6217 6436 6824 6659 2%
Total OECD 22329 22663 22067 22072 21860 22379 21955 21846 22010 22012 22536 -2%
LPGNorth America 13 8 8 20 4 4 3 6 2 1 2 -67%Europe 260 270 311 313 284 304 341 344 362 317 323 -2%Pacific 529 558 561 569 547 580 546 508 519 612 528 16%
Total OECD 802 836 879 903 836 888 890 858 882 930 853 9%
NaphthaNorth America 22 36 42 34 51 43 38 40 59 14 12 14%Europe 352 390 292 292 336 285 257 284 237 248 407 -39%Pacific 841 900 876 917 830 906 853 809 898 854 837 2%
Total OECD 1215 1326 1210 1243 1217 1234 1147 1133 1194 1116 1257 -11%
Gasoline3
North America 878 788 752 669 981 703 655 612 749 606 660 -8%Europe 193 174 216 223 221 216 203 193 265 153 193 -20%Pacific 96 64 73 71 61 70 90 83 86 101 62 62%
Total OECD 1167 1025 1040 963 1262 989 948 887 1101 860 915 -6%
Jet & KeroseneNorth America 62 76 73 62 86 81 64 65 96 31 60 -48%Europe 452 417 398 320 367 451 450 451 554 349 358 -3%Pacific 53 40 50 58 43 45 55 65 59 42 45 -6%
Total OECD 567 532 521 440 497 578 569 580 709 423 463 -9%
Gasoil/DieselNorth America 55 49 33 46 30 32 23 5 52 11 30 -63%Europe 1035 1045 1001 1078 931 934 1063 1155 1096 940 1081 -13%Pacific 87 97 129 99 153 123 140 146 117 156 93 68%
Total OECD 1177 1191 1163 1224 1114 1089 1226 1306 1266 1107 1205 -8%
Heavy Fuel OilNorth America 270 277 266 345 304 193 222 206 250 211 231 -8%Europe 534 529 579 505 582 651 576 657 548 522 542 -4%Pacific 113 117 146 147 111 156 169 142 184 182 102 79%
Total OECD 917 923 990 997 997 1001 967 1005 982 915 874 5%
Other ProductsNorth America 870 805 871 855 896 903 828 747 832 905 873 4%Europe 770 666 704 683 776 724 632 665 649 582 737 -21%Pacific 325 335 326 383 252 343 327 316 301 364 362 1%
Total OECD 1964 1807 1901 1921 1924 1970 1787 1728 1782 1851 1972 -6%
Total ProductsNorth America 2171 2038 2044 2033 2355 1960 1832 1681 2041 1780 1869 -5%Europe 3595 3491 3500 3415 3497 3566 3522 3748 3712 3111 3642 -15%Pacific 2045 2110 2161 2244 1995 2223 2181 2068 2164 2311 2029 14%
Total OECD 7810 7639 7705 7691 7847 7749 7535 7498 7917 7203 7539 -4%
Total OilNorth America 9524 9381 8747 8604 9283 8753 8351 8506 8421 8127 8483 -4%Europe 12488 12562 12496 12271 12344 12897 12465 12552 12905 11952 12905 -7%Pacific 8127 8360 8530 8888 8081 8478 8674 8285 8600 9135 8688 5%
Total OECD 30139 30302 29773 29764 29708 30128 29490 29344 29927 29215 30076 -3%1 Based on Monthly Oil Questionnaire data submitted by OECD countries in tonnes and converted to barrels. 2 Excludes intra-regional trade.3 Includes additives.

©© OOEECCDD//IIEEAA 22001122.. AAllll RRiigghhttss RReesseerrvveedd
The International Energy Agency (IEA) makes every attempt to ensure, but does not guarantee, the accuracy and completeness of the information or the clarity of content of the Oil Market Report (hereafter the OMR). The IEA shall not be liable to any party for any inaccuracy, error or omission contained or provided in this OMR or for any loss, or damage, whether or not due to reliance placed by that party on information in this OMR.
The Executive Director and Secretariat of the IEA are responsible for the publication of the OMR. Although some of the data are supplied by IEA Member‐country governments, largely on the basis of information they in turn receive from oil companies, neither these governments nor these oil companies necessarily share the Secretariat’s views or conclusions as expressed in the OMR. The OMR is prepared for general circulation and is distributed for general information only. Neither the information nor any opinion expressed in the OMR constitutes an offer, or an invitation to make an offer, to buy or sell any securities or any options, futures or other derivatives related to such securities.
This OMR is the copyright of the OECD/IEA and is subject to terms and conditions of use. These terms and conditions are available on the IEA website at http://www.iea.org/oilmar/licenceomr.html. In relation to the Subscriber Edition (as defined in the OMR's online terms and conditions), all Platts information is sourced from © 2012 Platts and is published here with the permission of Platts – a division of The McGraw‐Hill Companies, Inc. The spot crude and product price assessments are based on daily Platts prices, converted when appropriate to US$ per barrel according to the Platts specification of products. The graphs marked ‘Data Source: Platts analysis’ are also based on Platts data. Any reproduction of information from the spot crude and product price tables, or of the graphs marked ‘Data Source: Platts analysis’ requires the prior permission of Platts.
Next Issue: 12 April 2012
Editorial Enquiries Editor David Fyfe Head, Oil Industry and Markets Division (+33) 0*1 40 57 65 90
Demand Matt Parry (+33) 0*1 40 57 66 23
OPEC Supply/Prices Diane Munro (+33) 0*1 40 57 65 94
Non-OPEC Supply Michael Cohen (+33) 0*1 40 57 65 22
Oil Price Formation Bahattin Buyuksahin (+33) 0*1 40 57 65 93
Refining Toril Bosoni (+33) 0*1 40 57 67 18 [email protected]
OECD Stocks Jae Hyung Lee (+33) 0*1 40 57 68 30
Statistics /Trade/Freight Andrew Wilson (+33) 0*1 40 57 66 78
Editorial Assistant Esther Ha (+33) 0*1 40 57 65 96
Fax: (+33) 0*1 40 57 65 99 * 0 - only within France
Media Enquiries IEA Press Office (+33) 0* 1 40 57 65 54
User’s Guide and Glossary to the IEA Oil Market Report For information on the data sources, definitions, technical terms and general approach used in preparing the Oil Market Report (OMR), Medium-Term Oil and Gas Markets (MTOGM) and Annual Statistical Supplement (current issue of the Statistical Supplement dated 10 August 2011), readers are referred to the Users’ Guide at www.oilmarketreport.org/glossary.asp. It should be noted that the spot crude and product price assessments are based on daily Platts prices, converted when appropriate to US$ per barrel according to the Platts specification of products (© 2012 Platts - a division of The McGraw-Hill Companies, Inc.).
The Oil Market Report is published under the responsibility of the Executive Director and Secretariat of the International Energy Agency. Although some of the data are supplied by Member-country Governments, largely on the basis of information received from oil companies, neither governments nor companies necessarily share the Secretariat’s views or conclusions as expressed therein. © OECD/IEA 2012
Subscription and Delivery Enquiries Oil Market Report Subscriptions International Energy Agency BP 586-75726 PARIS Cedex 15, France (+33) 0* 1 40 57 67 72
[email protected] (+33) 0* 1 40 57 66 90