fully-automated left ventricular mass and volume mri … · the d13a version of the inlinevf...
TRANSCRIPT

Vol.:(0123456789)1 3
Int J Cardiovasc Imaging (2018) 34:281–291 DOI 10.1007/s10554-017-1225-9
ORIGINAL PAPER
Fully-automated left ventricular mass and volume MRI analysis in the UK Biobank population cohort: evaluation of initial results
Avan Suinesiaputra1 · Mihir M. Sanghvi2 · Nay Aung2 · Jose Miguel Paiva2 · Filip Zemrak2 · Kenneth Fung2 · Elena Lukaschuk3 · Aaron M. Lee2 · Valentina Carapella3 · Young Jin Kim3 · Jane Francis3 · Stefan K. Piechnik3 · Stefan Neubauer3 · Andreas Greiser4 · Marie-Pierre Jolly5 · Carmel Hayes4 · Alistair A. Young1 · Steffen E. Petersen2
Received: 28 April 2017 / Accepted: 5 August 2017 / Published online: 23 August 2017 © The Author(s) 2017. This article is an open access publication
end-diastolic volume (EDV), end-systolic volume (ESV), stroke volume (SV), ejection fraction (EF) and LV mass (LVM). Agreement between manual and InlineVF auto-mated analyses were evaluated using Bland–Altman analy-sis and the intra-class correlation coefficient (ICC). Tenfold cross-validation was used to establish a linear regression calibration between manual and InlineVF results. InlineVF D13A returned results in 4423 cases, whereas InlineVF E11C returned results in 4775 cases and also reported LVM. Rapid visual assessment of the E11C results found 178 cases (3.7%) with grossly misplaced contours or landmarks. In the remaining 4597 cases, LV function showed good agreement: ESV −6.4 ± 9.0 ml, 0.853 (mean ± SD of the differences, ICC) EDV −3.0 ± 11.6 ml, 0.937; SV 3.4 ± 9.8 ml, 0.855;
Abstract UK Biobank, a large cohort study, plans to acquire 100,000 cardiac MRI studies by 2020. Although fully-automated left ventricular (LV) analysis was performed in the original acquisition, this was not designed for unsuper-vised incorporation into epidemiological studies. We sought to evaluate automated LV mass and volume (Siemens syngo InlineVF versions D13A and E11C), against manual analy-sis in a substantial sub-cohort of UK Biobank participants. Eight readers from two centers, trained to give consistent results, manually analyzed 4874 UK Biobank cases for LV
Availability of data and material: The data will be made available on request from the UK Biobank within six months of publication.
* Alistair A. Young [email protected]
Avan Suinesiaputra [email protected]
Mihir M. Sanghvi [email protected]
Nay Aung [email protected]
Jose Miguel Paiva [email protected]
Filip Zemrak [email protected]
Kenneth Fung [email protected]
Elena Lukaschuk [email protected]
Aaron M. Lee [email protected]
Valentina Carapella [email protected]
Young Jin Kim [email protected]
Jane Francis [email protected]
Stefan K. Piechnik [email protected]
Stefan Neubauer [email protected]
Andreas Greiser [email protected]
Marie-Pierre Jolly [email protected]
Carmel Hayes [email protected]
Steffen E. Petersen [email protected]
1 Department of Anatomy and Medical Imaging, Faculty of Medical and Health Sciences, University of Auckland, 85 Park Road, Auckland 1142, New Zealand
282 Int J Cardiovasc Imaging (2018) 34:281–291
1 3
and EF 3.5 ± 5.1%, 0.586. Although LV mass was consist-ently overestimated (29.9 ± 17.0 g, 0.534) due to larger epicardial contours on all slices, linear regression could be used to correct the bias and improve accuracy. Automated InlineVF results can be used for case-control studies in UK Biobank, provided visual quality control and linear bias correction are performed. Improvements between InlineVF D13A and InlineVF E11C show the field is rapidly advanc-ing, with further improvements expected in the near future.
Keywords Ventricular function · Automated analysis · UK Biobank
AbbreviationsCMR Cardiovascular magnetic resonance imagingEDV End-diastolic volumeESV End-systolic volumeSV Stroke volumeEF Ejection fractionLV Left ventricularLVM Left ventricular massSSFP Steady state free precession
Introduction
UK Biobank is a large prospective cohort study designed to assess the determinants of diseases of middle and old age [1]. Initial data collection in 500,000 participants, including genetic, physical and functional measures, was completed in 2010. Participants will be followed for 20 years, enabling nested case-control studies to assess exposures and pre-existing characteristics in the development of disease and the effect of treatment. In 2013, an imaging extension was initiated with the goal of imaging 100,000 UK Biobank par-ticipants by 2020 [2]. The imaging studies include a 20 min cardiovascular magnetic resonance (CMR) examination, to assess cardiac phenotypes including ventricular function [3]. However, analysis of ventricular function parameters in 100,000 cases is impractical using current manual methods, which require drawing the ventricular boundaries at end-diastole (ED) and end-systole (ES) [4]. Also, manual assess-ment requires substantial training and is subject to inter-observer and inter-center variation [5]. Large-scale CMR
studies, such as UK Biobank, therefore present substantial challenges and opportunities for epidemiological analysis of cardiac phenotypes [6–9].
Recently, fully-automatic analyses of ventricular function are becoming available, with immediate application to large cohort studies [10–13]. In the UK Biobank CMR imaging examination, the Siemens syngo InlineVF (Siemens Health-care, Erlangen, Germany) fully automated analysis of left ventricular (LV) volume was performed during acquisition. This software automatically identifies LV landmarks at the LV base (mitral valve) and apex in long-axis cine acquisi-tions, locates endocardial and epicardial contours at ED and ES in each short-axis cine slice, and performs volume calcu-lations to determine ventricular function parameters (Fig. 1). However, the software was designed for supervised analysis with visual assessment for quality control in a clinical set-ting. Since these results are already available to research-ers as part of the initial UK Biobank CMR image dataset, their application to large cohort studies such as UK Biobank requires investigation. Although the D13A version was used in the initial automated analysis, a subsequent E11C version will also be made available. This paper compares the perfor-mance of these versions in the first 5,000 UK Biobank cases.
We sought firstly to evaluate the performance of auto-mated ventricular function analysis against a standard man-ual analysis, in a substantial sub-cohort of UK Biobank. The second objective was to correct for bias between the auto-mated and manual analyses to enable automated results to be used in future UK Biobank case-control studies.
Methods
Subjects
CMR examinations from the first 5065 UK Biobank imag-ing extension participants were assessed. All participants gave written informed consent and the appropriate institu-tional review boards approved the study protocol (National Research Ethics Service North West 11/NW/0382).
Imaging protocol
The full CMR protocol and rationale have been described in detail previously [3]. Briefly, all imaging was conducted on a 1.5 T scanner (MAGNETOM Aera, syngo MR D13A, Siemens Healthcare GmbH, Erlangen, Germany) using a phased-array cardiac coil. Ventricular function scans con-sisted of retrospectively gated cine balanced steady-state free precession breath-hold acquisitions performed in horizontal long axis, vertical long axis, left ventricular outflow tract orientations, as well as a complete short axis stack covering the left and right ventricles. Typical parameters were: TR/
2 William Harvey Research Institute, NIHR Cardiovascular Biomedical Research Centre at Barts, Queen Mary University of London, Charterhouse Square, London EC1M 6BQ, UK
3 Division of Cardiovascular Medicine, Radcliffe Department of Medicine, University of Oxford, Oxford, UK
4 Siemens Healthcare GmbH, Erlangen, Germany5 Siemens Medical Solutions USA, Inc., Princeton, NJ, USA

283Int J Cardiovasc Imaging (2018) 34:281–291
1 3
TE = 2.6/1.1 ms, flip angle 80°, GRAPPA factor 2, voxel size 1.8 × 1.8 × 8 mm3 (6 mm for long axis). The actual temporal resolution of 32 ms was interpolated to 50 phases per cardiac cycle (~20 ms).
Manual analysis
Manual analysis of LV volumes and mass were performed in accordance with the Society of Cardiovascular Magnetic
Resonance recommendations [4]. Eight readers in two core laboratories were trained according to standard operating procedures prior to study commencement, to ensure mini-mal inter-observer bias. CMR examinations were analysed using cvi42 post-processing software (Version 5.1.1, Circle Cardiovascular Imaging Inc., Calgary, Canada). The ED frame was selected as the first frame of the series and the ES frame was selected as the smallest LV blood pool area in the mid-ventricular slice. At both ED and ES, the most basal
Fig. 1 a InlineVF results for a typical case with good agreement for volume (<5 ml for EDV and ESV) but overestimation of mass (61 g) compared with manual analysis. b InlineVF results for a case with
relatively large discrepancy between manual and inlineVF results (30 ml in EDV). Contours show errors at the base slice
284 Int J Cardiovasc Imaging (2018) 34:281–291
1 3
slice included had at least 50% of the LV blood pool sur-rounded by myocardium. Papillary muscles were included in the blood pool. Inter-observer errors were quantified in 50 randomly selected cases. The software provided ED and ES volume (EDV, ESV respectively), ejection fraction (EF), stroke volume (SV) and mass (LVM). LVM was calculated assuming a myocardial density of 1.05 g/ml.
InlineVF
The D13A version of the InlineVF analysis algorithm was performed as part of the image acquisition and results stored as a separate DICOM image series as part of the image data for each case. The InlineVF algorithm has been described previously [10, 14, 15]. Briefly, shortest path algorithms were used to determine epicardial and endocardial contours that were propagated to other frames and used in other slices as a geometric prior. All frames were segmented in each slice using an inverse consistent deformable registration to register all frames to the first frame. The segmentation was propagated to other frames through the forward and back-ward deformation fields. The long axis slices were used to detect basal and apical landmarks using machine learning methods [15]. These landmarks were used to define a base plane approximation at the level of the mitral valve, which was used to cut contours to avoid inclusion of atrial vol-ume in the ventricle. Papillary muscles were included in the blood pool. LV volumes and mass were calculated by slice summation, with a correction for the location of the base plane. LVM was calculated by assuming a myocardial den-sity of 1.05 g/ml. In this paper we used the LVM calculated at ED for both InlineVF and manual estimates.
A subsequent release of the software, version E11C, was applied retrospectively in a batch-processing mode proto-type. The E11C version provided an estimate of LVM cal-culated from the epicardial contours, whereas the D13A ver-sion did not. Other changes incorporated in E11C included a refined detection of the LV blood pool: In addition to the detection of the heart based on a Fourier transform over time to detect moving objects, RV insert points were also detected to derive a blood pool feature point. Thresholded connected components were then clustered across slices to recover the blood pool, using information about the location of the con-nected component with respect to the blood pool point as an additional feature in the clustering algorithm. The batch-processing prototype was implemented on a Windows 7 workstation using Python and Windows Batch scripts. The input was the directory containing DICOM images for an entire study and the output was the LV mass and volume.
Outliers with EDV or ESV > 500 ml in the automated results were rejected as unphysiological. For the E11C results, a rapid visual assessment of resulting contours was also performed. Algorithm failures were identified if the
InlineVF contours were grossly erroneous (e.g. contouring of organs other than the LV) or identification of the land-marks or LV base plane was grossly incorrect or absent.
Statistics
Agreement was assessed by Bland–Altman analysis of bias (mean difference) and precision (standard deviations of the differences), 95% limits of agreement, and two-way random single measures intra-class correlation coefficient (ICC) for agreement (i.e. including systematic differences) [16]. The Levene test was used to test for differences in preci-sion. Significant differences were defined at p < 0.05. Linear regression was performed to determine a correction between manual and InlineVF parameters. The correction parameters were assessed using Monte Carlo cross-validation [17]. The dataset was randomly divided into 90% training and 10% test cases, and prediction errors calculated in the test cases using the linear correction derived from the training cases. The resulting prediction errors were averaged for 500 trials. Statistical analysis was performed using R (version 3.3.2) statistical software [18].
Results
A total of 5065 consecutive UK Biobank CMR examina-tions were evaluated. Of these, 191 cases had either CMR data of insufficient quality for manual LV analysis or the CMR identifier could not be matched with the UK Biobank identifier. Manual LV analysis was performed in the remain-ing 4874 cases. Table 1 shows participant demographics. Typical inter-observer errors quantified in 50 cases were −2.2 ± 4.7 ml for EDV, −2.4 ± 4.7 ml for ESV, 0.53 ± 5.8 ml for SV, 2.7 ± 6.6% for EF, 1.9 ± 6.5 g for LVM.
InlineVF D13A results were obtained in 4423 cases (9% failure rate). However, several cases returned erroneous vol-umes due to gross failures of the algorithm to detect LV features. Some of these cases could be readily identified as unphysiological EDV or ESV. However, many cases could not be automatically identified as failures from the volumes alone. Excluding the 10 cases with EDV or ESV > 500 ml as implausible, and so outliers for this cohort, comparisons between manual and automated results in the remaining 4413 cases are shown in Table 2. Bias (mean differences) were small but standard deviations of the differences were relatively large, leading to wide limits of agreement.
InlineVF E11C results were obtained in 4775 cases (2% failure rate). Excluding the 101 cases with EDV or ESV > 500 ml, comparisons between manual and automated results in the remaining 4674 cases are shown in Table 3. Biases were again small and precision in EDV and ESV was
285Int J Cardiovasc Imaging (2018) 34:281–291
1 3
somewhat improved (p < 0.05) over the D13A version. LVM showed consistent overestimation relative to manual results.
Rapid visual assessment of the 4775 InlineVF E11C con-tours and landmarks found 178 cases with gross errors in automated contour or landmark placement (36 in contours only, 46 in the landmarks only, and 96 in both contours and landmarks). Results for the remaining 4597 cases (6% total failure rate) are shown in Table 4. The precision in the EDV, ESV, SV and EF estimates were considerably improved (all p < 0.05), whereas LVM precision (p = 0.12) was unaffected, compared with Table 3.
Figure 1a shows an example of InlineVF E11C results for a typical case with good agreement for volume (<5 ml for EDV and ESV) but overestimation of mass (61 g) compared with manual analysis. This shows some errors in contour placement for the basal slice, but the difference in LVM was mainly due to consistently larger epicardial contours for all slices. Figure 1b shows a case with a relatively large discrepancy between manual and InlineVF results (30 ml in EDV). This case illustrates good contours for most slices, except for the basal slice. Figure 2a shows a case that was classified as a failure by visual inspection. The algorithm in this case has detected both ventricles as the LV. Figure 2b shows another case classified as a failure, but with errors at the basal and apical slices only.
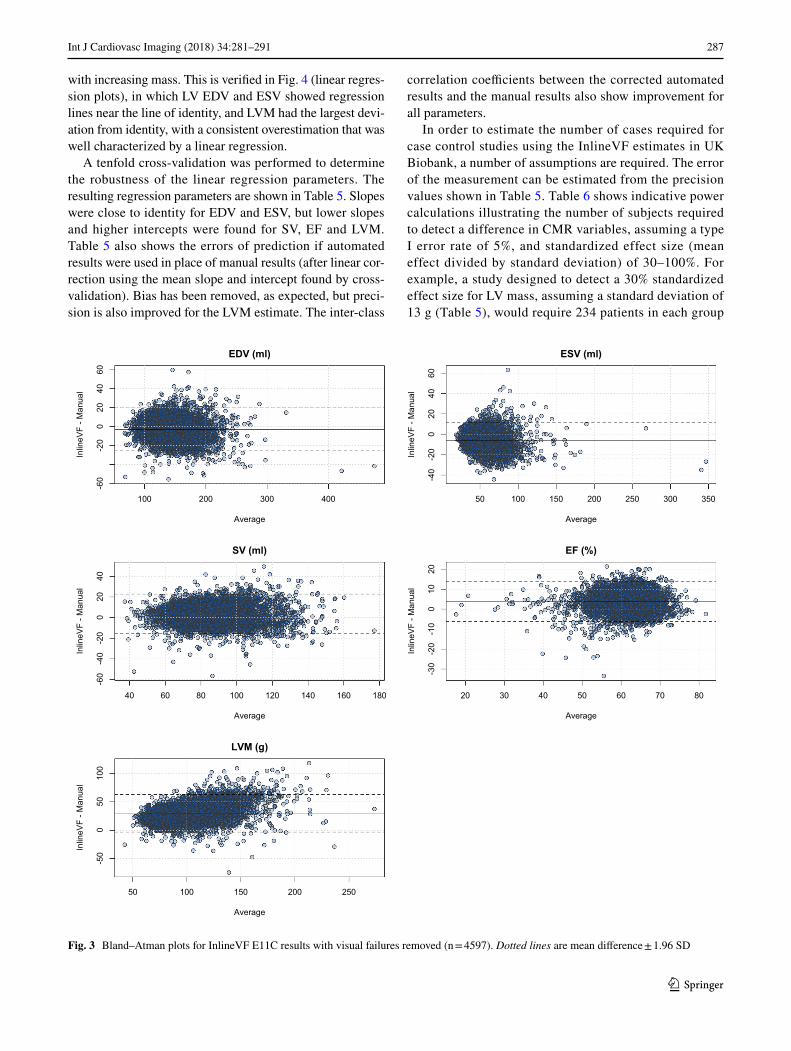
Figure 3 shows Bland–Altman plots for ventricular func-tion parameters and LV mass for the InlineVF E11C results with visual failures removed (n = 4597). LVM showed a con-sistent overestimation with the InlineVF results, increasing
Table 1 Participant characteristics
All continuous values are reported in mean ± standard deviation (SD), while categories are reported in number (percentage)a Angina, myocardial infarction, heart failure/pulmonary oedema, arrhythmia, cardiomyopathy, atrial fibrillation, stroke, ischaemic stroke, transient ischaemic attack, peripheral vascular diseaseb Asthma, chronic obstructive airways disease, emphysema/chronic bronchitis, bronchiectasis, interstitial lung disease, asbestosis, pulmo-nary fibrosis, fibrosing alveolitis/unspecified alveolitis, sleep apnoea, respiratory failure;c Renal failure, renal failure requiring dialysis, diabetic nephropathy
n 4874Age (years) 62 ± 8Male 2313 (48%)Caucasian ethnicity 4728 (97%)Weight (kg) 76 ± 15Height (cm) 170 ± 9Body mass index (kg/m2) 26 ± 4Body surface area (m2) 1.86 ± 0.21Systolic blood pressure (mmHg) 137 ± 18Diastolic blood pressure (mmHg) 79 ± 10Heart Rate (bpm) 70 ± 12Use of anti-hypertensive, lipid-lowering medications or
insulin1593 (33%)
Diabetes 256 (5%)Cardiovascular diseasesa 401 (8%)Respiratory diseasesb 805 (17%)Renal diseasesc 12 (0.2%)
Table 2 Comparison of manual and inlineVF D13A results, n = 4413
Values are mean ± SD. Unphysiological cases were removed
EDV (ml) ESV (ml) SV (ml) EF (%)
Manual 144.0 ± 34.3 59.2 ± 20.3 84.9 ± 19.2 59.4 ± 6.4InlineVF D13A 139.9 ± 37.5 62.3 ± 25.8 77.6 ± 18.2 56.1 ± 6.5Differences −4.2 ± 21.6 3.1 ± 19.0 −7.3 ± 10.9 −3.3 ± 6.0Limits of agreement (−46.6, 38.2) (−34.1, 40.4) (−28.7, 14.0) (−15.0,
8.5)R2 0.676 0.466 0.692 0.318ICC 0.813 0.658 0.772 0.499
Table 3 Comparison of manual and inlineVF E11C results, n = 4674
Values are mean ± SD. Unphysiological cases were removed
EDV (ml) ESV (ml) SV (ml) EF (%) LVM (g)
Manual 144.3 ± 34.3 59.4 ± 20.4 85.0 ± 19.3 59.3 ± 6.4 89.7 ± 24.8InlineVF E11C 141.8 ± 35.0 53.7 ± 22.8 88.1 ± 19.9 62.7 ± 7.3 119.2 ± 32.5Differences −2.5 ± 17.4 −5.6 ± 16.0 3.1 ± 11.0 3.4 ± 6.2 29.5 ± 17.8Limits of agreement (−36.6, 31.5) (−37.0, 25.7) (−18.4, 24.7) (−8.8, 15.6) (−5.4, 64.4)R2 0.765 0.535 0.771 0.348 0.705ICC 0.872 0.703 0.832 0.521 0.533

286 Int J Cardiovasc Imaging (2018) 34:281–291
1 3
Table 4 Comparison of manual and inlineVF E11C Results, n = 4597
Values are mean ± SD. Visually assessed failures were removed
EDV (ml) ESV (ml) SV (ml) EF (%) LVM (g)
Manual 144.5 ± 34.3 59.4 ± 20.5 85.1 ± 19.2 59.3 ± 6.4 89.8 ± 24.8InlineVF E11C 141.5 ± 33.1 53.1 ± 19.3 88.4 ± 19.1 63.0 ± 6.4 119.7 ± 32.0Differences −3.0 ± 11.6 −6.4 ± 9.0 3.4 ± 9.8 3.5 ± 5.1 29.9 ± 17.0Limits of agreement (−25.7, 19.7) (−24.1, 11.3) (−15.9, 22.7) (−6.3, 13.7) (−3.4, 63.2)R2 0.887 0.807 0.754 0.466 0.725ICC 0.937 0.853 0.855 0.586 0.534
Fig. 2 InlineVF results for two cases classified as failure by visual inspection. a Base landmarks incorrect and LV contours cover both ventri-cles. b LV contours show gross errors at the base and apex
287Int J Cardiovasc Imaging (2018) 34:281–291
1 3
with increasing mass. This is verified in Fig. 4 (linear regres-sion plots), in which LV EDV and ESV showed regression lines near the line of identity, and LVM had the largest devi-ation from identity, with a consistent overestimation that was well characterized by a linear regression.
A tenfold cross-validation was performed to determine the robustness of the linear regression parameters. The resulting regression parameters are shown in Table 5. Slopes were close to identity for EDV and ESV, but lower slopes and higher intercepts were found for SV, EF and LVM. Table 5 also shows the errors of prediction if automated results were used in place of manual results (after linear cor-rection using the mean slope and intercept found by cross-validation). Bias has been removed, as expected, but preci-sion is also improved for the LVM estimate. The inter-class
correlation coefficients between the corrected automated results and the manual results also show improvement for all parameters.
In order to estimate the number of cases required for case control studies using the InlineVF estimates in UK Biobank, a number of assumptions are required. The error of the measurement can be estimated from the precision values shown in Table 5. Table 6 shows indicative power calculations illustrating the number of subjects required to detect a difference in CMR variables, assuming a type I error rate of 5%, and standardized effect size (mean effect divided by standard deviation) of 30–100%. For example, a study designed to detect a 30% standardized effect size for LV mass, assuming a standard deviation of 13 g (Table 5), would require 234 patients in each group
100 200 300 400
-60
-20
020
4060
EDV (ml)
Average
Inlin
eVF
- Man
ual
50 100 150 200 250 300 350
-40
-20
020
4060
ESV (ml)
Average
Inlin
eVF
- Man
ual
40 60 80 100 120 140 160 180
-60
-40
-20
020
40
SV (ml)
Average
Inlin
eVF
- Man
ual
20 30 40 50 60 70 80
-30
-20
-10
010
20
EF (%)
Average
Inlin
eVF
- Man
ual
50 100 150 200 250
-50
050
100
LVM (g)
Average
Inlin
eVF
- Man
ual
Fig. 3 Bland–Atman plots for InlineVF E11C results with visual failures removed (n = 4597). Dotted lines are mean difference ± 1.96 SD

288 Int J Cardiovasc Imaging (2018) 34:281–291
1 3
to detect of a mean change of 4 g (30% of 13 g) with 90% power. However, additional variation is likely due to variability in the manual results and intrinsic biological variability.
Discussion
Fully automated image analysis methods are desirable for large cohort studies such as UK Biobank, due to the com-plex nature of image analysis and the requirement for large numbers of cases. Automated analysis tools for LV func-tion are now becoming more widely available, for a recent
Fig. 4 Linear regression plots the InlineVF E11C results with visual failures removed (n = 4597). Solid line is the linear regression; dotted line is the line of identity
0 100 200 300 400 5000
100
200
300
400
500
EDV (ml)
InlineVF
Man
ual
0 50 100 150 200 250 300 350
050
100
150
200
250
300
350
ESV (ml)
InlineVF
Man
ual
0 50 100 150
050
100
150
SV (ml)
InlineVF
Man
ual
0 20 40 60 800
2040
6080
EF (%)
InlineVF
Man
ual
0 50 100 150 200 250 300
050
100
150
200
250
300
LVM (g)
InlineVF
Man
ual

289Int J Cardiovasc Imaging (2018) 34:281–291
1 3
review see [11]; however, most studies have reported limited numbers of cases. An open benchmark challenge compari-son of fully-automated and semi-automated methods in 95 cases showed that the fully-automated Siemens InlineVF algorithm performed as well as semi-automated methods [10]. More recently, automated methods have been reported in studies with over 1000 participants [13, 19].
The Siemens InlineVF analysis tool was one of the first fully automated LV analysis methods commercially avail-able on standard scanners [20, 21], and the D13 version was enabled for the initial UK Biobank imaging acquisitions and these results are available to researchers as part of the initial image dataset. However, this tool was designed for clinical review in association with visual inspection of results, as required by regulatory and certification bodies. Application to epidemiological research studies such as UK Biobank is therefore unclear. In this study, we report the largest evalua-tion of a fully-automated LV analysis algorithm performed to date, to our knowledge. Improvements with the E11C ver-sion of InlineVF as well as LVM quantification, using visual inspection and linear bias correction, are demonstrated.
Although the detection failure rate was considerably improved in the E11C version, a review of remaining failures highlighted some conditions where misdetection was more likely. Firstly, the aorta can appear very bright and pulsate strongly in some cases, leading to mis-detection of the left ventricular blood pool. Secondly, the whole heart (left and right ventricles) may be detected as the left ventricle if the contrast between blood and myocardium is weak, or if there is some blurring due to irregular heart rate or breathing. Thirdly, the algorithm can fail if the gray level distributions of the different regions (blood, myocardium, lungs, partial
voluming) cannot be modeled correctly due to unexpected intensities and contrast in the images. To some extent, such failures could be mitigated by re-acquisition with better breath-holds, adjusted slice positioning, or arrhythmia rejec-tion. However, in the context of large cohort studies such as UK Biobank, it is not desirable to expend a large effort to achieve a 100% success rate, since a small number of drop-outs can be accommodated.
The best precision (standard deviation of the differences) obtainable was about twice that of the manual inter-observer precision for EDV and ESV, and over three times for LVM. However, the technology of automated image analysis is cur-rently advancing at a rapid pace, with new developments in machine learning (e.g. deep convolutional neural networks) showing considerable promise [22]. Therefore, we expect that improvements in algorithms will lead to improved preci-sion, leading to a reduction in the number of cases required for case-control studies.
Limitations of the study include the visual assessment required to detect algorithm failures. Although this is fast on a case-by-case basis, review of many thousands of cases is time-consuming. In the future it would be useful to auto-matically assess the quality of the analysis, for example to automatically flag failures, or give an uncertainty in the esti-mate. Some failures could be detected simply by implau-sibly large or small LV volumes (as in Fig. 2a). However this is not possible for the case in Fig. 2b, a more complex method is required. It may be possible to detect such fail-ures using machine learning methods, which would in turn lead to better performance of the original detection. This is an active area of further study. Another area of future research is the correction of breath-hold misregistration.
Table 5 Linear regression results (Monte Carlo cross-validation)
Corrected errors are mean differences and standard deviation of differences between manual and corrected InlineVF values (using the average linear regression model from cross-validation). Similarly corrected ICC uses the corrected InlineVF values
Slope Intercept Corrected errors Corrected ICC
EDV 0.975 ± 0.003 6.53 ± 0.36 ml 0.0 ± 11.54 ml 0.940ESV 0.954 ± 0.004 8.79 ± 0.22 ml 0.0 ± 8.99 ml 0.893SV 0.870 ± 0.003 8.13 ± 0.26 ml 0.0 ± 9.52 ml 0.859EF 0.682 ± 0.005 16.34 ± 0.30% 0.0 ± 4.68% 0.636LVM 0.660 ± 0.003 10.84 ± 0.29 g 0.0 ± 13.01 g 0.841
Table 6 Example power calculations showing number of cases (in each group) required to detect a difference in CMR variables between two groups of equal sizes
Significance level is 0.05, and a two-sided t test is assumed. Standardized effect sizes of 30, 60 and 100% are shown
Power 80% 90%
Effect size 30% 60% 100% 30% 60% 100%n 175 45 17 234 59 22
290 Int J Cardiovasc Imaging (2018) 34:281–291
1 3
The long axis slices were used to determine a basal cut-off plane below which volume was included in the ventricle. Inconsistent breath-holding can influence the position of this plane. Although the base plane is an average of all the long axis slices, and is therefore robust to moderate breath-hold misregistation, future methods will enable better registration of the short and long axis slices.
Another potential limitation was that the manual results were treated as correct for all calculations. It is known that the manual contouring can show bias between cent-ers due to differences in training [5]. Suinesiaputra et al. [5] provided a consensus dataset of 15 cases derived from analyses from seven independent centers for benchmark-ing purposes. Readers from the current study also ana-lyzed these cases, resulting in typical consensus errors of EDV = −6.72 ± 12.03 ml; ESV = −3.58 ± 12.75 ml; EF = −0.72 ± 3.51%; LVM = −1.28 ± 11.96 g. Thus, the manual results of the current study are in good agreement with pre-vious studies and other centers. Another source of poten-tial error is the choice of ED and ES frames, since this was assessed manually by visual inspection of the mid-ventric-ular slice. The automatic algorithm, in contrast, computed volume for all frames and reported the maximum and mini-mum volumes. Future studies should investigate the perfor-mance of different vendor’s software and quantify differ-ences between methods.
Conclusions
Automated InlineVF results provided in UK Biobank can be used for case-control studies, provided visual assessment for quality control and linear adjustment of bias are per-formed. Further improvements in performance are expected in the near future with rapid advances in automated analysis technologies.
Acknowledgements This research has been conducted using the UK Biobank Resource under application 2964. Funding was provided by British Heart Foundation (PG/14/89/31194), and by the National Institutes of Health (USA) 1R01HL121754. SN, SKP acknowledge the National Institute for Health Research (NIHR) Oxford Biomedi-cal Research Centre based at The Oxford University Hospitals Trust at the University of Oxford, and the British Heart Foundation Centre of Research Excellence. Aaron Lee and Steffen Petersen acknowledge support from the NIHR Biomedical Research Centre at Barts Health NHS Trust and from the “SmartHeart” EPSRC programme grant (EP/P001009/1).
Compliance with ethical standards
Conflict of interest AAY reports receiving consulting fees from Sie-mens Healthcare. AG, MPJ, CH are employees of Siemens Healthcare. SEP reports receiving consulting fees from Circle Cardiovascular Im-aging, Inc., Calgary, Canada.
Ethical Approval All human studies were approved by the appropri-ate ethics committees and have therefore been performed in accord-ance with the ethical standards laid down in the 1964 Declaration of Helsinki and its later amendments. All persons gave their informed consent prior to their inclusion in the study. Details that might disclose the identity of the subjects under study have been omitted.
Open Access This article is distributed under the terms of the Creative Commons Attribution 4.0 International License (http://crea-tivecommons.org/licenses/by/4.0/), which permits unrestricted use, distribution, and reproduction in any medium, provided you give appro-priate credit to the original author(s) and the source, provide a link to the Creative Commons license, and indicate if changes were made.
References
1. Sudlow C, Gallacher J, Allen N, Beral V, Burton P, Danesh J, Downey P, Elliott P, Green J, Landray M, Liu B, Matthews P, Ong G, Pell J, Silman A, Young A, Sprosen T, Peakman T, Collins R (2015) UK Biobank: an open access resource for identifying the causes of a wide range of complex diseases of middle and old age. PLoS Med 12(3):e1001779. doi:10.1371/journal.pmed.1001779
2. Petersen SE, Matthews PM, Bamberg F, Bluemke DA, Francis JM, Friedrich MG, Leeson P, Nagel E, Plein S, Rademakers FE, Young AA, Garratt S, Peakman T, Sellors J, Collins R, Neubauer S (2013) Imaging in population science: cardiovascular magnetic resonance in 100,000 participants of UK Biobank—rationale, challenges and approaches. J Cardiovasc Magn Reson 15(1):46
3. Petersen SE, Matthews PM, Francis JM, Robson MD, Zemrak F, Boubertakh R, Young AA, Hudson S, Weale P, Garratt S, Collins R, Piechnik S, Neubauer S (2016) UK Biobank’s cardiovascular magnetic resonance protocol. J Cardiovasc Magn Reson 18:8. doi:10.1186/s12968-016-0227-4
4. Schulz-Menger J, Bluemke DA, Bremerich J, Flamm SD, Fogel MA, Friedrich MG, Kim RJ, von Knobelsdorff-Brenkenhoff F, Kramer CM, Pennell DJ, Plein S, Nagel E (2013) Standardized image interpretation and post processing in cardiovascular mag-netic resonance: Society for Cardiovascular Magnetic Resonance (SCMR) board of trustees task force on standardized post process-ing. J Cardiovasc Magn Reson 15:35
5. Suinesiaputra A, Bluemke DA, Cowan BR, Friedrich MG, Kramer CM, Kwong R, Plein S, Schulz-Menger J, Westenberg JJ, Young AA, Nagel E (2015) Quantification of LV function and mass by cardiovascular magnetic resonance: multi-center variability and consensus contours. J Cardiovasc Magn Reson 17(1):63. doi:10.1186/s12968-015-0170-9
6. Medrano-Gracia P, Cowan BR, Suinesiaputra A, Young AA (2015) Challenges of cardiac image analysis in large-scale pop-ulation-based studies. Curr Cardiol Rep 17(3):563. doi:10.1007/s11886-015-0563-2
7. Rueckert D, Glocker B, Kainz B (2016) Learning clinically useful information from images: past, present and future. Med Image Anal 33:13–18. doi:10.1016/j.media.2016.06.009
8. Frangi AF, Taylor ZA, Gooya A (2016) Precision Imaging: more descriptive, predictive and integrative imaging. Med Image Anal 33:27–32. doi:10.1016/j.media.2016.06.024
9. Suinesiaputra A, McCulloch AD, Nash MP, Pontre B, Young AA (2016) Cardiac image modelling: breadth and depth in heart disease. Med Image Anal 33:38–43. doi:10.1016/j.media.2016.06.027
10. Suinesiaputra A, Cowan BR, Al-Agamy AO, AlAttar MA, Ayache N, Fahmy AS, Khalifa AM, Medrano-Gracia P, Jolly MP, Kadish AH, Lee DC, Margeta J, Warfield SK, Young AA (2014) A
291Int J Cardiovasc Imaging (2018) 34:281–291
1 3
collaborative resource to build consensus for automated left ven-tricular segmentation of cardiac MR images. Med Image Anal 18(1):50–62
11. Peng P, Lekadir K, Gooya A, Shao L, Petersen SE, Frangi AF (2016) A review of heart chamber segmentation for structural and functional analysis using cardiac magnetic resonance imaging. MAGMA 29(2):155–195. doi:10.1007/s10334-015-0521-4
12. Lu YL, Connelly KA, Dick AJ, Wright GA, Radau PE (2013) Automatic functional analysis of left ventricle in cardiac cine MRI. Quant Imaging Med Surg 3(4):200–209. doi:10.3978/j.issn.2223-4292.2013.08.02
13. Corden B, de Marvao A, Dawes TJ, Shi W, Rueckert D, Cook SA, O’Regan DP (2016) Relationship between body composition and left ventricular geometry using three dimensional cardiovas-cular magnetic resonance. J Cardiovasc Magn Reson 18(1):32. doi:10.1186/s12968-016-0251-4
14. Jolly MP, Guetter C, Lu X, Xue H, Guehring J (2013) Auto-matic segmentation of the myocardium in cine MR images using deformable registration. In: Camara O, Mansi T, Pop M, Rhode K, Sermesant M, Young AA (eds) Statistical atlases and compu-tational models of the heart. Imaging and modelling challenges. Lecture Notes in Computer Science, Springer, Berlin, pp 98–108
15. Lu X, Georgescu B, Jolly MP, Guehring J, Young A, Cowan B, Littmann A, Comaniciu D (2010) Cardiac anchoring in MRI through context modeling. Med Image Comput Comput Assist Interv 13(Pt 1):383–390
16. Hallgren KA (2012) Computing inter-rater reliability for obser-vational data: an overview and tutorial. Tutor Quant Methods Psychol 8(1):23–34
17. Shao J (1993) Linear model selection by cross-validation. J Amer Statistical Assoc 88(422):486–494
18. R Team (2014) R: A language and environment for statistical com-puting. http://www.R-project.org/
19. de Marvao A, Dawes TJ, Shi W, Durighel G, Rueckert D, Cook SA, O’Regan DP (2015) Precursors of hypertensive heart pheno-type develop in healthy adults: a high-resolution 3D MRI study. JACC 8(11):1260–1269. doi:10.1016/j.jcmg.2015.08.007
20. Theisen D, Sandner TA, Bauner K, Hayes C, Rist C, Reiser MF, Wintersperger BJ (2009) Unsupervised fully automated inline analysis of global left ventricular function in CINE MR imaging. Invest Radiol 44(8):463–468. doi:10.1097/RLI.0b013e3181aaf429
21. Lin K, Collins JD, Lloyd-Jones DM, Jolly MP, Li D, Markl M, Carr JC (2016) Automated assessment of left ventricular func-tion and mass using heart deformation analysis: initial experience in 160 older adults. Acad Radiol 23(3):321–325. doi:10.1016/j.acra.2015.10.020
22. Avendi MR, Kheradvar A, Jafarkhani H (2016) A combined deep-learning and deformable-model approach to fully automatic seg-mentation of the left ventricle in cardiac MRI. Med Image Anal 30:108–119. doi:10.1016/j.media.2016.01.005