fully automated structure determinations of the fes sh2 domain using different sets of nmr spectra
TRANSCRIPT

MAGNETIC RESONANCE IN CHEMISTRYMagn. Reson. Chem. 2006; 44: S83–S88Published online in Wiley InterScience (www.interscience.wiley.com). DOI: 10.1002/mrc.1813
Fully automated structure determinations of the FesSH2 domain using different sets of NMR spectra
Anna Scott, Blanca Lopez-Mendez and Peter Guntert∗
Tatsuo Miyazawa Memorial Program, RIKEN Genomic Sciences Center, 1-7-22 Suehiro, Tsurumi, Yokohama 230-0045, Japan
Received 13 December 2005; Revised 17 February 2006; Accepted 28 February 2006
The recently introduced fully automated protein NMR structure determination algorithm (FLYA) yields,without any human intervention, a three-dimensional (3D) protein structure starting from a set of two-and three-dimensional NMR spectra. This paper investigates the influence of reduced sets of experimentalspectra on the quality of NMR structures obtained with FLYA. In a case study using the Src homologydomain 2 from the human feline sarcoma oncogene Fes (Fes SH2), five reduced data sets selected from thefull set of 13 three-dimensional spectra of the previously determined conventional structure were usedto calculate the protein structure. Three reduced data sets utilized only CBCA(CO)NH and CBCANH forthe backbone assignments and two data sets used only CBCA(CO)NH. All, some, or none of the fiveoriginal side-chain assignment spectra were used. Results were compared with those of a FLYA calculationfor the complete set of spectra and those of the conventionally determined structure. In four of the fivecases tested, the three-dimensional structures deviated by less than 1.3 A in backbone RMSD from theconventionally determined Fes SH2 reference structure, showing that the FLYA algorithm is remarkablystable and accurate when used with reduced sets of input spectra. Copyright 2006 John Wiley & Sons,Ltd.
KEYWORDS: NMR; 1H; 15N; 13C; Fes SH2; protein structure; automated assignment; CYANA; FLYA
INTRODUCTION
Until recently it was not possible to determine an NMRprotein structure without manual analysis of the data andchemical shift assignments, although many computationalapproaches have been introduced either to support theinteractive analysis by visualization and book-keeping, orto provide automation for specific parts of an NMR structuredetermination.1 – 4 Automated procedures are now widelyaccepted, e.g. for the assignment of NOE distance restraintsand the structure calculations.3 – 7 Present systems designedto handle the whole NMR structure determination process,however, generally require certain human interventions.3,7
The recently introduced fully automated protein NMRstructure determination algorithm (FLYA) is a significantadvancement because it can solve NMR protein structuresby purely computational means using only the primarystructure and processed NMR spectra as the input. (Lopez-Mendez B, Guntert P. J. Am. Chem. Soc. Submitted) TheFLYA algorithm can decrease significantly the time requiredto determine a protein structure. This is particularly valuablefor NMR-based structural genomics initiatives where a largenumber of structures need to be solved as quickly andefficiently as possible. Depending on the characteristicsof the protein whose structure is being solved, different
ŁCorrespondence to: Peter Guntert, RIKEN Genomic SciencesCenter, 1-7-22 Suehiro, Tsurumi, Yokohama 230-0045, Japan.E-mail: [email protected]
NMR spectra can be used for structure determination. FLYAhas been tested successfully for three 12–16 kDa proteins,including the Src homology domain 2 from the human felinesarcoma oncogene Fes (Fes SH2).8 Because there is no uniquestandard set of experiments for structure determination,it is desirable to understand the limitations of the FLYAalgorithm when used with a reduced number of NMRspectra. Additionally, being able to calculate good qualitystructures with a minimum number of experiments would beadvantageous to researchers. The Fes SH2 domain structure(PDB code 1WQU) was originally solved by manual chemicalshift assignment and automated NOE assignment with theprogram CYANA.8,9 Here we use the NMR spectra availablefrom the conventional structure determination of the FesSH2 protein to calculate protein structures on the basis ofreduced numbers of experiments.
EXPERIMENTAL
Computational methodsThe FLYA algorithm was used to generate the Fes SH2protein structures. This method will be described in detailelsewhere. (Lopez-Mendez B, Guntert P. J. Am. Chem. Soc.Submitted) In brief, the algorithm uses as input data onlythe protein sequence and multidimensional NMR spectra.Peaks are identified in the multidimensional NMR spectrausing the automated peak picking algorithm of NMRView,10
and the peak lists are prepared by CYANA.4,11 Dependingon the spectra, the preparation included unfolding aliased
Copyright 2006 John Wiley & Sons, Ltd.

S84 A. Scott, B. Lopez-Mendez and P. Guntert
signals, systematic correction of chemical shift referencing,and removal of peaks near the diagonal or water lines.The peak lists resulting from this step remained invariablethroughout the rest of the procedure. An ensemble of initialchemical shift assignments was obtained by multiple runsof a modified version of the GARANT algorithm12,13 withdifferent seed values for the random number generator.14
The peak position tolerance was set to 0.03 ppm for the 1Hdimensions and to 0.4 ppm for the 13C and 15N dimensions.These initial chemical shift assignments were consolidatedby CYANA into a single consensus chemical shift list. Theconsensus chemical shift list, the amino acid sequence, andthe unassigned NOE peak lists were used as input datafor combined automated NOE assignment6 and structurecalculation11 using a new version of the software CYANA.Seven cycles of combined automated NOE assignment andstructure calculation by simulated annealing in torsionangle space, and a final structure calculation using onlythe unambiguously assigned distance restraints were run.The complete calculation comprised three stages. In thefirst stage, the chemical shifts and protein structures weregenerated de novo (stage I). In the next stages (stages II andIII), the structures generated in the preceding stage were usedas additional input for the determination of chemical shiftassignments. Stages II and III are particularly important foraromatic residues and other resonances whose assignmentsrely on through-space NOESY information. At the end ofthe third stage, the 20 final CYANA conformers with thelowest target function values were subjected to restrainedenergy minimization in explicit solvent against the AMBERforce field15 using the program OPALp.16,17 The completeprocedure was driven by the NMR structure calculationprogram CYANA,4,11 which was also used for parallelizationof all the time-consuming steps. Calculations were performedsimultaneously on 20 processors of a Linux cluster systemwith Intel Xeon 3.06 GHz processors and 2 GB of memory per2-processor node, and required about 30 h of computationtime for a complete FLYA run. Three runs were conductedwith each set of NMR spectra using different seed values forthe random number generators. The results of these threeruns were averaged and are presented in the Section onResults and Discussion.
ProteinThe FLYA algorithm was applied to determine the structureof the Src homology domain 2 from the human feline sarcomaoncogene Fes (Fes SH2), whose resonance assignments9 andhigh-quality NMR solution structure8 were previously deter-mined using conventional techniques. Fes SH2 comprises 114residues and has the canonical Src homology 2 domain foldwith a central three-stranded antiparallel ˇ-sheet flankedon either side by an ˛-helix, and three short antiparallelˇ-strands that pack against the second ˛-helix.8 The sevenN-terminal and six C-terminal residues are non-native flank-ing regions related to the expression and purification systemand are disordered in solution8 so that the structured regionof the protein is residues 8–108. The Fes SH2 coordinatesand chemical shift assignments determined earlier by con-ventional methods are available from the Protein Data Bank
with accession code 1WQU and from the BioMagResBankwith accession number 6331.
NMR spectroscopy and spectral processingThe NMR measurements recorded for the previous con-ventional structure determination were also used for thisstudy. They were collected at 25 °C on a Bruker DRX 600spectrometer operating at a proton frequency of 600 MHzand using an xyz-gradient triple-resonance probe, with theexception of the NOESY spectra that were recorded on aBruker AV 800 spectrometer operating at a proton frequencyof 800 MHz and equipped with a triple-resonance 1H, 13C,15N probe with triple-axis pulse field gradients. Table 1 givesa summary of the spectra acquired, and the [1H,15N]-HSQCspectrum in Fig. 1 illustrates the quality of the NMR datafor Fes SH2. Further details about the NMR experimentsare given in Refs 8, 9. The NMR measurements were car-ried out with one uniformly 13C- and 15N-labeled samplecontaining 1.2 mM protein dissolved in 90% H2O/10% D2O(v/v), 20 mM Tris-HCl buffer, pH 7.0, 100 mM NaCl, 1 mM
dithiothreitol, and 0.02% NaN3.9 The program NMRPipe18
was used for spectral processing. At least twofold zero-fillingin each spectral dimension, linear prediction in one indirectdimension, apodization by 60–90° shifted sine-squared win-dow functions, and baseline correction along all dimensionswere applied. Whenever possible, the same parameters wereused for processing the corresponding dimensions of allexperiments. Particular attention was paid to accurate andconsistent chemical shift referencing in the direct and indi-rect dimensions to enable the use of small tolerances for thematching of peak positions from different spectra during thefully automated analysis.
Analysis and structure comparisonThe program MOLMOL19 was used to visualize three-dimensional (3D) structures. CYANA was used to obtainstatistics on target function values, restraint violations, etc.RMSD values to the mean coordinates of a structure bundlefor superpositions of the backbone atoms N, C˛ and C0
or the heavy atoms in the structured region of residues8–108 were calculated with CYANA. The single RMSD
Figure 1. [1H,15N]-HSQC spectrum of the Fes SH2 domain.Folded peaks are labeled with asterisks.
Copyright 2006 John Wiley & Sons, Ltd. Magn. Reson. Chem. 2006; 44: S83–S88

Fully automated structure determination of Fes SH2 S85
Table 1. Acquisition parameters for the multidimensional NMR spectra recorded for Fes SH2 and a summary of spectra used forthe FLYA runs 1 to 6
Spectra used in FLYA run
Spectrum Nucleia PointsbSpectral widthc
(kHz) 1 2 3 4 5 6
2D spectra – – – 2 2 2 2 2 215N-HSQC 15N 46 11.2, 2.7 Yes Yes Yes Yes Yes Yes13C-HSQC 13C 40 11.2, 7.9 Yes Yes Yes Yes Yes Yes3D spectra – – – 13 9 8 7 5 3For backbone assignmentHNCO 15N, 13C 46 ð 50 8.4, 2.0, 3.3 Yes – – – – –HN(CA)CO 15N, 13C 46 ð 50 8.4, 2.0, 3.3 Yes – – – – –HNCA 15N, 13C 46 ð 50 8.4, 2.0, 4.8 Yes – – – – –HN(CO)CA 15N, 13C 46 ð 50 8.4, 2.0, 4.8 Yes – – – – –CBCANH 15N, 13C 46 ð 64 8.4, 2.0, 11.3 Yes Yes Yes Yes – –CBCA(CO)NH 15N, 13C 46 ð 64 8.4, 2.0, 11.3 Yes Yes Yes Yes Yes YesFor side-chain assignmentHBHA(CO)NH 15N, 1H 46 ð 64 8.4, 2.0, 8.4 Yes Yes Yes Yes – –(H)CC(CO)NH 15N, 13C 46 ð 64 8.4, 2.0, 11.3 Yes Yes Yes Yes Yes –H(CCCO)NH 15N, 1H 46 ð 64 8.4, 2.0, 6.7 Yes Yes Yes Yes Yes –HCCH-COSY 13C, 1H 50 ð 100 8.4, 11.3, 8.4 Yes Yes – – – –HCCH-TOCSY 13C, 1H 64 ð 100 8.4, 11.3, 8.4 Yes Yes Yes – – –For restraint collection15N-edited NOESY 15N, 1H 46 ð 128 11.2, 2.7, 11.2 Yes Yes Yes Yes Yes Yes13C-edited NOESY 13C, 1H 40 ð 150 11.2, 8.0, 11.2 Yes Yes Yes Yes Yes Yes
a Nuclei: nuclei observed in the indirect dimension(s).b Points: complex time domain data points in the indirect dimensions. For all the spectra, 512 complex time domain data points wererecorded in the directly detected 1H dimension.c Spectral width: spectral widths in the direct and indirect dimension(s).
value between the two sets of mean coordinates was used toquantify the deviation of one structure bundle from another.Conformational energies were calculated with OPALp16,17
using the AMBER15 force field.
RESULTS AND DISCUSSION
A summary of the NMR spectra collected, and theiracquisition parameters are given in Table 1 along with theexperiments included in the reduced data sets. For Run 1,the full set of 2 two-dimensional (2D) and thirteen 3D spectrawas employed. Runs 2–6 used progressively reduced setsof spectra for the backbone and side-chain chemical shiftassignments. The 2D HSQC (Fig. 1) and the 3D NOESYspectra were used in all the runs. Run 2 used nine 3D spectraincluding all available side-chain experiments and thebackbone experiments CBCANH and CBCA(CO)NH. Runs3 and 4 used the same backbone and side-chain experimentsas Run 2 except that they also excluded the HCCH-COSYand HCCH-COSY/HCCH-TOCSY experiments and utilizedeight and seven 3D spectra, respectively. Run 5 furtheromitted the backbone experiment CBCANH and the side-chain experiment HBHA(CO)NH. In the most extreme case,Run 6, a single backbone experiment CBCA(CO)NH was keptbesides the NOESY spectra. Automated peak picking yieldedpeak lists that contained on average about 1.5 times as manyentries as would be expected under ideal conditions. Peakpicking was always performed over the complete spectrum,
excluding only two narrow bands along the water line andalong the diagonal. No other spectral regions or individualpeaks were interactively excluded from peak picking.
Table 2 summarizes the chemical shift assignments andprovides structural statistics for Runs 1–6. The chemicalshift assignments for the structured region of the protein,residues 8–108, were classified into three categories. Thefirst category, ‘all’, includes all assignable 1H, 13C and, 15Natoms. The second category, ‘backbone, ˇCH/CH2’, includesonly the 1H, 13C, and 15N atoms in the protein backbone alongwith the Hˇ and Cˇ atoms. The final category, ‘other CHn’,includes all the remaining aliphatic and aromatic side-chainassignments except Hˇ and Cˇ. Run 1 made use of theHNCO and HN(CA)CO experiments for the assignment ofthe carbonyl carbons so that the number of assigned nucleiwas higher than for Runs 2–6, which did not include theexperiments to assign the C0 chemical shifts.
Table 2 summarizes for each of the three categories ofnuclei the percentage of assignments that are, within agiven tolerance, identical to those made by conventionalassignment (‘equal’), that differ by more than the tolerancefrom the conventional assignment (‘different’), and thatdo not agree within the tolerance with the conventionalassignment of any atom of the same residue (‘wrong’).Only the latter type of assignment error can potentiallylead to a serious distortion of the resulting structure. Forthe same reason, 13C and 15N atoms not bound to 1H
Copyright 2006 John Wiley & Sons, Ltd. Magn. Reson. Chem. 2006; 44: S83–S88

S86 A. Scott, B. Lopez-Mendez and P. Guntert
Table 2. Statistics of the Fes SH2 chemical shift assignments and structures determined using the FLYA algorithm and differentsets of experimental NMR spectra
FLYA run
Quantity 1 2 3 4 5 6
All chemical shift assignmentsa,b
Assigned 1H, 13C, 15N nuclei 1199 1091 1091 1091 1091 1091Equal (%) 90 89 88 84 84 77Different (%) 9 11 11 15 16 23Wrong (%) 3 4 3 6 7 15Backbone and ˇCHn chemical shift assignmentsa,b
Assigned 1H, 13C, 15N nuclei 760 659 659 659 659 659Equal (%) 97 96 96 93 92 88Different (%) 3 4 3 6 8 14Wrong (%) 2 2 2 3 6 12Other CHn chemical shift assignmentsa,b
Assigned 1H, 13C, 15N nuclei 439 432 432 432 432 432Equal (%) 77 78 77 69 71 63Different (%) 20 21 22 30 28 36Wrong (%) 5 6 5 11 10 19Structural statisticsAssigned NOESY cross peaks 4882 4859 4874 4757 4712 4524Long-range (ji � jj ½ 5) distance restraints 1206 1230 1219 1188 1153 1102Maximal distance restraint violation (A) 0.15 0.17 0.15 0.15 0.19 0.20CYANA target function (A2) 4.5 3.2 4.4 4.7 7.6 8.8AMBER energy (kcal/mol) �3957 �3916 �3948 �3917 �3741 �3663Backbone RMSD to mean (A)b 0.34 0.30 0.31 0.33 0.35 0.35All heavy atom RMSD to mean (A)b 0.74 0.71 0.68 0.74 0.72 0.73Backbone RMSD to reference (A)b 0.97 0.85 1.00 1.06 1.28 2.87All heavy atom RMSD to reference (A)b 1.37 1.33 1.56 1.56 1.83 3.41
a Chemical shift assignments are classified as ‘equal’ when they coincided, within tolerances 0.03 ppm for 1H and 0.4 ppm for 13C/15N,with the corresponding shift from the conventional assignment, as ‘different’ when they differed by more than the tolerance from thevalue from the conventional assignment, and as ‘wrong’ when they did not match any conventionally assigned shift within the sameresidue.b For the structured region of residues 8–108.
were excluded when counting the wrong assignments.For chemical shift matching, tolerance values of 0.03 ppmfor 1H and 0.4 ppm for 13C were used throughout. Theserelatively large tolerances were used in consideration of themoderate precision of the peak positions that can be achievedby automated peak picking. Note that the percentages ofequal and different peaks do not necessarily sum up to100% because only the shifts of nuclei that were assignedsimultaneously by both methods could be compared.
As expected, when fewer experiments are used, thenumber of equal assignments decreases and the numberof different and wrong assignments increases. Nevertheless,Runs 1–3 yielded assignments of virtually equal correctness(Table 2). Runs 4 and 5 were of reduced quality, but stillgenerated the proper structure. However, in Run 6 there isan obvious deterioration in the backbone fold.
The backbone and ˇCHn assignments are the mostaccurate, with 96–97% of these shifts being equal to thereference assignments for Runs 1–3, 92–93% for Runs 4 and5, and 88% for Run 6. Two percent of the backbone and ˇCHn
shifts in Runs 1–3, 3–6% in Runs 4–5, and 12% in Run 6are not assigned to the correct residue. The accuracy of the
side-chain assignments beyond ˇCHn is lower, with 5–6%of the shifts in Runs 1–3, 10–11% in Runs 4–5, and 19%in Run 6 not being assigned to the correct residue. Overall,the assignments to incorrect residues amount to 3–4% forRuns 1–3, 6–7% for Runs 4–5, and 15% for Run 6. With theexception of Run 6, this extent of errors fulfills the previouslyestablished minimal requirement of 90% assignment for thesuccessful use of combined automated NOE assignment andstructure calculation with CYANA.6,20
The consensus chemical shift assignments were usedtogether with the automatically picked NOESY peak listsfor the assignment of NOEs and the structure calculation.The total number of input NOESY cross peaks was 13 894.This number is considerably larger than the total numberof 7012 expected NOESY cross peaks, 1340 in the 15N-edited NOESY spectrum and 5672 in the 13C-edited NOESYspectrum, based on a maximal observable 1H–1H distanceof 4.5 A in the reference structure 1WQU. In comparison, themanually prepared NOESY peak lists for the conventionalstructure determination contained 4732 NOESY peaks, ofwhich 4603 were assigned.8 The number of NOESY peaksassigned using the FLYA method varied from 4882 in Run 1
Copyright 2006 John Wiley & Sons, Ltd. Magn. Reson. Chem. 2006; 44: S83–S88
Fully automated structure determination of Fes SH2 S87
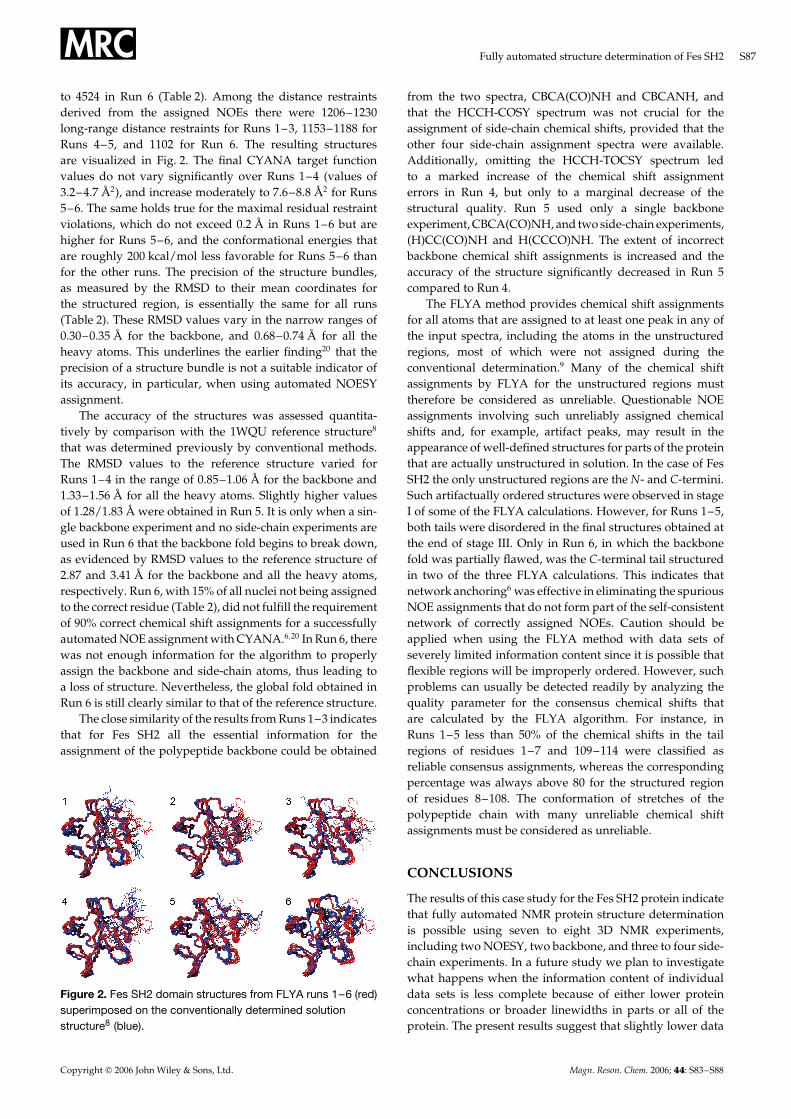
to 4524 in Run 6 (Table 2). Among the distance restraintsderived from the assigned NOEs there were 1206–1230long-range distance restraints for Runs 1–3, 1153–1188 forRuns 4–5, and 1102 for Run 6. The resulting structuresare visualized in Fig. 2. The final CYANA target functionvalues do not vary significantly over Runs 1–4 (values of3.2–4.7 A2), and increase moderately to 7.6–8.8 A2 for Runs5–6. The same holds true for the maximal residual restraintviolations, which do not exceed 0.2 A in Runs 1–6 but arehigher for Runs 5–6, and the conformational energies thatare roughly 200 kcal/mol less favorable for Runs 5–6 thanfor the other runs. The precision of the structure bundles,as measured by the RMSD to their mean coordinates forthe structured region, is essentially the same for all runs(Table 2). These RMSD values vary in the narrow ranges of0.30–0.35 A for the backbone, and 0.68–0.74 A for all theheavy atoms. This underlines the earlier finding20 that theprecision of a structure bundle is not a suitable indicator ofits accuracy, in particular, when using automated NOESYassignment.
The accuracy of the structures was assessed quantita-tively by comparison with the 1WQU reference structure8
that was determined previously by conventional methods.The RMSD values to the reference structure varied forRuns 1–4 in the range of 0.85–1.06 A for the backbone and1.33–1.56 A for all the heavy atoms. Slightly higher valuesof 1.28/1.83 A were obtained in Run 5. It is only when a sin-gle backbone experiment and no side-chain experiments areused in Run 6 that the backbone fold begins to break down,as evidenced by RMSD values to the reference structure of2.87 and 3.41 A for the backbone and all the heavy atoms,respectively. Run 6, with 15% of all nuclei not being assignedto the correct residue (Table 2), did not fulfill the requirementof 90% correct chemical shift assignments for a successfullyautomated NOE assignment with CYANA.6,20 In Run 6, therewas not enough information for the algorithm to properlyassign the backbone and side-chain atoms, thus leading toa loss of structure. Nevertheless, the global fold obtained inRun 6 is still clearly similar to that of the reference structure.
The close similarity of the results from Runs 1–3 indicatesthat for Fes SH2 all the essential information for theassignment of the polypeptide backbone could be obtained
Figure 2. Fes SH2 domain structures from FLYA runs 1–6 (red)superimposed on the conventionally determined solutionstructure8 (blue).
from the two spectra, CBCA(CO)NH and CBCANH, andthat the HCCH-COSY spectrum was not crucial for theassignment of side-chain chemical shifts, provided that theother four side-chain assignment spectra were available.Additionally, omitting the HCCH-TOCSY spectrum ledto a marked increase of the chemical shift assignmenterrors in Run 4, but only to a marginal decrease of thestructural quality. Run 5 used only a single backboneexperiment, CBCA(CO)NH, and two side-chain experiments,(H)CC(CO)NH and H(CCCO)NH. The extent of incorrectbackbone chemical shift assignments is increased and theaccuracy of the structure significantly decreased in Run 5compared to Run 4.
The FLYA method provides chemical shift assignmentsfor all atoms that are assigned to at least one peak in any ofthe input spectra, including the atoms in the unstructuredregions, most of which were not assigned during theconventional determination.9 Many of the chemical shiftassignments by FLYA for the unstructured regions musttherefore be considered as unreliable. Questionable NOEassignments involving such unreliably assigned chemicalshifts and, for example, artifact peaks, may result in theappearance of well-defined structures for parts of the proteinthat are actually unstructured in solution. In the case of FesSH2 the only unstructured regions are the N- and C-termini.Such artifactually ordered structures were observed in stageI of some of the FLYA calculations. However, for Runs 1–5,both tails were disordered in the final structures obtained atthe end of stage III. Only in Run 6, in which the backbonefold was partially flawed, was the C-terminal tail structuredin two of the three FLYA calculations. This indicates thatnetwork anchoring6 was effective in eliminating the spuriousNOE assignments that do not form part of the self-consistentnetwork of correctly assigned NOEs. Caution should beapplied when using the FLYA method with data sets ofseverely limited information content since it is possible thatflexible regions will be improperly ordered. However, suchproblems can usually be detected readily by analyzing thequality parameter for the consensus chemical shifts thatare calculated by the FLYA algorithm. For instance, inRuns 1–5 less than 50% of the chemical shifts in the tailregions of residues 1–7 and 109–114 were classified asreliable consensus assignments, whereas the correspondingpercentage was always above 80 for the structured regionof residues 8–108. The conformation of stretches of thepolypeptide chain with many unreliable chemical shiftassignments must be considered as unreliable.
CONCLUSIONS
The results of this case study for the Fes SH2 protein indicatethat fully automated NMR protein structure determinationis possible using seven to eight 3D NMR experiments,including two NOESY, two backbone, and three to four side-chain experiments. In a future study we plan to investigatewhat happens when the information content of individualdata sets is less complete because of either lower proteinconcentrations or broader linewidths in parts or all of theprotein. The present results suggest that slightly lower data
Copyright 2006 John Wiley & Sons, Ltd. Magn. Reson. Chem. 2006; 44: S83–S88
S88 A. Scott, B. Lopez-Mendez and P. Guntert
quality for individual spectra may be tolerable provided thatthere is sufficient redundancy within the full set of spectra.Ideally, an approach that is based exclusively on spectra thatyield conformational restraints, i.e. the NOESY experiments,is the most attractive. However, with the present versionof FLYA a few through-bond experiments remain necessaryfor reliable results. It will be intriguing to combine theFLYA approach with optimal isotope labeling by the SAIL(stereo-array isotope labeling) method21,22 to enhance theefficiency, reliability, and size range of applicability offully automated NMR protein structure determination. Inthis way, a further reduction in the required numberof experiments is conceivable without the loss of crucialinformation because SAIL gives rise to fewer and sharperpeaks, reduces the number of signals to be assigned, andeliminates the need for stereospecific assignments.
AcknowledgementsA.S. was supported by the Japan Society for the Promotion ofScience. This work was supported by the National Project on ProteinStructural and Functional Analyses of the Ministry of Education,Culture, Sports, Science and Technology of Japan (MEXT), andby the Tatsuo Miyazawa Memorial Program of RIKEN GenomicSciences Center.
REFERENCES1. Baran MC, Huang YJ, Moseley HNB, Montelione GT. Chem. Rev.
2004; 104: 3541.2. Altieri AS, Byrd RA. Curr. Opin. Struct. Biol. 2004; 14: 547.3. Gronwald W, Kalbitzer HR. Prog. NMR Spectrosc. 2004; 44: 33.4. Guntert P. Prog. NMR Spectrosc. 2003; 43: 105.5. Nilges M, Macias MJ, O’Donoghue SI, Oschkinat H. J. Mol. Biol.
1997; 269: 408.
6. Herrmann T, Guntert P, Wuthrich K. J. Mol. Biol. 2002; 319:209.
7. Huang YJ, Moseley HNB, Baran MC, Arrowsmith C, Powers R,Tejero R, Szyperski T, Montelione GT. Methods Enzymol. 2005;394: 111.
8. Scott A, Pantoja-Uceda D, Koshiba S, Inoue M, Kigawa T, TeradaT, Shirouzu M, Tanaka A, Sugano S, Yokoyama S, Guntert P.J. Biomol. NMR 2005; 31: 357.
9. Scott A, Pantoja-Uceda D, Koshiba S, Inoue M, Kigawa T, TeradaT, Shirouzu M, Tanaka A, Sugano S, Yokoyama S, Guntert P.J. Biomol. NMR 2004; 30: 463.
10. Johnson BA, Blevins RA. J. Biomol. NMR 1994; 4: 603.11. Guntert P, Mumenthaler C, Wuthrich K. J. Mol. Biol. 1997; 273:
283.12. Bartels C, Guntert P, Billeter M, Wuthrich K. J. Comput. Chem.
1997; 18: 139.13. Bartels C, Billeter M, Guntert P, Wuthrich K. J. Biomol. NMR
1996; 7: 207.14. Malmodin D, Papavoine CHM, Billeter M. J. Biomol. NMR 2003;
27: 69.15. Cornell WD, Cieplak P, Bayly CI, Gould IR, Merz KM, Fer-
guson DM, Spellmeyer DC, Fox T, Caldwell JW, Kollman PA.J. Am. Chem. Soc. 1995; 117: 5179.
16. Koradi R, Billeter M, Guntert P. Comput. Phys. Commun. 2000;124: 139.
17. Luginbuhl P, Guntert P, Billeter M, Wuthrich K. J. Biomol. NMR1996; 8: 136.
18. Delaglio F, Grzesiek S, Vuister GW, Zhu G, Pfeifer J, Bax A.J. Biomol. NMR 1995; 6: 277.
19. Koradi R, Billeter M, Wuthrich K. J. Mol. Graphics 1996; 14:51.
20. Jee J, Guntert P. J. Struct. Funct. Genomics 2003; 4: 179.21. Kainosho M, Torizawa T, Iwashita Y, Terauchi T, Ono AM,
Guntert P. Nature 2006; 439: 52.22. Ikeya T, Terauchi T, Guntert P, Kainosho M. Magn. Reson. Chem.
2006; 44: S152.
Copyright 2006 John Wiley & Sons, Ltd. Magn. Reson. Chem. 2006; 44: S83–S88