function point analysis - washington iceaawashingtoniceaa.com/files/presentations/34_function...
TRANSCRIPT

Introduction
and Basic Overview as an
Alternative to SLOC-based
Estimation
Function Point Analysis
© 2010 TASC, Inc. © 2010 TASC, Inc.
Estimation
Tucker Moore
TASC - ASOU
November 17, 2010

Software Cost Estimation
� Two Main Types of Developed SW Cost Estimation
– SLOC Based Estimation
– Function Point Analysis
� What’s the Difference?
– SLOC deals specifically with counting and estimating the Lines of Code for a program. It is explicitly code length-based, usually to apply a $/LOC
© 2010 TASC, Inc. 2
program. It is explicitly code length-based, usually to apply a $/LOC productivity rate to an estimate.
– Function Point Analysis quantifies and assigns a value to the actual uses, interfaces, and purposes of a piece of SW. It also adjusts these values depending on the complexity of the program.
� This presentation focuses on Function Point Analysis as an alternative to SLOC – based estimations.
Robert Cringely - “If automobiles had followed the same development cycle as the computer, a Rolls-Royce would today cost $100, get a million miles per gallon,
and explode once a year, killing everyone inside.”

� The Definitions of a Function Point (FP)
� Brief History of FP Analysis
� What you need, and Why you use Function Points
� Basic “How To Count” Function Points
� Benefits of FP Analysis – Pros and Cons
Presentation Agenda
© 2010 TASC, Inc.
� Benefits of FP Analysis – Pros and Cons
� Recommendations
� Conclusion
� References
� ≈35 Slides
3

� IFPUG (International Function Point Users Group):– Function Point Analysis (FPA) is a sizing measure of clear business significance. The FPA technique quantifies the functions contained within software in terms that are meaningful to the software users.
– About Function Point Analysis, http://www.ifpug.org/about/about.htm (2005). Online.
� SCEA:– Function points are a size measure that, as the name
What is a Function Point?
© 2010 TASC, Inc.
– Function points are a size measure that, as the name indicates, considers the number of functions being developed based on the requirements specification.
– SCEA. Cost Estimating Body of Knowledge (CEBoK), Module 12 Software Cost Estimation. 2009. Print.
� So…What does that mean?– Simply Speaking: Function Points are the aspects of a SW application that a User recognizes as important to the SW program’s actual use.
4
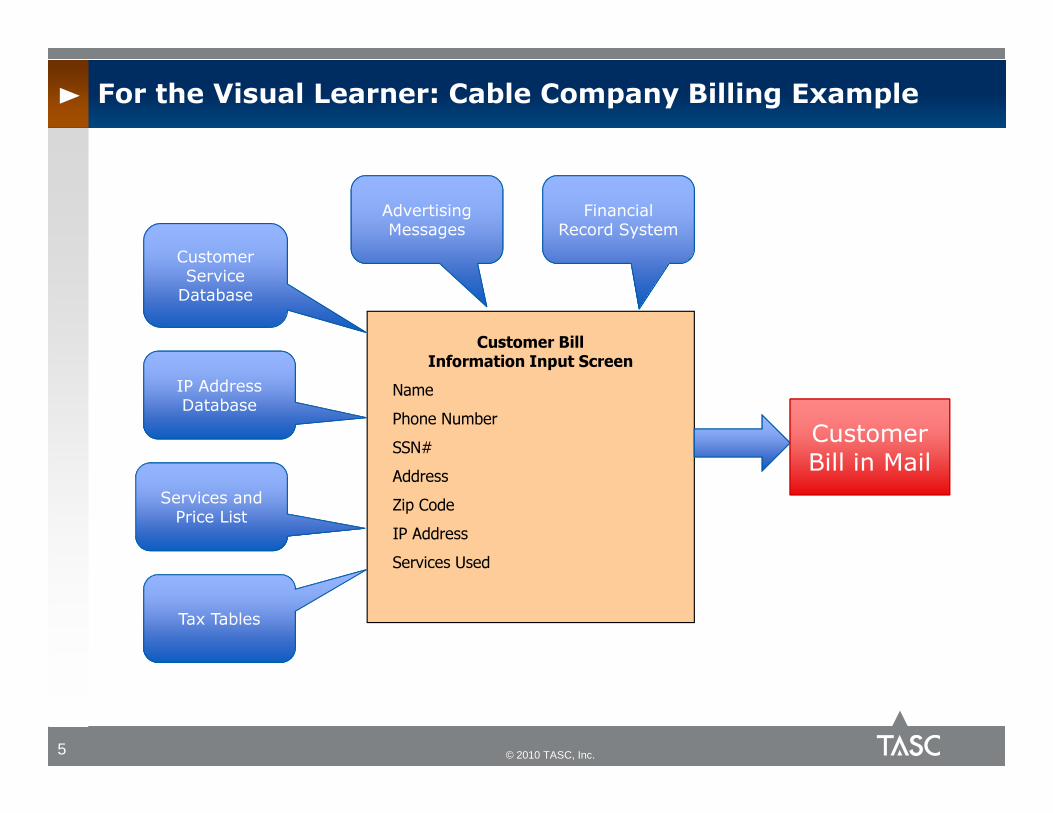
For the Visual Learner: Cable Company Billing Example
Customer Bill Information Input Screen
Name
Customer Service Database
IP Address Database
Advertising Messages
Financial Record System
© 2010 TASC, Inc. 5
Phone Number
SSN#
Address
Zip Code
IP Address
Services Used
Database
Services and Price List
Tax Tables
Customer Bill in Mail

• Allan Albrecht, of IBM, developed the method of Function Point Counting in 1979 in A New Way of Looking at Tools
• In 1986, the IFPUG, or International Function Point Users Group, was set up to develop and apply standards to the practice of function point analysis• IFPUG has numerous international partners in Europe, Australia, and Asia
Quick History of FP Analysis
© 2010 TASC, Inc.
Australia, and Asia
• Since 1986, several versions of the Function Point Counting Practices Manual have been published by IFPUG. However, a new version is published only out of necessity in order to keep the standards from changing.
• IFPUG: About Us, http://www.ifpug.org/about/ (2009). Online.
6
IFPUG Logo
< http://www.ifpug.org/about/>

� The Right Resources
– The Program’s Primary Users
– Program Developers / People who are familiar with the program (logically)
– Customers
– System Analysts
Getting Started: What do you need?
© 2010 TASC, Inc.
– System Analysts
– Project Managers
– Function Point Specialists
– Measurement Analysts
7
Picture borrowed from the Audi website. They looked like they were working well together.
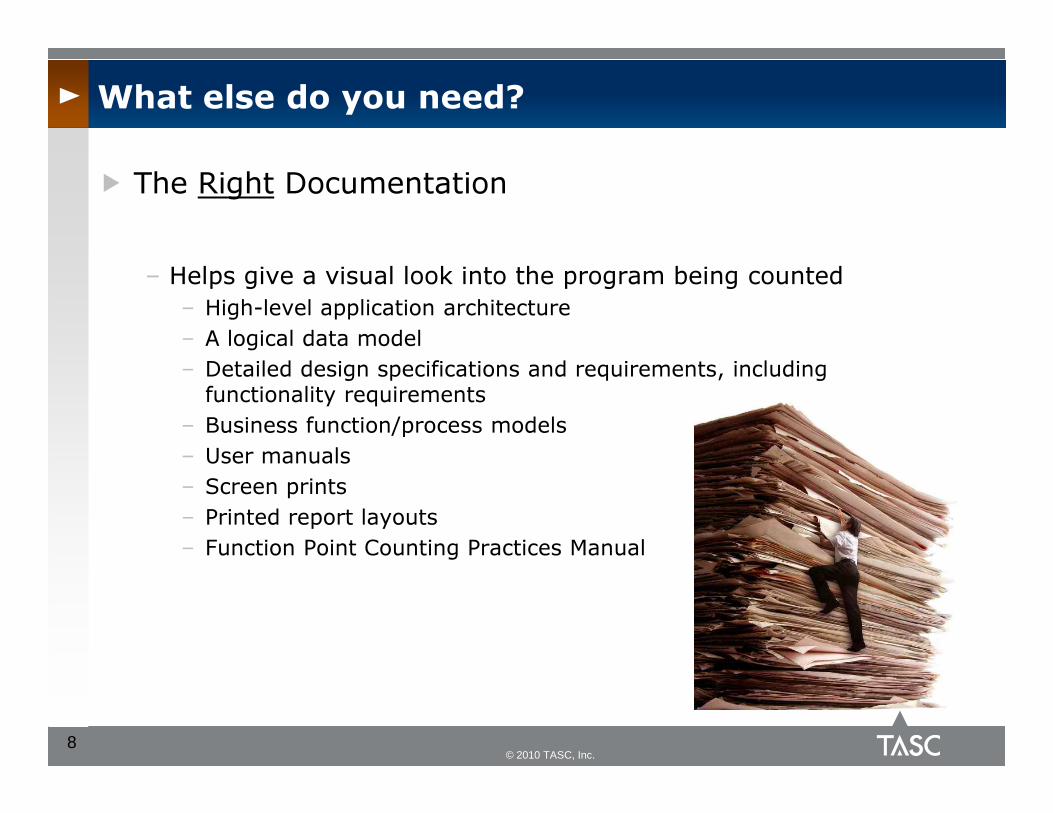
� The Right Documentation
– Helps give a visual look into the program being counted
– High-level application architecture
– A logical data model
– Detailed design specifications and requirements, including functionality requirements
What else do you need?
© 2010 TASC, Inc.
– Business function/process models
– User manuals
– Screen prints
– Printed report layouts
– Function Point Counting Practices Manual
8

� Function Point Analysis can be performed with as many/few of these documents as are available
• Documents are only necessary for assisting the analyst to facilitate the visual mapping process for the program with a manager or engineer
• A high level architecture, design specifications, and
A Note on Documentation
© 2010 TASC, Inc.
• A high level architecture, design specifications, and function/process models are all sufficient if the analyst can understand them and the manager can explain them
• This ability to work with preliminary documents is beneficial especially because this is all the cost analyst has to work with in many situations
9
� ICBD (for the Intelligence Community)
� CARD (for DoD Programs)
� User Interviews
� Customer Interviews
� Programmer Interviews
Where do I get this data?
© 2010 TASC, Inc.
� Programmer Interviews
� Past Similar Systems– Like in SLOC-based estimation
– Gives a great comparison metric
� Common Sense
10

� Historical Data and Pre-Established Parametric Data– Similar programs can be used to establish relationships or to see possible trends in the function growth and development time frame
� Must be able to visualize the logical progression– Visual Maps are essential to understanding the flow of the
Why do you need this data?
© 2010 TASC, Inc.
– Visual Maps are essential to understanding the flow of the program
� Insight into the program complexity
� Identify important, easily-forgotten features
11

� Disclaimer: This is just the Basic Idea
� Let’s go back to the “ComCable Company” Example– Estimate for New Customer Billing System
– Assuming we’re starting from scratch
– Customer Services maintains Customer Billing Info, enters into the system
– The information going onto Bill comes from multiple,
So, How do you count Function Points?
© 2010 TASC, Inc.
– The information going onto Bill comes from multiple, externally maintained systems
12

Again, For the Visual Learner
Customer Bill Information Input Screen
Name
Customer
Service
Database
IP Address Database
Advertising Messages
Financial Record System
© 2010 TASC, Inc. 13
Phone Number
SSN#
Address
Zip Code
IP Address
Services Used
Database
Services and Price List
Tax Tables
Customer Bill in Mail

Function Point Counting Process
Determine the Typeof FP Count
(New Development, Enhancement,
Existing Application)
Indentify the Scope and the Boundaries of the Application
Count the Data Function Types
Calculate the Unadjusted
Function Points
© 2010 TASC, Inc. 14
the ApplicationCount the
Transaction Function Types
Function Points (UFP)
Determine the Value
Adjustment Factor (VAF)
Calculate the Adjusted
Function Points (AFP)

� The Type of count that we’re performing is a “New Development Count”
– We assumed that this is the first time a billing system was created
– No existing code or structure was introduced
� We’ve already identified the Scope and Application
Boundaries
– We know the purpose
– We know what data goes in / comes out through interfaces and user
Where are we in the process?
© 2010 TASC, Inc.
– We know what data goes in / comes out through interfaces and user transactions
– We know what the User wants
15
Determine the Typeof FP Count
(New Development, Enhancement,
Existing Application)
Indentify the Scope and the Boundaries of the Application

� Two Types of Functions– Data Functions– Transaction Functions
� Data Functions– Made up of the Internal and External “resources” that affect the system– Internal Logical Files (ILF) and External Interface Files (EIF)
� Transaction Files– Made up of the processes that are exchanged between the user, the
internal files, and the external files
Now We Count the Functions
© 2010 TASC, Inc.
internal files, and the external files– External Inputs (EI), External Outputs (EO), and External Inquiries (EQ)
� More detail on these on next slide
16
Count the Data Function Types
Count the Transaction
Function Types
� Remember, we have two types of Data Functions– ILFs and EIFs
� ILFs– Internal Logical Files are those that are User identifiable groups of data and are maintained by the User
– Let’s assume we have one ILF : “ComCable” Customers
EIFs
Indentify the Data Functions
© 2010 TASC, Inc.
� EIFs– External Interface Files are User identifiable groups of data that are maintained by someone Other Than the user.
– EIF’s hold information that is referenced to by an ILF
– Assume we have six
17

ILFs and EIFs
Customer
Service
Database
IP Address Database
Advertising Messages
Financial Record System
© 2010 TASC, Inc. 18
Customer Billing Application
ILF –Customer Information
Services and Price List
Tax Tables

� Transaction Functions are the inputs, outputs, and data retrievals through logical processing
� Types: External Inputs, External Outputs, External Inquiries
� External Inputs (EI)– Unique process, data goes INTO application from outside the boundary
– Intent is to maintain / alter the system
� External Output (EO)
Transaction Functions
© 2010 TASC, Inc.
– Data comes OUT of the system
– Intent is to present information to a user
– Performs Calculation, Derives Data, or Updates ILF
� External Inquiries (EQ)– Data comes OUT of the system
– Intent is to present information to a user
– Performs NO calculations, Derives NO data, Updates NO ILFs
19

Transaction Functions in the Example
• External Inputs
• (on INPUT screen)
– Add Record Feature
– Change Record
• External Outputs
– The Customer
Bill Report
– Print Report
Feature
• External Inquiries
• (on INPUT screen)
– Report Look-Up Feature
© 2010 TASC, Inc. 20
– Change Record Feature
– Delete Record Feature

Customer Information
Name:_________________
Phone Number:__________
SSN#:_________________
Address:_______________
Input Screen and Customer Bill
ComCable Customer Bill
Name
Phone Number
SSN#
Address
Zip Code
Customer Service Input Screen Bill Output
© 2010 TASC, Inc.
Address:_______________
Zip Code:______________
IP Address:_____________
Services Used:___________
21
IP Address
Services Used
Taxes
Hidden Fees
Total
Advertisement Info
Add Change Delete Print Look-Up
Print Bill

� Here is where Complexity comes into play
� EIFs and ILFs are broken up into two parts– Record Element Types (RET)
– Data Element Types (DET)
� EI, EO, and EQs are broken into two parts– File Types Referenced (FTR)
Great, so how many Function Points?
© 2010 TASC, Inc.
– File Types Referenced (FTR)
– Data Element Types (DET)
22

� In ILFs and EIFs, Record Element Types (RET) are the largest user-identifiable subgroup of elements– Our ILF has 3 examples: Cable, Phone, and Internet Customers WITHIN ComCable Customers
– EIF Example: Customer’s Current Balance Due within the Financial Record System
� Data Element Types (DETs) are the different
RETs and DETs
© 2010 TASC, Inc.
� Data Element Types (DETs) are the different elements within each RET– The Cable Customer RET has Name, Number, SSN, etc. as DETs
– The Customer’s Current Balance Due has “Balance Due” as a DET
23
ILF -
Cable
ILF -
Phone
ILF -
Internet
ComCable Customers

� Counted for EI, EO, and EQ
� Same basic definitions as RETs and DETs for ILF/EIF
� File Types Referenced (FTRs) are the larger, user-identifiable subgroups within the EI, EO, EQ that are Referenced To
� Data Element Type (DET) is the data subgroup within
FTRs and DETs
© 2010 TASC, Inc.
� Data Element Type (DET) is the data subgroup within an FTR– These DETs are only counted ONCE for the same logical process: if already counted by an earlier process, then they can’t be counted again
24

Example of RET, FTR, DET Counts
ILF/EIF RET DET EI/EO/EQ FTR DET
ILF-
ComCable
Customers
Cable
Customers
Name
Number
SSN
Address
Zip Code
Service
Used
EI – Cable
Customer - Add
Record
ILF – ComCable
Customers
Name
Number
SSN
Address
Zip Code
IP Address
Service
Used
ILF-
ComCable
Customers
Phone
Customers
Name
Number
SSN
Address
EI – Cable
Customer –
Change Record
ILF – ComCable
Customers
Name
Number
SSN
Address
© 2010 TASC, Inc. NORTHROP GRUMMAN PRIVATE / PROPRIETARY LEVEL I25
Zip Code
Service
Used
Zip Code
IP Address
Service
Used
ILF-
ComCable
Customers
Internet
Customers
Name
Number
SSN
Address
Zip Code
IP Address
Service
Used
EO – Customer
Bill
ILF – ComCable
Customer
EIF- Services/
Price
EIF – Zip Code
EIF – Financial
Records
EIF –
Advertisements
EIF – Tax Table
ALL OF
ABOVE
Total Due
Taxes
Bar Code
EIF – Zip
Code
Zip Code
Table
Zip Code
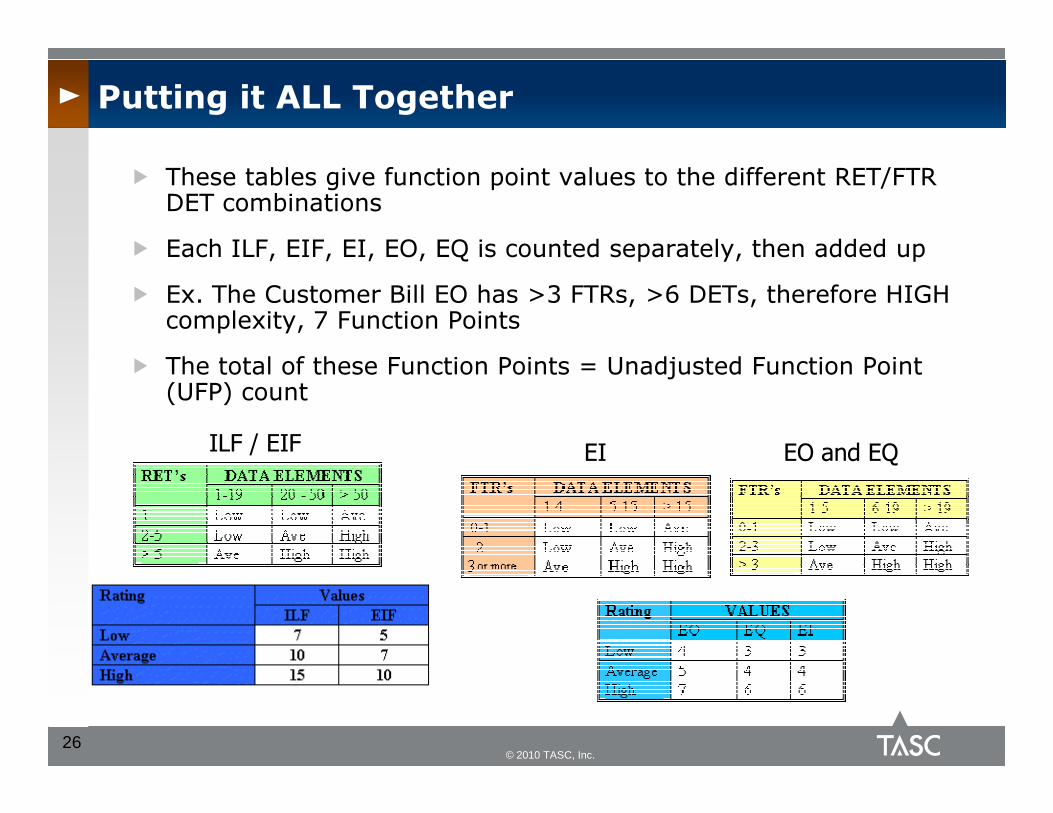
� These tables give function point values to the different RET/FTR DET combinations
� Each ILF, EIF, EI, EO, EQ is counted separately, then added up
� Ex. The Customer Bill EO has >3 FTRs, >6 DETs, therefore HIGH complexity, 7 Function Points
� The total of these Function Points = Unadjusted Function Point (UFP) count
Putting it ALL Together
© 2010 TASC, Inc. 26
ILF / EIF EI EO and EQ

Next Step in the Process
Determine the Typeof FP Count
(New Development, Enhancement,
Existing Application)
Indentify the Scope and the Boundaries of the Application
Count the Data Function Types
Calculate the Unadjusted
Function Points
© 2010 TASC, Inc. 27
the ApplicationCount the
Transaction Function Types
Function Points (UFP)
Determine the Value
Adjustment Factor (VAF)
Calculate the Adjusted
Function Points (AFP)

� The factor that normalizes the Unadjusted Function Point count
� Calculated by asking the 14 General System Characteristic Questions– Purpose is to apply further valuation to system complexity
– Sums up “Degrees of Influence” for each GSC
Value Adjustment Factor
© 2010 TASC, Inc.
� VAF calculation can be performed at Any point in the FP counting process– Any Added / Changed / Deleted functionality of a system results in VAF recalculation
VAF = 0.65 + [(Σ Deg. Of Influence) / 100]
28

� These questions help to describe the complexity of a program
� The analyst assigns a value of 1 – 5 Degrees of Influence for most questions
General System Characteristic Questions
1Data Communications: Describes the degree to which the
application communicates directly with the processor.
2Distributed Data Processing: Describes the degree to which the
application transfers data among physical components of the
© 2010 TASC, Inc. 29
application.
3Performance: Describes the degree to which response time and
throughput performance considerations influenced the application development.
4
Heavily Used Configuration: Describes the degree to which computer resource restrictions influenced the development of the application. Heavily used operational configurations may require
special considerations when designing the application.
5Transaction Rate: Describes the degree to which the rate of
business transactions influenced the development of the application.
6
On-Line Data Entry: On-line User Interface describes the degree to which data is entered or retrieved through interactive
transactions. On-line User Interface for data entry, control functions, reports, and queries are provided in the application.
7
End-User Efficiency: Describes the degree of consideration for human factors and ease of use for the user of the application
measured. The on-line functions provided emphasize a design for user efficiency.

General System Characteristic Questions
8On-Line Update: Describes the degree to which internal logical files (ILF)
are updated on-line. The application provides on-line updates for the ILF's.
9Complex Processing: Describes the degree to which processing logic
influenced the development of the application.
10Reusability: Describes the degree to which the application and the code in the application have been specifically designed, developed, and supported
to be usable in other applications.
Installation Ease: Describes the degree to which conversion from previous environments influenced the development of the application. A conversion /
© 2010 TASC, Inc. 30
11environments influenced the development of the application. A conversion / installation plan and/or tools were provided and tested during the system
test phase.
12
Operational Ease: Describes the degree to which the application attends to operational aspects, such as start-up, back-up, and recovery processes. The application minimizes the need for manual activities, such as tape mounts, paper handling, and direct, on-location manual intervention.
13Multiple Sites: Describes the degree to which the application has been
developed for different hardware and software environments.
14Facilitate Change: Describes the degree to which the application has been developed for easy modification of processing logic or data structure. Made
up of two parts: Flexible Query and Business Data Control Data.
� The “Final” Function Point count
� Applies the Value Adjustment Factor (VAF) to the Unadjusted Function Point (UFP)
AFP = UFP * VAF
Adjusted Function Point Count (AFP)
© 2010 TASC, Inc.
� Some certain situations, such as an Enhancement Function Point Count, require additional math
31

� Major metric is $ / Function Point (Cost)
� Function Point / Person-Month (Productivity)
� For Very Similar Systems: SLOC / Function Point(Cost)
Function Points in Cost Estimation
© 2010 TASC, Inc.
� Like all cost estimation, ALL of these metrics require GOOD historical data
32
� General Benefits (not necessarily benefits over SLOC):– Independent of Technology
– Independent of Programming Languages
– Requirements are the only thing needed for a FP Count
– SLOC can grow but Functionality usually stays the same
– Provides a method of easier communication with business groups
– Clear view of size, cost, and productivity
– Keeps all parties involved in estimate
– Provides a naturally strong base of documentation
Pros and Cons of Function Points
© 2010 TASC, Inc.
� Cons:– Can be very time-consuming
– Requires a good base of historical data and past function point counts
– Requires a trained function point counter
– Counting techniques can vary from counter to counter
– There are no COTS packages available for FP Counting that are recognized by IFPUG
– Suffers some of the same pitfalls as the Build-Up methodology
– Incurs the inherent risk when using analogies
33

� Begin counting Function Points alongside counting SLOC– Need historical data before relying on FP’s completely
– Strengthens FP knowledge and ability within group
� Count Function Points for past programs– Again, need to build a firm base of historical data
– FP counting training and practice
Recommendations
© 2010 TASC, Inc.
– FP counting training and practice
� Compare Results– How long it takes to produce function point-based estimates
– How Accurate / Precise (margin of error)
– Customer preference
34
� Function Point Analysis quantifies a system or application’s functional uses
� Function Points are a solid alternative to SLOC counting for developed SW estimation– Independent of Technology / Programming Languages– Relatively simple– Great communication device
� Can be completed at all stages of development
� Should Test and Practice
Conclusion
© 2010 TASC, Inc.
� Should Test and Practice– Gain a base of historical data– Compare to SLOC– Pick up where SLOC leaves off
� To Reiterate: This presentation is not trying to assert Function Point Analysis as dominant over SLOC-based estimation– FPA is presented as an oft-overlooked alternative to SLOC
35

� For more information, see the references page and visit some of the sites given
� Contact me with questions, comments, concerns, etc.
� Tucker Moore – TASC- [email protected]
- (703) 449-3646
Thank You
© 2010 TASC, Inc.
- (703) 449-3646
- (703) 785-8650
36

� SCEA. Cost Estimating Body of Knowledge (CEBoK),
Module 12 – Software Cost Estimation. 2009. Print.
• IFPUG Website, <http://www.ifpug.org/about/> (2009). Online.
� IFPUG. Function Point Counting Practices Manual. 2009. Print.
Resources
© 2010 TASC, Inc.
2009. Print.
� Q/P Management Group – Lori Holmes
� Software Metrics, <http://www.softwaremetrics.com> (2009). Online.
� Total Metrics, <http://www.totalmetrics.com> (2009). Online.
37

© 2010 TASC, Inc. © 2010 TASC, Inc. 38