functional analysis of sox3 binding at the dbx1 locus · 2014-09-10 · functional analysis of sox3...
TRANSCRIPT

Functional analysis of SOX3 binding at
the Dbx1 locus
This thesis submitted in part fulfilment of the requirements for the Degree of Master of Philosophy in the discipline of Biochemistry, School of Molecular and
Biomedical Science, at the University of Adelaide
Pengcheng Li July 2013

2
Table of Contents 1 Chapter 1. Introduction ..................................................................................... 7
1.1 Sox3 is a member of the Sox B1 subfamily belong to Sox family................. 8
1.2 Sox3 is required for brain development ........................................................ 9
1.3 SoxB1 functional redundancy in NPCs ...................................................... 11
1.4 SOX3 target gene regulation...................................................................... 13
1.5 Function of the Dbx1 gene in mammalian development ............................. 14
1.6 The spinal cord development with SoxB1 .................................................. 15
1.7 Aims and Objectives ................................................................................. 17
2 Chapter 2. Materials and Methods ................................................................... 18
2.1 Abbreviations ............................................................................................ 19
2.2 Materials ................................................................................................... 21
2.2.1 Chemicals and Reagents ..................................................................... 21
2.2.2 Enzymes ............................................................................................ 22
2.2.3 Antibodies .......................................................................................... 22
2.2.4 Solutions ............................................................................................ 22
2.2.5 Bacterial Strains ................................................................................. 23
2.2.6 Primers and Oligos ............................................................................. 24
2.2.7 Commercially Available kits .............................................................. 25
2.3 METHODS ............................................................................................... 26
2.3.1 Agarose gel electrophoresis (AGE) .................................................... 26
2.3.2 Transformation of Bacteria ................................................................. 26
2.3.3 Restriction digestion ........................................................................... 26
2.3.4 Ligations ............................................................................................ 27
2.3.5 Dephosphorylation ............................................................................. 27
2.3.6 Polymerase chain reaction (PCR) ....................................................... 27
2.3.7 Gel purification .................................................................................. 28
2.3.8 Blue-white selection ........................................................................... 28
2.3.9 Plasmid extraction .............................................................................. 28
2.3.10 DNA sequencing ................................................................................ 29
2.3.11 293T cells culture, passage and transfection ....................................... 29
2.3.12 Western Blots ..................................................................................... 30
2.3.13 EMSA Methods ................................................................................. 30
2.3.14 Immunofluorescence .......................................................................... 32
2.3.15 Dual-Luciferase Reporter Assay ......................................................... 33

3
2.3.16 qPCR ................................................................................................. 33
3 Chapter 3. Results ........................................................................................... 34
3.1 Optimization of the SOX3 TF expression .................................................. 35
3.2 Assessing the DNA binding properties of SOX3 at putative Dbx1 binding sites by EMSA..................................................................................................... 36
3.3 Construction and expression of Sox2-pIRES2-EGFP ................................. 37
3.4 Dual-Luciferase Reporter Assay ................................................................ 38
3.5 real-time PCR analysis of Sox3-null mouse at E9.5 ................................... 39
4 Chapter 4. Discussion ...................................................................................... 41 5 References

4
Declaration I declare that this thesis does not incorporate, without my acknowledgment, any
material previously submitted for a degree or diploma in any other university. To the
best of my knowledge this thesis does not contain any material written or published
by any other person, except where due reference is made.
Pengcheng Li

5
Acknowledgements Firstly, I would like to thank my supervisor Paul Thomas for accepting me into his lab
and for his response and encouragement during this year. In a word, my boss is a kind
and supportive supervisor.
Thanks to my co-supervisor Professor Dabing zhang in Shanghai Jiao Tong university
and head of scool David Adelson at the University of Adelaide for offering me such a
great opportunity to study in beautiful Australia with Aussies as a Joint Master
Degree student.
I am very thankful to all members of the Thomas Lab- James, Bryan, Nick, Dale,
Shaun, Sandie, Adi and Dan who all helped create a very relaxing working
atmosphere during this year, which was quite incredible for me but common for them.
Special thanks to Dale for his help from the beginning to the end with any aspects, not
only with the experiments but also with the proofreading of my thesis. Thanks Nick
for his help with qPCR and his explanation with my confusion in reading papers.
Thanks James for his help with Western blot. Thanks Adi the only Asian fellow in our
lab and Shaun as we three often came to the lab on weekends. Thanks Dan for giving
me the Cos cells. Thanks Sandie for inviting me to her home BBQ.
I would like to thank my family for their support throughout this year, especially my
wife. I would also thank my friends here who helped me kill the time when I was
alone.

6
ABSTRACT Sox3 a members of the SOX transcription factor family, is essential for normal brain
development and required for growth of pituitary and hypothalamus. Sox3, as well as
Sox2 which is another member in SOXB1 subfamily are widely expressed in neural
progenitor cells and show functional redundancy. ChIP-seq data by Bergsland et al,
2011 has identified five putative SOX3 binding sites near/at the Dbx1 locus.
Microarray data from the lab (N. Rogers, unpublished data) has identified Dbx1 as
downregulated in Sox3 null neural progenitor cells. Together these data suggest that
Dbx1 may be regulated directly by SOX3.
To investigate the possibility that SOX3 regulates the Dbx1 locus in vitro, we
performed gel shift assays and Luciferase Reporter Assays to see if SOX3 binds any
of the five Dbx1 regulatory sites. Due to time constraints we were not able to optimize
the gel shift assays to obtain any informative results. Secondly, we optimized
Luciferase Reporter Assays providing preliminary data suggesting SOX3 may bind at
one of the tested Dbx1 sites. To study the redundancy between Sox2 and Sox3, Sox2
was also tested in the Luciferase Reporter Assays indicating Sox2 may also regulate
the same site as Sox3 . Due to time constraints, the other three binding sites remain to
be analyzed in the future.
The function of Dbx1 is best characterized in the context of the developing neural
tube (also known as the spinal cord). To identify how other neural tube marker genes
are regulated by Sox3, qPCR was performed with some marker genes in Sox3 null
E9.5 mouse embryos compared with WT embryos. Dbx1, Pax6, Ngn2 and Olig2 all
showed significant decrease in Sox3 null. Further study of these genes will be required
to assess the significant outcome of their down regulation in an in vivo context.

7
1
Chapter 1. Introduction

8
1.1 Sox3 is a member of the Sox B1 subfamily belong to Sox family
The SRY related HGM box containing (Sox) family of transcription factors was first
described in 1990 with the Y chromosome-linked sex-determing region Y(SRY) gene
as the founding member (Gubbay, Collignon et al. 1990). SRY is widely considered as
the main initiator of male sex determination and encodes a transcription factor
containing a highly conserved High Mobility Group box (HMG box), a DNA binding
domain 79 amino acids in length (Foster and Graves 1994). The HMG box
superfamily of transcription factors are divided into two subfamilies: one is the
HMG/UBF group which have a duplicated HMG domain that lack sequence-specific
binding activity, while the members in the TCF/SOX/MATA group generally have
single, sequence-specific HMG box binding domains (Bowles, Schepers et al. 2000).
Members of the Sox family share greater than 50% or higher amino acid identity with
SRY in the conserved HMG box (Bowles, Schepers et al. 2000).
Analysis of the whole genome in 2002 identified 20 Sox genes in mouse and humans
(Schepers, Teasdale et al. 2002). Comparison of different domains (transactivation,
transrepression and dimerization domains) in SOX proteins have further categorized
the genes into 8 groups, A to H, with additional sub groups within the Sox B genes,
Sox B1 and Sox B2 (Lefebvre, Dumitriu et al. 2007). The members of the Sox B1
subgroup, Sox1, Sox2 and Sox3, generally act as transcriptional activators while the
Sox B2 genes, Sox14 and Sox21, generally repress transcription (Lefebvre, Dumitriu
et al. 2007). This is supported by experiments using obligatory activator (SOX3
HMG-VP16) and repressor (SOX3 HMG-EnR) fusion proteins-overexpression of the
former inhibits neurodifferentiation (as does WT SOX) while the latter promotes
neurodifferentiation (Bylund, Andersson et al. 2003).
Sox3 is a single exon gene located on the X chromosome. Of the 20 SOX proteins in
mammals, SOX3 shows both highest percentage of amino acid identity (67%) to SRY
within the HMG domain. Based on sequence alignments and gain of function studies,
it is thought that Sry evolved from Sox3, athough Sox3 is not required sex
determination (Sutton, Hughes et al. 2011). Sox3 is widely expressed in the CNS and

9
is also essential for normal mammalian brain development (Rizzoti, Brunelli et al.
2004; Woods, Cundall et al. 2005; Sutton, Hughes et al. 2011). Furthermore, it is
required for the formation of both hypothalamus and pituitary in mice as well as
associated with human hypopituitarism and mental retardation (Rizzoti, Brunelli et al.
2004; Woods, Cundall et al. 2005)
Sox3 is first expressed between 5.5 to 6.5 dpc in the epiblast and extraembryonic
ectoderm of mouse embryos and it is upregulated in the developing neural plate
(Wood and Episkopou 1999). Between 8.0 to 9.0 dpc (the beginning of neuralation),
Sox3 is expressed in the neuroectoderm (Wood and Episkopou 1999). Sagittal section
of 10.5 dpc wild-type embryo has shown that Sox3 is present in the neuroprogenitor
cells throughout the CNS (Rizzoti, Brunelli et al. 2004; Rogers, Cheah et al. 2013).
Importantly, Sox3 expression is downregulated in the vast majority of neurons during
embryonic brain development. As such, Sox3 is expressed after birth in the residual
population of stem/progenitor cells and a small subset of neuron of indeterminate
phenotype (Rogers, Cheah et al. 2013). SOX3 is also express in the spermatogonial
progenitor cells in the testis and is required for early spermatogenesis (Collignon,
Sockanathan et al. 1996; Rizzoti, Brunelli et al. 2004).
1.2 Sox3 is required for brain development
Sox3 null mice have been generated using gene targeting in embryonic stem cells
(Rizzoti, Brunelli et al. 2004). They exhibit variable phenotypes with the more
seriously affected mice dying before weaning (3 weeks). The pituitary growth
hormone level in Sox3 null mice is approximately one third that of wild type mice
resulting in dwarfism in some mutants. Other anterior pituitary hormones are also
generally lower. The pituitary develops from the infundibulum in the ventral
diencephalon and the Rathke’s pouch and the secretory is regulated by the
hypothalamus. In the Sox3 null mutant mice, pituitary dysgenesis is first observed in
the 11.5-d.p.c. mutant brains (see Figure 1.1). Furthermore, an extra cleft appears
between the anterior lobe and intermediate lobe resulting in a smaller anterior and the
mixture of growth hormone-positive anterior lobe cells and intermediate cells (see
Figure 1.2) (Rizzoti, Brunelli et al. 2004). Other CNS defects include agenesis of the
corpus callosum and absence of the dorsal hippocampus. Sox3 mutants also exhibit
variable craniofacial defects including the pinna and teeth as well as the defects in

10
both testes and ovaries. Together these studies show that Sox3 is required for normal
development of the brain, craniofacial region and gonads.
.
Figure 1.1 . Sagittal sections through brains of the 11.5dpc mice (a) wild type (b)Sox3 null
embryos, dorsally expanded Rathke’s pouch and the less obvious evagination of the
infundibulum.(Rizzoti, Brunelli et al. 2004)
Figure 1.2 .immunohistochemistry of 6-weeks wild type and Sox3 null mice growth hormone on
pituitary sections .(m) The pituitary can be divided clearly by three parts :anterior lobe (Ant);
intermediate lobe(Int); posterior lobe(Post). The heavy staining section is the growth hormone-
generation somatotrophs (n) The inset figure show the extra cleft in the mutant.(Rizzoti, Brunelli
et al. 2004)
In humans, the previous studies of SOX3 duplications (at Xq26-27 (3.9Mb)) indicated
this chromosomal abnormality is associated with mental retardation, growth hormone
deficiency (X-linked Hypopituitarism) presumably due to overexpression of SOX3
(Solomon, Ross et al. 2004). Polyalanine tract expansion (+11 Ala) in SOX3 is also
associated with mental retardation and short stature due to growth hormone (GH)
deficiency (Laumonnier, Ronce et al. 2002). Furthermore, a recent study

11
demonstrated that both overdosage and underdosage of Sox3 resulting from
duplications of Xq26-27 (685.6kb) and an expansion of a polyalanine tract (by 7
alanines), respectively, leads to Infundibular Hypoplasia and Hypopituitarism. For the
patients with duplication of SOX3, they had short stature due to GH deficiency and
one of them also had a cyst in the corpus callosum. For the patients with underdosage
of SOX3, they were characterized as having short stature and GH deficiency but not
mental retardation (Woods, Cundall et al. 2005). A recently published knock-in
mouse model from the Thomas laboratory has shown that the (+11Ala) expansion
allele functions as a partial loss-of-function mutation (Hughes, Piltz et al. 2013).
1.3 SoxB1 functional redundancy in NPCs
Despite the widespread expression of Sox3 in the developing nervous system, the
CNS phenotype of Sox3 null mice is relatively mild, suggesting that other genes may
compensate for the loss of Sox3 function. Given their similarity in sequence,
expression and function, several lines of evidence suggest that the two other members
of the SOXB1 subgroup, Sox1 and Sox2, are functionally redundant with Sox3, as
outlined below.
1. Sox1, Sox2 and Sox3 have overlapping expression at most stages of the neural
development. Overlapping expression is mainly observed in the developing CNS of
the embryo, as indicated by in situ hybridization (see Figure 1.3). Both Sox2 and Sox3
are expressed in the neuroectoderm from the onset of somitogenesis between 8 and 9
dpc. From the 6 somite stage, Sox2 transcripts are present in ectoderm adjacent to the
hindbrain as well as Sox3. At the 8-10 somite stage, both of them are expressed in the
ectoderm overlying the second branchial arch, Sox2 and Sox3 are sequentially
expressed in the nasal placode . Last but not least, Sox2 and Sox3 are detected in the
gut endoderm and the posterior region of the foregut respectively. However, it should
be noted that there are subtle differences of expression between Sox2 and Sox3. For
example, at 4-6 somite stage, Sox2 is downregulated in rhombomere (r) 5 and 6 while
Sox3 becomes upregulated in r5 (Wood and Episkopou 1999).

12
2. Overexpression experiments in chick embryos indicate that all SOXB1 members
have the ability to inhibit neuroprogenitor differentiation (Bylund, Andersson et al.
2003).
3. It has been demonstrated in vitro that both SOX2 and SOX3 bind to the motif
AACAAT, the consensus binding sequence of the SRY protein (Collignon,
Sockanathan et al. 1996). Although SOX3 has greatest sequence homology to SRY
within the HMG box, SOX2 exhibits similar affinities to SOX3 compared to SRY
(Collignon, Sockanathan et al. 1996).
4. A recent ChIP-seq study in NPC on Sox2 and Sox3 binding sites has identified 1160
overlapping sites from the ChIP-seq data (Bergsland, Ramskold et al. 2011).
Given the strong evidence for SOXB1 functional redundancy outlined above, it is
interesting to consider the primary cause of the defects in the Sox3 null mice. One
possibility is that these defects arise from as yet undefined embryonic CNS regions
that express Sox3 but not Sox2 or Sox1. An alternative possibility is that the defects
reflect regions that are particularly sensitive to the SOXB1 dosage, such that the loss
of Sox3 cannot be fully compensated by Sox2 and/or Sox1. To begin to address this
issue, it is essential to define the direct target genes that are regulated by Sox3 during
CNS development.
Figure 1.3, Expressions of Sox2 and Sox3 in the mouse embryos at 9 dpc.It shows the Sox2 and
Sox3 overlapping expression in the CNS of mouse embryo. Figure modified from Wood et al.
1999 (Wood and Episkopou 1999).

13
1.4 SOX3 target gene regulation
SOX3 acts by binding specific DNA sequences, as such it is important to know where
SOX3 binds within the genome. A recent study by Bergsland et al. 2011 identified
9720 unique SOX3 binding sites in NPCs by ChIP-Seq. Analysis of the binding sites
identified a SOX3 DNA binding motif (tCYTTTSTyyk) (Figure 1.4) (Bergsland,
Ramskold et al. 2011). Additionally, the same experiment was performed with SOX2
in NPCs, identifying 1388 SOX2 biding sites over 90% of which were also bound by
SOX3.
To identify CNS genes that require Sox3 for their expression, our lab performed
genome wide expression profiling comparing WT and Sox3 null day 4 NPCs (N.
Rogers, unpublished data). The microarray data revealed that Dbx1 was significantly
downregulated, which was subsequently validated on independent NPCs by qRT-PCR
(see Figure 1.5). Notably, Dbx1 expression is still down 2-fold in NP cells in culture
at day 6 (N. Rogers, Unpublished Data). Using the ChIP-seq data published by
Bergland et al, we identified 5 SOX3 binding sites at or near the Dbx1 locus in
regions of high mammalian conservation (Bergsland, Ramskold et al. 2011) (Figure
1.6). Interestingly, only 3 of the 5 SOX3 binding sites near Dbx1 also bound Sox2 in
NPCs suggesting the possibility of SOX3-specific regulation(Figure 1.6).
Figure 1.4 . Sequence binding preference of Sox2 and Sox3 in NPCs.(Bergsland, Ramskold et al.
2011)

14
Figure 1.5 . Microarray results of Sox3 null versus WT cells at day 4(Nicholas Rogers,
Unpublished Data). Sox3BS: Sox3 binding sites; FC(KO vs. WT): fold change (Knock out vs.
Wild type).
Figure 1.6. Five potential binding sites of SOX3 in/near Dbx1 From Dale and (Bergsland,
Ramskold et al. 2011).
1.5 Function of the Dbx1 gene in mammalian development
The Dbx1 gene encodes the developing brain homeobox protein 1 (DBX1) and is
expressed as early as 8.25 dpc within five discrete subsets: EM (early midbrain), vDi
(ventral diencephalon), dDM (dorso-lateral diencephalon and mesencephalon), ANR
(anterior neural ridge) and FE (facial ectoderm) of cells in the cephalic region in the
developing mouse. Genetic ablation of all Dbx1-expressing cells gives rise to the
absence of dorsal neural tube closure at midbrain level, a severe reduction in the size

15
of the forebrain as well as serious defects of craniofacial structure (Causeret, Ensini et
al. 2011)(Figure 1.7). Comparison of Sox3 expression (figure 1.7) with Dbx1 by situ
hybridization at 12ss (approximately 9.5 dpc) (Causeret, Ensini et al. 2011), reveals
regions of overlapping expression in the midbrain, forebrain and spinal cord,
consistent with the notion that Dbx1 is a direct target of SOX3.
Figure 1.7. Heads of wild-type(A) and PGK:Cre;DbxDTA (B) E12.5 mouse embryos. Mutants
show severe neural and craniofacial defects(Causeret, Ensini et al. 2011)
1.6 The spinal cord development with SoxB1
The function of Dbx1 is best characterized in the context of the developing neural
tube (also known as the spinal cord). During the development of neural tube,
morphogens Sonic hedgehog (Shh), retinoic acid (RA) and bone morphogenetic
proteins (BMPs) “pattern” the NPCs by restricted activity at ventral, intermediate and
dorsal region of the neural tube, respectively (Oosterveen, Kurdija et al. 2013). Shh
expression leads to different classes of positionally defined neurons in the ventral
neural tube (Briscoe, Pierani et al. 2000). Activation or repression by Shh give rise to
2 classes of homeodomain TFs expressed by NPCs which act as intermediaries to
coordinate neural patterning (Oosterveen, Kurdija et al. 2012)(figure 1.8).
Furthermore, class I and II TFs redefine domain boundaries through cross-repression
interaction (Jessell 2000). It is obvious that Sox3 also expressed in the spinal cord
(see figure 1.3) and Dbx1 as well which was mentioned above. Furthermore, Dbx1 is
one of the class I genes expressing in the neural tube (Oosterveen, Kurdija et al.
2012).

16
Figure 1.8. Schematic illustrating the expression domains of class I and II TFs in
ventral neural tube. class I TFs are repressed by shh; class II TFs are induced by shh.
Expression of class I and II TFs within an individual progenitor region controls
neuronal fate.(Oosterveen, Kurdija et al. 2012)

17
1.7 Aims and Objectives
In summary, Sox3 is expressed throughout the central nervous system (CNS) in the
developing mouse embryo (Collignon, Sockanathan et al. 1996; Wood and Episkopou
1999; Archer, Jin et al. 2011). Sox3 has been shown to maintain cells as neural
progenitor cells (NPC), both preventing differentiation as well as stimulating cell
proliferation (Guth and Wegner 2008). What is more, microarray data from our lab
has identified Dbx1 as the top downregulated gene in the Sox3 null NPCs and five
putative SOX3 binding sites at Dbx1 locus have been identified by ChIP-seq from
Bergsland et al. Together, these data strongly suggest that Dbx1 is a directly regulated by SOX3. However, additional evidence of SOX3 binding at the Dbx1 locus
is required to definitively show that Dbx1 is a direct target of SOX3. Therefore, the
first aim is to investigate SOX3’s ability to bind specific DNA sequences at the Dbx1
locus using in vitro assays.
Specifically, my aim was to:
1. Design probes based on SOX3 binding sites identified by ChIP-seq.
2. Optimization transient SOX3 over-expression in 293T cells.
3. Optimize and perform a gel shift assay.
4. Validate SOX3 binding with a luciferase reporter assay.
The second aim of this project is to investigate potential functional compensation by
SOX2 at the Dbx1 locus.
Specifically, I aimed to
1. Generate a Sox2 expression plasmid.
2. Repeat Aim 1 with the Sox2 expression plasmid.

18
2
Chapter 2. Materials and Methods

19
2.1 Abbreviations
Amp Ampicillin
APS Ammoniumpersulfate
bp base pair
BSA Bovine Serum Albumin
ºC Degree Celsius
cDNA Complimentary deoxyribonucleic acid
CO2 Carbon dioxide
Cy3 Cyanine 3
DAPI 4’,6-diamidino-2phenylindole
DMEM Dulbecco’s Modified Eagle Medium
DMSO Dimethyl Sulfoxide
DNA Deoxyribonucleic acid
dNTP Deoxyribonucleotide Triphosphate
Dpc Day post coitum
DTT Dithiothreitol
EDTA Ethylenediaminetetraacetic acid
eGFP Enhanced green fluorescent protein
EtBr Ethidium Bromide
EtOH Ethanol
FCS Foetal Calf Serum
GFP Green fluorescent protein
HEPES 4-(2-hydroxyethyl)-1-piperazineethanesulfonic acid
HRP Horseradish peroxidase
HS Horse Serum
IPTG Isopropyl β-D-1-thiogalactopyranoside
IRES Internal ribosome entry site
Kan kanamycin
kb kilo base pairs

20
L Litre
LB Luria Broth
M Molar
mA milliampere
mg Milligram
min Minutes
mL Millilitre
mm millimeter
mM Millimolar
MQ Milli-Q
ng nanogram
P1000 1000μL pippete
PBS Phosphate Buffered Saline
PCR Polymerase Chain Reaction
PFA Paraformaldehyde
PMSF phenylmethanesulfonylfluoride
polydIdC Poly(deoxyinosinic-deoxycytidylic) acid sodium salt
qPCR Quantitative polymerase chain reaction
RO Reverse osmosis
rpm Revolutions Per Minute
RT Room Temperature
SDS Sodium Dodecyl Sulphate
sec Seconds
TBE Tris/Borate/EDTA
TEMED N,N,N',N'-tetramethylethylenediamine
Tris tris(hydroxymethyl)-aminomethane
Triton X-
100 Octylphenol ethylene oxide condensate
Tween-20 Polyoxyethylene-sorbitan Monolaurate
V Volts
v/v Volume per Volume
x-gal 5-bromo-4-chloro-3-indolyl-β-D-galactopyranoside
μg Microgram

21
μL Microlitre
μM Micromolar
2.2 Materials
2.2.1 Chemicals and Reagents
DMEM Gibco
FCS Life Technologies
Trypsin Gibco
Fugene Transfection Reagent Promega
SOC media CSU
BSA New England Biolabs
Bradford Reagent Bio-Rad
Skim Milk Powder Diploma
Isopropanol EMSURE
Prestained Protein Marker Bio-Rad
1kb Plus DNA Ladder Life Technologies
dNTP Mix Roche
BigDye Version3.1 Amersham
Tween-20 Fisher Biotech
DAPI Life Technologies
EtBr Sigma Aldrich
Triton X-100 Sigma
Klenow New England Biolabs
DMSO Sigma Aldrich
Phosphorus-32 Radionuclide(α-32P-dATP) PerkinElmer
PFA Sigma Aldrich
HS Life Technologies
Protease Inhibitor Cocktail Roche
22
2.2.2 Enzymes
Enzyme Manufacturer
Restriction Enzymes New England Biolabs
T4 Ligase New England Biolabs
Calf Intestinal Phosphatase(CIP) FINNZYMES
Shrimp Alkaline phosphatase(SAP) Roche
2.2.3 Antibodies
Antibody Dilution Species Manufacturer
Anti-Sox3 1:1000 Goat R&D Systems
Anti-Sox2 1:2000 Rabbit Millipore
Anti-Histone H3 1:2000 Rabbit Abcam
Anti-Beta-tubulin 1:1000 Rabbit Cell signaling
Anti-Goat HRP 1:5000 Donkey Rockland
Anti-Rabbit HRP 1:5000 Donkey Rockland
Anti-Rabbit Cy3 1:500 Donkey Rockland
2.2.4 Solutions
2.2.4.1 Buffers for EMSA
Hypotonic Buffer:10mM Tris pH 7.9, 1.5mM MgCl2, 10mM NaCl, 10% Glycerol
Added fresh 1mM DTT, 1mM PMSF, 1x Protease Inhibitor Cocktail
Hypertonic Buffer:10mM Tris pH 7.9, 1.5mM MgCl2, 420mM NaCl, 10% Glycerol
Added fresh 1mM DTT, 1mM PMSF, 1x Protease Inhibitor Cocktail

23
4x Gel Shift buffer 40mM Hepes pH 7.9,40% Glycerol, 0.4mM EDTA, 2mM DTT, 12mM MgCl2,
16mM Spermadine
5x TGE 250mM Tris pH 8.5, 1.9M Glycine, 1mM EDTA
10x Klenow buffer(TM) 100mM Tris pH 7.5, 50mM MgCl2, 75mM DTT
2.2.4.2 Buffers and Solutions for Western Blots
1x GTS:192mM Glycine, 25mM Tris-HCl, 0.1% SDS
Western Blot transfer buffer : 192mM Glycine, 25mM Tris-HCl, 15% Methanol
PBS: 30mM NaCl, 2.5mM KCl, 10mM Na2HPO4, 30mM NaH2PO4, HCl to pH 7.4
PBST:0.1%(v/v)Tween-20 in PBS
Buffers for Protein expression
Whole cell extract lysis buffer: 420mM NaCl, 25% glycerol, 0.5% NP-40, 1.5mM
MgCl2, 20mM Hepes(pH7.5) and fresh Protease Cocktail Inhibitors
2.2.5 Bacterial Strains
E.Coli DH5α: host for recombinant plasmids.
Tissue culture cell lines
HEK293T : human embryonic kidney 293 cells stably expressing the SV40 large T-
antigen
Cos-7 Cells: Monkey kidney cells, expressing SV40 large T-antigen

24
2.2.6 Primers and Oligos
2.2.6.1 Oligonucleotide designed for EMSA and Luciferase
NAME Oligonucleotide(5’-3’) Dbx1(site1)Forward AATTAGGCCACATTCAATTACTCTTAAGACAATTATATG
Dbx1(site1)Reverse AATTCATATAATTGTCTTAAGAGTAATTGAATGTGGCCT
Dbx1(site2)Forward AATTCCATCTAGGCTCCATTCAGCCCCCTAGACACC
Dbx1(site2)Reverse AATTGGTGTCTAGGGGGCTGAATGGAGCCTAGATGG
Dbx1(site3)Forward AATTCTGCTAAGAGGCTCATTCAGTGCCCAGGG
Dbx1(site3)Reverse AATTCCCTGGGCACTGAATGAGCCTCTTAGCAG
Dbx1(site4)Forward AATTAAAAAAGCAGCCCTGAATGAATGTTAACAG
Dbx1(site4)Reverse AATTCTGTTAACATTCATTCAGGGCTGCTTTTTT
Dbx1(site5)Forward AATTTTGTCGGCAAAAGCCTGAATGGTGGTGGAA
Dbx1(site5)Reverse AATTTTCCACCACCATTCAGGCTTTTGCCGACAA
Dbx1(Negative)Forward AATTTAACCTTTGGTCTCCACAAGCTTTCTCCCCTTAAC
Dbx1(Negative)Reverse AATTGTTAAGGGGAGAAAGCTTGTGGAGACCAAAGGTTA
Dbx1(Positive)Forward AATTTCGAGGAAGAGAAACACCAACAAAGGAGGAGAAAGGCC
Dbx1(Positive)Reverse GGCCTTTCTCCTCCTTTGTTGGTGTTTCTCTTCCTCGAAATT
2.2.6.2 Oligonucleotide primers used for qPCR
Gene 5’-3’Forwad 5’-3’Reverse
β-actin CTGCCTGACGGCCAGG GATTCCATACCCAAGAAGGAAGG
Sox1 GACTTGCAGGCTATGTACAACATC CCTCTCAGACGGTGGAGTTATATT
Sox2 ACCAGCTCGCAGACCTACAT TCGGACTTGACCACAGAGC
Sox3 GAACGCATCAGGTGAGAGAAG GTCGGAGTGGTGCTCAGG
Dbx1 CGTTCGCCTTTCCATACTTC GAGAAGGTCCCAGGGATAGG
Pax6 GCACATGCAAACACACATGA ACTTGGACGGGAACTGACAC
Ngn2 AACTCCACGTCCCCATACAG GAGGCGCATAACGATGCTTCT
Neurod4 CCAGAGACTGTGGTACTGAAAGA GGATTGTGTGTTGACCAGCTC
Oligo2 GCAGCGAGCACCTCAAATCTA GGCCCCAGGGATGATCTAAG
Nkx2.9 AACAGACGTGCGTTCCACA GAGTCTGCAGGGCTTGTCTC
Nkx6.1 AGAGCACGCTTGGCCTATTC TGCGTGCTTCTTTCTCCACTT
Nkx6.2 CATGACCGAGAGCCAAGTGAA CGGCATCCGAGTCTTGCTT

25
2.2.7 Commercially Available kits
SUPPLIER KIT NAME CATALOGUE Qiagen QIAquick Gel Extraction kit 28706
Qiagen QIAfilter Plasmid Midi kit 12243
Thermo Scientific SuperSignal West Pico Stable Peroxide Solution 1856135
Thermo Scientific SuperSignal West Pico Luminol/Enhancer Solution 1856136
Promega Dual-Luciferase Reporter Assay System 10-Pack 289339
Applied Biosystems Fast SYBR Green Master Mix 1205065

26
2.3 METHODS
2.3.1 Agarose gel electrophoresis (AGE)
AGE was used to measure and separate DNA fragments in different sizes. 1% v/w
agarose powder was dissolved in an appropriate volume of 1x TBE, EtBr was added
to a final concentration of 1/50,000(v/v) and poured into appropriate gel casting trays.
Samples were mixed with 6x DNA loading buffer and run about 100V in 1x TBE
running buffer. Electrophoresed gels were observed using a UV transilluminator(UVP
BioDoc-It® Imaging System).
2.3.2 Transformation of Bacteria
5μL ligation reactions or 10ng plasmid DNA was mixed with 50μL chemically
competent E.coli DH5α cells. Cells were incubated on ice for 30 mins and then heat-
shocked at 42ºC for 90 secs. After being returned to ice for 5 mins, 250μL SOC
medium was added into the mixture and incubated in 37ºC with shaking for 45 mins.
Reactions was spread on LB agar plate containing appropriate antibiotics (Amp/Kan)
for selection and incubated at 37ºC overnight.
2.3.3 Restriction digestion
This method was used for cloning and checking insertion. The reaction was incubated
at least for 60 mins at 37ºC.
COMPONENT VOLUME(μL) 10x buffer 1.5
10x BSA(if required) 1.5
Restriction Enzyme 0.5
DNA plasmid 5
MQH2O 6.5(if BSA added) or 7(if not)
Total 15

27
2.3.4 Ligations
The reaction of ligations were performed as below:
COMPONENT VOLUME(μL) Insertion of the plasmid 3(1)
Vector 0.5
10x ligation Buffer 1
T4 ligase 0.5
MQH2O 5(7)
Total 10
Reaction was incubated at 4ºC overnight or at RT for 2 hours. Backbone only
ligations were performed as a negative control.
2.3.5 Dephosphorylation
To increase the efficiency of ligation, CIP or SAP were used to remove the 5’
phosphate of the digested vector to prevent self-ligation.
COMPONENT VOLUME(μL) SAP 1
10x SAP buffer 1.5
Vector 12.5
Total 15
The reaction were incubated for 60 mins at 37ºC followed by 15 mins at 65ºC. For the
CIP, 1μL CIP was added to 15μL cut vector followed by incubation at RT for 1 hour.
2.3.6 Polymerase chain reaction (PCR)
PCR reaction system:
COMPONENT VOLUME(μL)
Eppicenter Buffer B 7.5
Forward primers (100ng) 1
Reverse primers (100ng) 1
DNA template(100ng) 1
Pfu 0.5
H2O 4
Total 15

28
Reactions were incubated at 95ºC for 2 mins, followed by 40 cycles of 95ºC for 30
secs, 50ºC for 30 secs and 68ºC for 3 mins, followed by final extention at 68ºC for 5
mins.
2.3.7 Gel purification
To extract the DNA fragments in Agarose gel, Qiagen QIAquick Gel Extraction kit
was used to purified them according to manufacturers instructions.
2.3.8 Blue-white selection
40μL 100mM IPTG and 40μL x-gal was spread on agar plates prior to plating
transformed DH5αbacteria.
2.3.9 Plasmid extraction
Single transformed colonies was picked and cultured overnight at 37ºC in LB medium
containing antibiotic(100μg/mL Amp or 50μg/mL Kan) with shaking at 250rpm.
2mLs of culture was grown for plasmid mini-preps and 50 mLs for Midipreps. For
plasmid mini-preps, cultures were transferred to 1.5 mL tubes and centrifuged for 2
mins at 14,000rpm. The supernatant were then removed and pellets were resuspended
in P1.P2 was added and tubes were inverted 4-6 times followed by incubation at RT
for 5 mins. P3 buffer was added and the mixture was inverted 5 times with incubation
on ice for 5 mins. Samples were centrifuged for 2 mins at 14,000rpm and the
supernatant was transferred to new tubes and precipitated with isopropanol by
centrifuging for 15 mins at 14,000rpm. Plasmids were precipitated with 70% ethanol
and centrifuged for 2 mins at 14,000 rpm. For large scale plasmid preparation the
Qiagene QIAfilter Plasmid Midi kit was used as per manufacturers instructions.

29
2.3.10 DNA sequencing
COMPONENT VOLUME(μL) H2O 11.5
Template 1
Primer(50ng/μL) 1
4x Better buffer 5
Big Dye V3.1 1.5
Total 20
Samples were thermocycled at 96ºC for 3 mins; 35 cycles of 96ºC for 10 secs,50ºC
for 10 secs and 60ºC for 30 secs. Sequencing products were precipitated with 60%
isopropanol. Samples were mixed and incubated at RT for 15 mins, followed by
centrifugation for 15 mins at 14,000rpm. The pellet was washed with 200μL 75%
isopropanol with spinning for another 5 mins. Clean sequencing reactions were
analysed by the Australian Genome Research Facility, Adelaide.
2.3.11 293T cells culture, passage and transfection
293T cells were cultured in 37ºC, 5%CO2, 10 mL DMEM (4,500mg/L D-glucose, L-
glutamine, 25 mM HEPES buffer) with 10% FCS in 100mm cell culture dish.
Cells were passaged every 2-3 days when the cells reached 90% confluence. Old
media was aspirated and 1 mL trypsin was added and incubated at RT for 5 minutes.
Trypsin was neutralised with 1 mL of 10% FCS DMEM and cells were triturated to
form a single cell suspension. Cells were washed twice and 1/10th were replated.
105 cells were plated in each well of a 24 well plate or 100mm dish for transfection.
Cells were then cultured in the same condition mentioned above overnight. For
different plasmids, there were different ratios between Fugene and plasmids(For
EMSA, Western blot and Immunofluorescence , Fugene:plasmid=7μL:2μg; for
Luciferase assay, Fugene: plasmid=3μL:1μg). Appropriate volume of Fugene was
added into plasmids diluted in MQH2O and made the total volume to 20μL. The
mixture was incubated at RT for 15 mins and was then added to the cells. Assays
could be performed after 24-48 hours culturing in 37ºC,5% CO2.

30
2.3.12 Western Blots
2.3.12.1 Protein concentration quantification
Bio-rad Protein Assay Dye Reagent Concentrate was diluted 1:4 and 200uL of the
diluted Bradford solution was added into each diluted samples and BSA standards
(0.1 to 0.5mg/mL). The concentration of protein samples was calculated from the line
of best fit from the BSA standards using Excel.
2.3.12.2 SDS-PAGE
SDS-PAGE gel was composed of 10% or 12% resolving gel and 5% stacking gel.
Protein samples were denatured with 6x loading buffer and incubated at 95ºC for 5
mins before loading. Gels were run at 100V in 1x GTS until the dye reached the
bottom of the gel.
2.3.12.3 Transfer, blocking and detection
After running, the proteins were transferred to nitrocellulose membrane in Western
blots transfer buffer at 250mA for 1.5 hour. After transfer, the membrane was blocked
with 5% skim milk PBST at RT for 1-2 hours or at 4ºC overnight. After twice PBST
wash, the membrane was incubated on nutator at 4ºC with primary antibody diluted in
1% skim milk PBST. After triple 5mins PBST wash, the membrane was then
incubated at 4ºC with 1% skim milk PBST diluted secondary antibody for 1 hour in
RT or at 4ºCovernight. After this, the membrane was washed 20 mins in PBST three
times and developed in 500μL SuperSignal West Pico Stable Peroxide Solution and
500μL SuperSignal West Pico Luminol/Enhancer Solution reagent for 5 mins.
2.3.13 EMSA Methods
2.3.13.1 Annealing of probe
Lyophilized stocks of primers was dissolved in sterile 1x TE. Complementary primers
was then combined to a final concentration of 100μM with 50mM NaCl and
incubated in 95ºC heating block for 5 mins. The heating block was taken out and left

31
to cool to room temperature on the bench. 1μM annealed probes was made up and
stored at -20ºC.
2.3.13.2 Klenow labelling of probe
As annealed probes had EcoRI overhangs(5’aatt3’) and it can be labelled with α-32P-
dATP.added as the following order:
7μL Sterile MQ H2O
2μL 10xTM buffer
1μL Annealed probe at 25ng/μL or approximately 1μM
2μL 2mM dNTP’s (dCTP,dGTP,dTTP)
2μL 100mM DTT
4μL α-32P-dATP(40μCi)
2μL Klenow
Total 20μL
Fresh Klenow and DTT was added.
The mixture was incubated at 30ºC for 20 mins before 30μL 1x TE were added to the
reaction. The whole reaction was transferred to the centre of prespun Amersham
Probequant G-50 micro column with spinning at 3000rpm for 2 mins.150μL 1x TE
then added into the mixture to make the final volume to 200μL.
2.3.13.3 Nuclear and cytosolic extracts for EMSA
293T cells were cultured for 24 hours after transfection in a 6 well tray. Cells were
removed from the culture dish, transferred to a 1.5mL tube and pelleted by
centrifuging at 4ºC for 5 mins at 1,200 rpm. Cells were lysed in 50μL of hypotonic
buffer, leaving the nuclei intact. Samples were incubated on nutator at 4ºC for 30
mins and then snap froze in EtOH/dry ice. Samples were thawed on ice and
centrifuged at 14,000 rpm for 30 mins at 4ºC.Supernatant(cytosolic fraction) were
kept and nuclei pellets were resuspended in 30μL cold hypertonic buffer with
incubating on nutator at 4ºC for 30 mins. Solutions were Centrifuged at 14,000 rpm
and the supernatant(nuclear extract) was stored at -80ºC.

32
2.3.13.4 Gel preparation, running and exposure
The gel was performed in large Owl electrophoresis apparatus.
For the 5.5%/1x TGE gel:
5.5mL 30%Acrylamide:bis-acrlamide
8mL 5x TGE
26.5mL MQ H2O
40μL TEMED
240μL 10% APS
Pre-electrophoresis was performed in 1x TGE at 30 mA for 30 mins. Binding
reactions were loaded as well as free probe containing visible loading buffer.
Electrophoresis was performed at 35mA until free probe was 1/2 cm from the bottom
and plates were separated. Gel stuck to one of the plates and a piece of whatman was
used to cover the gel and remove it from plate. The gel was dried by the gel dryer and
leaved in a cassette to expose for 2 days and visualised by Typhoon scanner.
2.3.14 Immunofluorescence
Cells were transfected in 35mm dish and grown for 48 hours. Media was removed
gently and cells were washed once with PBS. The PBS was aspirated and 1mL PFA
was added with incubation at RT for 15 mins folloed by 3 PBS washes.1% TritonX-
100 PBS was added for another 15 mins incubation. 10% HS was diluted in 0.25%
TritonX-100 PBS for blocking and incubated at RT for 30 mins. Primary
antibody(Sox2 antibody 1 in 700 dilution) was diluted in 0.25% TritonX-100 PBS as
well and incubated in the fridge overnight. Cells were washed 3 times with PBS and
incubated with the secondary antibody (Cy3 anti-rabbit 1 in 500 dilution) diluted in
0.25% TritonX-100 PBS. The solution was incubated at RT for 1 hour and washed
with PBS 3 times, covered in DAPI and coverslipped. Fluorescence images were
obtained using Zeiss Axioplan 2 at 20x, 63x and 100x magnification. Oil immersion
was added when using the 63x and 100x objective lens.

33
2.3.15 Dual-Luciferase Reporter Assay
105 cells per 500μL 293T cells were cultured in 24-well trays in 10% FCS DMEM for
the Luciferase Assay overnight. Appropriate amounts of plasmids (expression
plasmid, PGL3-promotor vector and pRL-CMV vector) were mixed with suitable
ratio of Fugene HD for 15 mins. The mixture was then added equally to each well and
cultured in 37ºC, 5%CO2 for 24 hours.
Culture medium was aspirated and 1x PBS was added gently to wash the cells. 100μL
1x passive lysis buffer was added to each well and rotated for 15 mins. Suspended
cells were transferred to new eppendorf tubes and were centrifuged at 14,000 rpm for
30 secs. 10μL of the supernatant was taken from each well and added to 96-well plate.
GloMax™ 96 Microplate Luminometer and GloMax software were used to do this
assay. For measurement, 1 sec delay and 10 sec read time was determined; 75μL of
LARII was dispensed to measure luciferase activity and 75μL of Stop & Glo®
Reagent was dispensed to measure the Renilla luciferase activity.
2.3.16 qPCR
15μL qPCR reactions in 96 wells consisted of 50% Fast SYBR Green, approximately
5 ng template cDNA, 200nM forward and reverse primers concentration and MQ
H2O. Each samples were done in triplicate. Quantitative reaction were proceeded
using an Applied Biosystems Step one Plus thermo cycler, with the parameters:
Enzyme activation at 95ºC for 20 secs; denature at 95ºC for 3 secs, anneal and extend
at 60ºC for 30 secs for 39 cycles. Using the prism 6 to deal with the data after
analysis.

34
3
Chapter 3. Results

35
To analyze the SOX3 TF binding at the Dbx1 locus in vitro, probes containing the
putative binding sequences were designed for both EMSA and Dual-Luciferase
Reporter Assays. Based on the ChIP-seq data combining the mouse genome sequence
(see Figure 1.6), it is obvious there are 5 possible specific binding sites in/near the
Dbx1 gene. According to the consensus binding sequence of Sox3 in NPCs (see
Figure 1.4) and the 5 potential SOX3 binding sites in/near Dbx1 identified by ChIP-
seq (see Figure 1.6), 5 probes containing the potential binding site (Figure 3.1) were
designed as well as a positive control and a negative control. The negative control was
a scrambled sequence not containing any SOX binding motifs.
3.1 Optimization of the SOX3 TF expression
To perform gel shift analysis of the putative SOX3 binding sites, a source of SOX3
protein is required. Human Embryonic Kidney 293T cells are a common cell type for
overexpressing high levels of protein in vitro. Three Sox3 overexpression plasmids
previously generated in the Thomas lab were assessed for SOX3 expression levels;
pSox3-Myc, pSox3-IRES2-eGFP and pSox3-flag. Each construct was transfected into
293T cells with FugeneHD, at a 3:2 ratio FugeneHD:DNA, pN1-IRES-EGFP was
also transfected into a separate poplutaion of cells as a transfection efficiency control.
Cells were collected 48 hours post transfection followed by nuclear protein
fractionation. Protein lysates were run on 4-12% SDS PAGE followed by Western
blot analysis using anti-SOX3 antibody. pSox3-IRES2-EGFP and Sox3-myc
expression plasmid generated the highest levels of SOX3 expression, with a band at
approximately 42kDa (figure 3.2A). Western blot was repeated with only pSox3-
IRES2-EGFP and Sox3-myc transfected cells and Anti-H3 antibody was used as a
loading control (figure 3.2B).
As EMSA requires high transfection efficiency, optimization of transfection was
performed with the pSox3-IRES2-EGFP and Sox3-myc expression constructs using
varying Fugene to DNA ratios (3:2, 4:2, 5:2, 6:2, 7:2 and 8:2). Transfection efficiency
was observed by fluorescent microscopy (Nikon TE300) at excitation wavelength of
558nm to assess eGFP levels with only pSox3-IRES2-EGFP transfected cells as Sox3-
myc won’t express GFP. Visualisation of GFP positive cells by flouescent microscope
showed ratios 5:2 and 7:2 had the highest GFP expression (figure 3.3A, figure 3.3B);
and the Western blot indicated that the 7:2 ratio gave the highest expression of SOX3

Figure 3.1: 5 pairs of probes containing the five potential SO
X3 preference
binding motif highlighted in red, each have E
coRⅠ
overhangs(5’aatt3’).
Dbx1-1
Dbx1-2
Dbx1-3
Dbx1-4
Dbx1-5

1 2 3 4 5 6 7
Figure 3.2A: W
estern blot of the SO
X3 protein in 293T cells transfected by
different Sox3 expression plasm
ids. Lane 1:Protein m
arker; lane 2 to 3 were
nontransfected; lane4 to7 were cells transfected by N
1-IRE
S-E
GFP, S
ox3-Myc,
Sox3-IR
ES
-eGFP
and Sox3-flag, respectively.S
ox3-Myc and S
ox3-IRE
S-eG
FP
showed expression in 293T cells. U
pper arrowhead is 50 kD
; lower arrow
head is 37 kD
. This is an anti-SO
X3 antibody.
1 2 3 4 5
50kD
37kD
25kD
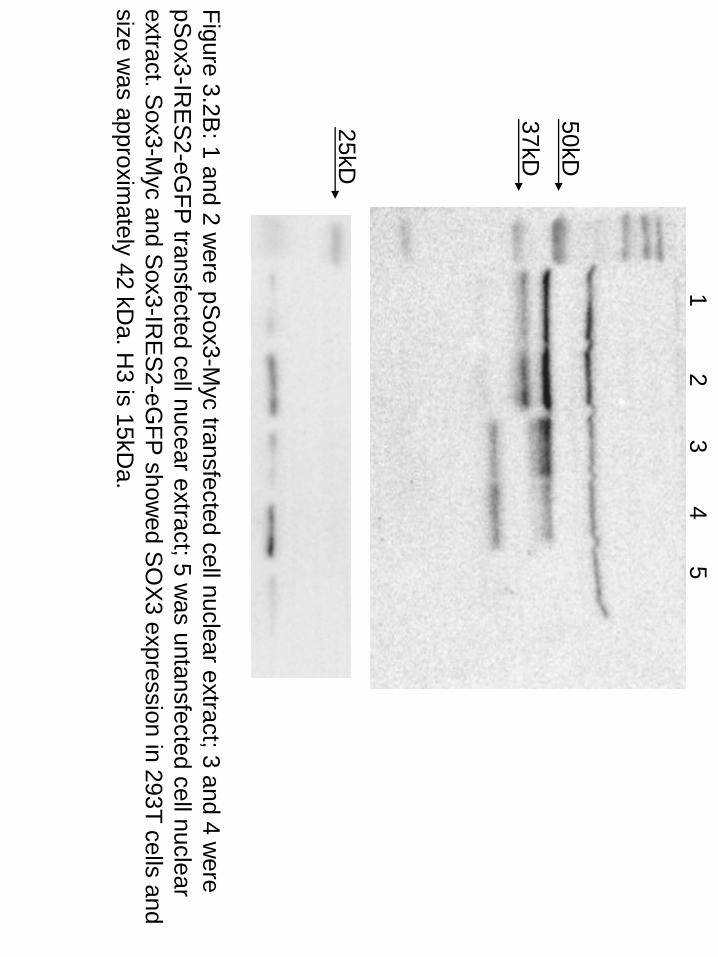
Figure 3.2B: 1 and 2 w
ere pSox3-M
yc transfected cell nuclear extract; 3 and 4 were
pSox3-IR
ES
2-eGFP
transfected cell nucear extract; 5 was untansfected cell nuclear
extract. Sox3-M
yc and Sox3-IR
ES
2-eGFP
showed S
OX
3 expression in 293T cells and size w
as approximately 42 kD
a. H3 is 15kD
a.

Fugene :plasmid=3:2
4:2 5:2
6:2 7:2
8:2
Figure 3.3A: D
ifferent ratio of Fugene to plasmid S
ox3-IRE
S-eG
FP in
transfection. It was photographed by the U
V m
icroscope with eG
FP filter.5:2 and
7:2 showed better eG
FP expression.

Fugene :plasmid=3:2
4:2 5:2
6:2 7:2
8:2
Figure 3.3B: phase contrast im
ages of different ratio of Fugene to plasmid S
ox3-IR
ES
-eGFP
in transfection. Total number of cells in each dish is about the sam
e.
36
(figure 3.4). The ratio of 7:2 with plasmid Sox3-pIRES2-EGFP was selected for the
EMSA.
3.2 Assessing the DNA binding properties of SOX3 at putative Dbx1
binding sites by EMSA
The Electrophoretic Mobility Shift Assay (EMSA), also known as the gel shift assay,
is commonly used to measure the specific DNA binding activity of a protein of
interest that has been purified or generated in cultured cells through transfection of an
expression construct (Hellman and Fried 2007). If a protein:DNA interaction occurs,
the radiolabelled (32P) probe containing the putative binding site will migrate more
slowly than unbound probe. Accordingly, this sensitive and simple method was used
to assess SOX3 binding to the Dbx1 sequences.
Initial EMSA experiments tested three probes, Dbx1-1, Dbx1-neg and Dbx1-pos, for
interactions with SOX3, using 12ug of nuclear extract which came from Sox3-
transfected and non transfected cells. No bands were observed on the gel after 48
hours exposure, nor was any free probe observed.
Then, to optimize the amount of nuclear extract, as the protocol (Hapgood, Cuthill et
al. 1989; 2012) indicated that 8-16μg of nuclear extract was needed in each reaction,
12μg Sox3-transfected nuclear extract and double amount (24μg) as well as 12μg
untransfected 293T cell nuclear extract were used in conjunction with the Dbx1-1,
Dbx-neg and non probes. These samples generated a very faint band without any
different between the Dbx1-1 and Dbx-neg (figure 3.5A).
Subsequently, to confirm whether this assay can work, a positive control containing
the SOX motif (5-agctcaaacaaataaacaattaactc-3)_previously shown to bind SOX3
(Woods et al, 2005) was used, while keeping the lysate constant at 24μg. Sox3
transfected samples displayed darker bands than the untransfected but still without
significant difference between both Dbx-pos and Dbx-neg probes (figure 3.5B). As it
was not possible to obtain consistent results with the gel shift assay, an alternative
approach (the Dual luciferase reporter assay) was used (see Section 2.5).

Neg - + - - + - - + -
Dbx1-1 + - - + - - + - -
2×
Sox3 S
ox3 control
Neg - + - - - + - -
Dbx1-1 - - + - - - + -
Pos - - - + - - - +
Control S
ox3 Figure 3.5 D
bx1-1 did not display a binding specificity distinct from D
bx-neg and Dbx1-pos. (A
)Sox3
gel shift assay. Low m
olecular weight nonspecific bands w
ere observed in most lanes, including the
untransfected lysate(lanes 7-9) (B) no difference betw
een Dbx-pos (lane 8) and D
bx-neg (lane 6).
A
B
1 2 3 4 5 6 7 8 9 1 2 3 4 5 6 7 8

1 2 3 4 5 6 7 8 9 10 11 12
Figure 3.4: 293T transfection optimisation. W
estern blot of cell lysates transfected w
ith varying Fugene:DN
A ratios of 3:2, 4:2, 5:2, 6:2, 7:2, 8:2 for both S
ox3-IRE
S-E
GFP
(lanes1-6) or Sox3-m
yc (lanes 7-12), respectively. Lane 5 (Fugne : S
ox3-IRE
S-eG
FP=7:2) expressed the highest S
OX
3 protein in 293T cells.
50kD
37kD

37
3.3 Construction and expression of Sox2-pIRES2-EGFP
To address the ability of SOX2 to bind the Dbx1 regulatory regions we required a
SOX2 expression vector. To generate the Sox2 expression vector multiple methods
were used. In an attempt to subclone the Sox2 ORF from pcDNA3.1-myc-Sox2, the
ORF was removed from this Sox2 plasmid (already available in the Thomas
laboratory) with XhoI and SalI and gel purified. The purified product was then ligated
into pIRES-EGFP, linearized with XhoI and SalI and transformed into DH5a cells.
However, no colonies were observed.
Next, a Sox2 ORF PCR product was produced from pCl-neo-Sox2 with Pfu DNA
polymerase and ligated into EcoRI-digested pBluescript vector. Through Blue-white
selection, the recombinant vector was generated. Sequencing the vectors highlighted
several mutations within each vector. The PCR was repeated several times with either
Taq polymerase, giving no PCR product or Pfu polymerse, however all clones
contained error according to the sequencing.
Finally, pcDNA3.1 myc-Sox2 was digested with AgeIand XhoI. pIRES2-EGFP was
linearised with XhoI and XmaI (AgeI(A/CCGGT) and XmaI(C/CCGGG) would
produce the compatible sticky ends) (see figure3.6). The recombinant vector was
digested and checked by XhoIand PstI(see figure 3.7) and validated by Sanger
sequencing.
To confirm the expression of SOX2 from the Sox2-pIRES2-EGFP expression
construct, it was transfected in 293T cells as described above for the Sox3 expression
experiments. Protein lysates from the transfected cells were run on a SDS-PAGE,
transferred to nitrocellulose membrane and analyzed by western blot with anti-SOX2
antibody (figure 3.8A) and repeated western blot with anti-beta-tubulin-antibody as a
loading control (figure 3.9B). A band was observed at ~35kDa (the expected size) in
the transfected lane and not in the untransfected control (figure 3.8). In addition to the
western blot, immunofluorescence was performed using an anti-Sox2 antibody to test
the expression and localisation in cells. SOX2 expression was observed in the
nucleus of Sox2-pIRES2-EGFP transfected cells, while no expression was observed in
pIRES2-EGFP transfected cells (see figure 3.9).

Digested w
ith the X
ho1 and Age1
Digested w
ith the X
ho1 and Xm
a1
Ligation
Figure 3.6: Schem
atic diagram of the construction of the S
ox2-IR
ES
-eGFP
vector
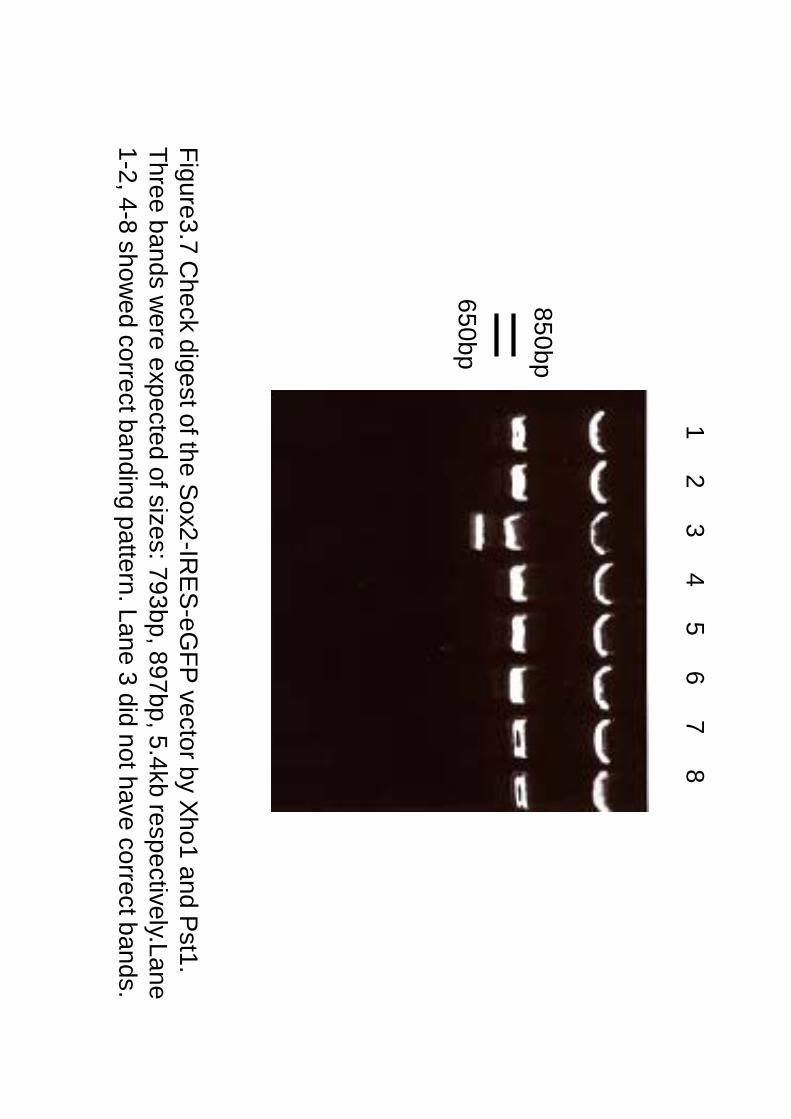
Figure3.7 Check digest of the S
ox2-IRE
S-eG
FP vector by X
ho1 and Pst1.
Three bands were expected of sizes: 793bp, 897bp, 5.4kb respectively.Lane
1-2, 4-8 showed correct banding pattern. Lane 3 did not have correct bands.
1 2 3 4 5 6 7 8
850bp
650bp
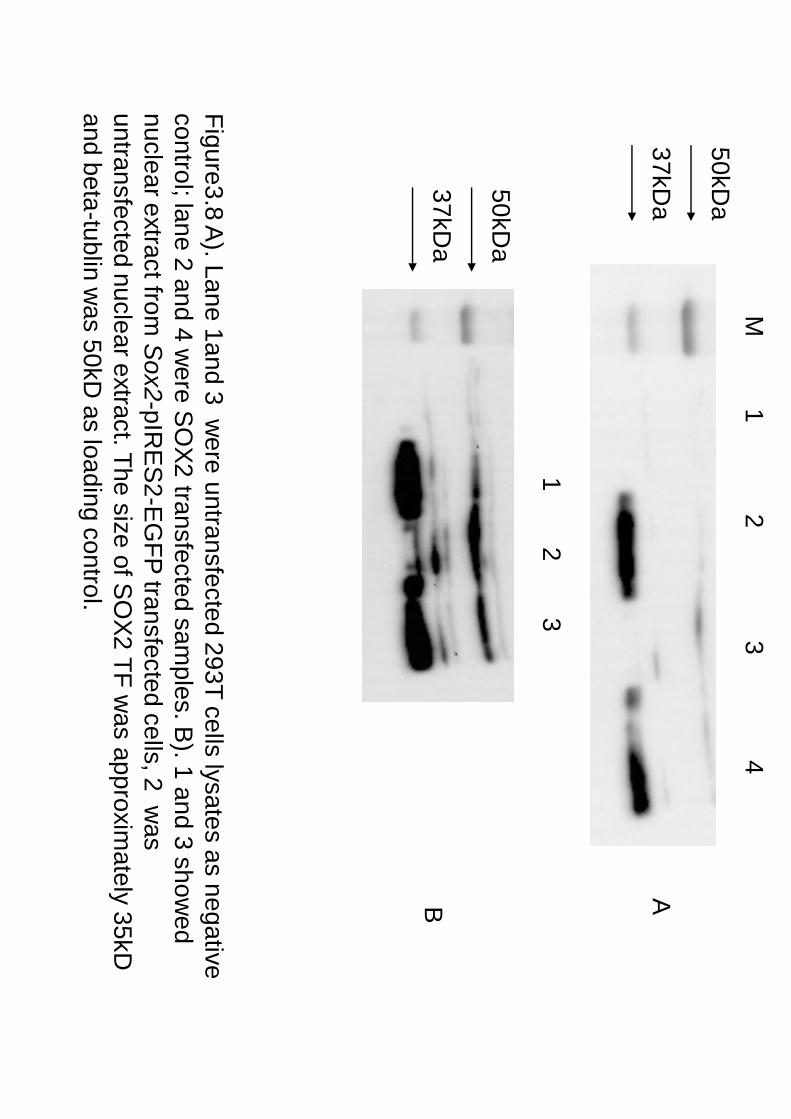
Figure3.8 A). Lane 1and 3 w
ere untransfected 293T cells lysates as negative control; lane 2 and 4 w
ere SO
X2 transfected sam
ples. B). 1 and 3 show
ed nuclear extract from
Sox2-pIRE
S2-E
GFP
transfected cells, 2 was
untransfected nuclear extract. The size of SO
X2 TF w
as approximately 35kD
and beta-tublin w
as 50kD as loading control.
50kDa
37kDa
1 2 3 4
50kDa
37kDa
1 2 3
M
A B
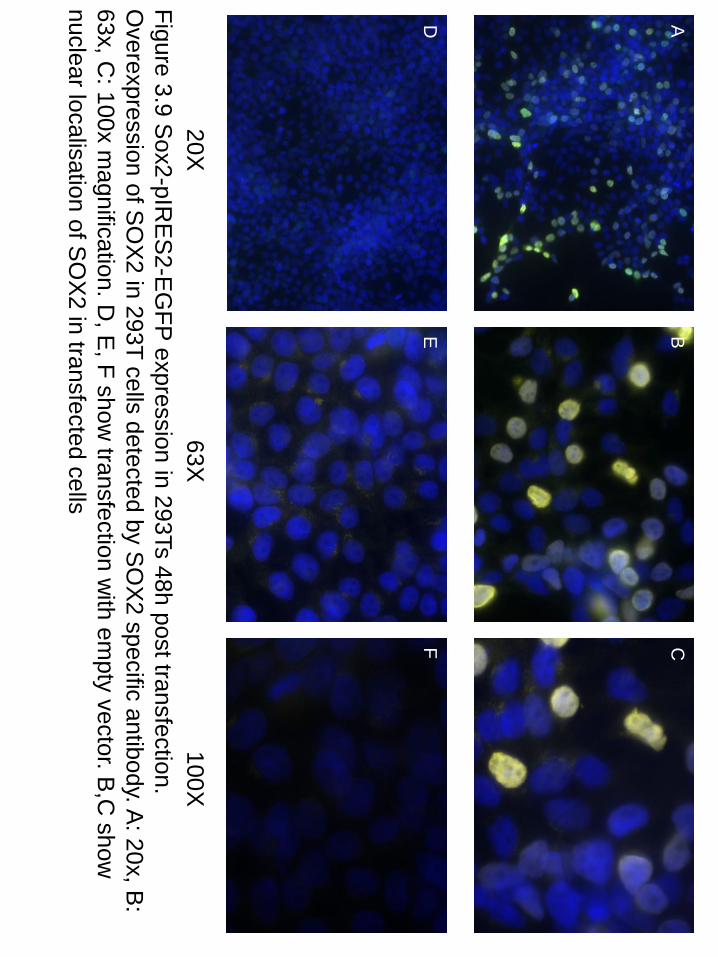
20X
100X
63X
Figure 3.9 Sox2-pIR
ES
2-EG
FP expression in 293Ts 48h post transfection.
Overexpression of S
OX
2 in 293T cells detected by SO
X2 specific antibody. A
: 20x, B:
63x, C: 100x m
agnification. D, E
, F show transfection w
ith empty vector. B
,C show
nuclear localisation of S
OX
2 in transfected cells
A
B
C
D
E
F

38
3.4 Dual-Luciferase Reporter Assay
Dual-Luciferase Reporter Assay is another common technique to study the
transcriptional activity of putative regulatory regions in cells. The putative regulatory
region is cloned before a luciferase reporter. When the transcription factor binds at
this region, it can activate the expression of the reporter. Upon addition of appropriate
substrate, the signal is amplified providing a highly sensitive method for assessing
transcriptional activity. This assay was used as an alternative method to study the
binding activity of SOX3 at specific sequences in/near Dbx1.
Initially, expression plasmids were transfected into 293T cells with the following
Fugene:DNA ratios, Sox3-pIRES2-EGFP /pIRES2-EGFP: pGL3-SOCM/pGL3-
empty: pRL-CMV=110ng: 80ng: 10ng with 0.6μL Fugene HD. Unfortunately, there
was no significant difference between either the negative control or the (data not
shown).
To reduce the background level as much as possible and to optimize the amount of
signal generated from the assay, the ratio of either Fugene:DNA or Reporter:Sox3
plasmids was altered (see Figure 3.10A). Increasing the Fugene:DNA ratio did not
change the transcriptional reporter levels. Adjusting the ratio of SOX3:reporter did
vary the transcriptional output. From the data (see Figure3.10B), the ratio of Sox3-
pIRES2-EGFP:pGL3-SOCM:pRL-CMV=100ng: 280ng: 10ng with 1.8μL Fugene
showed the best activity.
To demonstrate that SOX3 overexpression was responsible for the observed reporter
activity, the amount of SOX3 expression plasmid was increased relative to a constant
amount of reporter plasmid (figure 3.10C). By increasing the amount of SOX3
expression plasmid from 0ng to 1000ng, we observed an increase in reporter activity
relative to the amount of expression plasmid (figure 3.10D), pcDNA3.1 was added to
maintain total DNA amounts. Sox3-pIRES2-EGFP:pGL3-SOCM:pRL-
CMV=1000/3ng: 280ng: 10ng with 1.2μL Fugene showed the highest RLU activity,
and was used for the remaining reporter assays.

-0.01 0
0.01
0.02
0.03
0.04
0.05
0.06
12
34
56
78
RLU
Sox3-gfp/SOCM
0
0.005
0.01
0.015
0.02
0.025
0.03
0.035
0.04
0.045
0.05
12
34
56
78
RLU
pcDNA/SOCM
Sox3-gfp/SOCM
A
D
C
B
Figure 3.10 Optim
ization of the Dual-Luciferase R
eporter Assay. (A
) Am
ounts of DN
A added in each w
ell in triplicate; (B) no difference w
as observed for transfections 1-5. The optimal
plasmid:Fugene ratio w
as determined to be #7 ; (C
) the amount of plasm
id added in each well in
triplicate; (D) D
ual-Luciferase Reporter A
ssays results of (C), (blue) pcD
NA
, (red) Sox3-pIR
ES
2-E
GFP. 5-8 dem
onstrated dose dependent response. The optimal plasm
id:Fugene ratio was
determined to be #8. R
LU: relative luciferase units. E
rror bars represent standard deviation.

39
To begin to assess Sox3 binding to the Dbx1 sites, Dbx1-1-pGL3 and Dbx1-4-pGL3
reporter vectors were generated through two steps: ligating dsOligos into pBluescript
and subcloning them into the pGL3-basic vectors. As the annealed Dbx1 probes
contained EcoRI overhangs they were ligated into EcoRIdigested pBluescript.
Successful transformants were selected by the means of white-blue colour selection,
followed by restriction enzyme digestion (figure 3.10E), and sequencing data. Dbx1-
1-pGL3, Dbx1-4-pGL3 were successfully constructed.
Finally, using the optimized luciferase assay (figure 3.10C and D), the transcriptional
activity of SOX2 and SOX3 was tested separately for activity on the Dbx1-1-pGL3
and Dbx1-4-pGL3 reporter vectors. No significant difference was observed between
the positive control and negative control for both Sox2 and Sox3 expression plasmids.
The Dbx1-4-pGL3 transfected cell lysate were lower than the negative control,
however the Dbx1-1-pGL3 reporter showed statistically higher activity compared
with either the empty reporter plasmid or the SOCM reporter for both SOX2 and
SOX3 (figure 3.11).
3.5 real-time PCR analysis of Sox3-null mouse at E9.5
Real-time PCR is a technique to infer the relative amount of a gene transcript in a
sample. qRT-PCR provides relative differences in gene expression compared to a
known constant within each sample, a reference gene, in this case ActB. Considering
Dbx1 expression is reduced in the developing spinal cord (N.Rogers, unpublished
data), we decided to check the expresson levels of other spinal cord development
marker genes in Sox3 null embryos (Pierani et al. 2001, and Oosterveen et al.2013).
For the purpose of comparing ventral neural tube marker genes’ expression between
WT and Sox3 KO samples, qPCR was performed using cDNA samples produced
from RNA extracted from whole embryos of 4 WT and 3 KO E9.5 mouse embryos.
Expression of Sox3, Sox1, Sox2, Dbx1, Pax6, Ngn2, Neurod4, Olig2, Nkx2.9, Nkx6.1
and Nkx6.2 was measured by qPCR. Sox3, Dbx1, Pax6, Ngn2 and Olig2 all showed
significant decrease in Sox3 null mice compared to WT. Conversely, Sox1, Sox2,
Nkx2.9, Nkx6.1 and Nkx6.2 revealed no changes. Neurod4 was also decreased in the
KO, however this was not statistically significant (p=0.0674) (see figure 3.12 and

40
3.13). Together, these data show for the first time that, in addition to Dbx1, several
genes that have important roles in neural development are abnormally expressed in
Sox3 KO embryos.

A
B
figure 3.10E: digestion and checking D
bx1-1-PG
L3(A) and D
bx1-4-PG
L3. (A
) digested by Afl2 and X
baI, and expected to be digested to~1900bp and ~3100bp; (B
) digested by XbaI and expected to be ~2000bp and ~3000bp
3,000bp
2,000bp
1,500bp
3,000bp
2,000bp
1,500bp

0
0.02
0.04
0.06
0.08
0.1
0.12
0.14
0.16
PGL3-SOCM
Dbx1-1-PGL3
Dbx1-4-PGL3
PGL3-empty
RLU
Sox2-gfp
Sox3-gfp
Figure3.11 Luciferase reporter assays comparing S
OX
2/3 activity on Dbx1-
1/Dbx1-4 reporter constructs. The am
ounts of these two plasm
ids came
from the previous optim
ization. Positive control (P
GL3-S
OC
M) and
Negtive(P
GL3-em
pty) did no difference; Dbx1-4-P
GL3 dem
onstrated lower
RLU
than PG
L3-emty w
ith both Sox2 and S
ox3 expression vectors; how
ever, Dbx1-1 show
ed higher activity than Dbx1-4. R
LU: relative
luciferase units. Error bars represent standard deviation.
* *
* *

Figure3.12 Com
parative mR
NA expression of Sox3, D
bx1, Ngn2, Pax6 and
Olig2 relative to β-actin. A significant decrease in gene expression is
observed by qPC
R betw
een WT and Sox3 null em
bryos for all genes. n≥2, error bars represent standard deviation. *: P
≤0.05, **: P ≤ 0.01, ***: P
≤ 0.001, ****: P
≤ 0.0001.

Figure 3.13 Gene expression of Sox1, Sox2, N
eurod4, Nkx2.9, N
kx6.1 and N
kx6.2 relative to β-actin. The results show no significant change in gene
expression between W
T and Sox3 null embryos. P
value’s for Neurod4 and
Nkx6.2 w
ere 0.0674 and 0.0765 respectively, both of which w
ere not quite significant. n≥2, error bars represent standard deviation.

41
4
Chapter 4. Discussion

42
Current data suggests Dbx1 may be directly regulated by SOX3; microarray and qRT-
PCR evidence shows a 2-2.5 fold down regulation of Dbx1 in NPCs and embryos that
lack Sox3 (N Rogers, unpublished data), and recently published ChIP-seq data
indicates 5 SOX3 binding sites in or near the Dbx1 locus (Bergsland, Ramskold et al.
2011). The overall aim of this project was to confirm the regulation of Dbx1 by SOX3
in vitro.
Initially, EMSA was selected as a method to assess SOX3 binding to Dbx1 sites. This
method can be performed using lysates derived from cells transfected with an
expression construct encoding the transcription factor of interest. Therefore, SOX3
expression plasmids were assessed for their level of expression by western blot
analysis. It was identified that transfecting Sox3-pIRES2-EGFP with Fugene at a 7:2
ratio into 293T cells provided the best transfection efficiency by both Western blot
analysis for SOX3 (Figure 3.4) and EGFP positive cell count (Figure 3.3). EMSA
requires high levels of SOX3 expression, therefore optimizing transfection efficiency
should aid in producing successful EMSA experiment.
The EMSA did not show any evidence of any bands (Figure 3.5A) and unlike
published EMSA data, very little free probe was observed at the bottom of the gel
(Woods, Cundall et al. 2005), even under conditions where no protein was added to
the reaction (ie. the “probe-only” control). Therefore, it is possible that the Klenow
radiolabelling reaction was not efficient, possibly due to the age of the enzyme stock
used for these studies. The lack of a positive control probe also made it difficult to
identify the source of the problem.
The EMSA was repeated using fresh Klenow as well as including a positive control
probe that was previously shown to bind SOX3 (Woods et. al 2005). Several faint
bands were present on this EMSA, however all bands were background bands present
in both experimental and either non transfected or negative control probe lanes
(Figure 3.5B).
There are several possible explanations as to why the EMSA experiments did not
work. One possibility is the SOX3 expression level was not sufficient for EMSA. As
transiently transfected cells were used the amount of expression can vary greatly and

43
is dependent of the efficiency of transfection. An alternative method would be to
make stable cell lines overexpressing SOX3 as all cells would be overexpressing
SOX3 giving much higher and consistent protein levels. Secondly, as mentioned
above, there was never a strong free probe signal which could be the due to using old
radioactive isotopes that may no longer give a strong signal due to relatively short half
life. However, multiple batches were used, at the peak of their signal with no increase
in strength of the free probe, as such it seems unlikely. Another possibility is the
Klenow labeling was not efficient. Hence, Fluorescence-based EMSA techniques
could be applied in the future as these can quantify the amount of protein and DNA
rigorously which is better for analyzing the results (Jing, Agnew et al. 2003). Finally,
the binding reaction of the DNA to protein may require further optimization by
altering buffer conditions or cell concentration or incubation time. Unfortunately due
to time constraints, I was not able to verify the binding activity of SOX3 to Dbx1
regulatory regions through EMSA.
To assess the potential binding of SOX2 to the Dbx1 sites, it was necessary to
generate a SOX2 expression construct. Construction of the Sox2-pIRES2-EGFP
vector by direct subcloning the Sox2 ORF from pCI-neo-Sox2 into p-IRES2-EGFP
did not produce any clones containing the Sox2 ORF. The same restriction sites were
used to both remove the ORF and linearise the donor vector, removing the possibility
of incompatible ends. As an alternative method, PCR based amplification using Pfu
polymerase and cloning was used to generate the expression vector. Although several
positive clones were sequenced, mutations were identified within all clones that were
analysed. This PCR was repeated several times however the number of mutations did
not reduce. Taq polymerase was used as an alternative polymerase, even though it is
not a proof reading enzyme. Unfortunately Taq produced no PCR products under a
range of different buffer conditions. A final attempt to generate a Sox2 expression
vector involved subcloning the Sox2 ORF from pcDNA3.1myc into pIRES2-EGFP.
AgeI and XmaI produce compatible restriction sites, therefore these enzymes in
conjunction with XhoI were used for subcloning. The Sox2 expression plasmid was
successfully cloned and the sequence was verified by Sanger sequencing.
Expression of SOX2 from the expression plasmid was confirmed by both Western
blot (figure 3.8) and immunofluorescence (figure 3.9). The Western blot showed

44
bands corresponding to the expected size of SOX2 in the transfected lanes and not in
the negative control (figure 3.8). The expression construct was also tested by
immunofluorescence. Cells transfected with either Sox2-pIRES2-EGFP or pIRES2-
EGFP (negative control) were compared to one another thorough use of an α- Sox2
antibody. No staining was observed in the negative control while distinct staining was
present in the nuclei of Sox2-pIRES2-EGFP transfected cells (figure 3.9). The Sox2
expression plasmid contains an IRES EGFP reporter cassette to aid in identifying
successfully transfected cells. Among all the SOX2 positive cells not all expressed
EGFP (data not shown). As EGFP is expressed from an IRES it is possible that not all
cells express EGFP to the same level. Another possibility is that EGFP antibody was
not as sensitive as the SOX2 antibody and therefore could not detect relatively low
levels of EGFP in transfected cells.
Given the difficulty in optimizing the EMSA experiments, transactivation reporter
assays were instead used to assess SOX3 binding at Dbx1-associated genomic sites.
Initial luciferase reporter assays showed no difference between SOCM-pGL3
(positive control reporter) and pGL3-empty (negative control vector) activity in
response to overexpression of SOX3 (data not shown). Therefore, in order to get a
response from the SOCM-pGL3 reporter, the ratio of the SOCM-pGL3 with Sox3-
pIRES2-EGFP as well as Fugene was optimized. Altering the Fugene to DNA ratio in
experiment 1 to 3 did not change the level of activity of the SOCM reporter (Figure
3.10A&B). This suggests that the lack of response is not caused by transfection
efficiency. Then, altering the relative amount of Sox3-pIRES2-EGFP and SOCM-
pGL3 showed an increase in the activity where the best response over background is
seen in experiment 7. This indicates that the expressing protein to reporter vector ratio
is critical in generating a luciferase reporter response. Next, the amount of Sox3-
pIRES2-EGFP was changed while the SOCM-pGL3 was constant. It is expected that
by increasing the amount of SOX3 transfected into the reporter assay would give a
dose dependant response (Wong, Farlie et al. 2007), however, when the amount of
Sox3-pIRES2-EGFP was increased from 300ng to 1500ng no difference in
transactivation was observed (data not shown). One explanation was that the total
amount of plasmid was not equal in each transfection. Therefore, pIRES2-EGFP was
used to keep the total amount of DNA transfected the same. Increasing the amount of

45
SOX3 gave a corresponding increase in activity, compared to the empty pcDNA
negative control (figure 3.10D).
Using the conditions identified above, the amount of Sox3 plasmid was increased to
see if there is a dose dependent response (figure 3.10C&D). The conditions identified
to give the best response (840ng SOCM: 1000ng Sox3-pIRES2-EGFP : 5.4uL
Fugene) were then used to analyse the response of Dbx1-1 and Dbx1-4 reporter
constructs. Accordingly, optimized ratio of the Fugene to DNA referring to
experiment 7&8 in figure3.10D were performed with SOCM-pGL3, Dbx1-1-pGL3,
Dbx1-4-pGL3, empty-pGL3 and Sox3-pIRES2-EGFP. No significant difference was
seen between positive and negative control while the negative control showed higher
luciferase activity than Dbx1-4 (figure 3.11). However, Dbx1-1-pGL3 reporter
showed statistically higher activity compared with either the negative control reporter
or the SOCM reporter for both SOX3 and SOX2. Although the activation of the
Dbx1-1 reporter was statistically higher than both the positive and negative controls,
this is only one experiment and further repeats would be required to gain confidence
in the results. This is consistent with what has been observed by ChIP-PCR
(McAninch, D., Unpublished data) where Dbx1-1 showed stronger enrichment than
Dbx1-4.
To determine whether the cellular context has an impact on SOX3-mediated
activation of the Dbx1 sites, cotransfection reporter assays were also performed using
Cos-7 cells. However, due to time constraints, this experiment was attempted only
once and no activation was seen by SOX3 with SOCM compared to empty pGL3.
One reason was that the signal from the positive control was not particularly high
(compared to the negative control) even though the SOCM-pGL3 had 4 repeated
binding sites. It might be necessary to clone the Dbx1 probes into pGL3 as
concatamers to increase the response observed. Furthermore the optimization of the
ratio of the three vectors was not sufficient; a greater response is required for the
positive control above background. Another option to improve this assay would be to
try mouse P19 cells as they may express cofactors that may be required for more
efficient transactivation. It was observed in Oosterveen’s recent study in 2013
(Oosterveen, Kurdija et al. 2013) that co-activators might also be needed to activate
the binding interaction, such as P300. However, referring to Dale’s ChIP-seq data, site

46
1 showed stronger binding activity than site 4, which is consistent with the existing
data.
As Sox3 plays important roles in brain development, a lot of studies have been
analyzed upon its function as well as expression. However, little is known about the
direct targets of Sox3. Recently, a landmark study focusing on identification of SoxB1
binding in neuroprogenitor cells has been published which has provided valuable
information on the target genes of Sox3 (Bergsland, Ramskold et al. 2011;
Oosterveen, Kurdija et al. 2012; Oosterveen, Kurdija et al. 2013). Besides that,
according to the expression of dorsoventral neural tube development marker genes in
other articles, we determined to use the qPCR as an approach to analyze the
expression difference of some of the marker genes between E9.5 Sox3 null and WT
samples.
As expected, Sox3 was virtually undetectable in the Sox3 null embryos and Dbx1 was
significantly downregulated (consistent with the unpublished results of Nicholas
Rogers). Interestingly, Ngn2, Pax6 and Olig2 were all significant down-regulated.
Pax6, Olig2 and Ngn2 are all regionally restricted marker genes in the neural tube
which are likely coexpressed with Sox3, indicating that they may be direct or indirect
targets of Sox3. While some of genes were not changed, like Sox1 and Sox2, which
means no influence upon the other two SOXB1 family members in Sox3 null mice, as
a consequence, they might compensate for some loss of function by the absence of
Sox3. For the Neurod4 gene there was a trend towards lower expression in the KO
embryos. Additional samples would be required to determine the significance of
these data. Nkx2.9, Nkx6.1 and Nkx6.2 were not changed between the WT and KO.
One explanation was that the changes were delayed (ie. not present at this timepoint)
while another was that they were not the targets of Sox3 at all. For the future, given
that Dbx1 is downregulated in the Sox3 null embryos and that DBX1 controls V0
neuron differentiation via Evx1 (Pierani, Moran-Rivard et al. 2001), it would be
interesting to assess whether Evx1 expression is also decreased in the Sox3 null
mutant embryos. Unfortunately, due to the primers not performing and time
constraints, Evx1 expression could not be performed as part of this project.

47
References Archer, T. C., J. Jin, et al. (2011). "Interaction of Sox1, Sox2, Sox3 and Oct4
during primary neurogenesis." Developmental biology 350(2): 429-440. Bergsland, M., D. Ramskold, et al. (2011). "Sequentially acting Sox transcription
factors in neural lineage development." Genes & development 25(23):
2453-2464. Bowles, J., G. Schepers, et al. (2000). "Phylogeny of the SOX family of
developmental transcription factors based on sequence and structural indicators." Developmental biology 227(2): 239-255.
Briscoe, J., A. Pierani, et al. (2000). "A homeodomain protein code specifies progenitor cell identity and neuronal fate in the ventral neural tube." Cell 101(4): 435-445.
Bylund, M., E. Andersson, et al. (2003). "Vertebrate neurogenesis is
counteracted by Sox1-3 activity." Nature neuroscience 6(11): 1162-1168. Causeret, F., M. Ensini, et al. (2011). "Dbx1-expressing cells are necessary for
the survival of the mammalian anterior neural and craniofacial structures." PloS one 6(4): e19367.
Collignon, J., S. Sockanathan, et al. (1996). "A comparison of the properties of Sox-3 with Sry and two related genes, Sox-1 and Sox-2." Development 122(2): 509-520.
Foster, J. W. and J. A. M. Graves (1994). "An Sry-Related Sequence on the
Marsupial X-Chromosome - Implications for the Evolution of the Mammalian Testisdetermining Gene." Proceedings of the National Academy of Sciences of the United States of America 91(5): 1927-1931.
Gubbay, J., J. Collignon, et al. (1990). "A gene mapping to the sex-determining
region of the mouse Y chromosome is a member of a novel family of embryonically expressed genes." Nature 346(6281): 245-250.
Guth, S. I. E. and M. Wegner (2008). "Having it both ways: Sox protein function between conservation and innovation." Cellular and Molecular Life Sciences 65(19): 3000-3018.

48
Hellman, L. M. and M. G. Fried (2007). "Electrophoretic mobility shift assay (EMSA) for detecting protein-nucleic acid interactions." Nature protocols 2(8): 1849-1861.
Hughes, J., S. Piltz, et al. (2013). "Mechanistic Insight into the Pathology of Polyalanine Expansion Disorders Revealed by a Mouse Model for X Linked Hypopituitarism." PLoS genetics 9(3).
Jessell, T. M. (2000). "Neuronal specification in the spinal cord: inductive signals
and transcriptional codes." Nature reviews. Genetics 1(1): 20-29. Jing, D., J. Agnew, et al. (2003). "A sensitive two-color electrophoretic mobility
shift assay for detecting both nucleic acids and protein in gels." Proteomics 3(7): 1172-1180.
Laumonnier, F., N. Ronce, et al. (2002). "Transcription factor SOX3 is involved in X-linked mental retardation with growth hormone deficiency." American journal of human genetics 71(6): 1450-1455.
Lefebvre, V., B. Dumitriu, et al. (2007). "Control of cell fate and differentiation
by Sry-related high-mobility-group box (Sox) transcription factors." The international journal of biochemistry & cell biology 39(12): 2195-2214.
Oosterveen, T., S. Kurdija, et al. (2012). "Mechanistic differences in the transcriptional interpretation of local and long-range Shh morphogen
signaling." Developmental cell 23(5): 1006-1019. Oosterveen, T., S. Kurdija, et al. (2013). "SoxB1-driven transcriptional network
underlies neural-specific interpretation of morphogen signals." Proceedings of the National Academy of Sciences of the United States of
America 110(18): 7330-7335. Pierani, A., L. Moran-Rivard, et al. (2001). "Control of interneuron fate in the
developing spinal cord by the progenitor homeodomain protein Dbx1." Neuron 29(2): 367-384.
Rizzoti, K., S. Brunelli, et al. (2004). "SOX3 is required during the formation of the hypothalamo-pituitary axis." Nature genetics 36(3): 247-255.
Rogers, N., P. S. Cheah, et al. (2013). "Expression of the murine transcription factor SOX3 during embryonic and adult neurogenesis." Gene expression
patterns : GEP 13(7): 240-248.

49
Schepers, G. E., R. D. Teasdale, et al. (2002). "Twenty pairs of sox: extent, homology, and nomenclature of the mouse and human sox transcription factor gene families." Developmental cell 3(2): 167-170.
Solomon, N. M., S. A. Ross, et al. (2004). "Array comparative genomic hybridisation analysis of boys with X linked hypopituitarism identifies a 3.9 Mb duplicated critical region at Xq27 containing SOX3." Journal of medical genetics 41(9): 669-678.
Sutton, E., J. Hughes, et al. (2011). "Identification of SOX3 as an XX male sex reversal gene in mice and humans." The Journal of clinical investigation 121(1): 328-341.
Wong, J., P. Farlie, et al. (2007). "Polyalanine expansion mutations in the X-
linked hypopituitarism gene SOX3 result in aggresome formation and impaired transactivation." Frontiers in Bioscience 12: 2085-2095.
Wood, H. B. and V. Episkopou (1999). "Comparative expression of the mouse Sox1, Sox2 and Sox3 genes from pre-gastrulation to early somite stages."
Mechanisms of development 86(1-2): 197-201. Woods, K. S., M. Cundall, et al. (2005). "Over- and underdosage of SOX3 is
associated with infundibular hypoplasia and hypopituitarism." American journal of human genetics 76(5): 833-849.