functional assessments, safety outcomes, and driving
TRANSCRIPT
DOT HS 811 630 August 2012
Functional Assessments, Safety Outcomes, and Driving Exposure Measures for Older Drivers
DISCLAIMER
This publication is distributed by the U.S. Department of Transportation, National Highway Traffic Safety Administration, in the interest of information exchange. The opinions, findings, and conclusions expressed in this publication are those of the authors and not necessarily those of the Department of Transportation or the National Highway Traffic Safety Administration. The United States Government assumes no liability for its contents or use thereof. If trade names, manufacturers’ names, or specific products are mentioned, it is because they are considered essential to the object of the publication and should not be construed as an endorsement. The United States Government does not endorse products or manufacturers.
Suggested APA Reference Format:
Staplin, L., Lococo, K. H., Gish, K. W., & Joyce, J. (2012, August). Functional assessments, safety outcomes, and driving exposure measures for older drivers. (Report No. DOT HS 811 630). Washington, DC: National Highway Traffic Safety Administration.
i
Technical Report Documentation Page 1. Report No. DOT HS 811 630
2. Government Accession No.
3. Recipient's Catalog No.
1. Title and Subtitle Functional Assessments, Safety Measures for Older Drivers
Outcomes, and Driving Exposure 5. Report Date August 2012 6. Performing Organization Code
7. Author(s) Loren Staplin, Kathy H. Lococo, Kenneth W. Gish, and John Joyce
8. Performing Organization Report No.
9. Performing Organization Name and Address
TransAnalytics, LLC 336 West Broad Street Quakertown, PA 18951
10. Work Unit No. (TRAIS)
11. Contract or Grant No. Contract No. DTNH22-09-D-00135, Task Order No. 01
12. Sponsoring Agency Name and Address Office of Behavioral Safety Research National Highway Traffic Safety Administration U.S. Department of Transportation 1200 New Jersey Avenue SE. Washington, DC 20590
13. Type of Report and Period CoveredDraft Final Report
14. Sponsoring Agency Code
15. Supplementary Notes Dr. Kathy Sifrit was the NHTSA Task Order Manager on this project. 16. Abstract
This project was conducted to provide an objective measure of the relationship between older adults’ scores on a set of driving assessment tools and their (serious point) violations and crashes over a period of 18 months following the assessments. An additional objective was to compare alternative methods of measuring driver exposure. The assessments were performed on 692 participants age 70 and older who visited one of four Maryland Motor Vehicle Administration (MVA) field offices between September 2008 and June 2009, under NHTSA contract DTNH22-05-D-05043, Task Order 10. The assessments emphasized cognitive performance domains, specifically visuospatial ability, speed of (visual information) processing, divided attention, visual search, working memory, and response planning or “executive function.” Contrast sensitivity was also measured, as well as simple and choice brake reaction time. The functional assessments examined in this research were computer-based and designed to be self-administered, although the assistance of a test administrator was always available and was required for some measures. Univariate and multivariate analyses examined the relationships between functional assessment scores and safety indicators. The measure of “executive function” (maze performance) was highlighted as a significant predictor of crash risk in the study results. This may be of interest to occupational therapy/driving rehabilitation providers as a potentially valuable tool to support clinical evaluations of fitness to drive; and, to developers of screening tools for early warning of driving impairments, and of products meant to educate older drivers and their families about age-related changes that impact safe driving. A subsample of 10 drivers participated in a naturalistic study, driving their own cars for a 1-month period with instrumentation installed by the research team. Data collected included the date and time of each trip taken, monitored via the vehicle’s OBD-II port; self-reported driving habits obtained via a Driving Preferences Instrument (DPI); and the date, time, and other characteristics for each trip as recorded using a paper-and-pencil trip log. The results showed a very strong (r > 0.90), significant correlation between trip log entries and OBD data; whereas DPI responses, that relied on memory and estimation, were only weakly correlated with the objective OBD record, and included both over- and under-reporting of driving exposure. These results reinforce a growing concern about the reliability of self-reported exposure data in traffic safety research. 17. Key Words Safety, older drivers, functional abilities, driver assessment, driver screening, driver performance, crashes, violations, exposure
18. Distribution Statement No restrictions. This document is available to the public through the National Technical Information Service, www.ntis.gov.
19.
Security Classif. (of this report) Unclassified
20.
Security Classif. (of this page) Unclassified
21. No. of Pages 87
22. Price
Form DOT F 1700.7 (8-72) Reproduction of completed page authorized
ii
ACKNOWLEDGEMENTS The authors wish to thank three people who provided invaluable assistance to this project. Danielle Betkey, in the Driver Safety Division of the Maryland Motor Vehicle Administration, and Cynthia Burch, in the National Study Center at the University of Maryland School of Medicine, compiled crash and violation data files to support analyses in the study of functional status and safety outcomes. Adam Rhodes installed, maintained, and removed the on-board instrumentation used to collect data in drivers’ own vehicles, for the naturalistic exposure study.
iii
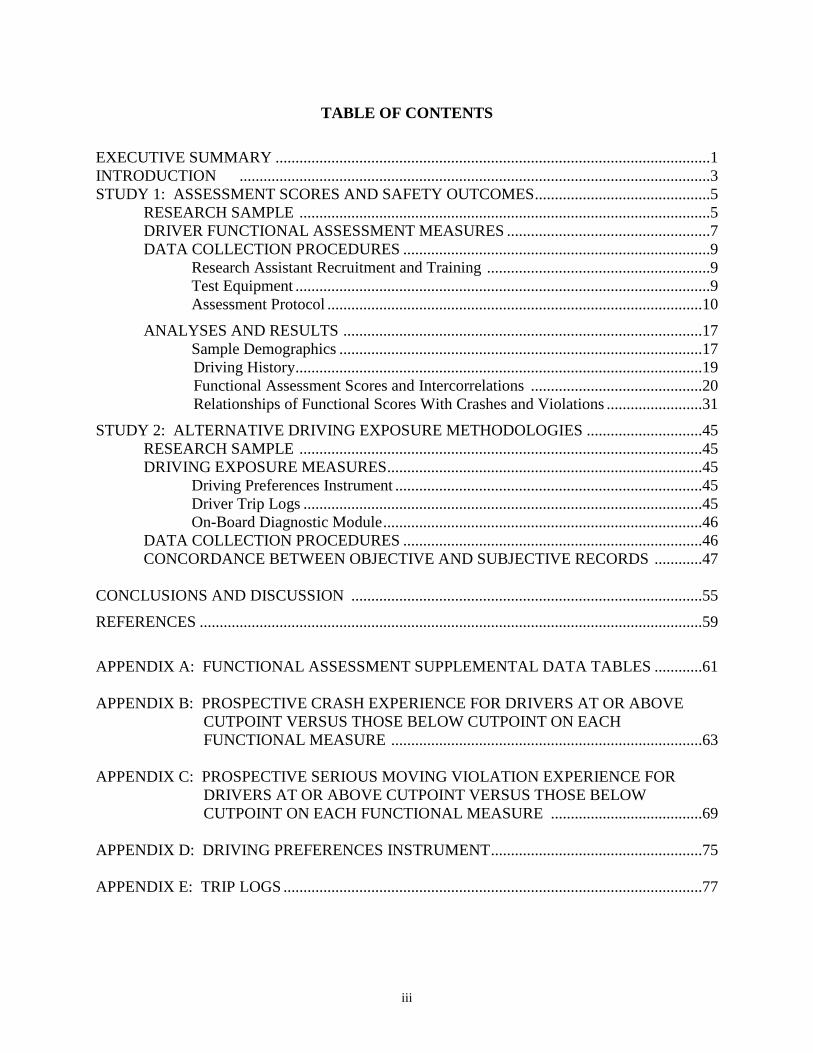
TABLE OF CONTENTS
EXECUTIVE SUMMARY .............................................................................................................1 INTRODUCTION ......................................................................................................................3 STUDY 1: ASSESSMENT SCORES AND SAFETY OUTCOMES ............................................5 RESEARCH SAMPLE .......................................................................................................5 DRIVER FUNCTIONAL ASSESSMENT MEASURES ...................................................7 DATA COLLECTION PROCEDURES .............................................................................9
Research Assistant Recruitment and Training ........................................................9 Test Equipment ........................................................................................................9 Assessment Protocol ..............................................................................................10
ANALYSES AND RESULTS ..........................................................................................17 Sample Demographics ...........................................................................................17
Driving History ......................................................................................................19 Functional Assessment Scores and Intercorrelations ...........................................20 Relationships of Functional Scores With Crashes and Violations ........................31
STUDY 2: ALTERNATIVE DRIVING EXPOSURE METHODOLOGIES .............................45 RESEARCH SAMPLE .....................................................................................................45 DRIVING EXPOSURE MEASURES ...............................................................................45 Driving Preferences Instrument .............................................................................45 Driver Trip Logs ....................................................................................................45
On-Board Diagnostic Module ................................................................................46 DATA COLLECTION PROCEDURES ...........................................................................46 CONCORDANCE BETWEEN OBJECTIVE AND SUBJECTIVE RECORDS ............47 CONCLUSIONS AND DISCUSSION ........................................................................................55
REFERENCES ..............................................................................................................................59
APPENDIX A: FUNCTIONAL ASSESSMENT SUPPLEMENTAL DATA TABLES ............61 APPENDIX B: PROSPECTIVE CRASH EXPERIENCE FOR DRIVERS AT OR ABOVE
CUTPOINT VERSUS THOSE BELOW CUTPOINT ON EACH FUNCTIONAL MEASURE ..............................................................................63
APPENDIX C: PROSPECTIVE SERIOUS MOVING VIOLATION EXPERIENCE FOR
DRIVERS AT OR ABOVE CUTPOINT VERSUS THOSE BELOW CUTPOINT ON EACH FUNCTIONAL MEASURE ......................................69
APPENDIX D: DRIVING PREFERENCES INSTRUMENT .....................................................75 APPENDIX E: TRIP LOGS .........................................................................................................77
iv
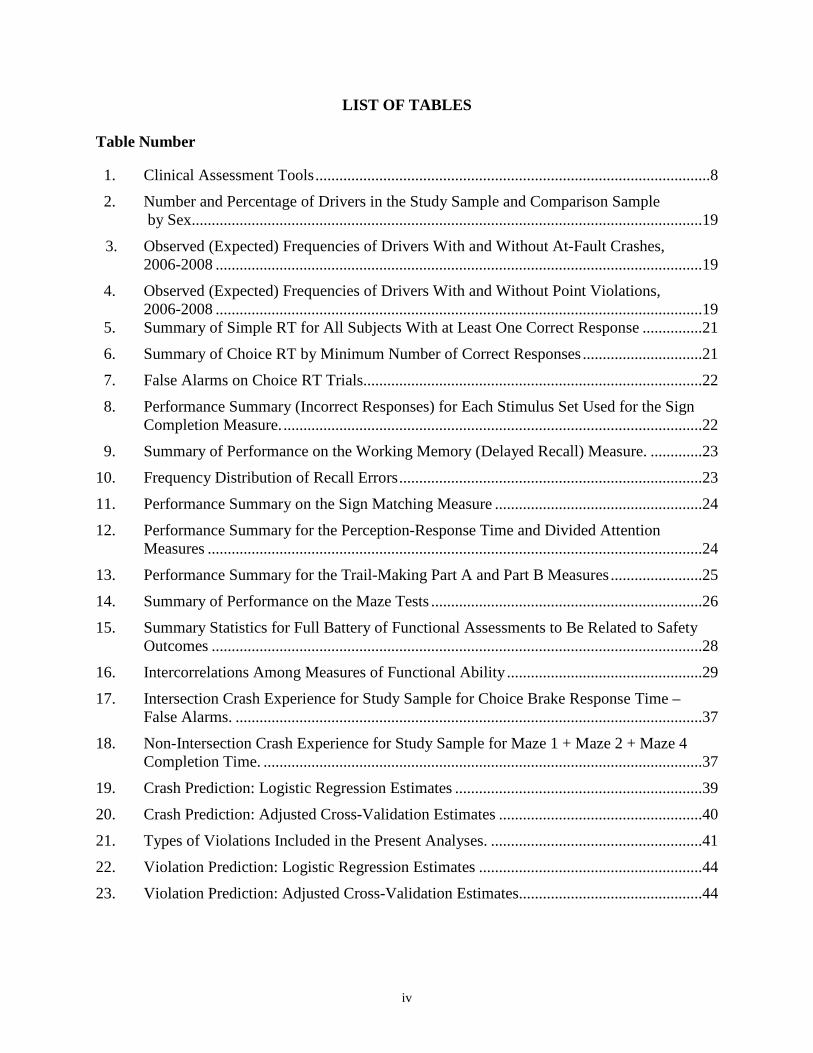
LIST OF TABLES
Table Number 1. Clinical Assessment Tools ...................................................................................................8
2. Number and Percentage of Drivers in the Study Sample and Comparison Sample by Sex................................................................................................................................19
3. Observed (Expected) Frequencies of Drivers With and Without At-Fault Crashes, 2006-2008 ..........................................................................................................................19
4. Observed (Expected) Frequencies of Drivers With and Without Point Violations, 2006-2008 ..........................................................................................................................19 5. Summary of Simple RT for All Subjects With at Least One Correct Response ...............21
6. Summary of Choice RT by Minimum Number of Correct Responses ..............................21
7. False Alarms on Choice RT Trials.....................................................................................22
8. Performance Summary (Incorrect Responses) for Each Stimulus Set Used for the Sign Completion Measure. .........................................................................................................22
9. Summary of Performance on the Working Memory (Delayed Recall) Measure. .............23
10. Frequency Distribution of Recall Errors ............................................................................23
11. Performance Summary on the Sign Matching Measure ....................................................24
12. Performance Summary for the Perception-Response Time and Divided Attention Measures ............................................................................................................................24
13. Performance Summary for the Trail-Making Part A and Part B Measures .......................25
14. Summary of Performance on the Maze Tests ....................................................................26
15. Summary Statistics for Full Battery of Functional Assessments to Be Related to Safety Outcomes ...........................................................................................................................28
16. Intercorrelations Among Measures of Functional Ability .................................................29
17. Intersection Crash Experience for Study Sample for Choice Brake Response Time – False Alarms. .....................................................................................................................37
18. Non-Intersection Crash Experience for Study Sample for Maze 1 + Maze 2 + Maze 4 Completion Time. ..............................................................................................................37
19. Crash Prediction: Logistic Regression Estimates ..............................................................39
20. Crash Prediction: Adjusted Cross-Validation Estimates ...................................................40
21. Types of Violations Included in the Present Analyses. .....................................................41
22. Violation Prediction: Logistic Regression Estimates ........................................................44
23. Violation Prediction: Adjusted Cross-Validation Estimates..............................................44
v
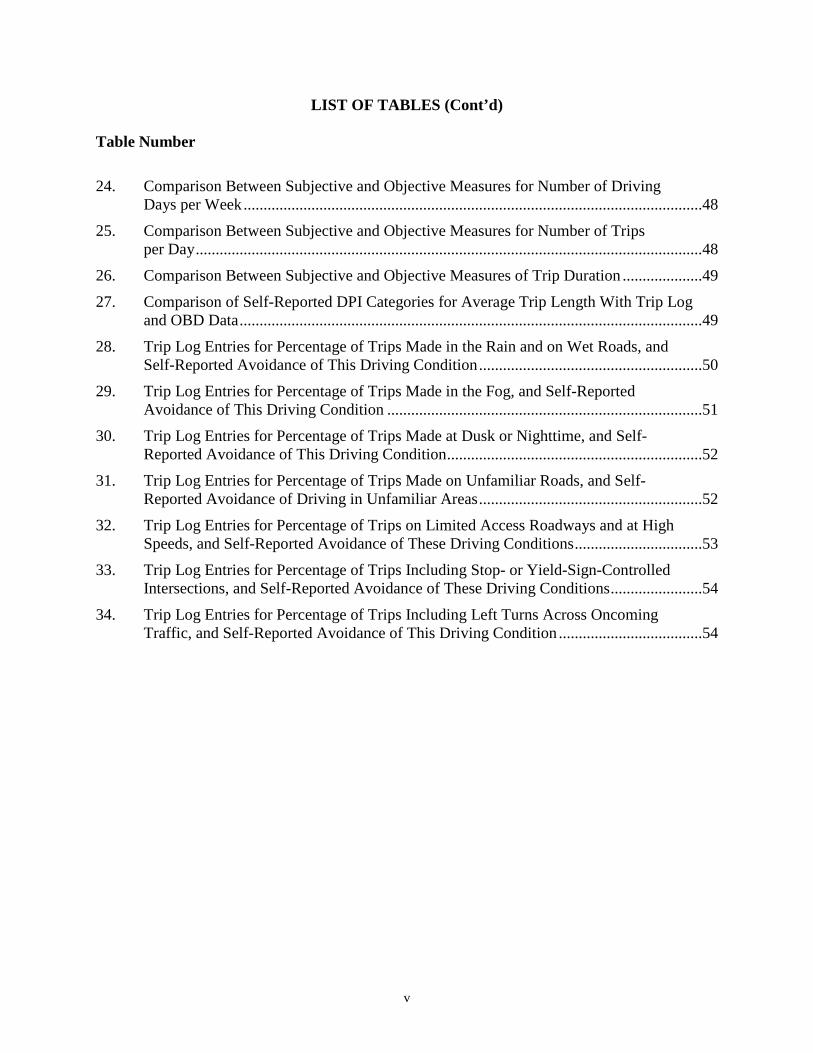
LIST OF TABLES (Cont’d)
Table Number
24. Comparison Between Subjective and Objective Measures for Number of Driving Days per Week ...................................................................................................................48
25. Comparison Between Subjective and Objective Measures for Number of Trips per Day ...............................................................................................................................48
26. Comparison Between Subjective and Objective Measures of Trip Duration ....................49
27. Comparison of Self-Reported DPI Categories for Average Trip Length With Trip Log and OBD Data ....................................................................................................................49
28. Trip Log Entries for Percentage of Trips Made in the Rain and on Wet Roads, and Self-Reported Avoidance of This Driving Condition ........................................................50
29. Trip Log Entries for Percentage of Trips Made in the Fog, and Self-Reported Avoidance of This Driving Condition ...............................................................................51
30. Trip Log Entries for Percentage of Trips Made at Dusk or Nighttime, and Self- Reported Avoidance of This Driving Condition ................................................................52
31. Trip Log Entries for Percentage of Trips Made on Unfamiliar Roads, and Self- Reported Avoidance of Driving in Unfamiliar Areas ........................................................52
32. Trip Log Entries for Percentage of Trips on Limited Access Roadways and at High Speeds, and Self-Reported Avoidance of These Driving Conditions ................................53
33. Trip Log Entries for Percentage of Trips Including Stop- or Yield-Sign-Controlled Intersections, and Self-Reported Avoidance of These Driving Conditions .......................54
34. Trip Log Entries for Percentage of Trips Including Left Turns Across Oncoming Traffic, and Self-Reported Avoidance of This Driving Condition ....................................54
vi
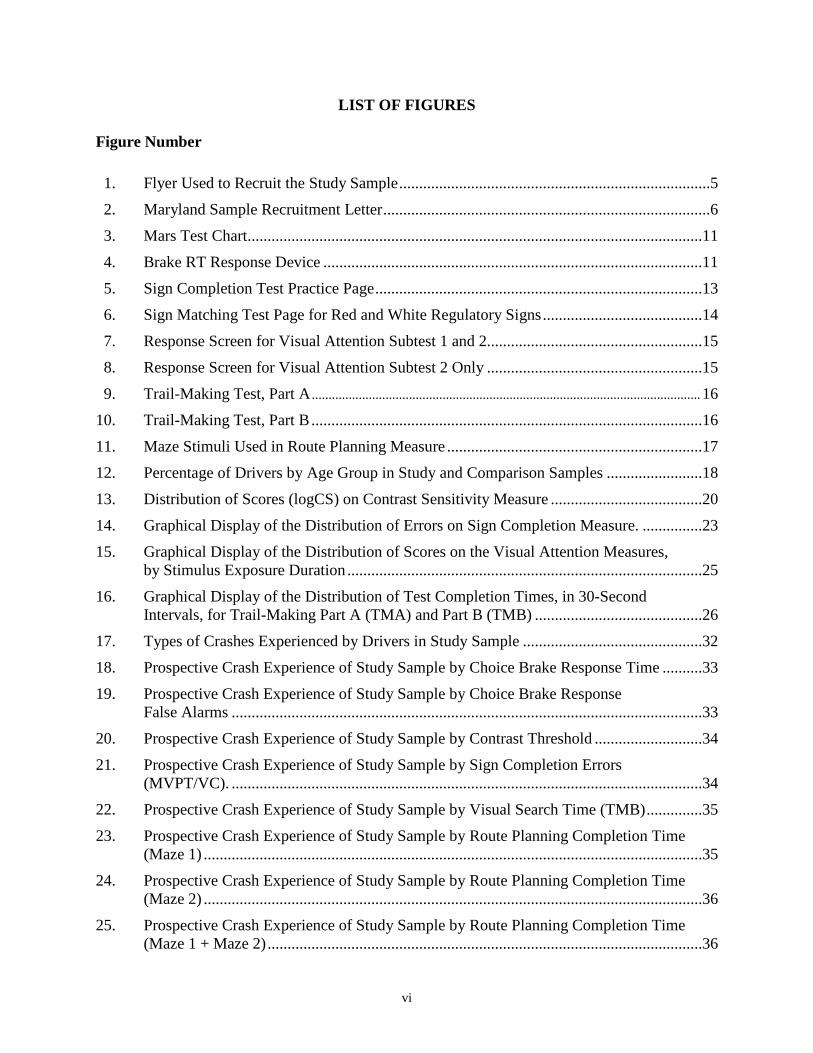
LIST OF FIGURES Figure Number
1. Flyer Used to Recruit the Study Sample ..............................................................................5
2. Maryland Sample Recruitment Letter ..................................................................................6
3. Mars Test Chart..................................................................................................................11
4. Brake RT Response Device ...............................................................................................11
5. Sign Completion Test Practice Page ..................................................................................13
6. Sign Matching Test Page for Red and White Regulatory Signs ........................................14
7. Response Screen for Visual Attention Subtest 1 and 2......................................................15
8. Response Screen for Visual Attention Subtest 2 Only ......................................................15
9. Trail-Making Test, Part A .................................................................................................................... 16
10. Trail-Making Test, Part B ..................................................................................................16
11. Maze Stimuli Used in Route Planning Measure ................................................................17
12. Percentage of Drivers by Age Group in Study and Comparison Samples ........................18
13. Distribution of Scores (logCS) on Contrast Sensitivity Measure ......................................20
14. Graphical Display of the Distribution of Errors on Sign Completion Measure. ...............23
15. Graphical Display of the Distribution of Scores on the Visual Attention Measures, by Stimulus Exposure Duration .........................................................................................25
16. Graphical Display of the Distribution of Test Completion Times, in 30-Second Intervals, for Trail-Making Part A (TMA) and Part B (TMB) ..........................................26
17. Types of Crashes Experienced by Drivers in Study Sample .............................................32
18. Prospective Crash Experience of Study Sample by Choice Brake Response Time ..........33
19. Prospective Crash Experience of Study Sample by Choice Brake Response False Alarms ......................................................................................................................33
20. Prospective Crash Experience of Study Sample by Contrast Threshold ...........................34
21. Prospective Crash Experience of Study Sample by Sign Completion Errors (MVPT/VC). ......................................................................................................................34
22. Prospective Crash Experience of Study Sample by Visual Search Time (TMB) ..............35
23. Prospective Crash Experience of Study Sample by Route Planning Completion Time (Maze 1) .............................................................................................................................35
24. Prospective Crash Experience of Study Sample by Route Planning Completion Time (Maze 2) .............................................................................................................................36
25. Prospective Crash Experience of Study Sample by Route Planning Completion Time (Maze 1 + Maze 2) .............................................................................................................36
vii
LIST OF FIGURES (Cont’d) Figure Number
26. Prospective Intersection Crash Experience of Study Sample by Choice Brake Response False Alarms ......................................................................................................................38
27. Prospective Non-Intersection Crash Experience of Study Sample by Maze 1 + Maze 2 + Maze 4 Completion Time ...............................................................................................38
28. Prospective Serious Violation Experience of Study Sample by Visual Search Time (TMB) ................................................................................................................................42
29. Prospective Serious Violation Experience of Study Sample by Route Planning Completion Time (Maze 1) ................................................................................................42
30. Prospective Serious Violation Experience of Study Sample by Route Planning Completion Time (Maze 1+ Maze 2) ................................................................................43
31. Prospective Serious Violation Experience of Study Sample by Route Planning Completion Time (Maze 1 + Maze 2 + Maze 4) ...............................................................43
32. CarChip Used for Collecting On-Board Diagnostic Data. .................................................46
1
EXECUTIVE SUMMARY
This study advances our understanding in two important areas of traffic safety research, (1) how age-related decline in a range of functional abilities predicts the risk of being involved in a crash or committing a serious moving violation, prospectively; and, (2) the reliability of alternative self-report methods compared to an objective record of driving exposure. In both cases, the study sample was drawn from a cross-section of active drivers 70 and older, who were contacted by research team members at rural, suburban, and urban branch offices of the Maryland Motor Vehicle Administration (MVA). Visual, cognitive, and psychomotor functional abilities of 692 consenting Maryland drivers were measured in private offices at the MVA after these people had completed their license renewal or other transactions, with an assurance that performance on the various tests would not impact their license in any way. Except for a portable eye chart, a computer touch-screen display was used to obtain all measures in the 30-minute assessment, under the guidance of test administrators trained and employed by TransAnalytics. Drivers received $25 gift cards as a “thank you” after completing the functional measurements, then were offered an opportunity to participate in further project activities with higher compensation ($100) that included installing equipment in their own cars to monitor their driving habits over a 1-month period. As a condition for IRB approval of the research plan, test administrators told drivers that they could discontinue their participation at any time, for any reason. The amount of missing data was typically modest, as sample sizes ranged from 650 to 675 drivers for the analyses of most measures; but greater data loss was noted for the most cognitively challenging measures. To the extent there was a selective loss of the least capable drivers from each data set analyzed in this study, the results understate the relationship between declining functional ability and crash risk. Univariate and multivariate analyses gauged the relationship between functional status and driving safety indicators. The best crash prediction model that emerged from a stepwise regression procedure included four measures of functional ability, and exhibited an odds ratio (OR) of 4.5. This was not significantly higher than the OR associated with the best predictor revealed in the (univariate) analyses of each functional measure in isolation. Also, this result depended upon a statistical adjustment to remove the influence of the absolute probability of crash occurrence as a model parameter. Study conclusions focused primarily upon the examination of individual measures as predictors of crash involvement and violation experience. In that regard, the time to successfully draw a path through a maze displayed onscreen (the “route planning” measure) evidenced the strongest findings. Performance on the easiest version of this test (Maze 1) significantly predicted crash involvement at p < .017. A combination of this test plus a more challenging version (Maze 2) predicted crash involvement at p < .001. Maze 1 also emerged as the most significant (p < .02) predictor of prospective serious moving violations. This is noteworthy because this procedure may be a more sensitive indicator of deficits related to mild cognitive impairment and dementia than any others included in the assessment battery. The computer-based maze test offers a brief, reliable, intuitive instrument,
2
with good face validity for a key component of everyday driving that could be readily incorporated into existing inventories used in clinical practice, and other applications. Additional measures of functional ability shown to significantly predict crashes or serious moving violations included contrast threshold (a transformed measure of contrast sensitivity) and visual search with divided attention, measured using a computer version of the Trail-Making Test, Part B. In the former case, a cutpoint was found (1.4 log contrast sensitivity) that can be reconciled well with the large body of literature on visual risk factors for driving. In the latter case, a cutpoint was found (130 seconds completion time) that is considerably lower than the threshold of 180 seconds most commonly cited in earlier analyses—including one performed at Maryland MVA sites very similar to the present research. A critical difference is that the previous studies used a paper-and-pencil version of Trails B. Translating this measure to a computer touchscreen may facilitate performance by reducing psychomotor demands. If replicated, these results could warrant an adjustment of the scoring criteria for screening and assessment programs that incorporate a computer (touchscreen) version of the Trail-Making Test. Finally, the Choice Brake Response measure—where the driver moved the foot from the gas to the brake pedal on a floor unit connected to the data collection computer as quickly as possible, but only when a certain type of sign was shown on the computer display—produced interesting results. In the crash analyses, brake response time (RT) predicted crash involvement at p < .055,and Choice Brake Response false alarms approached significance as a crash predictor at p < .07. When considering intersection crashes specifically, however, Choice Brake Response false alarms was the only significant (p < .049) crash predictor. Drivers who mis-applied the brake pedal at least twice during this measure were just over three times (OR = 3.04) more likely to be involved in an intersection crash. This finding may point to a fruitful avenue of research into the antecedents of “pedal error” crashes. The methodological study of driving exposure data collection techniques compared information describing driving days per week, trips per day, and average trip length from three sources. An on-board diagnostic (OBD) module installed in subjects’ cars provided an objective reference against which the accuracy and reliability of either/both of the other data sources could be gauged. These other sources included a written trip log, a structured list of entries completed immediately after driving, and a self-report questionnaire that reflected individuals’ estimates of, or recall about, their driving experience much farther removed in time. The correlation was very strong and significant between the trip log data and the OBD record (r > 0.9, p < .001). The questionnaire data, in comparison, showed very low correlations with the OBD record, and there was not any consistent pattern of error—both overestimations and underestimations were evident in these estimates. While an objective record is of course most desirable, it appears that data obtained immediately after driving via structured self reports are clearly superior to data that rely on memory and estimation, and may provide a reliable means of obtaining exposure information at a lower cost than instrumenting subjects’ vehicles. For any traffic safety indicator that purports to be “exposure-based” the reliability of the methods used to obtain the exposure data is paramount.
3
INTRODUCTION
In a preceding project sponsored by the National Highway Traffic Safety Administration (NHTSA),1 the research team administered a comprehensive battery of functional assessments to a volunteer sample of older drivers in multiple offices of the Maryland Motor Vehicle Administration (MVA) between September 2008 and June 2009. These drivers gave informed consent for their driving records, maintained by the State of Maryland, to be used in associated analyses with an understanding that the results (a) would be reported only at an aggregate level, not identifying any individual research participant; and (b) would in no way affect their license status. The previous project ended before sufficient driving experience could be accumulated following the assessment date of the last drivers, which precluded prospective analyses to evaluate the predictive validity of the assessment scores for motor vehicle citations and crashes.
The research described in this report includes two studies. The first study completed the
evaluation of assessment scores versus safety outcomes, by examining drivers’ (serious point) violations and crashes during the 18 months immediately following their date of assessment. The assessments covered a range of functional abilities with strong construct validity and hypothesized empirical validity as significant predictors of adverse safety outcomes among older drivers.
The prospective analyses addressed the following research questions:
• To what extent did each assessment instrument predict safety outcomes?
• Which instrument was the strongest predictor of safety outcomes?
• Does combining scores on a selection of instruments improve the predictive value?
• Do the data indicate potential cut points for clinicians to use in making recommendations regarding driving limitation or cessation?
• Were some assessments more likely to predict a specific type of crash or citation (e.g., were some better at predicting intersection crashes)?
The second study described in this report examined alternative methods of gauging driver
exposure. While it is always desirable to normalize the relationships between independent and dependent variables observed in traffic safety studies in terms of some measure of exposure (e.g., annual miles driven) such data are typically unavailable, and when (self) reported they have been shown to often be of questionable reliability (cf., Staplin, Gish, & Joyce, 2008).
In this research, a subset of 10 paid volunteers among those who completed functional assessments at the MVA permitted their own cars to be instrumented with an unobtrusive data logger, and drove according to their usual habits for a period of one month. They also recorded a trip log for all driving during this period. Earlier, when they completed their functional assessments, these same drivers generated exposure estimates and reported their driving habits
1 “Older Drivers: Relationship Between Assessment Tool Scores and Safety Outcomes,” Contract DTNH22-05-D-
05043, Task Order #10.
4
from memory. This within-subjects design supported analyses of the concordance between objective and subjective means of recording several important metrics of driver exposure.
The results of this study provided a comparison of data from the on-board data logger, the entries in the trip logs, and the earlier exposure estimates for these driver exposure measures:
• • • •
Number of days of driving per week; Number of trips per day; Average trip duration (hours, minutes); and Average trip length (miles).
The research team also sought more detailed information describing the extent to which
this subsample drove under specific traffic and weather conditions, performed particular maneuvers (e.g., left turns at intersections), and used specific types of roadways; but such data were collected only via subjective reports in this study.
5
STUDY 1: ASSESSMENT SCORES AND SAFETY OUTCOMES RESEARCH SAMPLE The research team recruited 692 drivers for this study from people who visited one of four Maryland MVA field offices to conduct business (license renewal, title transfer, etc.) between September 2008 and June 2009. All people meeting the age requirement (70 or older) with a valid Maryland driver licenses were eligible to participate.
We selected the MVA offices in which to conduct recruitment and data collection
activities to reflect a balance of urban, suburban, and rural areas; we also considered the age distribution of the customer traffic, seeking offices with relatively higher volumes of older drivers.2 The sites selected included one large city (Baltimore City), one small city (Annapolis), one suburban location (Loch Raven/Parkville), and one rural location (Easton). Recruitment and assessment activities were discontinued at the Annapolis MVA office in November 2008, due to volumes that were much lower than anticipated; the other three sites remained active for the duration of data collection.
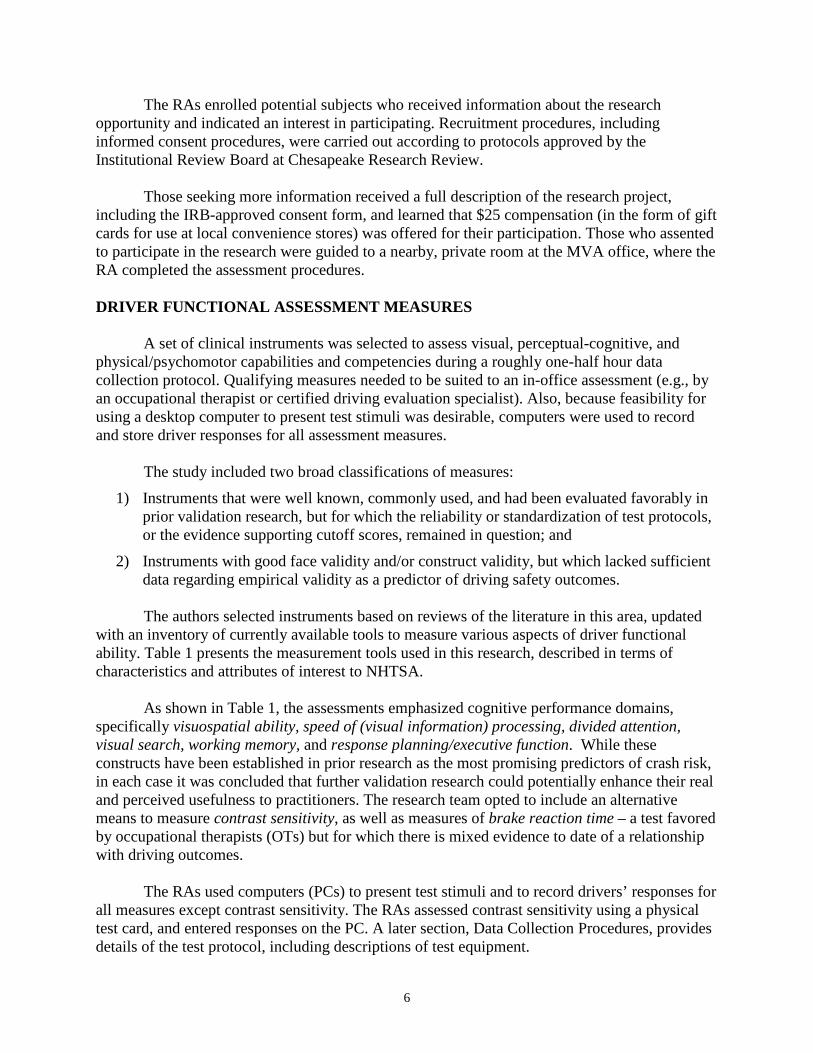
Initial contact to recruit study participants took place in one of two ways: A counter staff
member at the MVA told potential participants about the study and provided a research flyer (see Figure 1); or the MVA mailed a letter to older drivers in the geographical catchment area of each field office whose license renewal date was approaching in the next month, advising them of this research opportunity (see Figure 2). Both methods directed interested people to project research assistants (RAs) on-site at each MVA office for more information.
2 As determined by production logs and internal analyses provided to TransAnalytics by the Maryland MVA.
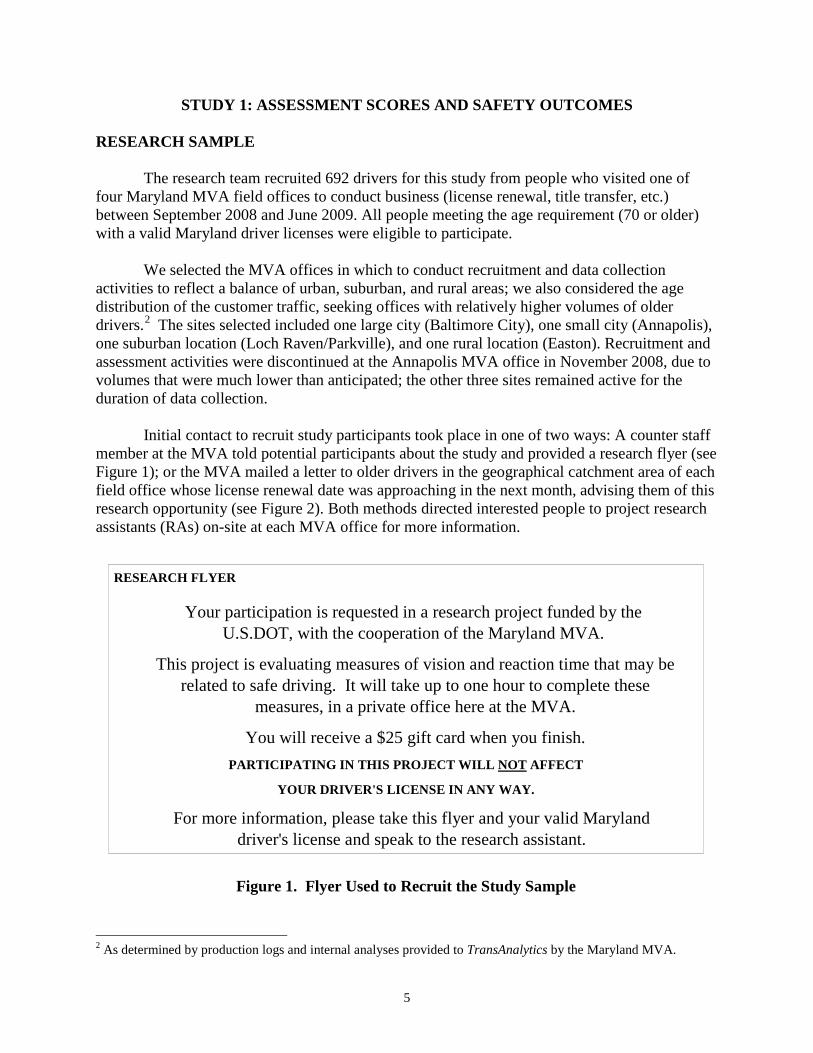
RESEARCH FLYER
Your participation is requested in a research project funded by the U.S.DOT, with the cooperation of the Maryland MVA.
This project is evaluating measures of vision and reaction time that may be related to safe driving. It will take up to one hour to complete these
measures, in a private office here at the MVA.
You will receive a $25 gift card when you finish. PARTICIPATING IN THIS PROJECT WILL NOT AFFECT
YOUR DRIVER'S LICENSE IN ANY WAY.
For more information, please take this flyer and your valid Maryland driver's license and speak to the research assistant.
Figure 1. Flyer Used to Recruit the Study Sample
6
The RAs enrolled potential subjects who received information about the research opportunity and indicated an interest in participating. Recruitment procedures, including informed consent procedures, were carried out according to protocols approved by the Institutional Review Board at Chesapeake Research Review.
Those seeking more information received a full description of the research project,
including the IRB-approved consent form, and learned that $25 compensation (in the form of gift cards for use at local convenience stores) was offered for their participation. Those who assented to participate in the research were guided to a nearby, private room at the MVA office, where the RA completed the assessment procedures.
DRIVER FUNCTIONAL ASSESSMENT MEASURES A set of clinical instruments was selected to assess visual, perceptual-cognitive, and physical/psychomotor capabilities and competencies during a roughly one-half hour data collection protocol. Qualifying measures needed to be suited to an in-office assessment (e.g., by an occupational therapist or certified driving evaluation specialist). Also, because feasibility for using a desktop computer to present test stimuli was desirable, computers were used to record and store driver responses for all assessment measures. The study included two broad classifications of measures:
1) Instruments that were well known, commonly used, and had been evaluated favorably in prior validation research, but for which the reliability or standardization of test protocols, or the evidence supporting cutoff scores, remained in question; and
2) Instruments with good face validity and/or construct validity, but which lacked sufficient data regarding empirical validity as a predictor of driving safety outcomes.
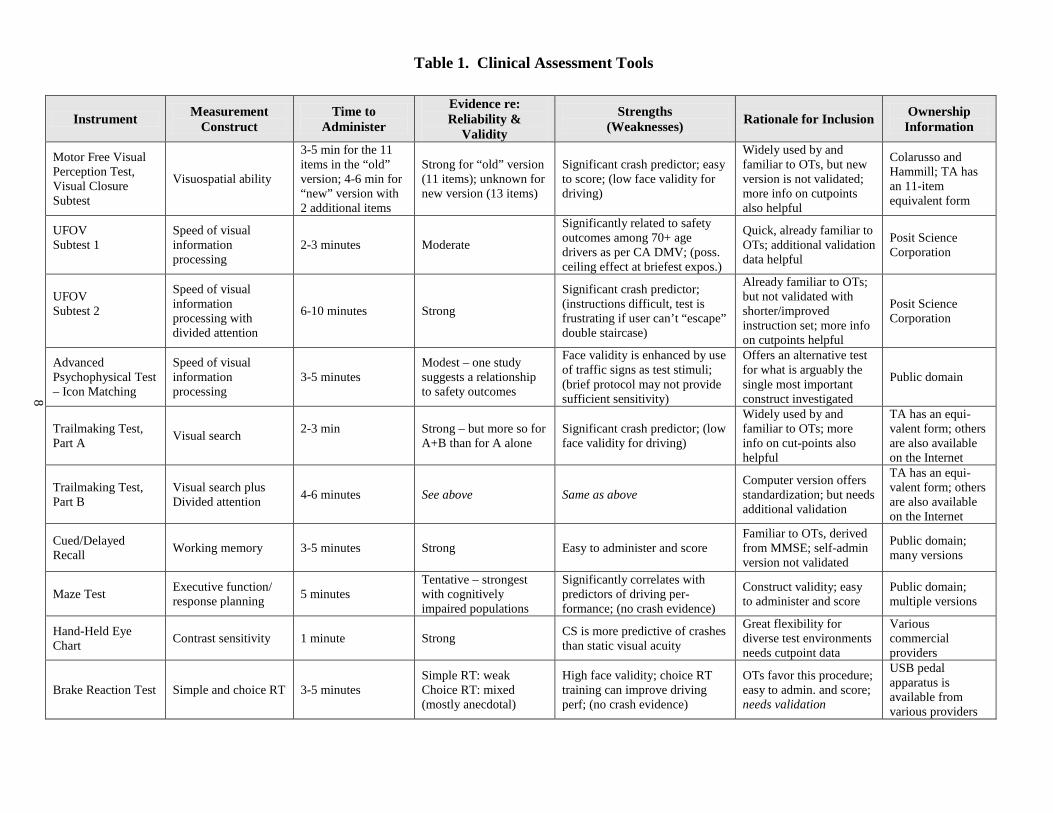
The authors selected instruments based on reviews of the literature in this area, updated with an inventory of currently available tools to measure various aspects of driver functional ability. Table 1 presents the measurement tools used in this research, described in terms of characteristics and attributes of interest to NHTSA.
As shown in Table 1, the assessments emphasized cognitive performance domains, specifically visuospatial ability, speed of (visual information) processing, divided attention, visual search, working memory, and response planning/executive function. While these constructs have been established in prior research as the most promising predictors of crash risk, in each case it was concluded that further validation research could potentially enhance their real and perceived usefulness to practitioners. The research team opted to include an alternative means to measure contrast sensitivity, as well as measures of brake reaction time – a test favored by occupational therapists (OTs) but for which there is mixed evidence to date of a relationship with driving outcomes.
The RAs used computers (PCs) to present test stimuli and to record drivers’ responses for all measures except contrast sensitivity. The RAs assessed contrast sensitivity using a physical test card, and entered responses on the PC. A later section, Data Collection Procedures, provides details of the test protocol, including descriptions of test equipment.
7
Figure 2. Maryland Sample Recruitment Letter
8
Table 1. Clinical Assessment Tools
Evidence re: Measurement Time to Strengths Ownership Instrument Reliability & Rationale for Inclusion Construct Administer (Weaknesses) Information Validity 3-5 min for the 11 Widely used by and Motor Free Visual Colarusso and items in the “old” Strong for “old” version Significant crash predictor; easy familiar to OTs, but new Perception Test, Hammill; TA has Visuospatial ability version; 4-6 min for (11 items); unknown for to score; (low face validity for version is not validated; Visual Closure an 11-item “new” version with new version (13 items) driving) more info on cutpoints Subtest equivalent form 2 additional items also helpful
Significantly related to safety UFOV Speed of visual Quick, already familiar to outcomes among 70+ age Posit Science Subtest 1 information 2-3 minutes Moderate OTs; additional validation drivers as per CA DMV; (poss. Corporation processing data helpful ceiling effect at briefest expos.) Already familiar to OTs; Speed of visual Significant crash predictor; UFOV but not validated with information (instructions difficult, test is Posit Science Subtest 2 6-10 minutes Strong shorter/improved processing with frustrating if user can’t “escape” Corporation instruction set; more info divided attention double staircase) on cutpoints helpful
Face validity is enhanced by use Offers an alternative test Advanced Speed of visual Modest – one study of traffic signs as test stimuli; for what is arguably the Psychophysical Test information 3-5 minutes suggests a relationship Public domain (brief protocol may not provide single most important – Icon Matching processing to safety outcomes sufficient sensitivity) construct investigated Widely used by and TA has an equi-
Trailmaking Test, 2-3 min Strong – but more so for Significant crash predictor; (low familiar to OTs; more valent form; others Visual search Part A A+B than for A alone face validity for driving) info on cut-points also are also available helpful on the Internet
TA has an equi-Computer version offers Trailmaking Test, Visual search plus valent form; others 4-6 minutes See above Same as above standardization; but needs Part B Divided attention are also available additional validation on the Internet Familiar to OTs, derived Cued/Delayed Public domain; Working memory 3-5 minutes Strong Easy to administer and score from MMSE; self-admin Recall many versions version not validated
Tentative – strongest Significantly correlates with Executive function/ Construct validity; easy Public domain; Maze Test 5 minutes with cognitively predictors of driving per-response planning to administer and score multiple versions impaired populations formance; (no crash evidence) Great flexibility for Various Hand-Held Eye CS is more predictive of crashes Contrast sensitivity 1 minute Strong diverse test environments commercial Chart than static visual acuity needs cutpoint data providers
USB pedal Simple RT: weak High face validity; choice RT OTs favor this procedure; apparatus is Brake Reaction Test Simple and choice RT 3-5 minutes Choice RT: mixed training can improve driving easy to admin. and score; available from (mostly anecdotal) perf; (no crash evidence) needs validation various providers
9
DATA COLLECTION PROCEDURES Data collection procedures included recruitment and training of project RAs, followed by deployment of equipment to the MVA offices, then subject recruitment and consent, before the administration of the actual functional assessments. These activities are described below. Research Assistant Recruitment and Training Advertisements for primary Research Assistants (RAs) were placed in the Baltimore Sun newspaper. The primary RAs explained the consent process to the study participants, obtained their consent, and administered the assessment measures. The advertisement described the position as a part-time test administrator with a BA or AA degree, in the health or social service area, to interview older drivers for a research project at local MVA offices. Once interviewed and hired, the RAs were each asked to “nominate” a friend or relative to serve as a “secondary” RA, whose job was to “meet and greet” older drivers who were interested in being research participants and to keep them engaged while the “primary” RA was carrying out the PC-based assessment in a private room elsewhere in the facility. This strategy was employed to minimize the involvement of the MVA counter personnel in the project, and to maximize the number of candidate research participants screened each day. Primary RAs met with the project Principal Investigator (PI) at the Loch Raven/Parkville MVA office for a 1-day group training session. The PI discussed the procedures for recruiting subjects, obtaining consent, and providing subject payments; and then demonstrated how to conduct each assessment tool on the test station. Procedures for computer start up, saving and transmitting data to the PI on a regular basis, and computer shutdown and troubleshooting were also discussed, in addition to procedures for securing the equipment and consent forms in the MVA testing room at the end of each test day. RAs practiced delivery of the assessment tools with each other, until they were proficient with the protocol. One-on-one follow up with individual RAs was provided by the PI as required. Primary RAs were given a PowerPoint presentation developed by the Office of Human Research Ethics at the University of North Carolina, Chapel Hill, titled, “Protecting People Who Participate in Research.” RAs completed this training independently and provided signed documentation to the project PI indicating that they had completed this alternative human subjects training program. Test Equipment Computers were used to present stimuli for all assessment measures except contrast sensitivity testing, and RAs recorded all responses at a PC workstation. This workstation included:
• • • •
•
A Windows 2000 desktop personal computer, including audio speakers; A touchscreen monitor (Synaps Model S15TSM 15-in LCD TFT, 1024 x 768); A bar code reader to scan in the Maryland driver license number (E-Seek Model 200); Accelerator and brake foot pedals for brake reaction time measures (Savant Elite USB dual action foot switch by Kinesis Computer Ergonomics); and A flash drive key and archive (SanDisk 1-GB flash drive).
10
Assessment Protocol The data collection equipment remained in a locked room at each participating MVA office during the data collection period. Each morning, the primary RA powered up the PC to run the assessment program. This program was password-protected. The RA began interaction with each study participant by reminding the participant that this was a Federally sponsored research study in which (a) all data are reported at the “group” level and no individuals would be identified, and (b) study participation would “not affect your driver’s license in any way.” The RA then presented the informed consent form, which the older driver reviewed and signed before proceeding. Once the RA obtained informed consent, she ensured that the older driver was seated comfortably at the test station, was able to read and reach the touchscreen display, could hear the narration of test procedures that were included as part of the assessment program, and could easily use the foot pedal unit on the floor next to the PC workstation with his/her right foot. The RA confirmed that the Maryland driver’s license was valid, and that the person was born in 1938 or earlier. The RA then swiped the license through the card reader attached to the PC, to register the driver license (Soundex) number in the participant’s data file. The next activity, an exercise termed “pointing practice” familiarized study participants with use of the touchscreen. Directions presented on the display instructed subjects to press a white dot that would appear on the screen. When the subject touched the dot, it moved to a new location on the screen. RAs instructed subjects to continue to touch the dot as it moved from location to location. The dot moved to 10 locations; if subjects could not complete this exercise in 20 seconds, the program prompted them to complete more practice trials before moving on to the actual assessments. However, subjects could decline to repeat the practice if they wished. The time in milliseconds (ms) to complete the pointing practice was recorded in the subject’s data file. After completing the pointing practice, the measures listed below were performed in the same order for all subjects. Instructions were available as text on screen; they were also delivered or repeated by the RA, as needed for each subject. As indicated, the initial vision test required direct involvement of the RA, while subjects could complete the remaining assessments using an automatized, self-paced protocol. The RAs encouraged all subjects to complete the entire assessment protocol, but subjects understood they were free to decline to continue at any point, either for a single measure or for the remainder of the assessments, without penalty.
• • • • • • • •
Contrast sensitivity Brake response time (simple and choice RT) Working memory (cued recall) Sign completion (visual closure/visualizing missing information) Sign matching (icon matching) Visual attention (Useful Field of View subtests 1 and 2) Visual search (Trailmaking) Route planning (maze completion)
11
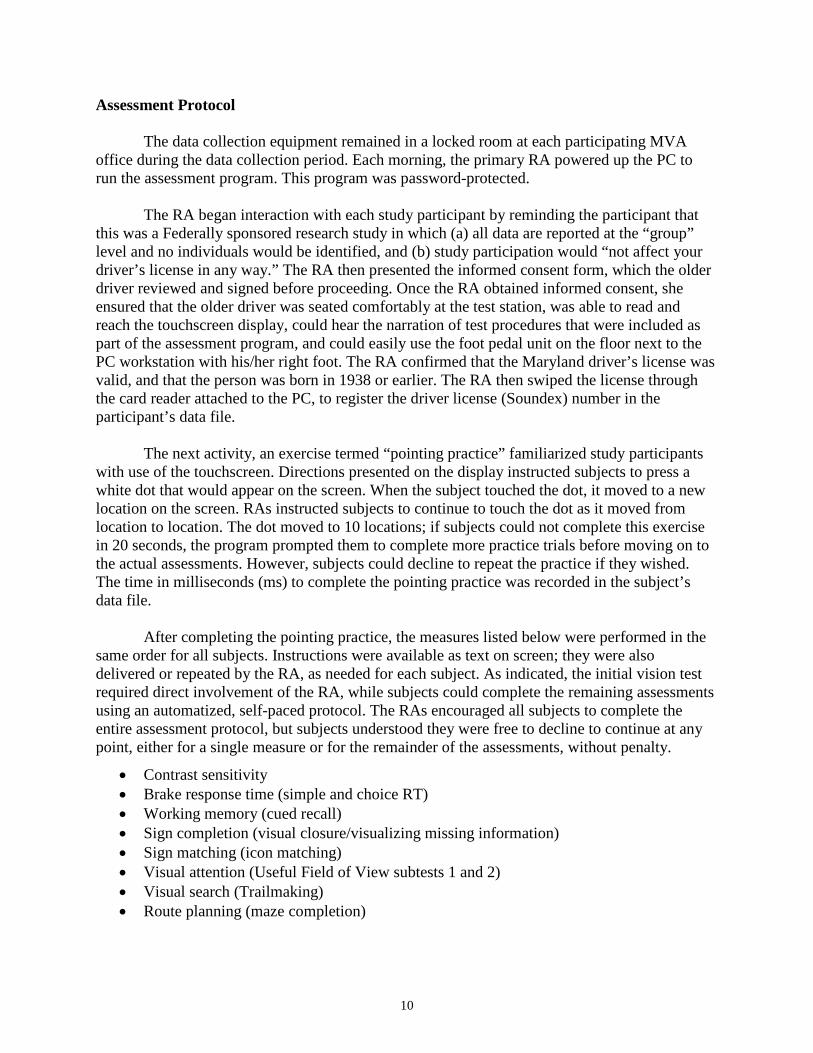
Figure 3. MARS Test Chart
Contrast Sensitivity RAs administered this assessment first, using a MARS Contrast Sensitivity test chart. This chart was hidden from view prior to the assessment, at which time the RA set the chart on the back of the workstation at a pre-measured distance (20 inches) from the driver. As shown in Figure 3, the MARS Letter Contract Sensitivity Test (Mars Perceptrix Corporation, 2003) is a 9- by 14-inch chart with 48 letters (6 letters in each of 8 rows). The contrast of each letter, reading from left to right and continuing on successive lines, decreases by a constant factor of 0.04 log units. The RA instructed the participant to read each letter across each row, and then continue to the next row. The score was the contrast of the final correct letter the participant identified before making two consecutive errors (minus 0.04 for each previous incorrect letter). As the driver read the letters from the chart, the RA made an entry in the program, by pressing letters on an identical chart displayed on the touchscreen, to record the last letter correctly identified by the driver. Subjects were encouraged to guess, even when they thought the letters were too faint to see accurately. Contrast sensitivity scores were stored in the subject’s data file, and later converted to log scores to summarize subjects’ performance.
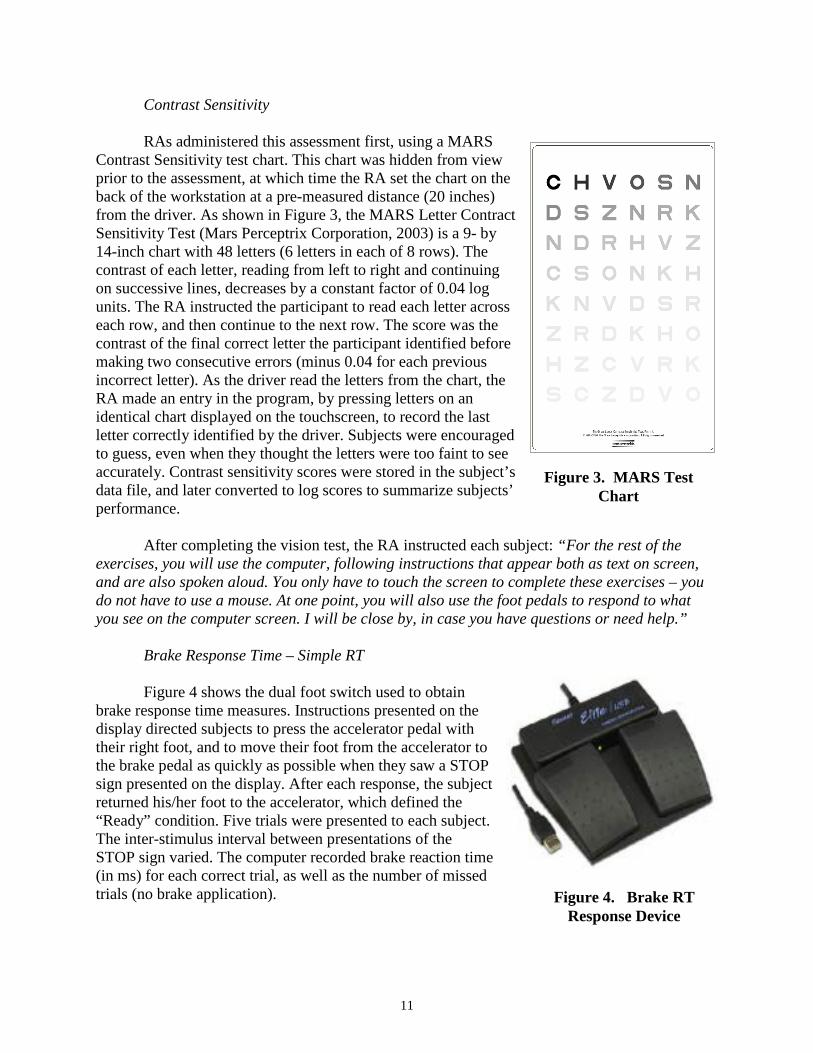
After completing the vision test, the RA instructed each subject: “For the rest of the exercises, you will use the computer, following instructions that appear both as text on screen, and are also spoken aloud. You only have to touch the screen to complete these exercises – you do not have to use a mouse. At one point, you will also use the foot pedals to respond to what you see on the computer screen. I will be close by, in case you have questions or need help.” Brake Response Time – Simple RT Figure 4 shows the dual foot switch used to obtain brake response time measures. Instructions presented on the display directed subjects to press the accelerator pedal with their right foot, and to move their foot from the accelerator to the brake pedal as quickly as possible when they saw a STOP sign presented on the display. After each response, the subject returned his/her foot to the accelerator, which defined the “Ready” condition. Five trials were presented to each subject. The inter-stimulus interval between presentations of the STOP sign varied. The computer recorded brake reaction time (in ms) for each correct trial, as well as the number of missed trials (no brake application).
Figure 4. Brake RT Response Device
12
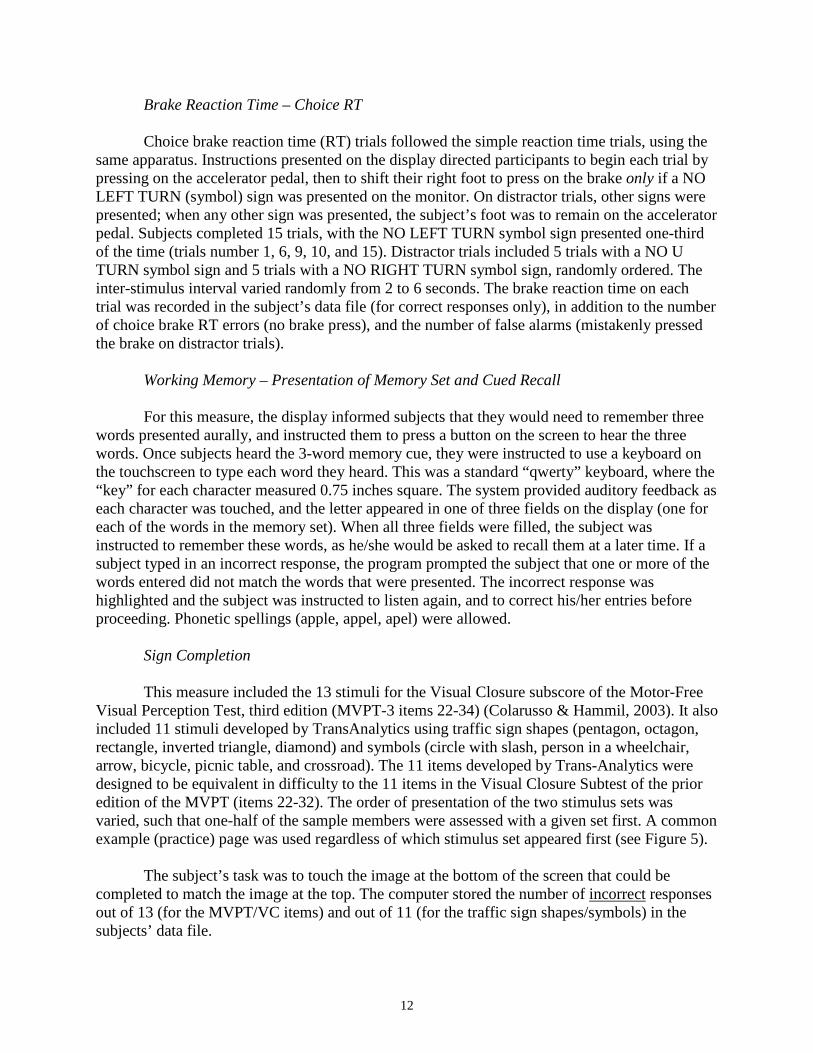
Brake Reaction Time – Choice RT Choice brake reaction time (RT) trials followed the simple reaction time trials, using the same apparatus. Instructions presented on the display directed participants to begin each trial by pressing on the accelerator pedal, then to shift their right foot to press on the brake only if a NO LEFT TURN (symbol) sign was presented on the monitor. On distractor trials, other signs were presented; when any other sign was presented, the subject’s foot was to remain on the accelerator pedal. Subjects completed 15 trials, with the NO LEFT TURN symbol sign presented one-third of the time (trials number 1, 6, 9, 10, and 15). Distractor trials included 5 trials with a NO U TURN symbol sign and 5 trials with a NO RIGHT TURN symbol sign, randomly ordered. The inter-stimulus interval varied randomly from 2 to 6 seconds. The brake reaction time on each trial was recorded in the subject’s data file (for correct responses only), in addition to the number of choice brake RT errors (no brake press), and the number of false alarms (mistakenly pressed the brake on distractor trials). Working Memory – Presentation of Memory Set and Cued Recall For this measure, the display informed subjects that they would need to remember three words presented aurally, and instructed them to press a button on the screen to hear the three words. Once subjects heard the 3-word memory cue, they were instructed to use a keyboard on the touchscreen to type each word they heard. This was a standard “qwerty” keyboard, where the “key” for each character measured 0.75 inches square. The system provided auditory feedback as each character was touched, and the letter appeared in one of three fields on the display (one for each of the words in the memory set). When all three fields were filled, the subject was instructed to remember these words, as he/she would be asked to recall them at a later time. If a subject typed in an incorrect response, the program prompted the subject that one or more of the words entered did not match the words that were presented. The incorrect response was highlighted and the subject was instructed to listen again, and to correct his/her entries before proceeding. Phonetic spellings (apple, appel, apel) were allowed. Sign Completion This measure included the 13 stimuli for the Visual Closure subscore of the Motor-Free Visual Perception Test, third edition (MVPT-3 items 22-34) (Colarusso & Hammil, 2003). It also included 11 stimuli developed by TransAnalytics using traffic sign shapes (pentagon, octagon, rectangle, inverted triangle, diamond) and symbols (circle with slash, person in a wheelchair, arrow, bicycle, picnic table, and crossroad). The 11 items developed by Trans-Analytics were designed to be equivalent in difficulty to the 11 items in the Visual Closure Subtest of the prior edition of the MVPT (items 22-32). The order of presentation of the two stimulus sets was varied, such that one-half of the sample members were assessed with a given set first. A common example (practice) page was used regardless of which stimulus set appeared first (see Figure 5). The subject’s task was to touch the image at the bottom of the screen that could be completed to match the image at the top. The computer stored the number of incorrect responses out of 13 (for the MVPT/VC items) and out of 11 (for the traffic sign shapes/symbols) in the subjects’ data file.
13
The display presented the following instructions:
This “sign completion” test measures your ability to visualize a complete object, or image on a sign, when part of it is hidden from view. Choose which one of four partial images at the bottom of each page could be completed to match the image at the top. IMPORTANT: to complete an image, you can only add lines—you CANNOT MOVE or TAKE AWAY lines.”
This was not a timed test. However, if a subject failed to respond to a given stimulus page within 30 seconds, the display prompted him/her to respond without further delay. Failure to respond within an additional 10 seconds caused the program to score the page incorrect and proceed to the next page. Working Memory – Delayed Recall
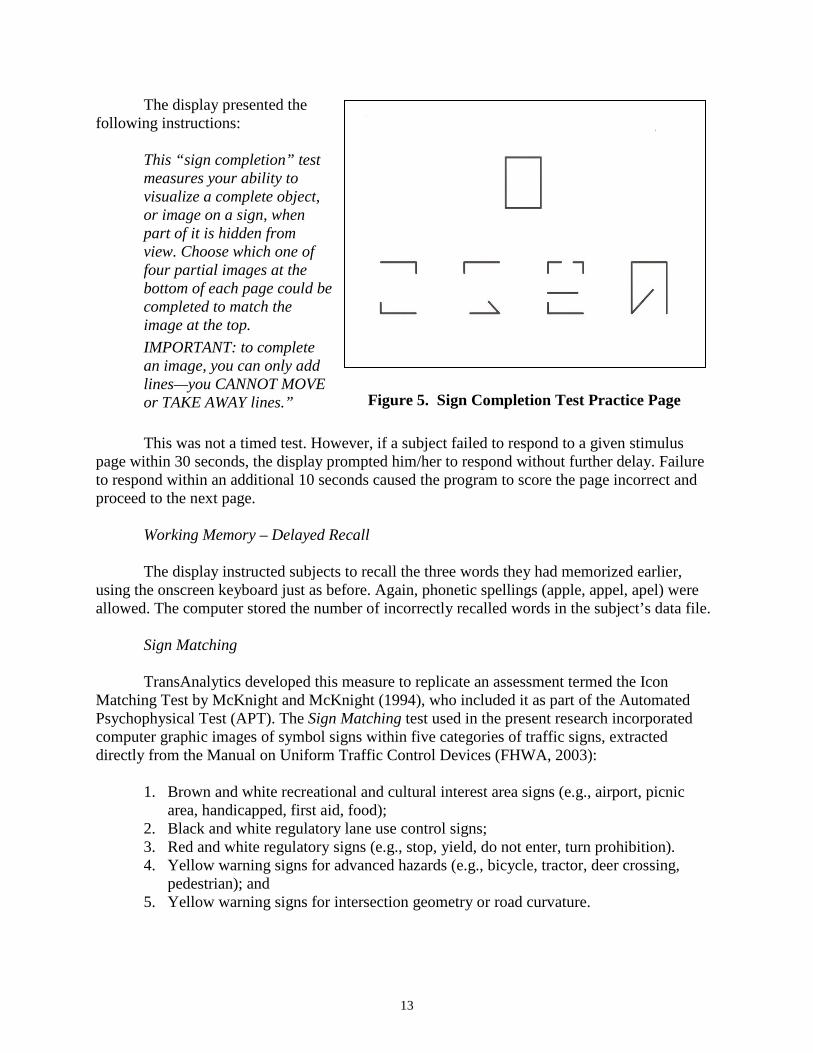
The display instructed subjects to recall the three words they had memorized earlier, using the onscreen keyboard just as before. Again, phonetic spellings (apple, appel, apel) were allowed. The computer stored the number of incorrectly recalled words in the subject’s data file. Sign Matching TransAnalytics developed this measure to replicate an assessment termed the Icon Matching Test by McKnight and McKnight (1994), who included it as part of the Automated Psychophysical Test (APT). The Sign Matching test used in the present research incorporated computer graphic images of symbol signs within five categories of traffic signs, extracted directly from the Manual on Uniform Traffic Control Devices (FHWA, 2003):
1. Brown and white recreational and cultural interest area signs (e.g., airport, picnic area, handicapped, first aid, food);
2. Black and white regulatory lane use control signs; 3. Red and white regulatory signs (e.g., stop, yield, do not enter, turn prohibition). 4. Yellow warning signs for advanced hazards (e.g., bicycle, tractor, deer crossing,
pedestrian); and 5.
Yellow warning signs for intersection geometry or road curvature.
Figure 5. Sign Completion Test Practice Page
14
The RA instructed subjects as follows: “Please rest your hand comfortably somewhere
s
Figure 6. Sign Matching Test Page for Red and White Regulatory Signs
near the screen, and follow these instructions: (1) Watch the screen—five clusters of 3 signs each will appear on each page; (2) As fast as you can, touch the corner of the screen where you see signs that EXACTLY match the signs inthe center. Your score is the time it takes you tomake a correct match on each page. Respond aquickly as you can, but be sure to make a correct response. For each sign category, the software presented a screen showing 3 signs clustered inthe center, with a cluster of 3 signs in each of the four corners of the screen (see Figure 6). The centroid of each corner cluster was 5 inches from the centroid of the reference stimulus in the middle of the screen; this translated to an eccentricity of 12 to 15 degrees for a viewing distance that varied across subjects from 18 to 24 inches. Subjects completed four repetitions for each of the 5 sign categories, for a total of 20 trials. A data file stored the reaction time for correct responses for each page within each sign category as well as the number of trials with errors (the subject selected an incorrect sign cluster as the match). A failure to respond within 10 seconds on any trial was scored as an error. Visual Attention
This measure consisted of customized versions of two subtests of the useful field of view (UFOV) test protocol, subtest 1 (speed of visual information processing) and subtest 2 (information processing speed with divided attention). The program used a double staircase method for stimulus presentation, where 75% accuracy defined a correct response for a given exposure duration. Subtest 1 was abbreviated to permit maximum overall test duration of 2 minutes per subject; this is identical to the PRT test protocol that TransAnalytics developed for use in Tier 2 of the California DMV’s 3-Tier pilot program. The programming for subtest 2 was altered to allow a minimum exposure duration of test stimuli of 100 ms, instead of 17 ms employed in the traditional protocol as the briefest stimulus exposure duration.
The instructions for subtest 1 were as follows:
1. Watch for a car or truck figure to flash on in the box in the center of the screen. 2. When asked, choose whether you just saw a car or a truck.
This will be repeated, over and over, with the figure flashing on and off faster and faster. It may get so fast that you can’t tell for sure what you saw. That’s OK, the test is supposed to work this way.
15
The instructions for subtest 2 were as follows:
1. Continue to watch the box in the center, to see whether a car or truck figure appears. 2. At the same time, watch to see where a car appears around the edge of the screen. This
figure will flash on and off at EXACTLY THE SAME TIME as the figure in the center. 3. When asked, touch the screen to tell which figure appeared in the center AND which
location the car appeared in, at the outside edge of the screen.
Since the outside figure will always be a car, you do not need to pay attention to what it is, only WHERE IT APPEARS. Three practice pages will follow.
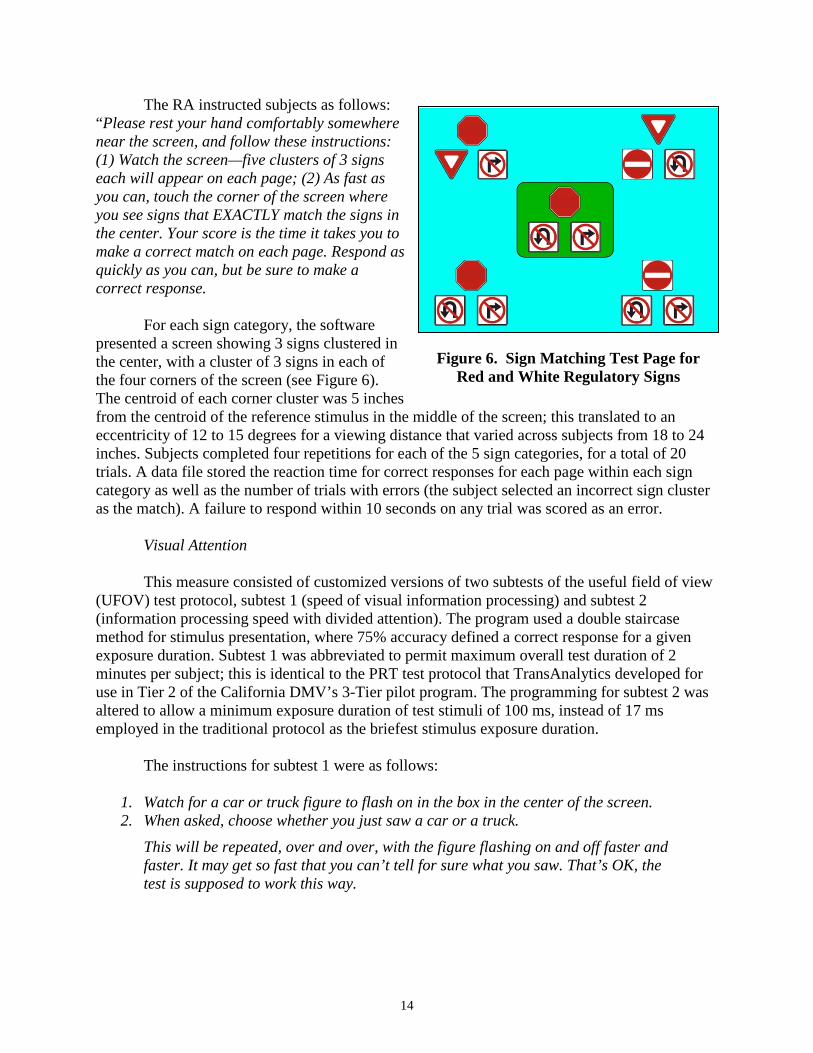
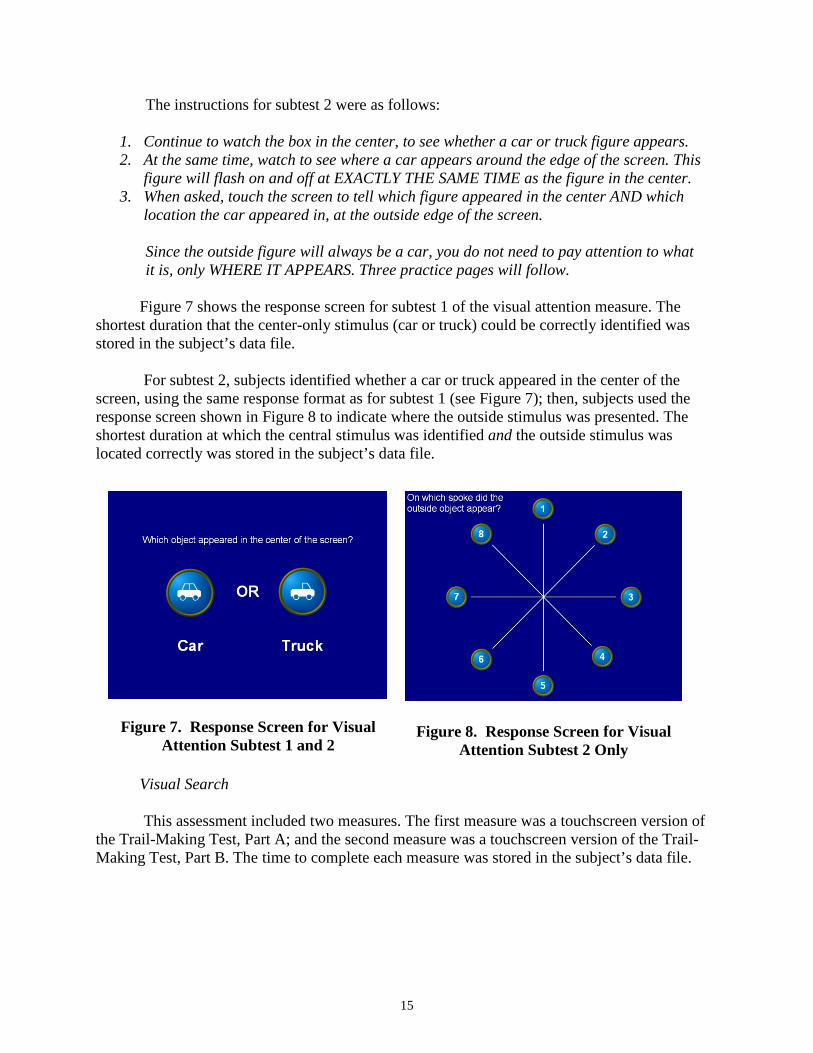
Figure 7 shows the response screen for subtest 1 of the visual attention measure. The shortest duration that the center-only stimulus (car or truck) could be correctly identified was stored in the subject’s data file. For subtest 2, subjects identified whether a car or truck appeared in the center of the screen, using the same response format as for subtest 1 (see Figure 7); then, subjects used the response screen shown in Figure 8 to indicate where the outside stimulus was presented. The shortest duration at which the central stimulus was identified and the outside stimulus was located correctly was stored in the subject’s data file.
Visual Search This assessment included two measures. The first measure was a touchscreen version of the Trail-Making Test, Part A; and the second measure was a touchscreen version of the Trail-Making Test, Part B. The time to complete each measure was stored in the subject’s data file.
Figure 7. Response Screen for Visual Attention Subtest 1 and 2
Figure 8. Response Screen for Visual Attention Subtest 2 Only
16
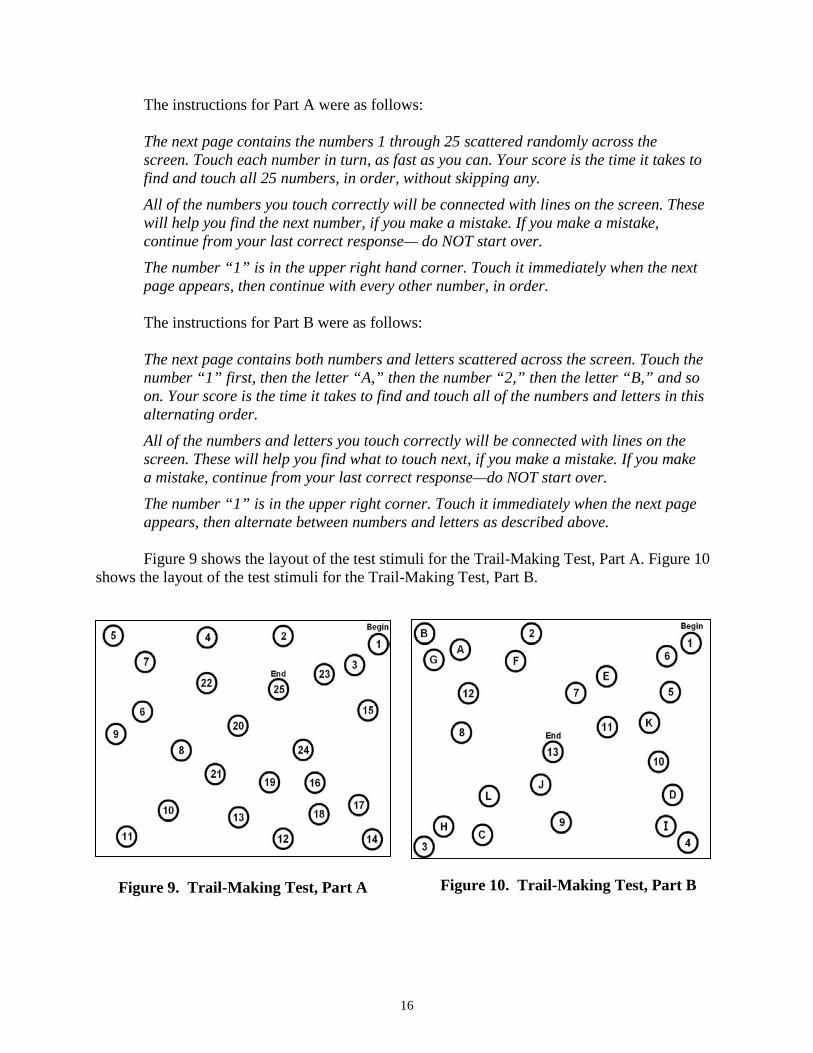
The instructions for Part A were as follows:
The next page contains the numbers 1 through 25 scattered randomly across the screen. Touch each number in turn, as fast as you can. Your score is the time it takes to find and touch all 25 numbers, in order, without skipping any. All of the numbers you touch correctly will be connected with lines on the screen. These will help you find the next number, if you make a mistake. If you make a mistake, continue from your last correct response— do NOT start over. The number “1” is in the upper right hand corner. Touch it immediately when the next page appears, then continue with every other number, in order.
The instructions for Part B were as follows:
The next page contains both numbers and letters scattered across the screen. Touch the number “1” first, then the letter “A,” then the number “2,” then the letter “B,” and so on. Your score is the time it takes to find and touch all of the numbers and letters in this alternating order. All of the numbers and letters you touch correctly will be connected with lines on the screen. These will help you find what to touch next, if you make a mistake. If you make a mistake, continue from your last correct response—do NOT start over. The number “1” is in the upper right corner. Touch it immediately when the next page appears, then alternate between numbers and letters as described above.
Figure 9 shows the layout of the test stimuli for the Trail-Making Test, Part A. Figure 10 shows the layout of the test stimuli for the Trail-Making Test, Part B.
Figure 9. Trail-Making Test, Part A Figure 10. Trail-Making Test, Part B
17
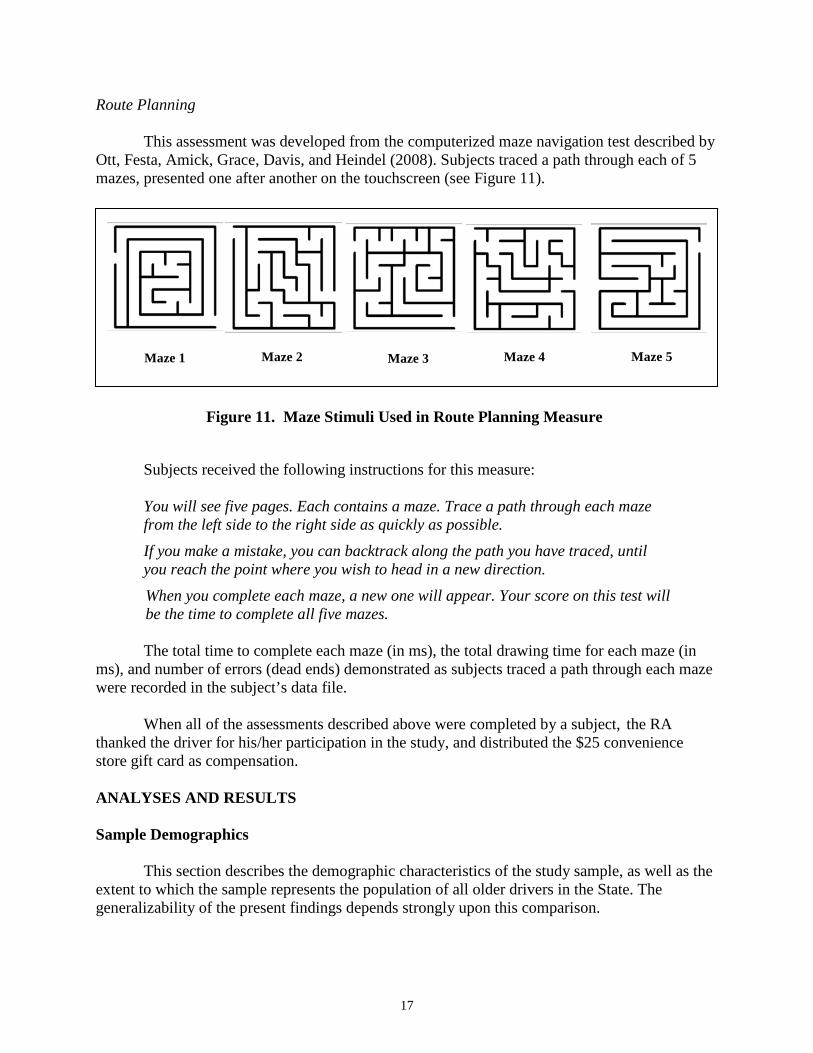
Route Planning This assessment was developed from the computerized maze navigation test described by Ott, Festa, Amick, Grace, Davis, and Heindel (2008). Subjects traced a path through each of 5 mazes, presented one after another on the touchscreen (see Figure 11).
Subjects received the following instructions for this measure:
You will see five pages. Each contains a maze. Trace a path through each maze from the left side to the right side as quickly as possible. If you make a mistake, you can backtrack along the path you have traced, until you reach the point where you wish to head in a new direction. When you complete each maze, a new one will appear. Your score on this test will be the time to complete all five mazes.
The total time to complete each maze (in ms), the total drawing time for each maze (in ms), and number of errors (dead ends) demonstrated as subjects traced a path through each maze were recorded in the subject’s data file. When all of the assessments described above were completed by a subject, the RA thanked the driver for his/her participation in the study, and distributed the $25 convenience store gift card as compensation. ANALYSES AND RESULTS Sample Demographics This section describes the demographic characteristics of the study sample, as well as the extent to which the sample represents the population of all older drivers in the State. The generalizability of the present findings depends strongly upon this comparison.
Maze 1 Maze 2 Maze 3 Maze 4 Maze 5
Figure 11. Maze Stimuli Used in Route Planning Measure
18
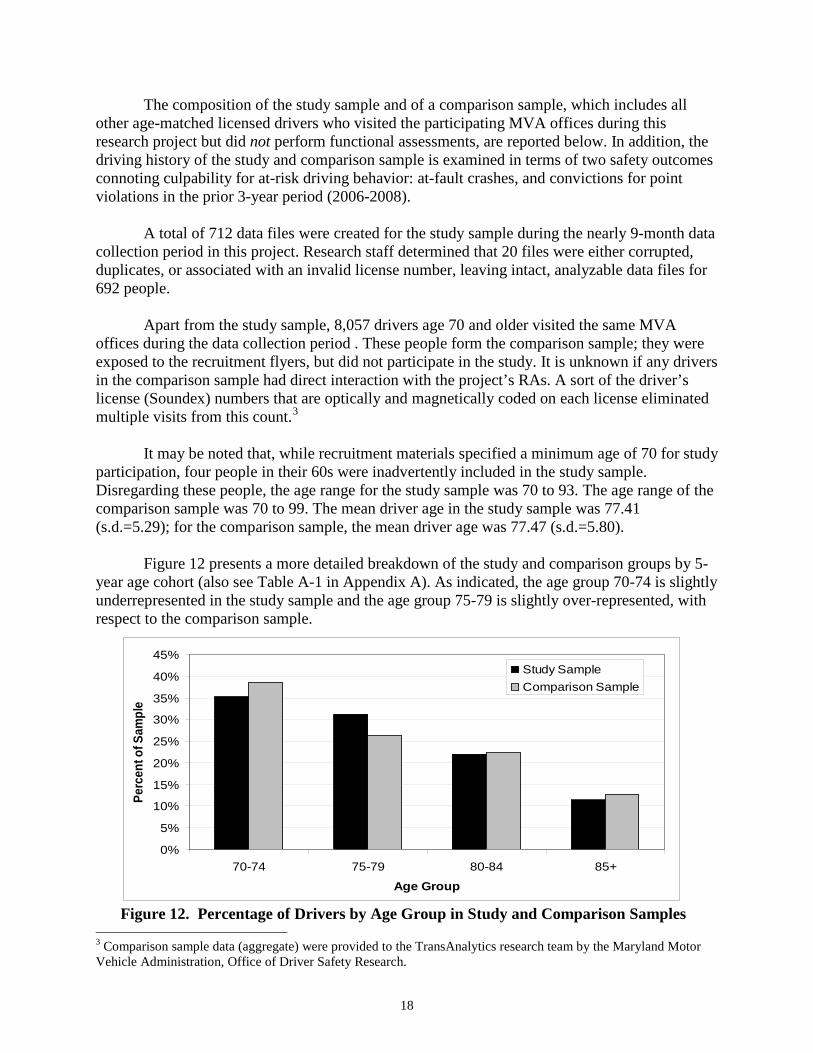
Figure 12. Percentage of Drivers by Age Group in Study and Comparison Samples
0%
5%
10%
15%
20%
25%
30%
35%
40%
45%
70-74 75-79 80-84 85+
Age Group
Perc
ent o
f Sam
ple
Study SampleComparison Sample
The composition of the study sample and of a comparison sample, which includes all other age-matched licensed drivers who visited the participating MVA offices during this research project but did not perform functional assessments, are reported below. In addition, the driving history of the study and comparison sample is examined in terms of two safety outcomes connoting culpability for at-risk driving behavior: at-fault crashes, and convictions for point violations in the prior 3-year period (2006-2008). A total of 712 data files were created for the study sample during the nearly 9-month data collection period in this project. Research staff determined that 20 files were either corrupted, duplicates, or associated with an invalid license number, leaving intact, analyzable data files for 692 people. Apart from the study sample, 8,057 drivers age 70 and older visited the same MVA offices during the data collection period . These people form the comparison sample; they were exposed to the recruitment flyers, but did not participate in the study. It is unknown if any drivers in the comparison sample had direct interaction with the project’s RAs. A sort of the driver’s license (Soundex) numbers that are optically and magnetically coded on each license eliminated multiple visits from this count.3 It may be noted that, while recruitment materials specified a minimum age of 70 for study participation, four people in their 60s were inadvertently included in the study sample. Disregarding these people, the age range for the study sample was 70 to 93. The age range of the comparison sample was 70 to 99. The mean driver age in the study sample was 77.41 (s.d.=5.29); for the comparison sample, the mean driver age was 77.47 (s.d.=5.80). Figure 12 presents a more detailed breakdown of the study and comparison groups by 5-year age cohort (also see Table A-1 in Appendix A). As indicated, the age group 70-74 is slightly underrepresented in the study sample and the age group 75-79 is slightly over-represented, with respect to the comparison sample.
3 Comparison sample data (aggregate) were provided to the TransAnalytics research team by the Maryland Motor Vehicle Administration, Office of Driver Safety Research.
19
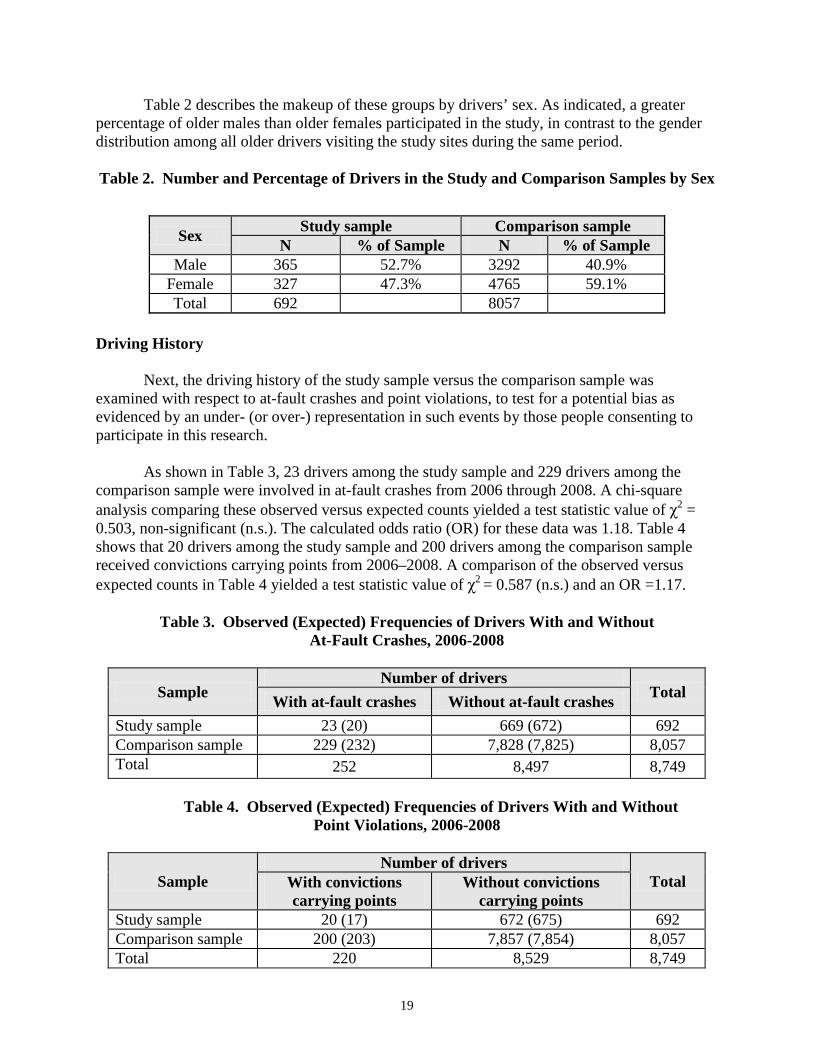
Table 2 describes the makeup of these groups by drivers’ sex. As indicated, a greater percentage of older males than older females participated in the study, in contrast to the gender distribution among all older drivers visiting the study sites during the same period. Table 2. Number and Percentage of Drivers in the Study and Comparison Samples by Sex
Study sample Comparison sample Sex N % of Sample N % of Sample Male 365 52.7% 3292 40.9%
Female 327 47.3% 4765 59.1% Total 692 8057
Driving History Next, the driving history of the study sample versus the comparison sample was examined with respect to at-fault crashes and point violations, to test for a potential bias as evidenced by an under- (or over-) representation in such events by those people consenting to participate in this research. As shown in Table 3, 23 drivers among the study sample and 229 drivers among the comparison sample were involved in at-fault crashes from 2006 through 2008. A chi-square analysis comparing these observed versus expected counts yielded a test statistic value of χ2 = 0.503, non-significant (n.s.). The calculated odds ratio (OR) for these data was 1.18. Table 4 shows that 20 drivers among the study sample and 200 drivers among the comparison sample received convictions carrying points from 2006–2008. A comparison of the observed versus expected counts in Table 4 yielded a test statistic value of χ2 = 0.587 (n.s.) and an OR =1.17.
Table 3. Observed (Expected) Frequencies of Drivers With and Without At-Fault Crashes, 2006-2008
Number of drivers
Sample Total With at-fault crashes Without at-fault crashes Study sample 23 (20) 669 (672) 692 Comparison sample 229 (232) 7,828 (7,825) 8,057 Total 252 8,497 8,749
Table 4. Observed (Expected) Frequencies of Drivers With and Without Point Violations, 2006-2008
Sample
Study sample Comparison sample Total
Number of drivers With convictions Without convictions Total carrying points carrying points
20 (17) 672 (675) 692 200 (203) 7,857 (7,854) 8,057
220 8,529 8,749
20
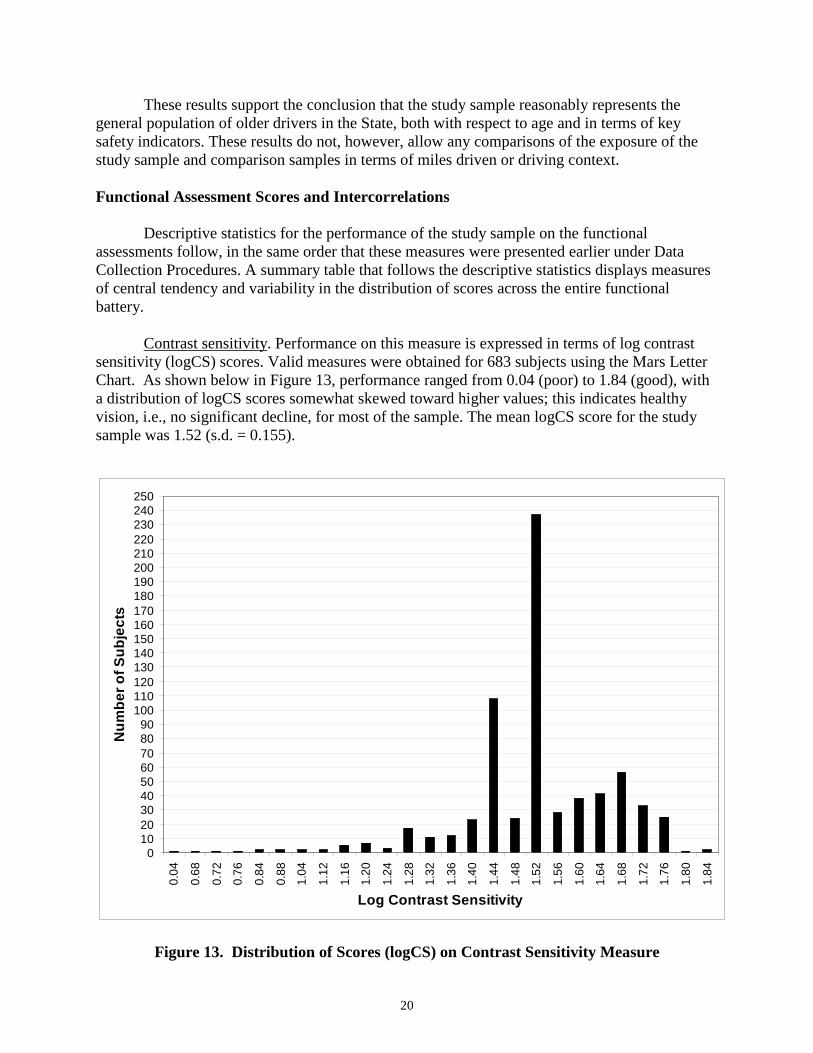
These results support the conclusion that the study sample reasonably represents the general population of older drivers in the State, both with respect to age and in terms of key safety indicators. These results do not, however, allow any comparisons of the exposure of the study sample and comparison samples in terms of miles driven or driving context. Functional Assessment Scores and Intercorrelations Descriptive statistics for the performance of the study sample on the functional assessments follow, in the same order that these measures were presented earlier under Data Collection Procedures. A summary table that follows the descriptive statistics displays measures of central tendency and variability in the distribution of scores across the entire functional battery. Contrast sensitivity. Performance on this measure is expressed in terms of log contrast sensitivity (logCS) scores. Valid measures were obtained for 683 subjects using the Mars Letter Chart. As shown below in Figure 13, performance ranged from 0.04 (poor) to 1.84 (good), with a distribution of logCS scores somewhat skewed toward higher values; this indicates healthy vision, i.e., no significant decline, for most of the sample. The mean logCS score for the study sample was 1.52 (s.d. = 0.155).
Figure 13. Distribution of Scores (logCS) on Contrast Sensitivity Measure
0102030405060708090
100110120130140150160170180190200210220230240250
0.04
0.68
0.72
0.76
0.84
0.88
1.04
1.12
1.16
1.20
1.24
1.28
1.32
1.36
1.40
1.44
1.48
1.52
1.56
1.60
1.64
1.68
1.72
1.76
1.80
1.84
Log Contrast Sensitivity
Num
ber o
f Sub
ject
s
21
Simple brake reaction time (RT). The correct response to each of the 5 trials in this measure was to remove the foot from the accelerator and press the brake. If a subject did not respond within 5 s, the trial was concluded and scored as an error. For each test subject, simple brake reaction time was averaged across the five (or fewer) trials on which they responded correctly. Mean and standard deviation brake RTs are presented in Table 5 for all subjects with at least one correct response for this measure.
Table 5. Summary of
Simple RT for All Subjects With at Least One Correct Response.
Measure N Range of scores (seconds)
Mean score (seconds)
S.D. score (seconds)
Simple brake RT (at least one correct response) 686 0.51 – 4.06 1.11 0.45
Ninety-two percent of the sample (637 subjects) responded correctly on all 5 trials; 42 subjects (6%) made 1 error; 6 subjects made 2 errors; 1 subject made 3 errors; and 3 subjects made errors on all 5 trials. The latter group, with no valid brake RT responses of less than 5.0 s, are not included in the data summary table. Choice brake reaction time (RT). In order to respond correctly to each of the 5 trials designated as choice RT trials in this measure, the subject removed his or her foot from the accelerator and pressed the brake. For the 10 distractor trials the correct response was to keep the foot on the accelerator. If a subject pressed the brake on a distractor trial, a false alarm was recorded. If a subject failed to respond with a brake press within 3.0 s, that trial was concluded and scored as an error. For each test subject, choice brake reaction time was averaged across the five (or fewer) trials on which they responded correctly. Table 6 presents mean and standard deviation brake RTs for all subjects with at least one correct response for this measure, and also for the slightly smaller group of subjects with at least three correct responses.
Table 6. Summary of
Choice RT by Minimum Number of Correct Responses
Measure N Range of scores (seconds)
Mean score (seconds)
S.D. Score (seconds)
Choice brake RT (at least one correct response) 677 0.64 - 2.95 1.34 0.38
Choice brake RT (at least three correct responses) 651 0.64 – 2.73 1.32 0.35
Five hundred twelve subjects (75%) responded correctly on all five trials; 117 subjects (17%) made one error; 22 subjects (3%) made 2 errors; 17 subject made 3 errors; 9 subjects made 4 errors; and 12 subjects made errors on all 5 trials. The latter group, with no valid brake RT responses of less than 3.0 s, are not included in the data summary table. The distribution of false alarms on this measure, where subjects responded by pressing the incorrect pedal, is shown in Table 7. As noted, this measure included 10 distractor trials; the number of false alarms per subject could therefore range from 0 to 10. Half of the subjects made no false alarms on these trials, and a quarter made only 1 error.
22
Table 7. False Alarms on Choice RT Trials
Number of responses to Number of
distractors (false alarms) subjects 0 344 1 172 2 37 3 25 4 35 5 39 6 13 7 3 8 5 9 1 10 15
Percentage of sample
50% 25% 5% 4% 5% 6% 2%
<1% <1% <1% 2%
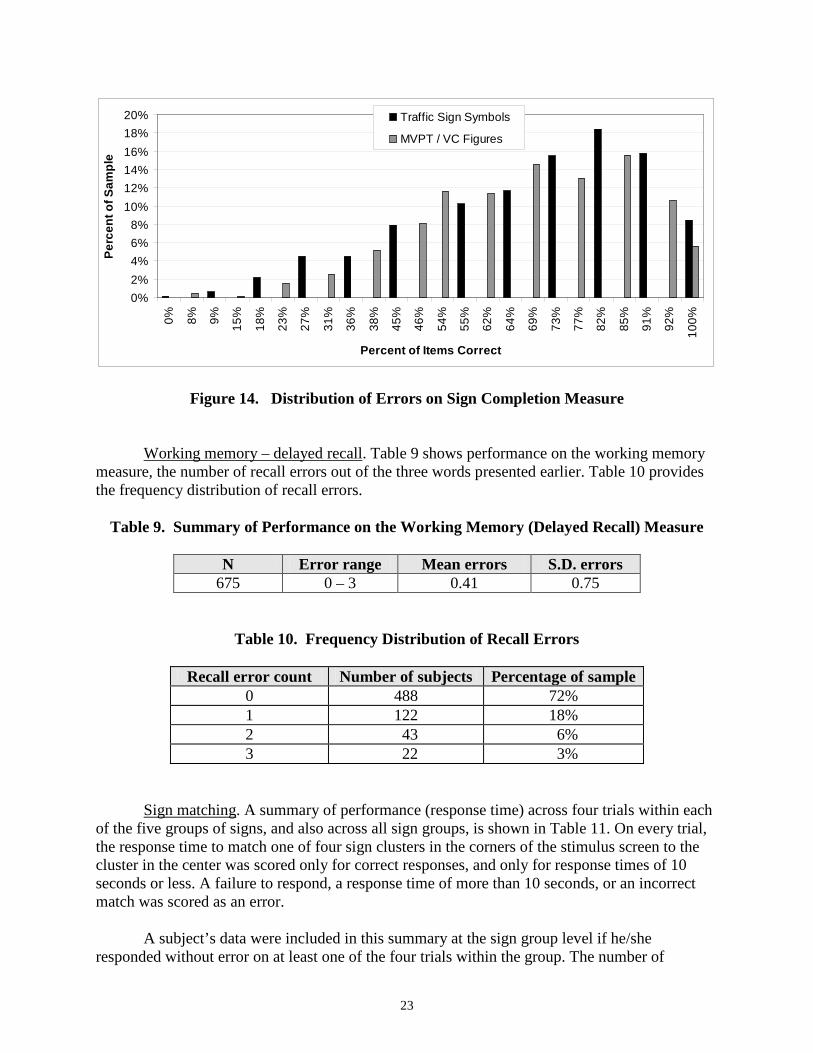
Sign completion. Performance on this measure is summarized in terms of the number of errors (incorrect responses) subjects made when identifying which of four test stimuli with missing lines could be completed to match a reference figure at the top of the page. The measure included two subsets of stimuli, a 13-item set taken from the Visual Closure subtest of the current version of the Motor Free Visual Perception Test (MVPT-3/VC); and an 11-item set using current traffic sign shapes and symbols, altered by TransAnalytics in a manner designed to approximate the missing information characteristics of the MVPT/VC stimuli. Table 8 summarizes performance for the MVPT/VC figures and traffic sign symbols, respectively. Figure 14 presents the number of subjects and percentage of the sample at each error count for each subset of stimuli to facilitate a comparison of subjects’ performance using the MVPT/VC items and the traffic sign shapes and symbols (also see Table A-2 in Appendix A). Table 8. Performance Summary (Incorrect Responses) for Each Stimulus Set Used for the
Sign Completion Measure
Stimulus set N Error range Mean errors MVPT/VC figures 681 0-12 4.07 Traffic sign shapes/symbols 684 0-11 3.40
S.D. errors 2.50 2.39
23
Figure 14. Distribution of Errors on Sign Completion Measure
0%2%4%6%8%
10%12%14%16%18%20%
0% 8% 9% 15%
18%
23%
27%
31%
36%
38%
45%
46%
54%
55%
62%
64%
69%
73%
77%
82%
85%
91%
92%
100%
Percent of Items Correct
Perc
ent o
f Sam
ple
Traffic Sign Symbols
MVPT / VC Figures
Working memory – delayed recall. Table 9 shows performance on the working memory measure, the number of recall errors out of the three words presented earlier. Table 10 provides the frequency distribution of recall errors.
Table 9. Summary of Performance on the Working Memory (Delayed Recall) Measure
N 675
Error range Mean errors S.D. errors 0 – 3 0.41 0.75
Table 10. Frequency Distribution of Recall Errors
Recall error count Number of subjects Percentage of sample
0 488 72% 1 122 18% 2 43 6% 3 22 3%
Sign matching. A summary of performance (response time) across four trials within each of the five groups of signs, and also across all sign groups, is shown in Table 11. On every trial, the response time to match one of four sign clusters in the corners of the stimulus screen to the cluster in the center was scored only for correct responses, and only for response times of 10 seconds or less. A failure to respond, a response time of more than 10 seconds, or an incorrect match was scored as an error. A subject’s data were included in this summary at the sign group level if he/she responded without error on at least one of the four trials within the group. The number of
24
subjects contributing to the data summary for “all groups” could therefore exceed the total for any single group. This number was used to calculate the grand mean and standard deviation scores for all groups.
Table 11. Performance Summary on the Sign Matching Measure
Sign group N Range of scores (seconds)
Mean score (seconds)
S.D. score (seconds)
Brown and white, recreational and cultural interest 669 1.96 – 9.90 5.92 1.32
Black and white, regulatory lane use 660 2.86 – 9.92 6.16 1.30 Red and white, regulatory 663 2.22 – 9.89 5.84 1.29 Yellow warning signs, hazard ahead 657 2.54 – 9.83 6.00 1.24 Yellow warning signs, road geometry 665 3.12 – 9.98 5.67 1.20 All groups 674 2.92 – 9.90 5.95 1.06
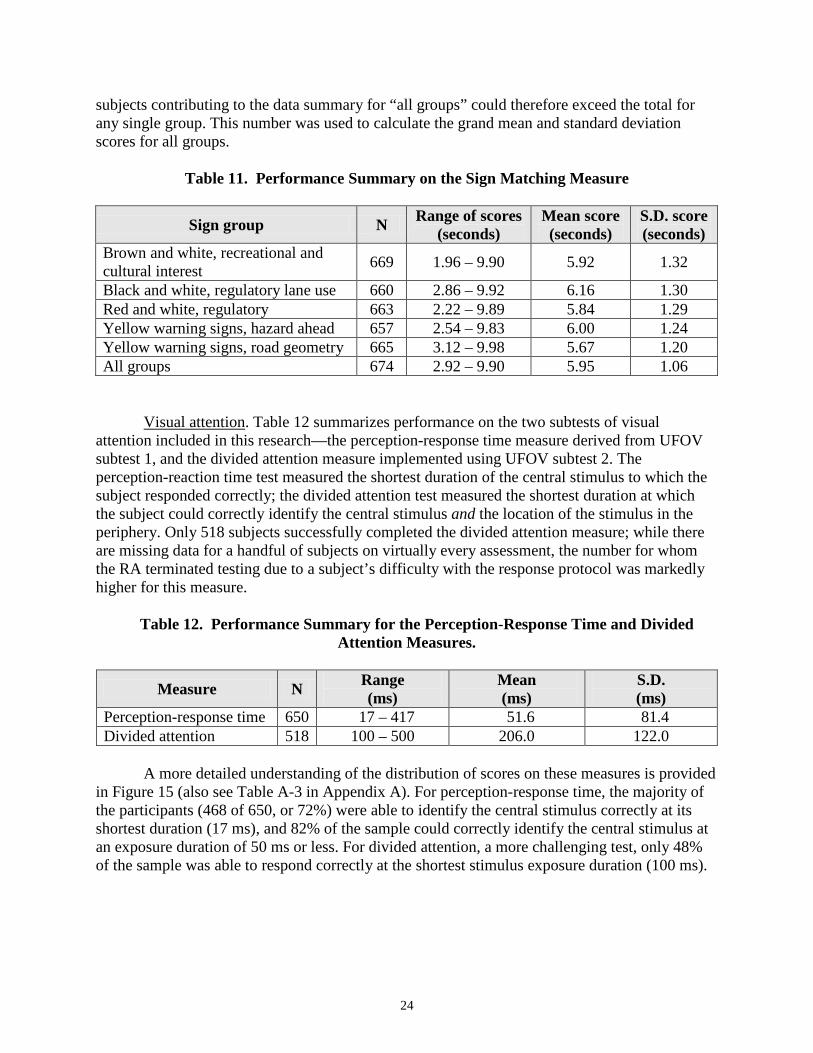
Visual attention. Table 12 summarizes performance on the two subtests of visual attention included in this research—the perception-response time measure derived from UFOV subtest 1, and the divided attention measure implemented using UFOV subtest 2. The perception-reaction time test measured the shortest duration of the central stimulus to which the subject responded correctly; the divided attention test measured the shortest duration at which the subject could correctly identify the central stimulus and the location of the stimulus in the periphery. Only 518 subjects successfully completed the divided attention measure; while there are missing data for a handful of subjects on virtually every assessment, the number for whom the RA terminated testing due to a subject’s difficulty with the response protocol was markedly higher for this measure.
Table 12.
Performance Summary for the Perception-Response Time and Divided Attention Measures.
Measure N Range (ms)
Mean (ms)
S.D. (ms)
Perception-response time 650 17 – 417 51.6 81.4 Divided attention 518 100 – 500 206.0 122.0
A more detailed understanding of the distribution of scores on these measures is provided in Figure 15 (also see Table A-3 in Appendix A). For perception-response time, the majority of the participants (468 of 650, or 72%) were able to identify the central stimulus correctly at its shortest duration (17 ms), and 82% of the sample could correctly identify the central stimulus at an exposure duration of 50 ms or less. For divided attention, a more challenging test, only 48% of the sample was able to respond correctly at the shortest stimulus exposure duration (100 ms).
25
Figure 15. Distribution of Scores on the Visual Attention Measures, by Stimulus Exposure
Duration
0%
10%
20%
30%
40%
50%
60%
70%
80%
90%
<51
51-1
00
101-
150
151-
200
201-
250
251-
300
301-
350
351-
400
401-
450
451-
500
Shortest Central Stimulus Duration Responded to Correctly (ms)
Perc
ent o
f Sam
ple
Perception-Response Time
Divided Attention
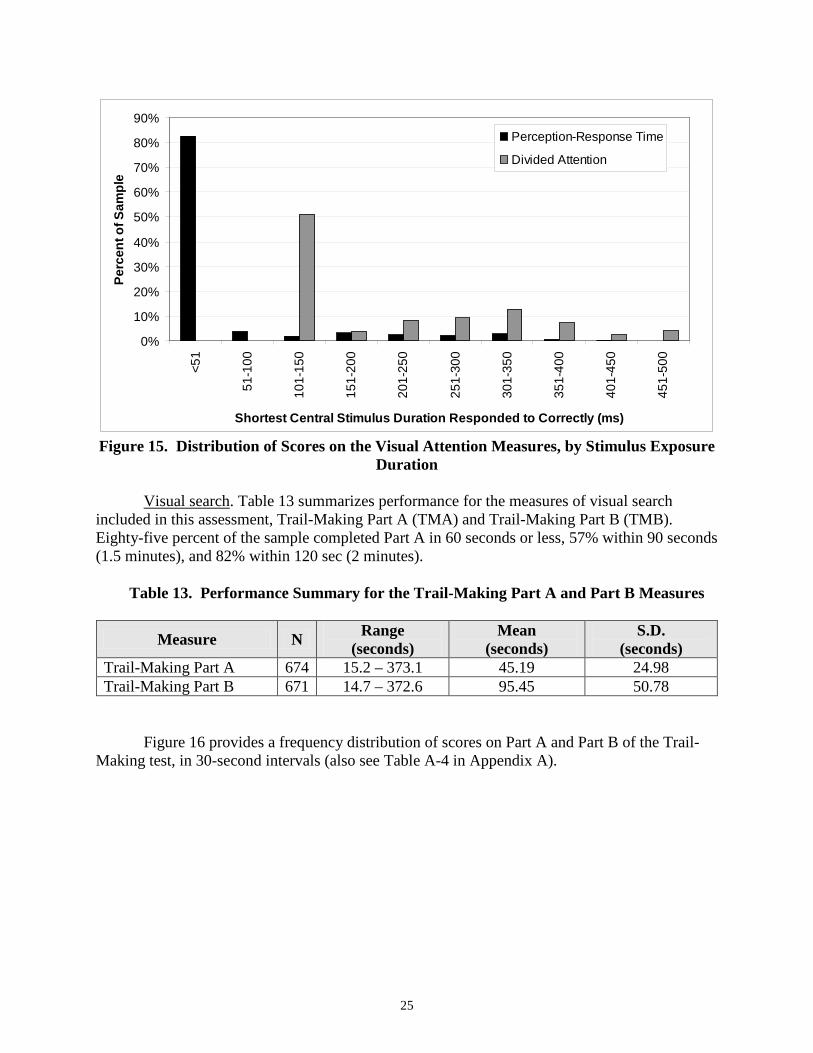
Visual search. Table 13 summarizes performance for the measures of visual search included in this assessment, Trail-Making Part A (TMA) and Trail-Making Part B (TMB). Eighty-five percent of the sample completed Part A in 60 seconds or less, 57% within 90 seconds (1.5 minutes), and 82% within 120 sec (2 minutes).
Table 13.
Performance Summary for the Trail-Making Part A and Part B Measures
Measure N Range (seconds)
Mean (seconds)
S.D. (seconds)
Trail-Making Part A 674 15.2 – 373.1 45.19 24.98 Trail-Making Part B 671 14.7 – 372.6 95.45 50.78
Figure 16 provides a frequency distribution of scores on Part A and Part B of the Trail-Making test, in 30-second intervals (also see Table A-4 in Appendix A).
26
Figure 16. Graphical Display of the Distribution of Test Completion Times, in 30-
Second Intervals, for Trail-Making Part A (TMA) and Part B (TMB)
0
50
100
150
200
250
300
350
400
450
< 30
30 -
60
61 -
90
91 -
120
121
- 150
151
- 180
181
- 210
211
- 240
241
- 270
271
- 300
301
- 330
331
- 360
>360
Time to Complete (Seconds)
Num
ber o
f Sub
ject
s
TMATMB
Route planning. A summary of performance on the maze test is presented in Table 14. The test incorporated three measures included in later analyses: completion time, planning time, and errors/dead ends. Completion time is the total amount of time from the instant a maze appeared on the touchscreen until the subject completed tracing a line through the maze and arrived at the finish point. Planning time is this total completion time minus the time when the subject’s finger was actually drawing the line through the maze. The count of errors/dead ends reveals how often a subject was required to discontinue the path he/she was following through the maze, and shift to another path. Following Ott et al. (2008), performance is described in terms of the total score, summed across all five mazes, for each of the three outcome variables. As shown in Table 14, these data varied considerably. Note the smaller N for the measure “planning time.” This is a consequence of an apparent measurement error, that resulted on trials where this value was not greater than zero for a subject on one or more mazes.
Table 14. Summary of Performance on the Maze Tests
Measure N Range Mean S.D.
Time to complete (seconds) 661 11.22 – 203.87 88.94 31.78 Planning time (seconds) 628 3.69 – 99.62 23.05 14.40 Number of errors or dead ends 661 0 – 101 16.92 13.61
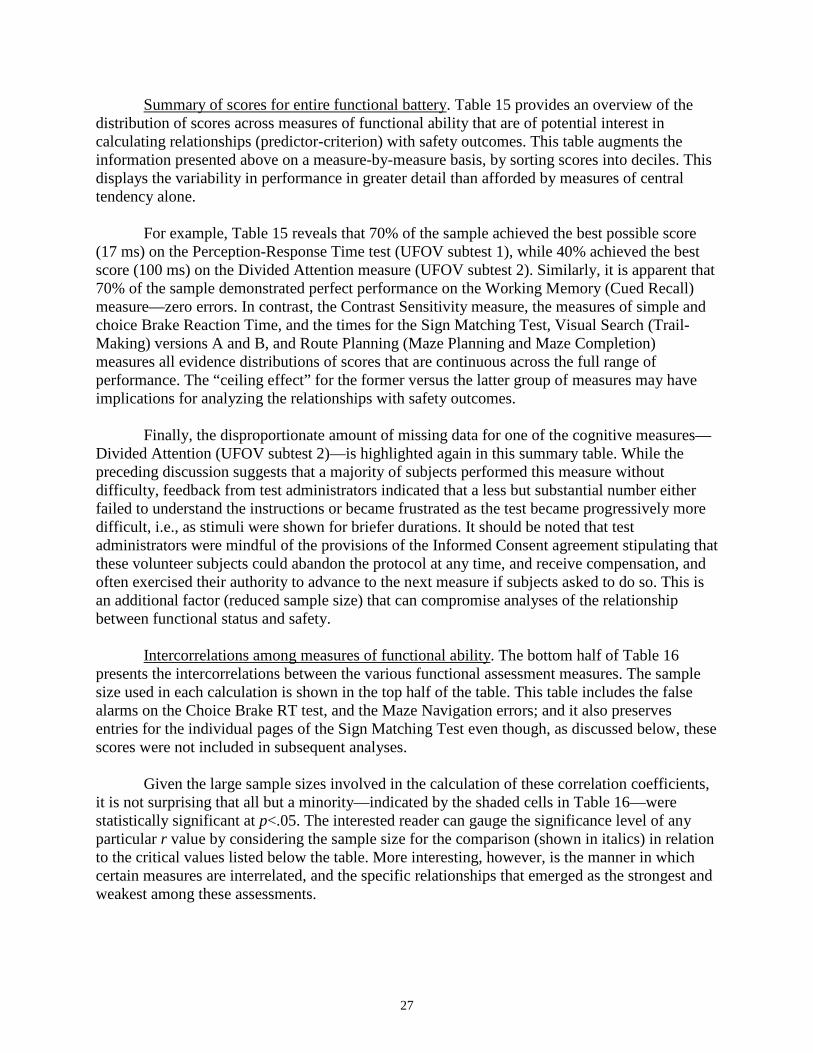
27
Summary of scores for entire functional battery. Table 15 provides an overview of the distribution of scores across measures of functional ability that are of potential interest in calculating relationships (predictor-criterion) with safety outcomes. This table augments the information presented above on a measure-by-measure basis, by sorting scores into deciles. This displays the variability in performance in greater detail than afforded by measures of central tendency alone. For example, Table 15 reveals that 70% of the sample achieved the best possible score (17 ms) on the Perception-Response Time test (UFOV subtest 1), while 40% achieved the best score (100 ms) on the Divided Attention measure (UFOV subtest 2). Similarly, it is apparent that 70% of the sample demonstrated perfect performance on the Working Memory (Cued Recall) measure—zero errors. In contrast, the Contrast Sensitivity measure, the measures of simple and choice Brake Reaction Time, and the times for the Sign Matching Test, Visual Search (Trail-Making) versions A and B, and Route Planning (Maze Planning and Maze Completion) measures all evidence distributions of scores that are continuous across the full range of performance. The “ceiling effect” for the former versus the latter group of measures may have implications for analyzing the relationships with safety outcomes. Finally, the disproportionate amount of missing data for one of the cognitive measures—Divided Attention (UFOV subtest 2)—is highlighted again in this summary table. While the preceding discussion suggests that a majority of subjects performed this measure without difficulty, feedback from test administrators indicated that a less but substantial number either failed to understand the instructions or became frustrated as the test became progressively more difficult, i.e., as stimuli were shown for briefer durations. It should be noted that test administrators were mindful of the provisions of the Informed Consent agreement stipulating that these volunteer subjects could abandon the protocol at any time, and receive compensation, and often exercised their authority to advance to the next measure if subjects asked to do so. This is an additional factor (reduced sample size) that can compromise analyses of the relationship between functional status and safety. Intercorrelations among measures of functional ability. The bottom half of Table 16 presents the intercorrelations between the various functional assessment measures. The sample size used in each calculation is shown in the top half of the table. This table includes the false alarms on the Choice Brake RT test, and the Maze Navigation errors; and it also preserves entries for the individual pages of the Sign Matching Test even though, as discussed below, these scores were not included in subsequent analyses. Given the large sample sizes involved in the calculation of these correlation coefficients, it is not surprising that all but a minority—indicated by the shaded cells in Table 16—were statistically significant at p<.05. The interested reader can gauge the significance level of any particular r value by considering the sample size for the comparison (shown in italics) in relation to the critical values listed below the table. More interesting, however, is the manner in which certain measures are interrelated, and the specific relationships that emerged as the strongest and weakest among these assessments.
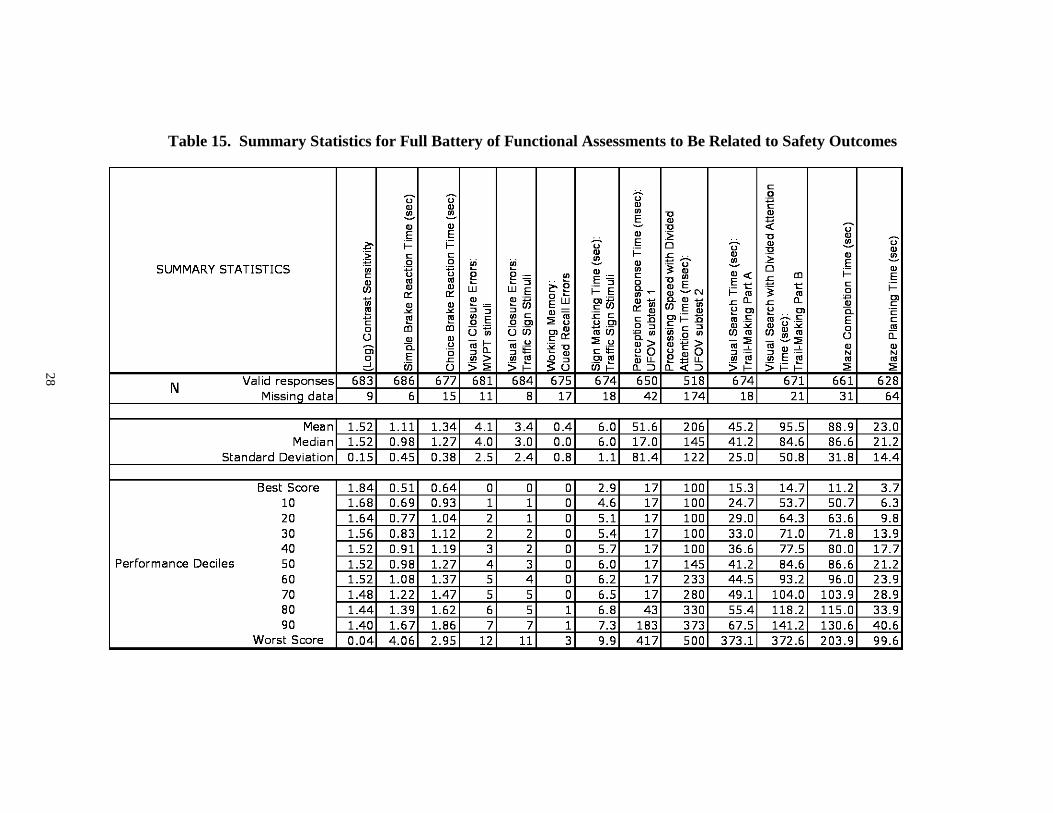
28
Table 15. Summary Statistics for Full Battery of Functional Assessments to Be Related to Safety Outcomes
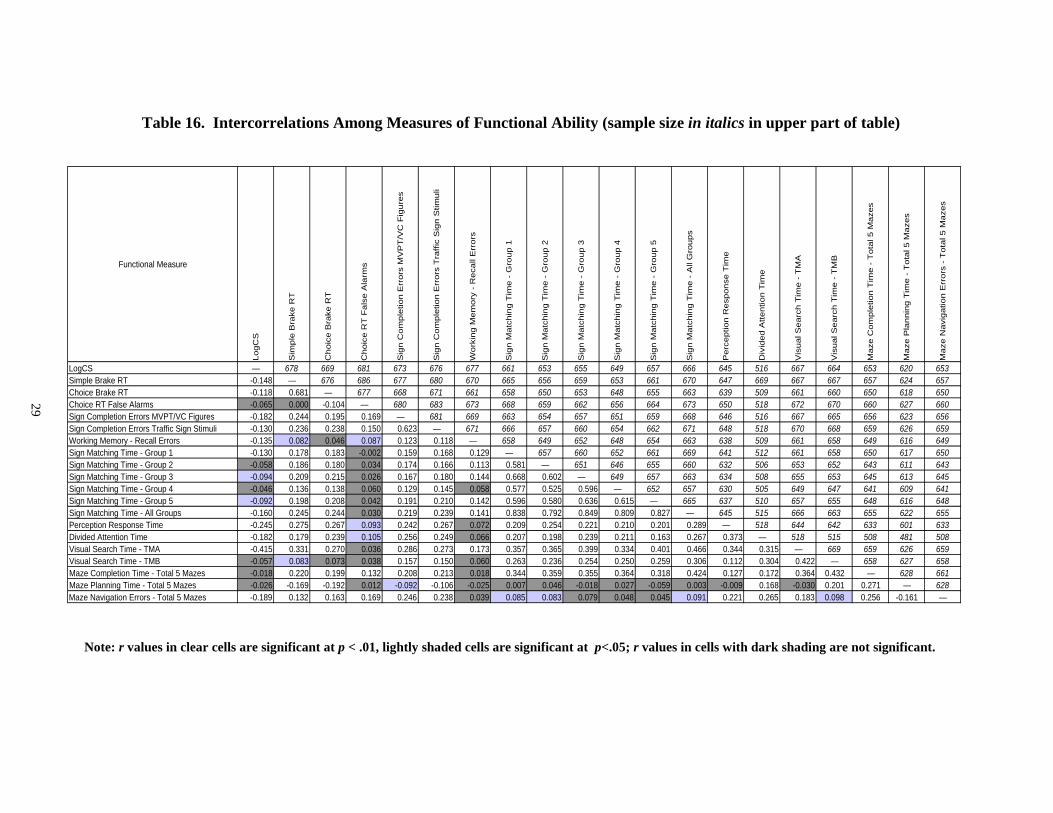
29
Table 16. Int
Functional Measure
LogCSSimple Brake RT Choice Brake RTChoice RT False AlarmsSign Completion Errors MVPT/VC FiguresSign Completion Errors Traffic Sign StimuliWorking Memory - Recall ErrorsSign Matching Time - Group 1Sign Matching Time - Group 2Sign Matching Time - Group 3Sign Matching Time - Group 4Sign Matching Time - Group 5Sign Matching Time - All Groups Perception Response TimeDivided Attention Time
ercorrelations Among Measures of Functional Ability (sample size in italics in upper part o
LogC
S
Sim
ple
Bra
ke R
T
Cho
ice
Bra
ke R
T
Cho
ice
RT
Fal
se A
larm
s— 678 669 681 673 676 677 661 653 655 649 657 666 645 516 667 664-0.148 — 676 686 677 680 670 665 656 659 653 661 670 647 669 667 667-0.118 0.681 — 677 668 671 661 658 650 653 648 655 663 639 509 661 660
Sig
n C
ompl
etio
n E
rror
s M
VP
T/V
C F
igur
es
Sig
n C
ompl
etio
n E
rror
s T
raffi
c S
ign
Stim
uli
Wor
king
Mem
ory
- R
ecal
l Err
ors
Sig
n M
atch
ing
Tim
e -
Gro
up 1
Sig
n M
atch
ing
Tim
e -
Gro
up 2
Sig
n M
atch
ing
Tim
e -
Gro
up 3
Sig
n M
atch
ing
Tim
e -
Gro
up 4
Sig
n M
atch
ing
Tim
e -
Gro
up 5
Sig
n M
atch
ing
Tim
e -
All
Gro
ups
Per
cept
ion
Res
pons
e T
ime
Div
ided
Atte
ntio
n T
ime
Vis
ual S
earc
h T
ime
- T
MA
Vis
ual S
earc
h T
ime
- T
MB
f table)
653 620657 624650 618
Maz
e C
ompl
etio
n T
ime
- T
otal
5 M
azes
Maz
e P
lann
ing
Tim
e -
Tot
al 5
Maz
es
653657650
Maz
e N
avig
atio
n E
rror
s -
Tot
al 5
Maz
es
-0.065 0.000 -0.104 — 680 683 673 668 659 662 656 664 673 650 518 672 670 660 627 660-0.182 0.244 0.195 0.169 — 681 669 663 654 657 651 659 668 646 516 667 665-0.130 0.236 0.238 0.150 0.623 — 671 666 657 660 654 662 671 648 518 670 668-0.135 0.082 0.046 0.087 0.123 0.118 — 658 649 652 648 654 663 638 509 661 658-0.130 0.178 0.183 -0.002 0.159 0.168 0.129 — 657 660 652 661 669 641 512 661 658-0.058 0.186 0.180 0.034 0.174 0.166 0.113 0.581 — 651 646 655 660 632 506 653 652-0.094 0.209 0.215 0.026 0.167 0.180 0.144 0.668 0.602 — 649 657 663 634 508 655 653-0.046 0.136 0.138 0.060 0.129 0.145 0.058 0.577 0.525 0.596 — 652 657 630 505 649 647-0.092 0.198 0.208 0.042 0.191 0.210 0.142 0.596 0.580 0.636 0.615 — 665 637 510 657 655
656 623659 626649 616650 617643 611645 613641 609648 616
656659649650643645641648
-0.160 0.245 0.244 0.030 0.219 0.239 0.141 0.838 0.792 0.849 0.809 0.827 — 645 515 666 663-0.245 0.275 0.267 0.093 0.242 0.267 0.072 0.209 0.254 0.221 0.210 0.201 0.289 — 518 644 642-0.182 0.179 0.239 0.105 0.256 0.249 0.066 0.207 0.198 0.239 0.211 0.163 0.267 0.373 — 518 515-0.415 0.331 0.270 0.036 0.286 0.273 0.173 0.357 0.365 0.399 0.334 0.401 0.466 0.344 0.315 — 669
655 622633 601508 481659 626
655633508659Visual Search Time - TMA
Visual Search Time - TMB -0.057 0.083 0.073 0.038 0.157 0.150 0.060 0.263 0.236 0.254 0.250 0.259 0.306 0.112 0.304 0.422 — 658 627 658Maze Completion Time - Total 5 Mazes -0.018 0.220 0.199 0.132 0.208 0.213 0.018 0.344 0.359 0.355 0.364 0.318 0.424 0.127 0.172 0.364 0.432
-0.026 -0.169 -0.192 0.012 -0.092 -0.106 -0.025 0.007 0.046 -0.018 0.027 -0.059 0.003 -0.009 0.168 -0.030 0.201-0.189 0.132 0.163 0.169 0.246 0.238 0.039 0.085 0.083 0.079 0.048 0.045 0.091 0.221 0.265 0.183 0.098
are significant at p < .01, lightly shaded cells are significant at p<.05; r values in cells with dark shading are
— 6280.271 —0.256 -0.161
not significan
661628—
t.
Maze Planning Time - Total 5 MazesMaze Navigation Errors - Total 5 Mazes
Note: r values in clear cells
30
As noted earlier, higher scores on these assessments typically translates to poorer performance across outcome measures including response time (Brake RT and Sign Matching), stimulus exposure duration (PRT and Divided Attention), errors or incorrect responses (Working Memory and Sign Completion), and completion times (Visual Search/Trail-Making and the Maze Test). The exception is (log) Contrast Sensitivity, where higher scores are associated with better performance. The most obvious result in Table 16 is the consistent inverse relationship between contrast sensitivity and the scores for every other functional assessment performed in this research. This makes sense, as poorer vision (lower LogCS values) is associated with poorer performance on the other measures (higher values), all of which depend on the processing of visual information. The highest intercorrelations were observed among the individual categories of stimuli in the Sign Matching test. While expected, these data validate assumptions of equivalent difficulty across stimulus sets. Similarly, each stimulus set was very highly correlated (r ~ .80) with the “all groups” composite calculation for performance on this measure. Accordingly, the “all groups” data were the focus of subsequent analyses. Simple and Choice Brake RT measures produced the next highest intercorrelations (r = .681), followed by the alternative sets of test stimuli used to assess visual closure in the Sign Completion test—the conventional MVPT/VC line drawings and the traffic sign shapes and symbols with missing and disoriented line segments (r = .623). For the former test, Choice RT was inversely correlated with false alarms; as subjects took longer to respond, they made fewer errors, a classic response speed-accuracy tradeoff. For the latter measure, the results suggest that the two alternative sets of Sign Completion stimuli may be interchangeable. Both were included in subsequent analyzes involving safety and driving performance outcomes. Within the cognitive assessments, scores on the two visual search measures, Trail-Making Part A and B demonstrated a reasonably strong association (r = .422). Interestingly, results for Part A of this test procedure was more strongly associated than results for Part B with scores on the other measures of cognitive ability, even including Divided Attention (UFOV Subtest 2). The assessment targeting “executive function,” the Maze Test, yielded mixed results. Maze Navigation Errors and Maze Planning Time were significantly correlated with the fewest other assessments, overall, and the fewest other cognitive assessments in particular. Also, Maze Planning Time was inversely correlated with the other speeded response measures (Simple and Choice RT), and with Maze Navigation Errors. The latter finding is not unexpected—with instructions to complete the mazes as fast as possible, an increase in planning time should lead to a reduction in navigation errors, as indicated in Table 16. Those with extended planning times may have attempted to solve the mazes “cognitively” before ever touching the screen. However, there was a much stronger and consistently positive association of Maze Completion Time with the cognitive and speed-of-response assessments. Maze Completion Time and Maze Planning Time were both retained in subsequent analyses, but Maze Navigation Errors was dropped from further analysis in consideration of the apparent measurement errors noted earlier.
31
Relationships of Functional Scores with Crashes and Violations Univariate and multivariate data analyses documented relationships between functional assessment scores and prospective motor vehicle crashes and serious moving violations using the R statistical computing environment (R Development Core Team, 2011). The EpiTools (short for Epidemiology Tools) package, which was loaded into R (Aragon, 2010), supported significance testing. One-tailed tests were applied in the univariate analyses because the hypotheses concerned a directional effect on safety indices of a decline in functional abilities—i.e., poorer function should result in higher risk of unsafe outcomes. Specifically, analysts carried out one-tailed significance tests using the mid-P (short for median or mid-probability) method, a variant of the Fisher's exact test. The mid-P variant compensates for overly conservative significance testing of 2x2 contingency tables caused by discreteness of the data (for details see Berry & Armitage, 1995). In the current analyses, the discreteness is due to the small number of crashes (20) and citations (16) among the study sample during the prospective observation period. As such, the statistician selected the Fisher's exact test with mid-P adjustment for the current analyses over either the Pearson's chi-square test or the Fisher's exact test (Lydersen, Fagerland, & Laake, 2009). These analyses compared the crash and violation experience of drivers in the study sample for a period of 18 months following assessment with their clinical assessment scores. The Maryland MVA assisted in keying the driving history data to the assessment date of each individual. The analyst calculated an odds ratio for each statistical test that reached significance (p < .05), as well as those that fell into a “marginal” range (.05 < p < .10) — providing that changes with declining function in the relative proportions of crash- or violation-involved versus crash- or violation-free drivers were in the predicted direction. For these outcomes, the greater statistical power afforded by a larger sample size (also yielding additional crashes and violations during the observation period) would likely indicate that such differences are reliable at the .05 level. It should be noted that the number of drivers for whom assessment data were available in the current analyses – 692 – falls substantially below the sample size of 1,876 analyzed in the preceding NHTSA research that in many ways provided the rationale and justification for this study.4 Cutpoints were identified separately for crashes and for moving violations, signifying assessment scores that resulted in the peak odds ratio with a minimum of 5 drivers per cell. This criterion for a valid analysis was rigidly applied. If no cutpoint satisfied this criterion, the analysis was deemed invalid and no result was reported. One measure of functional ability (working memory/delayed recall) in the crash analyses and two measures (working memory/ delayed recall and perception-response time (UFOV subtest 1)) in the analyses of moving violations did not produce valid cutpoints. Reasons for these limitations to the current analyses are considered later in the discussion section of this report.
4 Staplin, L., Lococo, K. H., Gish, K. W., & Decina, L. E. (2003, May). Model driver screening and evaluation program, vol. II, Maryland pilot older driver study. (Report No. DOT HS 809 583). Washington, DC: National Highway Traffic Safety Administration.
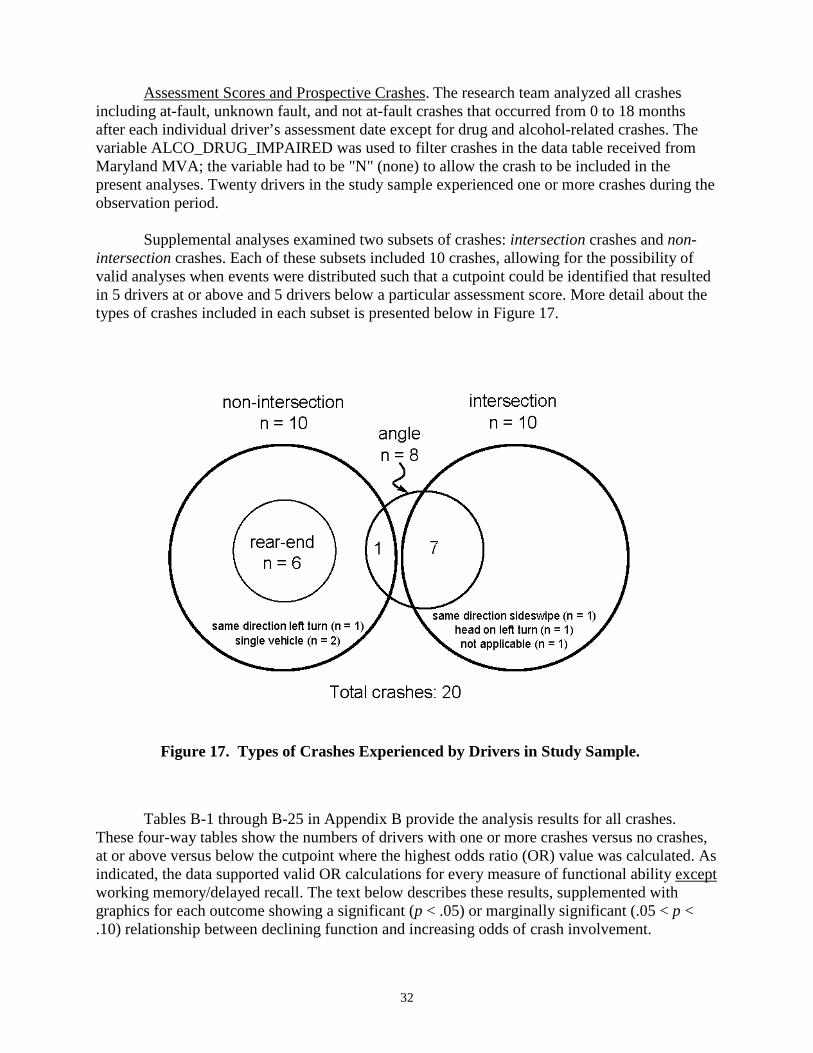
32
Assessment Scores and Prospective Crashes. The research team analyzed all crashes including at-fault, unknown fault, and not at-fault craafter each individual driver’s assessment date except
shes that occurred from 0 to 18 months for drug and alcohol-related crashes. The
variable ALCO_DRUG_IMPAIRED was used to filter crashes in the data table received from Maryland MVA; the variable had to be "N" (none) to allow the crash to be included in the present analyses. Twenty drivers in the study sample experienced one or more crashes during the observation period. Supplemental analyses examined two subsets of crashes: intersection crashes and non-intersection crashes. Each of these subsets included 10 crashes, allowing for the possibility of valid analyses when events were distributed such that a cutpoint could be identified that resulted in 5 drivers at or above and 5 drivers below a particular assessment score. More detail about the types of crashes included in each subset is presented below in Figure 17.
Figure 17. Types of Crashes Experienced by Drivers in Study Sample.
Tables B-1 through B-25 in Appendix B provide the analysis results for all crashes. These four-way tables show the numbers of drivers with one or more crashes versus no crashes, at or above versus below the cutpoint where the highest odds ratio (OR) value was calculated. As indicated, the data supported valid OR calculations for every measure of functional ability except working memory/delayed recall. The text below describes these results, supplemented with graphics for each outcome showing a significant (p < .05) or marginally significant (.05 < p < .10) relationship between declining function and increasing odds of crash involvement.
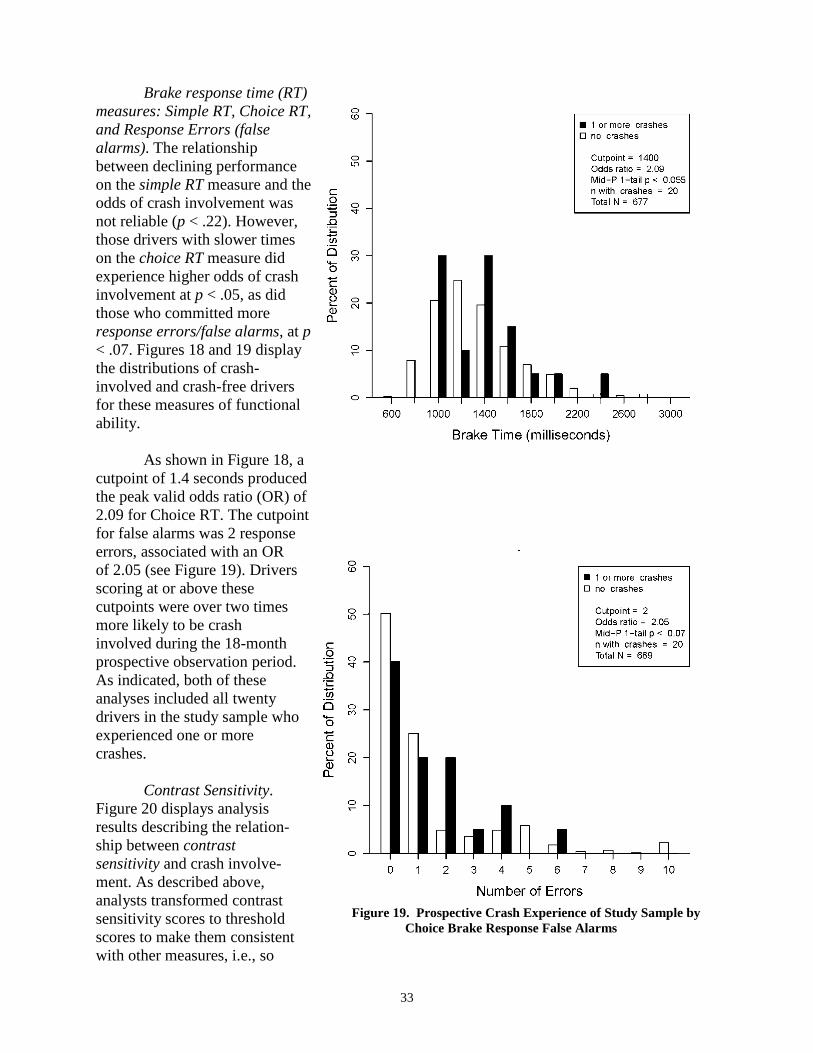
33
Brake response time (RT) ,
Figure 18. Prospective Crash Experience of Study Sample by Choice Brake Response Time.
Figure 19. Prospective Crash Experience of Study Sample by Choice Brake Response False Alarms
measures: Simple RT, Choice RTand Response Errors (false alarms). The relationship between declining performance on the simple RT measure and theodds of crash involvement was not reliable (p < .22). However, those drivers with slower times on the choice RT measure did experience higher odds of crash involvement at p < .05, as did those who committed more response errors/false alarms, at p< .07. Figures 18 and 19 display the distributions of crash-involved and crash-free drivers for these measures of functional ability. As shown in Figure 18, a cutpoint of 1.4 seconds producedthe peak valid odds ratio (OR) of2.09 for Choice RT. The cutpointfor false alarms was 2 response errors, associated with an OR of 2.05 (see Figure 19). Drivers scoring at or above these cutpoints were over two times more likely to be crash involved during the 18-month prospective observation period. As indicated, both of these analyses included all twenty drivers in the study sample who experienced one or more crashes. Contrast Sensitivity. Figure 20 displays analysis results describing the relation-ship between contrast sensitivity and crash involve-ment. As described above, analysts transformed contrast sensitivity scores to threshold scores to make them consistent with other measures, i.e., so
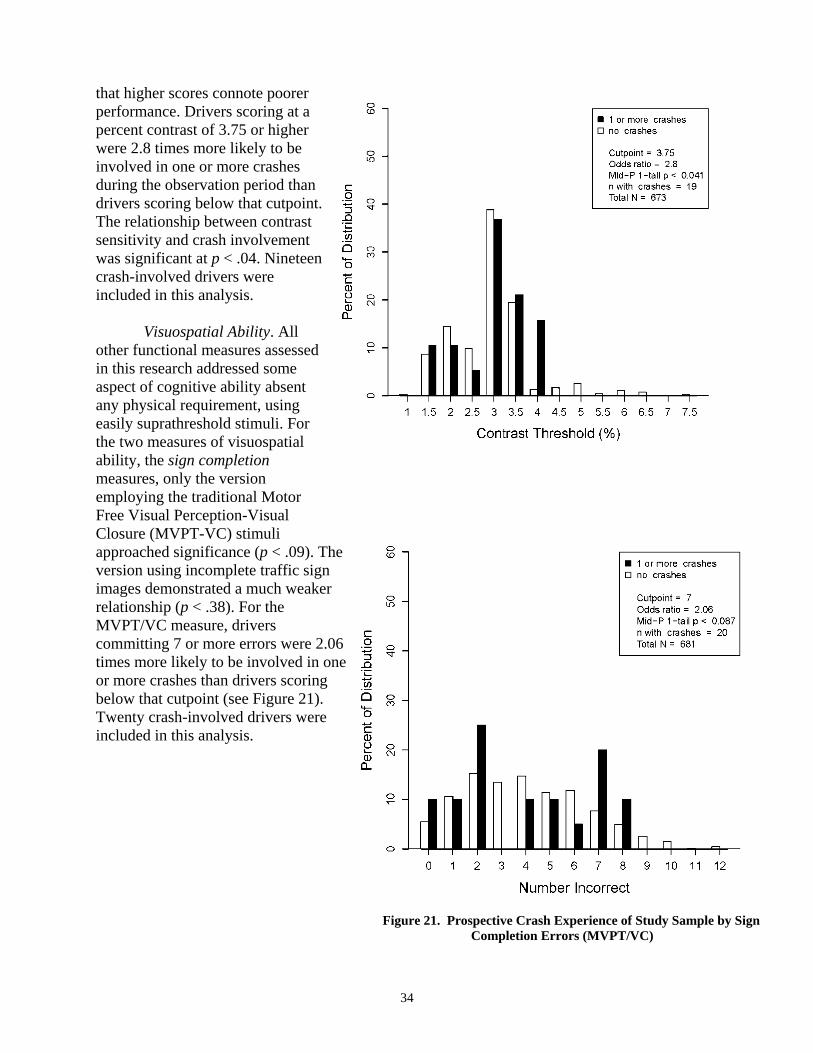
34
that higher scores connote poorer performance. Drivers scoring at a percent contrast of 3.75 or higher were 2.8 times more likely to be involved in one or more crashes during the observation period than drivers scoring below that cutpoint. The relationship between contrast sensitivity and crash involvement was significant at p < .04. Nineteen crash-involved drivers were included in this analysis. Visuospatial Ability. All other functional measures assessed in this research addressed some aspect of cognitive ability absent any physical requirement, using easily suprathreshold stimuli. For the two measures of visuospatial ability, the sign completion measures, only the version employing the traditional Motor Free Visual Perception-Visual Closure (MVPT-VC) stimuli approached significance (p < .09). The
e
Figure 20. Prospective Crash Experience of Study Sample by Contrast Threshold
Figure 21. Prospective Crash Experience of Study Sample by Sign Completion Errors (MVPT/VC)
version using incomplete traffic sign images demonstrated a much weaker relationship (p < .38). For the MVPT/VC measure, drivers committing 7 or more errors were 2.06times more likely to be involved in onor more crashes than drivers scoring below that cutpoint (see Figure 21). Twenty crash-involved drivers were included in this analysis.
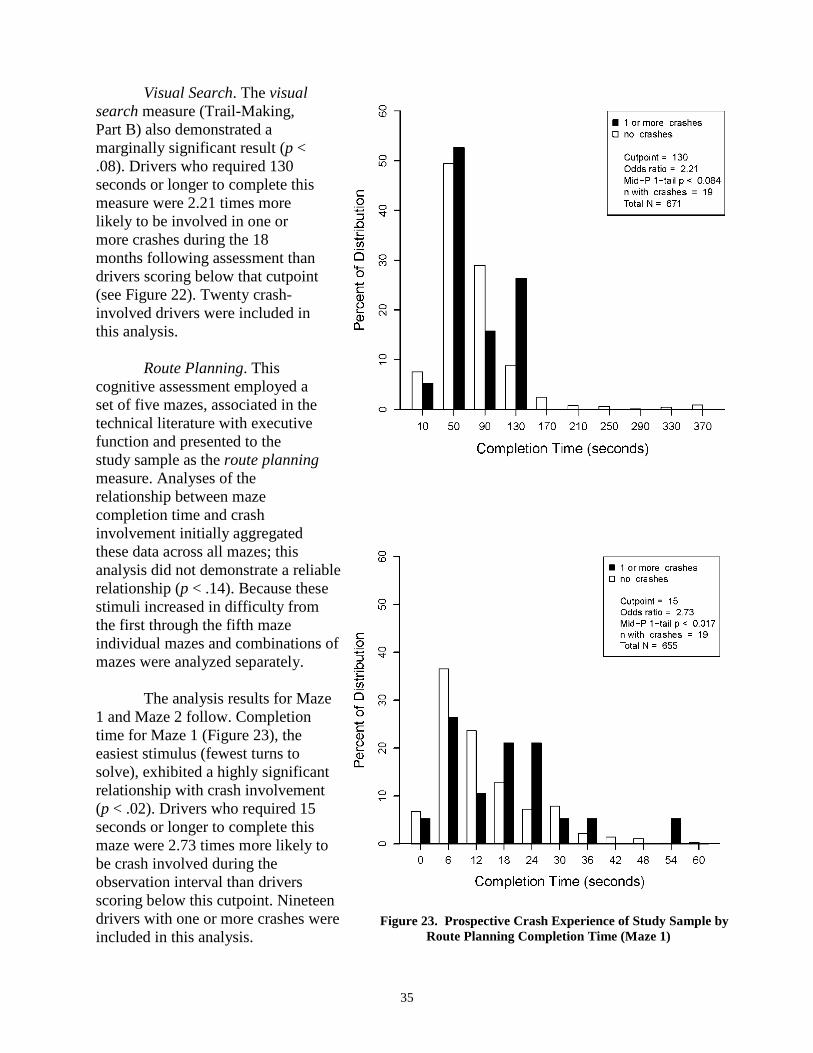
35
Visual Search. The visual search measure (Trail-Making, Part B) also demonstrated a marginally significant result (p < .08). Drivers who required 130 seconds or longer to complete this measure were 2.21 times more likely to be involved in one or more crashes during the 18 months following assessment than drivers scoring below that cutpoint (see Figure 22). Twenty crash-involved drivers were included in this analysis. Route Planning. This cognitive assessment employed a set of five mazes, associated in the technical literature with executive function and presented to the study sample as the route planning measure. Analyses of the relationship between maze completion time and crash
involvement initially aggregated these data across all mazes; this analysis did not demonstrate a reliable
Figure 23. Prospective Crash Experience of Study Sample by Route Planning Completion Time (Maze 1)
Figure 22. Prospective Crash Experience of Study Sample by Visual Search Time (TMB)
relationship (p < .14). Because these stimuli increased in difficulty from the first through the fifth maze individual mazes and combinations of mazes were analyzed separately. The analysis results for Maze 1 and Maze 2 follow. Completion time for Maze 1 (Figure 23), the easiest stimulus (fewest turns to solve), exhibited a highly significant relationship with crash involvement (p < .02). Drivers who required 15 seconds or longer to complete this maze were 2.73 times more likely to be crash involved during the observation interval than drivers scoring below this cutpoint. Nineteen drivers with one or more crashes were included in this analysis.
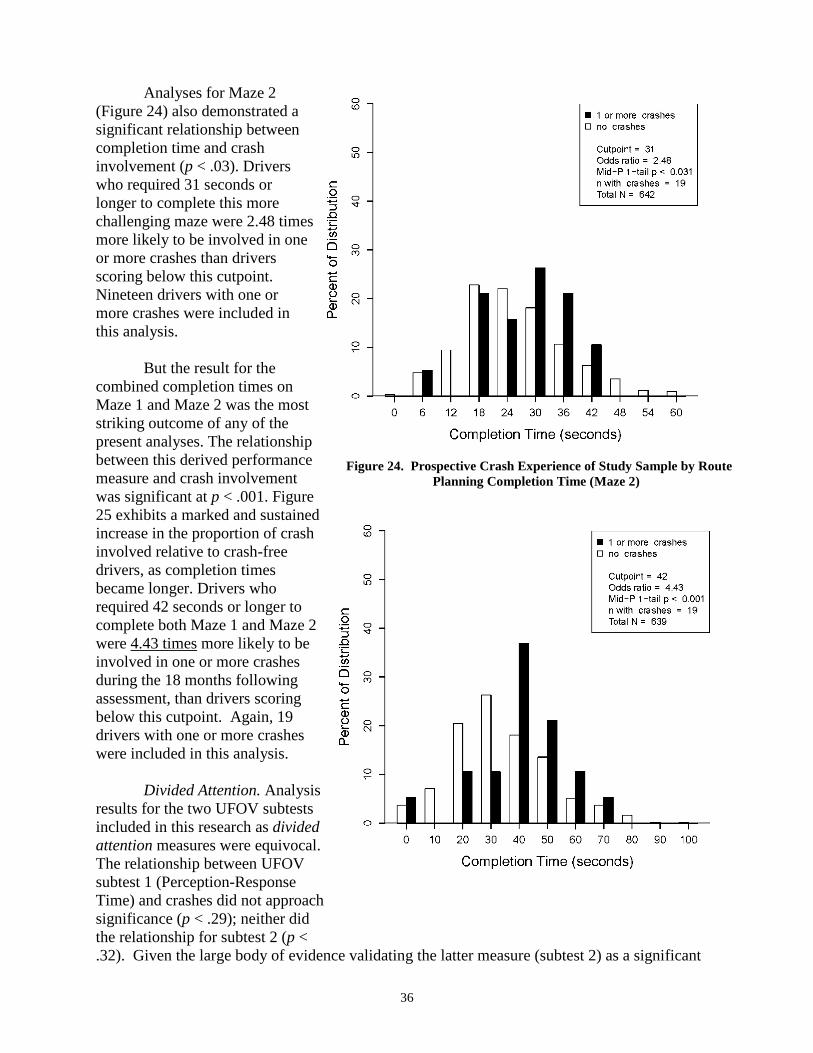
36
Analyses for Maze 2 (Figure 24) also demonstrated a significant relationship between completion time and crash involvement (p < .03). Drivers who required 31 seconds or longer to complete this more challenging maze were 2.48 times
d
is d l.
ch
Figure 24. Prospective Crash Experience of Study Sample by Route Planning Completion Time (Maze 2)
Figure 25. Prospective Crash Experience of Study Sample by Route Planning Completion Time (Maze 1 + Maze 2)
more likely to be involved in one or more crashes than drivers scoring below this cutpoint. Nineteen drivers with one or more crashes were included in this analysis. But the result for the combined completion times on Maze 1 and Maze 2 was the moststriking outcome of any of the present analyses. The relationshipbetween this derived performancemeasure and crash involvement was significant at p < .001. Figure25 exhibits a marked and sustaineincrease in the proportion of crashinvolved relative to crash-free drivers, as completion times became longer. Drivers who required 42 seconds or longer to complete both Maze 1 and Maze 2were 4.43 times more likely to beinvolved in one or more crashes during the 18 months following assessment, than drivers scoring below this cutpoint. Again, 19 drivers with one or more crashes were included in this analysis.
Divided Attention. Analysresults for the two UFOV subtestsincluded in this research as divideattention measures were equivocaThe relationship between UFOV subtest 1 (Perception-Response Time) and crashes did not approasignificance (p < .29); neither did the relationship for subtest 2 (p < .32). Given the large body of evidence validating the latter measure (subtest 2) as a significant
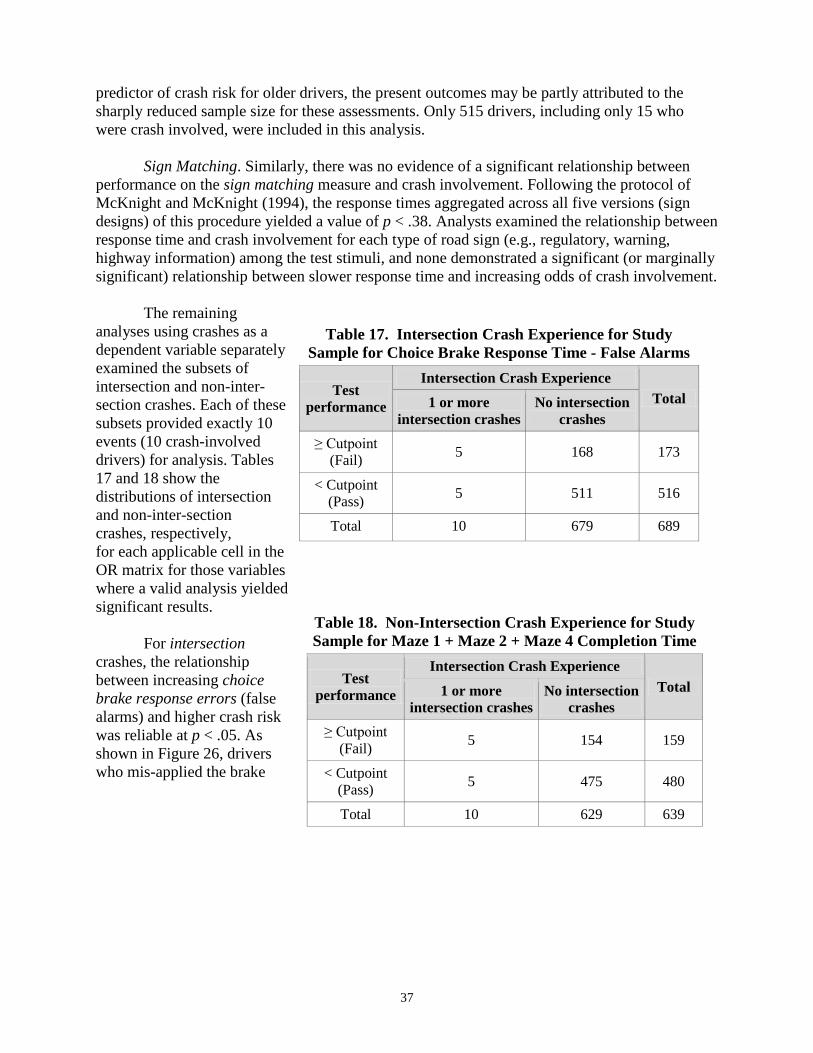
37
predictor of crash risk for older drivers, the present outcomes may be partly attributed to the sharply reduced sample size for these assessments. Only 515 drivers, including only 15 who were crash involved, were included in this analysis. Sign Matching. Similarly, there was no evidence of a significant relationship between performance on the sign matching measure and crash involvement. Following the protocol of McKnight and McKnight (1994), the response times aggregated across all five versions (sign designs) of this procedure yielded a value of p < .38. Analysts examined the relationship between response time and crash involvement for each type of road sign (e.g., regulatory, warning, highway information) among the test stimuli, and none demonstrated a significant (or marginally significant) relationship betwee
The remaining
analyses using crashes as a dependent variable separately
Table 17. Intersection Crash Experience for Study Sample for Choice Brake Response Time - False Alarms
Intersection Crash Experience Test Total 1 or more No intersection performance
intersection crashes crashes ≥ Cutpoint 5 168 173 (Fail)
< Cutpoint 5 511 516 (Pass)
Total 10 679 689
Table 18. Non-Intersection Crash Experience for Study Sample for Maze 1 + Maze 2 + Maze 4 Completion Time
Intersection Crash Experience Test Total 1 or more No intersection performance
intersection crashes crashes ≥ Cutpoint 5 154 159 (Fail)
< Cutpoint 5 475 480 (Pass)
Total 10 629 639
examined the subsets of intersection and non-inter-section crashes. Each of thesesubsets provided exactly 10 events (10 crash-involved drivers) for analysis. Tables 17 and 18 show the distributions of intersection and non-inter-section crashes, respectively, for each applicable cell in theOR matrix for those variableswhere a valid analysis yieldedsignificant results.
For intersection crashes, the relationship between increasing choice brake response errors (false alarms) and higher crash risk was reliable at p < .05. As shown in Figure 26, drivers who mis-applied the brake
n slower response time and increasing odds of crash involvement.
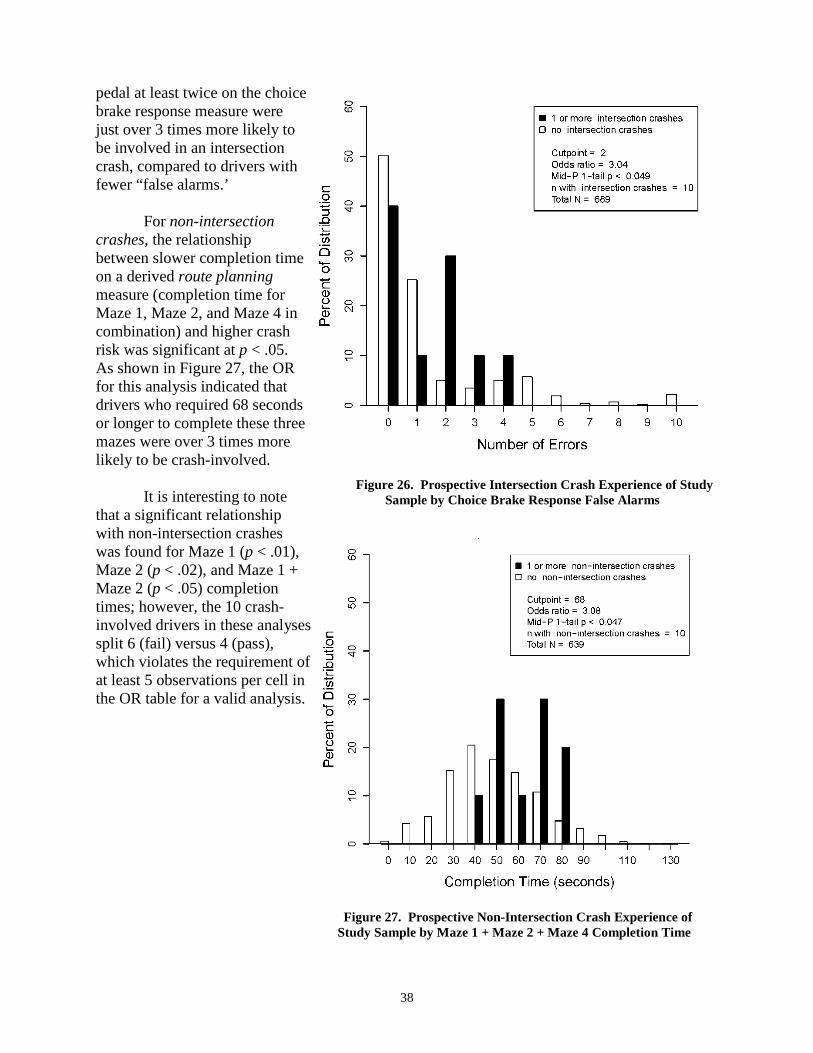
38
pedal at least twice on the choice brake response measure were just over 3 times more likely to be involved in an intersection crash, compared to drivers with fewer “false alarms.’
For non-intersection crashes, the relationship between slower completion time on a derived route planning measure (completion time for Maze 1, Maze 2, and Maze 4 in combination) and higher crash risk was significant at p < .05. As shown in Figure 27, the OR for this analysis indicated that drivers who required 68 seconds or longer to complete these three mazes were over 3 times more likely to be crash-involved.
It is interesting to note that a significant relationship with non-intersection crashes was found for Maze 1 (p < .01), Maze 2 (p < .02), and Maze 1 + Maze 2 (p < .05) completion times; however, the 10 crash-involved drivers in these analysessplit 6 (fail) versus 4 (pass), which violates the requirement ofat least 5 observations per cell in the OR table for a valid analysis.
Figure 26. Prospective Intersection Crash Experience of Study Sample by Choice Brake Response False Alarms
Figure 27. Prospective Non-Intersection Crash Experience of Study Sample by Maze 1 + Maze 2 + Maze 4 Completion Time
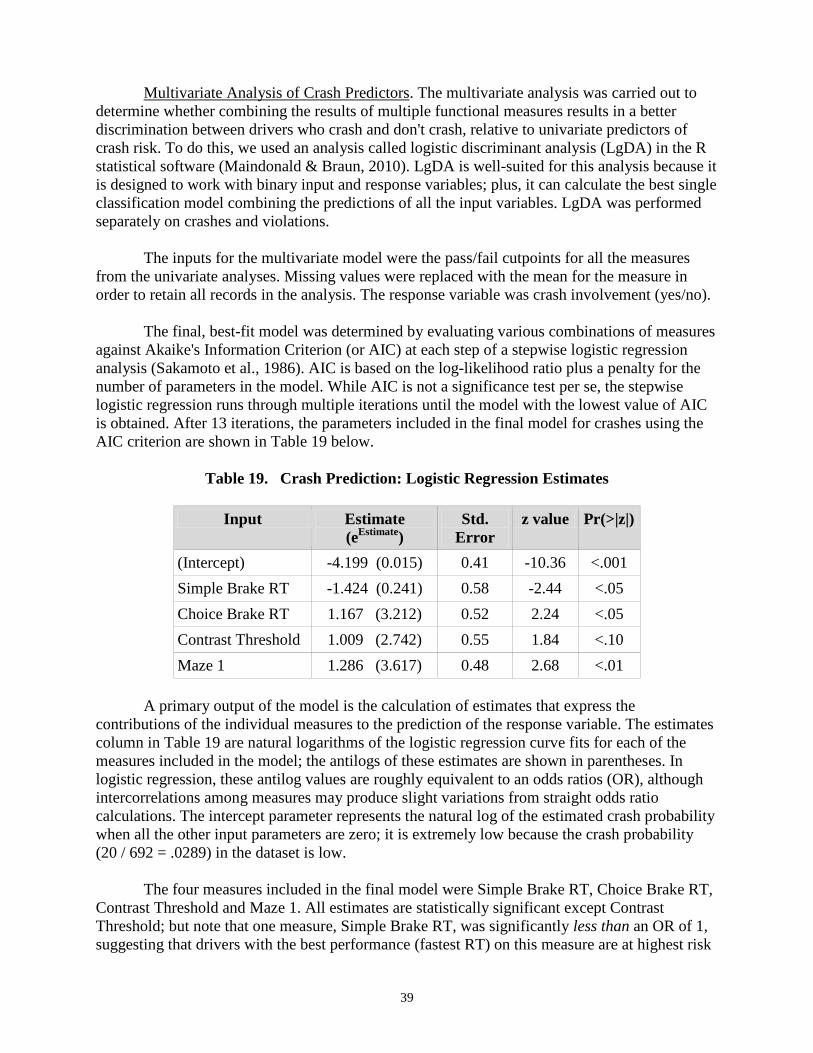
39
Multivariate Analysis of Crash Predictors. The multivariate analysis was carried out to determine whether combining the results of multiple functional measures results in a better discrimination between drivers who crash and don't crash, relative to univariate predictors of crash risk. To do this, we used an analysis called logistic discriminant analysis (LgDA) in the R statistical software (Maindonald & Braun, 2010). LgDA is well-suited for this analysis because it is designed to work with binary input and response variables; plus, it can calculate the best single classification model combining the predictions of all the input variables. LgDA was performed separately on crashes and violations. The inputs for the multivariate model were the pass/fail cutpoints for all the measures from the univariate analyses. Missing values were replaced with the mean for the measure in order to retain all records in the analysis. The response variable was crash involvement (yes/no). The final, best-fit model was determined by evaluating various combinations of measures against Akaike's Information Criterion (or AIC) at each step of a stepwise logistic regression analysis (Sakamoto et al., 1986). AIC is based on the log-likelihood ratio plus a penalty for the number of parameters in the model. While AIC is not a significance test per se, the stepwise logistic regression runs through multiple iterations until the model with the lowest value of AIC is obtained. After 13 iterations, the parameters included in the final model for crashes using the AIC criterion are shown in Table 19 below.
Table 19.
Crash Prediction: Logistic Regression Estimates
Input Estimate (eEstimate)
Std. Error
z value Pr(>|z|)
(Intercept) -4.199 (0.015) 0.41 -10.36 <.001 Simple Brake RT -1.424 (0.241) 0.58 -2.44 <.05 Choice Brake RT 1.167 (3.212) 0.52 2.24 <.05 Contrast Threshold 1.009 (2.742) 0.55 1.84 <.10 Maze 1 1.286 (3.617) 0.48 2.68 <.01
A primary output of the model is the calculation of estimates that express the contributions of the individual measures to the prediction of the response variable. The estimates column in Table 19 are natural logarithms of the logistic regression curve fits for each of the measures included in the model; the antilogs of these estimates are shown in parentheses. In logistic regression, these antilog values are roughly equivalent to an odds ratios (OR), although intercorrelations among measures may produce slight variations from straight odds ratio calculations. The intercept parameter represents the natural log of the estimated crash probability when all the other input parameters are zero; it is extremely low because the crash probability (20 / 692 = .0289) in the dataset is low. The four measures included in the final model were Simple Brake RT, Choice Brake RT, Contrast Threshold and Maze 1. All estimates are statistically significant except Contrast Threshold; but note that one measure, Simple Brake RT, was significantly less than an OR of 1, suggesting that drivers with the best performance (fastest RT) on this measure are at highest risk
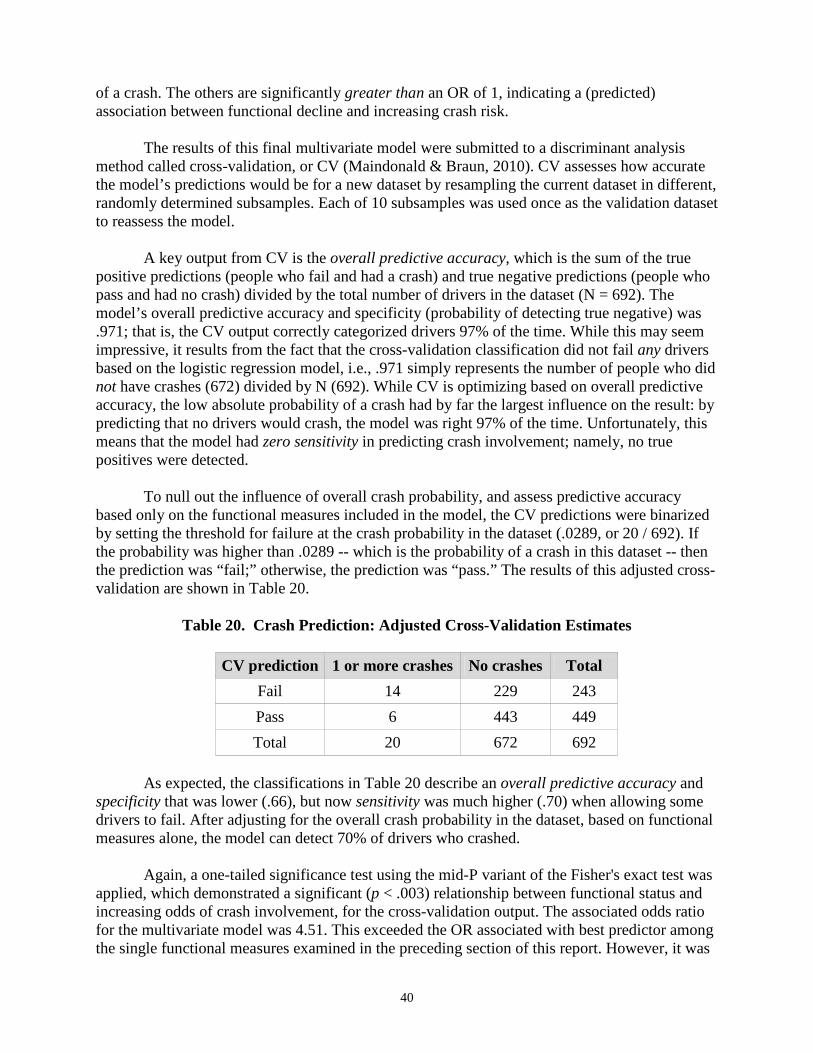
40
of a crash. The others are significantly greater than an OR of 1, indicating a (predicted) association between functional decline and increasing crash risk. The results of this final multivariate model were submitted to a discriminant analysis method called cross-validation, or CV (Maindonald & Braun, 2010). CV assesses how accurate the model’s predictions would be for a new dataset by resampling the current dataset in different, randomly determined subsamples. Each of 10 subsamples was used once as the validation dataset to reassess the model. A key output from CV is the overall predictive accuracy, which is the sum of the true positive predictions (people who fail and had a crash) and true negative predictions (people who pass and had no crash) divided by the total number of drivers in the dataset (N = 692). The model’s overall predictive accuracy and specificity (probability of detecting true negative) was .971; that is, the CV output correctly categorized drivers 97% of the time. While this may seem impressive, it results from the fact that the cross-validation classification did not fail any drivers based on the logistic regression model, i.e., .971 simply represents the number of people who did not have crashes (672) divided by N (692). While CV is optimizing based on overall predictive accuracy, the low absolute probability of a crash had by far the largest influence on the result: by predicting that no drivers would crash, the model was right 97% of the time. Unfortunately, this means that the model had zero sensitivity in predicting crash involvement; namely, no true positives were detected. To null out the influence of overall crash probability, and assess predictive accuracy based only on the functional measures included in the model, the CV predictions were binarized by setting the threshold for failure at the crash probability in the dataset (.0289, or 20 / 692). If the probability was higher than .0289 -- which is the probability of a crash in this dataset -- then the prediction was “fail;” otherwise, the prediction was “pass.” The results of this adjusted cross-validation are shown in Table 20.
Table 20. Crash Prediction: Adjusted Cross-Validation Estimates
CV prediction 1 or more crashes No crashes Total Fail 14 229 243 Pass 6 443 449 Total 20 672 692
As expected, the classifications in Table 20 describe an overall predictive accuracy and specificity that was lower (.66), but now sensitivity was much higher (.70) when allowing some drivers to fail. After adjusting for the overall crash probability in the dataset, based on functional measures alone, the model can detect 70% of drivers who crashed. Again, a one-tailed significance test using the mid-P variant of the Fisher's exact test was applied, which demonstrated a significant (p < .003) relationship between functional status and increasing odds of crash involvement, for the cross-validation output. The associated odds ratio for the multivariate model was 4.51. This exceeded the OR associated with best predictor among the single functional measures examined in the preceding section of this report. However, it was
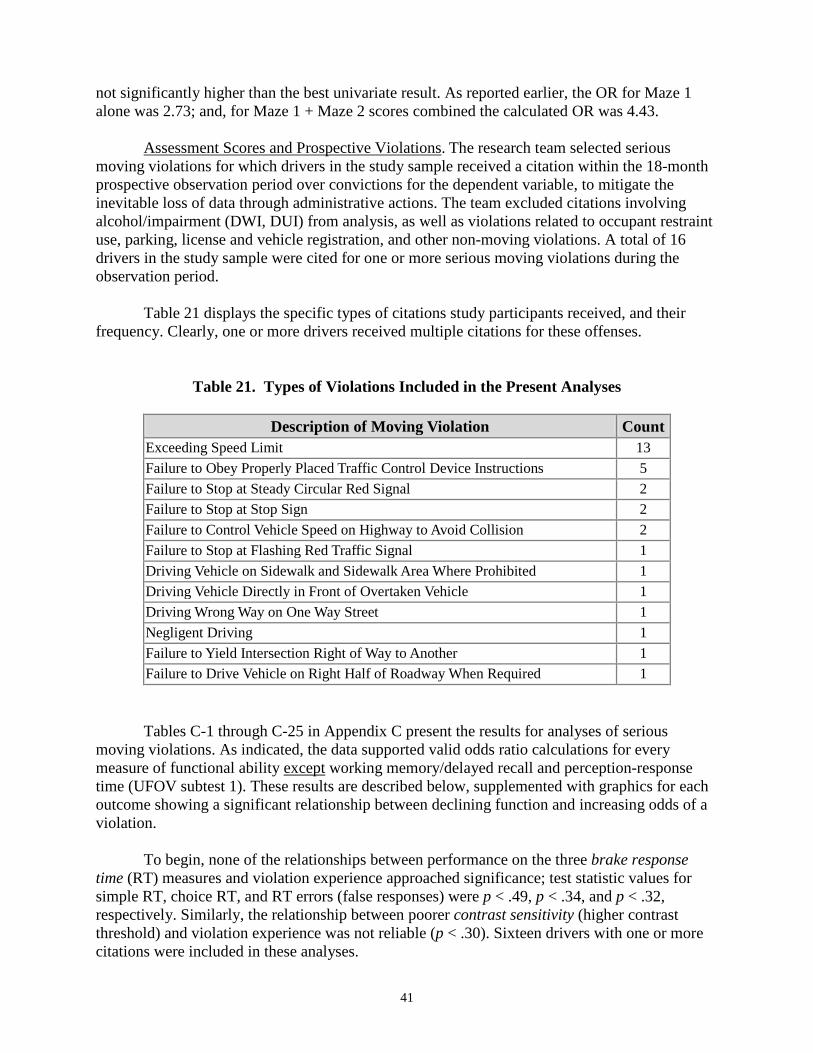
41
not significantly higher than the best univariate result. As reported earlier, the OR for Maze 1 alone was 2.73; and, for Maze 1 + Maze 2 scores combined the calculated OR was 4.43. Assessment Scores and Prospective Violations. The research team selected serious moving violations for which drivers in the study sample received a citation within the 18-month prospective observation period over convictions for the dependent variable, to mitigate the inevitable loss of data through administrative actions. The team excluded citations involving alcohol/impairment (DWI, DUI) from analysis, as well as violations related to occupant restraint use, parking, license and vehicle registration, and other non-moving violations. A total of 16 drivers in the study sample were cited for one or more serious moving violations during the observation period. Table 21 displays the specific types of citations study participants received, and their frequency. Clearly, one or more drivers received multiple citations for these offenses.
Table 21. Types of Violations Included in the Present Analyses
Description of Moving Violation Count
Exceeding Speed Limit 13 Failure to Obey Properly Placed Traffic Control Device Instructions 5 Failure to Stop at Steady Circular Red Signal 2 Failure to Stop at Stop Sign 2 Failure to Control Vehicle Speed on Highway to Avoid Collision 2 Failure to Stop at Flashing Red Traffic Signal 1 Driving Vehicle on Sidewalk and Sidewalk Area Where Prohibited 1 Driving Vehicle Directly in Front of Overtaken Vehicle 1 Driving Wrong Way on One Way Street 1 Negligent Driving 1 Failure to Yield Intersection Right of Way to Another 1 Failure to Drive Vehicle on Right Half of Roadway When Required 1
Tables C-1 through C-25 in Appendix C present the results for analyses of serious moving violations. As indicated, the data supported valid odds ratio calculations for every measure of functional ability except working memory/delayed recall and perception-response time (UFOV subtest 1). These results are described below, supplemented with graphics for each outcome showing a significant relationship between declining function and increasing odds of a violation. To begin, none of the relationships between performance on the three brake response time (RT) measures and violation experience approached significance; test statistic values for simple RT, choice RT, and RT errors (false responses) were p < .49, p < .34, and p < .32, respectively. Similarly, the relationship between poorer contrast sensitivity (higher contrast threshold) and violation experience was not reliable (p < .30). Sixteen drivers with one or more citations were included in these analyses.

42
Among the measures of cognitive ability, only performance
,
,
Figure 28. Prospective Serious Violation Experience of Study
Sample by Visual Search Time (TMB)
Figure 29. Prospective Serious Violation Experience of Study Sample by Route Planning Completion Time (Maze 1)
on the visual search (Trail-MakingPart B) and route planning (maze completion) demonstrated significant relationships with serious moving violations. The data supported valid analyses, but did not yield significant findings, for sign completion (p < .23 for MVPT-VC and p < .14 for traffic sign stimuli); sign matching (p < .35 for combined stimulus sets and.12 < p < .44 for individual sign designs); and divided attention (p <.14 for UFOV subtest 2). Missing data was again a factor for the latter measure, as only 518 driverswith 15 citations in the aggregate (versus 16 for all other measures), were included in this analysis. Visual Search. Drivers whoneeded 130 seconds or longer to complete Trail-Making, Part B were 2.82 times more likely to be cited (one or more times) for a serious moving violation during the 18 months following assessment than drivers with completion times below this cutpoint (Figure 28). This finding converges with the crash analysis, where the same cutpoint emerged in the OR calculation. This relationship was significant at p < .04. Route Planning. As shown in Figure 29, drivers who required 12 seconds or longer to complete Maze 1 (the simplest maze) were 2.86 times more likely to be cited for a serious moving violation, compared to drivers with completion times below this cutpoint. This measure
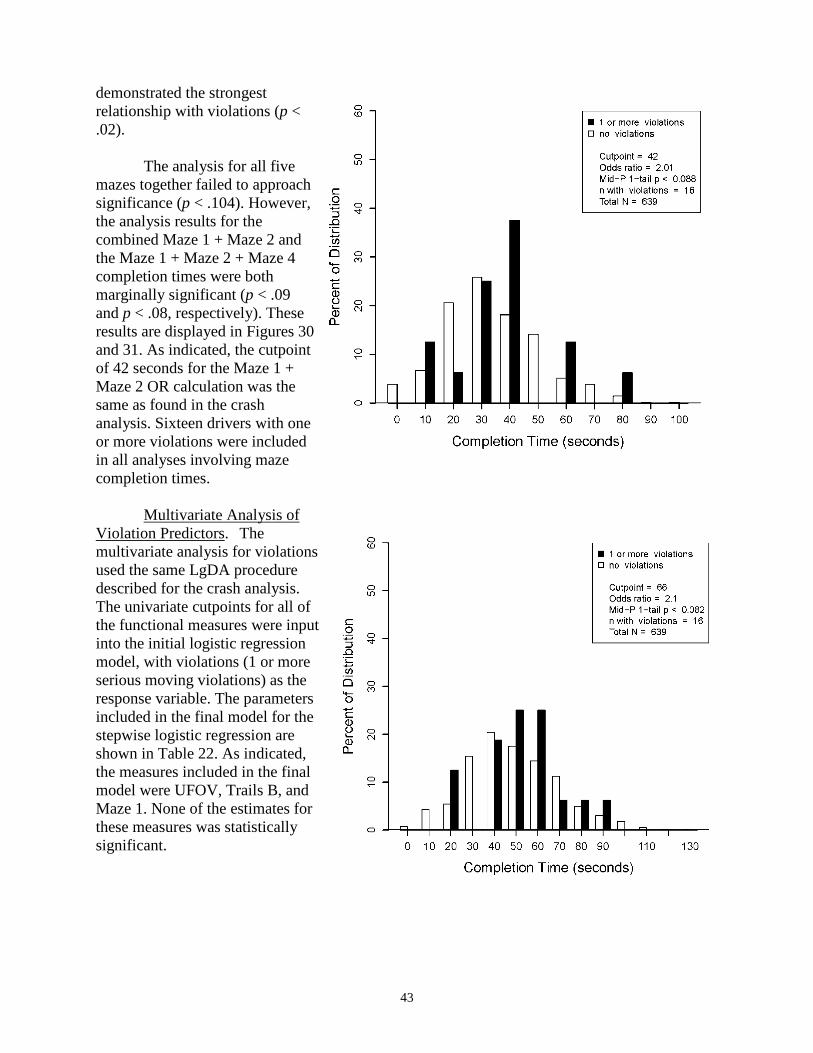
43
demonstrated the strongest relationship with violations (p < .02). The analysis for all five mazes together failed to approach significance (p < .104). However, the analysis results for the combined Maze 1 + Maze 2 and the Maze 1 + Maze 2 + Maze 4 completion times were both marginally significant (p < .09 and p < .08, respectively). These results are displayed in Figures 30 and 31. As indicated, the cutpoint of 42 seconds for the Maze 1 + Maze 2 OR calculation was the same as found in the crash analysis. Sixteen drivers with one or more violations were included in all analyses involving maze completion times. Multivariate Analysis of Violation Predictors. The multivariate analysis for violations used the same LgDA procedure described for the crash analysis. The univariate cutpoints for all of the functional measures were input into the initial logistic regression model, with violations (1 or more serious moving violations) as the response variable. The parameters included in the final model for the stepwise logistic regression are shown in Table 22. As indicated, the measures included in the final model were UFOV, Trails B, and Maze 1. None of the estimates for these measures was statistically significant.
Figure 31. Prospective Serious Violation Experience of Study Sample by Route Planning Completion Time
(Maze 1 + Maze 2 + Maze 4)
Figure 30. Prospective Serious Violation Experience of Study Sample by Route Planning Completion Time (Maze 1+ Maze 2).
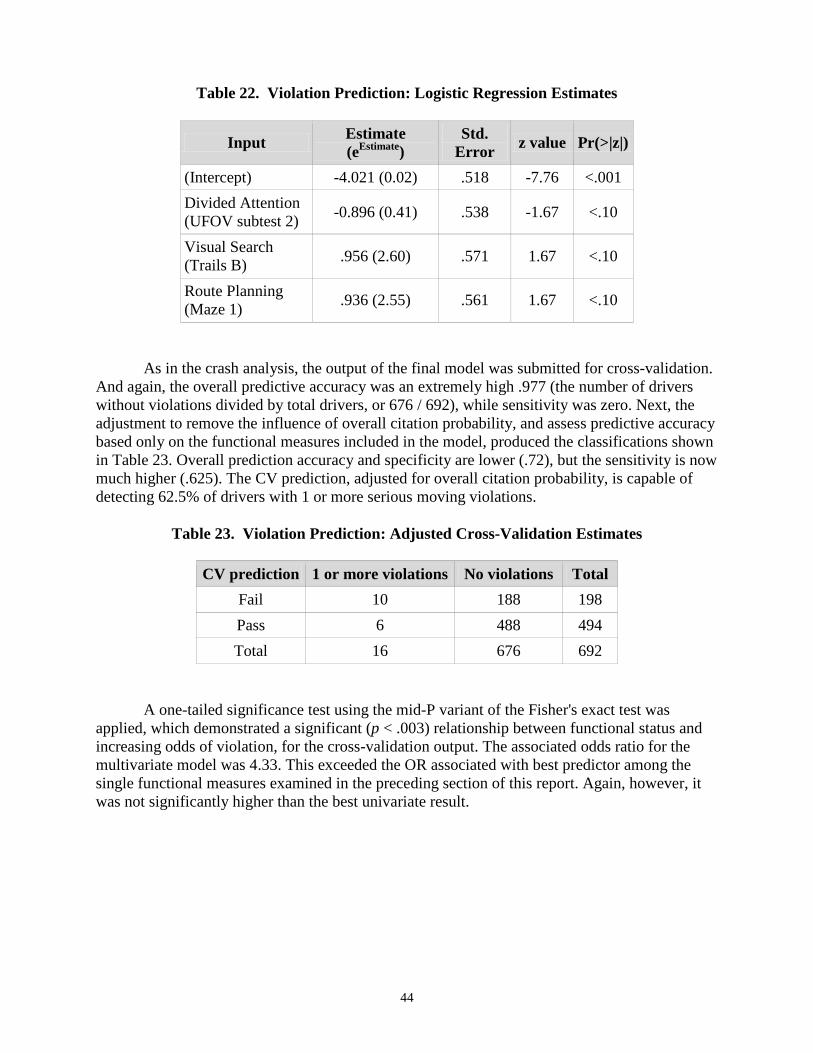
44
Table 22. Violation
Input
(Intercept) Divided Attention (UFOV subtest 2) Visual Search (Trails B) Route Planning (Maze 1)
Prediction: Logistic Regression Estimates
Estimate Std. z value Pr(>|z|) (eEstimate) Error -4.021 (0.02) .518 -7.76 <.001
-0.896 (0.41) .538 -1.67 <.10
.956 (2.60) .571 1.67 <.10
.936 (2.55) .561 1.67 <.10
As in the crash analysis, the output of the final model was submitted for cross-validation. And again, the overall predictive accuracy was an extremely high .977 (the number of drivers without violations divided by total drivers, or 676 / 692), while sensitivity was zero. Next, the adjustment to remove the influence of overall citation probability, and assess predictive accuracy based only on the functional measures included in the model, produced the classifications shown in Table 23. Overall prediction accuracy and specificity are lower (.72), but the sensitivity is now much higher (.625). The CV prediction, adjusted for overall citation probability, is capable of detecting 62.5% of drivers with 1 or more serious moving violations.
Table 23. Violation Prediction: Adjusted Cross-Validation Estimates
CV prediction 1 or more violations No violations Total Fail 10 188 198 Pass 6 488 494 Total 16 676 692
A one-tailed significance test using the mid-P variant of the Fisher's exact test was applied, which demonstrated a significant (p < .003) relationship between functional status and increasing odds of violation, for the cross-validation output. The associated odds ratio for the multivariate model was 4.33. This exceeded the OR associated with best predictor among the single functional measures examined in the preceding section of this report. Again, however, it was not significantly higher than the best univariate result.
45
STUDY 2: ALTERNATIVE DRIVING EXPOSURE METHODOLOGIES
This study examined the level of agreement between different sources of driver exposure information including self-reports regarding comfort or avoidance of specific driving situations, trip log summaries, and trip log data from an on-board diagnostic module in the driver's vehicle. The following sections provide detail about the research sample, the driving exposure measures, data collection procedures, and the concordance between the objective and subjective measures.
RESEARCH SAMPLE
At the Loch Raven/Parkville MVA site, RAs advised drivers who completed functional assessments of the opportunity to participate in a follow-on study, that included a $100 cash compensation. The size of this sample was restricted to 10 drivers for practical and budgetary reasons. Inclusion criteria for this sample included the requirement that participants regularly drive three or more days per week. The sample included 5 males ranging in age from 71 to 75 (mean = 71.8) and 5 females ranging in age from 71 to 81 (mean = 74.8). DRIVING EXPOSURE MEASURES
The 10 drivers in Study 2 participated in multiple data collection activities for approximately one month. They maintained trip logs of their driving experience during this time, and allowed the installation of a data logger that plugged in to the OBD (on-board diagnostic) port in their own cars. They also completed the Driving Preferences Instrument (DPI). These three exposure measures are described below. Driving Preferences Instrument
The DPI was developed to obtain self reports in this research about how much and under what conditions older people drive, with a particular interest in learning about their exposure to conditions that are known to be most risky for this group. RAs used the DPI to collect information from the sample about how many days per week and trips per day they drove, and their average trip length. The DPI included items regarding older people’s level of comfort driving in a variety of situations, and how often they avoid those same situations, using a rating scale containing the responses, “always,” “often,” “sometimes,” “rarely,” and “never.” Appendix D presents a paper version of this instrument. Driver Trip Logs The 10 drivers who participated in Study 2 maintained a trip log for a period of 1 month. The trip log, shown in Appendix E, asked subjects to report, for each trip taken, information about various trip attributes that overlapped in part (though not item-for-item) with their responses on the DPI. In addition, subjects reported any collisions (minor) or near misses on every drive; and, whether they felt unsafe or uncomfortable during any part of this trip, either as the result of their actions or the actions of others. An RA provided each participant with a trip log, a binder with 5.5- by 8.5-in sheets – one for each trip taken during their month of participation in this phase of the study. RAs instructed subjects to remove their completed trip log pages from the binder at the end of each week, and mail them to TransAnalytics for data entry, using a postage-prepaid envelope provided with the binder.
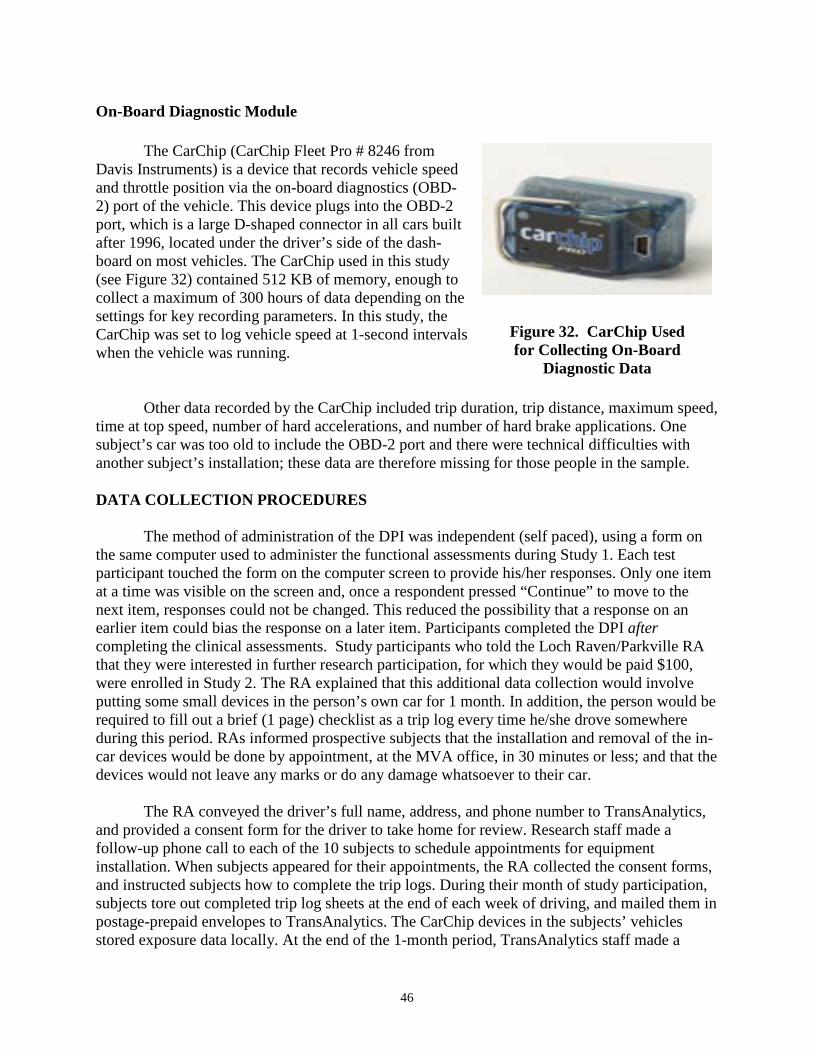
46
On-Board Diagnostic Module
The CarChip (CarChip Fleet Pro # 8246 from Davis Instruments) is a device that records vehicle speed and throttle position via the on-board diagnostics (OBD-2) port of the vehicle. This device plugs into the OBD-2 port, which is a large D-shaped connector in all cars built after 1996, located under the driver’s side of the dash-board on most vehicles. The CarChip used in this study (see Figure 32) contained 512 KB of memory, enough to collect a maximum of 300 hours of data depending on the
Figure 32. CarChip Used for Collecting On-Board
Diagnostic Data
settings for key recording parameters. In this study, the CarChip was set to log vehicle speed at 1-second intervalswhen the vehicle was running.
Other data recorded by the CarChip included trip duration, trip distance, maximum speed, time at top speed, number of hard accelerations, and number of hard brake applications. One subject’s car was too old to include the OBD-2 port and there were technical difficulties with another subject’s installation; these data are therefore missing for those people in the sample. DATA COLLECTION PROCEDURES The method of administration of the DPI was independent (self paced), using a form on the same computer used to administer the functional assessments during Study 1. Each test participant touched the form on the computer screen to provide his/her responses. Only one item at a time was visible on the screen and, once a respondent pressed “Continue” to move to the next item, responses could not be changed. This reduced the possibility that a response on an earlier item could bias the response on a later item. Participants completed the DPI after completing the clinical assessments. Study participants who told the Loch Raven/Parkville RA that they were interested in further research participation, for which they would be paid $100, were enrolled in Study 2. The RA explained that this additional data collection would involve putting some small devices in the person’s own car for 1 month. In addition, the person would be required to fill out a brief (1 page) checklist as a trip log every time he/she drove somewhere during this period. RAs informed prospective subjects that the installation and removal of the in-car devices would be done by appointment, at the MVA office, in 30 minutes or less; and that the devices would not leave any marks or do any damage whatsoever to their car.
The RA conveyed the driver’s full name, address, and phone number to TransAnalytics, and provided a consent form for the driver to take home for review. Research staff made a follow-up phone call to each of the 10 subjects to schedule appointments for equipment installation. When subjects appeared for their appointments, the RA collected the consent forms, and instructed subjects how to complete the trip logs. During their month of study participation, subjects tore out completed trip log sheets at the end of each week of driving, and mailed them in postage-prepaid envelopes to TransAnalytics. The CarChip devices in the subjects’ vehicles stored exposure data locally. At the end of the 1-month period, TransAnalytics staff made a
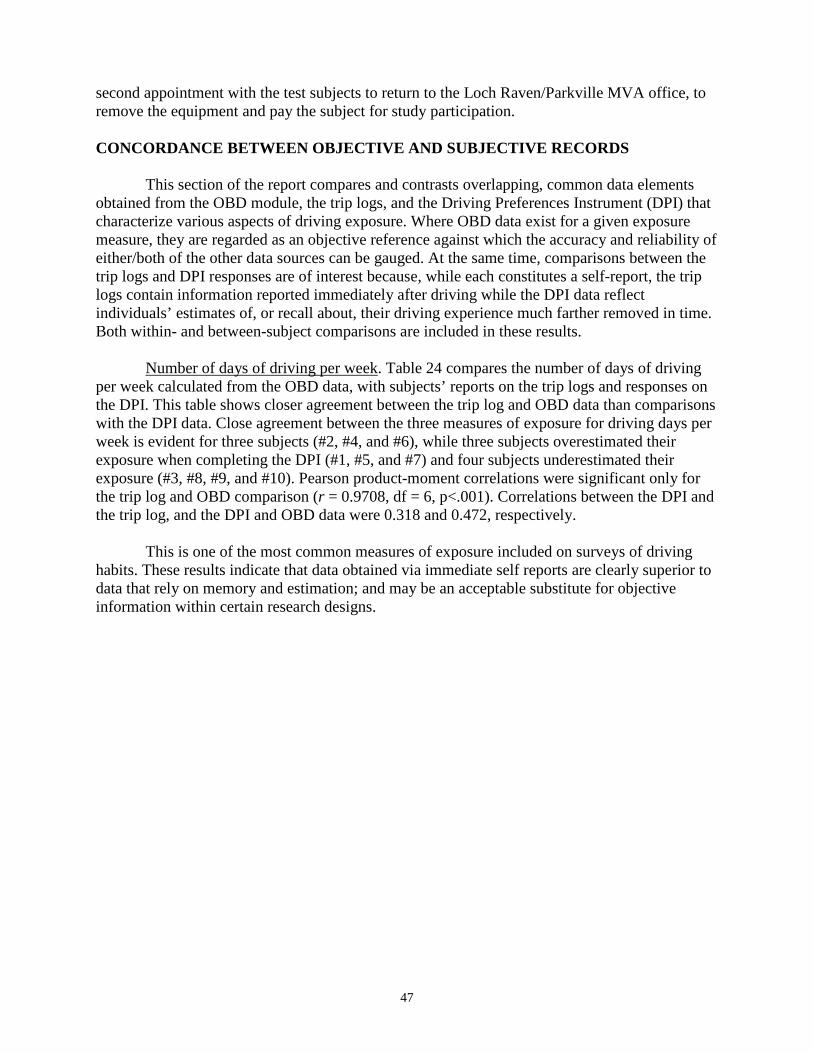
47
second appointment with the test subjects to return to the Loch Raven/Parkville MVA office, to remove the equipment and pay the subject for study participation. CONCORDANCE BETWEEN OBJECTIVE AND SUBJECTIVE RECORDS This section of the report compares and contrasts overlapping, common data elements obtained from the OBD module, the trip logs, and the Driving Preferences Instrument (DPI) that characterize various aspects of driving exposure. Where OBD data exist for a given exposure measure, they are regarded as an objective reference against which the accuracy and reliability of either/both of the other data sources can be gauged. At the same time, comparisons between the trip logs and DPI responses are of interest because, while each constitutes a self-report, the trip logs contain information reported immediately after driving while the DPI data reflect individuals’ estimates of, or recall about, their driving experience much farther removed in time. Both within- and between-subject comparisons are included in these results. Number of days of driving per week. Table 24 compares the number of days of driving per week calculated from the OBD data, with subjects’ reports on the trip logs and responses on the DPI. This table shows closer agreement between the trip log and OBD data than comparisons with the DPI data. Close agreement between the three measures of exposure for driving days per week is evident for three subjects (#2, #4, and #6), while three subjects overestimated their exposure when completing the DPI (#1, #5, and #7) and four subjects underestimated their exposure (#3, #8, #9, and #10). Pearson product-moment correlations were significant only for the trip log and OBD comparison (r = 0.9708, df = 6, p<.001). Correlations between the DPI and the trip log, and the DPI and OBD data were 0.318 and 0.472, respectively. This is one of the most common measures of exposure included on surveys of driving habits. These results indicate that data obtained via immediate self reports are clearly superior to data that rely on memory and estimation; and may be an acceptable substitute for objective information within certain research designs.
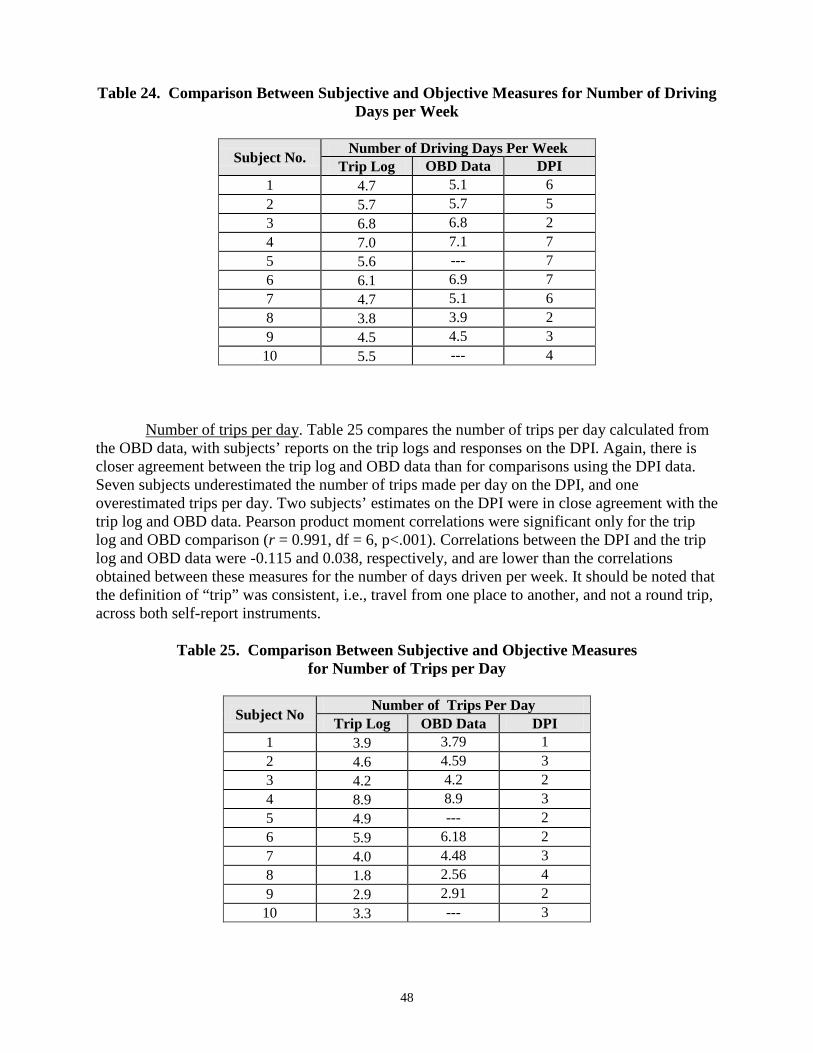
48
Table 24. Comparison Between Subjective and Objective Measures for Number of Driving Days per Week
Subject No. Number of Driving Days Per Week Trip Log OBD Data DPI
1 4.7 5.1 6 2 5.7 5.7 5 3 6.8 6.8 2 4 7.0 7.1 7 5 5.6 --- 7 6 6.1 6.9 7 7 4.7 5.1 6 8 3.8 3.9 2 9 4.5 4.5 3
10 5.5 --- 4
Number of trips per day. Table 25 compares the number of trips per day calculated from the OBD data, with subjects’ reports on the trip logs and responses on the DPI. Again, there is closer agreement between the trip log and OBD data than for comparisons using the DPI data. Seven subjects underestimated the number of trips made per day on the DPI, and one overestimated trips per day. Two subjects’ estimates on the DPI were in close agreement with the trip log and OBD data. Pearson product moment correlations were significant only for the trip log and OBD comparison (r = 0.991, df = 6, p<.001). Correlations between the DPI and the trip log and OBD data were -0.115 and 0.038, respectively, and are lower than the correlations obtained between these measures for the number of days driven per week. It should be noted that the definition of “trip” was consistent, i.e., travel from one place to another, and not a round trip, across both self-report instruments.
Table 25. Comparison Between Subjective and Objective Measures for Number of Trips per Day
Subject No Number of Trips Per Day Trip Log OBD Data DPI
1 3.9 3.79 1 2 4.6 4.59 3 3 4.2 4.2 2 4 8.9 8.9 3 5 4.9 --- 2 6 5.9 6.18 2 7 4.0 4.48 3 8 1.8 2.56 4 9 2.9 2.91 2 10 3.3 --- 3
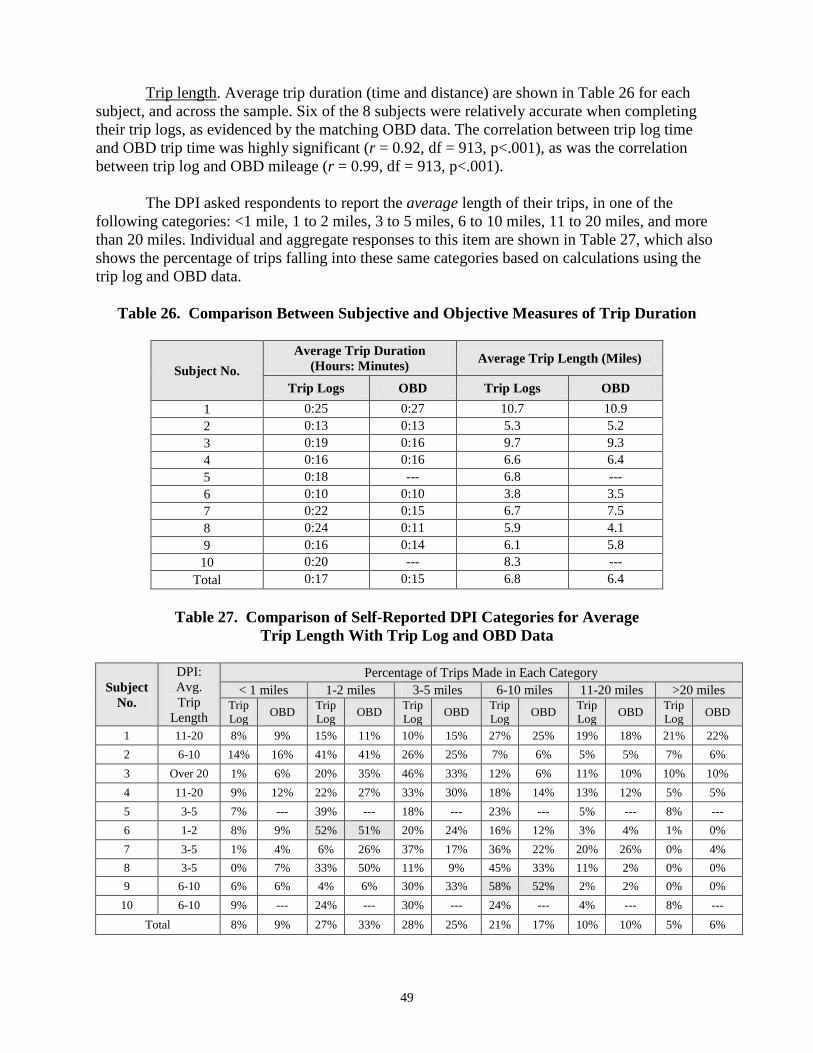
49
Trip length. Average trip duration (time and distance) are shown in Table 26 for each subject, and across the sample. Six of the 8 subjects were relatively accurate when completing their trip logs, as evidenced by the matching OBD data. The correlation between trip log time and OBD trip time was highly significant (r = 0.92, df = 913, p<.001), as was the correlation between trip log and OBD mileage (r = 0.99, df = 913, p<.001). The DPI asked respondents to report the average length of their trips, in one of the following categories: <1 mile, 1 to 2 miles, 3 to 5 miles, 6 to 10 miles, 11 to 20 miles, and more than 20 miles. Individual and aggregate responses to this item are shown in Table 27, which also shows the percentage of trips falling into these same categories based on calculations using the trip log and OBD data.
Table 26. Comparison Between Subjective and Objective Measures of Trip Duration
Average Trip Duration Average Trip Length (Miles) (Hours: Minutes) Subject No.
Trip Logs OBD Trip Logs OBD 1 0:25 0:27 10.7 10.9 2 0:13 0:13 5.3 5.2 3 0:19 0:16 9.7 9.3 4 0:16 0:16 6.6 6.4 5 0:18 --- 6.8 --- 6 0:10 0:10 3.8 3.5 7 0:22 0:15 6.7 7.5 8 0:24 0:11 5.9 4.1 9 0:16 0:14 6.1 5.8 10 0:20 --- 8.3 ---
Total 0:17 0:15 6.8 6.4
Table 27. Comparison of Self-Reported DPI Categories for Average
Trip Length With Trip Log and OBD Data
Subject No.
DPI: Avg. Trip
Length
Percentage of Trips Made in Each Category < 1 miles 1-2 miles 3-5 miles 6-10 miles 11-20 miles >20 miles
Trip Log OBD Trip
Log OBD TripLog OBD Trip
Log OBD TripLog OBD Trip
Log OBD
1 11-20 8% 9% 15% 11% 10% 15% 27% 25% 19% 18% 21% 22% 2 6-10 14% 16% 41% 41% 26% 25% 7% 6% 5% 5% 7% 6% 3 Over 20 1% 6% 20% 35% 46% 33% 12% 6% 11% 10% 10% 10% 4 11-20 9% 12% 22% 27% 33% 30% 18% 14% 13% 12% 5% 5% 5 3-5 7% --- 39% --- 18% --- 23% --- 5% --- 8% --- 6 1-2 8% 9% 52% 51% 20% 24% 16% 12% 3% 4% 1% 0% 7 3-5 1% 4% 6% 26% 37% 17% 36% 22% 20% 26% 0% 4% 8 3-5 0% 7% 33% 50% 11% 9% 45% 33% 11% 2% 0% 0% 9 6-10 6% 6% 4% 6% 30% 33% 58% 52% 2% 2% 0% 0%
10 6-10 9% --- 24% --- 30% --- 24% --- 4% --- 8% --- Total 8% 9% 27% 33% 28% 25% 21% 17% 10% 10% 5% 6%
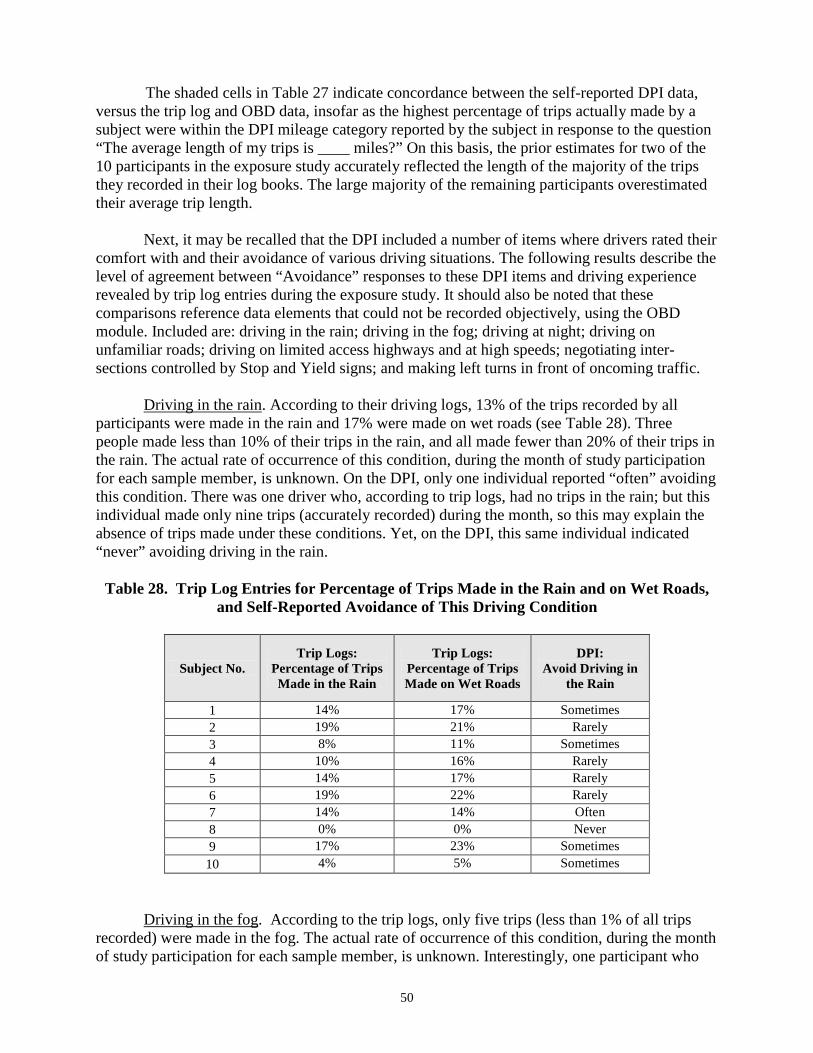
50
The shaded cells in Table 27 indicate concordance between the self-reported DPI data, versus the trip log and OBD data, insofar as the highest percentage of trips actually made by a subject were within the DPI mileage category reported by the subject in response to the question “The average length of my trips is ____ miles?” On this basis, the prior estimates for two of the 10 participants in the exposure study accurately reflected the length of the majority of the trips they recorded in their log books. The large majority of the remaining participants overestimated their average trip length.
Next, it may be recalled that the DPI included a number of items where drivers rated their comfort with and their avoidance of various driving situations. The following results describe the level of agreement between “Avoidance” responses to these DPI items and driving experience revealed by trip log entries during the exposure study. It should also be noted that these comparisons reference data elements that could not be recorded objectively, using the OBD module. Included are: driving in the rain; driving in the fog; driving at night; driving on unfamiliar roads; driving on limited access highways and at high speeds; negotiating inter-sections controlled by Stop and Yield signs; and making left turns in front of oncoming traffic.
Driving in the rain. According to their driving logs, 13% of the trips recorded by all
participants were made in the rain and 17% were made on wet roads (see Table 28). Three people made less than 10% of their trips in the rain, and all made fewer than 20% of their trips in the rain. The actual rate of occurrence of this condition, during the month of study participation for each sample member, is unknown. On the DPI, only one individual reported “often” avoiding this condition. There was one driver who, according to trip logs, had no trips in the rain; but this individual made only nine trips (accurately recorded) during the month, so this may explain the absence of trips made under these conditions. Yet, on the DPI, this same individual indicated “never” avoiding driving in the rain.
Table 28. Trip Log Entries for Percentage of Trips Made in the Rain and on Wet Roads,
and Self-Reported Avoidance of This Driving Condition
Trip Logs: Trip Logs: DPI: Subject No. Percentage of Trips Percentage of Trips Avoid Driving in
Made in the Rain Made on Wet Roads the Rain
1 14% 17% Sometimes 2 19% 21% Rarely 3 8% 11% Sometimes 4 10% 16% Rarely 5 14% 17% Rarely 6 19% 22% Rarely 7 14% 14% Often 8 0% 0% Never 9 17% 23% Sometimes
10 4% 5% Sometimes
Driving in the fog. According to the trip logs, only five trips (less than 1% of all trips
recorded) were made in the fog. The actual rate of occurrence of this condition, during the month of study participation for each sample member, is unknown. Interestingly, one participant who
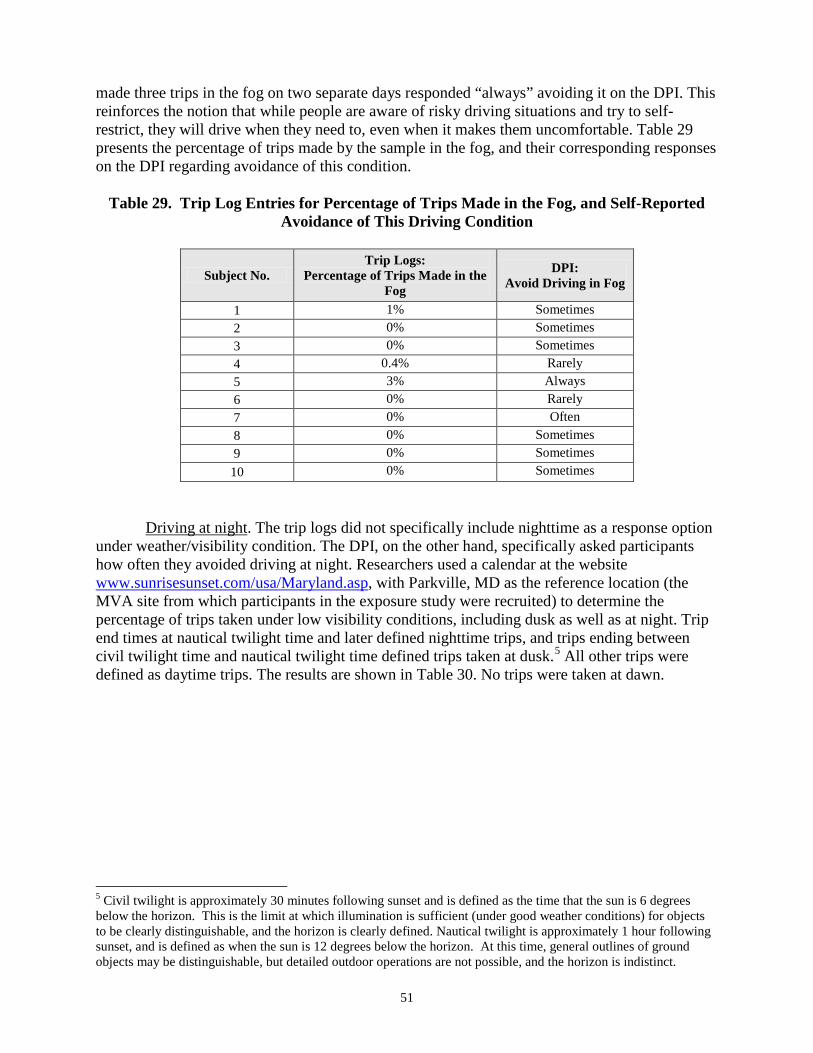
51
made three trips in the fog on two separate days responded “always” avoiding it on the DPI. This reinforces the notion that while people are aware of risky driving situations and try to self-restrict, they will drive when they need to, even when it makes them uncomfortable. Table 29 presents the percentage of trips made by the sample in the fog, and their corresponding responses on the DPI regarding avoidance of this condition.
Table 29. Trip Log Entries for Percentage of Trips Made in the Fog, and Self-Reported
Avoidance of This Driving Condition
Trip Logs: DPI: Subject No. Percentage of Trips Made in the Avoid Driving in Fog Fog 1 1% Sometimes 2 0% Sometimes 3 0% Sometimes 4 0.4% Rarely 5 3% Always 6 0% Rarely 7 0% Often 8 0% Sometimes 9 0% Sometimes 10 0% Sometimes
Driving at night. The trip logs did not specifically include nighttime as a response option under weather/visibility condition. The DPI, on the other hand, specifically asked participants how often they avoided driving at night. Researchers used a calendar at the website www.sunrisesunset.com/usa/Maryland.asp, with Parkville, MD as the reference location (the MVA site from which participants in the exposure study were recruited) to determine the percentage of trips taken under low visibility conditions, including dusk as well as at night. Trip end times at nautical twilight time and later defined nighttime trips, and trips ending between civil twilight time and nautical twilight time defined trips taken at dusk.5 All other trips were defined as daytime trips. The results are shown in Table 30. No trips were taken at dawn.
5 Civil twilight is approximately 30 minutes following sunset and is defined as the time that the sun is 6 degrees below the horizon. This is the limit at which illumination is sufficient (under good weather conditions) for objects to be clearly distinguishable, and the horizon is clearly defined. Nautical twilight is approximately 1 hour following sunset, and is defined as when the sun is 12 degrees below the horizon. At this time, general outlines of ground objects may be distinguishable, but detailed outdoor operations are not possible, and the horizon is indistinct.
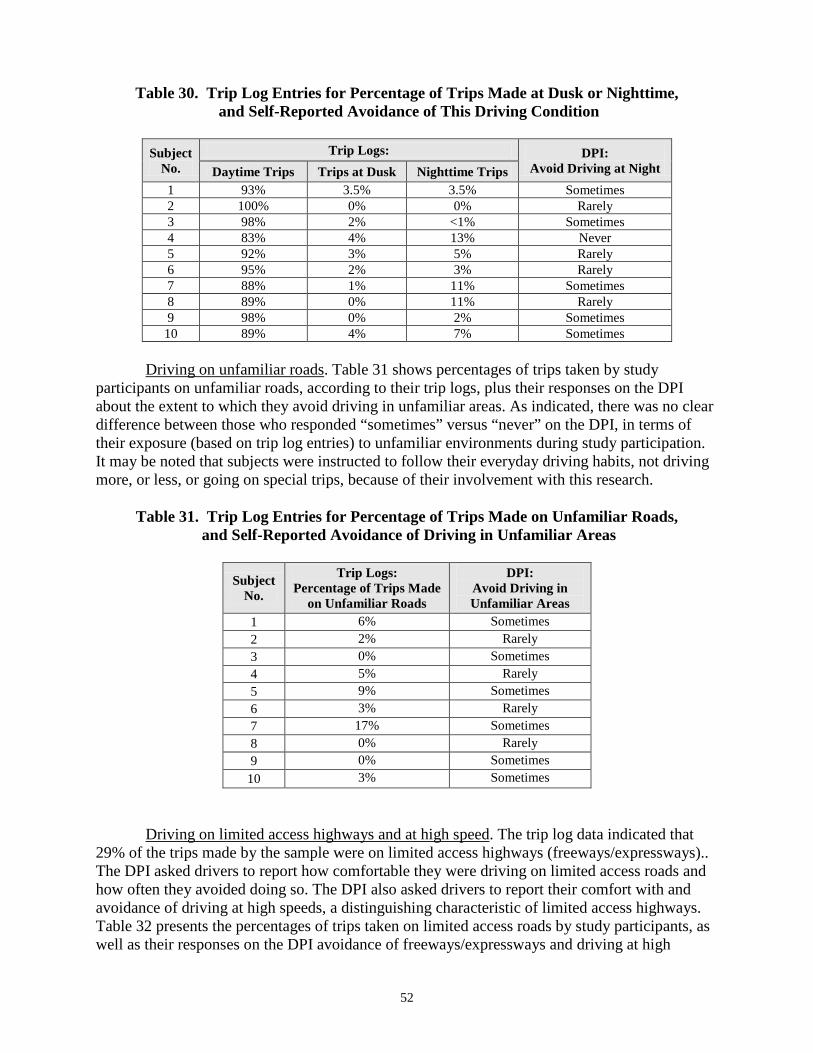
52
Table 30. Trip Log Entries for Percentage of Trips Made at Dusk or Nighttime, and Self-Reported Avoidance of This Driving Condition
Subject Trip Logs: DPI:
No. Avoid Driving at Night Daytime Trips Trips at Dusk Nighttime Trips 1 93% 3.5% 3.5% Sometimes 2 100% 0% 0% Rarely 3 98% 2% <1% Sometimes 4 83% 4% 13% Never 5 92% 3% 5% Rarely 6 95% 2% 3% Rarely 7 88% 1% 11% Sometimes 8 89% 0% 11% Rarely 9 98% 0% 2% Sometimes 10 89% 4% 7% Sometimes
Driving on unfamiliar roads. Table 31 shows percentages of trips taken by study
participants on unfamiliar roads, according to their trip logs, plus their responses on the DPI about the extent to which they avoid driving in unfamiliar areas. As indicated, there was no clear difference between those who responded “sometimes” versus “never” on the DPI, in terms of their exposure (based on trip log entries) to unfamiliar environments during study participation. It may be noted that subjects were instructed to follow their everyday driving habits, not driving more, or less, or going on special trips, because of their involvement with this research.
Table 31.
Trip Log Entries for Percentage of Trips Made on Unfamiliar Roads, and Self-Reported Avoidance of Driving in Unfamiliar Areas
Trip Logs: DPI: Subject Percentage of Trips Made Avoid Driving in No. on Unfamiliar Roads Unfamiliar Areas
1 6% Sometimes 2 2% Rarely 3 0% Sometimes 4 5% Rarely 5 9% Sometimes 6 3% Rarely 7 17% Sometimes 8 0% Rarely 9 0% Sometimes
10 3% Sometimes
Driving on limited access highways and at high speed. The trip log data indicated that 29% of the trips made by the sample were on limited access highways (freeways/expressways).. The DPI asked drivers to report how comfortable they were driving on limited access roads and how often they avoided doing so. The DPI also asked drivers to report their comfort with and avoidance of driving at high speeds, a distinguishing characteristic of limited access highways. Table 32 presents the percentages of trips taken on limited access roads by study participants, as well as their responses on the DPI avoidance of freeways/expressways and driving at high
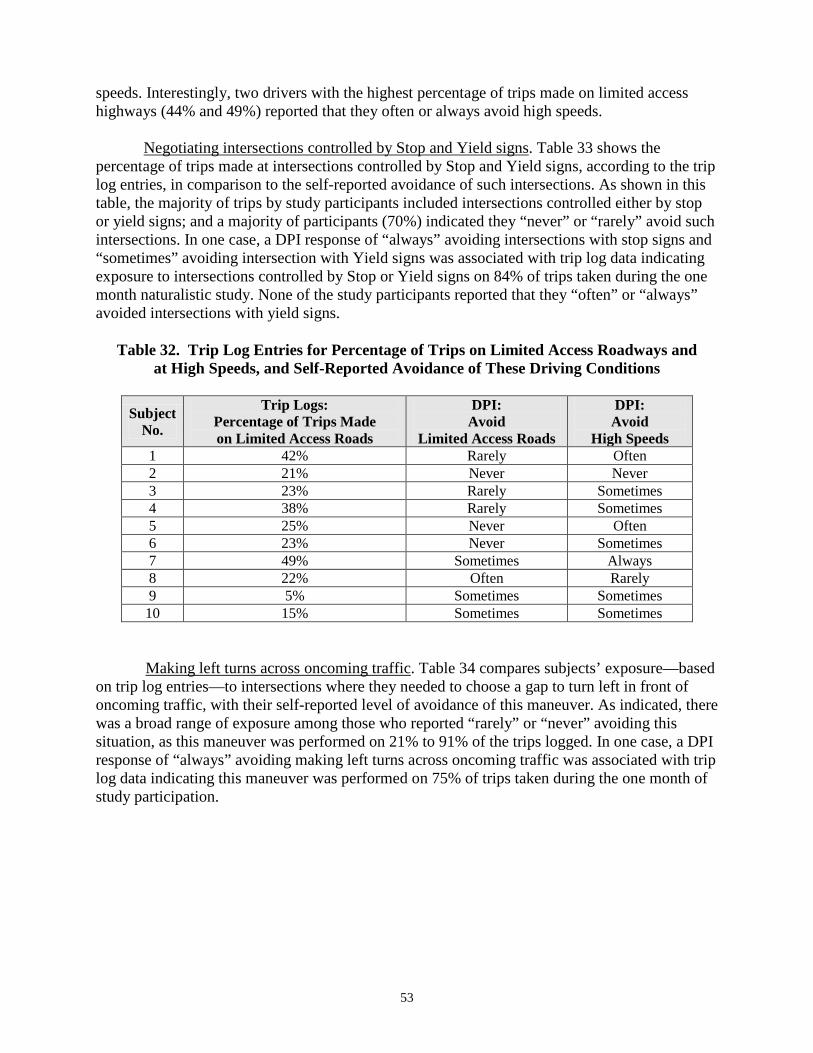
53
speeds. Interestingly, two drivers with the highest percentage of trips made on limited access highways (44% and 49%) reported that they often or always avoid high speeds.
Negotiating intersections controlled by Stop and Yield signs. Table 33 shows the percentage of trips made at intersections controlled by Stop and Yield signs, according to the trip log entries, in comparison to the self-reported avoidance of such intersections. As shown in this table, the majority of trips by study participants included intersections controlled either by stop or yield signs; and a majority of participants (70%) indicated they “never” or “rarely” avoid such intersections. In one case, a DPI response of “always” avoiding intersections with stop signs and “sometimes” avoiding intersection with Yield signs was associated with trip log data indicating exposure to intersections controlled by Stop or Yield signs on 84% of trips taken during the one month naturalistic study. None of the study participants reported that they “often” or “always” avoided intersections with yield signs.
Table 32. Trip Log Entries for Percentage of Trips on Limited Access Roadways and at High Speeds, and Self-Reported Avoidance of These Driving Conditions
Trip Logs: DPI: DPI: Subject Percentage of Trips Made Avoid Avoid No. on Limited Access Roads Limited Access Roads High Speeds
1 42% Rarely Often 2 21% Never Never 3 23% Rarely Sometimes 4 38% Rarely Sometimes 5 25% Never Often 6 23% Never Sometimes 7 49% Sometimes Always 8 22% Often Rarely 9 5% Sometimes Sometimes
10 15% Sometimes Sometimes
Making left turns across oncoming traffic. Table 34 compares subjects’ exposure—based on trip log entries—to intersections where they needed to choose a gap to turn left in front of oncoming traffic, with their self-reported level of avoidance of this maneuver. As indicated, there was a broad range of exposure among those who reported “rarely” or “never” avoiding this situation, as this maneuver was performed on 21% to 91% of the trips logged. In one case, a DPI response of “always” avoiding making left turns across oncoming traffic was associated with trip log data indicating this maneuver was performed on 75% of trips taken during the one month of study participation.
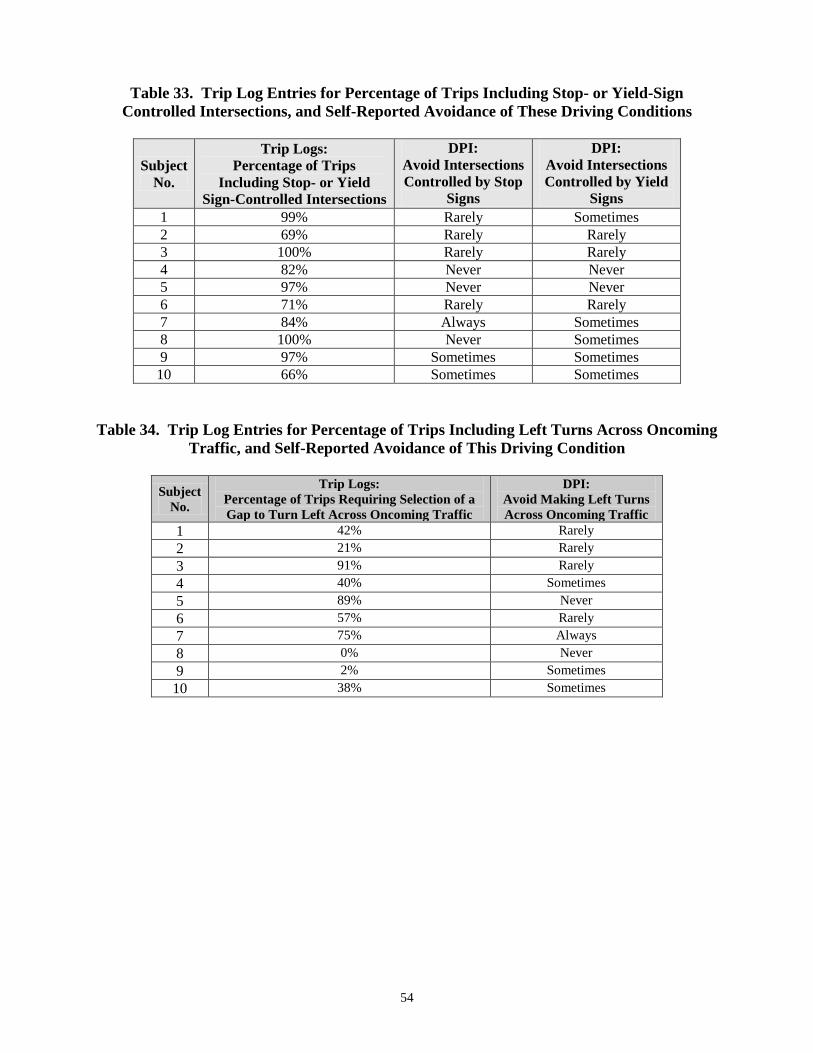
54
Table 33. Trip Log Entries for Percentage of Trips Including Stop- or Yield-Sign Controlled Intersections, and Self-Reported Avoidance of These Driving Conditions
Trip Logs: DPI: DPI:
Subject Percentage of Trips Avoid Intersections Avoid Intersections No. Including Stop- or Yield Controlled by Stop Controlled by Yield
Sign-Controlled Intersections Signs Signs 1 99% Rarely Sometimes 2 69% Rarely Rarely 3 100% Rarely Rarely 4 82% Never Never 5 97% Never Never 6 71% Rarely Rarely 7 84% Always Sometimes 8 100% Never Sometimes 9 97% Sometimes Sometimes
10 66% Sometimes Sometimes
Table 34. Trip Log Entries for Percentage of Trips Including Left Turns Across Oncoming Traffic, and Self-Reported Avoidance of This Driving Condition
Trip Logs: DPI: Subject Percentage of Trips Requiring Selection of a Avoid Making Left Turns No. Gap to Turn Left Across Oncoming Traffic Across Oncoming Traffic
1 42% Rarely 2 21% Rarely 3 91% Rarely 4 40% Sometimes 5 89% Never 6 57% Rarely 7 75% Always 8 0% Never 9 2% Sometimes 10 38% Sometimes
55
CONCLUSIONS AND DISCUSSION
The functional assessments used in this research represented measurement constructs identified in the technical literature or demonstrated in previous empirical studies to be significantly related to older driver crash experience and/or are widely recognized clinical tools used in fitness-to-drive evaluations by driving rehabilitation specialists. The research team selected particular tools and techniques for the assessments in this project on the basis of their expected ease of use, reliability, and ability to produce objective and standardized results in a clinical (driver rehabilitation) setting. With one exception, all assessments were computer-based, using a touchscreen to obtain responses from approximately 700 drivers age 70 and older. A portable eye chart was used to measure contrast sensitivity. Our experience during test administration indicates that a majority of older drivers were comfortable with this user interface, and could complete many of the assessments without prompting or assistance; however, a test administrator was always present, and most of the sample did require assistance with certain, specific assessments. The most problematic test procedure in this regard was the assessment of information processing speed with divided attention, using the UFOV subtest 2. As per the Informed Consent agreement for this research, study participants could skip measures or abandon the testing completely without penalty at any time during the assessment protocol; 174 people expressed confusion or frustration with UFOV subtest 2 and elected to skip it. This resulted in by far the greatest amount of missing data for any assessment, and indicates the need for improved instructions and/or a less lenient protocol for future studies using this measure. Recruiting older drivers to undergo functional assessments was more time-consuming and expensive than planned, and ultimately succeeded in recruiting only 70% of the desired sample size. The ratio of those solicited for research participation to those agreeing to participate as “paid volunteers” was slightly over 10:1. This contrasts with a recruitment rate approaching 50% in the earlier Maryland Pilot Older Drive Study, which included very similar test requirements and was conducted in a similar venue (see Staplin, Lococo, Gish, & Decina, 2003). The principal difference was that, in the previous work, employees of the MVA recruited subjects. Potential subjects may have considered this an “official” request for research participation, compared to the IRB-approved solicitation delivered by RAs in the current project. Future studies of this nature must be realistic in establishing budgets and timetables for subject recruitment. Despite the recruitment difficulties, it appears that the project attained a representative sample. Analyses revealed no significant differences between the study sample and all other licensed older drivers who visited the MVA study sites on recruitment and testing days—i.e., those who received notification of the research opportunity but declined to participate—with respect to immediate past history of driving negligence. While the ratio of males to females was higher in the sample (53:47) than in the comparison group (41:59), the mean age of the sample (77.4) matched the mean age of the comparison group almost exactly (77.5). The research team concluded that the present research methods met an essential prerequisite for generalization of the study’s findings, at least statewide if not beyond.
56
The intercorrelations observed among the functional assessments administered in this research yielded few surprises. There was a direct and consistent relationship between contrast sensitivity and the scores for other assessments, such that poorer vision was associated with poorer performance on every other measure. This makes sense; in this protocol, all of the assessments, including the physical (brake reaction time) measure, depended on the processing of visual information. Overall, very few correlations failed to reach significance at p < .01 (or even at p < .001). This reflects the extreme degrees of freedom for these analyses, and does not necessarily suggest an overlap between assessments that would justify eliminating one or more of the included measurement constructs. Univariate and multivariate analyses gauged the relationship between functional status and driving safety indicators. The best crash prediction model that emerged from a stepwise regression procedure included four measures of functional ability, and exhibited an odds ratio (OR) of 4.5, discounting the influence of crash probability on the model. This was not significantly higher than the OR associated with the best predictor revealed in the (univariate) analyses carried out for each functional measure in isolation. As such, study conclusions focused primarily upon the examination of individual measures as predictors of crash involvement and violation experience. In that regard, the so-called “route planning” measure, maze completion time, evidenced the strongest findings. Performance on the easiest version of this test (Maze 1) was a significant predictor of crash involvement at p < .017 and a combination of this test stimulus plus a more challenging version (Maze 2) predicted crash involvement at p < .001. Maze 1 also emerged as the most significant (p < .020) predictor of prospective serious moving violations among the study sample. Because this procedure may be a more sensitive indicator of deficits related to mild cognitive impairment and dementia (cf. Ott, 2008) than any others included in the assessment battery, the present results are especially noteworthy; the computer-based Maze Test offers a brief, reliable, intuitive instrument, with good face validity for a key component of everyday driving, that could be readily incorporated into existing inventories used in clinical practice and other applications. Not surprisingly, contrast threshold (a transformed measure of contrast sensitivity) also emerged as a significant predictor of crash involvement, as drivers scoring at a percent contrast of 3.75 or higher were 2.8 times more likely to be involved in one or more crashes than drivers scoring below that cutpoint. This level of visual performance equates to a log contrast sensitivity value of 1.42, which is somewhat better than the cutpoint of 1.25 identified by Owsley, Stalvey, Wells, Sloane, and McGwin (2001) for crash-involved older drivers. However, the Owsley et al. research examined 5 years’ retrospective crash experience for their subjects, while this study analyzed relationships between functional status and prospective crashes; it is possible that subjects’ vision at the time it was measured by Owsley et al. had deteriorated from its status in prior years, when their crashes occurred. Other measures established as significant crash predictors in the earlier Maryland Pilot Older Driver Study (Staplin et al., 2003) and also more broadly in the technical literature, demonstrated only marginal statistical significance (.05 < p < .10) in this study – specifically, visual search with divided attention (Trail-Making, Part B) and visuospatial ability (MVPT visual closure). Another measure of visual information processing/visual attention, UFOV subtest 2, did not approach significance in the crash or the violation analyses. These unexpected
57
results all may reflect the smaller-than-designed sample size, and the associated limitation in the number of crashes and violations available for the present analyses. UFOV, in particular, was plagued by missing assessment scores and small crash counts, and there is reason to believe that results for this measure may have been further biased through the selective loss of those drivers who were most cognitively challenged in this area. As continuing data collection activities6 using the same equipment and test protocols, carried out in the same (Maryland MVA branch office) locations produce a substantially larger sample with double or triple the number of prospective crashes available for analysis, there is every reason to expect ratification of these functional measures as significant predictors of crash risk. The Trail-Making test, while narrowly missing the .05 criterion as a crash predictor in these analyses, was significant at p < .04 with an OR of 2.86 as a predictor of serious moving violations. It also deserves mention that the same cutpoint (130 seconds completion time) was obtained in the violation analysis as in the crash analysis. This is not only a rare convergence, but a potentially important departure from the data derived from the earlier Maryland research. The results reported in Staplin et al. (2003) identify a cutpoint of 180 seconds for Trails B, based on a paper-and-pencil testing method. Translating this measure to a computer touchscreen may facilitate performance by reducing psychomotor demands. Replication of these results could warrant an adjustment of the scoring criteria for screening and assessment programs that incorporate a computer (touchscreen) version of the Trail-Making test. The remaining measure that merits discussion is the Choice Brake Response measure. In the crash analyses, response time (RT) predicted crash involvement at p < .055, and Choice Brake Response false alarms approached significance as a crash predictor at p < .07. When considering intersection crashes only, however, Choice Brake Response false alarms was the only significant (p < .049) crash predictor. Specifically, drivers who mis-applied the brake pedal at least twice during this measure were just over three times (OR = 3.04) more likely to be involved in an intersection crash. This finding may point to a fruitful avenue of research into the antecedents of “pedal error” crashes. Next, interpreting the meaning of a myriad of traffic safety indicators hinges on the availability of reliable exposure information. Older driver safety is one of the best examples. Crash frequency data identify older drivers as among the safest of all cohorts; but when risk is expressed in terms of crashes per mile driven, an upward trending curve from age 65 to 75 that accelerates sharply with increasing longevity (IIHS, 2009) has far different policy implications, given the continued aging of our society and its continuing reliance on private vehicles. But how reliable is the exposure information—most often obtained through self-reports—on which such analyses of crash risk are based? This research obtained information about various aspects of driving exposure from the OBD module, the trip logs completed by each subject, and the DPI. For three variables—driving days per week, trips per day, and average trip length—exposure information was obtained from all three sources. Where OBD data existed for a given exposure measure, they were regarded as an objective reference against which the accuracy and reliability of either/both of the other data sources could be gauged. Comparisons between the trip logs and DPI responses were also of interest because, while each constituted a type of self-report, the trip logs contained information
6 “Predicting Long-Term Mobility Outcomes for Older Adults,” NIH/NIA Grant R01 AG021958-06, 2/2010-2/2015.
58
reported immediately after driving while the DPI data reflected individuals’ estimates of, or recall about, their driving experience much farther removed in time. For those variables where exposure information was obtained from all three sources, a very strong (r > 0.9) and significant correlation was demonstrated between the trip log data and the OBD record. DPI data, in comparison, showed very low correlations with the OBD record, and without any consistent pattern of error—both overestimations and underestimations were evident in these estimates. With the caveat that these comparisons were carried out for only one small sample, it would appear that data obtained via immediate self reports are clearly superior to data that rely on memory and estimation; and may provide reliable exposure information within certain research designs.
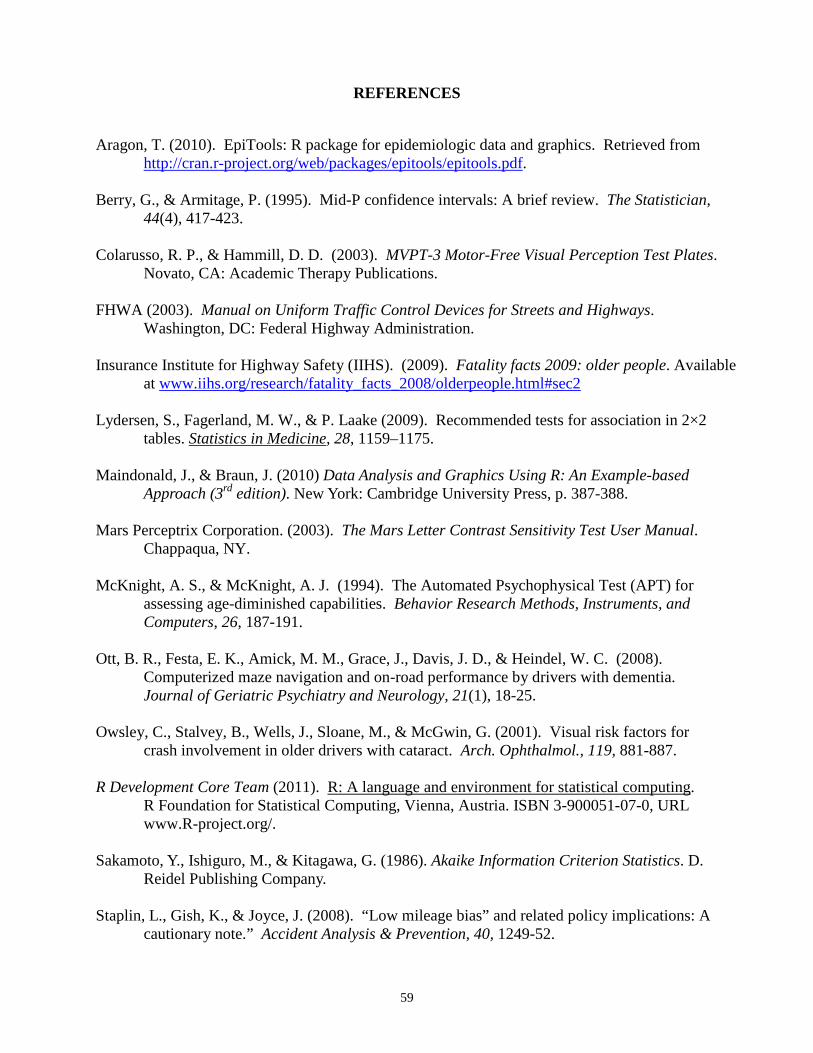
59
REFERENCES Aragon, T. (2010). EpiTools: R package for epidemiologic data and graphics. Retrieved from http://cran.r-project.org/web/packages/epitools/epitools.pdf. Berry, G., & Armitage, P. (1995). Mid-P confidence intervals: A brief review. The Statistician,
44(4), 417-423. Colarusso, R. P., & Hammill, D. D. (2003). MVPT-3 Motor-Free Visual Perception Test Plates.
Novato, CA: Academic Therapy Publications. FHWA (2003). Manual on Uniform Traffic Control Devices for Streets and Highways.
Washington, DC: Federal Highway Administration. Insurance Institute for Highway Safety (IIHS). (2009). Fatality facts 2009: older people. Available
at www.iihs.org/research/fatality_facts_2008/olderpeople.html#sec2 Lydersen, S., Fagerland, M. W., & P. Laake (2009). Recommended tests for association in 2×2
tables. Statistics in Medicine, 28, 1159–1175. Maindonald, J., & Braun, J. (2010) Data Analysis and Graphics Using R: An Example-based
Approach (3rd edition). New York: Cambridge University Press, p. 387-388. Mars Perceptrix Corporation. (2003). The Mars Letter Contrast Sensitivity Test User Manual.
Chappaqua, NY. McKnight, A. S., & McKnight, A. J. (1994). The Automated Psychophysical Test (APT) for
assessing age-diminished capabilities. Behavior Research Methods, Instruments, and Computers, 26, 187-191.
Ott, B. R., Festa, E. K., Amick, M. M., Grace, J., Davis, J. D., & Heindel, W. C. (2008).
Computerized maze navigation and on-road performance by drivers with dementia. Journal of Geriatric Psychiatry and Neurology, 21(1), 18-25.
Owsley, C., Stalvey, B., Wells, J., Sloane, M., & McGwin, G. (2001). Visual risk factors for
crash involvement in older drivers with cataract. Arch. Ophthalmol., 119, 881-887. R Development Core Team (2011). R: A language and environment for statistical computing.
R Foundation for Statistical Computing, Vienna, Austria. ISBN 3-900051-07-0, URL www.R-project.org/.
Sakamoto, Y., Ishiguro, M., & Kitagawa, G. (1986). Akaike Information Criterion Statistics. D.
Reidel Publishing Company. Staplin, L., Gish, K., & Joyce, J. (2008). “Low mileage bias” and related policy implications: A
cautionary note.” Accident Analysis & Prevention, 40, 1249-52.

60
Staplin, L., Lococo, K. H., Gish, K. W., & Decina, L. E. (2003, May). Model driver screening and evaluation program, vol. II, Maryland pilot older driver study. (Report No. DOT HS 809 583). Washington, DC: National Highway Traffic Safety Administration. Available at www.nhtsa.dot.gov/people/injury/olddrive/modeldriver/volume_ii.htm.
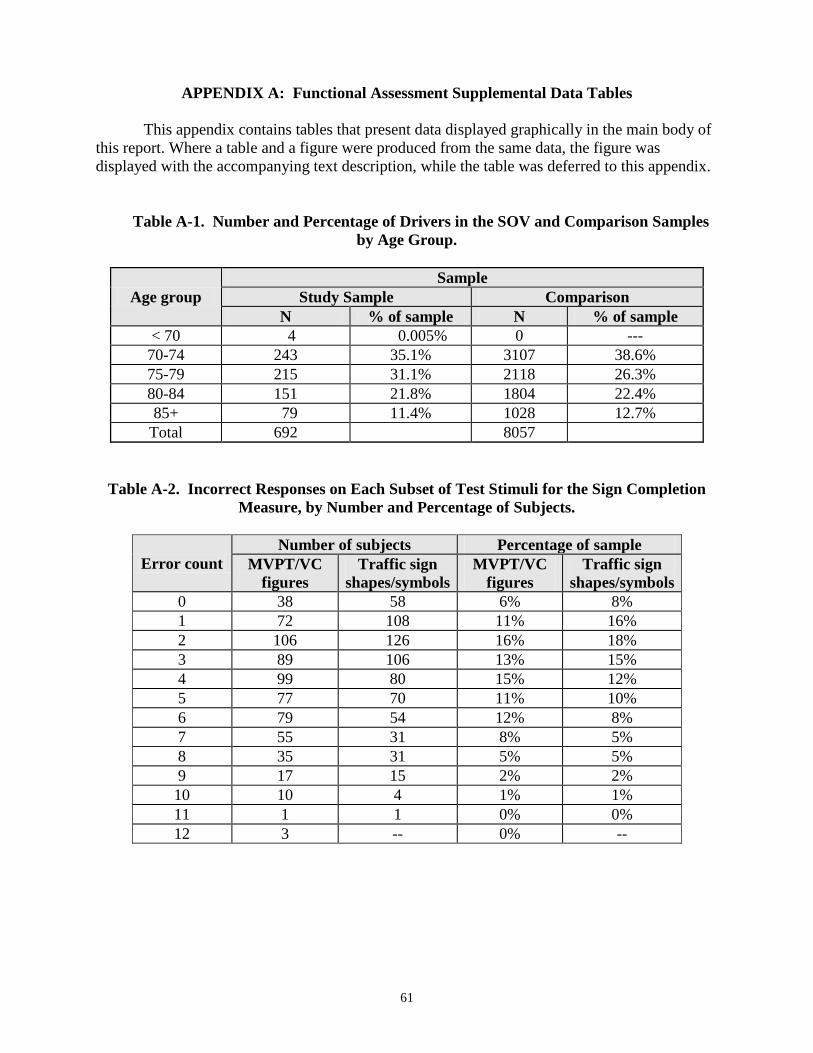
61
APPENDIX A: Functional Assessment Supplemental Data Tables This appendix contains tables that present data displayed graphically in the main body of this report. Where a table and a figure were produced from the same data, the figure was displayed with the accompanying text description, while the table was deferred to this appendix.
ach Subset of Test Sti
Table A-1. Number and Percentage of Drivers in the SOV and Comparison Samples by Age Group.
Sample
Age group Study Sample Comparison N % of sample N % of sample
< 70 4 0.005% 0 --- 70-74 243 35.1% 3107 38.6% 75-79 215 31.1% 2118 26.3% 80-84 151 21.8% 1804 22.4% 85+ 79 11.4% 1028 12.7%
Total 692 8057
Table A-2. Incorrect Responses on E muli for the Sign Completion Measure, by Number and Percentage of Subjects.
Number of subjects Percentage of sample
Error count MVPT/VC Traffic sign MVPT/VC Traffic sign figures shapes/symbols figures shapes/symbols
0 38 58 6% 8% 1 72 108 11% 16% 2 106 126 16% 18% 3 89 106 13% 15% 4 99 80 15% 12% 5 77 70 11% 10% 6 79 54 12% 8% 7 55 31 8% 5% 8 35 31 5% 5% 9 17 15 2% 2% 10 10 4 1% 1% 11 1 1 0% 0% 12 3 -- 0% --
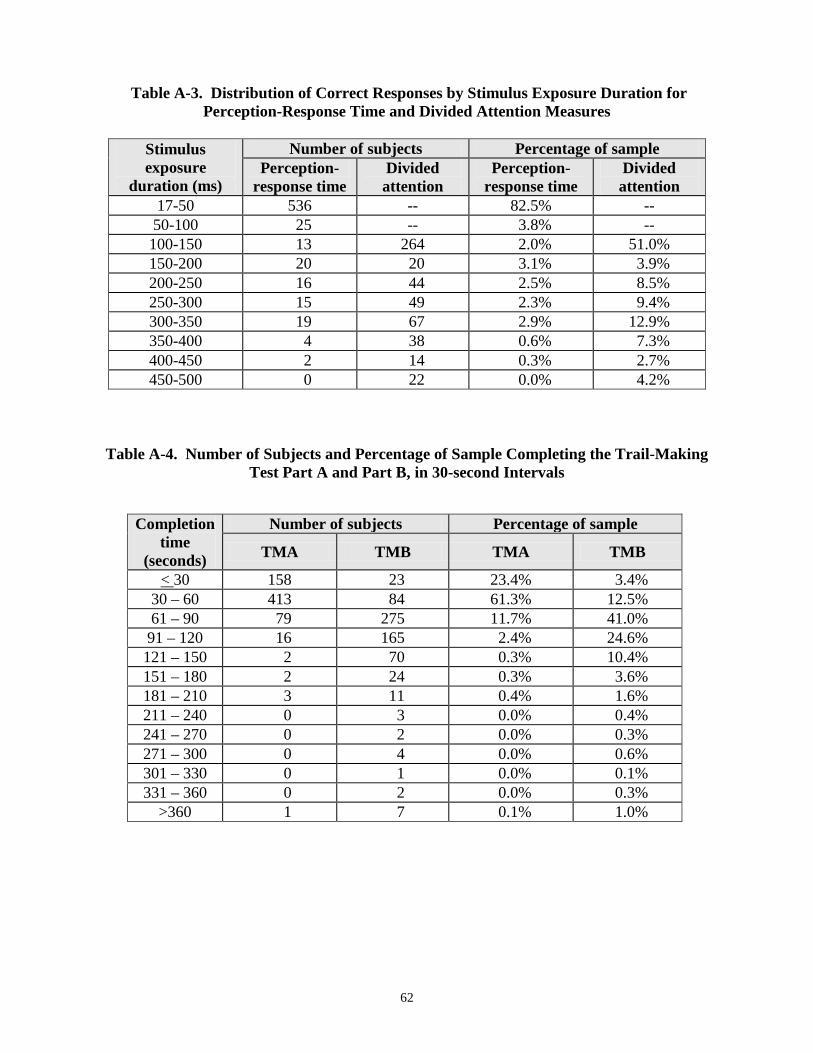
62
Table A-3. Distribution of Correct Responses by Stimulus Exposure Duration for Perception-Response Time and Divided Attention Measures
Stimulus Number of subjects Percentage of sample exposure
duration (ms) Perception-
response time Divided attention
Perception-response time
Divided attention
17-50 536 -- 82.5% -- 50-100 25 -- 3.8% -- 100-150 13 264 2.0% 51.0% 150-200 20 20 3.1% 3.9% 200-250 16 44 2.5% 8.5% 250-300 15 49 2.3% 9.4% 300-350 19 67 2.9% 12.9% 350-400 4 38 0.6% 7.3% 400-450 2 14 0.3% 2.7% 450-500 0 22 0.0% 4.2%
Table A-4. Number of Subjects and Percentage of Sample Completing the Trail-Making Test Part A and Part B, in 30-second Intervals
Completion Number of subjects Percentage of sample time TMA TMB TMA TMB (seconds) < 30 158 23 23.4% 3.4%
30 – 60 413 84 61.3% 12.5% 61 – 90 79 275 11.7% 41.0% 91 – 120 16 165 2.4% 24.6% 121 – 150 2 70 0.3% 10.4% 151 – 180 2 24 0.3% 3.6% 181 – 210 3 11 0.4% 1.6% 211 – 240 0 3 0.0% 0.4% 241 – 270 0 2 0.0% 0.3% 271 – 300 0 4 0.0% 0.6% 301 – 330 0 1 0.0% 0.1% 331 – 360 0 2 0.0% 0.3%
>360 1 7 0.1% 1.0%
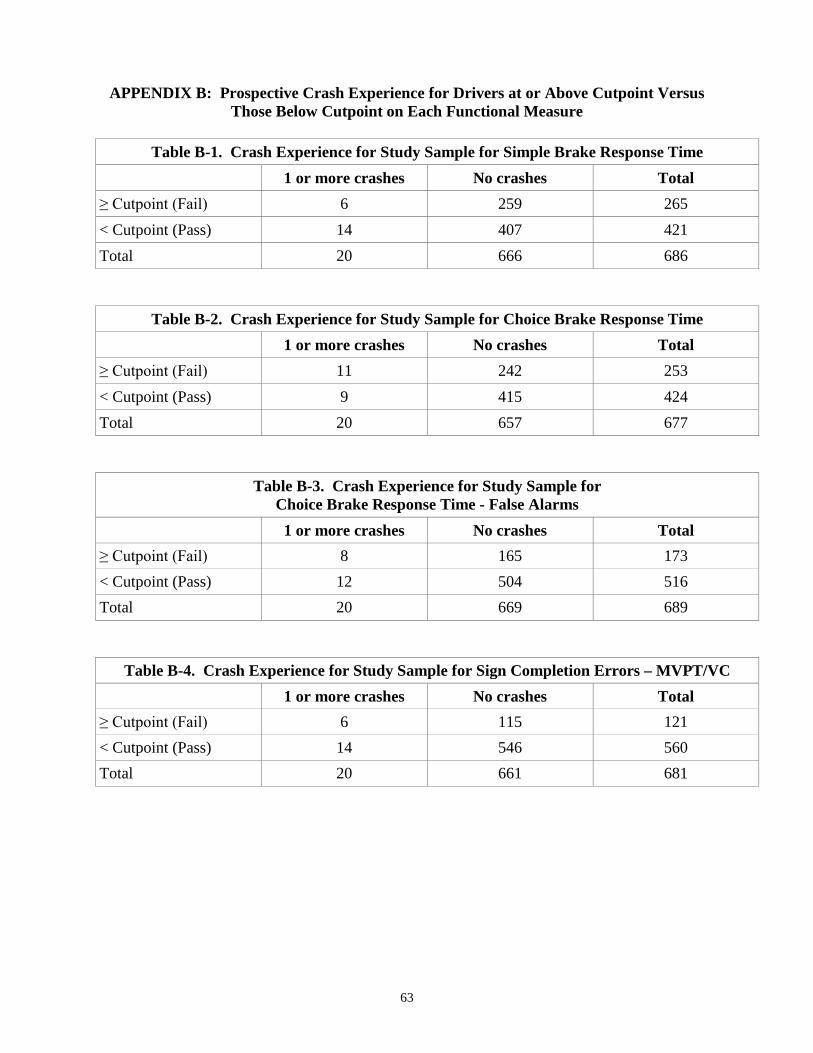
63
APPENDIX B: Prospective Crash Experience for Drivers at or Above Cutpoint Versus Those Below Cutpoint on Each Functional Measure
Table B-1. Crash Experience for Study Sample for Simple Brake Response Time
1 or more crashes No crashes Total ≥ Cutpoint (Fail) 6 259 265 < Cutpoint (Pass) 14 407 421 Total 20 666 686
Table B-2. Crash Experience for Study Sample for Choice Brake Response Time 1 or more crashes No crashes Total ≥ Cutpoint (Fail) 11 242 253 < Cutpoint (Pass) 9 415 424 Total 20 657 677
Table B-3. Crash Experience for Study Sample for Choice Brake Response Time - False Alarms
1 or more crashes No crashes Total ≥ Cutpoint (Fail) 8 165 173 < Cutpoint (Pass) 12 504 516 Total 20 669 689
Table B-4. Crash Experience for Study Sample for Sign Completion Errors – MVPT/VC 1 or more crashes No crashes Total ≥ Cutpoint (Fail) 6 115 121 < Cutpoint (Pass) 14 546 560 Total 20 661 681
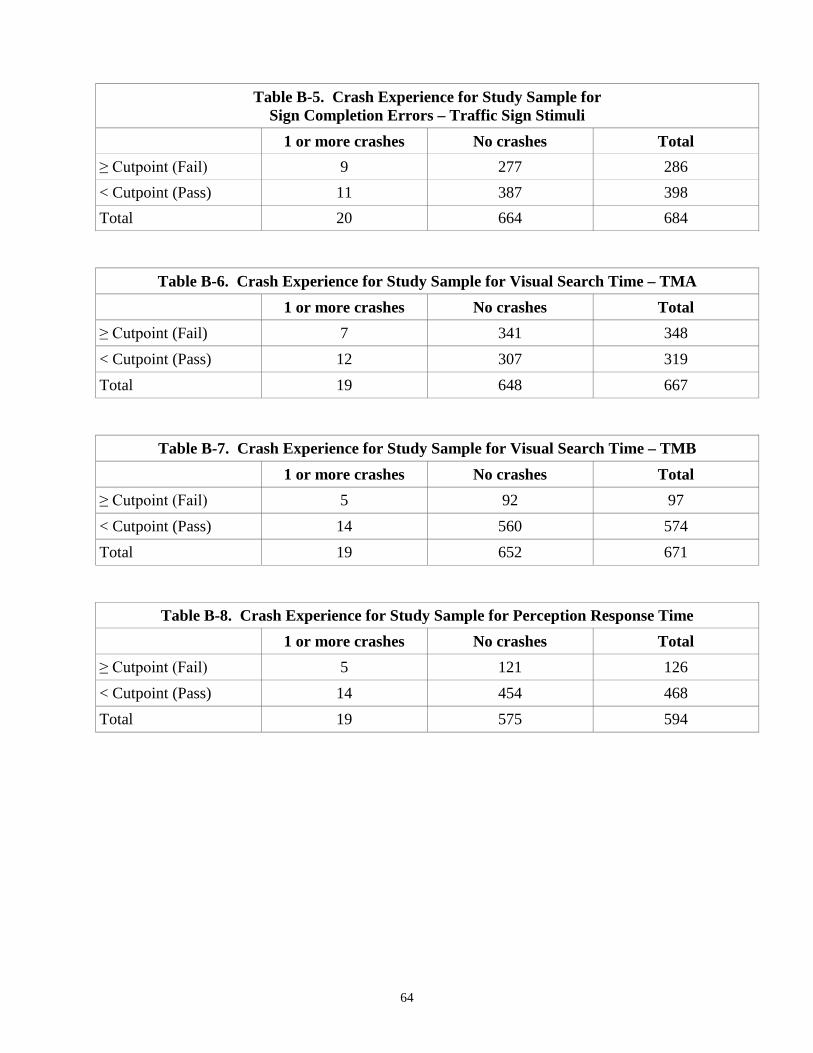
64
Table B-5. Crash Experience for Study Sample for Sign Completion Errors – Traffic Sign Stimuli
1 or more crashes No crashes Total ≥ Cutpoint (Fail) 9 277 286 < Cutpoint (Pass) 11 387 398 Total
20 664 684
Table B-6. Crash Experience for Study Sample for Visual Search Time – TMA
1 or more crashes No crashes Total ≥ Cutpoint (Fail) 7 341 348 < Cutpoint (Pass) 12 307 319 Total 19 648 667
Table B-7. Crash Experience for Study Sample for Visual Search Time – TMB 1 or more crashes No crashes Total ≥ Cutpoint (Fail) 5 92 97 < Cutpoint (Pass) 14 560 574 Total 19 652 671
Table B-8. Crash Experience for Study Sample for Perception Response Time 1 or more crashes No crashes Total ≥ Cutpoint (Fail) 5 121 126 < Cutpoint (Pass) 14 454 468 Total 19 575 594
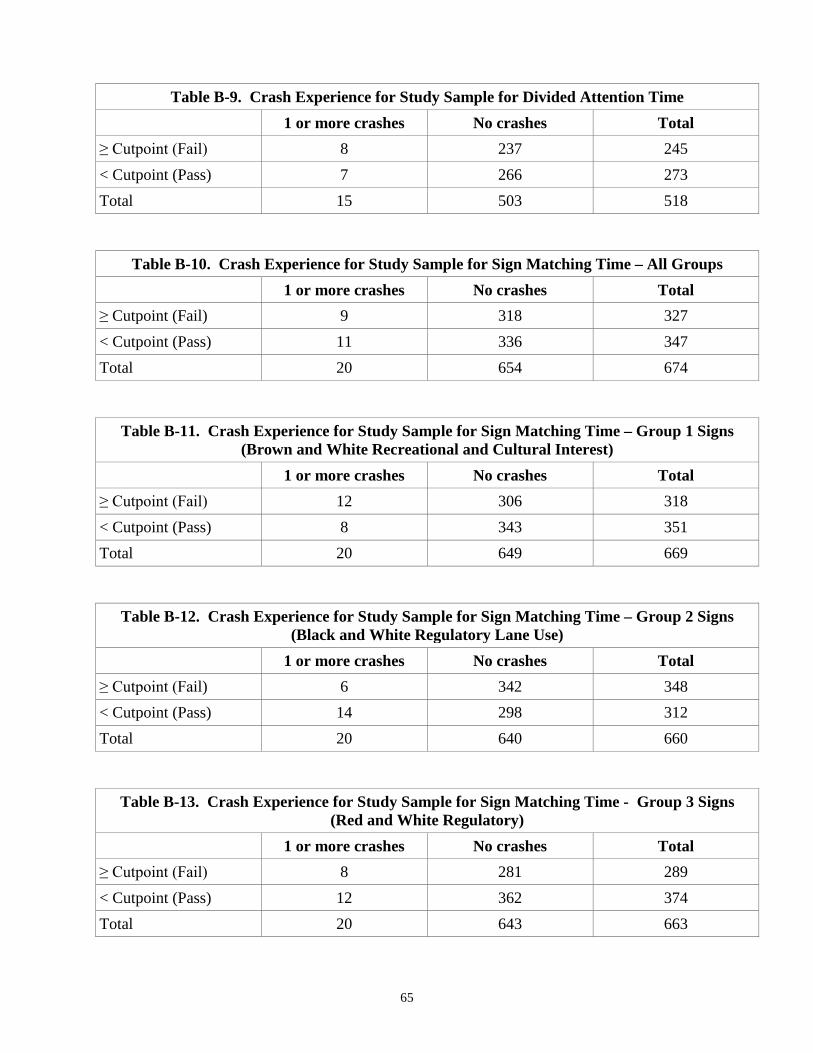
65
Table B-9. Crash Experience for Study Sample for Divided Attention Time 1 or more crashes No crashes Total ≥ Cutpoint (Fail) 8 237 245 < Cutpoint (Pass) 7 266 273 Total 15 503 518
Table B-10. Crash Experience for Study Sample for Sign Matching Time – All Groups 1 or more crashes No crashes Total ≥ Cutpoint (Fail) 9 318 327 < Cutpoint (Pass) 11 336 347 Total 20 654 674
Table B-11. Crash Experience for Study Sample for Sign Matching Time – (Brown and White Recreational and Cultural Interest)
Group 1 Signs
1 or more crashes No crashes Total ≥ Cutpoint (Fail) 12 306 318 < Cutpoint (Pass) 8 343 351 Total 20 649 669
Table B-12. Crash Experience for Study Sample for Sign Matching Time – (Black and White Regulatory Lane Use)
Group 2 Signs
1 or more crashes No crashes Total ≥ Cutpoint (Fail) 6 342 348 < Cutpoint (Pass) 14 298 312 Total 20 640 660
Table B-13. Crash Experience for Study Sample for Sign Matching Time - (Red and White Regulatory)
Group 3 Signs
1 or more crashes No crashes Total ≥ Cutpoint (Fail) 8 281 289 < Cutpoint (Pass) 12 362 374 Total 20 643 663
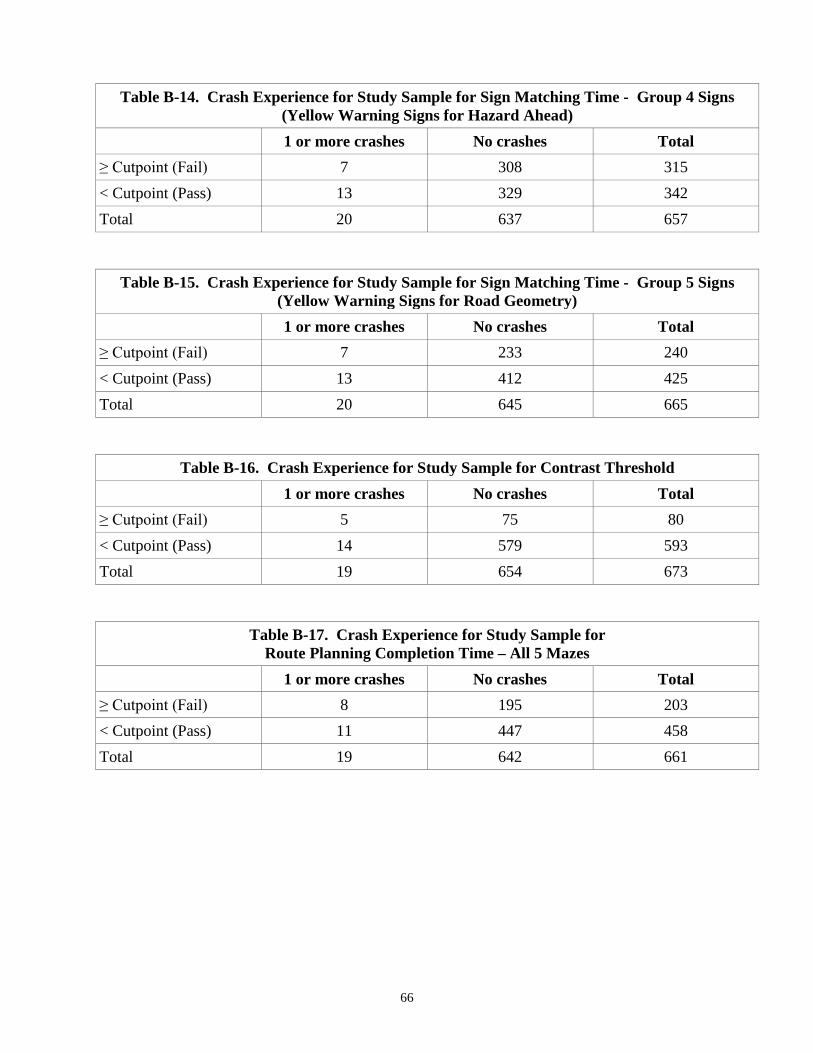
66
Table B-14. Crash Experience for Study Sample for Sign Matching Time - (Yellow Warning Signs for Hazard Ahead)
Group 4 Signs
1 or more crashes No crashes Total ≥ Cutpoint (Fail) 7 308 315 < Cutpoint (Pass) 13 329 342 Total 20 637 657
Table B-15. Crash Experience for Study Sample for Sign Matching Time - (Yellow Warning Signs for Road Geometry)
Group 5 Signs
1 or more crashes No crashes Total ≥ Cutpoint (Fail) 7 233 240 < Cutpoint (Pass) 13 412 425 Total
20 645 665
Table B-16. Crash Experience for Study Sample for Contrast Threshold
1 or more crashes No crashes Total ≥ Cutpoint (Fail) 5 75 80 < Cutpoint (Pass) 14 579 593 Total 19 654 673
Table B-17. Crash Experience for Study Sample for Route Planning Completion Time – All 5 Mazes
1 or more crashes No crashes Total ≥ Cutpoint (Fail) 8 195 203 < Cutpoint (Pass) 11 447 458 Total 19 642 661
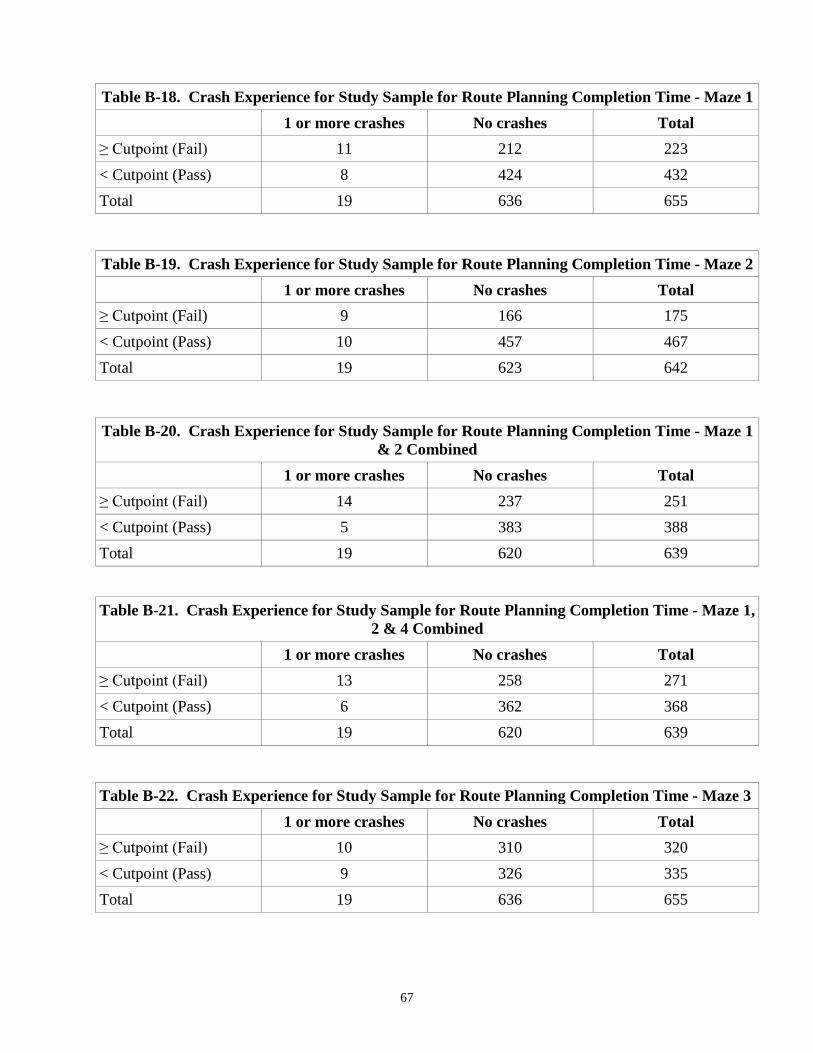
67
Table B-18. Crash Experience for Study Sample for Route Planning Completion Time - Maze 1 1 or more crashes No crashes Total ≥ Cutpoint (Fail) 11 212 223 < Cutpoint (Pass) 8 424 432 Total
19 636 655
Table B-19. Crash Experience for Study Sample for Route Planning Completion Time - Maze 2 1 or more crashes No crashes Total ≥ Cutpoint (Fail) 9 166 175 < Cutpoint (Pass) 10 457 467 Total
19 623 642
Table B-20. Crash Experience for Study Sample for Route Planning Completion Time -
& 2 Combined Maze 1
1 or more crashes No crashes Total ≥ Cutpoint (Fail) 14 237 251 < Cutpoint (Pass) 5 383 388 Total 19 620 639
Table B-21. Crash Experience for Study Sample for Route Planning Completion Time - 2 & 4 Combined
Maze 1,
1 or more crashes No crashes Total ≥ Cutpoint (Fail) 13 258 271 < Cutpoint (Pass) 6 362 368 Total 19 620 639 Table B-22. Crash Experience for Study Sample for Route Planning Completion Time - Maze 3 1 or more crashes No crashes Total ≥ Cutpoint (Fail) 10 310 320 < Cutpoint (Pass) 9 326 335 Total 19 636 655
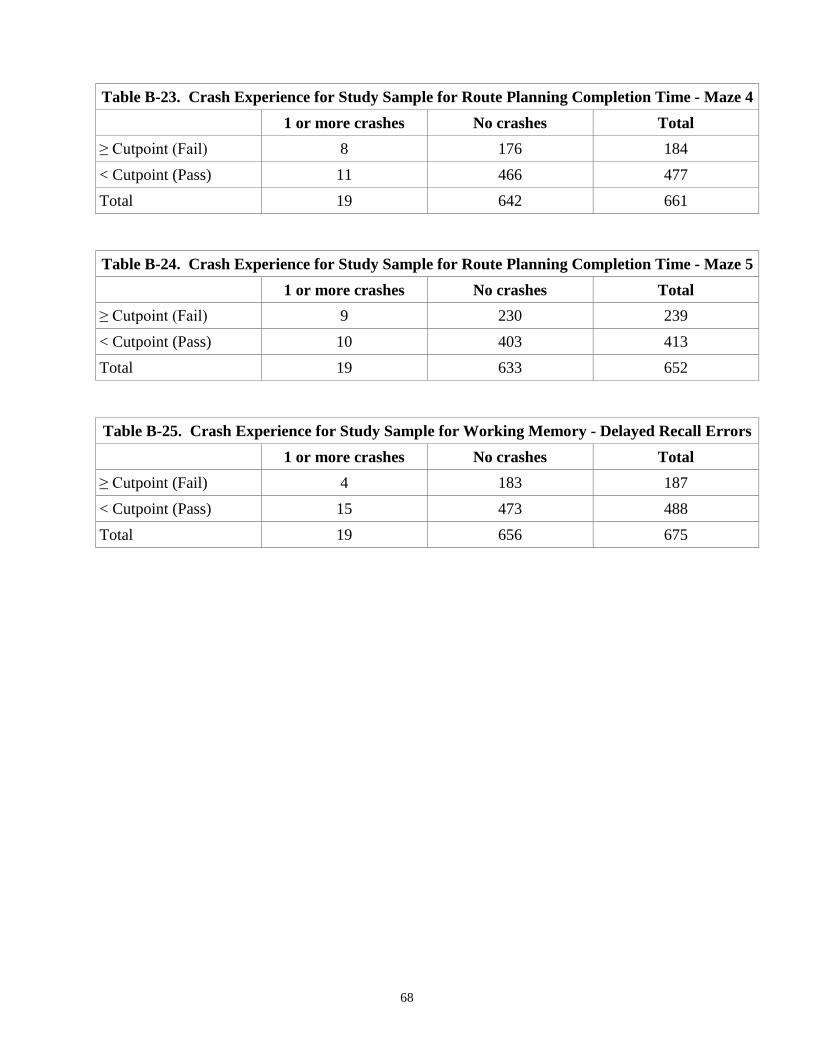
68
Table B-23. Crash Experience for Study Sample for Route Planning Completion Time - Maze 4 1 or more crashes No crashes Total ≥ Cutpoint (Fail) 8 176 184 < Cutpoint (Pass) 11 466 477 Total 19 642 661 Table B-24. Crash Experience for Study Sample for Route Planning Completion Time - Maze 5 1 or more crashes No crashes Total ≥ Cutpoint (Fail) 9 230 239 < Cutpoint (Pass) 10 403 413 Total 19 633 652 Table B-25. Crash Experience for Study Sample for Working Memory - Delayed Recall Errors 1 or more crashes No crashes Total ≥ Cutpoint (Fail) 4 183 187 < Cutpoint (Pass) 15 473 488 Total 19 656 675
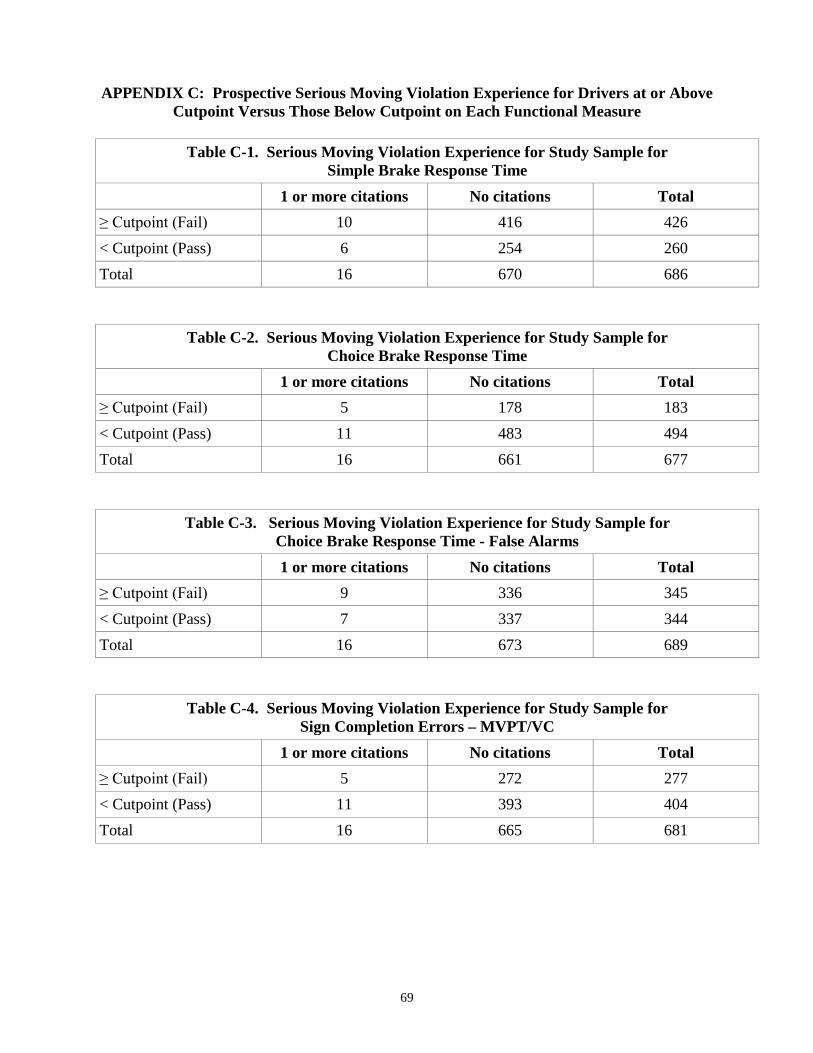
69
APPENDIX C: Prospective Serious Moving Violation Experience for Drivers at or Above Cutpoint Versus Those Below Cutpoint on Each Functional Measure
Table C-1. Serious Moving Violation Experience for Study Sample for
Simple Brake Response Time
1 or more citations No citations Total ≥ Cutpoint (Fail) 10 416 426 < Cutpoint (Pass) 6 254 260 Total
16 670 686
Table C-2. Serious Moving Violation Experience for Study Sample for Choice Brake Response Time
1 or more citations No citations Total ≥ Cutpoint (Fail) 5 178 183 < Cutpoint (Pass) 11 483 494 Total
16 661 677
Table C-3. Serious Moving Violation Experience for Study Sample for
Choice Brake Response Time - False Alarms 1 or more citations No citations Total ≥ Cutpoint (Fail) 9 336 345 < Cutpoint (Pass) 7 337 344 Total 16 673 689
Table C-4. Serious Moving Violation Experience for Study Sample for Sign Completion Errors – MVPT/VC
1 or more citations No citations Total ≥ Cutpoint (Fail) 5 272 277 < Cutpoint (Pass) 11 393 404 Total
16 665 681
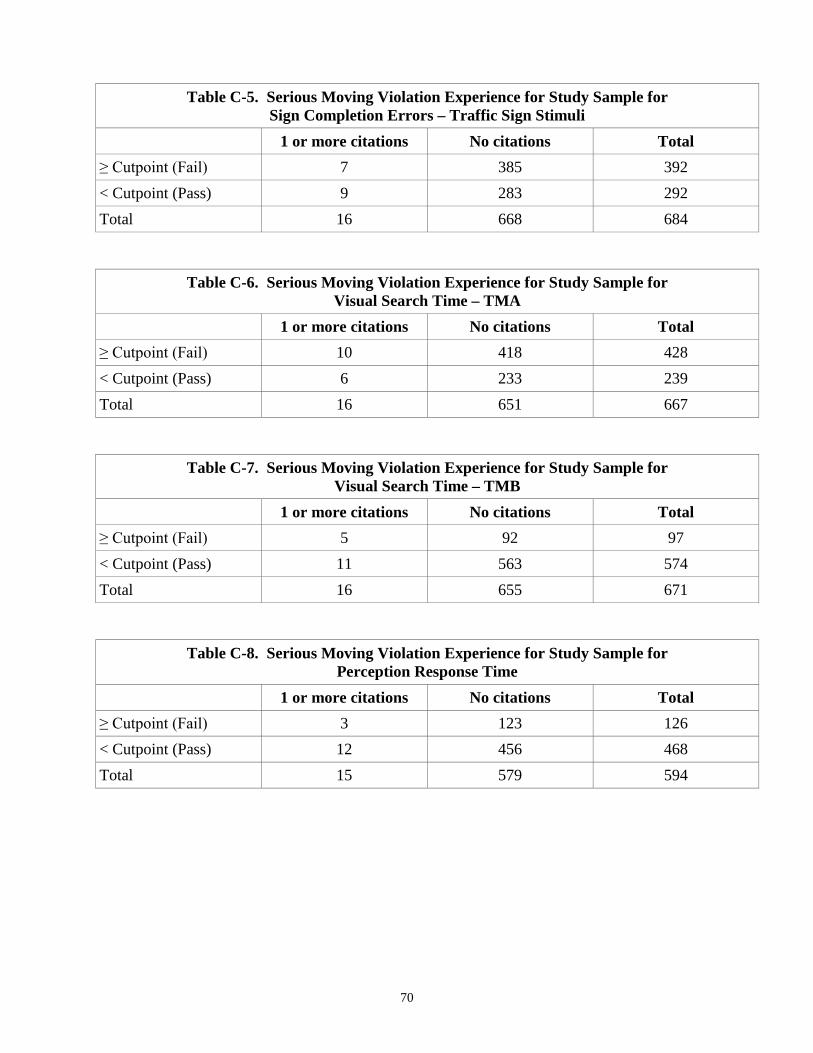
70
Table C-5. Serious Moving Violation Experience for Study Sample for Sign Completion Errors – Traffic Sign Stimuli
1 or more citations No citations Total ≥ Cutpoint (Fail) 7 385 392 < Cutpoint (Pass) 9 283 292 Total
16 668 684
Table C-6. Serious Moving Violation Experience for Study Sample for Visual Search Time – TMA
1 or more citations No citations Total ≥ Cutpoint (Fail) 10 418 428 < Cutpoint (Pass) 6 233 239 Total
16 651 667
Table C-7. Serious Moving Violation Experience for Study Sample for Visual Search Time – TMB
1 or more citations No citations Total ≥ Cutpoint (Fail) 5 92 97 < Cutpoint (Pass) 11 563 574 Total
16 655 671
Table C-8. Serious Moving Violation Experience for Study Sample for Perception Response Time
1 or more citations No citations Total ≥ Cutpoint (Fail) 3 123 126 < Cutpoint (Pass) 12 456 468 Total 15 579 594
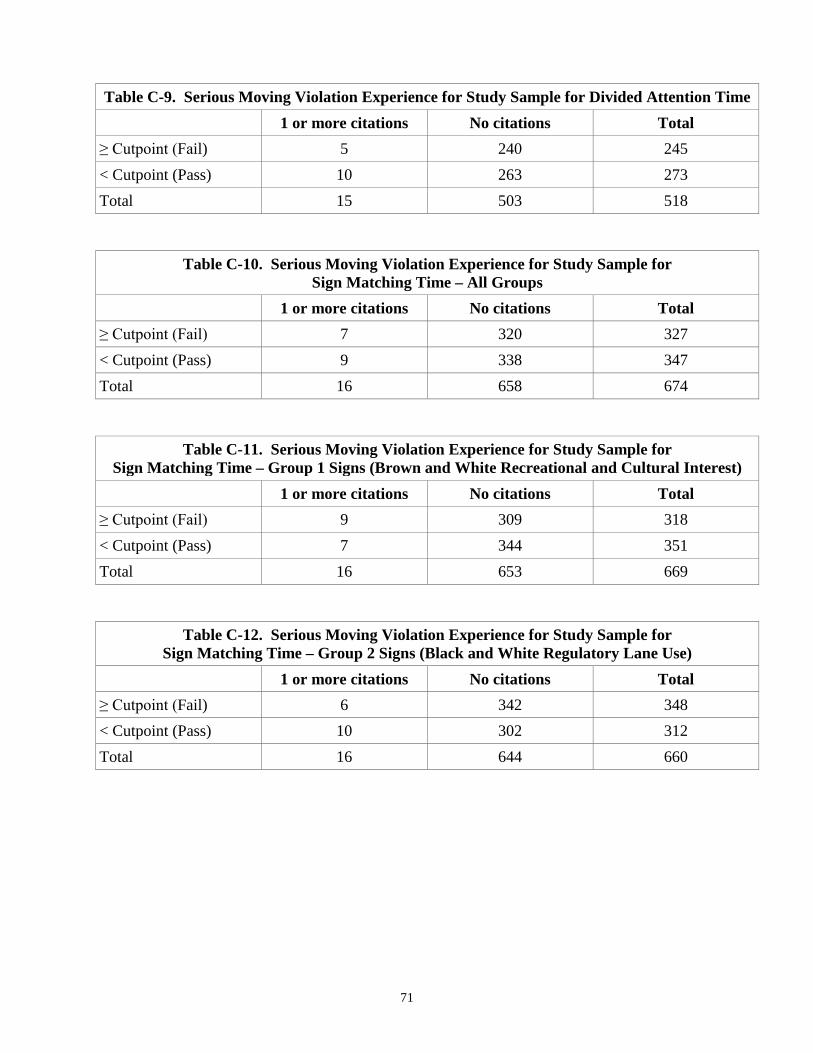
71
Table C-9. Serious Moving Violation Experience for Study Sample for Divided Attention Time 1 or more citations No citations Total ≥ Cutpoint (Fail) 5 240 245 < Cutpoint (Pass) 10 263 273 Total
15 503 518
Table C-10. Serious Moving Violation Experience for Study Sample for Sign Matching Time – All Groups
1 or more citations No citations Total ≥ Cutpoint (Fail) 7 320 327 < Cutpoint (Pass) 9 338 347 Total
16 658 674
Table C-11. Serious Moving Violation Experience for Study Sample for Sign Matching Time – Group 1 Signs (Brown and White Recreational and Cultural Interest)
1 or more citations No citations Total ≥ Cutpoint (Fail) 9 309 318 < Cutpoint (Pass) 7 344 351 Total
16 653 669
Table C-12. Serious Moving Violation Experience for Study Sample for Sign Matching Time – Group 2 Signs (Black and White Regulatory Lane Use)
1 or more citations No citations Total ≥ Cutpoint (Fail) 6 342 348 < Cutpoint (Pass) 10 302 312 Total
16 644 660
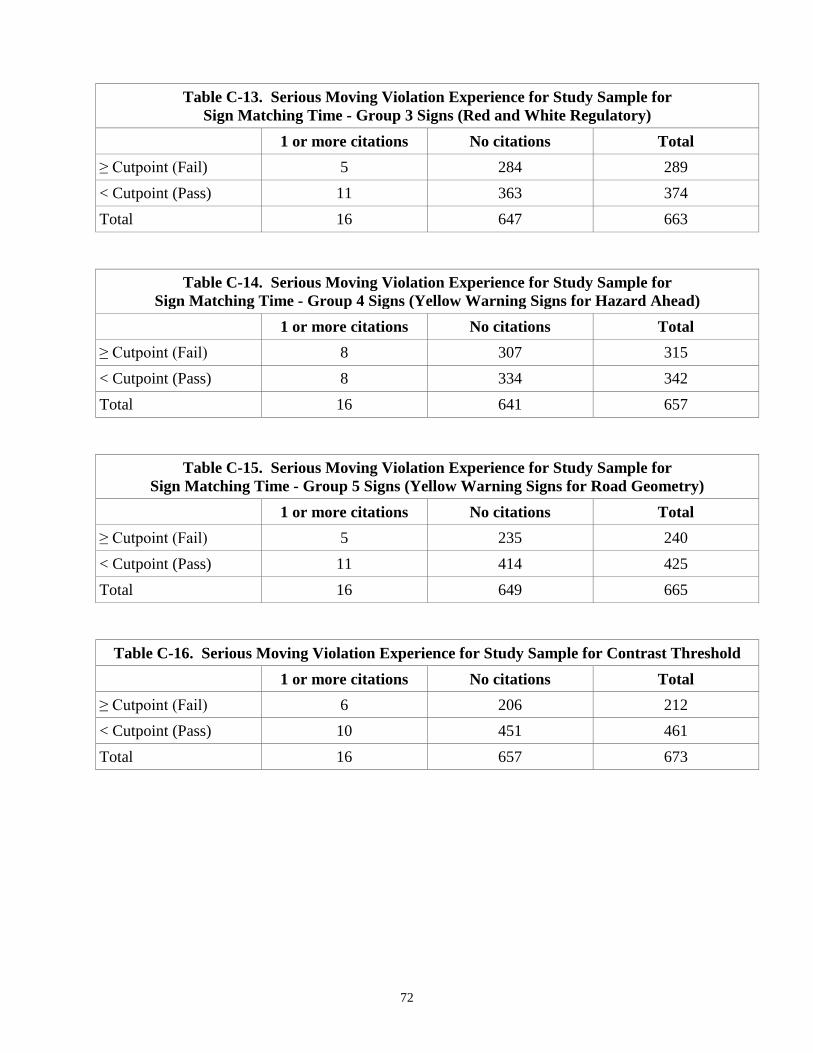
72
Table C-13. Serious Moving Violation Experience for Study Sample for Sign Matching Time - Group 3 Signs (Red and White Regulatory)
1 or more citations No citations Total ≥ Cutpoint (Fail) 5 284 289 < Cutpoint (Pass) 11 363 374 Total
16 647 663
Table C-14. Serious Moving Violation Experience for Study Sample for Sign Matching Time - Group 4 Signs (Yellow Warning Signs for Hazard Ahead)
1 or more citations No citations Total ≥ Cutpoint (Fail) 8 307 315 < Cutpoint (Pass) 8 334 342 Total
16 641 657
Table C-15. Serious Moving Violation Experience for Study Sample for Sign Matching Time - Group 5 Signs (Yellow Warning Signs for Road Geometry)
1 or more citations No citations Total ≥ Cutpoint (Fail) 5 235 240 < Cutpoint (Pass) 11 414 425 Total
16 649 665
Table C-16. Serious Moving Violation Experience for Study Sample for Contrast Threshold 1 or more citations No citations Total ≥ Cutpoint (Fail) 6 206 212 < Cutpoint (Pass) 10 451 461 Total
16 657 673
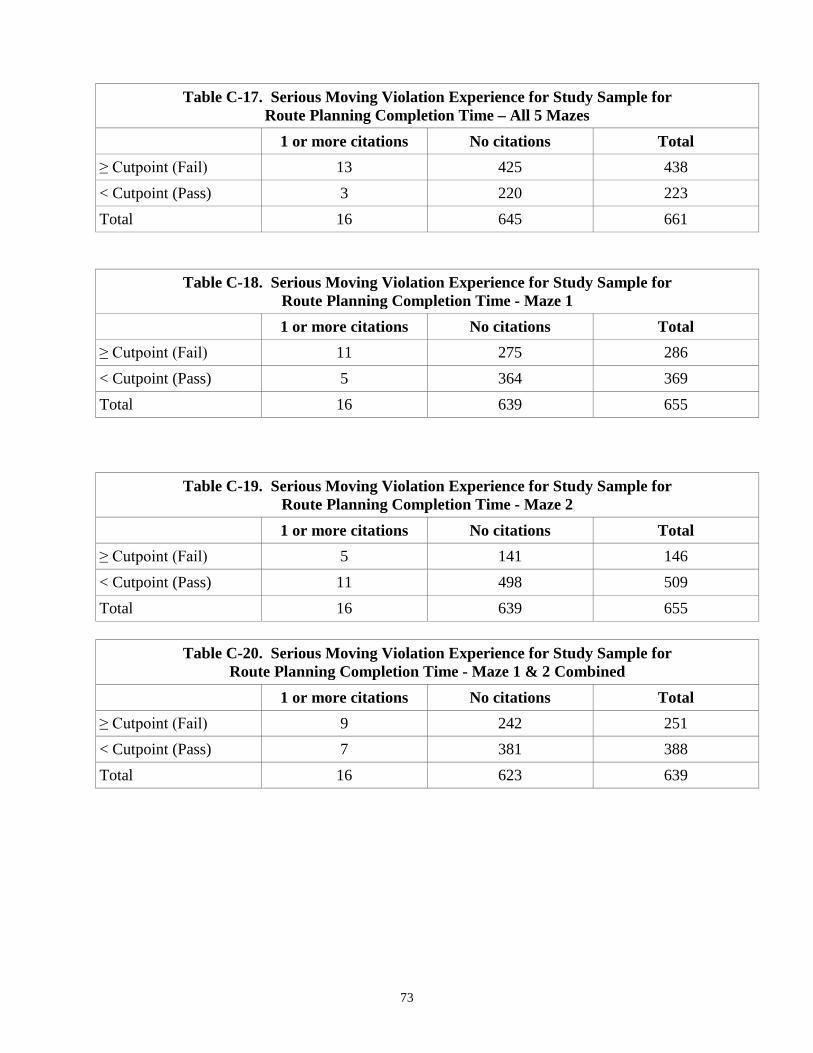
73
Table C-17. Serious Moving Violation Experience for Study Sample for Route Planning Completion Time – All 5 Mazes
1 or more citations No citations Total ≥ Cutpoint (Fail) 13 425 438 < Cutpoint (Pass) 3 220 223 Total
16 645 661
Table C-18. Serious Moving Violation Experience for Study Sample for Route Planning Completion Time - Maze 1
1 or more citations No citations Total ≥ Cutpoint (Fail) 11 275 286 < Cutpoint (Pass) 5 364 369 Total
16 639 655
Table C-19. Serious Moving Violation Experience for Study Sample for Route Planning Completion Time - Maze 2
1 or more citations No citations Total ≥ Cutpoint (Fail) 5 141 146 < Cutpoint (Pass) 11 498 509 Total
16 639 655
Table C-20. Serious Moving Violation Experience for Study Sample for Route Planning Completion Time - Maze 1 & 2 Combined
1 or more citations No citations Total ≥ Cutpoint (Fail) 9 242 251 < Cutpoint (Pass) 7 381 388 Total
16 623 639
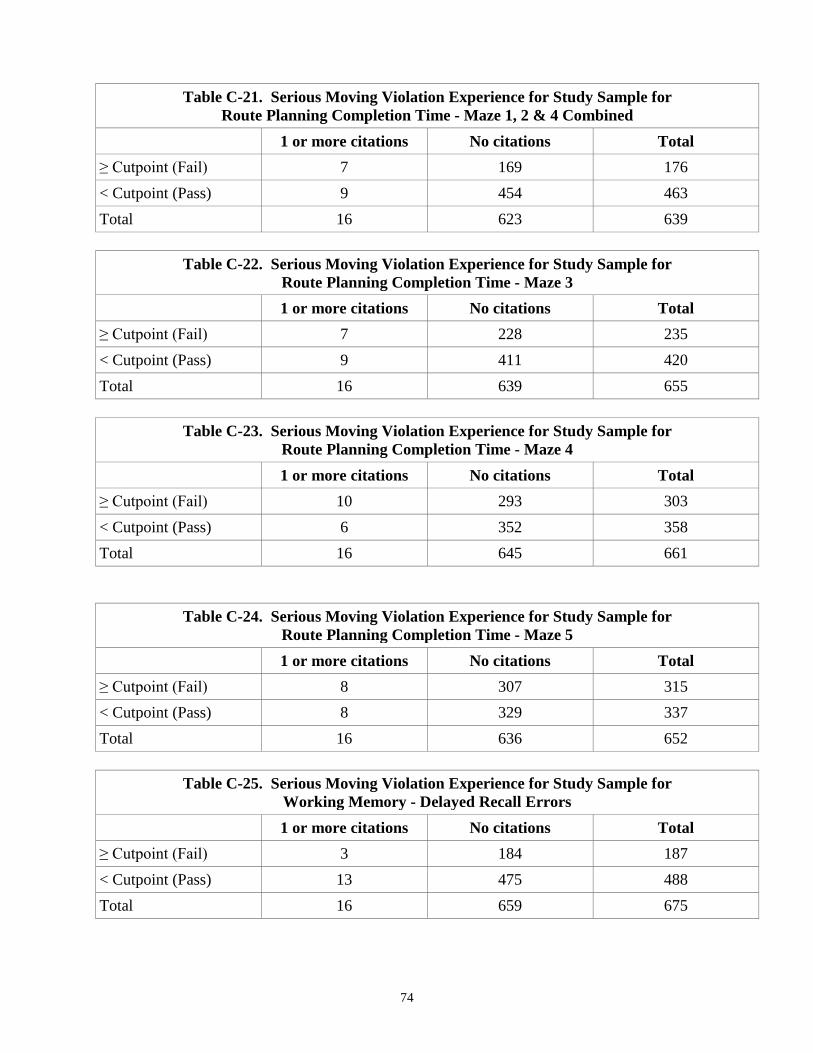
74
Table C-21. Serious Moving Violation Experience for Study Sample for Route Planning Completion Time - Maze 1, 2 & 4 Combined
1 or more citations No citations Total ≥ Cutpoint (Fail) 7 169 176 < Cutpoint (Pass) 9 454 463 Total
16 623 639
Table C-22. Serious Moving Violation Experience for Study Sample for Route Planning Completion Time - Maze 3
1 or more citations No citations Total ≥ Cutpoint (Fail) 7 228 235 < Cutpoint (Pass) 9 411 420 Total 16 639 655
Table C-23. Serious Moving Violation Experience for Study Sample for Route Planning Completion Time - Maze 4
1 or more citations No citations Total ≥ Cutpoint (Fail) 10 293 303 < Cutpoint (Pass) 6 352 358 Total 16 645 661
Table C-24. Serious Moving Violation Experience for Study Sample for Route Planning Completion Time - Maze 5
1 or more citations No citations Total ≥ Cutpoint (Fail) 8 307 315 < Cutpoint (Pass) 8 329 337 Total 16 636 652
Table C-25. Serious Moving Violation Experience for Study Sample for Working Memory - Delayed Recall Errors
1 or more citations No citations Total ≥ Cutpoint (Fail) 3 184 187 < Cutpoint (Pass) 13 475 488 Total 16 659 675
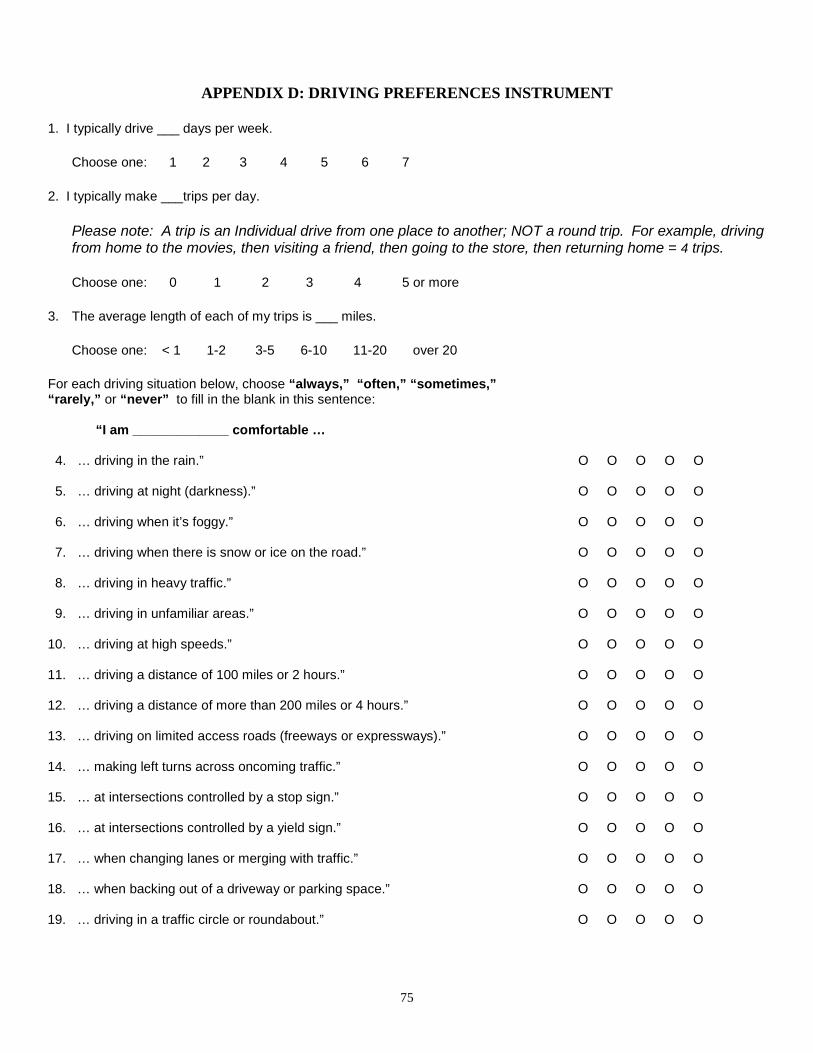
75
APPENDIX D: DRIVING PREFERENCES INSTRUMENT
1. I typically drive ___ days per week.
Choose one: 1 2 3 4 5 6 7
2. I typically make ___trips per day.
Please note: A trip is an Individual drive from one place to another; NOT a round trip. For example, driving from home to the movies, then visiting a friend, then going to the store, then returning home = 4 trips.
Choose one: 0 1 2 3 4 5 or more
3. The average length of each of my trips is ___ miles.
Choose one: < 1 1-2 3-5 6-10 11-20 over 20
For each driving situation below, choose “always,” “often,” “sometimes,” sm
e
ys i t yn
me era
w rel
l fte
o a eva o s r n
“rarely,” or “never” to fill in the blank in this sentence: “I am _____________ comfortable … 4. … driving in the rain.” O O O O O 5. … driving at night (darkness).” O O O O O 6. … driving when it’s foggy.” O O O O O 7. … driving when there is snow or ice on the road.” O O O O O 8. … driving in heavy traffic.” O O O O O 9. … driving in unfamiliar areas.” O O O O O 10. … driving at high speeds.” O O O O O 11. … driving a distance of 100 miles or 2 hours.” O O O O O 12. … driving a distance of more than 200 miles or 4 hours.” O O O O O 13. … driving on limited access roads (freeways or expressways).” O O O O O 14. … making left turns across oncoming traffic.” O O O O O 15. … at intersections controlled by a stop sign.” O O O O O 16. … at intersections controlled by a yield sign.” O O O O O 17. … when changing lanes or merging with traffic.” O O O O O 18. … when backing out of a driveway or parking space.” O O O O O 19. … driving in a traffic circle or roundabout.” O O O O O
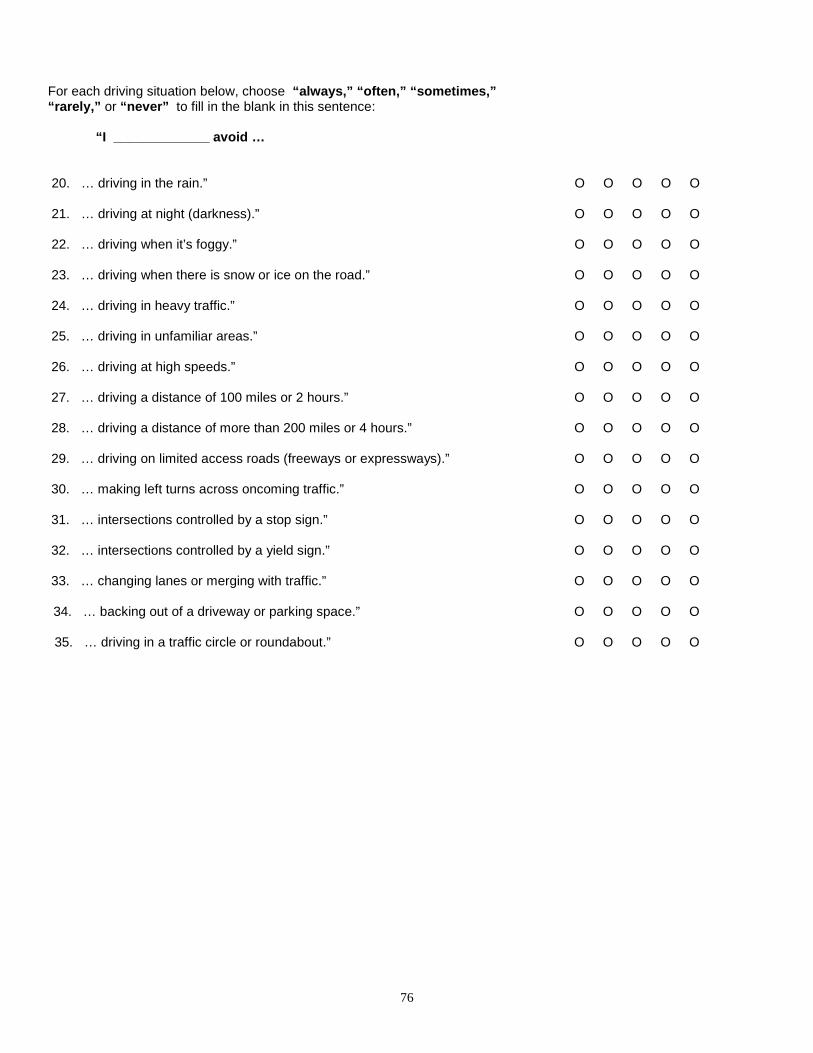
76
For each driving situation below, choose “always,” “often,” “sometimes,” “rarely,” or “never” to fill in the blank in this sentence: s
me
ys i t ya n er
w me
rel
fte eval oo s ra n
“I _____________ avoid … 20. … driving in the rain.” O O O O O 21. … driving at night (darkness).” O O O O O 22. … driving when it’s foggy.” O O O O O 23. … driving when there is snow or ice on the road.” O O O O O 24. … driving in heavy traffic.” O O O O O 25. … driving in unfamiliar areas.” O O O O O 26. … driving at high speeds.” O O O O O 27. … driving a distance of 100 miles or 2 hours.” O O O O O 28. … driving a distance of more than 200 miles or 4 hours.” O O O O O 29. … driving on limited access roads (freeways or expressways).” O O O O O 30. … making left turns across oncoming traffic.” O O O O O 31. … intersections controlled by a stop sign.” O O O O O 32. … intersections controlled by a yield sign.” O O O O O 33. … changing lanes or merging with traffic.” O O O O O 34. … backing out of a driveway or parking space.” O O O O O
35. … driving in a traffic circle or roundabout.” O O O O O
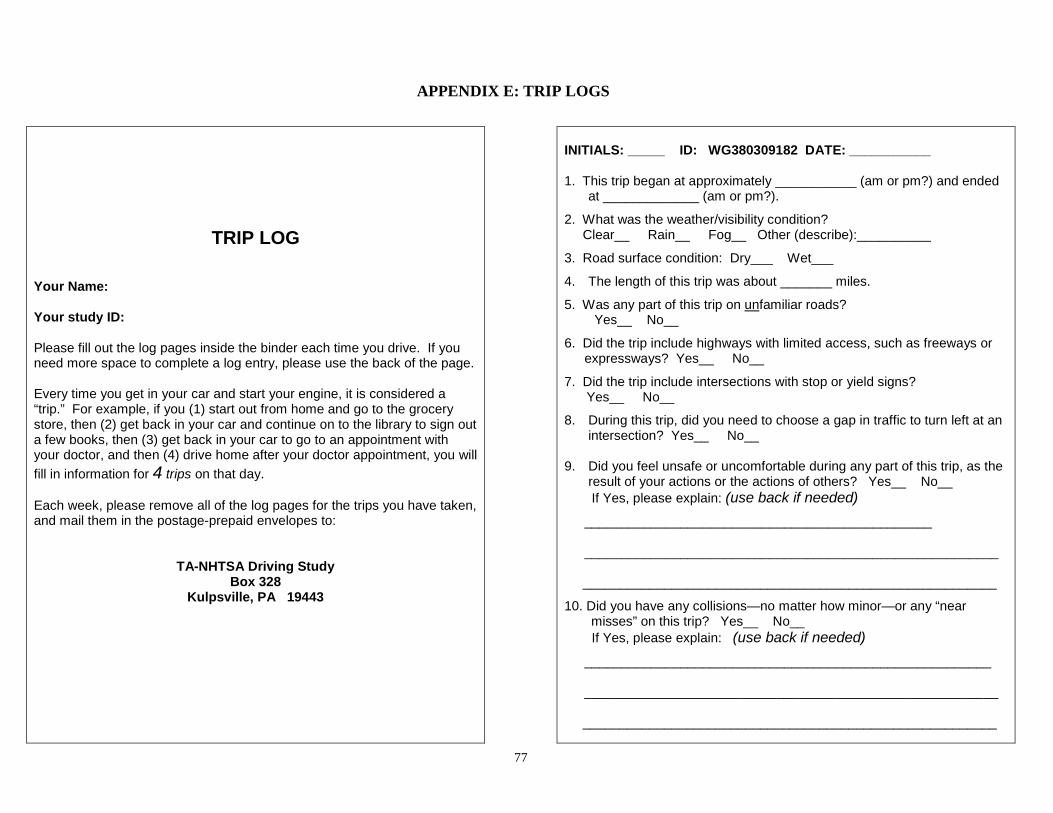
77
TRIP LOG Your Name: Your study ID: Please fill out the log pages inside the binder each time you drive. If you need more space to complete a log entry, please use the back of the page. Every time you get in your car and start your engine, it is considered a “trip.” For example, if you (1) start out from home and go to the grocery store, then (2) get back in your car and continue on to the library to sign out a few books, then (3) get back in your car to go to an appointment with your doctor, and then (4) drive home after your doctor appointment, you will fill in information for 4 trips on that day. Each week, please remove all of the log pages for the trips you have taken, and mail them in the postage-prepaid envelopes to:
TA-NHTSA Driving Study Box 328
Kulpsville, PA 19443
INITIALS: _____ ID: WG380309182 DATE: ___________ 1. This trip began at approximately ___________ (am or pm?) and ended
at _____________ (am or pm?).
2. What was the weather/visibility condition? Clear__ Rain__ Fog__ Other (describe):__________
3. Road surface condition: Dry___ Wet___
4. The length of this trip was about _______ miles.
5. Was any part of this trip on unfamiliar roads? Yes__ No__
6. Did the trip include highways with limited access, such as freeways or expressways? Yes__ No__
7. Did the trip include intersections with stop or yield signs? Yes__ No__
8. During this trip, did you need to choose a gap in traffic to turn left at an intersection? Yes__ No__
9. Did you feel unsafe or uncomfortable during any part of this trip, as the result of your actions or the actions of others? Yes__ No__
If Yes, please explain: (use back if needed) _______________________________________________ ________________________________________________________
________________________________________________________
10. Did you have any collisions—no matter how minor—or any “near misses” on this trip? Yes__ No__
If Yes, please explain: (use back if needed) _______________________________________________________ ________________________________________________________
________________________________________________________
APPENDIX E: TRIP LOGS
DOT HS 811 630 August 2012
8721-081412-v3