functional capability space and optimum process adjustments for manufacturing processes with...
TRANSCRIPT

This article was downloaded by: [University of Wyoming Libraries]On: 04 October 2013, At: 10:57Publisher: Taylor & FrancisInforma Ltd Registered in England and Wales Registered Number: 1072954 Registered office: Mortimer House,37-41 Mortimer Street, London W1T 3JH, UK
IIE TransactionsPublication details, including instructions for authors and subscription information:http://www.tandfonline.com/loi/uiie20
Functional capability space and optimum processadjustments for manufacturing processes with in-specsfailureKamal Mannar a & Darek Ceglarek b ca General Electric Healthcare, Waukesha, WI, 53188, USAb The Digital Laboratory, WMG, University of Warwick, Coventry, CV4 7AL, UKc Department of Industrial and Systems Engineering, University of Wisconsin, Madison, WI,53706, USAPublished online: 20 Nov 2009.
To cite this article: Kamal Mannar & Darek Ceglarek (2009) Functional capability space and optimum process adjustments formanufacturing processes with in-specs failure, IIE Transactions, 42:2, 95-106, DOI: 10.1080/07408170902789027
To link to this article: http://dx.doi.org/10.1080/07408170902789027
PLEASE SCROLL DOWN FOR ARTICLE
Taylor & Francis makes every effort to ensure the accuracy of all the information (the “Content”) containedin the publications on our platform. However, Taylor & Francis, our agents, and our licensors make norepresentations or warranties whatsoever as to the accuracy, completeness, or suitability for any purpose of theContent. Any opinions and views expressed in this publication are the opinions and views of the authors, andare not the views of or endorsed by Taylor & Francis. The accuracy of the Content should not be relied upon andshould be independently verified with primary sources of information. Taylor and Francis shall not be liable forany losses, actions, claims, proceedings, demands, costs, expenses, damages, and other liabilities whatsoeveror howsoever caused arising directly or indirectly in connection with, in relation to or arising out of the use ofthe Content.
This article may be used for research, teaching, and private study purposes. Any substantial or systematicreproduction, redistribution, reselling, loan, sub-licensing, systematic supply, or distribution in anyform to anyone is expressly forbidden. Terms & Conditions of access and use can be found at http://www.tandfonline.com/page/terms-and-conditions

IIE Transactions (2010) 42, 95–106Copyright C© “IIE”ISSN: 0740-817X print / 1545-8830 onlineDOI: 10.1080/07408170902789027
Functional capability space and optimum processadjustments for manufacturing processes with in-specs failure
KAMAL MANNAR1 and DAREK CEGLAREK2,3,∗
1General Electric Healthcare, Waukesha, WI 53188, USAE-mail: [email protected] Digital Laboratory, WMG, University of Warwick, Coventry CV4 7AL, UK and 3Department of Industrial and SystemsEngineering, University of Wisconsin, Madison, WI 53706, USAE-mail: [email protected]
Received August 2006 and accepted January 2008
This paper introduces a methodology for functional capability analysis and optimal process adjustment for products with failuresthat occur when design parameters and process variables are within tolerance limits (in-specs). The proposed methodology definesa multivariate functional capability space (FC-Space) using a mathematical morphology operation, the Minkowski sum, in order torepresent a unified model with (i) multidimensional design tolerance space; (ii) in-specs failure region(s); and, (iii) non-parametric,multivariate process measurements represented as Kernel Density Estimates (KDEs). The defined FC-Space allows the determinationof a desired process fallout rate in the case of products with field failures that occur within design tolerances (in-specs). The outlinedprocess adjustment approach identifies the optimum position of the process mean in order to minimize the overlap between the KDEsand in-specs failure regions, i.e., achieve the minimum possible process fallout rate for current process variation. The FC-Space-basedprocess adjustment methodology is illustrated using a case study from the electronics industry where the in-specs failure region isidentified based on warranty information analysis.
Keywords: Warranty analysis, process capability assessment, process adjustment, quality, statistical process control
1. Introduction
A critical concept in the area of statistical process controlis the assessment of manufacturing process capability. Pro-cess capability is seen as the ability of the manufacturingprocess to consistently produce items within the given speci-fications of quality characteristics, i.e., within the tolerancesfor Design Parameters (DPs) and Process Variables (PVs)(Polansky, 2001; Ding et al., 2005; Montgomery, 2005).Therefore, process capability is related to process falloutrate, which is defined as the probability of DP and PVmeasurements to be outside of design tolerances. This defi-nition of process capability is based on the assumption thatany product within design tolerances has satisfactory func-tional performance, i.e., any product manufactured withinthe current tolerance limits is defect free.
With increasing complexity in products, optimal deter-mination of tolerances for DPs and PVs in the design phasecan be challenging (Engelhardt, 2000; Ding et al., 2002a;Shiu et al., 2003; Ceglarek et al., 2004). Frequently, thisis due to a lack of knowledge during the design phase
∗Corresponding author
about the interactions between various DPs and PVs, whichcause product degradation or failure (Khan and Ceglarek,2000; Ding et al., 2002b; Zhou et al., 2003; Takata et al.,2004; Chen et al., 2006). Moreover, traditional capabilityand adjustments do not take into consideration productfunctional assessments that can also contribute to prod-uct field failures. Product defects can occur either duringmanufacturing inspections or in the field (warranty fail-ures). Therefore, tolerances assigned to DPs and PVs caninclude regions that are susceptible to manufacturing orwarranty defects. In such cases, traditional quality controland inspection in manufacturing based on original designtolerances cannot detect these defects/failures.
The existence of potential failure regions that occur whendesign parameters and process variables are within toler-ance units (in-specs) was first proposed by Skinner et al.(2002) based on their research in semiconductor manufac-turing. They identified that the region within the toleranceof certain PVs is related to low yield and suggested avoidingthese low-yield regions of the tolerance to improve over-all process yield. Similarly, Mannar and Ceglarek (2006)provided an analysis on ways to integrate manufacturingmeasurements with warranty information in order to local-ize warranty failures related to critical DPs and PVs. They
0740-817X C© 2010 “IIE”
Dow
nloa
ded
by [
Uni
vers
ity o
f W
yom
ing
Lib
rari
es]
at 1
0:57
04
Oct
ober
201
3

96 Mannar and Ceglarek
identified in-specs fault regions of certain critical DPs andPVs that are susceptible to specific warranty failures.
1.1. Motivation
The existence of in-specs failures serves as motivation to de-velop a new functional capability analysis and process ad-justment methodology. The motivation involves a need forfunctional capability analysis, integration of non-normalprocess characteristics with in-spec failure regions and de-termination of an optimum process mean in the presenceof an in-spec failure region, which is described as follows.
1.1.1. Need for functional capability analysis and processadjustment
In contrast to traditional process capability and adjustmentmethods, wherein design tolerances are assumed to be cor-rect, there may exist in-specs failure regions that need tobe incorporated in to the functional capability assessment.A functional capability assessment provides the followingadvantages.
1. Product functional evaluation in global markets: Sinceproduct usage is influenced by numerous factors includ-ing geographic markets and customer groups, there canexist potentially different in-specs failure regions corre-sponding to each market. Therefore, functional capabil-ity assessment and process adjustment must incorporatethese in-specs failure regions separately in order to tailorproduct performance to each market.
2. Product functional evaluation in supply chains: Generally,various suppliers in multiple manufacturing facilities areinvolved in producing a product, each having differentvariations and distribution characteristics for DPs andPVs. Functional capability assessment, which incorpo-rates in-specs failures, can help in identifying and eval-uating processes and potential suppliers.
1.1.2. Integration of multivariate non-normal processmeasurements and in-specs failure regions
Process capability incorporates both tolerance specifica-tions and distribution characteristics of the measurementsthat determine process fallout rate. In addition to in-specsfailure regions, the DPs and PVs may be non-normal.Therefore, a non-parametric representation of process mea-surements needs to be incorporated for functional capabil-ity analysis and process adjustment.
1.1.3. Determination of optimum process mean for in-specsfault regions
Traditionally, processes are adjusted to the design nominal(Xd). For cases of in-specs failure regions the adjustmentof the process mean to the design nominal is not opti-mal and can increase the process fallout rate (Mannar andCeglarek, 2006). Therefore, a new methodology is needed
Fig. 1. Multivariate normal process with the mean at designnominal.
to identify the functional nominal (Xf ) that can ensure thelowest process fallout rate.
Figures 1 to 4 show two-dimensional examples of in-specs fault regions and their effects on process capabil-ity and adjustment. Figure 1 illustrates an example of amultivariate normal process representing a 99.73% confi-dence interval for the DPs and PVs measured. The pro-cess mean is adjusted to be at design nominal (Xd), whichis frequently equivalent to {x1 = (USL1 − LSL1)/2, x2 =(USL2 − LSL2)/2}, where USL is the Upper SpecificationLimit and LSL is the Lower Specification Limit. For thecase of an in-specs failure region, as shown in Fig. 1, thisresults in a significantly lower process capability. Therefore,an optimum process adjustment method requires the deter-mination of the coordinates of the process mean X that min-imize the process fallout rate. In other words, it minimizesthe overlap of the corresponding confidence region with
Fig. 2. Multivariate normal process with a mean shift that mini-mizes the fallout rate of the process.
Dow
nloa
ded
by [
Uni
vers
ity o
f W
yom
ing
Lib
rari
es]
at 1
0:57
04
Oct
ober
201
3

Process capability, process adjustment, quality 97
Fig. 3. Multivariate non-normal process with the mean at designnominal.
the failure regions. Figure 2 provides an example of processadjustment that minimizes the overlap between the in-specsfailure region, process distribution and tolerance limits.
The problem becomes especially challenging when theprocess measurements do not follow multivariate normal orfixed parametric distributions. Such cases require the use ofa flexible non-parametric approach in representing processmeasurements. We use a multivariate kernel-density-basedmethod to determine an estimate of the unknown densityof the process measurements. Kernel density estimation isa popular technique for smooth estimation of the density,consisting of a chosen kernel function (such as Gaussian,Epanechnikov) and bandwidth matrix (width of the kernelfunction) to estimate the density (Silverman, 1986; Scott,1992). This paper follows the approach as implemented byPolansky (2001) using optimum bandwidth selection basedon research conducted by Wand and Jones (1995). Figure 3illustrates a case of non-normal process representation us-
Fig. 4. Multivariate non-normal process with a mean location toavoid failure regions.
ing Kernel Density Estimate (KDE)-based confidence re-gions with the mean set at design nominal. Also, it shouldbe noted that any variations in the distribution of measure-ment data will cause a change in optimum process meanadjustments as can be noted by observing the differencesin Figs 2 and 4.
The proposed methodology addresses the aforemen-tioned issues in the following ways.
1. Determination of Functional Capability Space (FC-Space): Based on the in-specs fault regions and currentprocess measurements, we define FC-Space to representall process mean positions in order to ensure a givenprocess capability. The FC-Space is part of the pro-cess adjustment space that corresponds to the degreesof freedom allowable for adjusting the process mean.In this paper, the process adjustment space is based onhomogenous transformation and includes six degreesof freedom. The overall FC-Space is defined by an in-specs failure region, KDE-based process representation,tolerance space and process adjustment space. The FC-Space is the subset of adjustment space wherein there isno overlap of the KDE with the in-specs failure regions.
2. Functional nominal and optimum process adjustmentbased on FC-Space: This step determines the optimumprocess adjustment necessary to minimize the processfallout rate. The position of the process mean with mini-mum process fallout is referred as the functional nominal(Xf ) as compared to a fixed design nominal (Xd). Theoptimum process adjustment is based on determiningthe mean location that is equidistant from the bound-aries of the FC-Space. This ensures the least probabilityof overlap between the process with different failure andtolerance regions.
1.2. Related work
A great deal of research exists on monitoring and controlof manufacturing processes (Hawkins, 1991; Ceglarek andShi, 1995; Mason and Young, 2001). While recent researchhas proposed a number of multivariate process monitoringand control approaches (see, for example, Montgomery(2005), there are no methods for process capability stud-ies using non-normal process data and in-specs failures.A common approach for multivariate process monitoringis based on the Hotelling T2 control charts. However, therequired process normality assumption is difficult to sat-isfy in many multivariate processes, for example, in electri-cal/electronic assembly processes where parameters are fre-quently tuned during testing. Recent research has focusedon developing non-parametric approaches to multivariateprocess control. Sun and Tsung (2003) developed a kernel-distance-based multivariate control chart using a supportvector-based method for monitoring quality characteristicsthat are non-normal. Polansky (2005) proposed anothernon-parametric control chart based on estimation of the
Dow
nloa
ded
by [
Uni
vers
ity o
f W
yom
ing
Lib
rari
es]
at 1
0:57
04
Oct
ober
201
3

98 Mannar and Ceglarek
density of the sample subgroup statistic using a kernel den-sity estimator of observed measurements. A comprehen-sive review of non-parametric control charts is presentedby Chakraborti et al. (2001).
There has also been considerable research on multi-variate process capability analysis (Wang et al., 2000).Generally, a multivariate capability index uses a p-dimensional rectangular specification volume and assumesthat the distribution of the process measurements isknown. Multivariate-normal-distribution-based capabilitymethodologies have been proposed by Taam et al. (1993),Chen (1994) and Shahriari et al. (1995). Chen (1994) de-veloped a general multivariate capability index that al-lows both rectangular and elliptical specifications. Wanget al. (2000) reviewed major multivariate process capabil-ity indices under the assumption of normality. Polansky(2001) proposed a non-parametric, distribution-free esti-mator to compute multivariate process capability that iscalculated based on the KDE of the probability densityfunction (p.d.f.). This methodology is also used to estimatethe probability of failures to generate control charts (Polan-sky, 2005). Foster et al. (2005) proposed cause-related mul-tivariate capability indices based on process-oriented basisrepresentation.
However, all the aforementioned methodologies assumethat there are no in-specs failure regions, which can of-ten result in miscalculation of process capability and meanadjustment as illustrated in Figs. 2 to 4. The focus of theproposed FC-Space approach is to integrate the in-specsfailure regions with non-parametric process measurementsin order to determine process capability as well as optimumprocess adjustment to minimize process fallout rate.
1.3. Problem formulation
The FC-Space approach is based on information ob-tained from design (Tolerance Space), failure analysis (Fail-ure Space) and manufacturing measurements (KDE-basedProcess Space). The process adjustment is determinedbased on design tolerances, fault region in the space of mea-surements related to failure and the confidence interval as-sociated with the process measurements used to determinethe capability. These three regions, Tolerance Space, FailureSpace and Process Space are defined as follows (Fig. 5).
1. Tolerance Space Tm (T-Space): Let B represent all DPsand PVs related to a given field failure which are to bemonitored jointly. B defines an m-dimensional space Rm
(|B| = m) that is of interest for monitoring the selectedfield failure. The methodology for identifying B is pre-sented in Mannar and Ceglarek (2006). The tolerancespace, Tm, is defined by all design tolerances assignedto each DP and PV, where ai ∈ B. Tm is a subset of Rm
defined by design tolerances.2. Failure Space F (F-Space): The Failure Space, F is the
failure region in Rm, consists of: (i) an in-specs failure
Fig. 5. Illustration of Tolerance, Failure and Process Spaces|B| = 3.
region within the Tm which is sensitive to warranty fail-ures or cause lower process yield Fin-spec; and, (ii) anout-of-tolerance failure region Fout−of−spec = Rm − Tm,i.e., the region in the m-dimensional space outside ofdesign tolerance:
F = Fin-spec + Fout-of-spec. (1)
3. Process Space A (A-Space): The process space A rep-resents measurements obtained for DPs and PVs in B.The process space A is defined by a specified confidenceregion generated based on sample measurements, forexample, 99.73% confidence region. The confidence in-terval/region can be generated based on parametric ornon-parametric representation of the measurement datadepending on the characteristics of the process. In thispaper, we use a non-parametric approach to generate theconfidence interval for multivariate data based on ker-nel density estimation for m-dimensional measurementsusing n sample manufacturing measurements.3.1. Adjustment space (Cad j -Space): The adjustment
space corresponds to the possible degrees of free-dom associated with the capability to adjust theprocess mean, X. Since the process region A isassumed to be constant (no change in shape),the coordinates of any reference point in A com-pletely define the position of A. Therefore, adjust-ment space for A can be represented in terms ofmeanX = (γ1, ..., γd) ∈ Rd , where
d = m +(
m2
)
is the number of degrees of freedom; (γ1, . . . , γm)is the position of the reference point, X and(γm+1, . . . , γd ) are the Euler angles specifying theorientation of X. Any adjustment of X in this d-dimensional space changes the location or orien-tation of A. Process space A in a specific positiondefined by position of X = x is represented by (A)x.
While Cad j -Space as defined above is genericenough to incorporate both mean shift and rotation
Dow
nloa
ded
by [
Uni
vers
ity o
f W
yom
ing
Lib
rari
es]
at 1
0:57
04
Oct
ober
201
3

Process capability, process adjustment, quality 99
of process space A, in this paper we primarily fo-cus on mean-shift-based adjustment of a process.This assumes that the process space A can only beadjusted by translational degrees of freedom, i.e.,Euler angles (γm+1, . . . , γd ) are constant and only(γ1, . . . , γm) defining the position of the referencepoint is considered.
Since the process mean X is used as the ref-erence point for process adjustment, (γ1, . . . , γm)are determined based on calculation of the samplemean for m-dimensions based on n-sample processmeasurements.
X =⎡⎣ n∑
j=1
(xj1 )/n,
n∑j=1
(xj2 )/n, . . . ,
n∑j=1
(xjm)/n
⎤⎦ .
(2)3.2. Restricted Adjustment Space (COA(F)): The failure
space F is mapped into the Cad j -Space to determinethe coordinates of X for which there is overlap ofA with F:
COA(F) ≡ {x ∈ Rm|(A)x ∩ F �= Ø}. (3)
Based on the above-defined spaces, the functionalcapability space, FC-Space, potential capability in-dex FCp and optimum process adjustment can bedescribed as follows (illustrated in Fig. 6):
1. Functional capability space (FC-Space): FC-Space is de-fined as the subset of the Cad j -Space for which there isno overlap between the failure and process space (F andA), i.e., {x ∈ Rm|(A)x ∩ F = Ø}. The FC-Space can beobtained by the Boolean subtraction of COA(F) fromCad j -Space:
FC − Space =⋃
{x ∈ Rm|(A)x ∩ F = Ø}. (4)
2. Potential capability index FCp: This capability index de-termines the ratio of process dispersion (variation) tothe available tolerance space. The FC-Space determinesthe region in the adjustment space that can be used bythe process mean location. This considers both the pro-cess dispersion (A) and the failure regions (F). The FCp
Fig. 6. Illustration of FC-space and COA(F).
index is defined as the volume of the FC-Space corre-sponding to a 99.73% confidence region; a higher vol-ume indicates better process capability and vice-versa:
FCp = vol (FC − Space99/73%).
3. Optimum Process Adjustment: Based on the identifiedFC-Space boundaries the next step involves identifyingthe functional nominal which is the optimum positionof the mean so as to minimize the process fallout. Thelocation of the current mean with respect to the func-tional nominal Xf determines the functional capabilityindex FCpk, which is explained below.3.1. Determination of functional nominal (Xf ): The func-
tional nominal corresponds to the position ofthe process mean with the lowest possible fall-out rate. The functional nominal corresponds tothe optimum process adjustment achieved onlyby mean adjustment, i.e., shift of the processmean without changing the variance or otherdistribution characteristics. This involves deter-mining the location of A such that: (i) A ∩F = Ø, i.e., COA(F) = Ø; and (ii) maximizingthe minimum distance of X to the FC-Spaceboundaries.
3.2. Functional capability index (FCpk): The distance ofthe current process mean to the functional nominaldetermines the mean location index FCpk.
The outline of the proposed approach is shown in Fig. 7.
2. Generation of process space (A)
This section focuses on determining a kernel estimate ofthe unknown population p.d.f. f . The confidence inter-vals obtained from the analysis are shown in Fig. 8. Themethodology for estimating f is based on Polansky (2001)and consists of the following steps.
Step 1. Select a kernel function K to estimate the p.d.f. fof a given measurement sample
Step 2. Estimate the optimum bandwidth matrix (H) thatminimizes the mean square error between the es-timated fallout rate and the actual fallout rate forthe sample data.
Step 3. Determine of the confidence intervals based on theestimated p.d.f. f .
The p.d.f. of the measurements f is estimated based onn random samples with measurements X1, X2, . . . , Xn.Each sample measurement Xi consists of m measurementsXi = [Xi1, . . . , Xim].
The kernel function used in the analysis is the multivari-ate Epanechnikov kernel based on Wand and Jones (1995)and Polansky (2001), who suggest that Epanechnikov ker-nels are generally optimal.
Dow
nloa
ded
by [
Uni
vers
ity o
f W
yom
ing
Lib
rari
es]
at 1
0:57
04
Oct
ober
201
3

100 Mannar and Ceglarek
Fig. 7. Outline of the proposed methodology.
Fig. 8. KDE confidence regions and failure regions.
The bandwidth matrix H is a symmetric positive def-inite d × d matrix and defines kernel function KH(x) =|H|−1/2 K(H−1/2x). The d-variate kernel-density estimate off is given by
f (x; H) = n−1n∑
i=1
KH(x − Xi ) for all x ∈ Rm. (5)
The kernel-based estimate of process fallout p(H) is givenby (Polansky, 2001):
p(H) = 1 −∫
FR
f (x; H)dx −∫
TFR
f (x; H)dx
= 1 − n−1( n∑
i=1
∫FR
KH(x − Xi )dx
+n∑
i=1
∫TFR
KH(x − Xi )dx. (6)
Dow
nloa
ded
by [
Uni
vers
ity o
f W
yom
ing
Lib
rari
es]
at 1
0:57
04
Oct
ober
201
3

Process capability, process adjustment, quality 101
The Mean Squared Error (MSE) of the above estimator iscomputed by
MSE[ p(H)] = E[ p(H) − p]2. (7)
The estimation of the optimal bandwidth using Equation(7) is done using the bootstrap-based approach suggestedby Polansky (2001).
Based on the above mentioned procedure we estimate thep.d.f. f which is used to determine various confidence in-tervals of interest (for example, 99.73% confidence intervalcorresponding to six-sigma variation). Figure 8 shows anexample of the KDE-based confidence regions.
3. Functional process capability space (FC-Space)
This section focuses on the determination of FC-Space andprocess capability FCp index.
3.1. Determination of the restricted adjustment spaceCOA(F)
The different KDE confidence regions generated areapproximated by the minimum convex polyhedron thatcompletely surrounds each of these confidence regions. Aseparate analysis is conducted for each confidence regionto determine the FC-Space corresponding to the differentconfidence regions required. For example, if a 99.73% con-fidence region is used then the FC-Space corresponding tothis region is obtained.
In general, failure space F can consist of multiple failureregions: kW defined as number of in-specs failure regionsFin-spec and kT defined as number of out-of-specs failureregions Fout-of-spec as shown in Equation (8):
F =kW⋃j=1
Fin−spec +kT⋃
j=1
Fout-of-spec. (8)
COA(F) consists of coordinates x in the Cad j -Space wherein(A)x ∩ Bi �= Ø∀Fi ∈ F
COA(Fi ) = {x ∈ Cad j − Space|(A)x ∩ Fi �= Ø}. (9)
COA(F) = KF+KT∪j=1
COA(F j ). (10)
If c is a given location of A defined by the mean location xc,then (A)xc = xc ⊕ (A)x0 . The operation ⊕, between anytwo objects A and B is defined as
A ⊕ B = {a + b|a ∈ A, b ∈ B} and A B= A ⊕ (−B), (−B) = {−b|b ∈ B}.
The operations of ⊕ and can be used to identify restrictedadjustment space COA(F j ) as shown in Equation (11):
COA(F j ) = F j (A)x0 . (11)
The equation COA(F j ) = F j (A)x0 is equivalent toCOA(F j ) = F j ⊕ (−(A)x0 ), where −(A)x0 = x0 − ai∀ai ∈
V, V is the set of all vertices of A. The calculation ofCOA(F j ) involves the sum of F j and −(A)x0 which is per-formed by using the Minkowski sum defined as follows:
(−A) ⊕ F j = {x + y|x ∈ (−A), y ∈ F j }. (12)
The calculation is performed based on the algorithm pro-posed by Lozano-Perez (1980) which firsts converts any setA into a convex polygon denoted by Conv(.) and vert(.)denotes the vertices of the convex polygon generated for Fand A. Lozano-Perez (1980) shows that if A and F j are con-vex then COA(F j ) is convex and COA(F j ) can be calculatedusing Equations (13) and (14):
COA(F j ) = conv(vert(F j ) − vert((A)x0 )). (13)COA(F j ) = F j ⊕ (−(A)x0 ). (14)
3.2. Determination of FC-Space and capability index F Cp
Based on Equation (14) individual COA(F j ) are calculatedto determine COA(F) which is then used to calculate theFC-Space as:
FC − Space = Cad j Space − COA(F). (15)
The generated FC-Space is a polygon since it is formedby the combination of Cad j -Space and COA(F) which arerepresented as polygons.
Finally, the volume of the FC-Space corresponding to99.73% confidence region defines the current process capa-bility, FCp = vol(FC − Space99/73%). Figure 9 shows theFC-Space corresponding to 99.73% confidence region. Aseries of FC-Spaces can be generated for different confi-dence regions as shown in Fig. 10.
Fig. 9. FC-Space for 99.73% confidence interval correspondingto MCpm ≥ 1.
Dow
nloa
ded
by [
Uni
vers
ity o
f W
yom
ing
Lib
rari
es]
at 1
0:57
04
Oct
ober
201
3
102 Mannar and Ceglarek
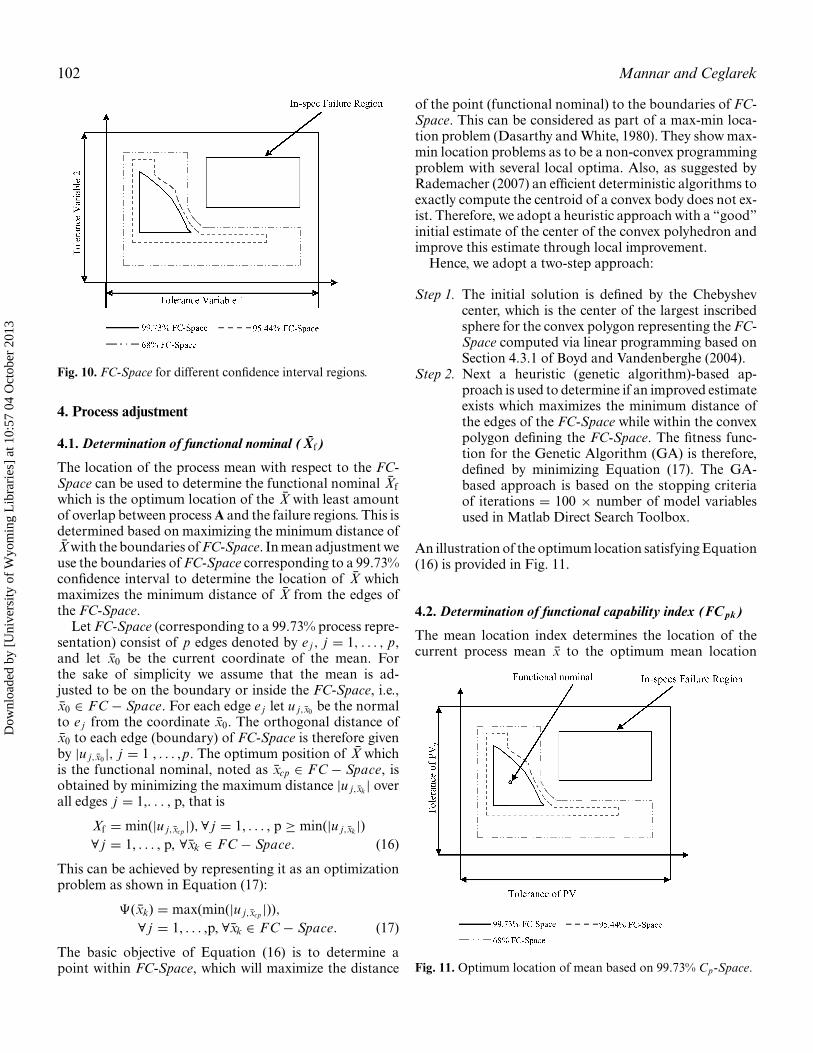
Fig. 10. FC-Space for different confidence interval regions.
4. Process adjustment
4.1. Determination of functional nominal (Xf)
The location of the process mean with respect to the FC-Space can be used to determine the functional nominal Xfwhich is the optimum location of the X with least amountof overlap between process A and the failure regions. This isdetermined based on maximizing the minimum distance ofX with the boundaries of FC-Space. In mean adjustment weuse the boundaries of FC-Space corresponding to a 99.73%confidence interval to determine the location of X whichmaximizes the minimum distance of X from the edges ofthe FC-Space.
Let FC-Space (corresponding to a 99.73% process repre-sentation) consist of p edges denoted by e j , j = 1, . . . , p,and let x0 be the current coordinate of the mean. Forthe sake of simplicity we assume that the mean is ad-justed to be on the boundary or inside the FC-Space, i.e.,x0 ∈ FC − Space. For each edge e j let u j,x0 be the normalto e j from the coordinate x0. The orthogonal distance ofx0 to each edge (boundary) of FC-Space is therefore givenby |u j,x0 |, j = 1 , . . . ,p. The optimum position of X whichis the functional nominal, noted as xcp ∈ FC − Space, isobtained by minimizing the maximum distance |u j,xk| overall edges j = 1,. . . , p, that is
Xf = min(|u j,xcp |), ∀ j = 1, . . . , p ≥ min(|u j,xk|)∀ j = 1, . . . , p, ∀xk ∈ FC − Space. (16)
This can be achieved by representing it as an optimizationproblem as shown in Equation (17):
�(xk) = max(min(|u j,xcp |)),∀ j = 1, . . . ,p, ∀xk ∈ FC − Space. (17)
The basic objective of Equation (16) is to determine apoint within FC-Space, which will maximize the distance
of the point (functional nominal) to the boundaries of FC-Space. This can be considered as part of a max-min loca-tion problem (Dasarthy and White, 1980). They show max-min location problems as to be a non-convex programmingproblem with several local optima. Also, as suggested byRademacher (2007) an efficient deterministic algorithms toexactly compute the centroid of a convex body does not ex-ist. Therefore, we adopt a heuristic approach with a “good”initial estimate of the center of the convex polyhedron andimprove this estimate through local improvement.
Hence, we adopt a two-step approach:
Step 1. The initial solution is defined by the Chebyshevcenter, which is the center of the largest inscribedsphere for the convex polygon representing the FC-Space computed via linear programming based onSection 4.3.1 of Boyd and Vandenberghe (2004).
Step 2. Next a heuristic (genetic algorithm)-based ap-proach is used to determine if an improved estimateexists which maximizes the minimum distance ofthe edges of the FC-Space while within the convexpolygon defining the FC-Space. The fitness func-tion for the Genetic Algorithm (GA) is therefore,defined by minimizing Equation (17). The GA-based approach is based on the stopping criteriaof iterations = 100 × number of model variablesused in Matlab Direct Search Toolbox.
An illustration of the optimum location satisfying Equation(16) is provided in Fig. 11.
4.2. Determination of functional capability index (FC pk)
The mean location index determines the location of thecurrent process mean x to the optimum mean location
Fig. 11. Optimum location of mean based on 99.73% Cp-Space.
Dow
nloa
ded
by [
Uni
vers
ity o
f W
yom
ing
Lib
rari
es]
at 1
0:57
04
Oct
ober
201
3

Process capability, process adjustment, quality 103
Table 1. Comparison of traditional and functional capabilityanalysis
Traditionalcapability Functional capability
Interpretation analysis analysis
Aggregated capability MCpm FC-Spaceindex
Dispersion capability Cp Fcp = vol(Fc99.73%)index
Optimum mean location Design Functional nominalcalculation nominal
Process mean location 1D
FCpk
index Distance of process meanto optimum position
determined by the functional nominal Xf :
FCpk = dist(x, Xf ). (18)
5. Relationship of FC-Space to the multivariatecapability index
In this section, we compare the functional capability in-dices as proposed in this paper to traditional multivariatecapability indices.
In the past few years, researchers have developed severalmultivariate capability indices (Cheng, 1991; Taam et al.,1993; Shariari et al., 1995). A comparison conducted byWang et al. (2000) indicate that these capability indicesshare a close relationship in calculation and interpretation.Therefore, for consistency we select definitions proposedby Taam et al. (1993) to illustrate the relationships betweenfunctional and traditional capability indices.
Table 1 shows the comparison of the traditional capabil-ity analysis with the proposed functional capability analysisbased on the FC-Space.
5.1. Traditional capability analysis
The multivariate capability index, MCpm, is defined as fol-lows (Taam et al., 1993):
MC pm = Cp
D. (19)
The index can be decomposed into two segments based onthe numerator and denominator.
1. Dispersion capability index Cp: Calculation of Cp isbased on the ratio of the tolerance volume to the pro-cess dispersion volume. The calculation is performedafter modification of either the tolerance region or pro-cess region to have the same general geometric shape,i.e., for the case of a normality assumption, either thetolerance is modified to have an elliptical shape as the
Fig. 12. Traditional capability index calculation.
process confidence region, or the process confidence re-gion is modified to be rectangular. Figure 12 illustratesthe modification of tolerance region into elliptical shapefor Cp calculation:
Cp = vol (Tolerance region)vol (esimated 99.73% process region)
. (20)
2. Process mean capability index 1/D: The distance of theprocess mean to the design nominal, D, can be calculatedas
D =[
1 + nn − 1
(X − µ0)′S−1(X − µ0)]1/2
(21)
Values of 0 < 1/D < 1 measure the closeness of the de-sign nominal Xd to sample mean. The maximum valueof 1/D = 1 is achieved when the process is centered atthe design nominal Xd, then the MCPM = CP.
The calculations of the MCpm assume that the designnominal is the “ideal” process location. However, the cur-rent process capability indices do not consider the in-specsfailure region(s) which could result in higher errors whenapproximating the same geometric shape.
5.2. Functional capability analysis
The proposed functional capability analysis generalizes thecurrently used capability index MCpm by incorporating in-specs failure regions and non-parametric estimates for con-fidence regions.
Corresponding to the MCpm index we can use the bound-aries generated by FC-Space to determine the overall pro-cess capability. In traditional capability analysis a valueof MCpm = 1 signifies that 99.73% of the process valueslie within the tolerance region, providing a process falloutrate of 0.27%. In the functional capability this process fall-out rate is guaranteed by the 99.73% boundary for the
Dow
nloa
ded
by [
Uni
vers
ity o
f W
yom
ing
Lib
rari
es]
at 1
0:57
04
Oct
ober
201
3
104 Mannar and Ceglarek
tolerance region and interior fault regions and thus,MCpm > FCp.
The two parts of the traditional process capability in-dex MCpm, the numerator and denominator in Equation(19), have a close relationship with the functional capabilityindices and can be described as follows:
1. Dispersion functional capability index FCp: The processfunctional capability index Fcp = vol(Fc99.73%) repre-sents the 99.73% volume of the FC-Space. This volumetakes into account the shape and location of the in-specs failure regions, tolerance boundaries and processspread determined by KDE confidence region. Highervalues for FCp denote a smaller process spread com-pared to the available tolerance volume, which is similarto traditional Cp.
However, traditional Cp calculation is based on theapproximation of the process region and tolerance win-dow, which is understood to have the same geometricshape and thus results in larger errors in the case ofin-specs failure regions and non-parametric confidenceregions.
2. Actual functional capability index (FCpk): Since the lo-cation of process mean depends on in-specs failure re-gions and the KDE confidence region, the functionalnominal is different from the design nominal. Section4 discusses the determination of the functional nomi-nal. The distance of the optimum functional nominalfrom the current mean determines the FCpk which is ameasure of process actual capability index.
6. Case study
The presented methodology of capability adjustment usingFC-Space to monitor manufacturing measurements within-specs failure regions is illustrated using an industrial casestudy from cell phone manufacturing. The case study ana-lyzes warranty failures of a high-end consumer cell-phonemodel from the iDEN phone family introduced in 200l.Mannar and Ceglarek (2006) identify two critical manufac-
Fig. 13. Scatter plot (869 samples).
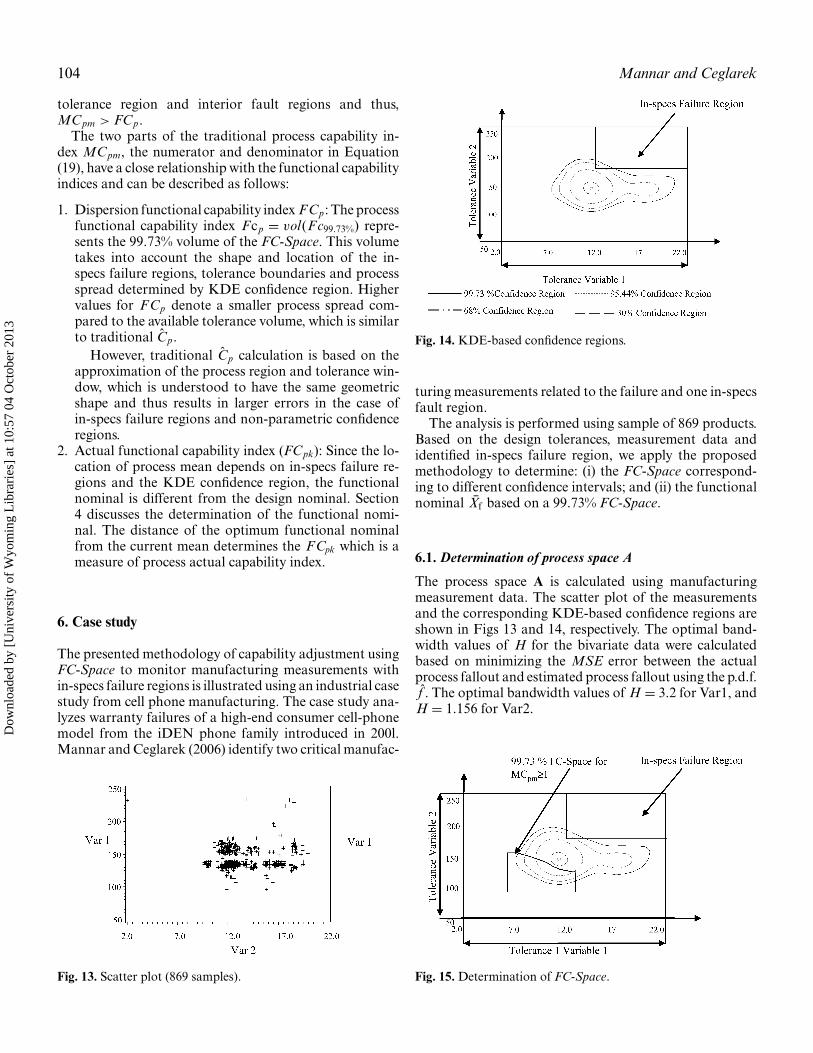
Fig. 14. KDE-based confidence regions.
turing measurements related to the failure and one in-specsfault region.
The analysis is performed using sample of 869 products.Based on the design tolerances, measurement data andidentified in-specs failure region, we apply the proposedmethodology to determine: (i) the FC-Space correspond-ing to different confidence intervals; and (ii) the functionalnominal Xf based on a 99.73% FC-Space.
6.1. Determination of process space A
The process space A is calculated using manufacturingmeasurement data. The scatter plot of the measurementsand the corresponding KDE-based confidence regions areshown in Figs 13 and 14, respectively. The optimal band-width values of H for the bivariate data were calculatedbased on minimizing the MSE error between the actualprocess fallout and estimated process fallout using the p.d.f.f . The optimal bandwidth values of H = 3.2 for Var1, andH = 1.156 for Var2.
Fig. 15. Determination of FC-Space.
Dow
nloa
ded
by [
Uni
vers
ity o
f W
yom
ing
Lib
rari
es]
at 1
0:57
04
Oct
ober
201
3

Process capability, process adjustment, quality 105
Fig. 16. Optimum mean adjustment.
6.2. Determination of FC-Space
The FC-Space was calculated following the approach de-scribed in Section 3. The FC-Space corresponding to the99.73% confidence region is shown in Fig. 15. Figure 16shows the FC-Space obtained for varying confidence inter-vals. Figure 16 also shows the design nominal Xd = (12.5,154.5) and the obtained functional nominal Xf = (10.08,124.95).
The case study also illustrates the importance of iden-tifying the minimum subset of manufacturing parametersrelated to the failure (Mannar and Ceglarek, 2006). Thisis important since the proposed methodology is based onKDE-based process representation and Minkowski sum–based determination of FC-Space, which are computation-ally expensive and have estimation bias in higher dimen-sions. The current state of the art in calculation of theMinkowski sum for FC-Space calculation (Varadhan andManocha, 2006) and KDE estimation (Scott and Sain,2004) can handle at least three dimensions.
7. Conclusions and future work
This paper focuses on functional process capability anal-ysis and mean adjustment for processes that have in-specs(within tolerance) failure identified during manufactur-ing or field phase of the Product Life-cycle Management(PLM). The consideration of in-specs failures is of criticalimportance in integrating design, manufacturing and ser-vice engineering in the product PLM paradigm. Currentprocess capability and adjustment methods lead to incor-rect results in the presence of in-specs failure regions.
In order to address this problem, we presented a genericmethodology to handle multiple in-specs failure regionswithin the DPs or PVs tolerances (in-specs). The proposedFC-Space methodology maps the in-specs failure regionsand design tolerance space into the adjustment space of the
process mean to determine regions, that ensure a requiredprocess capability.
The process space consists of confidence regions that aregenerated using KDE-based non-parametric estimation ofthe distribution of the measurements. A series of FC-Spacesis generated corresponding to varying confidence intervalswhich can be used to determine current process capability.Based on the FC-Space99.73% generated for 99.73% confi-dence interval we estimate the potential functional capabilityindex FCp.
In addition, we determined the optimum process locationdefined as the functional nominal which ensures the lowestprocess overlap with corresponding tolerance and failureregions; and actual functional capability index FCpk.
The relationship between functional capability and tradi-tional multivariate process capability is discussed. The pro-posed methodology is illustrated using a case study fromcell-phone manufacturing.
Acknowledgements
The authors acknowledge the financial support provided bya UK STAR Award EP/E044506/1 and Motorola Corp.The authors would like to acknowledge Ashutosh Katiyar,ZS Associates, Princeton, NJ, for his initial work on thepaper as well as Dr. Feng Niu and Bassam Bafaraj, Mo-torola for their discussions related to the warranty issues inelectronic manufacturing.
References
Boyd, S.P. and Vandenberghe, L. (2004) Convex Optimization, CambridgeUniversity Press, Cambridge, UK.
Ceglarek, D., Huang, W., Zhou, S., Ding, Y., Kumar, R. and ZhouY. (2004) Time-based competition in manufacturing: stream-of-variation analysis (SOVA) methodology-review. International Jour-nal of Flexible Manufacturing Systems, 16(1), 11–44.
Ceglarek, D. and Shi, J. (1995) Dimensional variation reductionfor automotive body assembly. Manufacturing Review, 8(2),139–154.
Chakraborti, S., Van der Laan, P. and Bakir, S.T. (2001) Nonparametriccontrol charts: an overview and some results. Journal of QualityTechnology, 3, 304–315.
Chen, H. (1994) A multivariate process capability index over a rectangularsolid zone. Statistica Sinica, 4, 749–758.
Chen, Y., Ding, Y., Jin, J. and Ceglarek, D. (2006) Integration of toleranceand maintenance design for multi-station manufacturing processes.IEEE Transactions on Automation Science and Engineering, 3(4),440–453.
Cheng, S.W., Chang, L.K. and Spiring, F.A. (1991) A multivariate mea-sure of process capability cpm. International Journal of Modelingand Simulation, 11, 1–6.
Dasarathy, B. and White, L.J. (1980) A maximin location problem. Op-erations Research, 28(6), 1385–1401.
Ding, Y., Ceglarek, D. and Shi, J. (2002a) Design evaluation ofmulti-station assembly processes by using state space approach.Transactions of ASME, Journal of Mechanical Design, 124(3),408–418.
Dow
nloa
ded
by [
Uni
vers
ity o
f W
yom
ing
Lib
rari
es]
at 1
0:57
04
Oct
ober
201
3

106 Mannar and Ceglarek
Ding, Y., Ceglarek, D. and Shi, J. (2002b) Fault diagnosis of multistagemanufacturing processes by using state space approach. Transac-tions of ASME, Journal of Manufacturing Science and Engineering,124(2), 313–322.
Ding, Y., Jin, J., Ceglarek, D. and Shi, J. (2005) Process-oriented toleranc-ing for multi-station assembly systems. IIE Transactions on Designand Manufacturing, 37(6), 493–508.
Droogenbroeck, M.V. and Buckley, M. (2005) Morphological erosionsand openings: fast algorithms based on anchors. Journal of Mathe-matical Imaging and Vision, 22(2–3), 121–142.
Foster, E.J., Barton, R.R., Gautam, N., Truss, L.T. and Tew, J.D. (2005)The process-oriented multivariate capability index. InternationalJournal of Production Research, 43(10), 2135–2148.
Hawkins, D.M. (1991) Multivariate quality control based on regression-adjusted variables. Technometrics, 33, 61–75.
Khan, A. and Ceglarek, D. (2000) Sensor optimization for fault diagnosisin multi-fixture assembly systems with distributed sensing. Transac-tions of ASME, Journal of Manufacturing Science and Engineering,122(1), 215–226.
Lozano-Perez, T. (1980) Spatial planning: a configuration space ap-proach. AI Memo 605, Artificial Intelligence Laboratory, Mas-sachusetts Institute of Technology, Cambridge, MA.
Mannar, K. and Ceglarek, D. (2006) Fault region localization: productand process improvement based on field performance and manu-facturing measurements. IEEE Transactions on Automation Scienceand Engineering, 3(4), 423–439.
Mason, R.L. and Young, J.C. (2001) Implementing multivariate statisticalprocess control using Hotelling’s T2 statistic. Quality Progress, 34(4),71–73.
Matheron, G. and Serra, J. (1988) Image Analysis and Mathematical Mor-phology Volume 2: Theoretical Advances, Academic Press, London.
Montgomery, D.C. (2005) Introduction to Statistical Quality Control, fifthedition, Wiley, New York, NY.
Polansky, A.M. (2001) A smooth nonparametric approach to multivari-ate process capability. Technometrics, 43(2), 199–211.
Polansky, A.M. (2005) A general framework for constructing controlcharts. Quality and Reliability Engineering International, 21(6), 633–653.
Rademacher, L.A. (2007) Approximating centroid is hard, in Proceedingsof 23rd Annual Symposium on Computational Geometry, pp. 302–305.
Scott, D.W. (1992) Multivariate Density Estimation: Theory, Practice andVisualization, Wiley, New York, NY.
Scott, D.W. and Sain, S.R. (2005) Multi-dimensional density estimation,in Handbook of Statistics, Data Mining and Computational Statistics,Rao, C.R. and Wegman, E.J. (eds), Elsevier, Amsterdam, pp. 229–261.
Shahriari, H., Hubele, N.F. and Lawrence, F.P. (1995) A multivariateprocess capability vector, in Proceedings of the Fourth IndustrialEngineering Research Conference, pp. 304–309.
Shiu, B.W., Apley, D., Ceglarek, D. and Shi, J. (2003) Tolerance allocationfor sheet metal assembly using beam-based model. IIE Transactionson, Design and Manufacturing, 35(4), 329–342.
Silverman, B.W. (1986) Density Estimation for Statistics and Data Anal-ysis, Chapman & Hall, London, UK.
Skinner, K.R., Montgomery, D.C., Runger, G.C., Fowler, J.W.,McCarville, D.R., Rhoads, T.R. and Stanley, J.D. (2002) Multi-variate statistical methods for modeling and analysis of wafer probetest data. IEEE Transaction on Semiconductor Manufacturing, 15(4),523–530.
Sun, R.X. and Tsung, F. (2003) A kernel-distance-based multivariatecontrol chart using support vector methods. International Journalof Production Research, 41(13), 2975–2989.
Taam, W., Subbaiah, P. and Liddy, J.W. (1993) A note on multivariatecapability indices. Journal of Applied Statistics, 20(3), 339–351.
Takata, S., Kimura, F., Van Houten F.J.A.M., Westkamper, E., Shpi-talni, M., Ceglarek D. and Lee, J. (2004) Maintenance: changingrole in life cycle management. Annals of the CIRP, 53(2), 643–655.
Varadhan, G. and Manocha, D. (2006) Accurate Minkowski sum approx-imation of polyhedral models. Graphical Models, 68(4), 343–355.
Wand, M.P. and Jones M.C. (1995a) Kernel Smoothing, Chapman andHall, London, UK.
Wand, M.P. and Jones, M.C. (1995b) Multivariate plug-in bandwidthselection. Computational Statistics, 9, 97–116.
Wang, F.K., Hubele, N.F., Lawrence, F.P., Miskulin, J.D. and Shahri-ari, H. (2000) Comparison of three multivariate process capabilityindices. Journal of Quality Technology, 32(3), 263–275.
Zhou, S., Ding, Y., Chen, Y. and Shi, J. (2003) Diagnosability study ofmultistage manufacturing processes based on linear mixed-effectsmodels. Technometrics, 45(4), 312–325.
Biographies
Kamal Mannar received his B.Tech. degree in Mechanical Engineeringfrom the National Institute of Technology Karnataka, India in 2001,an M.S. degree in Manufacturing Systems Engineering from the Uni-versity of Wisconsin–Madison in 2005 and a Ph.D. degree in Industrialand Systems Engineering from the University of Wisconsin-Madisonin 2006. He is currently working as a Knowledge Engine DevelopmentLeader of Global Services Technology, General Electric Health Care,Pewaukee, Wisconsin. His research interests include methodologies fordiagnosis and prediction of warranty and field failures, remote diagnosisand prediction for health care equipment and use of field performance asfeedback to design and manufacturing to improve product robustness.
Dariusz (Darek) Ceglarek received his Ph.D. degree in Mechanical En-gineering from the University of Michigan–Ann Arbor in 1994. He wason the research faculty at the University of Michigan-Ann Arbor from1995 to 2000. In 2000, he accepted an appointment at the University ofWisconsin–Madison as an Assistant Professor in the Department of In-dustrial and Systems Engineering where he rose to the ranks of AssociateProfessor and Professor in 2003 and 2005, respectively. Since 2006 he isProfessor and EPSRC Research Chair at the University of Warwick, UK.He is a Fellow of CIRP. He served as Chair of the Quality, Statistics andReliability Section of the Institute of Operations Research and Manage-ment Sciences (INFORMS); Program Chair for the American Societyof Mechanical Engineers (ASME) Design-for-Manufacturing Life Cycle(DFMLC) Conferences, Associate Editor of IEEE Transactions (TASE)and Associate Editor of ASME Transactions, Journal of ManufacturingScience and Engineering. His research focuses on product life cycle mod-eling and analysis with emphasis on production and healthcare systemsconvertibility, scalability and 6-sigma quality and root cause analysis dur-ing design, manufacturing and service phases. He has published widelyin his research areas with more than 60 papers in leading journals. Twoof his paper received Best Paper Awards from the ASME ManufacturingEngineering Division and ASME Design Engineering Division. He hasreceived numerous awards including in 2007 a UK EPSRC STAR Award(granted to an “exceptional senior faculty, recognised international leaderin his/her research field”), US National Science Foundation (NSF) 2003CAREER Award (NSF’s “most prestigious awards in support of juniorfaculty who exemplify the role of teacher-scholars through outstandingresearch, excellent education and the integration of education and re-search”); 1999 Outstanding Research Scientist Award from the Collegeof Engineering at the University of Michigan; the 1998 Dell K. Allen Out-standing Young Manufacturing Engineer of the Year Award from the So-ciety of Manufacturing Engineers (SME). More information is posted at:http://digital.warwick.ac.uk/Digital-Product-Lifecycle-Management.
Dow
nloa
ded
by [
Uni
vers
ity o
f W
yom
ing
Lib
rari
es]
at 1
0:57
04
Oct
ober
201
3