functional genomic analysis of a commercial wine strain of...
TRANSCRIPT

Functional genomic analysis of a commercial wine strain ofSaccharomyces cerevisiae under di¡ering nitrogen conditions
Leilah E. Backhus a, Joseph DeRisi b, Patrick O. Brown c, Linda F. Bisson a;*a Department of Viticulture and Enology, University of California, Davis, One Shields Avenue, Davis, CA 95616-8749, USA
b Department of Biochemistry and Biophysics, University of California, San Francisco, San Francisco, CA 94143, USAc Department of Biochemistry, Stanford University School of Medicine, Howard Hughes Medical Institute, Stanford, CA 94305-5428, USA
Received 4 November 2000; received in revised form 26 March 2001; accepted 29 March 2001
First published online 20 April 2001
Abstract
DNA microarray analysis was used to profile gene expression in a commercial isolate of Saccharomyces cerevisiae grown in a syntheticgrape juice medium under conditions mimicking a natural environment for yeast: High-sugar and variable nitrogen conditions. The highnitrogen condition displayed elevated levels of expression of genes involved in biosynthesis of macromolecular precursors across the timecourse as compared to low-nitrogen. In contrast, expression of genes involved in translation and oxidative carbon metabolism wereincreased in the low-nitrogen condition, suggesting that respiration is more nitrogen-conserving than fermentation. Several genes underglucose repression control were induced in low-nitrogen in spite of very high (17%) external glucose concentrations, but there was no generalrelief of glucose repression. Expression of many stress response genes was elevated in stationary phase. Some of these genes were expressedregardless of the nitrogen concentration while others were found at higher levels only under high nitrogen conditions. A few genes, FSP2,RGS2, AQY1, YFL030W, were expressed more strongly with nitrogen limitation as compared to other conditions. ß 2001 Federation ofEuropean Microbiological Societies. Published by Elsevier Science B.V. All rights reserved.
Keywords: Microarray; Nitrogen limitation; Wine yeast
1. Introduction
A vast amount of research on the model eukaryote,Saccharomyces cerevisiae, has been conducted using labo-ratory strains under laboratory conditions. Laboratorymedia were designed to facilitate genetic analysis of thisyeast and bear little resemblance to the natural environ-ment of this organism. Saccharomyces is found in the wildassociated with grape surfaces, but is generally in minorproportions to other yeasts [1]. S. cerevisiae evolved todominate anaerobic growth on high-sugar substrates, forexample, crushed grapes. A typical environment in whichS. cerevisiae thrives is rich in sugar (20^25%, equimolarmixture of glucose and fructose), low in pH (pH 3.0^3.8)and nitrogen is most frequently the limiting nutrient forgrowth [2]. Many juices, however, contain ample amountsof all essential macro- and micronutrients. Under these
conditions, populations generally enter stationary phasedue to attainment of maximal cell density rather than tolimitation for any given nutrient. Cells retain high rates ofmetabolic activity and are competent for further growthupon reduction of the cell number. In contrast to labora-tory strains, natural and commercial isolates of Saccharo-myces are highly ethanol tolerant.
Nitrogen limitation imposes a nutritional stress on met-abolic activities of non-growing as well as growing cul-tures. Stationary phase rates of fermentation are not sus-tained under nitrogen limitation [3] and it has beensuggested that this is due to reduced viability [3]. Physio-logical analysis of this `typical' energy-su¤cient, nutrient-limited stationary phase has been limited. Several genescontrolled by the STRE element involved in response togeneral stress were shown to be expressed in commercialstrains during stationary phase in the absence of nutrition-al limitation [4].
The completion of the sequence of the genome of S.cerevisiae allowed development of tools for the evaluationof expression of the entire complement of genes encoded
1567-1356 / 01 / $20.00 ß 2001 Federation of European Microbiological Societies. Published by Elsevier Science B.V. All rights reserved.PII: S 1 5 6 7 - 1 3 5 6 ( 0 1 ) 0 0 0 1 9 - 8
* Corresponding author. Tel. : +1 (530) 752-3835;Fax: +1 (530) 752-0382; E-mail : [email protected]
FEMSYR 1413 10-7-01 Cyaan Magenta Geel Zwart
FEMS Yeast Research 1 (2001) 111^125
www.fems-microbiology.org
in the genome [5,6,7]. The goal of this study was to useDNA microarray hybridization analysis to comparemRNA expression pro¢les in cultures of a commercialwine yeast grown in a synthetic grape juice medium undernutrient-su¤cient and nitrogen-limited conditions in orderto analyze the physiological status of the two cultures atdi¡erent stages of growth. An aligned goal was the iden-ti¢cation of genes that might be associated with nutrientde¢ciency in stationary phase.
2. Materials and methods
2.1. Yeast strain and growth conditions
An isolate from the commercial wine strain of S. cere-visiae known as `French White' (UCD2100) was used forthis study (Red Star Yeast, Milwaukee, WI, USA).UCD2100 was selected for this analysis because it had amedian rate of fermentation in comparison to several oth-er strains that were tested in a pilot study. The mediumused was MMM `Minimal Must Medium' developed orig-inally by Giudici and Kunkee [8]. The medium was modi-¢ed as follows: proline, Casamino acids, ammonium phos-phate and ammonium hydroxide were excluded in order tolimit nitrogen. Medium pH was adjusted using potassiumhydroxide. Arginine was added as sole nitrogen source toa level of 1.24 g l31 for the high-nitrogen condition and to0.165 g l31 for the low-nitrogen fermentation. MMM issomewhat unstable and tends to develop a tartrate precip-itate upon aging of the components, so the medium wasmade and sterilely ¢ltered immediately prior to inocula-tion.
Cells were pre-grown in 5 ml of MMM to saturation(OD580 nm = 10) on a roller drum at room temperature toearly stationary phase (approximately 48 h). The cells wereharvested by centrifugation, rinsed once and resuspendedin MMM with the appropriate nitrogen concentration.Cultures for subsequent total RNA preparations weregrown in 1 l of medium (in a 2-l £ask), and inoculatedwith approximately 106 cells ml31. Replicate fermentationswere conducted and the cells pooled for the mRNA iso-lation. Cultures were grown at 30³C with moderate agita-tion (100 rpm). Under typical industrial conditions, car-bon dioxide evolution maintains cells in suspension andthere is very little settling. Moderate agitation was usedto mimic this situation. At the times indicated, portions ofthe cultures were harvested for mRNA preparation. Flaskswere swirled to resuspend settled biomass, transferred tocentrifuge tubes and centrifuged at 3000 rpm for 5 min atroom temperature (approximately 27³C) to avoid a tem-perature shock to the culture. Cell pellets were resus-pended, transferred to 1.5-ml Eppendorf tubes and frozenimmediately in liquid nitrogen and then transferred to380³C until used for mRNA preparation. A bench toprefractometer (Fisher) was used to determine total sugar
present at time of sampling. A standard curve usingMMM with decreasing amounts of sugar and increasingamounts of ethanol was created in order to correct fordeviation due to ethanol. Samples were clari¢ed by centri-fugation prior to analysis.
2.2. Preparation of mRNA and microarray analysis
Total RNA was extracted using standard protocols [9]and mRNA puri¢ed using Pharmacia Biotech oligo(dT)cellulose columns following manufacturer's instructionswith the following modi¢cations as suggested by C. Siedel :mRNA was selected with one pass over the column ratherthan two, linear acrylamide was used as a carrier for themRNA rather than glycogen, and samples were resus-pended in DEPC-treated water instead of TE bu¡er.
Fabrication of DNA microarrays, synthesis of £uores-cently labeled cDNA and hybridization was as previouslydescribed [5^7]. The data were quanti¢ed using the pro-gram Scanalyze 1.1 [5^7]. An initial cluster analysis wasperformed to identify classes of genes displaying commonpatterns of expression [10]. Scanalyze 1.1 and the cluster-ing software are both available on the Internet atrana.stanford.edu/software. The complete microarraydata set is available at http://genome_www4.stanford.edu/MicroAway/SMD/
3. Results and discussion
3.1. Growth conditions and experimental design
The commercial strain, French White, was selected forthese studies because it presented median values for sev-eral fermentation parameters in an initial screen of winestrains. To evaluate gene expression patterns under nativeconditions, cultures were prepared in a synthetic juice me-dium. Cells were grown in high (1.24 g l31) or low (0.165 gl31) arginine as sole nitrogen source. Arginine is generallypresent in high concentration in grape juice and serves asprinciple nitrogen source. Proline is also present at equalor greater concentrations in grape juice, but is not utilizedas a nitrogen source under anaerobic conditions. Sincelimited aeration was necessary in order to harvest samplesfor subsequent analysis, proline was omitted from the syn-thetic juice medium to more closely replicate actual fer-mentation conditions.
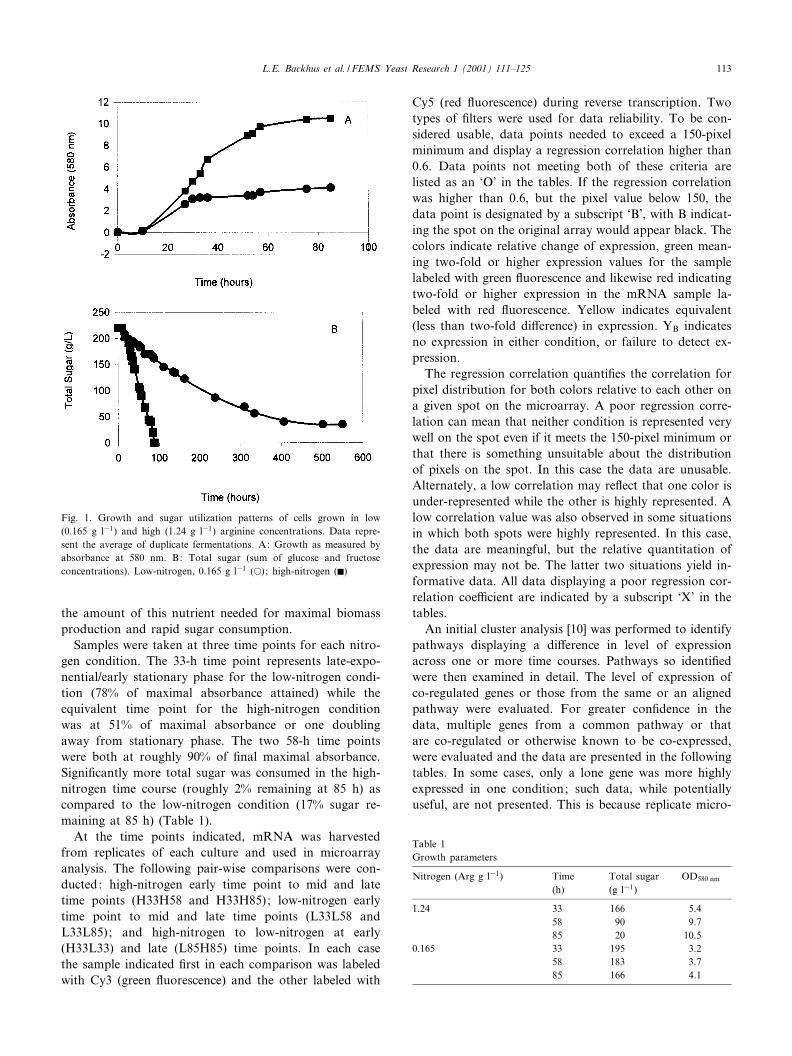
Cultures were monitored by absorbance and by glucoseand fructose concentration (Fig. 1). Extensive preliminaryexperiments were conducted to de¢ne the nitrogen condi-tions limiting for growth and fermentation. A minimalconcentration of 0.33 g l31 arginine was needed for com-plete utilization of sugar. The value of 0.165 g l31 wasselected for this study as being half of the concentrationrequired for consumption of sugar present. The high-nitro-gen concentration was selected as one that greatly exceeds
FEMSYR 1413 10-7-01 Cyaan Magenta Geel Zwart
L.E. Backhus et al. / FEMS Yeast Research 1 (2001) 111^125112
the amount of this nutrient needed for maximal biomassproduction and rapid sugar consumption.
Samples were taken at three time points for each nitro-gen condition. The 33-h time point represents late-expo-nential/early stationary phase for the low-nitrogen condi-tion (78% of maximal absorbance attained) while theequivalent time point for the high-nitrogen conditionwas at 51% of maximal absorbance or one doublingaway from stationary phase. The two 58-h time pointswere both at roughly 90% of ¢nal maximal absorbance.Signi¢cantly more total sugar was consumed in the high-nitrogen time course (roughly 2% remaining at 85 h) ascompared to the low-nitrogen condition (17% sugar re-maining at 85 h) (Table 1).
At the time points indicated, mRNA was harvestedfrom replicates of each culture and used in microarrayanalysis. The following pair-wise comparisons were con-ducted: high-nitrogen early time point to mid and latetime points (H33H58 and H33H85); low-nitrogen earlytime point to mid and late time points (L33L58 andL33L85); and high-nitrogen to low-nitrogen at early(H33L33) and late (L85H85) time points. In each casethe sample indicated ¢rst in each comparison was labeledwith Cy3 (green £uorescence) and the other labeled with
Cy5 (red £uorescence) during reverse transcription. Twotypes of ¢lters were used for data reliability. To be con-sidered usable, data points needed to exceed a 150-pixelminimum and display a regression correlation higher than0.6. Data points not meeting both of these criteria arelisted as an `O' in the tables. If the regression correlationwas higher than 0.6, but the pixel value below 150, thedata point is designated by a subscript `B', with B indicat-ing the spot on the original array would appear black. Thecolors indicate relative change of expression, green mean-ing two-fold or higher expression values for the samplelabeled with green £uorescence and likewise red indicatingtwo-fold or higher expression in the mRNA sample la-beled with red £uorescence. Yellow indicates equivalent(less than two-fold di¡erence) in expression. YB indicatesno expression in either condition, or failure to detect ex-pression.
The regression correlation quanti¢es the correlation forpixel distribution for both colors relative to each other ona given spot on the microarray. A poor regression corre-lation can mean that neither condition is represented verywell on the spot even if it meets the 150-pixel minimum orthat there is something unsuitable about the distributionof pixels on the spot. In this case the data are unusable.Alternately, a low correlation may re£ect that one color isunder-represented while the other is highly represented. Alow correlation value was also observed in some situationsin which both spots were highly represented. In this case,the data are meaningful, but the relative quantitation ofexpression may not be. The latter two situations yield in-formative data. All data displaying a poor regression cor-relation coe¤cient are indicated by a subscript `X' in thetables.
An initial cluster analysis [10] was performed to identifypathways displaying a di¡erence in level of expressionacross one or more time courses. Pathways so identi¢edwere then examined in detail. The level of expression ofco-regulated genes or those from the same or an alignedpathway were evaluated. For greater con¢dence in thedata, multiple genes from a common pathway or thatare co-regulated or otherwise known to be co-expressed,were evaluated and the data are presented in the followingtables. In some cases, only a lone gene was more highlyexpressed in one condition; such data, while potentiallyuseful, are not presented. This is because replicate micro-
Fig. 1. Growth and sugar utilization patterns of cells grown in low(0.165 g l31) and high (1.24 g l31) arginine concentrations. Data repre-sent the average of duplicate fermentations. A: Growth as measured byabsorbance at 580 nm. B: Total sugar (sum of glucose and fructoseconcentrations). Low-nitrogen, 0.165 g l31 (a); high-nitrogen (F)
Table 1Growth parameters
Nitrogen (Arg g l31) Time(h)
Total sugar(g l31)
OD580 nm
1.24 33 166 5.458 90 9.785 20 10.5
0.165 33 195 3.258 183 3.785 166 4.1
FEMSYR 1413 10-7-01 Cyaan Magenta Geel Zwart
L.E. Backhus et al. / FEMS Yeast Research 1 (2001) 111^125 113

arrays were not run which are necessary to di¡erentiatebetween a spurious spike and a real trend for a single gene.Except where indicated in the text, a 2.5-fold di¡erence inexpression or greater was used as the criterion of di¡er-ential expression. This is greater than the value of 2 de-termined from statistical analysis to indicate a di¡erence atthe 99.75% con¢dence level. However, replication is neces-sary for con¢dence in levels of expression at the lowerlimit of signi¢cance.
3.2. Relative replicative status of the samples
The growth data (Table 1) suggest that the earliest timepoint in high-nitrogen is in exponential growth while theothers are in late-exponential or stationary phase. To con-¢rm this assessment, levels of mRNA of the cyclin geneswere evaluated (Table 2). Cyclins are expressed at speci¢ctime points during the cell cycle (reviewed in [11]). Di¡er-ences in the appearance of cyclin mRNA in one popula-tion versus another would indicate corresponding di¡er-ences in the relative numbers of cells of the population atthat stage of the cell cycle. The late G1 cyclins [11], CLN1and CLN2, showed higher expression in the H33 sample,especially as compared to the late time point (H85) and tothe early time point of the low-nitrogen culture (L33).Likewise, the earliest time point of the low-nitrogen cul-ture displayed higher expression of the G1 cyclins than didthe later time points. Comparison of the latest time points
for both nitrogen conditions (L85H85) showed no di¡er-ence in cyclin expression. Thus, G1 cyclin gene expressionsuggests that more cells are entering the cell cycle in thenutrient su¤cient cultures and at earlier time points.
CLN3 expression was equivalent across most compari-sons as expected since this cyclin is thought to be synthe-sized constitutively [12], but was elevated in the L85 timepoint as compared to the earlier time point (L33). Thismay indicate that a higher percentage of this populationis in G0/early G1. Alternately, it could mean that a higherlevel of mRNA is needed to maintain Cln3p levels underthese starvation conditions. CLB1 expression was alsohigher in the earlier time points and at higher nitrogenconcentration. The late S phase cyclins [11], CLB3 andCLB4, showed an interesting trend of being more highlyexpressed at the midpoint of both the high- and low-nitro-gen time course. This may indicate that under these con-ditions S phase is elongated or that higher mRNA levelsare needed to maintain Clb3p and Clb4p levels. The cyclindata fully supported the assessment of culture replicativestatus from the absorbance measurements.
An alternate method to evaluate the relative replicativeactivities of two samples is to compare genes involved insynthesis of cytoplasmic components that would be re-quired for distribution to growing buds. The SEC genesde¢ne many components required for net cell wall andmembrane synthesis as well as for synthesis of endoplas-mic reticulum and Golgi components [13]. Similarly, the
Table 2Analysis of cyclin genes
O indicates unusable data; Y indicates no di¡erence in level of expression and YB means expression below detection limit of 150 pixels. G indicatestwo-fold or higher expression under conditions labeled with green £uorescence and R means two-fold or higher expression under conditions labeledwith red £uorescence. Condition labeling color is indicated by the color of shading around the time point.
Table 3Expression of genes for protein synthesis, degradation and localization
See legend to Table 2. Y to R indicates that genes of the family displayed no di¡erences in expression (Y) or tended to be elevated under R-labelingconditions. Similarly, Y to G indicates no di¡erences with a tendency of several genes to be elevated in the G-labeling conditions.
FEMSYR 1413 10-7-01 Cyaan Magenta Geel Zwart
L.E. Backhus et al. / FEMS Yeast Research 1 (2001) 111^125114

yeast cytoplasm contains a proteolytic particle, the protea-some, involved in protein turnover, the components ofwhich are encoded by the PRE genes [14]. Evaluation ofPRE and SEC gene expression (Table 3) indicated verylittle di¡erence across the comparisons. The only excep-tion was a tendency for SEC gene expression to be greaterin the H33 time point as compared to the same time pointfrom the low-nitrogen case (L33). The Y to G designationfor the H33 to L33 comparison indicates that while severalSEC genes showed an increase in expression in the H33sample, the fold di¡erence was near 2, the limit of signi¢-cance.
Ribosomal protein expression (RPL and RPS genes[15]) was evaluated to determine relative translational ac-
tivity of the time points. It was expected that relativetranslational activity would correlate with relative replica-tive activity, but this was not the case (Table 3). Instead,there was higher expression of the RPL and RPS genes inthe low-nitrogen time points as compared to the high-ni-trogen time course. The RPL and RPS genes displaying a2.4-fold increase or greater in the H33 versus H85 sampleswere: RPL2A, RPL2B, RPL4A, RPL5A, RPL6A, RPL9B,RPL13, RPL14A, RPL15A, RPL16B, RPL17, RPL17B,RPL19A, RPL27B, RPL30A, RPL30B, RPL41A,RPL45, RPS5, RPS10A, RPS13C, RPS18B, RPS21,RPS24A, RPS26A, RPS26B, RPS28A, RPS31A andRPS33B. In the case of the H33 to L33 comparison, sev-eral ribosomal genes were expressed at or around a two-
Table 4Carbon metabolism genes
See legend to Table 2. Subscript `x' indicates poor correlation coe¤cient (6 0.6).
FEMSYR 1413 10-7-01 Cyaan Magenta Geel Zwart
L.E. Backhus et al. / FEMS Yeast Research 1 (2001) 111^125 115

fold di¡erence, higher in L33. Because of nearness to thelower limit of signi¢cance this is indicated as `Y to R' inTable 3. The genes showing an increase in L33 are:RPLA3, RPL14B, RPL17, RPL17A, RPL25, RPL27,RPL32, RPL35B, RPL35A, RPL43A, RPL46, RPS12,RPS16A, RPS24EA, RPS24EB, RPS25, and RPS25B. In-terestingly, with the exception of RPL17, the ribosomalprotein genes showing a di¡erence in expression are notthe same. In contrast, at the later time point comparison(L85 H85), the fold di¡erence in gene expression wasgreater (2.5 or above) in the L85 sample for the followinggenes: RPL1, RPL2A, RPL2B, RPLA1, RPLA2, RPLA3,RPL5A, RPL6A, RPL6B, RPL9A, RPL9B, RPL13,RPL13A, RPL14A, RPL14B, RPL15A, RPL15B,RPL17, RPL17A, RPL17B, RPL19A, RPL19B, RPL25,RPL27, RPL27B, RPL30A, RPL30B, RPL32, RPL35A,RPL35B, RPL37A, RPL37B, RPS7A, RPS7B, RPS8A,RPS8B, RPS10A, RPS12, RPS13C, RPS16A, RPS16B,RPS18A, RPS18B, RPS21, RPS24A, RPS24EA,RPS24EB, RPS25, RPS26A, RPS26B, RPS27B,
RPS28A, RPS28B, RPS30, RPS31, RPS31A andRPS31B.
An increase in mRNA levels of ribosomal genes underconditions of nitrogen limitation has been noted before.Carbon source upshift of nitrogen-starved cells leads to atwo-fold increase in expression of the RPL and RPS genes[13]. The increase in RPL and RPS gene expression ob-served here suggests that an increase in expression of thesemay be sustained under conditions resembling the yeastnatural environment. In the low-nitrogen time course sug-ar levels are still quite high while this substrate is neardepletion in the high-nitrogen culture at this time.
3.3. Genes of carbon metabolism
The sugar consumption data suggested greater fermen-tative activity in the high-nitrogen time course as com-pared to the low-nitrogen condition. In general, mRNAlevels for many of the glycolytic genes were higher in theH33 condition as compared to later time points of high-
Table 5TCA cycle, glyoxylate and respiration genes
See legends to Tables 2 and 4.
FEMSYR 1413 10-7-01 Cyaan Magenta Geel Zwart
L.E. Backhus et al. / FEMS Yeast Research 1 (2001) 111^125116

nitrogen and to the early time point of the low-nitrogensample (Table 4). Interestingly, at the late time point, 85 h,expression of the glycolytic genes appears to be greater forthe low-nitrogen condition (L85), as compared to high-
nitrogen (H85). While much of the data show a low cor-relation coe¤cient, many of the messages showing thesame trend are fully usable data. While surprising, thisobservation is very consistent with the higher translational
Table 6Genes controlled by glucose repression
See legends to Tables 2 and 4.
Table 7Amino acid biosynthesis genes
See legends to Tables 2 and 4.
FEMSYR 1413 10-7-01 Cyaan Magenta Geel Zwart
L.E. Backhus et al. / FEMS Yeast Research 1 (2001) 111^125 117

activity of the low-nitrogen late time point, and suggeststhat the translational capacity is needed for continued syn-thesis of enzymes engaged in carbon catabolism.
Genes of the pentose phosphate pathway showed a sim-ilar trend (Table 4), with no di¡erences in expression inthe high-nitrogen time course, but with greater expressionin the late time point of the low-nitrogen sample. Therelative activities of the TCA cycle and of respirationwere also evaluated (Table 5). In general, level of expres-sion of these genes did not vary consistently across thehigh-nitrogen time course. The di¡erences noted were gen-erally at the limit of signi¢cance (at or around a two-folddi¡erence in expression). Some were elevated at the earlytime point (FUM1, IDP1), while others were elevated later(CIT2), or increased at the mid time point, but higher inthe early time point than in the latest time point (COX13).There was likewise very little di¡erence in expression ofthese genes in low-nitrogen. Comparison of the low- tohigh-nitrogen time points indicated greater expression ofseveral genes in low-nitrogen. Many of these genes areunder glucose repression control and there is a signi¢cantamount of glucose present in the media (17% at the latesttime point). This suggests that one response to low-nitro-gen is to switch from a fermentative mode of metabolismto respiration. This is reminiscent of the `Pasteur e¡ect' :the inhibition of fermentation at low-nitrogen conditionsby the presence of oxygen [17]. The Pasteur e¡ect is con-sidered to be largely irrelevant to yeast growth conditionsin laboratory media since it is only observed under veryspeci¢c and somewhat unphysiological conditions [17], but
these ¢ndings suggest that it is relevant to the native en-vironment in batch growth conditions. Respiration mayallow better conservation of nitrogen resources than fer-mentation. CIT2 (peroxisomal citrate synthetase) expres-sion was consistently higher in the `poorer' growth condi-tions, later time points or lower nitrogen content,suggesting that operation of the glyoxylate cycle mightbe associated with stationary phase. The pattern of ICL2expression is also consistent with this observation as is theexpression of the FOX2 gene (see Table 11).
Expression of the TCA and respiration genes may sim-ply indicate a general relief of glucose repression ratherthan a speci¢c adaptation to limiting nitrogen. To testthis possibility, the relative levels of expression of othergenes known to be repressed in the presence of glucosewere evaluated (Table 6). The ACH1, ADH2, MAL31,PCK1 and SUC2 genes were expressed at the early timepoint in low-nitrogen, but other glucose repressed genes(GAL, FBP1) showed no change. Only ADH2 expressionwas greater under low-nitrogen conditions at the later timepoint. This suggests that general relief of all glucose re-pression is not occurring and the e¡ect is selective forgenes involved in respiration. This ¢nding is not surprisingsince it is well known that multiple transcriptional mech-anisms regulate glucose repression/derepression.
3.4. Genes of nitrogen, sulfate and phosphate metabolism
Since nitrogen is the limiting nutrient in one of the timecourses, the levels of mRNA for genes involved in amino
Table 8Genes involved in nitrogen source degradation
See legends to Tables 2 and 4.
FEMSYR 1413 10-7-01 Cyaan Magenta Geel Zwart
L.E. Backhus et al. / FEMS Yeast Research 1 (2001) 111^125118

acid biosynthesis were evaluated (Table 7). In the low-nitrogen time course, there was little to no di¡erence inexpression levels for the entire time course. Genes indi-cated in bold are under general nitrogen control [18] andshow similar patterns of expression. For the high-nitrogentime course, expression was equivalent or higher at theearlier time point, with the exception of PRO2 and genesfor leucine biosynthesis, which were higher at the mid timepoint (LEU) or at the later time point as well (PRO2). Ingeneral, expression was greater in the high-nitrogen con-dition as compared to the low-nitrogen at the early timepoint and similar at the late time point. Thus amino acidbiosynthesis gene expression correlates with cyclin expres-sion. Cells displaying greater replicative activity also dis-play greater levels of expression of the amino acid biosyn-thetic genes. Biosynthesis does not correlate withtranslational activity (RPL, RPS gene expression), sug-gesting that these cultures are e¤ciently recycling nitrogenreserves.
The expression of genes involved in degradation of ni-trogen sources [19] was also evaluated. As expected, theculture with more arginine (H33) displayed higher levels ofexpression of the genes involved in arginine degradation,CAR1, CAR2, PUT1, PUT2 (Table 8). There was higherexpression at the high-nitrogen early time point as com-pared to the lower nitrogen condition. However, genes for
arginine and allantoin (DAL1) degradation were elevatedfor the low-nitrogen condition late time point, consistentwith active amino acid recycling. Expression of genes(DUR1,2) involved in urea degradation, an intermediatein arginine catabolism, was uniform across the compari-sons. For the low-nitrogen time course, most genes did notdisplay any variation in expression but the CAR1, CAR2,DAL4 and DAL5 genes were elevated at the late timepoint. DAL4 and DAL5 encode allantoin and allantoatepermeases, respectively. Expression of the general aminoacid permease (GAP1) did not vary. Expression of theamino acid transporter AGP genes did not vary in thesame way. AGP2 is present in higher levels in the H58and L33 cultures but not in the later time points of thelow-nitrogen time course. AGP1 is expressed to a greaterextent in the H85 as compared to L85 condition. AGP3showed little variation in expression with the exception ofbeing elevated in the early high-nitrogen time point ascompared to the late time point. The mRNA of the geneencoding the high-a¤nity urea transporter, DUR3, wasmore highly expressed in the H33 sample, but higher inthe low-nitrogen time course as compared to the high-ni-trogen conditions (H33L33 and L85H85).
NADP-glutamate dehydrogenase (GDH1) expressionwas elevated in H33 as compared to H85 and L33, butwas higher in L85 than in H85. GDH2 expression did not
Table 10Genes of phosphate metabolism
See legends to Tables 2 and 4.
Table 9Genes involved in methionine biosynthesis and sulfur metabolism
See legends to Tables 2 and 4.
FEMSYR 1413 10-7-01 Cyaan Magenta Geel Zwart
L.E. Backhus et al. / FEMS Yeast Research 1 (2001) 111^125 119
vary, and the URE2 gene, which is involved in regulationof GDH1 [16], shows a di¡erence only in the H33L33 pair-wise comparison. Glutamine synthetase (GLN1, GLN3)gene expression did not vary signi¢cantly. Expression ofUBP13, which encodes ubiquitin carboxyl-terminal hydro-lase was elevated in H33 across all three comparisons, butwas higher in L85 than in H85. The data for genes ofnitrogen degradation generally indicate higher levels ofexpression in the H33 time point, with elevated levels inL85 as compared to H85. This suggests that the L85 timepoint may be more biosynthetically active than H85, con-sistent with previous data described above.
With respect to methionine biosynthesis and sulfate re-duction (Table 9), expression of genes was roughly equiv-alent across the high and low-nitrogen time course. Com-parison of the two conditions to each other indicatedhigher expression in H33 and H85. Phosphate metabolismgene expression did not vary in the low-nitrogen timecourse (Table 10). There was also no di¡erence observedbetween levels of expression in the comparison of the twoearly time points. PHO81 and PHO84 were more highlyexpressed in the H85 sample as compared to the equiva-lent low-nitrogen time point. These genes are both inducedby limitation for phosphate. This suggests that the high-
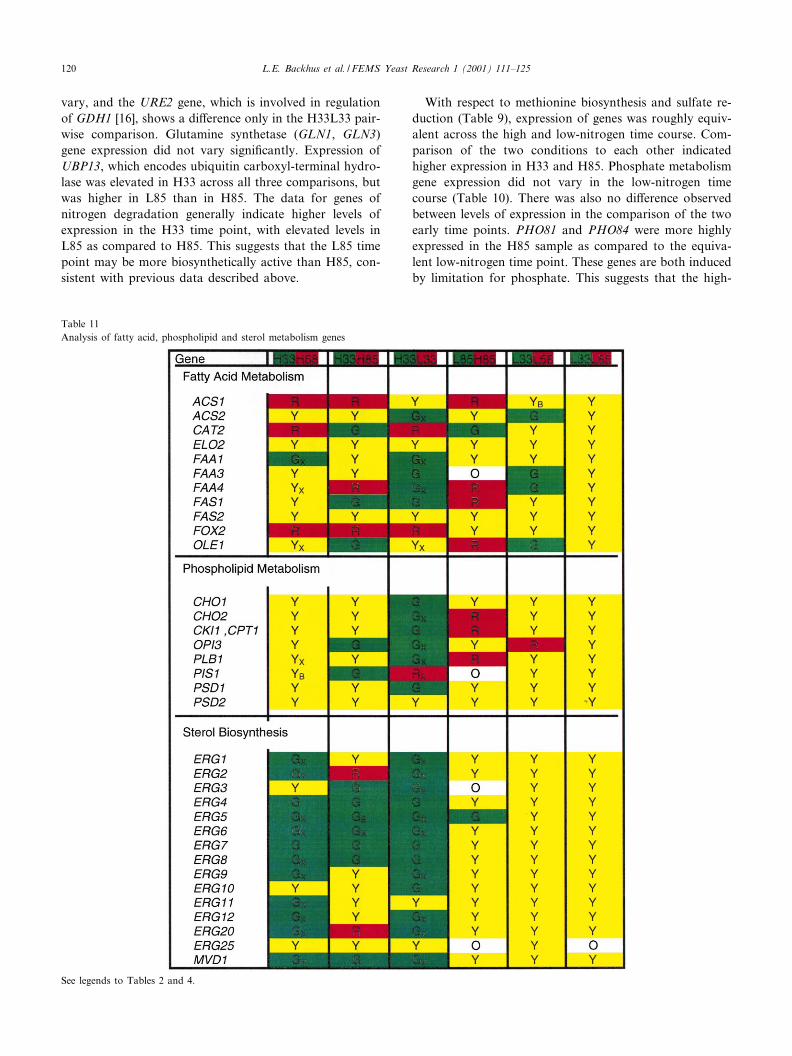
Table 11Analysis of fatty acid, phospholipid and sterol metabolism genes
See legends to Tables 2 and 4.
FEMSYR 1413 10-7-01 Cyaan Magenta Geel Zwart
L.E. Backhus et al. / FEMS Yeast Research 1 (2001) 111^125120

nitrogen culture has consumed more phosphate than thelow-nitrogen sample, consistent with greater biomass pro-duction and more complete utilization of substrate.
3.5. Fatty acid, phospholipid and ergosterol synthesis
Phospholipids and sterols are required for net mem-brane synthesis. In addition, alterations in fatty acid,phospholipid and sterol levels are needed to maintainethanol tolerance [3]. Therefore expression of the genesinvolved in biosynthesis of these components would beexpected to be greater in the high-nitrogen time course.This is exactly the pattern observed for the sterol (ERG)genes (Table 11). Genes of phospholipid metabolism wereequivalent within the two time courses, but were expressedto a greater extent in the high-nitrogen as compared to thelow-nitrogen condition. A similar trend was seen withfatty acid biosynthesis, but the data were not as clear-cut. The ACS1 (acetyl CoA synthetase) and FOX2 (fattyacid oxidation also yielding acetyl CoA) genes were ex-pressed more strongly at later time points. In general aswith amino acid biosynthesis, fatty acid and phospholipidsynthesis is greater in the more replicatively active cul-tures.
3.6. Genes involved in one-carbon transfers
Another index of relative growth is the level of expres-sion of genes involved in one-carbon transfers. Such trans-fers are generally associated with biosynthesis (aminoacids, phospholipids, nucleotides). There was a clear trendin expression of this family of genes. Expression was great-er in the more actively growing culture and at the highernitrogen level (Table 12). The RNR (ribonucleotide reduc-tase) genes were included in Table 12 as an indication ofdeoxynucleotide synthesis providing precursors for DNAsynthesis. In general, expression of RNR1 was higherunder nutrient-su¤cient conditions as compared to low-nitrogen (H33L33 and L85H85), consistent with earlierobservations of the replicative activity of these samples.RNR1 gene expression appeared to be higher at the latertime point of the high-nitrogen time course (H33H85).This observation is consistent with the higher levels ofexpression of the S phase cyclins in this culture and sug-gests an elongated S phase under these conditions (nonutrient limitation, growth limitation caused by attain-ment of maximal cell density and presence of ethanol).
One interesting trend was observed with the BIO genes,which are involved in uptake of intermediates in the bio-
Table 13Biotin synthesis and uptake
See legends to Tables 2 and 4.
Table 12Analysis of genes involved in one carbon metabolism
See legends to Tables 2 and 4.
FEMSYR 1413 10-7-01 Cyaan Magenta Geel Zwart
L.E. Backhus et al. / FEMS Yeast Research 1 (2001) 111^125 121

synthesis pathway of this vitamin and subsequent biotinsynthesis [20]. Wild-type yeast strains are only capable ofperforming the last three steps of biotin synthesis, so mustbe provided with this vitamin or an immediate precursor[20]. This vitamin is a cofactor required for many biosyn-thetic carboxylation and transcarboxylation reactions aswell as in carbon metabolism and respiration. Most otherbiosynthetic pathways showed no di¡erence in expressionacross the low-nitrogen time course. In a cluster analysis,the BIO genes emerge as one group of genes displayingsigni¢cantly higher expression in the earliest time point ofthe low-nitrogen time course (Table 13). In general there isno di¡erence in levels in the high-nitrogen conditions, butexpression is greater as compared to low-nitrogen(H33L33, L85H85). We are intrigued by this result asthe MMM medium contains ample biotin from the yeastnitrogen base component. These observations suggest thatdemands for biotin might be higher than previously ex-pected under these growth conditions.
3.7. Stress response and heat shock genes
Several genes are induced by environmental and nutri-tional stress in S. cerevisiae (reviewed in [21]). Previous
studies of the expression of stress-related genes under thecontrol of the STRE element during wine production con-ditions identi¢ed several heat shock proteins that are ex-pressed upon entry into stationary phase [4]. Expression ofthese and other stress and heat shock proteins [21] wastherefore evaluated. HSP12 and HSP26 encode small pro-teins of unknown function that were found to be inducedupon entry into stationary phase (Table 14), consistentwith an earlier study [4]. HSP12 and HSP26 are morehighly expressed at later time points in the high-nitrogenculture. HSP12 mRNA levels were elevated in the earlytime point for the low-nitrogen time course while HSP26shows no further induction. The mRNAs for both HSP12and HSP26 were present in higher concentration in theearly low-nitrogen time point as compared to the earlyhigh-nitrogen time point, con¢rming that a greater pro-portion of this population has entered stationary phase.HSP12 is also more highly expressed in the late time pointof the low-nitrogen culture as compared to the late timepoint of the nitrogen-su¤cient culture. Thus, expression ofthese two genes is consistent with the expected replicativestatus of the cultures, as both contain a signi¢cant pro-portion of cells in stationary phase.
For the Hsp70 family (SSA1 to SSA4, SSB1, SSB2,
Table 14Genes involved in stress response
See legends to Tables 2 and 4.
FEMSYR 1413 10-7-01 Cyaan Magenta Geel Zwart
L.E. Backhus et al. / FEMS Yeast Research 1 (2001) 111^125122

SSC1), SSA1 and SSB1 show little to no change andSSA2 is higher in the early time points as compared toboth late time points regardless of the nitrogen status ofthe culture. SSA3 and SSA4 are more highly expressed atthe latest time point in the high-nitrogen culture, and inthe early time point of the nitrogen-de¢cient culture versusthe same point of the early culture. Both also tend to showhigher expression at the early time point of the low-nitro-gen culture as opposed to later time points. SSA3 is higherin the nitrogen-rich late time point, H85, as compared tothe late time point from the nitrogen-de¢cient culture.Thus, expression of these two genes seems to be associatedwith a nutritionally su¤cient stationary phase. They arehigh in H85 and in L33, two samples that are likely in anequivalent stationary phase.
Similar results, higher expression in a nutrient-su¤cientstationary phase, are seen for HSP60 and HSC82. HSP42expression also appears to be higher in the more replica-tively active cultures, H33 versus L33 and in H85 versusL85. The HSP30 mRNA, also reported to be higher instationary phase during grape juice fermentation, was ele-vated in the low-nitrogen time course as compared tohigh-nitrogen, but this trend was not consistent in othersamples suggesting that expression of this gene might berestricted to a particular stage of stationary phase. Otherheat shock genes did not show a clear trend.
Several other genes are also associated with entry intostationary phase. The GAC1 gene which is involved inactivation of glycogen synthesis [22] was expressed atboth the mid and late time point of the high-nitrogensample as compared to the early time point (Table 14).This gene was also expressed more strongly in the earlytime point of the low-nitrogen culture, in agreement withthe literature [23]. Expression of GSY2, which encodes themajor isozyme of glycogen synthetase, did not vary muchacross the samples. On the other hand, GSY1 showedgreater expression in the high-nitrogen time course ascompared to low-nitrogen. Several genes, SOD2, TPS1,TPS2 and UBI4, also associated with stress response[21], showed higher expression in the low-nitrogen latetime point as compared to the high-nitrogen sample, and
the TPS genes also show greater expression at the earliertime point of the high-nitrogen time course. This patternof expression is similar to that observed for the glycolyticgenes.
The stress and heat shock genes examined seemed to beindicators of stress or entry into stationary phase, buteither did not distinguish between the nutritional statusof the cultures or were more highly expressed under nu-trient-su¤cient situations where entry into stationaryphase can be considered to be caused by attainment ofmaximal cell density as opposed to nutrient limitation.The YER150W gene (SPI1) has been reported to be ex-pressed in stationary phase in wine fermentations [4]. Thisgene was found to be more highly expressed in the L33sample, as compared to all other conditions (Table 15).Expression did not appear to increase at later time pointsor under nutrient-su¤cient conditions. We thereforewanted to search for genes that would be more highlyexpressed in nutritionally poor stationary phase (Table15). Eight genes showed a high level induction in thelate time point of the low-nitrogen culture as comparedto the high-nitrogen culture. One, YJL221C (FSP2, ho-mology to K-D-glucosidase) was highest in both late timepoints, but was higher in the low-nitrogen condition. Thisgene is induced in limiting conditions and displays highidentity to the MAL62 protein [24]. YML128C, YNL200Cand YPR195C, encoding proteins of unknown function,were more highly expressed in the low-nitrogen culturethan the high-nitrogen condition, but showed no di¡erencein expression in the high-nitrogen condition. YML128Cand YNL200C were previously identi¢ed as genes ex-pressed under stationary phase conditions during wine fer-mentation [4]. Thus these proteins might be an indicator ofnutritional stress. YOR107W expression was also high inthe lower nitrogen condition at both time points. The foldexpression increase in H85 versus H33 was 2.0, at thelower limit of signi¢cance. This gene has been designatedRGS2 and is a negative regulator of glucose-inducedcAMP signaling pathway [25], and a higher level of ex-pression may indicate that a larger percentage of the pop-ulation is in a true G0 state. Rgs2p plays a role in regu-
Table 15Genes expressed under nitrogen stress
See legends to Tables 2 and 4.
FEMSYR 1413 10-7-01 Cyaan Magenta Geel Zwart
L.E. Backhus et al. / FEMS Yeast Research 1 (2001) 111^125 123

lation of STRE gene expression [25]. The fact that riboso-mal protein synthesis increases at this time point suggeststhat the cAMP/PKA pathway is functional as the increasein expression of the RPL and RPS genes under nitrogen-limiting conditions is mediated by PKA [16]. The role ofthe Rgs2p may be to limit response of the cAMP/PKApathway to external nutrients but allow response to inter-nal signals. Thus the appearance of this protein might bean excellent indicator of the nutritional status of the cul-ture.
YPR192W (AQY1), which has homology to plant andanimal aquaporins [26], is more highly expressed in thelow-nitrogen time course and in both the mid and latetime points of the high-nitrogen condition. However, thedi¡erences in expression in the high-nitrogen time courseare at the lower limit of signi¢cance, 2.13 for H58 versusH33 and 2.15 for H85 versus H33. Both comparisonsshow a di¡erence in the same direction. This gene is ex-pressed more highly during nitrogen limitation [26], con-sistent with our data. Interestingly, it is believed to be non-functional in laboratory strains of Saccharomyces [26].The role of the AQY1 protein in yeast is unknown but ithas been shown to induce water uptake in Xenopus oo-cytes [26].
The GRE1 gene was originally identi¢ed as a gene ex-pressed under hyperosmotic conditions [27]. Gre1p resem-bles the late embryogenesis abundant protein of higherplants [27]. The GRE1 gene is negatively regulated bythe cAMP-PKA pathway and is induced upon nitrogenlimitation [27]. The appearance of GRE1 mRNA is con-sistent with inhibition of the cAMP signal transductionpathway by Rgs2p.
YFL030W encodes an alanine:glyoxylate aminotrans-ferase which is strongly glucose-repressed but expressedduring gluconeogenic growth on acetate and ethanol[28]. The observation of expression under these conditionssuggests it is not required for gluconeogenesis so much asfor amino acid biosynthesis. Its presence may be indicativeof more versatile amino acid recycling.
Analysis of this set of genes has revealed several thatmay be excellent indices of the physiological status of fer-menting cultures. Expression of RGS2 would indicate exitfrom permissive growth conditions, while several of theHSP genes would indicate entry into stationary phase.The presence of both would indicate nutrient de¢ciencyof stationary phase. GRE, which is induced by nitrogenlimitation, may be a reporter speci¢c for nitrogen starva-tion along with YFL030W. Further studies will de¢ne therole of these genes in nutrient-limited energy-su¤cient sta-tionary phase as well as characterize the status of thecAMP/PKA signal transduction cascade.
4. Conclusions
A clear view of the relative physiological status of nu-
trient-su¤cient and nitrogen-limited populations hasemerged from this analysis. Nutrient-su¤cient culturesthat enter a stationary phase based upon attainment ofmaximal cell density display higher levels of expressionof genes involved in biosynthesis of precursors of macro-molecules, and appear to retain competence for cell divi-sion. In contrast, energy-su¤cient cultures entering sta-tionary phase due to nitrogen limitation display greaterexpression of genes involved in translation and in oxida-tive carbon metabolism, suggesting that respiration ismore conserving of nitrogen resources than fermentation.The low-nitrogen culture also displayed higher mRNAlevels for genes involved in nitrogen compound recycling.Expression of the stress genes examined in general indi-cated higher levels of expression upon entry into station-ary phase or was higher in the high-nitrogen time course,which may re£ect the added stress of high ethanol concen-trations. Several genes were identi¢ed that appeared toincrease in expression only during nitrogen-limited station-ary phase. One of these genes encodes the RGS2 protein,which inhibits the cAMP/PKA signal transduction cascadethus restricting responses to glucose. This observation ex-plains the characteristics of arrested fermentations duringwine production. Such arrested cultures do not respond tosimple nutrient addition, as would be expected from inhi-bition of the cAMP/PKA cascade. However analysis ofother genes repressed by the cAMP/PKA cascade didnot reveal any changes in pattern of expression (to bereported) suggesting that only a subset of PKA-regulatedgenes is being derepressed under these conditions.
Some cautionary notes in interpretation of these dataare warranted. First, it is not clear if mRNA levels ofnon-growing cells will re£ect di¡erences in protein levels.That is, transcriptome analysis might not re£ect the pro-teome. However, the information on transcriptional activ-ity is clearly important and re£ects a need for the geneproduct. The absence of a transcriptional signal does notimply the converse, that the gene product is not requiredunder the conditions analyzed. Higher levels of expressionmay simply be needed to maintain a `status quo' level ofprotein, especially under conditions of accelerated mRNAand protein turnover. Further, it is important to bear inmind that the data are being generated across a popula-tion, and certain expression levels may be due to only apercentage of the population being in a speci¢c physiolog-ical state. Alternately, mRNA levels might indeed re£ectthe status of the entire population. Finally, the mRNAs ofgenes with a signi¢cant homology can cross-hybridize, im-pacting assessment of true changes in the level of expres-sion of individual members of gene families.
The data presented here are from unreplicated micro-arrays. Internal controls were used to evaluate reproduc-ibility and data quality. The trends discussed occur acrossa pathway or across a time course and are therefore sig-ni¢cant. Except in a few cases indicated in the text, thechange in expression was greater than 2.5-fold, replicate
FEMSYR 1413 10-7-01 Cyaan Magenta Geel Zwart
L.E. Backhus et al. / FEMS Yeast Research 1 (2001) 111^125124

arrays would allow greater con¢dence of di¡erences inexpression at the lower limit of expression. Analysis ofreplicate samples may reveal further trends in gene expres-sion not considered herein.
Acknowledgements
This research was supported by grants from the Amer-ican Vineyard Foundation and California CompetitiveGrant Program for Research in Viticulture and Enology(to L.F.B.). Chris Siedel is thanked for sharing optimizedprotocols and for advice during the course of this study.Eric Weiss is also thanked for helpful discussions. JimBrown, Lucy Joseph and Kathryn Weiss are thanked forcritical reading of the manuscript.
References
[1] Fleet, G.H. (1993) The microorganisms of winemaking: isolation,enumeration and identi¢cation. In: Wine Microbiology and Biotech-nology (Fleet, G.H., Ed.), pp. 1^25. Harwood Academic Publishers,Chur.
[2] Boulton, R.B., Singleton, V.L., Bisson, L.F. and Kunkee, R.E. (1996)Principles and Practices of Winemaking, 604 pp. Chapman and Hall,New York.
[3] Bisson, L.F. (1999) Stuck and sluggish fermentations. Am. J. Enol.Vitic. 50, 107^119.
[4] Puig, S. and Perez-Ortin, J.E. (2000) Stress response and expressionpatterns in wine fermentations of yeast genes induced at the diauxicshift. Yeast 16, 139^148.
[5] Schena, M., Shalon, D., Davis, R.W. and Brown, P.O. (1995) Quan-titative monitoring of gene expression patterns with a complementaryDNA microarray. Science 270, 467^470.
[6] Shalon, D., Smith, S.J. and Brown, P.O. (1996) A DNA microarraysystem for analyzing complex DNA samples using two-color £uores-cent probe hybridization. Genome Res. 7, 639^645.
[7] DeRisi, J.L., Iyer, V.R. and Brown, P.O. (1997) Exploring the meta-bolic and genetic control of gene expression on a genomic scale.Science 278, 680^686.
[8] Giudici, P. and Kunkee, R.E. (1994) The e¡ect of nitrogen de¢ciencyand sulfur containing amino acids on the reduction of sulfate tohydrogen sul¢de by wine yeasts. Am. J. Enol. Vitic. 45, 107^112.
[9] Ausubel, F.M., Brent, R., Kingston, R.E., Moore, D.D., Seidman,J.G., Smith, J.A. and Struhl, K. (1995) Current Protocols in Molec-ular Biology. Wiley Interscience, New York.
[10] Eisen, M.B., Spellman, P.T., Brown, P.O. and Botstein, D. (1998)Cluster analysis and display of genome-wide expression patterns.Proc. Natl. Acad. Sci. USA 95, 14863^14868.
[11] Lew, D.J., Weinert, T. and Pringle, J.R. (1997) Cell cycle control inSaccharomyces cerevisiae. In: The Molecular and Cellular Biology ofthe Yeast Saccharomyces : Cell Cycle and Cell Biology (Pringle, J.R.,Broach, J.R. and Jones, E.W., Eds.), pp. 607^695. Cold Spring Har-bor Laboratory Press, Cold Spring Harbor, NY.
[12] Tyers, M., Tokiwa, G. and Futcher, B. (1992) The Cln3^Cdc28 ki-nase complex of S. cerevisiae is regulated by proteolysis and phos-phorylation. EMBO J. 11, 1773^1784.
[13] Kaiser, C.A., Gimeno, R.E. and Shaywitz, D.A. (1997) Protein se-cretion, membrane biogenesis, and endocytosis. In: The Molecularand Cellular Biology of the Yeast Saccharomyces : Cell Cycle and CellBiology (Pringle, J.R., Broach, J.R. and Jones, E.W., Eds.), pp. 91^227. Cold Spring Harbor Laboratory Press, Cold Spring Harbor,NY.
[14] Finley, D., Tanaka, K., Mann, C., Feldmann, H. and Hochstrasser,M. et al. (1998) Uni¢ed nomenclature for subunits of the Saccharo-myces cerevisiae proteasome regulatory particle. Trends Biochem. Sci.23, 244^245.
[15] Planta, R.J. and Mager, W.H. (1998) The list of cytoplasmic riboso-mal proteins of Saccharomyces cerevisiae. Yeast 14, 471^477.
[16] Klein, C. and Struhl, K. (1994) Protein kinase A mediates growth-regulated expression of yeast ribosomal protein genes by modulatingRAP1 transcriptional activity. Mol. Cell. Biol. 14, 1920^1928.
[17] Lagunas, R. (1986) Misconceptions about the energy metabolism ofSaccharomyces cerevisiae. Yeast 2, 221^228.
[18] Hinnenbusch, A. (1992) General and pathway-speci¢c regulatorymechanisms controlling the synthesis of amino acid biosynthetic en-zymes in Saccharomyces cerevisiae. In: The Molecular and CellularBiology of the Yeast Saccharomyces : Gene Expression (Jones, E.,Pringle, J.R. and Broach, J.R., Eds.), pp. 319^414. Cold Spring Har-bor Laboratory Press, Cold Spring Harbor, NY.
[19] Cooper, T.G. (1982) Nitrogen metabolism in Saccharomyces cerevi-siae. In: The Molecular Biology of the Yeast Saccharomyces : Metab-olism and Gene Expression (Strathern, J.N., Jones, E.W. and Broach,J.R., Eds.), pp. 39^100. Cold Spring Harbor Laboratory Press, ColdSpring Harbor, NY.
[20] Phalip, V., Kuhn, I., Lemoire, Y. and Jeltsch, J.M. (1999) Character-ization of the biotin biosynthesis pathway in Saccharomyces cerevisi-ae and evidence for a cluster containing BIO5, a novel gene involvedin vitamin uptake. Gene 232, 43^51.
[21] Craig, E. (1992) The heat-shock response of Saccharomyces cerevisi-ae. In: The Molecular and Cellular Biology of the Yeast Saccharo-myces : Gene Expression (Jones, E., Pringle, J.R. and Broach, J.R.,Eds.), pp. 501^538. Cold Spring Harbor Laboratory Press, ColdSpring Harbor, NY.
[22] Franc°ois, J.M., Thompson-Jaeger, S., Skroch, J., Zellenka, U., Spe-vak, W. and Tatchell, K. (1992) GAC1 may encode a regulatorysubunit for protein phosphatase type 1 in Saccharomyces cerevisiae.EMBO J. 11, 87^96.
[23] Tadi, D., Hasan, R.N., Bussereau, F., Boy-Marcotte, E. and Jacquet,M. (1999) Selection of genes repressed by cAMP that are induced bynutritional limitation in Saccharomyces cerevisiae. Yeast 15, 1733^1746.
[24] Vandenbol, M., Durand, P., Bolle, P.A., Dion, C., Portelle, D. andHigler, F. (1994) Sequence analysis of a 40.2 kb DNA fragmentlocated near the left telomere of yeast chromosome X. Yeast 12,1657^1662.
[25] Versele, M., de Winde, J.H. and Thevelein, J.M. (1999) A novelregulator of G protein signaling in yeast, Rgs2, downregulates glu-cose-activation of the cAMP pathway through direct inhibition ofGpa2. EMBO J. 18, 5577^5591.
[26] Bonhivers, M., Carbrey, J.M., Gould, S.J. and Agre, P. (1998) Aqua-porins in Saccharomyces. J. Biol. Chem. 273, 27565^27572.
[27] Garay-Arroyo, A. and Covarrubias, A.A. (1999) Three genes whoseexpression is induced by stress in Saccharomyces cerevisiae. Yeast 15,879^892.
[28] Takada, Y. and Noguchi, T. (1985) Characteristics of alanine:glyox-ylate aminotransferase from Saccharomyces cerevisiae, A regulatoryenzyme in the glyoxylate pathway of glycine and serine biosynthesisfrom tricarboxylic acid-cycle intermediates. Biochem. J. 231, 157^163.
FEMSYR 1413 10-7-01 Cyaan Magenta Geel Zwart
L.E. Backhus et al. / FEMS Yeast Research 1 (2001) 111^125 125