functional groups behaviour and non-stable...
TRANSCRIPT
EVELYN DA FONSECA ALECRIM BRAGION
FUNCTIONAL GROUPS BEHAVIOUR AND NON-STABLE NATURAL EDGES OF GALLERY
FOREST (COMPORTAMENTO DE GRUPOS
FUNCIONAIS E BORDAS NATURAIS NÃO ESTÁVEIS DE MATAS DE GALERIA)
LAVRAS - MG
2016

!!
EVELYN DA FONSECA ALECRIM BRAGION
FUNCTIONAL GROUPS BEHAVIOUR AND NON-STABLE NATURAL EDGES OF GALLERY FOREST
(COMPORTAMENTO DE GRUPOS FUNCIONAIS E BORDAS NATURAIS NÃO ESTÁVEIS DE MATAS DE GALERIA)
Tese apresentada à Universidade Federal de Lavras, como parte das exigências do Programa de Pós-Graduação em Engenharia Florestal, área de concentração em Ecologia Florestal, para a obtenção do título de Doutor.
Orientador Dr. Eduardo van den Berg
LAVRAS – MG 2016

!!

!!
EVELYN DA FONSECA ALECRIM BRAGION
FUNCTIONAL GROUPS BEHAVIOUR AND NON-STABLE NATURAL EDGES OF GALLERY FOREST
(COMPORTAMENTO DE GRUPOS FUNCIONAIS E BORDAS NATURAIS NÃO ESTÁVEIS DE MATAS DE GALERIA)
Tese apresentada à Universidade Federal de Lavras, como parte das exigências do Programa de Pós-Graduação em Engenharia Florestal, área de concentração em Ecologia Florestal, para a obtenção do título de Doutor.
APROVADA em 24 de fevereiro de 2016.
Dr. Filipe Machado França UFLA Dr. Lucas del Bianco Faria UFLA Dr. Luiz Fernando Silva Magnago UFLA PhD. Robin Chazdon UCONN Dr. Rubens Manoel dos Santos UFLA
Dr. Eduardo van den Berg Orientador
LAVRAS – MG 2016

!!
A Deus, por me permitir estudar as belezas da natureza, Dedico

!!
AKNOWLEDGEMENTS /AGRADECIMENTOS
Primeiramente, gostaria de agradecer a Deus, meu escudo e força nas horas
difíceis.
À UFLA, por esses 10 anos de aprendizado.
Ao CNPq pelo financiamento do projeto e de minha bolsa de doutorado. À
CAPES pela bolsa de doutorado sanduíche.
Ao Eduardo van den Berg pela orientação e conhecimentos transmitidos ao
longo desses anos, e também pela paciência e compreensão.
Ao Daniel, marido maravilhoso, pela força e apoio a mim dados,
principalmente quando estávamos a 7500 km de distância.
Ao Ericssen, meu irmão favorito, sempre disposto a me ajudar em campo,
quando quer que fosse. Acho que você deveria estar recebendo o título junto! =)
À Ivane, minha mãe, os motivos para se agradecer uma mãe são óbvios, mas
a minha foi além e aventurou-se para me ajudar nos campos. Valeu D. Ivane!
Ao seu Paulo Alecrim, o melhor pai do mundo, que sempre me incentivou a
seguir em frente.
Ao cachorro Marie, pela companhia nos campos, fazendo deles os mais
divertidos! E por sempre nos avisar do perigo.
E finalmente, a todos que tiraram um pouco de tempo para me ajudar em
campo, especialmente ao Lucas, Joberth e Luiz. Mas, também a Carol Cambraia,
Carol Toledo, Costelinha, Eduardo, Eliandra, Ericssen, Felipe, Flávia, Gabi
Coelho, Gabi Meirelles, Grazi, Hisaias, Ivane, João, Juliana, Lucas Eduardo,
Marco, Marcos, Marie, Mateus, Rafael, Renato, Trotta, Valdir, Vilany e Will.
Espero não ter esquecido de ninguém! Muito obrigada galera!

!!
“There is no leaf of the forest, or lowly blade of grass, but has its ministry. Every tree and
shrub and leaf pours forth that element of life without which neither man nor animal could
live; and man and animal, in turn, minister to the life of tree and shrub and leaf. The flowers
breathe fragrance and unfold their beauty in blessing to the world. The sun sheds its light to
gladden a thousand worlds. The ocean, itself the source of all our springs and fountains,
receives the streams from every land, but takes to give. The mists ascending from its bosom
fall in showers to water the earth, that it may bring forth and bud.”
Desire of the Ages, pg. 20
!!
GENERAL ABSTRACT Gallery forests possess natural edges between forest and grasslands,
offering a unique opportunity to examine how species performance varies across natural environmental gradients and to study forest expansion into grasslands and the effect of positive interaction on this expansion. Here we asked whether demographic rates of tree functional groups varied with distance to the edge, whether we could explain differences in plant strategies through functional traits and which traits increase growth and allow survival. We also asked whether gallery forests are expanding into grasslands and whether a facilitation process fosters forest expansion. Also, we examined whether there is a change from positive to negative interactions in these short gradients as a consequence of the change in microclimate. For this purpose, we examine mortality and recruitment for 30 species existing in the first few meters (10 m) of natural edges of 8 different gallery forests, and use demographic data from 5 annual inventories (2009 - 2013). The shade-tolerant group had the lowest mortality rates and basal area loss while both pioneer and light-demanding species had similar behavior for these rates. There was no difference between groups for recruitment the rates and basal area gain. Distance from the edge differentially affected the functional groups in terms of survival and growth. Survival of the pioneer group was enhanced near the edge, but for the light-demanding and shade-tolerant, survival increased toward the forest interior. All groups had higher growth in the grassland and reduced growth in the edge. Those differences in behavior could be explained by differences in functional traits. A great part of the species in natural edges have an acquisition strategy. Growth was enhanced by acquisitive traits. However, mortality selected both strategies, but in distinct zones of the edge. We found forest expanding over grasslands with the pioneer species having the spearhead role, followed by the light-demanding species and, lastly, by the shade-tolerant in a clear succession process, that could suggest a facilitation process. However, the presence of facilitators did not foster forest expansion since the more facilitators, the less forest expansion. Also, there were no changes from positive to negative interactions, but even in the grassland presence of neighbors reduced survival. Our results showed how strong and sharp the edge gradient is and how the functional groups had growth and survival differentially affected by it. Although we did not find evidence of facilitation, negative interactions do not completely suppress expansion, since there was expansion in most of the sites.
Keywords: Environmental gradient. Functional groups. Dynamic. Cerrado. Positive interactions

!!
RESUMO GERAL Matas de galeria possuindo bordas naturais com campos limpos
apresentam uma oportunidade única de estudar a performance de espécies através do gradiente ambiental natural, a expansão florestal sobre os campos e o efeito das interações positivas nessa expansão. Nesta tese, nós perguntamos se as taxas demográficas de grupos funcionais variaram com a distância da borda, se as diferenças em estratégias dos grupos funcionais podem ser explicadas através de características funcionais e quais características aumentam o crescimento e permitem a sobrevivência. Nós também questionamos se as matas de galeria estão expandindo e se processos de facilitação promovem a expansão florestal. Também examinamos se há uma mudança de interações positivas para negativas no curto gradiente como consequência da mudança em microclima. Para isso, nós acompanhamos a mortalidade e recrutamento de 30 espécies presentes nos primeiros metros (10 m) de bordas naturais em 8 matas de galeria, e usamos dados demográficos de 5 inventários anuais (2009 – 2013). O grupo tolerante à sombra possuiu a menor taxa de mortalidade e perda de área basal. Não houve diferenças quanto às taxas de recrutamento e ganho em área basal. A distância da borda influenciou os grupos funcionais de maneira diferente em termos de crescimento e sobrevivência. A sobrevivência de pioneiras foi aumentada perto da borda, enquanto para os outros grupos a sobrevivência aumenta em direção ao interior. Todos os grupos cresceram mais no campo do que na borda. As diferenças em comportamento puderam ser explicadas através de características funcionais, sendo que a maior parte das espécies possui uma estratégia aquisitiva. O crescimento foi favorecido por características aquisitivas de recurso, no entanto mortalidade selecionada as duas estratégias, mas em áreas distintas da borda. A floresta expandiu sobre os campos com as espécies pioneiras sendo as primeiras, seguidas das exigentes de luz e tolerantes à sombra, o que poderia sugerir um processo de facilitação. No entanto, os primeiros colonizadores não promoveram a expansão florestal, já que quanto maior a sua abundância, menor a expansão florestal. Ainda, não há mudança de interações positivas para negativas, mas até mesmo no campo a presença de vizinhos diminui a sobrevivência. Nossos resultados mostram o quanto o gradiente das bordas é curto e forte, e como isso afeta de forma diferenciada os grupos funcionais. Embora nós não tenhamos encontrado evidências de facilitação, as interações negativas não suprimem a expansão florestal.
Palavras – chave: Gradiente ambiental. Grupos funcionais. Dinâmica. Cerrado.

!!
LIST OF FIGURES Paper 1 Figure 1 Geographical location of the studied sites. (A) Minas Gerais
State; (B) Minas Gerais macroregions; (C) Southern Minas
Gerais state region, with the location of the sampled sites.........
44
Figure 2 Sketch of how plots were assembled with 5 m of grassland and 10 m of forest's edge. X is the distance parallel to the upper limit of the plot as measured from the corner, Y is the distance of the individual from the upper limit of the plot.......……………...................................................................
45
Figure 3 Credible interval (95%) for survival parameters (A) and growth model parameters (B). Values that do not overlap zero are significant. P: Pioneer; L: Light-demanding; S: Shade-tolerant;Dist.:Distance .........…………..........................….......
52
Figure 4 Predicted growth values and credible intervals (95%) for each functional group in four distances: grassland (upper limit of plot), edge (5 m from upper limit), 5 m from edge (10m from upper limit) and 10 m from edge (15 m from upper limit) ..........................................................................................
53
Figure 5 Predicted survival probability values and their credible intervals (95%) for each functional group in four distances: grassland (upper limit of plot), edge (5 m from upper limit), 5 m from edge (10m from upper limit) and 10 m from edge (15 m from upper limit) .............................................................
54
Figure 6 Credible intervals (95%) for growth model parameters (A) and for survival model parameters (B). Values that do not overlap zero are significant. SS: Stem slenderness; CF: Crown format; SLA: Specific leaf area; LDMC: Leaf dry matter content; WD: Wood density; RGR: Relative Growth Rate...............................
55
!!
Paper 2 Figure 1 Interaction among plants can be context depend. In a stressful
environment such as grasslands, neighbors can provide shelter whose benefits can overlap resource depletion. However, when stress declines toward the forest interior the benefits of shelter decreases and the ability to explore shared resources becomes more important ............................................................
77
Figure 2 Sketch of how plots were assembled with 5 m of grassland and 10 m of forest edge. X is the distance parallel to the upper limit of the plot as measured from the corner, Y is the distance of the individual from the upper limit of the plot .....................
79
Figure 3 Number of recruits in grassland year by year for each site and for all sites .............................…………..........................….......
84
Figure 4 Relationship betweenE. erythropappusabundance and recruitment.Regression line shows a negative relation between variables suggesting that E. erythropappus is not promoting forest expansion .........................................................................
85
Figure 5 Credible interval (95%) for parameters of survival model. Values that do not overlap zero are significant .........................
85
Figure 6 Probability of survival for trees with DBH � 1 cm in grassland, edge and gallery forest as function of the Competition Index (CI). There was no change from positive to negative interactions, in all environments neighbors reduce the probability of survival ................................................................
86
Figure 7 Mean canopy coverage (%) for 8 gallery forests in Brazil .... 87

!!
LIST OF TABLES Paper 1 Table 1 Species with more than 50 individuals ordered by their
numbers (N) followed by their functional group (FG): P=pioneer, L= light-demanding, S= shade-tolerant .....,,,,,,,.....
62
Table 2 Number of dead individuals and recruits, as well as their initial and final number of individuals and rates of mortality, recruitment and net change for light-demanding, pioneer and shade-tolerant groups in natural forest edges of gallery forests, from 2009 to 2013. Values followed by the same letter are not significantly different according to an LSD test.........................
63
Table 3 Basal Area of dead individuals, recruits, as well as their initial and final basal area and rates of loss, gain and net change in terms of basal area for light-demanding, pioneer and shade-tolerant groups in natural forest edges of gallery forests, from 2009 to 2013. Values followed by the same letter are not significantly different according to an LSD test.........…............
64
Table 4 Differences in functional and allometric traits for tree functional groups in natural edges of gallery forest. SLA: Specific Leaf Area (mm2 mg-1); LDMC: Leaf dry matter content (%); SS: stem slenderness (tree height/CBH); CF: Crow Format (crown width/crown depth)..................................
65
Paper 2 Table 1 Species that had more than 50 samplings across sites in 8
gallery forests, ordered by their number of individuals (N) followed by functional group (EG): P=pioneer, L= light-demanding, S= shade-tolerant ...................................................
92
Table 2 Species that had more than 50 samplings across sites in 8 gallery forests and had dead samples in the grassland, edge and forest ..................................................................................
93
Table 3 Recruitment and mortality in grasslands surrounding gallery forests in Brazil during 5 years ..................................…............
93
Table 4 Soil moisture differences between seasons and different environments for 2010, 2012 and 2013 according to Two-way ANOVA and Tukey test ......................................
94

!!
CONTENTS 1 GENERAL INTRODUCTION!.........................................................................!13!2 THEORETICAL REVIEW!...............................................................................!17!2.1 Gallery forest ......................................................................................................... 17!
2.2 Grassland and forest boundaries ......................................................................... 18!
2.3 Positive interactions .............................................................................................. 22!
2.4 Plants strategies and Functional traits ................................................................ 23!
REFERENCES!.....................................................................................................!26!PAPER 1 - SHARP DIFFERENTIATION ON THE PERFORMANCE OF
PLANT FUNCTIONAL GROUPS ACROSS AN ABRUPT ENVIRONMENT GRADIENT IN NATURAL EDGES!.............................!38!
1 INTRODUCTION ................................................................................................... 40!
2 METHODS ............................................................................................................... 43!
3 RESULTS ................................................................................................................. 50!
4 DISCUSSION ........................................................................................................... 55!
5. REFERENCES ........................................................................................................ 66!
PAPER 2 - DOES FACILITATION FOSTER GALLERY FOREST EXPANSION INTO GRASSLANDS IN BRAZIL?!....................................!72!
1 INTRODUCTION ................................................................................................... 74!
2 METHODS ............................................................................................................... 78!
3 RESULTS ................................................................................................................. 83!
4 DISCUSSION ........................................................................................................... 87!
5 REFERENCES ......................................................................................................... 95!
!

13
1 GENERAL INTRODUCTION
Gallery forest that are forestry corridors along stream and river basins
(RIBEIRO; WALTER, 2001). Boundaries between gallery forest and grasslands
are one of the few examples of sharp natural old edges, this being one amazing
opportunity for studying how plant populations and communities behave. Those
boundaries are intriguing since they occur between very distinct vegetation types
coexisting under a common climate. (WHITTAKER, 1975; BOND, 2005;
BOND, 2005). Besides the sharp gradient with the open grassland, gallery
forests also have a strong internal gradient from the streamside toward the edge.
Light, soil moisture and nutrients vary along a gradient reflecting in a clear
turnover of species from the stream towards grassland (KELLMAN;
TACKABERRY; RIGG, 1998; ROSSATO; HOFFMANN; FRANCO, 2009;
VAN DEN BERG; OLIVEIRA-FILHO, 1999). However, those factors can not
satisfactorily explain the sharp feature of the edges. This feature is better
explained by the frequent fire events that take place in the grasslands and
eventually affect the edge, however, extinguishing there (VAN DEN BERG;
OLIVEIRA-FILHO, 1999; 2000; VAN DEN BERG; SANTOS 2004; FELFILI,
1998; ROSSATO; HOFFMANN; FRANCO, 2009).
Forest and grassland exist as alternative stable states (GRAY; BOND
2015; STAVER; ARCHIBALD; LEVIN, 2011a,b), therefore limits between
them could be shifting. Several studies date forest expansion starting around
3000 – 4000 YBP (BOWMAN; WALSH; MILNE, 2001; DESJARDINS et al.,
1996; HOPKINS 1992; KERSHAW, 1992; SANAIOTTI et al., 2002;
SCHWARTZ et al., 1996; SILVA et al., 2008). One of the main constraints to
forest expansion is fire, that kills woody seedlings and samplings and topkills
adults because of their lack of protective thick bark (HOFFMANN et al., 2009;
ONDEI et al., 2015). Therefore, under frequent fires, forest expansion is

14
unlikely, but when fire is suppressed gallery forest can expand into open areas
(RATTER, 1992). On the other hand, grasses are favored by frequent burn since
they benefit from the created open spaces and recover faster than trees after fire
events. Their presence even enhances the likelihood of burning due to their high
flammability, creating positive feedback between grassland and fire.
Given all constraints and stressful conditions for forest species
establishment in open areas, it is probable that forest expansion works as a
succession process where a facilitation process dominates (CLEMENTS, 1916;
CONNELL; SLATYER, 1977;GRIME, 1977) with an initial occupation of the
grassland area by colonizer species, smoothing the harsh grassland conditions,
followed by other species. As succession carries on and harsh conditions in
grasslands turn more suitable for forest species, the importance of positive
interactions probably decline, increasing the importance of competition and
other negative interactions. The gradient from grassland to forest could be
therefore in different stages of succession, when environmental stress is higher
in the grassland in lower in the forest. According to the stress-gradient
hypothesis in a gradient like this, interactions can change from facilitation (harsh
environment) to competition (BERTNESS; CALLAWAY, 1994; CALLAWAY;
WALKER, 1997).
Light is an abundant resource at natural edges, and one of the most
recognized tradeoffs in terms of plant strategies is the resource acquisition vs.
conservation (also known as fast-slow) (REICH, 2014) which is connected with
the capacity to exploit environments that are rich or poor in resources (GRIME
et al., 1997). Thus, shade-tolerance or intolerance would be the consequence of
this tradeoff between high growth in productive (high light) conditions and high
survival in low light conditions (BAZZAZ et al., 1983; DAVIES, 2001;
DENSLOW, 1980, 1987; HARTSHORN, 1980). Because functional traits are
related to plant strategies, this tradeoff can be investigated using functional traits

15
that are advantageous in high-light environment versus low-light environments
(REICH, 2014). The relationship between functional traits and plant strategies
have been tested for forest environments (FORGIARINI et al., 2015; POORTER
et al., 2003), where gap openings are the main cause of light increase.
Yet, such forest gaps are transitory (SWAINE; WHITMORE, 1988) and
few studies have explored the relationship between functional traits and plant
strategies within natural edges, where the high light incidence is constantly
present.
Several studies have investigated which factors are driving those
boundaries between gallery forest and open areas (KELLMAN;
TACKABERRY; RIGG, 1998; ROSSATO; HOFFMANN; FRANCO, 2009;
VAN DEN BERG; OLIVEIRA-FILHO, 1999), how or if such forest-grassland
limits change temporally (BURROWS; COMPTON; HOFFMANN, 1998;
DUSSART; LERNER; PEINETTI, 1998; PALMER; ROOYEN, 1998;
SCHWARTZ et al., 1996; SILVA et al., 2008), the role of soils (GRAY; BOND,
2015), constraints to tree establishment (HOFFMANN; ORTHEN; FRANCO,
2004), the role of facilitators in seedling establishment (HOFFMANN, 1996;
KELLMAN, 1985; KELLMAN; MIYANISHI, 1982), and what community
structure and species composition are like in those edges (COELHO et al., in
prep., KELLMAN; TACKABERRY; RIGG, 1998). However, we lack
understanding of how plants behave after the seedling stage, and if facilitators
are really helping plants achieve adulthood and forest expansion. In addition, we
also do not know how the environment gradient affect plant interactions. To
understand how natural edges work it is necessary to examine how species
performance varies across those natural environmental gradients, exploring how
functional traits are related to species success or failure in this environment,
since functional traits depict plant strategies (ADLER et al., 2014;
FORGIARINI et al., 2015; GRIME; HODGSON; HUNT, 1988; WILSON;

16
HODGSON., 1999). Our understanding regarding those questions is limited in
part because the large number of species present in the forests hinders
generalization. Variation among functional groups in behavior across edges,
however, can capture the complexity of specie response to environmental
heterogeneity (DIAZ; CABIDO, 1997) and provide some insights into the
processes that determine species distribution across the marked environmental
gradients that occur in these forests.
I conceived this thesis considering the need to better understand the
relationship between natural environment gradients, demographic rates, plant
strategies and performance, functional traits and plants interactions. In the first
paper, I aimed to answer how the environmental gradient affects survival and
growth of different functional groups, which are the plant strategies in natural
edges and how different functional traits mirror plant strategies. In the second
paper, I aimed to answer whether gallery forests are expanding and, if they are,
how the functional groups behave in such expansion; and also whether
facilitation fosters forest expansion.
17
2 THEORETICAL REVIEW
2.1 Gallery forest
In the Brazilian savanna, known as cerrado, around 33% of plant
diversity is within gallery forests(RIBEIRO; WALTER, 2001), that are forestry
corridors along stream and river basins. They correspond to 5% of the cerrado
territory (RIBEIRO; WALTER, 2001) representing the greatest biodiversity per
area in the cerrado biome (MENDONÇA et al., 1998). Gallery forests can have
boundaries with savannas and open environments, such as grasslands
(RODRIGUES, 2000).
Gallery forest are a refuge for forest species in an open area
environment, interfacing with many other types of vegetation like rainforest,
mesophytic forest and open areas, so their high biodiversity is due to all the
different floristic influences that to which they are subjected (MARIMON;
FELFILI; LIMA, 2002; OLIVEIRA-FILHO; RATTER, 1995; PINTO;
OLIVEIRA-FILHO, 1999; SILVA JÚNIOR et al., 1998).
They are buffer zones protecting the headwaters, controlling erosion and
filtering chemicals (FELFILI, 1994; 1995a). Gallery forests are also important as
a source of resources and shelter for fauna (REDFORD; FONSECA, 1986).
Because of all the services provided by them, they are protected by Brazilian
law, although it does not totally prevent deforestation (FELFILI, 1997).
Gallery forests are also subjected to natural perturbation because they
are narrow corridors with a large perimeter of contact between them and open
vegetation. This narrow, dissected shape makes them particularly susceptible to
the high rates of anthropogenic burning in the adjacent savannas and grasslands
(KELLMAN; MEAVE, 1997). They are also subjected to higher wind speeds.

18
Thus, plant species present in the gallery edges should be resistant to
environmental stress (MEAVE et al., 1991).
Boundaries between gallery forest and grasslands are one of the few
examples of sharp natural old edges. Several studies have been conducted
aiming to better understand the floristics and dynamics of gallery forests
(BATTILANI; SCREMIN-DIAS; SOUZA, 2005; VAN DEN BERG;
OLIVEIRA-FILHO, 1999; 2000; VAN DEN BERG; SANTOS, 2004; BUOSI;
FELFILI, 2004; DIETZSCH et al., 2006; FELFILI, 1994; 1995a, 1995b;
FELFILI et al., 2002; LOPES; SCHIAVINI, 2007; MARIMON et al., 2003;
OLIVEIRA-FILHO et al., 2007; OLIVEIRA; FELFILI, 2005; 2006;
OLIVEIRA-FILHO; RATTER, 1995; OLIVEIRA-FILHO; RATTER;
SHEPERD,1990; PINTO; HAY, 2005; RODRIGUES; NAVE, 2000; SILVA
JÚNIOR et al., 1998), however, we lack studies aiming to specifically
understand the natural few meters of the edge.
2.2 Grassland and forest boundaries
Different vegetation types and their location around the world should be
subject to climate control, where temperature and rain fall determine vegetation
structure patterns (WHITTAKER, 1975). However, savannas and forest can
grow in the same climate and, often, in the same soils, even though they are very
distinctive vegetation types(WHITTAKER, 1975; BOND, 2005; BOND;
WOODWARD; MIDGLEY, 2005). In this context, there is one of the few
examples of sharp naturalold edges: the boundaries between grasslands and
gallery forests.
Besides the sharp gradient with the open grassland, gallery forests also
have a strong internal gradient from the streamside toward the edge. Light, soil
moisture and nutrients vary along gradients, reflecting in a clear turnover of

19
species from the stream towards grassland (KELLMAN; TACKABERRY;
RIGG, 1998; ROSSATTO; HOFFMANN; FRANCO, 2009; VAN DEN BERG;
OLIVEIRA-FILHO, 1999). However, those factors can not satisfactorily explain
the sharp feature of the edges. This feature is better explained by the frequent
fire events that take place in the grasslands and eventually affect the edge,
however, extinguishing there (VAN DEN BERG; OLIVEIRA-FILHO, 1999;
2000; VAN DEN BERG; SANTOS, 2004; FELFILI, 1998; ROSSATO;
HOFFMANN; FRANCO, 2009).
It is possible that the gallery forests are expanding into grassland areas.
Several studies conducted around the world have shown past and recent
expansions of forest into open ecosystems (BOWMAN; WALSH; MILNE,
2001; DESJARDINS et al., 1996; HOPKINS, 1992; KERSHAW, 1992;
SANAIOTTI et al., 2002; SCHWARTZ et al., 1996; SILVA et al., 2008).
SILVA et al., (2008) suggested that gallery forest in Brazil started to expand
around 3000-4000 YBP and continue to do so. They also suggest that expansion
was limited by fire, since soil nutrient differences between vegetation types are
not prominent. Their conclusions are supported by other studies finding that
soils do not drive changes in vegetation types, but they are responders (GRAY;
BOND, 2015). Thus, boundaries between grasslands and gallery forest are
important models presenting important lessons about feedback between
vegetation type and fire activity under a common climate (MURPHY;
BOWMAN, 2012), where fire is a main constraint to forest expansion
(HOFFMANN; ORTHEN; FRANCO, 2004; HOFFMANN et al., 2009).
The oldest register of fire in the cerrado is from 32,000 YBP (LEDRU,
1993), a period that is previous to human presence in the region (11,000-12,000
YBP, COOKE, 1998; PROUS, 1992), although man presence in Brazil is older
than 30.000. However, mankind changed fire event frequency for at least
10.000, since they used fire for hunting, stimulation of fruit production,

20
undesirable species control, and tribal war (COUTINHO, 1990a). Currently,
humans burn natural areas to transform them into crop fields or planted pasture
(MIRANDA; BUSTAMANTE; MIRANDA, 2002), consequently they change
the natural fire regime (season and frequency of burning) with consequences for
the vegetation structure and composition (MIRANDA; BUSTAMANTE;
MIRANDA, 2002). The fire in the cerrado is a surface fire (MIRANDA;
BUSTAMANTE; MIRANDA, 2002), burning the herbaceous layer, which is
94% of the fuels consumed during the fires.
When fire is absent, forest expansion is a gradual process involving
growth of existing trees and recruitment of new ones, however forest species
face several constraints when establishing in the grasslands (BOND, 2008;
HOFFMANN; ORTHEN; FRANCO, 2004). They are limited by microclimate,
such as high light leading to high temperature and drought stress, and are also
limited by low nutrient availability, frequent fire and competition with grasses
(HOFFMANN; ORTHEN; FRANCO, 2004). Thus, the forest expansion rate
will be determined by tree establishment, survival and growth under those
constraints. Although those constraints lead to some limitations on forest species
(BOWMAN, PANTON, 1993; HOFFMANN; ORTHEN; FRANCO, 2004), the
increase in recruitment after fire suppression (SAN JOSÉ; FARIÑAS, 1991;
GEIGER et al., 2011) suggest that fire is the main factor limiting expansion, so
the rate of forest retreat is probably determined by fire frequency and intensity
(HOFFMANN; ORTHEN; FRANCO, 2004).
Open areas are favored by fire events because grasses are highly
flammable and may burn at intervals of 1-3 years (HOFFMANN et al., 2009).
Also, grasses benefit from the open spaces after a fire event and they
additionally recover from burning faster than trees (BAUDENA et al., 2015). On
the other hand, forest species are fire sensitive because they lack a protective
thick bark (HOFFMANN et al., 2009; ONDEI et al., 2015). In high fire

21
frequency, seedlings and saplings of wood plants suffer topkill (i.e. loss of
above-ground biomass) or death. Because of frequent fire, saplings can be
suppressed for decades, resulting in a demographic bottleneck, also known as
“fire - trap” (BELL, 1984). In this context, recruitment into adulthood will only
be possible during fire-free intervals long enough to allow saplings to reach a
size at which they are no longer susceptible to topkill (BOND; MIDGLEY,
2000)
When fire frequency is high, forest species fall into the fire-trap and do
not contribute to an increase in canopy cover leading to an open canopy, which
benefits grasses and increases fire frequency. Grasslands and forest are
therefore, alternative stable states maintained by feedback between fire and
vegetation (WILSON; AGNEW, 1992; SCHEFFER; CARPENTER, 2003;
WARMAN; MOLES, 2009; STAVER; ARCHIBALD; LEVIN, 2011a, 2011b;
HIROTA et al., 2011; HENNENBERG et al., 2006; BECKAGE; PLATT;
GROSS, 2009; HOFFMANN et al., 2009).
During fire-free periods, forest species can establish in grasslands and, if
the periods are long enough, can lead to an increase in tree cover and a decrease
in flammability due to a cooler and moister understory, which are unsuitable for
grasses (UHL; KAUFFMAN, 1990; RAY; NEPSTAD; MOUTINHO, 2005),
leading to a greater reduction in fire intensity, flame length and rate of spread
(HOFFMAN et al., 2011).
It is probable that boundaries between forest and grassland are
undergoing major changes, with forest expansion into open areas in response to
the increase in atmospheric CO2 and mean annual precipitation (BANFAI;
BOWMAN, 2006;BOWMAN; MURPHY; BANFAI, 2010), which enhance
plant growth (DRAKE; GONZÀLEZ-MELER, 1997; LEWIS et al., 2009) by
increasing photosynthetic efficiency, in particular at the seedling and sapling
stage (BOND; MIDGLEY, 2000; LLOYD; FARQUHAR, 2008), and

22
resprouting ability (HOFFMANN et al., 2000). An enhanced growth should
allow woody species an easier escape from the fire-trap, favoring forest
expansion (BOWMAN; MURPHY; BANFAI, 2010).
2.3 Positive interactions !
For a long time the importance of a positive relation among plants had
been neglected in community ecology (CALLAWAY; WALKER, 1997) and
traditional models for plant interactions have emphasized competition where
plants compete for limiting resources,such as light, space, water and nutrients.
However, recently a large body of evidence for the importance of interspecific
positive interactions has accumulated (HUNTER; AARSSEN, 1988;
BERTNESS; CALLAWAY, 1994; CALLAWAY, 1995; CALLAWAY;
WALKER, 1997; BROOKER; CALLAGHAN, 1998). Callaway (1995) states
that although neighbors may compete with one another for resources, they also
can provide benefits,like shade, higher nutrient levels, more available moisture,
soil oxygenation, protection from herbivores, a more favorable soil microflora,
shared resources via mycorrhizae and increased pollinator visits, resulting in
interactions that can be positive for at least one of the species involved.
The majority of facilitation research over the last two decades has been
motivated by the ‘stress-gradient hypothesis’ (SGH), that predicts that the
relative incidence of facilitation and competition will vary inversely across
gradients of physical stress or ecosystem productivity (BERTNESS;
CALLAWAY, 1994). The basic idea of the SGH is that facilitation ‘should be
particularly common in communities developing under high physical stress and
in communities with high consumer pressure’ and ‘where the physical
environment is relatively benign and consumer pressure is less severe, positive
interactions should be rare; as a result, competitive interactions should be the
dominant structuring forces’ (BERTNESS; CALLAWAY, 1994).

23
Given all constraints and stressful conditions for forest species
establishment in open areas, it is probable that forest expansion works as
succession process where a facilitation process dominates with an initial
occupation of the grassland area by colonizer species, smoothing the harsh
grassland conditions, followed by other species. In the grassland, where
environmental conditions are harsh, is probable that after the first trees establish
in the grassland they can facilitate new ones, acting as facilitators
(HOFFMANN, 1996; KELLMAN, 1985; KELLMAN; MIYANISHI, 1982).
Facilitators provide shade preventing lethal temperatures and increasing soil
moisture (PUGNAIRE; VALLADARES, 2007). They also provide nutrient
enrichment by litter (HUNTER; AARSEEN, 1988). Therefore, they allow higher
establishment and growth of forest species in open areas. As succession goes by
and harsh conditions in grasslands turn more suitable for forest species, the
importance of positive interactions probably decline, increasing the importance
of competition and other negative interactions. The gradient from grassland to
forest could be, therefore, in different stages of succession, when environmental
stress is higher in the grassland andlower in the forest. According to the strees-
gradient hypothesis in a gradient like this, interactions can change from
facilitation (harsh environment) to competition (BERTNESS; CALLAWAY,
1994; CALLAWAY; WALKER, 1997).
2.4 Plants strategies and Functional traits
One of the most recognized tradeoffs in terms of plant strategies is the
resource acquisition vs. conservation (also known as fast-slow) (REICH, 2014)
which is connected to the capacity to exploit environments that are rich or poor
in resources (GRIME et al., 1997). Thus, shade-tolerance or intolerance would
be the consequence of this tradeoff between high growth in productive (high
light) conditions and high survival in low light conditions (BAZZAZ et al.,

24
1983; DAVIES, 2001; DENSLOW, 1980, 1987; HARTSHORN, 1980). Swaine
and Whitmore (1988) described two extremes of a continuum of strategies in a
tropical forest environment, where light is a key resource affecting ecological
and physiological processes (TURTON; FREIBURGER, 1997). One group is
composed of species that need direct light incidence to germinate, establish and
grow, having fast growth but also a short life span. The other is made up of
species that can germinate, establish and grow under a closed canopy. Although
such classifications have been considered as over simplified for a rather
continuous gradient of strategies (ALVAREZ- BUYLLA; MARTINEZ-
RAMOS, 1992; BAKER; BURSLEM; SWAINE, 2003), their value is
undeniable, allowing pooling species together in ecologically meaningful groups
(VANCLAY, 1994; CONDIT; HUBBELL; FOSTER, 1996; VAN DEN BERG;
CHAZDON; CORRÊA, 2012).
Because functional traits are related to plant strategies, differences in
environment exploration can be investigated using functional traits that are
advantageous in high-light environments versus in low-light environments
(REICH, 2014). The specific leaf area (SLA, the ratio of leaf area to leaf dry
mass) and leaf dry matter content (LDMC, the ratio of leaf dry mass to fresh
mass) are morphological traits measured at the leaf level that are supposed to
mirror the fast-slow tradeoff, wherein species with a fast strategy have high SLA
and low LDMC and species with a slow strategy have low SLA and high LDMC
(POORTER; GARNIER, 1999). Wood density (WD) is also related to the fast-
slow tradeoff, wherein a low WD is associated to high growth and fast resource
acquisition. On the other hand, a high WD is related to slow growth but high
survival (PÉREZ-HARGUINDEGUY et al., 2013). Allometric traits are also
important in this tradeoff, since resource investment in crown shape and height
is linked to plant strategy (HORN, 1971; POORTER et al., 2003). Shade-
intolerant species are expected to have slender stems and deeper crowns as result

25
of their investment in vertical growth (HORN, 1971; POORTER et al., 2003).
Overall, shade-intolerant species, as resource acquisition strategists, are
expected to have high SLA, low LDMC, low wood density, high growth rates,
high mortality, slender stems and deep crowns.

26
REFERENCES
ADLER, P. B. et al. Functional traits explain variation in plant life history strategies. PNAS, Washington, v. 111, n. 2, p. 740-745, jul. 2014.
ALVAREZ-BUYLLA, E. R.; MARTINEZ-RAMOS, M. Demography and allometry of Cecropia obtusifolia, a neotropical pioneer tree, an evaluation of the climax-pioneer paradigm for tropical rain forests. Journal of Ecology, London, v. 80, n. 2, p. 275-290, jun. 1992.
BAKER, T. R.; BURSLEM, D. F. R. P.; SWAINE, M. D. Associations between tree growth, soil fertility and water avail- ability at local and regional scales in Ghanaian tropical rain forest. Journal of Tropical Ecology, Cambridge, v. 19, n. 2, p. 109-125, mar. 2003.
BANFAI, D. S.; BOWMAN, D. M. J. S. Drivers of rain-forest boundary dynamics in Kakadu National Park, northern Australia: a field assessment. Journal of Tropical Ecology, Cambridge, v. 23, n. 1, p. 73-86, jan. 2007.
BATTILANI, J. L.; SCREMIN-DIAS, E.; SOUZA, A. L. T. Fitossociologia de um trecho da mata ciliar do rio da Prata, Jardim, MS, Brasil. Acta Botanica Brasilica, São Paulo, v. 19, n. 3, p. 597-608, jul. 2005.
BAUDENA, M. et al. Forests, savannas, and grasslands: bridging the knowledge gap between ecology and Dynamic Global Vegetation Models. Biogeosciences, Göttingen, v. 12, n. 6, p. 1833-1848, mar. 2015.
BAZZAZ, F.A. Dynamics of wet tropical forests and their species strategies, In: MEDINA E., MOONEY M.A., VÁSQUEZ-YÁNES C. (Ed.), Physiological ecology of plants of the wet tropics: proceedings of an international symposium held in Oxatepec and Los Tuxtlas, Mexico. W. Junk, The Hague, 1984, p. 233–243.
BECKAGE, B.; PLATT, W. J.; GROSS, L. J. Vegetation, fire, and feedbacks: a disturbance-mediated model of savannas. The American Naturalist, Chicago, v. 174, n. 6, p. 805-818, dez. 2009.
BELL, R.H.V. Notes on elephant-woodland interactions. In: CUMMING, D.H.M. (Ed.) Status and Conservation of Africa’s Elephants and Rhinos. Gland, Switzerland, IUCN, 1984. p. 98–103.�
27
BERTNESS, M. D.; CALLAWAY, R. Positive interactions in communities. Trends in Ecology and Evolution, Maryland Heights, v. 9, n. 5, p. 191-193, mai. 1994.
BOND, et al. The global distribution of ecosystems in a world without fire. New Phytologist, Lancaster, v. 165, n. 2, p. 525-538, nov. 2004.
BOND, W. J. Large parts of the world are brown or black: a different view on the ‘Green World’ hypothesis. Journal of Vegetation Science, Malden, v. 16, n. 3, p. 261-266, jun. 2005.
______. What limits trees in C4 grasslands and savannas?Annual Review of Ecology, Evolution, and Systematics, Palo Alto, v. 39, n. 1, p. 641-659, Dec. 2008.
BOND, W. J.; MIDGLEY, G. F. A proposed CO2-controlled mechanism of woody plant invasion in grasslands and savannas. Global Change Biology, Malden, v. 6, n. 8, p. 865-869, dez. 2000.
______. Carbon dioxide and the uneasy interactions of trees and savannah grasses. Philosophical Transactions of the Royal Society B: Biological Sciences, London, v. 367, n. 1588, p. 601-612, fev. 2012.
BOND, W. J.; WOODWARD, F. I.; MIDGLEY, G. F. The global distribution of ecosystems in a world without fire. New Phytologist, Lancaster, v. 165, n. 2, p. 525-538, fev. 2005.
BOND, W. J. Large parts of the world are brown or black: A different view on the ‘Green World’hypothesis. Journal of Vegetation Science, Malden, v. 16, n. 3, p. 261-266, fev. 2005.
BOWMAN, D. M. J. S. Establishment of two dry monsoon forest species on a fire-protected monsoon forest-savanna boundary, Cobourg Peninsula, northern Australia. Australian Journal of Ecology, Malden, v. 18, n. 2, p. 235-237, jun. 1993.
BOWMAN, D. M. J. S.; MURPHY, B. P.; BANFAI, D. S. Has global envi- ronmental change caused monsoon rainforests to expand in the Australian monsoon tropics?.Landscape Ecology, New York, v. 25, n. 8, p. 1247-1260, out. 2010.
BOWMAN, D. M. J. S.; WALSH, A.; D. J. MILNE. Forest expansion and grassland contraction within a Eucalyptus savanna matrix between 1941 and 1994 at Litchfield National Park in the Australian monsoon tropics. Global

28
Ecology and Biogeography, Malden, v. 10, n. 5, p. 535-548, set./set. 2001.
BROOKER, R. W.; CALLAGHAN, T. V. The balance between positive and negative plant interactions and its relationship to environmental gradients: a model. Oikos, Lund, v. 81, n. 1, p. 196-207, fev. 1998.
BUOSI, D.; FELFILI, J. M. Florística e fitossociologia da mata de galeria na Fazenda Nova Hastinapura, na APA São Bartolomeu, Distrito Federal. Boletim do Herbário Ezechias Paulo Heringer, Brasília, v. 14, n. 1, p. 36-48, jan. 2004.
BURROWS, W. H.; COMPTON, J. F.; HOFFMANN, M. B. Vegetation thickening and carbon sinks in the grazed woodlands of north-east Australia. In: AUSTRALIAN FOREST GROWERS CONFERENCE, 1., 1998, Lismore. Proceedings..Lismore: AFG, 1998. p. 305-316.
CALLAWAY, R. M.; WALKER, L. R. Competition and facilitation: a synthetic approach to interactions in plant communities. Ecology, Washington, v. 78, n. 7, p. 1958-1965, out. 1997.
CALLAWAY, R. M. Positive interactions among plants. The Botanical Review, New York, v. 61, n. 4, p. 306-349, out. 1995.
______. Positive interactions in plant communities and the individualistic-continuum concept. Oecologia, Berlim, v. 112, n. 2, p. 143-149, set. 2007.
CLEMENTS, F. E. Plant succession: An analysis of the development of vegetation. Washington: Carnegie Institution of Washington, 1916. 512 p.
CONDIT, R.; HUBBELL, S. P.; FOSTER, R. B. Assessing the response of plant functional types to climatic change in tropical forests. Journal of Vegetation Science, Malden, v. 7, n. 3, p. 405-416, jun. 1996.
CONNELL, J. H.; SLATYER, R. O. Mechanisms of Succession in Natural Communities and Their Role in Community Stability and Organization. The American Naturalist, Chicago, v. 111, n. 982, p. 1326-1337, nov./dez. 1977.
COOKE, R. Human settlement of central America and northernmost South America: 14,000-8000 BP. Quaternary Internacional, London, v. 49, n. 50, p. 177-190, Oct. 1998.
COUTINHO, L. M. Aspectos ecológicos do fogo no cerrado: I., a temperatura do solo durante as queimadas. Revista Brasileira de Botânica, São Paulo, v. 1, n. 1, p. 93-97, maio 1978.

29
DAVIES, S. J. Tree Mortality and Growth In 11 Sympatric Macaranga Species In Borneo. Ecology, Washington, v. 82, n. 4, p. 920-932, abr. 2001.
DENSLOW, J S. Tropical Rainforest Gaps and Tree Species Diversity. Annual Review of Ecology and Systematics, Palo Alto, v. 18, p. 431-451, nov. 1987.
______. Gap Partitioning among Tropical Rainforest Trees. Biotropica, Malden, v. 12, n. 2, p. 47-55, jun. 1980.
DESJARDINS, T. et al. Changes of the forest-savanna boundary in Brazilian Amazonia during the Holocene revealed by stable isotope ratios of soil organic carbon. Ecosystems Ecology, Heidelberg, v. 108, n. 4, p. 749-756, dez. 1996.
DIAZ, S.; CABIDO, M. Plant functional types and ecosystem function in relation to global change. Journal of Vegetation Science, Malden, v. 8, n. 4, p. 463-474, ago. 1997.
DIETZSCH, L. et al. Caracterização da flora arbórea de dois fragmentos de matade galeria no Parque Canjerana, DF. Cerne, Lavras, v. 12, n. 3, p. 201-210, jul./set. 2006.
DRAKE, B. G.; GONZÀLEZ-MELER, M. L. A. More efficient plants: a consequence of rising atmospheric CO2?.Annual Review of Plant Physiology and Plant Molecular Biology, Palo Alto, v. 48, p. 609-639, jun. 1997.
DUSSART, E.; LERNER, P.; PEINETTI, R. Long-term dynamics of two populations of Prosopis caldenia Burkart. Journal of Range Management, Denver, v. 5, n. 6, p. 685-691, Nov. 1998.
FELFILI, J. M. Diversity, structure and dynamics of a gallery forest in central Brazil. Vegetatio, Dordrecht, v. 117, n. 1, p. 1-15, Mar. 1995a.
______. Growth, recruitment and mortality in the Gama gallery forest in central Brazil over a six-year period 1985-1991. Journal of Tropical Ecology,Cambridge, v. 11, n. 1, p. 67-83, July 1995b.
______. Determinação de padrões de distribuição de espécies em uma mata de galeria no Brasil Central com a utilização de técnicas de análise multivariada. Boletim do Herbário Ezechias Paulo Heringer, Brasília, v. 2, n. 1, p. 35-48, jan. 1998.
______. Diversity of the natural regeneration in the Gama gallery forest
30
in central Brazil. Forest Ecology and Management, Amsterdam, v. 91, n. 3, p. 235-245, Apr. 1997.
FELFILI, J. M. et al. Composição florística e fitossociologia do cerrado sentido restrito no município de Água Boa, MT. Acta Botanica Brasilica, Porto Alegre, v. 16, n. 1, p. 103-112, jan. 2002.
FELFILI, J. M. Floristic composition and phytosociology of the gallery forest alongside the Gama stream in Brasília, DF, Brazil. Revista Brasileira de Botânica, São Paulo, v. 17, n. 1, p. 1-11, jan. 1994.
FORGIARINI, C. et al. In the lack of extreme pioneers: trait relationships and ecological strategies of 66 subtropical tree species. Journal of Plant Ecology, Oxford, v. 8, n. 4, p. 359-367, ago. 2015.
GEIGER, E. L. et al. Distinct roles of savanna and forest tree species in regeneration following fire suppression in a Brazilian savanna. Journal of Vegetation Science, Malden, v. 22, n. 2, p. 312-321, abr. 2011.
GRAY, E. F.; BOND, W. J. Soil nutrients in an African forest/savanna mosaic: Drivers or driven?.South African Journal of Botany, Cape Town, v. 101, p. 66-72, nov. 2015.
GRIME, J. P. et al. Integrated screening validates primary axes of specialization in plants. Oikos, Copenhagen, v. 79, n. 2, p. 259-281, jun. 1997.
GRIME, J. P.; HODGSON, J. G.; HUNT, R. Comparative plant ecology: a functional approach to common british species. London: Chapman & Hall, 1988. 752 p.
GRIME, J. P. Evidence for the Existence of Three Primary Strategies in Plants and Its Relevance to Ecological and Evolutionary Theory. The American Naturalist, Chicago, v. 111, n. 982, p. 1169-1194, nov./dez. 1977.
HARTSHORN, G. S. Neotropical Forest Dynamics. Biotropica, Malden, v. 12, n. 2, p. 23-30, jun. 1980.
HENNENBERG, K. J. et al. Phytomass and Fire Occurrence along Forest-Savanna Transects in the Comoé National Park, Ivory Coast. Journal of Tropical Ecology, Cambridge, v. 22, n. 3, p. 303-311, mai. 2006.
HIROTA, M. et al. Global resilience of tropical forest and savanna to critical transitions. Science, Washington, v. 334, n. 6053, p. 232-235, out. 2011.
31
HOFFMANN, W. A. et al. Elevated CO2 enhances resprouting of a tropical savanna tree. Oecologia, Heidelberg, v. 123, n. 3, p. 312-317, mai. 2000.
______. Fuels or microclimate? Understanding the drivers of fire feedbacks at savanna-forest boundaries. Austral Ecology, Malden, v. 37, n. 6, p. 634-643, set. 2011.
______. Tree topkill, not mortality, governs the dynamics of savanna–forest boundaries under frequent fire in central Brazil. Ecology, Washington, v. 90, n. 5, p. 1326-1337, mai. 2009.
HOFFMANN, W. A. The effects of fire and cover on seedling establishment in a neotropical savanna. Journal of Ecology, London, v. 84, n. 3, p. 383-393, jun. 1996.
HOFFMANN, W. A.; ORTHEN, B.; FRANCO, A. C. Constraintts to seedling success of savanna and forest trees across the savanna-forest boundary. Oecologia, Heidelberg, v. 140, n. 2, p. 252-260, jul. 2004.
HOPKINS, B. Ecological processes at the forest-savanna boundary. In: FURLEY PA, PROCTER J, RATTER JA (Ed.) Nature and dynamics of forest-savanna boundaries. Chapman and Hall, London, 1992. p 21–33.
HORN, H. S. Adaptive geometry of trees. 1 ed. Princeton: Princeton University Press, 1971. 144 p.
HUNTER, A. F.; AARSSEN, L. W. Plants helping plants. BioScience, Oxford, v. 38, n. 1, p. 34-40, jan. 1988.
JOSÉ, J.J; MEDINA, E. Temporal changes in the structure of a Trachypogon savanna protected for 25 years. Acta Oecologica, [S.L], v. 12, n. 2, p. 237-247, jan. 1975.
KELLMAN, M. Forest Seedling Establishment in Neotropical Savannas: Transplant Experiments with Xylopia frutescens and Calophyllum brasiliense. Journal of Biogeography, Malden, v. 12, n. 4, p. 373-379, jul. 1985.
KELLMAN, M.; MEAVE, J. Fire in the tropical gallery forest of Belize. Journal of Biogeography, Oxford, v. 24, n. 1, p. 23-24, Jan. 1997.
KELLMAN, M.; MIYANISHI, K. Forest Seedling Establishment in Neotropical Savannas: Observations and Experiments in the Mountain Pine Ridge Savanna, Belize. Journal of Biogeography, Malden, v. 9, n. 3, p. 193-206, mai. 1982.

32
KELLMAN, M.; TACKABERRY, R.; RIGG, L. Structure and function in two tropical gallery forest communities: implications for forest conservation in fragmented systems. Journal of Applied Ecology, London, v. 35, n. 2, p. 195-206, abr. 1998.
KERSHAW, A. P. The development of rainforest-savanna boundaries in tropical Australia. In: FURLEY PA, PROCTER J, RATTER JA (Ed.) Nature and dynamics of forest-savanna boundaries. Chapman and Hall, London, 1992. p 255–271.
LEDRU, M. P. Late quaternary environmental and climatic changes in central Brazil. Quartenary Research, Washington, v. 39, n. 1, p. 90-98, Jan. 1993.
LEWIS, S. L. et al. Changing ecology of tropical forests: evidence and drivers. Annual Review of Ecology, Evolution, and Systematics, Palo Alto, v. 40, p. 529-549, dez. 2009.
LLOYD, J.; FARQUHAR, G. D. Effects of rising temperatures and [CO2] on the physiology of tropical forest trees. Philosophical Transactions of the Royal Society of London Series B, Biological Sciences, London, v. 363, n. 1498, p. 1811-1817, mai. 2008.
LOPES, S. F.; SCHIAVINI, I. Dinâmica da comunidade arbórea de mata de galeria da Estação Ecológica do Panga, Minas Gerais, Brasil. Acta Botanica Brasilica, Porto Alegre, v. 21, n. 2, p. 249-261, jun. 2007.
MARIMON, B. S. et al. Padrões de distribuição de espécies na mata de galeria do Córrego Bacaba, Nova Xavantina, Mato Grosso, em relação a fatores ambientais. Boletim do Herbário Ezechias Paulo Heringer, Brasília, v. 12, n. 1, p. 84-100, jan. 2003.
MARIMON, B. S.; FELFILI, J. M.; LIMA, E. S. Floristic and phytosociology of the gallery forest of the Bacaba stream, Nova Xavantina, Mato Grosso, Brazil. Edinburgh Journal of Botany, Edinburgh, v. 59, n. 2, p. 303-318, June 2002.
MEAVE, J. et al. Riparian habitats as tropical forests refugia. Global Ecology and Biogeography Letter, Oxford, v. 1, n. 3, p. 69-76, May 1991.
MENDONÇA, R. C et al. Flora vascular do cerrado. In: SANO S. M., ALMEIDA, S. P. (Ed.), Cerrado: Ambiente e Flora. Embrapa, Planaltina, 1998, p. 289–556.
33
MIRANDA, H. S.; BUSTAMANTE, M. M. C.; MIRANDA, A. C. The fire factor. In: OLIVEIRA, P. S.; MARQUIS, R. J. (Ed.). The Cerrados of Brazil: ecology and natural history of a Neotropical Savanna. New York: Columbia University, 2002. p. 51-68.
MURPHY, B. P.; BOWMAN, D. M. J. S. What controls the distribution of tropical forest and savanna?.Ecology Letters, Malden, v. 15, n. 7, p. 748-758, jul. 2012.
OLIVEIRA-FILHO, A. T. et al. Dinâmica da comunidade e populações arbóreas da borda e interior de um remanescente florestal na Serra da Mantiqueira, Minas Gerais, em um intervalo de cinco anos: 1999-2004. Revista Brasileira de Botânica, São Paulo, v. 30, n. 1, p. 149-161, jan./mar. 2007.
OLIVEIRA-FILHO, A. T.; RATTER, J. A. Study of the origin of Central Brazilian forests by the analysis of plant species distribution patterns. Edinburgh Journal of Botany, Edinburgh, v. 52, n. 2, p. 141-194, July 1995.
______. Study of the origin of Central Brazilian forests by the analysis of plant species distribution patterns. Edinburgh Journal of Botany, Edinburgh, v. 52, n. 2, p. 141-194, July 1995.
OLIVEIRA-FILHO, A. T.; RATTER, J. A.; SHEPHERD, G. J. Floristic composition and community structure of a Central Brazilian gallery forest. Flora, London, v. 184, n. 2, p. 103-117, 1990.
OLIVEIRA, E. C. L.; FELFILI, J. M. Estrutura e dinâmica da regeneração natural de uma mata de galeria no Distrito Federal, Brasil. Acta Botanica Brasilica, Porto Alegre, v. 4, n. 19, p. 801-811, out./dez. 2005.
OLIVEIRA, M. C.; FELFILI, J. M. Dinâmica da regeneração natural em mata de galeria perturbada, na Fazenda Água Limpa, DF, em um período de 24 anos. Boletim do Herbário Ezechias Paulo Heringer,Brasília, v. 18, n. 1, p. 65-74, jan. 2006.
ONDEI, S. et al. Post-fire resprouting strategies of rainforest and savanna saplings along the rainforest–savanna boundary in the Australian monsoon tropics. Plant Ecology, New York, p. 1-14, out. 2015.
PALMER, A. R.; ROOYEN, A. F. van. Detecting vegetation change in the southern Kalahari using Landsat TM data. Journal of Arid Environment, London, v. 39, n. 2, p. 143-153, June 1998.
PÉREZ-HARGUINDEGUY, N. et al. New handbook for standardised

34
measurement of plant functional traits worldwide. Australian Journal of Botany, Clayton South, v. 61, n. 3, p. 167-234, abr. 2013.
PINTO, J. R. R.; HAY, J. D. V. Mudanças florísticas e estruturais na comunidade arbórea de uma floresta de vale no Parque Nacional da Chapada dos Guimarães, Mato Grosso, Brasil. Revista Brasileira de Botânica, São Paulo, v. 28, n. 3, p. 523-539, jul. 2005.
PINTO, J. R. R.; OLIVEIRA-FILHO, A. T. Perfil florístico da comunidade arbórea de uma floresta de vale no Parque Nacional da Chapada dos Guimarães, Mato Grosso, Brasil. Revista Brasileira de Botânica, São Paulo, v. 22, n. 1, p. 53-67, abr. 1999.
POORTER, H; GARNIER, E. Ecological significance of inherent variation in relative growth rate. In: PUGNAIRE, F.; VALLADARES, X. (Ed) Handbook of functional plant ecology. New York, USA: Marcel Dekker, 1999, 81–120.
POORTER, L. et al. Architecture of 53 rain forest tree species differing in adult stature and shade tolerance. Ecology, Washington, v. 84, n. 3, p. 602-608, mar. 2003.
PROUS, A. Arqueologia brasileira. Brasília: UnB, 1992. 613 p.
PUGNAIRE, F.; VALLADARES, F. Functional plant ecology. 2 ed. Boca Raton: CRC Press, 2007. 744 p.
RATTER, J. A. Transitions between cerrado and forest vegetation in Brazil. In: FURLEY PA, PROCTER J, RATTER JA (Ed.) Nature and dynamics of forest-savanna boundaries. Chapman and Hall, London, 1992. p 417–429
RAY, D.; NEPSTAD, D.; MOUTINHO, P. Micrometeorological and canopy controls of fire susceptibility in a forested Amazon landscape. Ecological Applications, Washington, v. 15, n. 5, p. 1664-1678, out. 2005.
REDFORD, K. H.; FONSECA, G. A. B. The role of gallery forest in the zoogeography of the Cerrado's non-volant mammalian fauna. Biotropica, Washington, v. 18, n. 2, p. 126-135, Mar. 1986.
REICH, P. B. The world-wide ‘fast–slow’ plant economics spectrum: a traits manifesto. Journal of Ecology, London, v. 102, n. 2, p. 275-301, mar. 2014.
RIBEIRO, J. F.; WALTER, B. M. T. As matas de galeria no contexto do bioma Cerrado. In: RIBEIRO, J. F.; FONSECA, C. E. L.; SOUSA-SILVA, J. C. (Ed.).

35
Cerrado: caracterização e recuperação de matas de galeria. Brasília: EMBRAPA Cerrados, 2001. p. 29-47.
RODRIGUES, R. R. Uma discussão nomenclatural das formações ciliares. In: RODRIGUES, R. R.; LEITÃO-FILHO, H. (Ed.). Matas ciliares: conservação e recuperação. São Paulo: USP/FAPESP, 2000. p. 91-99.
RODRIGUES, R. R.; NAVE, A. G. Heterogeneidade florística das matas ciliares. In: RODRIGUES, R. R.; LEITÃO-FILHO, H. F. (Ed.). Matas ciliares: conservação e recuperação. São Paulo: USP/FAPESP, 2000. p. 45-71.
ROSSATTO, D. R.; HOFFMANN, W. A.; FRANCO, A. C. Differences in growth patterns between co-occurring forest and savanna trees affect the forest–savanna boundary. Functional Ecology, London, v. 23, n. 4, p. 689-698, ago. 2009.
SANAIOTTI, T. M. et al. Past vegetation changes in Amazon savannas determined using carbon isotopes of soil organic matter. Biotropica, Malden, v. 34, n. 1, p. 2-16, mar. 2002.
SCHEFFER, M.; CARPENTER, S. R. Catastrophic regime shifts in ecosystems: linking theory to observation. Trends in Ecology and Evolution, Maryland Heights, v. 18, n. 2, p. 648-656, dez. 2003.
SCHWARTZ, D. et al. Present dynamics of the savanna-forest boundary in the Congolese Mayombe: a pedological, botanical and isotopic (13C and 14C) study. Oecologia, Heidelberg, v. 106, n. 4, p. 516-524, jun. 1996.
SILVA JÚNIOR, M. C. et al. Análise da flora arbórea de Matas de Galeria no Distrito Federal: 21 levantamentos. In: RIBEIRO, J. F.; FONSECA, C. E. L.; SOUSA-SILVA, J. C. (Ed.). Cerrado: caracterização e recuperação de Matas de Galeria. Planaltina: EMBRAPA Cerrados, 2001. p. 142-191.
SILVA, L. C. R. et al. Expansion of gallery forests into central Brazilian savannas. Global Change Biology, Maiden, v. 14, n. 9, p. 2108-2118, set. 2008.
STAVER, A. C.; ARCHIBALD, S.; LEVIN, S. A. The Global Extent and Determinants of Savanna and Forest as Alternative Biome States. Science, Washington, v. 334, n. 6053, p. 230-232, out./out. 2011.
______. Tree cover in sub-Saharan Africa: rainfall and fire constraint forest and savanna as alternative stable states. Ecology, Washington, v. 92, n. 5, p. 1063-1072, mai. 2011.

36
SWAINE, M. D.; WHITMORE, T. C. On the definition of ecological species groups in tropical rain forest. Vegetatio, Dordrecht, v. 75, n. 1/2, p. 81-86, May 1988.
TURTON, S. M.; FREIBURGER, H. J. Edge and aspect effects on the microclimate of a small tropical forest remnant on the Atherton Tableland, northeastern Australia. In: LAURENCE, W. F.; BIERREGAARD, R. O. (Ed.) Tropical forest remmants. Chicago: The University of Chicago. 1997, p.45-54.
UHL, C.; KAUFFMAN, J. B. Deforestation, fire susceptibility and potential tree responses to fire in the eastern Amazon. Ecology, Washington, v. 71, n. 2, p. 437-449, abr. 1990.
VAN DEN BERG, E. Variáveis ambientais e a dinâmica estrutural e populacional de uma floresta de galeria em Itutinga, MG. 2001. 115 p. Tese (Doutorado em Biologia Vegetal) - Universidade Estadual de Campinas, Campinas, 2001.
VAN DEN BERG, E.; CHAZDON, R.; CORRÊA, B. S. Tree growth and death in a tropical gallery forest in Brazil: understanding the relationships among size, growth, and survivorship for understory and canopy dominant species. Plant ecology, New York, v. 213, n. 7, p. 1081-1092, jul. 2012.
VAN DEN BERG, E.; OLIVEIRA-FILHO, A. T. Spatial partitioning among tree species within an área of tropical montane gallery forest in south-eastern Brazil. Flora, London, v. 194, n. 3, p. 249-266, July 1999.
______. Composição florística e estrutura fitossociológica de uma floresta ripária em Itutinga, MG, e comparação com outras áreas. Revista Brasileira de Botânica, São Paulo, v. 23, n. 3, p. 231-253, set. 2000.
VAN DEN BERG, E.; SANTOS, F. A. M. Aspectos da variação ambiental em uma floresta de galeria em Itutinga, MG, Brasil. Ciência Floresta, Santa Maria, v. 13, n. 2, p. 83-98, dez. 2003.
VANCLAY, J. K. Modelling forest growth and yield. 1 ed. Oxfordshire: CABI, 1994. 336 p.
WARMAN, L.; MOLES, A. T. Alternative stable states in Australia’s Wet Tropics: a theoretical framework for the field data and a field-case for the theory. Landscape Ecology, New York, v. 24, n. 1, p. 1-13, jan. 2009.
WHITTAKER, R. H. Communities and ecosystems.2nd ed. New York: Macmillan, 1975. 352 p.

37
WILSON, J. B.; AGNEW, A. D. Q. Positive-feedback switches in plant communities. Advances in Ecological Research, Atlanta, v. 23, p. 263-336, ago. 1992.
WILSON, P. J.; T., K.; HODGSON, J. G. Specific leaf area and leaf dry matter content as alternative predictors of plant strategies. New Phytologist, Lancaster, v. 143, n. 1, p. 155-162, jul. 1999.
!

38
SECOND PART
!!!!!
!
!
PAPER 1 - SHARP DIFFERENTIATION ON THE PERFORMANCE OF PLANT FUNCTIONAL GROUPS ACROSS AN ABRUPT
ENVIRONMENT GRADIENT IN NATURAL EDGES

39
ABSTRACT
Gallery forests within grasslands present natural edges with open environments and offer a unique opportunity to examine how species performances vary across these natural environmental gradients and contribute to the distribution of species in the forest. This task, however, has been hampered by the high species diversity of these ecosystems. Here we asked whether demographic rates of tree functional groups varied with distance to the edge, whether we could explain differences in plant strategies and performance through functional traits and which traits increase growth and which are allowing the survival in natural edges. For this purpose, we examine mortality and recruitment for 30 species existing in the first 10 meters of natural edges of eight different gallery forests, and use demographic data from five annual inventories (2009 - 2013). We aimed to explain differences in strategies and performance of functional groups through functional traits, so we defined a priori plant strategies using functional groups classification based on light requirements for germination and establishment, classifying them in three functional groups, light-demanding, pioneer and shade-tolerant. The shade-tolerant group had the lowest mortality rates and basal area loss while both pioneer and light-demanding species had similar behavior for these rates. There was no difference between groups for recruitment and basal area gainrates. Distance from the edge differentially affected the functional groups in terms of survival and growth. Survival of the pioneer group was enhanced near the edge, but for the light-demanding and shade-tolerant, survival increased toward the forest interior. All groups had higher growth in the grassland and reduced growth in the edge. Those differences in behavior could be explained by differences in functional traits. The majority of the species in natural edges have an acquisition strategy, with higher SLA, lower LDMC, lighter WD, higher growth, deeper crowns and less slender stems. Growth was enhanced by acquisitive traits. However, mortality selected both strategies, but in distinct zones of the edge. Our results showed how strong and sharp the edge gradient is and how the functional groups had growth and survival differentially affected by it.
Keywords: Gradient. Pioneer. Light-demanding. Shade-tolerant. Gallery forest. Dynamic.

40
1 INTRODUCTION !
A gallery forest is narrow strip of forest growing alongside small
streams within the Cerrado biome. Gallery forest edges with natural grasslands
are an amazing opportunity for studying how plant populations and communities
behave in old forest edges. Besides the sharp gradient with the open grassland,
gallery forests also have a strong internal gradient from the streamside toward
the edge. Light, soil moisture and nutrients vary along the gradient reflecting in
a clear turnover of species from the stream towards grassland (KELLMAN;
TACKABERRY; RIGG, 1998; ROSSATO; HOFFMANN; FRANCO, 2009;
VAN DEN BERG; OLIVEIRA-FILHO, 1999). However, those factors can not
satisfactorily explain the sharp feature of the edges. This feature is better
explained by the frequent fire events that take place in the grasslands and
eventually affect the forest- grassland edge, however, extinguishing there (VAN
DEN BERG; OLIVEIRA-FILHO,1999; 2000; VAN DEN BERG; SANTOS
2004; FELFILI 1998; ROSSATO; HOFFMANN; FRANCO, 2009).
Several issues have been investigated along the years, as to which
factors are responsible for those boundaries (KELLMAN; TACKABERRY;
RIGG, 1998; ROSSATO; HOFFMANN; FRANCO, 2009; VAN DEN BERG;
OLIVEIRA-FILHO, 1999), how or if the forest-grassland temporally limits
change (BURROWS; COMPTON; HOFFMANN, 1998; DUSSART; LERNER;
PEINETTI, 1998; PALMER; ROOYEN, 1998; SCHWARTZ et al., 1996;
SILVA et al., 2008) and the nature of the community structure and species
composition in those edges (Coelho et al., in prep., KELLMAN;
TACKABERRY; RIGG, 1998). On the other hand, to understand how natural
edges work it is necessary to examine how species performance varies across
those natural environmental gradients, exploring plant strategies and related

41
functional traits associated to species success or failure in these environments
(ADLER et al., 2014; FORGIARINI et al., 2015; GRIME; HODGSON; HUNT,
1988; WILSON; HODGSON, 1999). Our knowledge regarding those questions
is limited in part because the large number of species present in the forests
hinders generalization. However, approaching this complexity by using
functional groups and evaluating how their responses vary across edges possibly
can capture the main facets of this complex relationship between plant behavior
and environmental variation (DIAZ; CABIDO 1997) and provide insights into
the processes that determine species distributions across the sharp environmental
gradients, such as that one existing between grassland and gallery forest.
One of the most recognized tradeoffs in terms of plant strategies is the
resource acquisition vs. conservation (also known as fast-slow; i.e. rates of
resource acquisition and processing) (REICH, 2014), which is connected with
the capacity to exploit environments that are rich or poor in resources (GRIME
et al., 1997). Thus, shade-tolerance or intolerance would be the consequence of
this tradeoff between high growth in productive (high light) conditions and high
survival in low light conditions (BAZZAZ, 1983; DAVIES 2001; DENSLOW
1980; 1987; HARTSHORN, 1980). Swaine and Whitmore (1988) described two
extremes of a continuum of strategies in a tropical forest environment, where
light is a key resource affecting ecological and physiological processes
(TURTON; FREIBURGER, 1997). One group is composed of species that need
direct light incidence to germinate, establish and grow, having fast growth but
also a short life span. The other is made up of species that can germinate,
establish and grow under a closed canopy and low light conditions. Although
classifications as this one have been considered over simplified for a rather
continuous gradient of strategies (ALVAREZ- BUYLLA; MARTINEZ-
RAMOS, 1992; BAKER; BURSLEM; SWAINE, 2003), their value is
undeniable, allowing pooling species together in ecologically meaningful groups

42
(VANCLAY, 1994; CONDIT; HUBBELL; FOSTER, 1996; VAN DEN BERG;
CHAZDON; CORRÊA, 2012).
Because functional traits are related to plant strategies, differences in
environmental exploration can be investigated using functional traits that are
advantageous in a high-light environment versus low-light (REICH, 2014). The
specific leaf area (SLA, the ratio of leaf area to leaf dry mass) and leaf dry
matter content (LDMC, the ratio of leaf dry mass to fresh mass) are
morphological traits measured at the leaf level that are supposed to mirror the
fast-slow tradeoff, wherein species with fast strategy have high SLA and low
LDMC and species with a slow strategy have low SLA and high LDMC
(POORTER; GARNIER 1999). Wood density (WD) is also related to the fast-
slow tradeoff, wherein a low WD is associated to high growth and fast resource
acquisition. On the other hand, a high WD is related to slow growth but high
survival (PÉREZ-HARGUINDEGUY et al., 2013). Allometric traits are also
important in this tradeoff, since resource investment in crown shape and height
is linked to plant strategy (HORN, 1971; POORTER et al., 2003). Shade-
intolerant species are expected to have slender stems and deeper crowns as a
result of their investment in vertical growth (HORN, 1971; POORTER et al.,
2003). Overall, shade-intolerant species, as resource acquisition strategists, are
expected to have high SLA, low LDMC, low wood density, high growth rates,
high mortality, slender stems and deep crowns. Nevertheless, the relationship
between functional traits and plant strategies have been tested for forest
environments (FORGIARINI et al., 2015; POORTER et al., 2003), where gap
openings are the main cause of light increase. However, forest gaps are
transitory (SWAINE; WHITMORE, 1988), unlike forest edges where high light
incidence is rather permanent.
Considering the need for better understanding of the relationship
between the natural environment gradient, demographic rates, strategies and

43
performances of plants and functional traits we aimed to answer the following
questions:
1) Are the demographic rates different between functional groups?
Overall, we expected a higher annual mortality, recruitment and basal area
change for the pioneer group, compared to the other groups, as a result of their
investment in fast growth, which may also result in higher mortality.
2) How do environmental gradients affect survival and growth of
different functional groups? We expected pioneers to perform better (high
survival and growth) in the immediate edge with the surrounding grassland,
where light conditions are likely to be more favorable. Shade-tolerant species
must be more successful towards the interior of the plots, where the canopy is
more developed and shadeis greater, and light-demanding species would occupy
an intermediate position between both groups;
3) Could we explain differences in functional group strategies and
performance through functional traits? We expected that pioneer groups will
have a set of traits and behaviors that distinguish them from the non-pioneers,
such as higher SLA, lower LDMC, lighter wood density, higher growth rates,
higher mortality, slender stems and deeper crowns;
4) Which traits increase growth and which allow the survival in natural
edges? We expected that the high light and disturbed environment in the edges
will act as an environmental filter selecting traits related to the acquisition
strategy, like fast growth, high SLA and high stem slenderness. On the other
hand, we expect low LDMC, low WD and crown format in these conditions
2 METHODS !
Study Sites – A gallery forest is narrow strip of forest growing alongside
small streams within the Cerrado biome. We studied 8 sites where the gallery
forest had boundaries with natural grasslands in the south of Minas Gerais State,
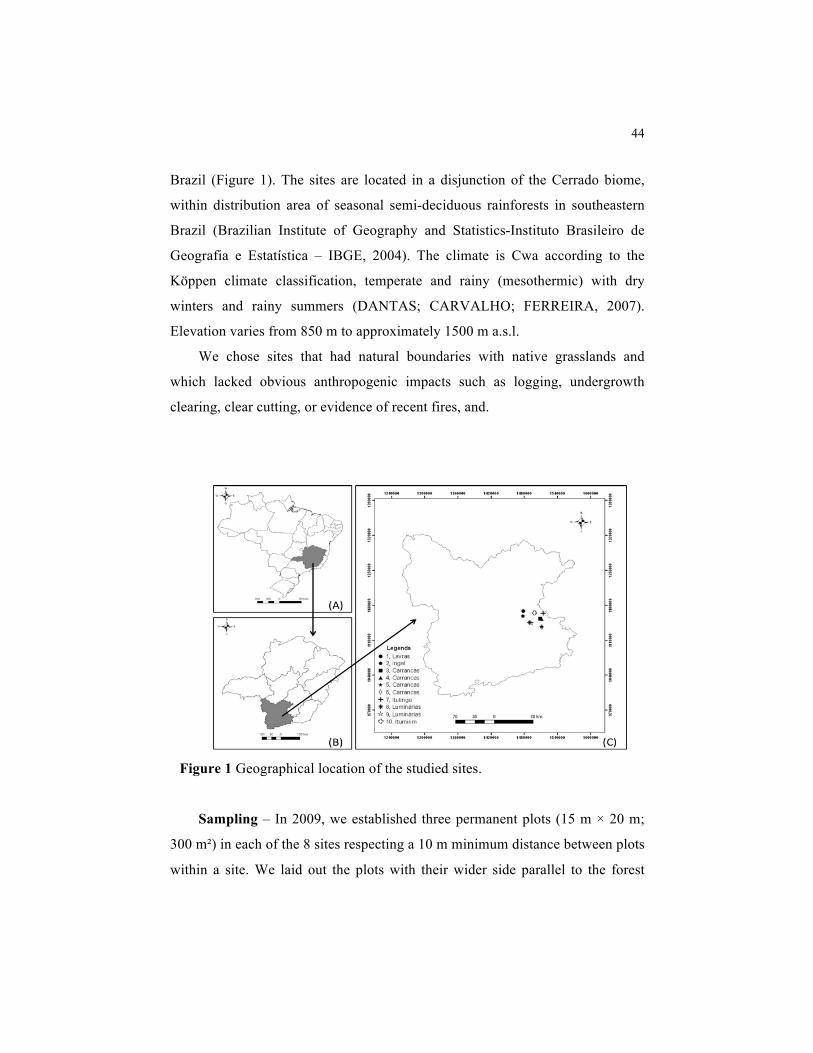
44
Brazil (Figure 1). The sites are located in a disjunction of the Cerrado biome,
within distribution area of seasonal semi-deciduous rainforests in southeastern
Brazil (Brazilian Institute of Geography and Statistics-Instituto Brasileiro de
Geografia e Estatística – IBGE, 2004). The climate is Cwa according to the
Köppen climate classification, temperate and rainy (mesothermic) with dry
winters and rainy summers (DANTAS; CARVALHO; FERREIRA, 2007).
Elevation varies from 850 m to approximately 1500 m a.s.l.
We chose sites that had natural boundaries with native grasslands and
which lacked obvious anthropogenic impacts such as logging, undergrowth
clearing, clear cutting, or evidence of recent fires, and.
Figure 1 Geographical location of the studied sites.
Sampling – In 2009, we established three permanent plots (15 m × 20 m;
300 m²) in each of the 8 sites respecting a 10 m minimum distance between plots
within a site. We laid out the plots with their wider side parallel to the forest
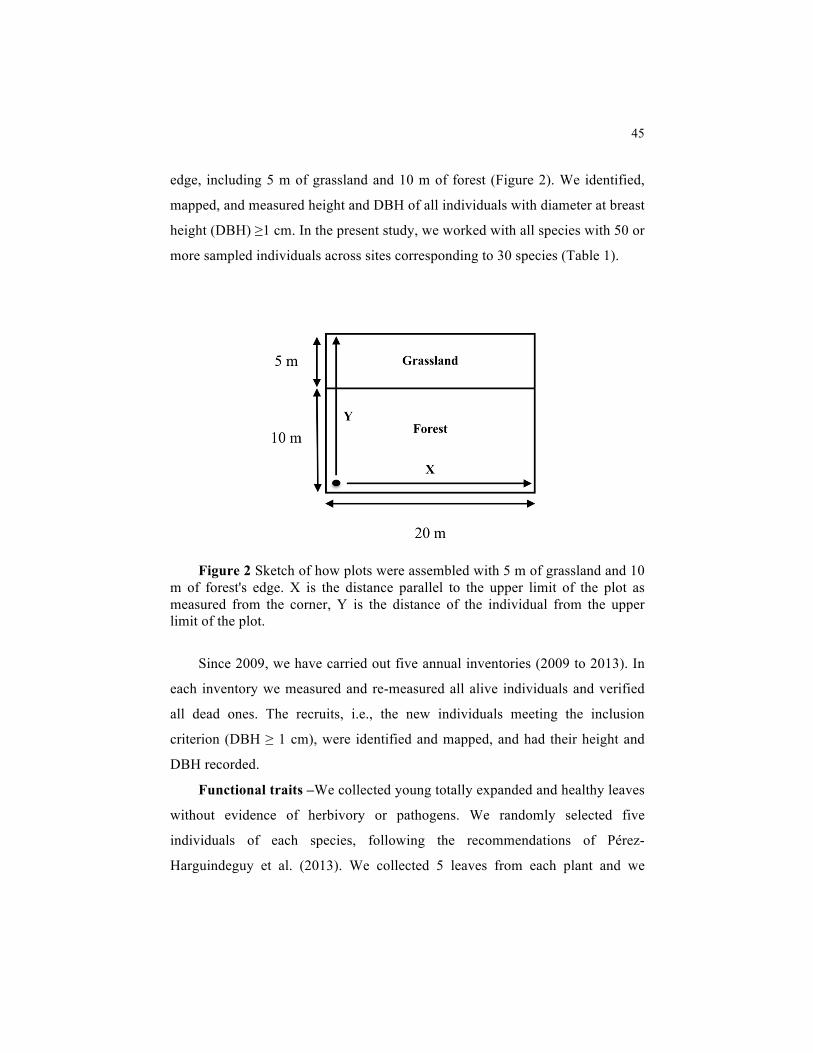
45
edge, including 5 m of grassland and 10 m of forest (Figure 2). We identified,
mapped, and measured height and DBH of all individuals with diameter at breast
height (DBH) ≥1 cm. In the present study, we worked with all species with 50 or
more sampled individuals across sites corresponding to 30 species (Table 1).
Figure 2 Sketch of how plots were assembled with 5 m of grassland and 10
m of forest's edge. X is the distance parallel to the upper limit of the plot as measured from the corner, Y is the distance of the individual from the upper limit of the plot.
Since 2009, we have carried out five annual inventories (2009 to 2013). In
each inventory we measured and re-measured all alive individuals and verified
all dead ones. The recruits, i.e., the new individuals meeting the inclusion
criterion (DBH ≥ 1 cm), were identified and mapped, and had their height and
DBH recorded.
Functional traits –We collected young totally expanded and healthy leaves
without evidence of herbivory or pathogens. We randomly selected five
individuals of each species, following the recommendations of Pérez-
Harguindeguy et al. (2013). We collected 5 leaves from each plant and we

46
measured leaf thickness using a digital micrometer and then weighed and
scanned them. After measurements, the leaves were dried during 72 h at 60 °C
and weighed again.
For wood densityanalysis, we collected samples of each species, following
the recommendations of Pérez-Harguindeguy et al. (2013). In order to ensure the
homogeneous distribution of water before calculating the green volume, we
placed samples in containers with water for thirty minutes and then the volume
was measured through the method of water displacement. After such procedure,
samples were dried until constant weight and were then weighed (PÉREZ-
HARGUINDEGUY et al., 2013).
Based on the measurements describedabove, we obtained the following
traits: specific leaf area (SLA, mm2 mg-1); leaf dry mass content (LDMC, %) and
wood specific gravity (g.cm-3).
Allometric traits – For allometric measurements we randomly selected 25
trees of each species within plots. We measured total height (Ht), height of the
first bifurcation (Hb), height of the first leaves from the ground (HL), crown
diameter (CD) in two perpendicular directions, stem diameter at breast height
(DBH at 1.3 m from the ground), stem diameter at 10% of the height. Using
these measures, we calculated the following indices: crown format (CF),
calculated as the ratio of tree crown width to crown depth (crow depth was
calculated as the difference between tree height and height of the first leaves);
stem slenderness (RTH), calculated as the ratio of tree height to tree CBH
(circumference at breast height).
Plant strategies –Functional groups can be defined as a group of different
species that respond in a similar way to a set of environmental factors
(GOURLET-FLEURY et al., 2005), in other words, a group of species with a
similar strategy. We defined a priori plant strategies using functional groups
classification based on light requirements for germination and establishment:
47
pioneer (fast growth – acquisition strategy) and non-pioneer (slow growth –
conservative strategy) (SWAINE; WHITMORE, 1988). Pioneers (P) were those
species whose seeds only germinate in sites with direct light at the ground level
for at least part of the day. Their germination is triggered by an increase in red
light or soil temperature fluctuation and their seedlings also require direct light
for establishment and growth. On the other hand, non-pioneers germinate and
their seedlings establish under the canopy without direct light (SWAINE;
WHITMORE, 1988). We subdivided this last group into two others: light-
demanding species (L), which demand more solar radiation for growth and have
faster growth; and shade-tolerant species (S), which require very little light and
grow slowly (SWAINE; WHITMORE 1988). We based our classification on
studies developed in the same region (NUNES et al., 2003; OLIVEIRA-FILHO
et al., 1994A, 1994B;OLIVEIRA-FILHO; MELLO; SCOLFORO, 1997;
PEREIRA et al., 2010; PINTO; HAY, 2005). We recognize the existence of
other classifications and approaches to classify functional groups, however, we
believe that the classification proposed by Swaine and Whitmore is suitable for
our analysis, since it is based on light requirements, which is a major defining
environmental condition for natural edges. We used the Kruskal-Wallis test to
seek for differences in functional and allometric traits between groups.
Demographic Rates – We calculated annual mortality rates (M),
recruitment (R) and net change (ChN) rates in terms of individuals, and loss (L),
gain (G) and net change (ChBA) of basal area for each site and species. We
calculated M, R, L and G following Sheil, Jennings and Savill, (2000):
; (1)
; (2)

48
; (3)
(4)
where t is the time between censuses in years (precisely 1 year in the
present case); N0 and Nt are the initial and final individual tree counts,
respectively; Nm and Nr are the number of dead trees and recruits, respectively;
BA0 and BAt are the initial and final tree basal areas, respectively; BAm is the
basal area of dead trees; BAr is the basal area of recruits; and BAd and BAg are
the decrease (due to trunk break or partial loss) and increase in the basal area of
surviving trees, respectively.
We calculated ChN and ChBA using the following equations (KORNING;
BALSLEV, 1994):
; (5)
. (6)
Finally, we calculated those rates for each functional group separately within each site.
Effect of environmental gradient and size on survival and growth – To
examine how annual growth (Gr, %.year-1) and survival (S) change with distance
from the edge and with the size of individuals we fited Bayesian models, in
which the growth and survival probability were a function of the size of the
individual and distance Y (Figure 2). The growth model takes the form:
(7)
Growth was calculated as:

49
(8)
Survival was modelled as a logistic:
(9)
Rather than fit separate models for each functional group, we included a
second level (parameter β) in the hierarchical model for each parameter in
Equations 1 and 2. For instance, Parameter β for functional group i in Eq.. 2 is
modelled as:
βi = normal(µi,τi) (10)
For each model we calculated the predicted values and the credible
intervals for the four following distances: in grassland (upper limit of plot), edge
(5 m from upper limit), 5 m from edge (10m from upper limit) and 10 m from
edge (15 m from upper limit).
Functional traits and survival – To answer which functional and
allometric traits affected growth (annual growth rate, %. yr-1) and survival at
edges we fitted Bayesian models and we modeled mortality as a Binomial
process and growth as a Gaussian process.
(11)
(12)
we used the predictors: SLA, LDMC, stem slenderness, crown format and
Relative Growth Rate (RGR), for survival and SLA, LDMC, stem slenderness
and crown format for growth. RGR as calculated as:
(13)

50
where DBHi and DBHf are the inicial and final DBH, respectively. ti and tf
are the initial and final years, respectively.
We obtained posterior distributions of parameters of both models using the
Markov Chain Monte Carlo (MCMC) method. We monitored convergence by
running three different chains with different start values. From the posterior
distribution we computed the mean and credible intervals (CI) for all parameters
and the significance of parameters was assessed by a 95% CI, and, for
evaluating discrepancy, we calculated Bayesian p-value (GELMAN; MENG;
STERN, 1996).
For all analyses, we used the R software, version 3.1.1. For the Bayesian
models, we used the RJAGS package (PLUMMER, 2014). For the Kruskal-
Wallis tests, we used the Agricolae package (MENDIBURU, 2014).
3 RESULTS
Demographic rates and functional groups – The recruitment and basal
area gain rates were equal for all groups and only mortality and basal area loss
were lower for shade-tolerant group (Table 2 and 3).
For the majority, the recruitment was higher than mortality, leading to a
positive net change rate (Table 2). When considering gain and loss of basal area
rates, gain was higher than loss for all the functional groups, also leading to
positive net change rates. The recruitment rates were higher than mortality rates
for 2011-2012 and 2013-2014 and lower than mortality for 2010-2011 and 2012-
2013 (Table 2). Despite the two periods with negative net change rate in terms
of individuals, the net change in basal area was negative only in 2012-2013
(Table 3), as the surviving individuals gained enough basal area to compensate
for the loss in terms of basal area related to mortality.

51
Since negative rates could be a consequence of fires that took place during
both periods, we recalculated the rates, removing sites that burned: Site 9 (2010-
2011) and Site 8 (2012-2013). The exclusion of Site 9 for the 2010-2011 period
did not lead to recruitment higher than mortality or a positive net rate change in
number of individuals, but there was a decrease in mortality (from 4.79 % year-1
to 3.67% year-1) and an increase in the net change rate for number of individuals
(from -1.56% year-1 to 0.00 % year-1). However, the basal area loss rate (11.09
% year-1) continued to be higher than the gain rate (7.75 % year-1) and the net
change rate continued to be negative (-1.34 % year-1). For the 2012-2013 period,
removing Site 8 led to higher recruitment than mortality (M = 3.21 % year-1; R =
5.71 % year-1) and to a positive net change rate in number of individuals (2.66 %
year-1). For basal area, all rates continued positive (L = 6.10 year-1; G = 10.93
year-; ChBA = 5.35 year-1).
Growth, environmental gradient and size – The Gaussian model for
growth based on size and distance had a good fit for all groups, since p-values
were close to 0.50 (p-value (P)=0.50; p-value (L)= 0.49; p-value (S)=0.50). Size
and distance had a negative effect on growth for all the groups (Figure 3).
Pioneers had the highest growth, and shade-tolerant had the lowest (Figure 4).
There was a decline in growth from grassland toward the interior for all groups
(Figure 4). Although the effect of size was negative, its effect was much weaker
than the distance effect (Figure 3 and 4).
Probability of survival, environmental gradient and size – The binomial
model for survival had a good fit with Bayesian p-value of 0.49. Size had a
positive effect on survival of pioneer and light-demanding groups but had a non-
significant effect on survival of shade-tolerant species. Distance had a positive
effect on survival of light-demanding and shade-tolerant species, but a negative
effect on pioneer group survival (Figure 3). In grasslands and edges the pioneer
group had highest survival regardless of size, however, deeper inside the forest
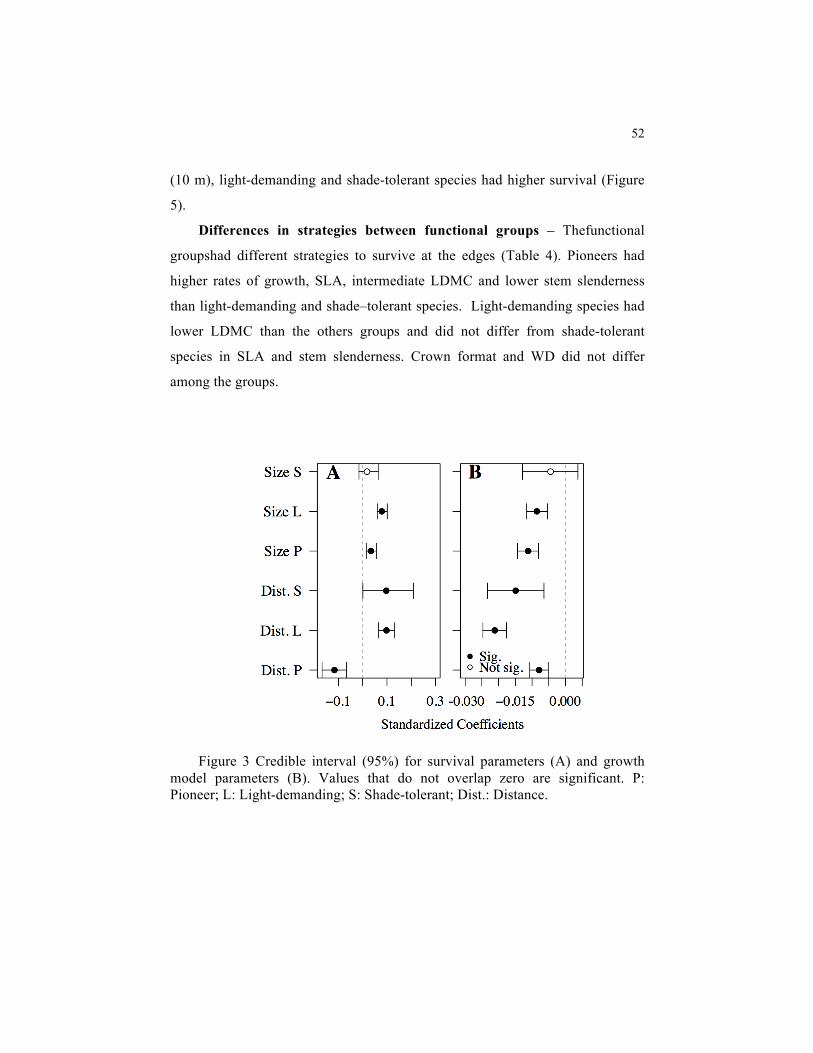
52
(10 m), light-demanding and shade-tolerant species had higher survival (Figure
5).
Differences in strategies between functional groups – Thefunctional
groupshad different strategies to survive at the edges (Table 4). Pioneers had
higher rates of growth, SLA, intermediate LDMC and lower stem slenderness
than light-demanding and shade–tolerant species. Light-demanding species had
lower LDMC than the others groups and did not differ from shade-tolerant
species in SLA and stem slenderness. Crown format and WD did not differ
among the groups.
Figure 3 Credible interval (95%) for survival parameters (A) and growth
model parameters (B). Values that do not overlap zero are significant. P: Pioneer; L: Light-demanding; S: Shade-tolerant; Dist.: Distance.
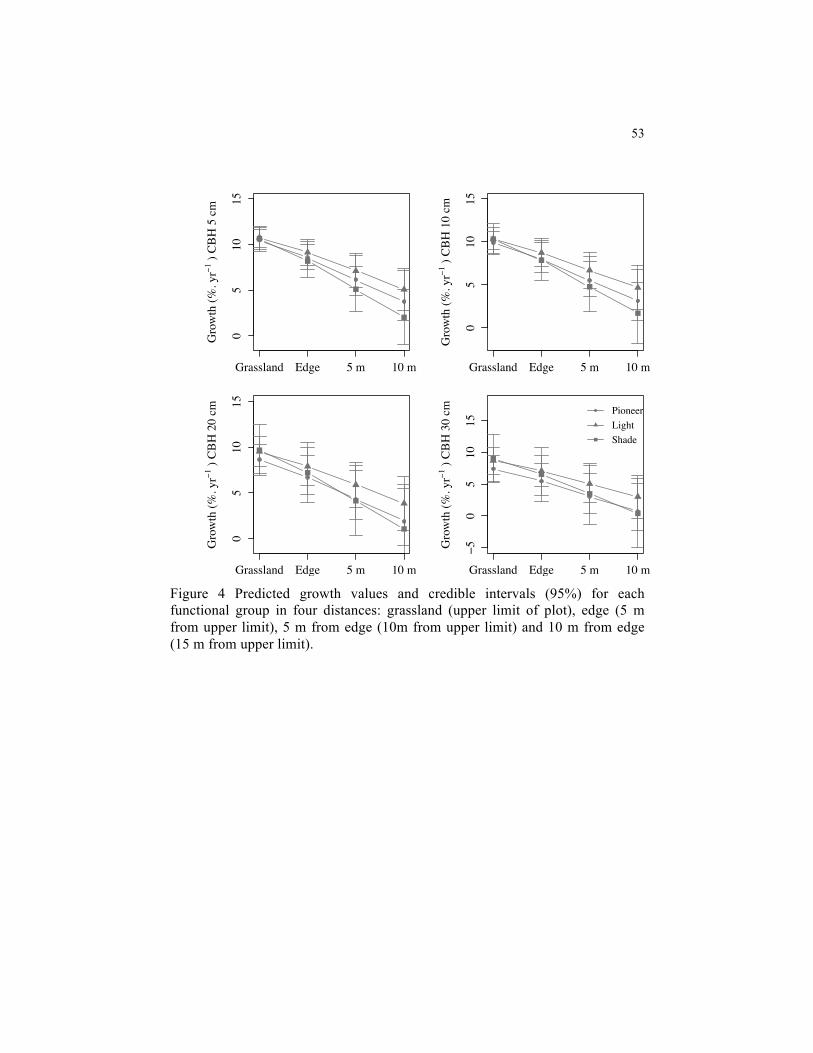
53
Figure 4 Predicted growth values and credible intervals (95%) for each functional group in four distances: grassland (upper limit of plot), edge (5 m from upper limit), 5 m from edge (10m from upper limit) and 10 m from edge (15 m from upper limit).
05
1015
Gro
wth
(%. y
r−1 )
CB
H 5
cm
Grassland Edge 5 m 10 m
05
1015
Gro
wth
(%. y
r−1 )
CB
H 1
0 cm
Grassland Edge 5 m 10 m
05
1015
Gro
wth
(%. y
r−1 )
CB
H 2
0 cm
Grassland Edge 5 m 10 m
−50
510
15
Gro
wth
(%. y
r−1 )
CB
H 3
0 cm
Grassland Edge 5 m 10 m
PioneerLightShade

54
Figure 5 Predicted survival probability values and their credible intervals (95%) for each functional group in four distances: grassland (upper limit of plot), edge (5 m from upper limit), 5 m from edge (10m from upper limit) and 10 m from edge (15 m from upper limit).
Effect of functional traits on growth and survival - Both the binomial
and Gaussian model had a good fit with p-value of 0.51 and 0.50, respectively.
LDMC, crown format and stem slenderness were significant for growth (Figure
6). Species with small LDMC, deeper crown and slimmer stem grew faster.
RGR, SLA and LDMC were significant for survival (Figure 6). Species with
4050
6070
8090
100
Prob
abili
ty o
f Sur
viva
l (%
) DB
H 5
cm
Grassland Edge 5 m 10 m
4050
6070
8090
100
Prob
abili
ty o
f Sur
viva
l (%
) DB
H 1
0 cm
Grassland Edge 5 m 10 m
4050
6070
8090
100
Prob
abili
ty o
f Sur
viva
l (%
) DB
H 2
0 cm
Grassland Edge 5 m 10 m
4050
6070
8090
100
Prob
abili
ty o
f Sur
viva
l (%
) DB
H 3
0 cm
Grassland Edge 5 m 10 m
PioneerLightShade

55
higher RGR and LDMC and lower SLA and wood density have a higher
survival probability.
Figure 6 Credible intervals (95%) for growth model parameters (A) and for
survival model parameters (B). Values that do not overlap zero are significant. SS: Stem slenderness; CF: Crown format; SLA: Specific leaf area; LDMC: Leaf dry matter content; WD: Wood density; RGR: Relative Growth Rate.
4 DISCUSSION
We assessed how the environmental gradient in gallery forest edges affects
the dynamic rates of different functional groups classified based on their light
requirements. We also investigated how different plant strategies, evaluated by
functional traits, lead to different performances in natural edges. Our results
showed how strong and sharp the edge gradient is and how functional groups
had their growth and survival differentially affected by it. Shade-intolerant
species were favored by grassland proximity and shade-tolerant species were
favored by canopy closure. Functional traits explained differences in behaviour
−0.010 0.000 0.005
Standardized Coefficients
WD
LDMC
SLA
CF
SS A
−0.3 −0.1 0.1 0.3
Standardized Coefficients
WD
LDMC
SLA
RGR
CF
SS
Sig.Not sig.
B

56
between groups with different resource use. A large part of the species in natural
edges have an acquisition strategy and growth was enhanced by those traits.
However, mortality selected both strategies, but in distinct zones of the edges,
i.e. groups with an acquisition strategy have a higher survival by the edge, while
groups with a conservative strategy survive more toward the interior.
Differences in demographic rates - We expected shade-tolerant species to
have lower mortality, recruitment and basal area gain. However, they only had
lower mortality leading to a lower basal area loss. This is strong evidence that
despite the high levels of light in the edges, due to vertical and lateral gaps
(VAN DEN BERG; SANTOS, 2003), the light gradient is abrupt, allowing
coexistence of light-demanding and shade-tolerant species in these 10 m wide
plots. Actually, we found that although the shade-tolerant species have lower
number of individuals than the pioneer and light-demanding groups, they gained
individuals, basal area and even had a lower mortality and basal area loss than
the other groups. Therefore, regardless of all disturbances that take place at
natural edges and their environmental conditions, shade-tolerant species are
thriving well in the gallery forest edges, even increasing in number and biomass
because of the sharp environmental gradient, which allows shade-tolerant to
survive a few meters inside the forest.
For all groups we found mortality rates lower than recruitment and a
positive net change rate in terms of number of individuals and basal area. We
also found a higher gain than loss, although, for years when there were fires, we
found higher mortality and basal area losses. The increase in number of
individuals and basal area in forest edges (positive rates of vegetation change in
terms of number of individuals and basal area) confirm the expansion of the
forests towards the surrounding natural grasslands, a trend found by several
authors (BURROWS; COMPTON; HOFFMANN, 1998; DUSSART; LERNER;
PEINETTI, 1998; PALMER; ROOYEN 1998; SCHWARTZ et al., 1996;

57
SILVA et al., 2008). However, after a fire event, the number of individuals in
Site 8 grassland reduced and some studies have shown that in the savanna-forest
boundary, forest can expand and retreat as a consequence of disturbances
(HOPKINS, 1992; WOODWARD; DIAMENT,1991). Fire suppression is
therefore important for recruitment in the grassland, since fire seems to be the
most important constraint to forest expansion in Brazil (HOFFMANN et al.,
2009).
Environmental gradient effect on survival and growth - Pioneer species
had a higher survival probability closer to the edge, whereas the survival of
climax species (whether shade tolerant or not) increased with increasing distance
from the immediate edge. In addition, the survival of pioneer and light-
demanding species depends on their DBH, whereas shade-tolerant species
survival is only affected by the distance to the edge. The height of shade-tolerant
species is less variable than the height of the other groups since they are species
commonly restricted to the understory of gallery forests. This contributes to the
non-detection of a plant-size effect on their survival, if any effect actually exists.
All groups grew faster in the grasslands. Pioneer species need light to
germinate and grow so they benefit from the permanent gap condition found in
the edge, however this permanent gap condition only exists in the first few
meters, leading to a higher mortality risk and lower number of individuals
toward the interior probably due to shading. For the pioneer species, light is,
therefore, the most important factor for their survival, regardless of the
disturbances and harsh microclimatic environments occurring at the forest edge.
On the other hand, although climax species also benefit from the higher
luminosity leading to higher growth toward the grassland, the harsher conditions
there have a price in terms of survival. In addition to the high light conditions in
the immediate edge, there are also microclimatic differences, such as lower
humidity and higher temperature variations (MURCIA, 1995). We did find soil

58
moisture differences between grassland and forest during the dry season
(BRAGION, in prep.), that is a limiting factor because of drought stress
(SCHOLES; ARCHER 1997). These environmental conditions handicap climax
species (LAURANCE; PERES, 2006), increasing mortality and reducing the
number of individuals in grassland and first meters of edge. Therefore, for
climax species, the unsuitable microclimatic conditions in the exposed edge is
the most important factor for their survival, although, for the surviving trees, the
growth is favored by higher light availability.
Differences in strategies between functional groups – Even though we
worked with subjective groups, we found significant similarities within groups
and differences in strategies among the groups. SLA and LDMC are markers of
position in the fundamental tradeoff between acquiring or conserving resources
(GARNIER et al., 2001), and we found differences between groups, with
pioneer species with higher SLA and lower LDMC (acquiring strategy) and
shade-tolerant species with lower SLA and higher LDMC (conservative
strategy).
Groups had a different spatial distribution at the edges and are affected by
the edge in different ways. Pioneer species were favored in the most exposed
section of the edge while shade-tolerant species were favored in the opposite
side deeper inside the forest, with the light-demanding group in an intermediary
situation. Those differences in behavior can be explained by functional traits.
Pioneer species are favored in the most exposed section of the edge because they
have a strategy focused on acquiring resources, resulting in low investment in
traits related to endurance and longevity (ALVAREZ-BUYLLA; MARTINEZ-
RAMOS, 1992). Their leaves with high SLA and low LDMC are productive
(POORTER; VAN DER WERF, 1998; VAN DER WERF et al., 1998)"allowing
them to have higher growth and to grow more than climax species in a more
productive environment, such as the immediate edge. On the other hand, shade-
59
tolerant species have low SLA and higher LDMC, features that favor efficiency
in resource use and, consequently, survival and longevity, being more
advantageous toward the interior, when light is scarce. Their investment in
resource conservation mirrors their slower growth rates more than pioneer
species. Light-demanding species in turn have intermediate traits which reflect
in their intermediate growth and intermediate response to the edge.
Normally, pioneer species are associated with investment in height, having
slender stems (POORTER et al., 2003). On the contrary, we found pioneer
species to be the less slender group. This is a consequence of environmental
conditions at the front of the edge, where pioneers are found. In a closed forest
condition pioneer species colonize gaps (SWAINE; WHITMORE 1988), and
although those gaps receive a high levels of light, they form a more enclosed
environment than natural edges, with light coming predominantly from the top.
Under this condition investment in height improves survival and further growth.
However, in natural edges, the lateral light incidence is permanent implying in
no need for height growth. Besides this, the higher wind exposureof the edges
could lead to higher damage for taller trees. Therefore, in natural edges, due to
the environmental conditions, pioneers have a less slender trunk than climax
species.
Functional traits and growth - We found that some functional and
allometric traits enhance growth. In the edges, species with deeper crowns,
instead of wider, grew more. A crown shape that can boost light interception is
crucial and given that in edges light reaches the forest not only vertically but
also laterally, deeper crowns allows a better interception of lateral light
promoting higher growth. The crown shape is also linked with successional
position (HORN, 1971) and because early-successional species (thus pioneers
and light-demanding) are fast-growing species with low investment in wood
they can not bear wide crowns. Shade-intolerant species are multilayer, with

60
narrow crowns and several branches disposed along those layers (HORN, 1971).
However, self-shading in deeper crown pays off only in high light environments,
such as natural edges.
Our results support the acquisition-conservation tradeoff (DIAZ et al.,
2004; WRIGHT et al., 2004) where it is expected that species with the strategy
of a rapid production of biomass, i.e. right growth rates, will have low LDMC.
In natural edges, species with low LDMC grow more. LDMC is a functional
marker of plant strategy and low LDMC is linked to shade-intolerant species and
its also linked to productive and often highly disturbed environments (PÉREZ-
HARGUINDEGUY et al., 2013), such as natural edges. We expected that
growth would have a positive relationship with stem slenderness, but we found
the opposite, less slender stems grew more. This could be a consequence of how
RGR is measured, since it is based on the trunk diameter increment. However,
we also found that pioneer species have less slender trunks and also have higher
growth. Therefore, having a less slender stem can be an advantageous trait in
natural edges for the reasons put forth previously.
Functional traits and survival - Climate, disturbance and site productivity
act as consecutive environmental filters that select certain traits (WOODWARD;
DIAMENT 1991). In natural edges, a high productive environment, due to the
high light incidence, environmental filters are expected to select traits associated
with resource acquisition. However, we found species with traits of both
strategies, acquisition and conservation. Survival is enhanced by lower SLA and
higher LDMC, both features of shade-tolerant species and of conservation
strategy. Survival is also enhanced by higher growth and lower WD, features of
shade-intolerant species and of an acquisition strategy. We found that
probability of survival varies with distance from the edge and among the
functional groups. As mentioned before, pioneer species have a higher survival
probability closer to the edge, whereas the survival of climax species (whether

61
shade tolerant or not) increased with increasing distance from the edge. So, in
this short gradient, both strategies are selected but in distinct zones of the edge.
The same effect was not observed for growth because all groups grow less
toward the interior, thus the effect of the gradient on growth did not change with
functional group.
Synthesis - Our study showed the nature of strong and sharp gradients of
natural edges in gallery forests, where in a few meters, canopy coverage changes
completely. Growth and survival of groups with different light use strategies
varied differentially and strongly along the sharp gradient of only 10 m studied
here. Shade-intolerant species were favored by grassland proximity and shade-
tolerant species were favored by canopy closure. Those differences in behavior
can be explained by differences in functional traits. A large part of the species in
natural edges have an acquisition strategy, with higher SLA, lower LDMC,
lighter WD, higher growth, deeper crowns and less stem slenderness. Growth
was enhanced by acquisitive traits. However, mortality selected both strategies,
but in distinct zones of the edge. We encourage further studies focusing on the
mechanisms behind forest expansion as to if/how pioneer species facilitate non-
pioneer establishment; and the long-term effect of fire as a forest expansion
suppressor.
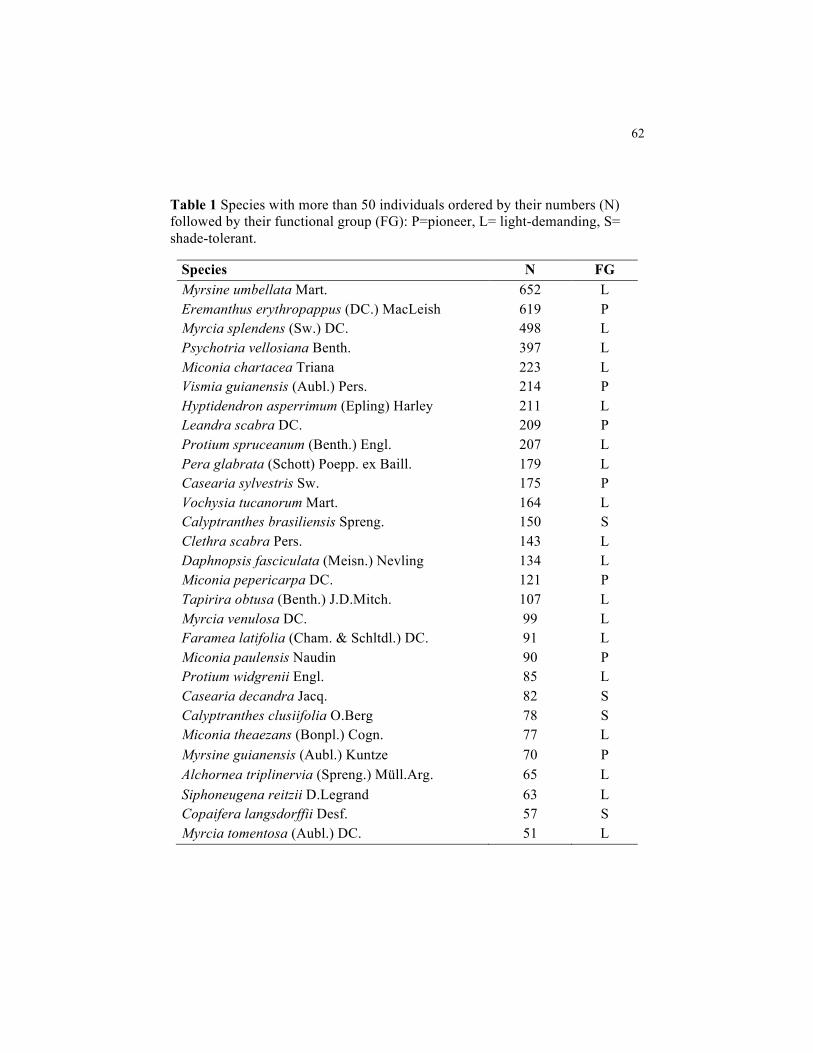
62
Table 1 Species with more than 50 individuals ordered by their numbers (N) followed by their functional group (FG): P=pioneer, L= light-demanding, S= shade-tolerant.
Species N FG Myrsine umbellata Mart. 652 L Eremanthus erythropappus (DC.) MacLeish 619 P Myrcia splendens (Sw.) DC. 498 L Psychotria vellosiana Benth. 397 L Miconia chartacea Triana 223 L Vismia guianensis (Aubl.) Pers. 214 P Hyptidendron asperrimum (Epling) Harley 211 L Leandra scabra DC. 209 P Protium spruceanum (Benth.) Engl. 207 L Pera glabrata (Schott) Poepp. ex Baill. 179 L Casearia sylvestris Sw. 175 P Vochysia tucanorum Mart. 164 L Calyptranthes brasiliensis Spreng. 150 S Clethra scabra Pers. 143 L Daphnopsis fasciculata (Meisn.) Nevling 134 L Miconia pepericarpa DC. 121 P Tapirira obtusa (Benth.) J.D.Mitch. 107 L Myrcia venulosa DC. 99 L Faramea latifolia (Cham. & Schltdl.) DC. 91 L Miconia paulensis Naudin 90 P Protium widgrenii Engl. 85 L Casearia decandra Jacq. 82 S Calyptranthes clusiifolia O.Berg 78 S Miconia theaezans (Bonpl.) Cogn. 77 L Myrsine guianensis (Aubl.) Kuntze 70 P Alchornea triplinervia (Spreng.) Müll.Arg. 65 L Siphoneugena reitzii D.Legrand 63 L Copaifera langsdorffii Desf. 57 S Myrcia tomentosa (Aubl.) DC. 51 L

63
Table 2 Dynamic rates in number of individuals for light-demanding, pioneer and shade-tolerant groups in natural forest edges of gallery forests, from 2009 to 2013. Values followed by the same letter are not significantly different according to an LSD test.
Year Group N˚ Dead
N˚
Recruits
N˚
Survival
Initial Number Final Number Mortality (%) Recruitment (%) Change
(%) 2009-2010 Light 79 336 3200 3279 3536 2.41a 9.50 a 7.84 a 2009-2010 Pioneer 19 113 1377 1396 1490 1.36ab 7.58 a 6.73 a 2009-2010 Shade 4 27 337 341 364 1.17b 7.42 a 6.74 a 2009-2010 Overall 102 476 4914 5016 5390 2.03 8.83 7.46 2010-2011 Light 182 92 3354 3536 3446 5.15 a 2.67 a -2.55 a 2010-2011 Pioneer 68 72 1422 1490 1494 4.56 a 4.82 a 0.27 a 2010-2011 Shade 8 10 356 364 366 2.20b 2.73 a 0.55 a 2010-2011 Overall 258 174 5132 5390 5306 4.79 3.28 -1.56 2011-2012 Light 190 292 3283 3473 3575 5.47 a 8.17 a 2.94 a 2011-2012 Pioneer 81 129 1420 1501 1549 5.40 a 8.33 a 3.20 a 2011-2012 Shade 8 39 362 370 401 2.16 b 9.73 a 8.38 a 2011-2012 Overall 279 460 5065 5344 5525 5.22 8.33 3.39 2012-2013 Light 260 216 3336 3596 3552 7.23 a 6.08 a -1.22 a 2012-2013 Pioneer 74 65 1482 1556 1547 4.76 a 4.20 a -0.58 a 2012-2013 Shade 10 27 391 401 418 2.49 b 6.46 a 4.24 a 2012-2013 Overall 344 308 5209 5553 5517 6.19 5.58 -0.65 2009-2013 Light 616 861 2739 3355 3600 3.98 a 5.32 a 1.42 a 2009-2013 Pioneer 209 354 1212 1421 1566 3.13 a 5.00 a 1.96 a 2009-2013 Shade 26 100 318 344 418 1.56 b 5.32 a 3.97 a 2009-2013 Overall 851 1315 4269 5120 5584 3.57 5.23 1.75

64
Table 3 Dynamic rates in terms of basal area for light-demanding, pioneer and shade-tolerant groups in natural forest edges of gallery forests, from 2009 to 2013. Values followed by the same letter are not significantly different according to an LSD test.
Year Group Dead Recruits Survivor Increm. Decrem. Initial
B. A.
Final
B. A.
Loss (%)
Gain (%)
Change (%) 2009-2010 Light 0.04 0.05 5.34 0.53 -0.10 4.96 5.39 2.85 a 10.88 a 8.61 a
2009-2010 Pioneer 0.01 0.02 4.49 0.50 -0.08 4.10 4.51 2.35 a 11.51 a 10.12 a 2009-2010 Shade 0.01 0.01 0.61 0.06 -0.01 0.57 0.62 3.65 a 10.70 a 7.83 a 2009-2010 Overall 0.06 0.09 10.44 1.09 -0.20 9.64 10.52 2.68 11.14 9.21 2010-2011 Light 0.13 0.02 5.22 0.34 -0.48 5.39 5.25 11.41 a 6.94 a -2.60 a 2010-2011 Pioneer 0.09 0.02 4.44 0.37 -0.41 4.51 4.47 11.12 a 8.86 a -0.95 a 2010-2011 Shade 0.01 0.00 0.61 0.04 -0.04 0.62 0.62 8.08 a 6.67 a -0.29 a 2010-2011 Overall 0.23 0.05 10.26 0.75 -0.94 10.52 10.34 11.09 7.75 -1.76 2011-2012 Light 0.09 0.04 5.40 0.48 -0.28 5.25 5.45 7.03 a 9.58 a 3.82 a 2011-2012 Pioneer 0.06 0.02 4.58 0.36 -0.22 4.47 4.61 6.37 a 8.35 a 3.06 a 2011-2012 Shade 0.00 0.01 0.63 0.04 -0.02 0.62 0.63 4.67 a 6.98 a 2.43 a 2011-2012 Overall 0.15 0.07 10.61 0.88 -0.53 10.34 10.69 6.60 8.90 3.41 2012-2013 Light 0.03 0.03 5.64 0.57 -0.34 5.45 5.68 6.75 a 10.50 a 4.12 a 2012-2013 Pioneer 0.01 0.01 4.81 0.57 -0.33 4.61 4.84 7.35 a 11.94 a 5.10 a 2012-2013 Shade 0.00 0.00 0.67 0.05 -0.01 0.63 0.67 1.87 a 7.81 a 6.44 a 2012-2013 Overall 0.04 0.04 11.12 1.18 -0.68 10.69 11.19 6.72 10.96 4.68 2009-2013 Light 0.37 0.18 5.68 1.27 -0.56 4.96 5.68 4.07 a 5.74 a 2.72 a 2009-2013 Pioneer 0.33 0.12 4.85 1.22 -0.48 4.10 4.84 4.28 a 6.28 a 3.39 a 2009-2013 Shade 0.01 0.01 0.67 0.12 -0.02 0.57 0.67 1.22 b 4.33 a 3.23 a 2009-2013 Overall 0.72 0.31 11.20 2.62 -1.05 9.64 11.19 3.98 5.88 3.04
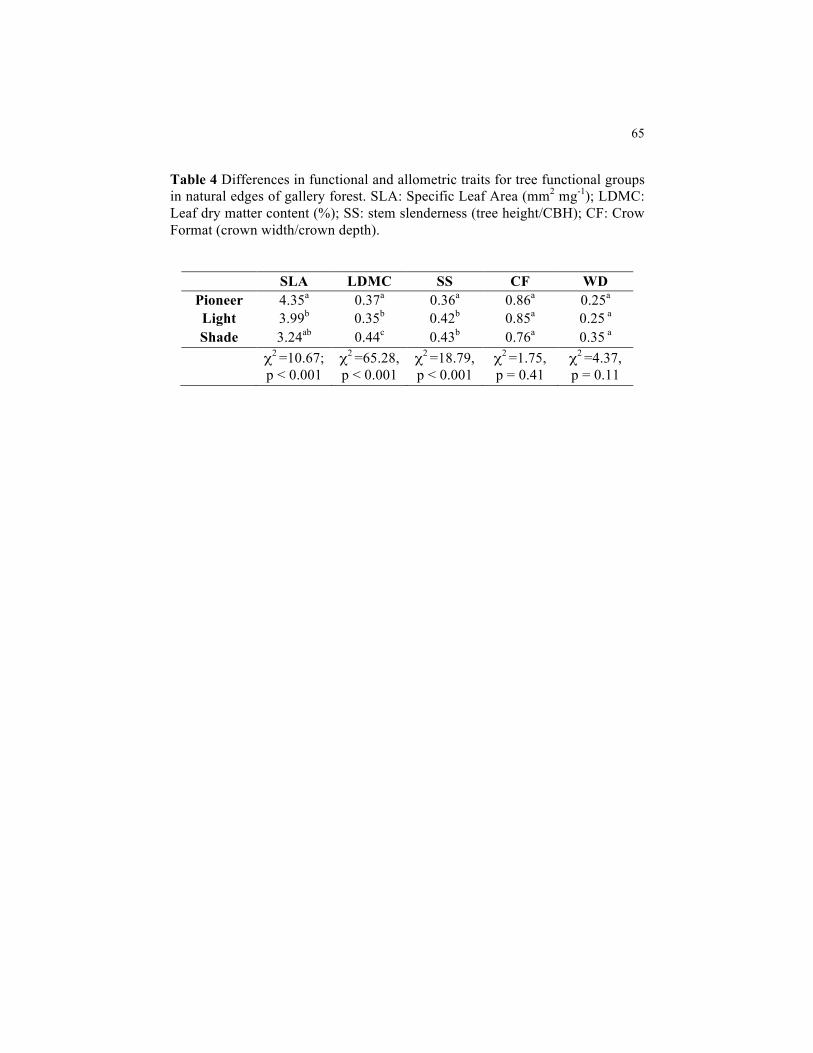
65
Table 4 Differences in functional and allometric traits for tree functional groups in natural edges of gallery forest. SLA: Specific Leaf Area (mm2 mg-1); LDMC: Leaf dry matter content (%); SS: stem slenderness (tree height/CBH); CF: Crow Format (crown width/crown depth). !
SLA LDMC SS CF WD Pioneer 4.35a 0.37a 0.36a 0.86a 0.25a Light 3.99b 0.35b 0.42b 0.85a 0.25 a Shade 3.24ab 0.44c 0.43b 0.76a 0.35 a
χ2 =10.67; χ2 =65.28, χ2 =18.79, χ2 =1.75, χ2 =4.37, p < 0.001 p < 0.001 p < 0.001 p = 0.41 p = 0.11
!
!
!
!
!
!
!

66
5. REFERENCES
ADLER, P. B. et al. Functional traits explain variation in plant life history strategies. PNAS, Washington, v. 111, n. 2, p. 740-745, jul. 2014.
ALVAREZ-BUYLLA, E. R.; MARTINEZ-RAMOS, M. Demography and allometry of Cecropia obtusifolia, a neotropical pioneer tree, an evaluation of the climax-pioneer paradigm for tropical rain forests. Journal of Ecology, London, v. 80, n. 2, p. 275-290, jun. 1992.
BAKER, T. R.; BURSLEM, D. F. R. P.; SWAINE, M. D. Associations between tree growth, soil fertility and water avail- ability at local and regional scales in Ghanaian tropical rain forest. Journal of Tropical Ecology, Cambridge, v. 19, n. 2, p. 109-125, mar. 2003.
BAZZAZ, F. A. Dynamics of wet tropical forests and their species strategies, In: MEDINA E., MOONEY M.A., VÁSQUEZ-YÁNES C. (Ed.), Physiological ecology of plants of the wet tropics: proceedings of an international symposium held in Oxatepec and Los Tuxtlas, Mexico. W. Junk, The Hague, 1983, p. 233–243.
BURROWS, W. H.; COMPTON, J. F.; HOFFMANN, M. B. Vegetation thickening and carbon sinks in the grazed woodlands of north-east Australia. In: AUSTRALIAN FOREST GROWERS CONFERENCE, 1., 1998, Lismore. Proceedings..Lismore: AFG, 1998. p. 305-316.
CONDIT, R.; HUBBELL, S. P.; FOSTER, R. B. Assessing the response of plant functional types to climatic change in tropical forests. Journal of Vegetation Science, Malden, v. 7, n. 3, p. 405-416, jun. 1996.
DANTAS, A. A. A.; CARVALHO, L. G.; FERREIRA, E. Climatic classification and tendencies in Lavras region, MG. Ciência e Agrotecnologia, Lavras, v. 31, n. 6, p. 1862-1866, dez. 2007.
DAVIES, S. J. Tree Mortality and Growth In 11 Sympatric Macaranga Species In Borneo. Ecology, Washington, v. 82, n. 4, p. 920-932, abr. 2001.
DENSLOW, J S. Tropical Rainforest Gaps and Tree Species Diversity. Annual Review of Ecology and Systematics, Palo Alto, v. 18, p. 431-451, nov. 1987.
______. Gap Partitioning among Tropical Rainforest Trees. Biotropica,

67
Malden, v. 12, n. 2, p. 47-55, jun. 1980.
DIAZ, S. et al. The plant traits that drive eco- systems: evidence from three continents. Journal of Vegetation Science, Malden, v. 15, n. 3, p. 295-304, jun. 2004.
DIAZ, S.; CABIDO, M. Plant functional types and ecosystem function in relation to global change. Journal of Vegetation Science, Malden, v. 8, n. 4, p. 463-474, ago. 1997.
DUSSART, E.; LERNER, P.; PEINETTI, R. Long-term dynamics of two populations of Prosopis caldenia Burkart. Journal of Range Management, Denver, v. 5, n. 6, p. 685-691, Nov. 1998.
FELFILI, J. M. Determinação de padrões de distribuição de espécies em uma mata de galeria no Brasil Central com a utilização de técnicas de análise multivariada. Boletim do Herbário Ezechias Paulo Heringer, Brasília, v. 2, n. 1, p. 35-48, jan. 1998.
FORGIARINI, C. et al. In the lack of extreme pioneers: trait relationships and ecological strategies of 66 subtropical tree species. Journal of Plant Ecology, Oxford, v. 8, n. 4, p. 359-367, ago. 2015.
GARNIER, E. et al. A standardized protocol for the determination of specific leaf area and leaf dry matter content. Functional Ecology, London, v. 15, n. 5, p. 688-695, out. 2001.
GELMAN, A.; MENG, X. L.; STERN, H. Posterior predictive assessment of model fitness via realized discrepancies. Statistica Sinica, Taipei, v. 6, p. 733-807, set. 1996.
GOURLET-FLEURY, S. et al. Grouping species for predicting mixed tropical forest dynamics: looking for a strategy. Annals of Forest Science, Springer Verlag, v. 62, n. 8, p. 785-796, abr. 2005.
GRIME, J. P. et al. Integrated screening validates primary axes of specialization in plants. Oikos, Copenhagen, v. 79, n. 2, p. 259-281, jun. 1997.
GRIME, J. P.; HODGSON, J. G.; HUNT, R. Comparative plant ecology: a functional approach to common british species. London: Chapman & Hall, 1988. 752 p.

68
HARTSHORN, G. S. Neotropical Forest Dynamics. Biotropica, Malden, v. 12, n. 2, p. 23-30, jun. 1980.
HOFFMANN, W. A. et al. Tree topkill, not mortality, governs the dynamics of savanna–forest boundaries under frequent fire in central Brazil. Ecology, Washington, v. 90, n. 5, p. 1326-1337, mai. 2009.
HOPKINS, B. Ecological processes at the forest-savanna boundary. In: FURLEY PA, PROCTER J, RATTER JA (Ed.) Nature and dynamics of forest-savanna boundaries. Chapman and Hall, London, 1992. p 21–33.
HORN, H. S. Adaptive geometry of trees. 1 ed. Princeton: Princeton University Press, 1971. 144 p.
INSTITUTO BRASILEIRO DE GEOGRAFIA E ESTATÍSTICA. Mapa de vegetação do Brasil. Rio de Janeiro, 2004. 1 mapa. Escala 1:5.000.000.
KELLMAN, M.; TACKABERRY, R.; RIGG, L. Structure and function in two tropical gallery forest communities: implications for forest conservation in fragmented systems. Journal of Applied Ecology, London, v. 35, n. 2, p. 195-206, abr. 1998.
KORNING, J.; BALSLEV, H. Growth and mortality of trees in Amazonian tropical rain forest in Ecuador. Journal of Vegetation Science, Knivsta, v. 5, n. 1, p. 77-86, Feb. 1994.
LAURANCE, W. F.; PERES, C. A. Emerging threats to Tropical Forests. Chicago:University of Chicago, 2006. 563 p.
MENDIBURU, F. Agricolae: statistical procedures for agricultural research: R package. Version 1.2-0. Disponível em: <http://CRAN.R-project.org/package=agricolae>. Acesso em: 2 jul. 2015.
MURCIA, C. Edge effects in fragmented forests: implications for conservation. Trends in Ecology and Evolution, Amsterdam, v. 10, n. 2, p. 58-62, Feb. 1995.
NUNES, Y. R. F. et al. Variações da fisionomia, diversidade e composição de guildas da comunidade arbórea em um fragmento de floresta semidecidual em Lavras, MG. Acta Botanica Brasilica, Porto Alegre, v. 17, n. 2, p. 213-229, abr./jun. 2003.

69
OLIVEIRA-FILHO, A. T. et al. Effect of flooding regime and understorey bamboos on the physiognomy and tree species composition of a tropical semideciduous forest in Southeastern Brazil. Vegetatio, Dordrecht, v. 113, n. 2, p. 99-124, Aug. 1994a.
______.Effects of soils and topography on the distribution of tree species in a tropical riverine forest in south-eastern Brazil. Journal of Tropical Ecology, Cambridge, v. 10, n. 4, p. 483-508, Nov. 1994b.
OLIVEIRA-FILHO, A. T.; MELLO, J. M.; SCOLFORO, J. R. S. Effects of the past disturbance and edges on tree community structure and dynamics whitin a fragment of tropical semideciduous forest in south-eastern Brazil over a five-year period 1987-1992. Plant Ecology, Dordrecht, v. 131, n. 1, p. 45-66, July 1997.
PALMER, A. R.; ROOYEN, A. F. van. Detecting vegetation change in the southern Kalahari using Landsat TM data. Journal of Arid Environment, London, v. 39, n. 2, p. 143-153, June 1998.
PEREIRA, I. M. et al. Caracterização ecológica de espécies arbóreas ocorrentes em ambientes de mata ciliar, como subsídio à recomposição de áreas alteradas nas cabeceiras do Rio Grande, Minas Gerais, Brasil. Ciência Florestal, Santa Maria, v. 20, n. 2, p. 235-253, abr./jun. 2010.
PÉREZ-HARGUINDEGUY, N. et al. New handbook for standardised measurement of plant functional traits worldwide. Australian Journal of Botany, Clayton South, v. 61, n. 3, p. 167-234, abr. 2013.
PINTO, J. R. R.; HAY, J. D. V. Mudanças florísticas e estruturais na comunidade arbórea de uma floresta de vale no Parque Nacional da Chapada dos Guimarães, Mato Grosso, Brasil. Revista Brasileira de Botânica, São Paulo, v. 28, n. 3, p. 523-539, jul. 2005.
PLUMMER, M. 2014. rjags: Bayesian graphical models using MCMC: R package Version 3-13. Disponível em: <http://CRAN.R-project.org/package=rjags>. Acesso em: 2 jul. 2015.
POORTER H.; VAN DER WERF, A.Is inherent variation in RGR determined by LAR at low irradiance and by NAR at high irradiance? A review of

70
herbaceous species. In: Lambers, H.; Poorter, H.; Van Vuuren, M. M. I. (Ed). Inherent variation in plant growth, physiological mechanisms and ecological consequences. Leiden, The Netherlands: Backhuys, 1998 p.309–336.
POORTER, H; GARNIER, E. Ecological significance of inherent variation in relative growth rate. In: PUGNAIRE, F.; VALLADARES, X. (Ed) Handbook of functional plant ecology. New York, USA: Marcel Dekker, 1999, 81–120.
POORTER, L. et al. Architecture of 53 Rain Forest Tree Species Differing In Adult Stature And Shade Tolerance. Ecology, Washington, v. 84, n. 3, p. 602-608, mar. 2003.
REICH, P. B. The world-wide ‘fast–slow’ plant economics spectrum: a traits manifesto. Journal of Ecology, London, v. 102, n. 2, p. 275-301, mar. 2014.
ROSSATO, D. R.; HOFFMANN, W. A.; FRANCO, A. C. Differences in growth patterns between co-occurring forest and savanna trees affect the forest–savanna boundary. Functional Ecology, London, v. 23, n. 4, p. 689-698, ago. 2009.
SCHOLES, R. J.; ARCHER, S. R. Tree-grass interactions in savannas. Annual Review in Ecology, Evolution and Systematics, Palo Alto, v. 28, n. 1, p. 517-544, Jan. 1997.
SCHWARTZ, D. et al. Present dynamics of the savanna-forest boundary in the Congolese Mayombe: a pedological, botanical and isotopic (13C and 14C) study. Oecologia, Heidelberg, v. 106, n. 4, p. 516-524, jun. 1996.
SHEIL, D.; JENNINGS, S.; SAVILL, P. Long-term permanent plot observations of vegetation dynamics in Budongo, a Ugandan rain forest. Journal of Tropical Ecology, Cambridge, v. 16, n. 6, p. 765-800, Nov. 2000.
SILVA, L. C. R. et al. Expansion of gallery forests into central Brazilian savannas. Global Change Biology, Maiden, v. 14, n. 9, p. 2108-2118, set. 2008.
SWAINE, M. D.; WHITMORE, T. C. On the definition of ecological species groups in tropical rain forest. Vegetatio, Dordrecht, v. 75, n. 1/2, p. 81-86, May 1988.
TURTON, S. M.; FREIBURGER, H. J. Edge and aspect effects on the microclimate of a small tropical forest remnant on the Atherton Tableland,

71
northeastern Australia. In: LAURENCE, W. F.; BIERREGAARD, R. O. (Ed.) Tropical forest remmants. Chicago: The University of Chicago. 1997, p.45-54.
VAN DEN BERG, E.; CHAZDON, R.; CORRÊA, B. S. Tree growth and death in a tropical gallery forest in Brazil: understanding the relationships among size, growth, and survivorship for understory and canopy dominant species. Plant ecology, New York, v. 213, n. 7, p. 1081-1092, jul. 2012.
VAN DEN BERG, E.; OLIVEIRA-FILHO, A. T. Composição florística e estrutura fitossociológica de uma floresta ripária em Itutinga, MG, e comparação com outras áreas. Revista Brasileira de Botânica, São Paulo, v. 23, n. 3, p. 231-253, set. 2000.
______. Spatial partitioning among tree species within an área of tropical montane gallery forest in south-eastern Brazil. Flora, London, v. 194, n. 3, p. 249-266, July 1999.
VAN DEN BERG, E.; SANTOS, F. A. M. Aspectos da variação ambiental em uma floresta de galeria em Itutinga, MG, Brasil. Ciência Floresta, Santa Maria, v. 13, n. 2, p. 83-98, dez. 2004.
VAN DER WERF , A et al.The importance of relative growth rate and associated traits for competition between species during vegetation succession. In: LAMBERS, H.; POORTER, H.; VAN VUUREN, M. M. I.(Ed). Inherent variation in plant growth, physiological mechanisms and ecological consequences. Leiden, The Netherlands: Backhuys, 1998, p.489–502.
VANCLAY, J. K. Modelling forest growth and yield. 1 ed. Oxfordshire: CABI, 1994. 336 p.
WILSON, P. J.; T., K.; HODGSON, J. G. Specific leaf area and leaf dry matter content as alternative predictors of plant strategies. New Phytologist, Lancaster, v. 143, n. 1, p. 155-162, jul. 1999.
WOODWARD, F. I.; DIAMENT, A. D. Functional approaches to predicting the ecological effects of global change. Functional Ecology, London, v. 5, n. 2, p. 202-212, jan. 1991.
WRIGHT, I. J. et al. The worldwide leaf economics spectrum. Nature, London, v. 428, p. 821-827, abr. 2004.

72
!
!
!
!
!
PAPER 2 - DOES FACILITATION FOSTER GALLERY FOREST EXPANSION INTO GRASSLANDS IN BRAZIL?
!
!

73
ABSTRACT
Boundaries between gallery forest and grasslands are one of the few examples of sharp, natural old edges and they are fascinating given the very distinct vegetation type coexisting under a common climate. However, a forest could be expanding into grassland areas and this process could be fostered by positive interactions, since forest species face several environmental constraints when living in open areas, thus, after first the trees are established in grassland they can facilitate new ones. It is also probable that forest expansion works as a succession process and as succession goes by and harsh conditions in grasslands turn more suitable for forest species, the importance of positive interactions probably declines, increasing the importance of competition and other negative interactions. In order to answer whether gallery forests are expanding and whether this expansion follows a succession process with the pioneers and light – demanding taking the lead, we studied 8 sharp boundaries of gallery forests with grasslands in a five year interval (2009-2013). We classified all species with at least 50 samplings across sites in three functional groups: pioneer, light – demanding and shade – tolerant and we generated bar plots for the number of individuals in the grassland over the years. To test if forest expansion is fostered by a facilitation process we selectedE. erythroppapus, one of the few first pioneers to establish in the grassland and should be a facilitator. We fitted a regression line expecting to find a positive relation between the abundance of facilitatorsand recruitment. Expecting a change from positive interactions to negative ones in the short gradient we fitted hierarchical Bayesian models expecting a positive relationship between Competition Index and survival where facilitation processes dominate (grasslands) and a negative relationship where competition processes dominate (inside the forest). We found forest expanding over grasslands with the pioneer species having the spearhead role, followed by the light-demanding species and, lastly, by the shade-tolerant in a clear succession process, what could suggest a facilitation process. However, the presence of facilitators did not foster forest expansion since the higher the number of facilitators, the lower the forest expansion. Also, there was no change from positive to negative interactions, but even in the grassland, neighbors reduced survival. Although we did not find evidence of facilitation, negative interactions do not completely suppress it, since there was expansion in most of the sites.
Key – words: positive interactions, functional groups, SGH, environmental gradient, cerrado

74
!
1 INTRODUCTION !
Boundaries between gallery forest and grasslands are one of the few
examples of sharp, natural, old edges. Those boundaries are intriguing since they
are very distinct vegetation types coexisting under a common climate.
(WHITTAKER, 1975; BOND, 2005; BOND; WOODWARD; MIDGLEY,
2005). It has been asserted that soil nutrients could explain these vegetation
mosaics (FURLEY 1992;FÖLSTER; DEZZEOB; PRIESSA, 2001;
GOODLAND; POLLARD, 1973; LLOYD et al., 2008; SARMIENTO, 1992),
however new studies have shown that soil nutrients do not explain differences in
vegetation (BOND, 2010; SILVA et al., 2008; ROSSATO; HOFFMANN;
FRANCO, 2009; VAN DEN BERG; OLIVEIRA-FILHO, 1999) or even drive
changes in vegetation types, but they are responders (GRAY; BOND 2015). The
sharp boundaries between open ecosystems and forest are better explained by
the frequent fire events that take place in the grasslands and eventually affect the
forest edge, however, extinguishing there (VAN DEN BERG; OLIVEIRA-
FILHO 1999, 2000; VAN DEN BERG; SANTOS 2003; FELFILI, 1998;
ROSSATO; HOFFMANN; FRANCO, 2009).
It is possible that the gallery forests are expanding into grassland areas.
Several studies conducted around the world have shown past and recent
expansions of forest into open ecosystems (BOWMAN; WALSH; MILNE,
2001; DESJARDINS et al., 1996; HOPKINS 1992; KERSHAW, 1992;
SANAIOTTI et al., 2002; SCHWARTZ et al., 1996; SILVA et al., 2008),
however fire is a main constraint to forest expansion (HOFFMANN; ORTHEN;
FRANCO, 2004; HOFFMANN et al., 2009). In the grassland, the grass layer
enhances the likelihood of fire events due its high flammability creating a
positive feedback between grassland and fire, since fire favors grasses and

75
hinders woody plants (BAUDENA et al., 2015). Fire kills woody seedlings and
samplings and topkills adults because of their lack of protective thick bark
(HOFFMANN et al., 2009; ONDEI et al., 2015). Therefore, under frequent fires,
forest expansion is unlikely, but when fire is suppressed, a gallery forest can
expand into open areas (Ratter, 1992). Therefore, forest and savanna exist as
alternative stable states where forests are favored by suppressing fire events
(GRAY; BOND 2015; STAVER; ARCHIBALD; LEVIN, 2011).
Forest species face several constraints when establishing in the
grasslands (BOND, 2008; HOFFMANN; ORTHEN; FRANCO, 2004). They are
limited by microclimate, such as high light leading to high temperature and
drought stress. Furthermore, grasses outcompete them in this environment,
mostly when as seedlings. After the first trees establish in the grassland they can
facilitate new ones (HOFFMANN, 1996; KELLMAN, 1985; KELLMAN;
MIYANISHI, 1982). These first colonizers provide shade preventing lethal
temperatures and increasing soil moisture (PUGNAIRE; VALLADARES 2007).
They also provide nutrient enrichment via their litter (HUNTER; AARSEEN,
1988). Therefore, they allow higher establishment and growth of forest species
in open areas. As time goes by, more forest tree species establish in grasslands
forming a more closed canopy and a more humid understory that exclude grasses
and is less flammable reducing frequency and intensity of fires events
(HOFFMANN et al., 2011) leading to a positive feedback between fire
exclusion and forest expansion. Consequently, although constraints can reduce
establishment and survival, they cannot prevent forest expansion into grasslands
(BOWMAN; PANTON, 1993; HOFFMANN, 1996; HOFFMANN; ORTHEN;
FRANCO, 2004).
Given all constraints and stressful conditions for forest species
establishment in open areas it is probable that forest expansion works as a
succession process where a facilitation process dominates (CLEMENTS, 1916;

76
CONNELL; SLATYER, 1977; GRIME, 1977) with an initial occupation of the
grassland area by colonizer species, smoothing the harsh grassland conditions,
followed by other species. As succession continues and harsh conditions in
grasslands turn more suitable for forest species, the importance of positive
interactions probably declines, increasing the importance of competition and
other negative interactions. The gradient from grassland to forest could therefore
be in different stages of succession, when environmental stress is higher in the
grassland in lower in the forest. According to the stress-gradient hypothesis in a
gradient like this, interactions can change from facilitation (harsh environment)
to competition (BERTNESS; CALLAWAY, 1994; CALLAWAY; WALKER,
1997).
Several issues have been explored through the years regarding forest
expansion into grasslands, such as if forest are expanding (Silva et al., 2008), the
role of soils (GRAY; BOND 2015), constraints to tree establishment
(HOFFMANN; ORTHEN; FRANCO, 2004), and the role of facilitators in
seedling establishment (HOFFMANN, 1996; KELLMAN 1985; KELLMAN;
MIYANISHI, 1982). However, we lack understanding of how plants behave
after the seedling stage, and if first colonizers are really helping plants achieve
adulthood and forest expansion. In addition, we also do not know how the
environment gradient affect plants interactions. The southern mesic grasslands
of Brazil are a unique opportunity to study forest expansion and the relationship
between positive interactions and forest expansion. In these grasslands, at
elevations above 900m a.s.l, Eremanthus erythropappus is a pioneer woody tree
known for its capacity to colonize grasslands. They form a monodominant buffer
surrounding gallery forests and prevent fire from advancing further inside the
forest (OLIVEIRA-FILHO; FLUMINHAN FILHO, 1999). Possibly this species,
could nurse forest tree seedlings by forming a shading canopy that increases soil
moisture, reducing grasses and fire events and thus facilitating forest expansion.

77
Therefore, we hypothesized that over time the density of trees increases
in the grassland areas close to the forest edge, following the general pattern of
expansion of forest over savannas observed around the globe. We expected this
expansion process to follow a path similar to that of forest succession, with an
initial occupation of the grassland area by pioneer species, followed by the light-
demanding and shade-tolerant species. We also hypothesized that gallery forest
expansion over the grassland is fostered by a facilitation process where trees
previously stablished on the grassland nurse new plants, so sites with higher
abundance of new colonizers will have a higher expansion toward the grassland.
Also, based on the stress-gradient hypothesis we believe that there is a change
from positive interactions (facilitation) to negative ones (tolerance) in the short
gradient from grassland to the gallery forest as a consequence of the sudden
change in microclimate (Figure 1). Because of that, we expected survival to be
enhanced by neighbors in the grassland and the opposite pattern deeper within
the gallery forest.
Figure 1 Interaction among plants can be context depend. In a stressful
environment such as grasslands, neighbors can provide shelter whose benefits can overlap resource depletion. However, when stress declines toward the forest interior the benefits of shelter decreases and the ability to explore shared resources becomes more important.

78
2 METHODS
Study Sites – We studied 8 gallery forests with natural edges with
grasslands in the south of Minas Gerais State, Brazil (Figure 2). The vegetation
of the region is a disjunction of the Cerrado biome, inserted within the seasonal
semi-deciduous rainforests distribution area of southeastern Brazil (Brazilian
Institute of Geography and Statistics-Instituto Brasileiro de Geografia e
Estatística – IBGE, 2004). The climate is Cwa according to the Köppen climate
classification, temperate and rainy (mesothermic) with dry winters and rainy
summers, and subtropical (DANTAS; CARVALHO; FERREIRA, 2007).
Elevation varies from 850 m to approximately 1500 m a.s.l.
We chose sites lacking obvious anthropogenic impacts such as logging,
undergrowth clearing, clear cutting, or evidence of recent fires, and that had
natural edges with native grasslands.
Vegetation sampling – In 2009, we established three permanent plots
(15 m × 20 m; 300 m²) in each of the 8 sites respecting a 10 m minimum
distance between plots within a site. We laid out the plots with their wider side
parallel to the forest edge, including 5 m of grassland and 10 m of forest (Figure
2). We identified, mapped, and measured height and DBH of all individuals with
diameter at breast height (DBH) ≥1 cm.
Since 2009, we have carried out five annual inventories (2009 to 2013).
In each inventory we measured and re-measured all alive individuals and
verified all dead ones. The recruits, i.e., the new individuals meeting the
inclusion criterion (DBH ≥ 1 cm), were identified and mapped, and had their
height and DBH recorded. We identified the recognizable species during the
fieldwork, or by collecting samples and comparing them to identified specimens

79
in an herbarium (ESAL Herbarium of the Federal University of Lavras) or
consulting the literature and specialists.
Figure 2 Sketch of how plots were assembled with 5 m of grassland and 10 m
of forest edge. X is the distance parallel to the upper limit of the plot as measured from the corner, Y is the distance of the individual from the upper limit of the plot.
Mapping of individuals – We mapped all individuals within the plots.
For each individual we measured the distance between the rooting point and two
corners of the plot, using an ultrasound distance measuring instrument (Haglöf
DME 201 Cruiser). We transformed the distances into coordinates (X and Y)
using the Pythagorean equation, where X is the distance parallel to the upper
boundary of the plot as measured from the corner, Y is the distance of the
individual from the upper limit of the plot (Figure 2).
Expansion of gallery forest over time – We established the plots
including 5 meters of grasslands so we could follow expansion or retraction of
the forest. To test if there was an initial occupation of the grassland area by
pioneer species, followed by light-demanding and shade tolerant species, we
generated bar plots for number of individuals for each functional group in the
grassland over the years. We also calculated recruitment and mortalityrates,
following Sheil, Jennings and Savill (2000):

80
; (1)
; (2)
where No are the initial count of individual trees, Nr is the number of
recruits and Nt is the final counts of individual trees.
For this analysis, we used all species with at least 50 samplings across
sites (Table 1). We defined functional groups using a classification based on
light requirements for germination and establishment (SWAINE; WHITMORE,
1988) and studies in the same region (NUNES et al., 2003; OLIVEIRA-FILHO
et al., 1994a, 1994b, 1997; OLIVEIRA-FILHO, MELLO, SCOLFORO, 1997;
PEREIRA et al., 2010; PINTO; HAY, 2005). Pioneers (P) were those species
whose seeds only germinate in sites with direct light at ground level for at least
part of the day. Their germination is triggered by an increase in red light or soil
temperature fluctuation and their seedlings require direct light for establishment
and growth. In contrast, non-pioneers germinate and their seedlings establish
under the canopy without direct light. We subdivided this non-pioneer group
into two: light-demanding species (L), which demand more solar radiation for
growth and have fast growth; and shade-tolerant species (S), which require very
little light and grow slowly. We recognize the existence of other classifications
and approaches to classify functional groups, however, we believe that the
classification proposed by Swaine and Whitmore (1988) is suitable for our
analysis, since it is based on light requirements, which is a major defining
environmental condition for natural edges.
Facilitation and forest expansion – We hypothesized thatforest
expansion is governed by facilitation process. For this, we selectedE.
erythroppapus as a model species, since it is the first pioneer to establish in the
grassland and it is the only species with significant number of individuals

81
establishing in the grassland. It should be a facilitator providing protection
against the environmental stress for new plants. We fitted a regression line
expecting to find a positive relation between the abundance of E. erythroppapus
and recruitment (%.year-1). We calculated recruitment (R) following Sheil,
Jennings and Savill (2000), as described above.
Interactions and survival – We hypothesized based on the SGH that
there is a change from positive interactions to negative ones in the short gradient
from grassland to the gallery forest. In this analysis we select all species with
more than 50 samplings across sites that had dead individuals in the grassland,
edge and forest (Table 2).
We expected a positive relationship between Competition Index (see
below) and survival where facilitation processes dominate (grasslands) and a
negative relationship where competition processes dominate (inside the forest).
We computed the competition index as (HEGYI, 1974):
(3)
where CIi is the competition index for the subject tree i, dbhj is the
diameter of the competitor tree j, dbhi is the diameter of the subject tree and Dji
is the distance between subject tree i and competitor tree j, and Ni the number of
competitor trees per subject tree i.
Survival was modelled as a logistic model:
; (4)
where Si is the probability of survival for each environment, G is the
annual growth (yr-1) and α and β were parameters. Rather than fit separate
models for each environment (grassland, edge and forest, Figure 4), we used a
second level in the hierarchical model for β parameter in Equation 1. Parameter
β for environment i in Eq. 1 is modelled as:
βi = normal(µi,τi)

82
We obtained posterior distributions of parameters using the Markov
Chain Monte Carlo (MCMC) method. We monitored convergence by running
three different chains with different start values. From the posterior distribution
we computed the mean and credible intervals (CI) for all parameters and the
significance of parameters was assessed by a 95% C.I., and, for evaluating
discrepancy, we calculated Bayesian p-value (GELMAN; MENG; STERN,
1996).
Light and Soil Moisture data – We hypothesized that there is a change
from positive interactions to negative interactions in the short gradient from
grassland to the gallery forest as a consequence of the change in the
microclimate. To test differences in microclimate we measured light and soil
moisture. We measured the canopy cover with a Lemmon convex spherical
densitometer, facing north, south, east and west, 1 m above the ground every one
meter from the top to the bottom of the plot.
We collected soil for surface moisture measurementsunder two
contrasting conditions: the rainy season (January and February) and the dry
season (August and September). In each round of sampling, we collected two
soil samples covering 0-20 cm of depth, one within the forest (10 m inside) and
one within the grassland (5 m from the edge), and placed them in hermetically
sealed containers. We measured soil moisture as the difference between the
initial weight of the sample and the final weight following oven drying at 110°C
until constant weight. The differences between the wet and dry weights of the
soil samples were used to calculate the soil moisture percentages for each plot.
The normality of the data distribution was checked graphically, and then a two-
way ANOVA was used to compare the data. We investigated possible
differences between grassland and forest during the rainy and dry seasons and
between seasons within each of the two environments for 3 years: 2011; 2013
and 2014. For all analyses, we used the R software, version 3.1.1. For the
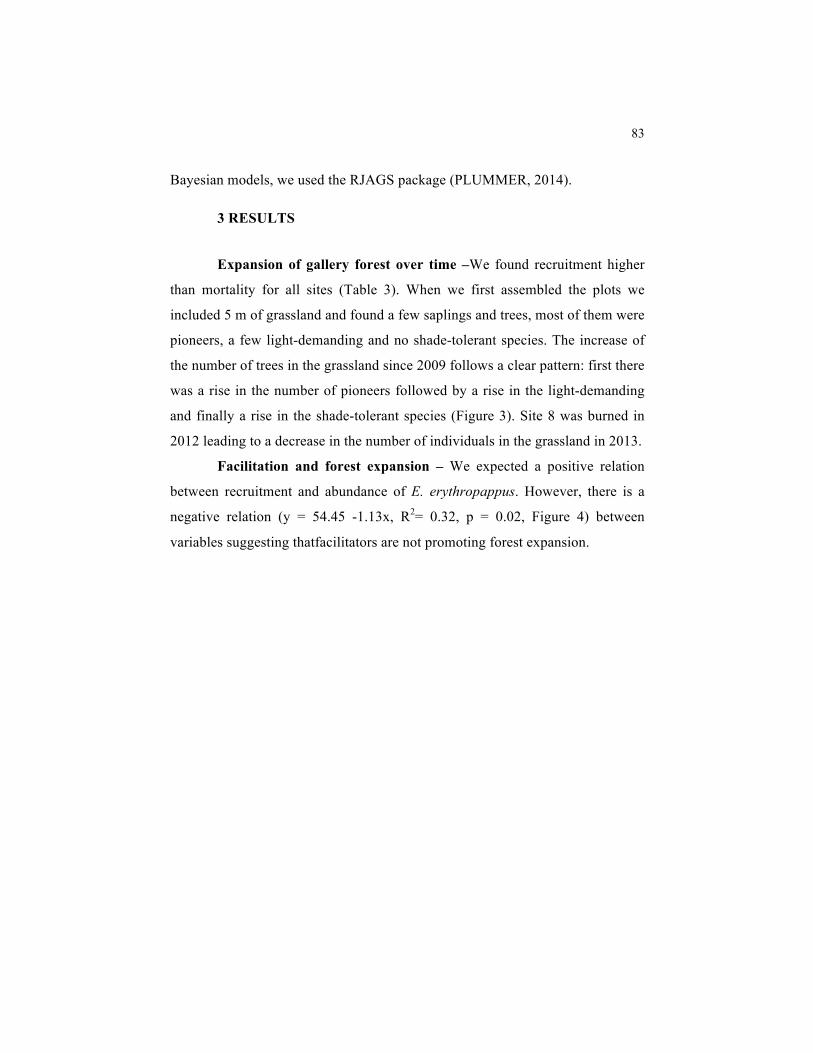
83
Bayesian models, we used the RJAGS package (PLUMMER, 2014).
3 RESULTS !
Expansion of gallery forest over time –We found recruitment higher
than mortality for all sites (Table 3). When we first assembled the plots we
included 5 m of grassland and found a few saplings and trees, most of them were
pioneers, a few light-demanding and no shade-tolerant species. The increase of
the number of trees in the grassland since 2009 follows a clear pattern: first there
was a rise in the number of pioneers followed by a rise in the light-demanding
and finally a rise in the shade-tolerant species (Figure 3). Site 8 was burned in
2012 leading to a decrease in the number of individuals in the grassland in 2013.
Facilitation and forest expansion – We expected a positive relation
between recruitment and abundance of E. erythropappus. However, there is a
negative relation (y = 54.45 -1.13x, R2= 0.32, p = 0.02, Figure 4) between
variables suggesting thatfacilitators are not promoting forest expansion.

84
Figure 3 Number of recruits in grassland year by year for each site and for all
sites.
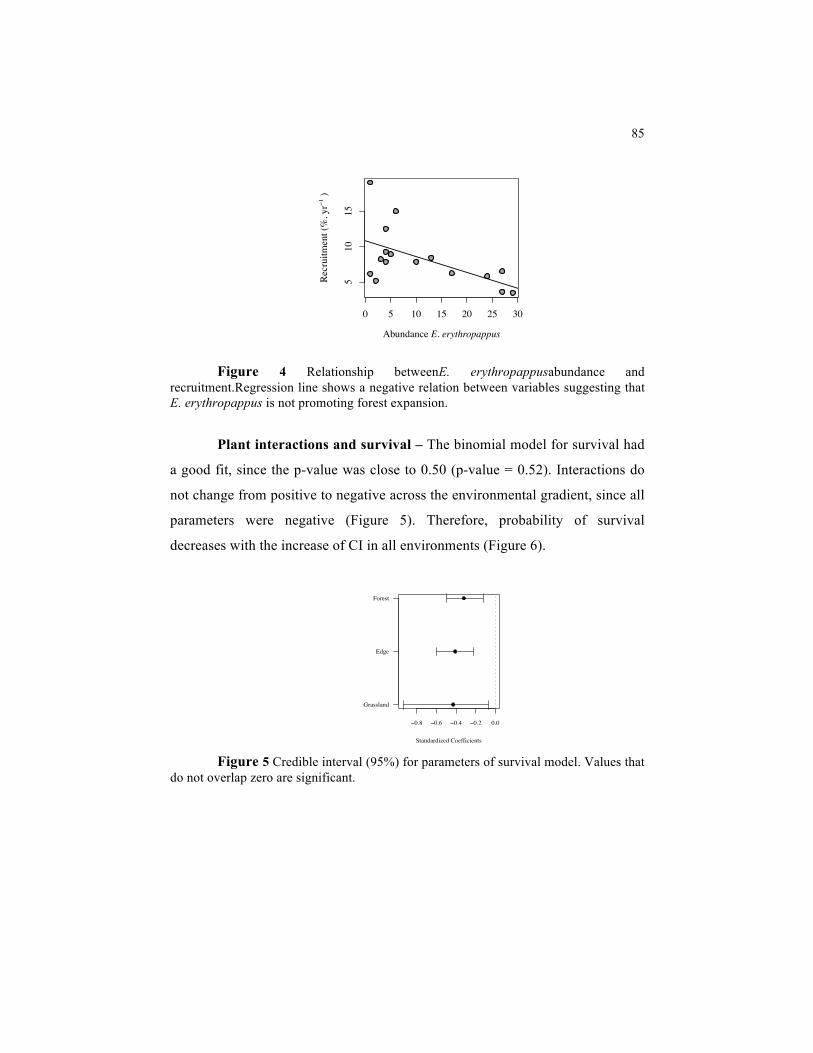
85
Figure 4 Relationship betweenE. erythropappusabundance and
recruitment.Regression line shows a negative relation between variables suggesting that E. erythropappus is not promoting forest expansion.
Plant interactions and survival – The binomial model for survival had
a good fit, since the p-value was close to 0.50 (p-value = 0.52). Interactions do
not change from positive to negative across the environmental gradient, since all
parameters were negative (Figure 5). Therefore, probability of survival
decreases with the increase of CI in all environments (Figure 6).
Figure 5 Credible interval (95%) for parameters of survival model. Values that
do not overlap zero are significant.
0 5 10 15 20 25 30
510
15Abundance E. erythropappus
Recr
uitm
ent (
%. y
r−1 )
−0.8 −0.6 −0.4 −0.2 0.0
Standardized Coefficients
Grassland
Edge
Forest

86
Figure 6 Probability of survival for trees with DBH ≥ 1 cm in grassland, edge
and gallery forest as function of the Competition Index (CI). There was no change from positive to negative interactions, in all environments neighbors reduce the probability of survival.
Light and Soil Moisture – The canopy coverage increased towards the
forest interior, however after 7 m from the edge it stabilized around 85-90%
(Figure 7). In 2010, the only difference in soil moisture is between edge and
grassland during dry season. In 2012, there wasno difference between edge and
grassland in the wet season, so grasslands are drier than edges during the dry
season. In 2013; there is no difference between seasons for each environment,
however edges are moister than grasslands in the wet and dry season (Table 4).
0 5 10 15 20
0.0
0.2
0.4
0.6
0.8
CI
Prob
abili
ty o
f Sur
viva
l (%
) GrasslandEdgeForest

87
Figure 7 Mean canopy coverage (%) for 8 gallery forests in Brazil.
4 DISCUSSION
We examined if forest expansion over grassland is foster by a
facilitation process. We assessed whether gallery forests are expanding into
grasslands and whether there is a facilitation process, where first colonizers
facilitate the recruitment fostering forest expansion. Also, based on the stress
gradient hypothesis (SGH), we examined whether there is a change from
positive to negative interactions in the short gradient from grassland to gallery
forest as a consequence of the change in microclimate. We found forest
expanding over grasslands, with of recruitment rates higher than mortality. We
also found the pioneer species having the spearhead role, followed by the light-
demanding species and, lastly, by the shade-tolerant in a clear succession
process, that could suggest a facilitation process. However, the presence of
facilitators did not foster forest expansion since the more facilitators, the less the
forest expansion. Also, there was no change from positive to negative
interactions, but even in the grassland neighbors reduced survival. Although we
did not find first colonizers acting as facilitators, negative interactions do not
completely suppress it, since there was expansion in most of the sites.
0 2 4 6 8 10
4050
6070
8090
Distance from Edge (m)
Mea
n C
anop
y C
over
age
(%)
88
The increases in number of individuals indicate forests expansion into
surrounding natural grasslands, a trend found by several authors (BOWMAN;
WALSH; MILNE,2001; DESJARDINS et al., 1996; HOPKINS, 1992;
KERSHAW, 1992; SANAIOTTI et al., 2002; SCHWARTZ et al., 1996; SILVA
et al., 2008). In addition, the behavior of the studied functional groups denotes
that the expansion front is in a continual succession process with pioneer and
light-demanding species taking the lead, followed by shade-tolerant species.
Such a sequence of occupation has been previously observed in the Congo
(SCHWARTZ et al., 1996) and the Ivory Coast (HENNEMBERG et al., 2006),
where the line of forest expansion towards the savanna was dominated by
pioneer species, followed by shade-tolerant species after the pioneer species had
formed a forest canopy.
However, after a fire event, the number of individuals in Site 8 grassland
decreased. Fire suppresses forest expansion by topkill (i.e. loss of above-ground
biomass) and mortality (HOFFMANN; ORTHEN; FRANCO, 2004). In our
study we could not differentiate between topkill and mortality, but both
processes can lead to reduction of the number of trees, stalling or even reverting
forest expansion. During this study period, only in three sites the grasslands
burned (Sites 8, 9 and 10), but in Site 9 fire did not cause death in the grassland
and on Site 10 the fire extinguished before reaching the plots. Considering that
open areas normally burn at 1-3 year intervals (HOFFMANN; ORTHEN;
FRANCO, 2004), fires in our sites seem much less frequent, at least for the
studied period. These longer intervals are possibly allowing gallery forests in the
southern gallery forest to expand over their surrounding grassland (see also
BOND; MIDGLEY, 2000). Fire suppression could therefore be important for
recruitment in the grassland, since fire seems to be the more important constraint
to forest expansion in Brazil (HOFFMANN et al., 2009).
89
Although forest expansion behaves similar to a succession process that
could suggest a facilitation process, our hypothesis of the first colonizer favoring
forest expansion was not confirmed, since forest expansion was negative in
relation toE. erythropappus abundance. Several studies have shown the
importance of isolated trees in open areas in providing shade, preventing lethal
temperatures and increasing soil moisture (PUGNAIRE; VALLADARES,
2007), so seedlings die less and grow more (HOFFMANN; 1996; KELLMAN;
1985; KELLMAN; MIYANISHI, 1982). However, if the same effect occurred
for older plants we expected to observed a positive relationship between
abundance and recruitment, which did not occur. Therefore, for older plants the
positive effect of protection is exchanged for the negative effect of resource
sharing.
In this context, it is important to consider the lifespan of the colonizer,
since E. erythroppapus is a long lifespan pioneer. Previous studies
(HENNEMBERG et al., 2006; SCHWARTZ et al., 1996) and our data showed
that forest expansion starts with shade intolerant species, which mostly have a
short lifespan. Thus, it is probable that they act as facilitators, but given their
short lifespan, they die fast releasing space and resources sooner than E.
erythroppapus, allowing the plants initially favored by the nurse trees to reach
adulthood. Therefore, although a long lived colonizer could still favor seedling
establishment, they probably do not favor their continuity up to adulthood
leading to lower recruitment rates when they are more abundant.
Changes in microclimate can affect how plants interact with each other
(BERTNESS; CALLAWAY, 1994; CALLAWAY; WALKER, 1997).
Boundaries studied here between grasslands and forest are very sharp and in few
meters the conditions change from a completely open area to a closed forest. Our
light measurements showed that the major changes in canopy cover occur in the
first 5-7 meters of edge. We believed that these differences in light would lead to

90
finding differences in soil moisture, even for the rainy season (December to
February), however we found differences in soil moisture only during the dry
season. Therefore, in these wet conditions (mean annual rain fall 1517 ± 168
mm) soil moisture in grassland is a limiting factor for forest expansion during
the dry season, resulting in plant drought stress (SCHOLES; ARCHER, 1997).
We hypothesized, based on the stress-gradient hypothesis, that
differences in microclimate would lead to changes from positive interactions in
the grassland to negative interactions in the forest (BERTNESS; CALLAWAY,
1994; CALLAWAY; WALKER, 1997). However, our results do not support
this idea, since there was no change from positive interactions to negative as a
response to changes in microclimate, on the contrary neighbors had negative
impact even in the grassland, where neighbors could shelter seedlings and young
trees against environment stress. Given that boundaries between gallery forest
are old, species living there were probable selected by environmental filters that
prioritized traits related to endurance, so they are shade intolerant species that
thrive well under high light, low soil moisture and high speed winds. However,
shade intolerant species seems not to be so good in sharing resources, such as
nutrients and water and in fact, savannas occur in nutrient-poor soils
(KELLMAN 1984; HOFFMANN et al., 2009; LEHMANN et al., 2011).
Therefore, the positive effect of environmental protection in grasslands is not
strong enough to overlap the negative effect of resource sharing.
It is important to consider that even with no positive interactions in the
grassland, there was forest expansion, and even for sites when E. erythroppapus
reduced recruitment the most, recruitment rates were still pretty impressive, with
an expansion of 20% in 5 years. This suggests that while negative interactions
could delay forest expansion, they could not prevent it and that species
establishing and surviving on grasslands are surviving due their great
competition ability in this environment.

91
Our hypothesis that facilitation fosters forest expansion was not
validated. Although forest expansion behaves similar to a succession process
suggesting a facilitation process, our hypothesis of facilitators favoring forest
expansion was not confirmed, since recruitment was negative in relation to
facilitator abundance. Given that E. erythroppapus is a long lifespan pioneer, it
is probable that short lifespan pioneers could facilitate forest expansion, since
they would die faster releasing space and resources, but this requires further
study. Also, there were no changes from positive to negative interactions along
microclimate gradient, and even in the grassland, neighbors reduced survival.
While facilitators can increase seedlings growth and survival, as plants grow the
positive affect of protection is possibly exchanged for a negative effect of
resource sharing. Likewise, the positive effect of environmental protection in
grasslands is not strong enough to overlap the negative effect of resource
sharing. Although we did not find first colonizers and the presence of neighbors
facilitating forest expansion, they do not completely suppress it, since there was
expansion in most of the sites, suggesting that plants establishing in grasslands
are good competitors. On the other hand, fire seems to be much more restrictive
to forest expansion than negative interactions, causing reduction in the number
of trees on the grassland.

92
Table 1 Species that had more than 50 samplings across sites in 8 gallery forests, ordered by their number of individuals (N) followed by functional group (EG): P=pioneer, L= light-demanding, S= shade-tolerant.
Species N FG Myrsine umbellata Mart. 652 L Eremanthus erythropappus (DC.) MacLeish 619 P Myrcia splendens (Sw.) DC. 498 L Psychotria vellosiana Benth. 397 L Miconia chartacea Triana 223 L Vismia guianensis (Aubl.) Pers. 214 P Hyptidendron asperrimum (Epling) Harley 211 L Leandra scabra DC. 209 P Protium spruceanum (Benth.) Engl. 207 L Pera glabrata (Schott) Poepp. ex Baill. 179 L Casearia sylvestris Sw. 175 P Vochysia tucanorum Mart. 164 L Calyptranthes brasiliensis Spreng. 150 S Clethra scabra Pers. 143 L Daphnopsis fasciculata (Meisn.) Nevling 134 L Miconia pepericarpa DC. 121 P Tapirira obtusa (Benth.) J.D.Mitch. 107 L Myrcia venulosa DC. 99 L Faramea latifolia (Cham. & Schltdl.) DC. 91 L Miconia paulensis Naudin 90 P Protium widgrenii Engl. 85 L Casearia decandra Jacq. 82 S Calyptranthes clusiifolia O.Berg 78 S Miconia theaezans (Bonpl.) Cogn. 77 L Myrsine guianensis (Aubl.) Kuntze 70 P Alchornea triplinervia (Spreng.) Müll.Arg. 65 L Siphoneugena reitzii D.Legrand 63 L Copaifera langsdorffii Desf. 57 S Myrcia tomentosa (Aubl.) DC. 51 L
!
!
!
!

93
Table 2 Species that had more than 50 samplings across sites in 8 gallery forests and had dead samples in the grassland, edge and forest.
Species N FG Myrsine umbellata Mart. 652 L Eremanthus erythropappus (DC.) MacLeish 619 P Vismia guianensis (Aubl.) Pers. 214 P Hyptidendron asperrimum (Epling) Harley 211 L Pera glabrata (Schott) Poepp. ex Baill. 179 L Miconia pepericarpa DC. 121 P Myrcia venulosa DC. 99 L Miconia theaezans (Bonpl.) Cogn. 77 L
Table 3 Recruitment and mortality in grasslands surrounding gallery forests in Brazil during 5 years.
Site Recruitment (%. yr-1)
Mortality (%. yr-1)
S10P1 11.18 3.41 S10P2 16.80 2.14 S10P3 0.00 0.00 S1P1 8.33 2.86 S1P2 5.95 0.53 S3P1 19.09 0.00 S3P2 8.42 0.00 S3P3 12.50 0.00 S4P1 11.03 3.89 S4P2 3.71 1.33 S4P3 7.18 2.67 S5P1 4.92 4.56 S5P2 9.09 0.36 S5P3 8.89 1.38 S6P1 8.41 1.35 S6P2 6.83 2.92 S6P3 6.84 1.00 S8P1 20.00 0.00 S8P2 11.67 1.54 S8P3 16.47 5.83 S9P1 13.33 2.86 S9P2 16.36 0.00 S9P3 20.00 0.00
Overall 8.95 1.93

94
Table 4 Soil moisture differences between seasons and different environments for 2010, 2012 and 2013 according to Two-way ANOVA and Tukey test.
2010 Season
Environment
Wet Dry F value p Edge 12.04 13.00 45.93 0.83 Grassland 11.11 8.84 0.19 F value 20.84 p 0.84 0.002
2012 Season Wet Dry F value p Environment Edge 18.12 12.25 45.93 < 0.001
Grassland 14.23 8.00 < 0.001 F value 20.84 p 0.013 < 0.001
2013 Season Wet Dry F value p Environment Edge 16.05 16.03 45.93 0.99
Grassland 11.47 10.92 0.97 F value 20.84 p 0.007 <0.001
!
!
!
!
!
!
!
!

95
5 REFERENCES !
BAUDENA, M. et al. Forests, savannas, and grasslands: bridging the knowledge
gap between ecology and Dynamic Global Vegetation Models. Biogeosciences,
Göttingen, v. 12, n. 6, p. 1833-1848, mar. 2015.
BERTNESS, M. D.; CALLAWAY, R. Positive interactions in communities.
Trends in Ecology and Evolution, Maryland Heights, v. 9, n. 5, p. 191-193,
mai. 1994.
BOND, W. J. Do nutrient-poor soils inhibit development of forests? A nutrient
stock analysis. Plant and Soil, Cham, v. 334, n. 1, p. 47-60, set. 2010.
______. Large parts of the world are brown or black: a different view on the
‘Green World’ hypothesis. Journal of Vegetation Science, Malden, v. 16, n. 3,
p. 261-266, jun. 2005.
______. What limits trees in C4 grasslands and savannas?Annual Review of
Ecology, Evolution, and Systematics, Palo Alto, v. 39, n. 1, p. 641-659, Dec.
2008.
BOND, W. J.; MIDGLEY, G. F. A proposed CO2-controlled mechanism of
woody plant invasion in grasslands and savannas. Global Change Biology,
Malden, v. 6, n. 8, p. 865-869, dez. 2000.
BOND, W.J.; WOODWARD, F.I.; MIDGLEY, G.F. The global distribution of
ecosystems in a world without fire. New Phytologist, Lancaster, v. 165, n. 2, p.
525-538, nov. 2005.
BOWMAN, D. M. J. S. Establishment of two dry monsoon forest species on a
fire-protected monsoon forest-savanna boundary, Cobourg Peninsula, northern

96
Australia. Australian Journal of Ecology, Malden, v. 18, n. 2, p. 235-237, jun.
1993.
BOWMAN, D. M. J. S.; PANTON, W. J. Factors that control monsoon-
rainforest seedling establishment and growth in North Australian eucalyptus
savanna. Journal of Ecology, London, v. 81, n. 2, p. 297-304, jun. 1993.
BOWMAN, D. M. J. S.; WALSH, A.; D. J. MILNE. Forest expansion and
grassland contraction within a Eucalyptus savanna matrix between 1941 and
1994 at Litchfield National Park in the Australian monsoon tropics. Global
Ecology and Biogeography, Malden, v. 10, n. 5, p. 535-548, set./set. 2001.
CALLAWAY, R. M.; WALKER, L. R. Competition and facilitation: a synthetic
approach to interactions in plant communities. Ecology, Washington, v. 78, n. 7,
p. 1958-1965, out. 1997.
CLEMENTS, F. E. Plant succession: An analysis of the development of
vegetation. Washington: Carnegie Institution of Washington, 1916. 512 p.
CONNELL, J. H.; SLATYER, R. O. Mechanisms of Succession in Natural
Communities and Their Role in Community Stability and Organization. The
American Naturalist, Chicago, v. 111, n. 982, p. 1326-1337, nov./dez. 1977.
DANTAS, A. A. A.; CARVALHO, L. G.; FERREIRA, E. Climatic
classification and tendencies in Lavras region, MG. Ciência e Agrotecnologia,
Lavras, v. 31, n. 6, p. 1862-1866, dez. 2007.
DESJARDINS, T. et al. Changes of the forest-savanna boundary in Brazilian
Amazonia during the Holocene revealed by stable isotope ratios of soil organic
carbon. Ecosystems Ecology, Heidelberg, v. 108, n. 4, p. 749-756, dez. 1996.
97
FELFILI, J. M. Determinação de padrões de distribuição de espécies em uma
mata de galeria no Brasil Central com a utilização de técnicas de análise
multivariada. Boletim do Herbário Ezechias Paulo Heringer, Brasília, v. 2, n.
1, p. 35-48, jan. 1998.
FÖLSTER, H.; DEZZEOB, N; PRIESSA, J. A. Soil–vegetation relationship in
base-deficient premontane moist forest–savanna mosaics of the Venezuelan
Guayana. Geoderma, Philadelphia, v. 104, n. 1, p. 95-113, nov. 2001.
FURLEY, P. A. Edaphic changes at the forest-savanna bondary with particular
reference to the neotropics. In: FURLEY, P. A.; PROCTOR, J.; RATTER, J. A.
(Ed.). Nature and dynamics of Forest-Savanna Boundaries. London:
Chapman & Hall, 1992. p. 99-115.
GELMAN, A.; MENG, X. L.; STERN, H. Posterior predictive assessment of
model fitness via realized discrepancies. Statistica Sinica, Taipei, v. 6, p. 733-
807, set. 1996.
GOODLAND, R.; POLLARD, R. The Brazilian Cerrado vegetation: a fertility
gradient. Journal of Ecology, London, v. 61, n. 1, p. 219-224, mar. 1973.
GRAY, E. F.; BOND, W. J. Soil nutrients in an African forest/savanna mosaic:
Drivers or driven? South African Journal of Botany, Cape Town, v. 101, p.
66-72, nov. 2.
GRIME, J. P. Evidence for the Existence of Three Primary Strategies in Plants
and Its Relevance to Ecological and Evolutionary Theory. The American
Naturalist, Chicago, v. 111, n. 982, p. 1169-1194, nov./dez. 1977.
HENNENBERG, K. J. et al. Phytomass and Fire Occurrence along Forest-
Savanna Transects in the Comoé National Park, Ivory Coast. Journal of

98
Tropical Ecology, Cambridge, v. 22, n. 3, p. 303-311, mai. 2006.
HEGYI, F. A simulation model for managing jack-pine stands. Growth model for tree and stand simulation. Royal College of Forestry, Stockholm, 1974.
HOFFMANN, W. A. et al. Fuels or microclimate? Understanding the drivers of
fire feedbacks at savanna-forest boundaries. Austral Ecology, Malden, v. 37, n.
6, p. 634-643, set. 2011.
______. Tree topkill, not mortality, governs the dynamics of savanna–forest
boundaries under frequent fire in central Brazil. Ecology, Washington, v. 90, n.
5, p. 1326-1337, mai. 2009.
HOFFMANN, W. A. The effects of fire and cover on seedling establishment in a
neotropical savanna. Journal of Ecology, London, v. 84, n. 3, p. 383-393, jun.
1996.
HOFFMANN, W. A.; ORTHEN, B.; FRANCO, A. C. Constraintts to seedling
success of savanna and forest trees across the savanna-forest boundary.
Oecologia, Heidelberg, v. 140, n. 2, p. 252-260, jul. 2004.
HOPKINS, B. Ecological processes at the forest-savanna boundary. In:
FURLEY PA, PROCTER J, RATTER JA (Ed.) Nature and dynamics of
forest-savanna boundaries. Chapman and Hall, London, 1992. p 21–33.
HUNTER, A. F.; AARSSEN, L. W. Plants helping plants. BioScience, Oxford,
v. 38, n. 1, p. 34-40, jan. 1988.
INSTITUTO BRASILEIRO DE GEOGRAFIA E ESTATÍSTICA. Mapa de
vegetação do Brasil. Rio de Janeiro, 2004. 1 mapa. Escala 1:5.000.000.
KELLMAN, M. Forest Seedling Establishment in Neotropical Savannas:

99
Transplant Experiments with Xylopia frutescens and Calophyllum brasiliense.
Journal of Biogeography, Malden, v. 12, n. 4, p. 373-379, jul. 1985.
______. Synergistic relationships between fire and low soil fertility in
neotropical savannas: a hypothesis. Biotropica, Lawrence, v. 16, n. 2, p. 158-
160, jun. 1984.
KELLMAN, M.; MIYANISHI, K. Forest Seedling Establishment in Neotropical
Savannas: Observations and Experiments in the Mountain Pine Ridge Savanna,
Belize. Journal of Biogeography, Malden, v. 9, n. 3, p. 193-206, mai. 1982.
KERSHAW, A. P. The development of rainforest-savanna boundaries in tropical
Australia. In: FURLEY PA, PROCTER J, RATTER JA (Ed.) Nature and
dynamics of forest-savanna boundaries. Chapman and Hall, London, 1992. p
255–271.
LEHMANN, C. E. et al. Deciphering the distribution of the savanna biome. New
Phytologist, Lancaster, v. 191, n. 1, p. 197-209, jul. 2011.
LLOYD, J. et al. Contributions of woody and herbaceous vegetation to tropical
savanna ecosystem productivity: a quasi-global estimate.Tree Physiology,
Victoria, v. 28, n. 3, p. 219-224, fev. 2008.
NUNES, Y. R. F. et al. Variações da fisionomia, diversidade e composição de
guildas da comunidade arbórea em um fragmento de floresta semidecidual em
Lavras, MG. Acta Botanica Brasilica, Porto Alegre, v. 17, n. 2, p. 213-229,
abr./jun. 2003.
OLIVEIRA-FILHO, A. T. et al. Effect of flooding regime and understorey
bamboos on the physiognomy and tree species composition of a tropical

100
semideciduous forest in Southeastern Brazil. Vegetatio, Dordrecht, v. 113, n. 2,
p. 99-124, Aug. 1994a.
______. Effects of soils and topography on the distribution of tree species in a
tropical riverine forest in south-eastern Brazil. Journal of Tropical Ecology,
Cambridge, v. 10, n. 4, p. 483-508, Nov. 1994b.
OLIVEIRA-FILHO, A. T.; FLUMINHAN-FILHO, M. Ecologia da Vegetação
do Parque Florestal Quedas Do Rio Bonito.Cerne, Lavras, v. 5, n. 2, p. 51-64,
abr. 1999.
OLIVEIRA-FILHO, A. T.; MELLO, J. M.; SCOLFORO, J. R. S. Effects of the
past disturbance and edges on tree community structure and dynamics within a
fragment of tropical semideciduous forest in south-eastern Brazil over a five-
year period 1987-1992. Plant Ecology, Dordrecht, v. 131, n. 1, p. 45-66, July
1997.
ONDEI, S. et al. Post-fire resprouting strategies of rainforest and savanna
saplings along the rainforest–savanna boundary in the Australian monsoon
tropics. Plant Ecology, New York, p. 1-14, out. 2015.
PEREIRA, I. M. et al. Caracterização ecológica de espécies arbóreas ocorrentes
em ambientes de mata ciliar, como subsídio à recomposição de áreas alteradas
nas cabeceiras do Rio Grande, Minas Gerais, Brasil. Ciência Florestal, Santa
Maria, v. 20, n. 2, p. 235-253, abr./jun. 2010.
PINTO, J. R. R.; HAY, J. D. V. Mudanças florísticas e estruturais na
comunidade arbórea de uma floresta de vale no Parque Nacional da Chapada dos
Guimarães, Mato Grosso, Brasil. Revista Brasileira de Botânica, São Paulo, v.
28, n. 3, p. 523-539, jul. 2005.

101
PLUMMER, M. 2014. rjags: Bayesian graphical models using MCMC: R
package Version 3-13. Disponível em: <http://CRAN.R-
project.org/package=rjags>. Acesso em: 2 jul. 2015.
PUGNAIRE, F.; VALLADARES, F. Functional plant ecology. 2 ed. Boca
Raton: CRC Press, 2007. 744 p.
ROSSATTO, D. R.; HOFFMANN, W. A.; FRANCO, A. C. Differences in
growth patterns between co-occurring forest and savanna trees affect the forest–
savanna boundary. Functional Ecology, London, v. 23, n. 4, p. 689-698, ago.
2009.
SANAIOTTI, T. M. et al. Past vegetation changes in Amazon savannas
determined using carbon isotopes of soil organic matter. Biotropica, Malden, v.
34, n. 1, p. 2-16, mar. 2002.
SARMIENTO, G. A conceptual model relating environmental factors and
vegetation formations in the lowlands of tropical South America. In: Furley,
P.A., Proctor, J., Ratter, J.A. (Eds.), Nature and Dynamics of Forest–Savanna
Boundaries. Chapman and Hall, London, 1992, p. 583–601.
SCHOLES, R. J.; ARCHER, S. R. Tree-grass interactions in savannas. Annual
Review in Ecology, Evolution and Systematics, Palo Alto, v. 28, n. 1, p. 517-
544, Jan. 1997.
SCHWARTZ, D. et al. Present dynamics of the savanna-forest boundary in the
Congolese Mayombe: a pedological, botanical and isotopic (13C and 14C)
study. Oecologia, Heidelberg, v. 106, n. 4, p. 516-524, jun. 1996.

102
SHEIL, D.; JENNINGS, S.; SAVILL, P. Long-term permanent plot observations
of vegetation dynamics in Budongo, a Ugandan rain forest. Journal of Tropical
Ecology, Cambridge, v. 16, n. 6, p. 765-800, Nov. 2000.
SILVA, L. C. R. et al. Expansion of gallery forests into central Brazilian
savannas. Global Change Biology, Maiden, v. 14, n. 9, p. 2108-2118, set. 2008.
STAVER, A. C.; ARCHIBALD, S.; LEVIN, S. Tree cover in sub-Saharan
Africa: rainfall and fire constraint forest and savanna as alternative stable states.
Ecology, Washington, v. 92, n. 5, p. 1063-1072, mai. 2011.
SWAINE, M. D.; WHITMORE, T. C. On the definition of ecological species
groups in tropical rain forest. Vegetatio, Dordrecht, v. 75, n. 1/2, p. 81-86, May
1988.
VAN DEN BERG, E.; OLIVEIRA-FILHO, A. T. Spatial partitioning among
tree species within an área of tropical montane gallery forest in south-eastern
Brazil. Flora, London, v. 194, n. 3, p. 249-266, July 1999.
______. Composição florística e estrutura fitossociológica de uma floresta
ripária em Itutinga, MG, e comparação com outras áreas. Revista Brasileira de
Botânica, São Paulo, v. 23, n. 3, p. 231-253, set. 2000.
VAN DEN BERG, E.; SANTOS, F. A. M. Aspectos da variação ambiental em
uma floresta de galeria em Itutinga, MG, Brasil. Ciência Floresta, Santa Maria,
v. 13, n. 2, p. 83-98, dez. 2003.
WHITTAKER, R. H. Communities and ecosystems.2nd ed. New York:
Macmillan, 1975. 352 p.!
!
!