functional modeling joseph valacich, joey george and jeff hoffer, essentials of system analysis and...
TRANSCRIPT

Functional Modeling
Joseph Valacich, Joey George and Jeff Hoffer, Essentials of System Analysis and Design, 4th edition, Prentice Hall, 2009.

Outline
• Definition and construction of functional models
• Documenting functional models---Data flow diagram (DFD)
• Structuring and organizing DFDs
2

Review: Modeling
• Functional: what happens
• Dynamic: when it happens
• Static: what it happens to
3
Functional Models
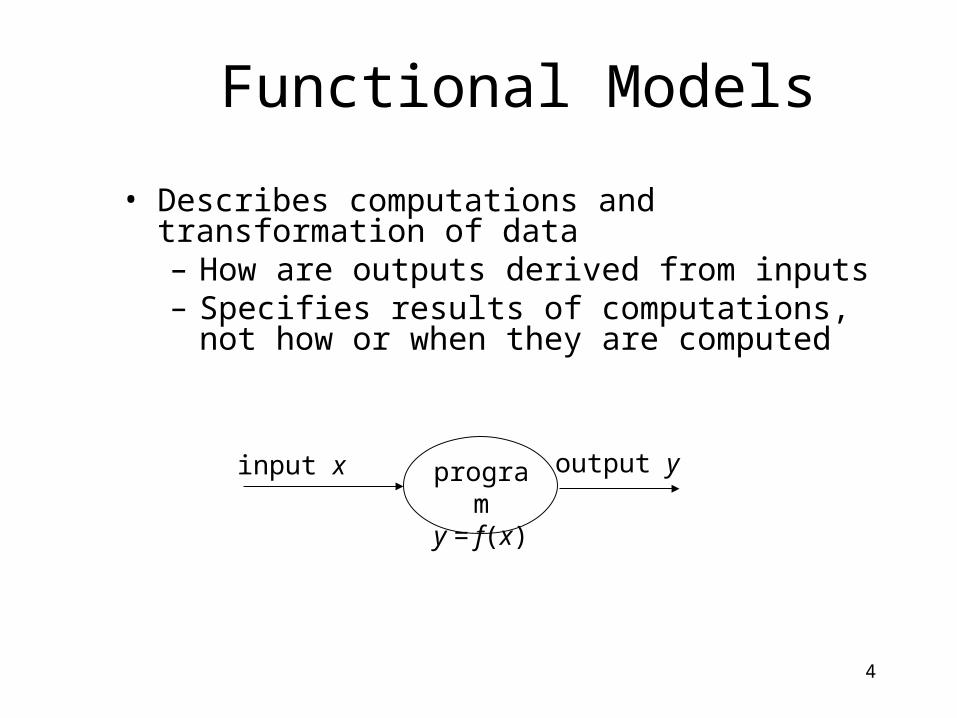
• Describes computations and transformation of data– How are outputs derived from inputs– Specifies results of computations, not how or
when they are computed
4
programy = f(x)
input x output y

Functional Models (Cont.)
• Does not describe timing– Has no regard for order of operations– No control information– Not a flow chart
• Uses diagrams– Use cases– Data flow diagram (DFD, not a UML diagram)– Activity diagrams
5
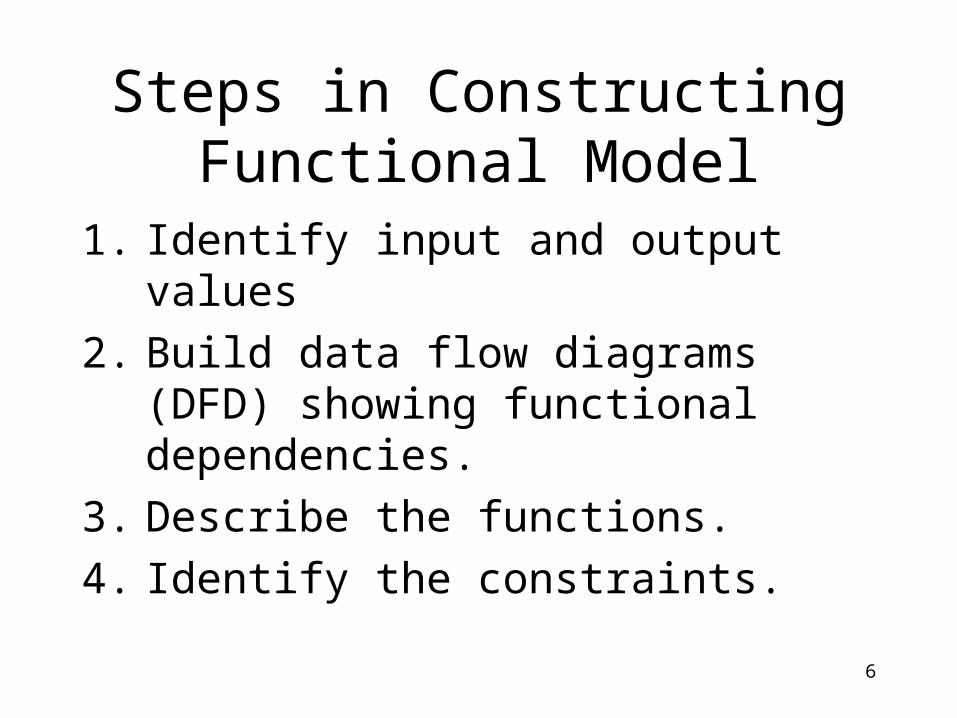
Steps in Constructing Functional Model
1. Identify input and output values
2. Build data flow diagrams (DFD) showing functional dependencies.
3. Describe the functions.
4. Identify the constraints.
6

1. Identify Input/Output
• At the highest level of abstraction, these are the system inputs and outputs.
• Each lower level has inputs and outputs defined by some higher level.
7
programinput x output y

2. Build Diagrams
• Start with each output and determine what function computes it.
• (Or trace forward from inputs.)• Expand each non-trivial process in a higher-
level diagram by constructing a lower-level diagram.
8
f1
f11
f12
f13
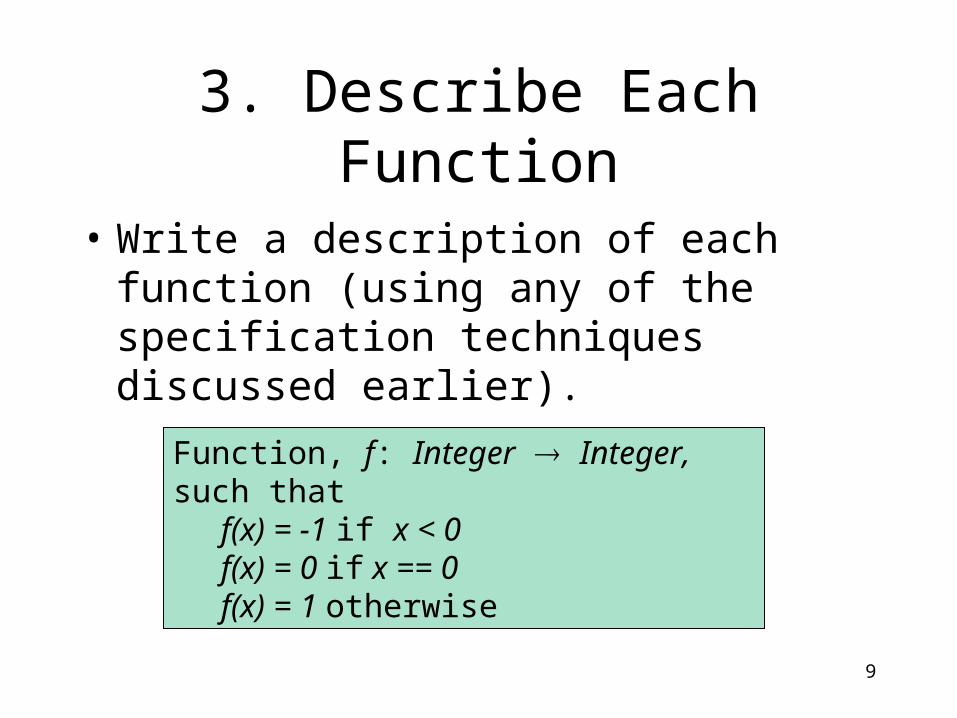
3. Describe Each Function
• Write a description of each function (using any of the specification techniques discussed earlier).
9
Function, f: Integer Integer, such that f(x) = -1 if x < 0f(x) = 0 if x == 0f(x) = 1 otherwise
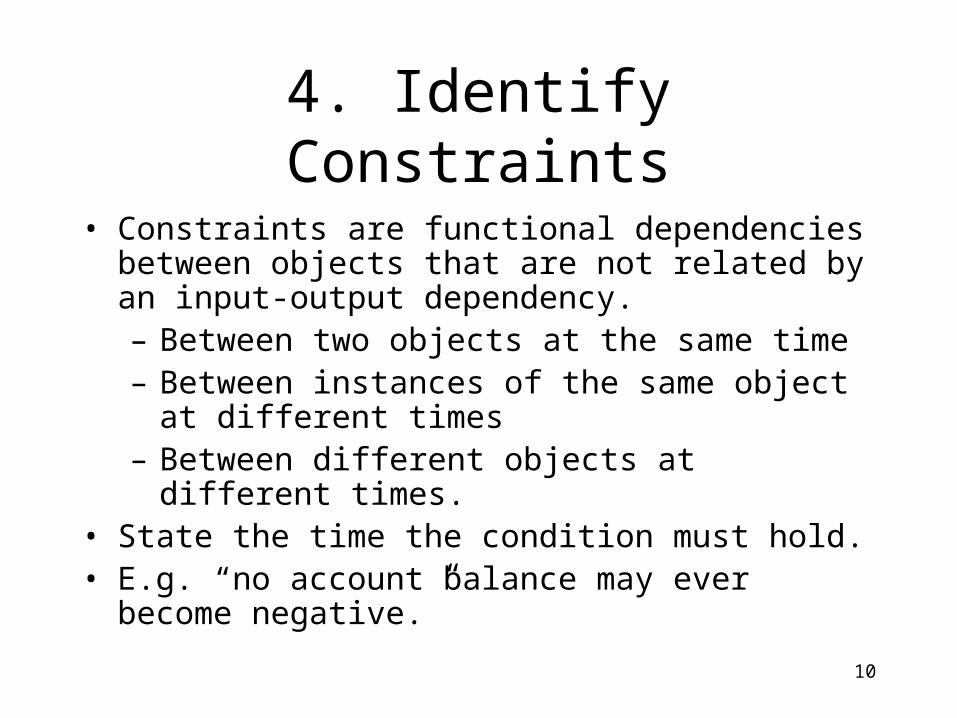
4. Identify Constraints
• Constraints are functional dependencies between objects that are not related by an input-output dependency. – Between two objects at the same time– Between instances of the same object at different
times– Between different objects at different times.
• State the time the condition must hold.• E.g. “no account balance may ever become
negative.”
10

Specifying Functions
• Need a signature (syntactic or interface)• Need transformations (semantics or meaning)
11

Specifying Functions (Cont.)
• Need a signature (syntactic or interface)– Name– Arguments (number, order, types)– Values returned (number, order, types)
• Need transformations (semantics or meaning)
12

Specifying Functions (Cont.)
• Need a signature (syntactic or interface)• Need transformations (semantics or meaning)
– Equations and formulae– Tables of values– Pre and post conditions– Decision tables– Pseudo code– Natural language
13

Functions
• Trivial– Access: read or write attributes. May not
be necessary to show all of these.
• Non-trivial– Queries: no side effects– Actions: “instantaneous” (atomic)– Activities: duration over time
14

Outline
Definition and construction of functional models
• Documenting functional models---Data flow diagram (DFD)
• Structuring and organizing DFDs
15

Documenting Functional Models
• Uses diagrams– Data Flow Diagram (DFD)– UML Activity Diagram
16

17
Data Flow Diagram (DFD)
• Semi-formal notation for specifying– Functions of an information system and– How data flow from functions to functions
• Describes systems as– Collections of functions that manipulate data– Data can
• Be stored in data repository,• Flow in data flows, and• Be transferred to or from the environment.
Price List
Find CostItems Cost
CustomerCustomer
18
DFDs Are Not For Specifying
• Order of operations (functions)
• Control information
• Flow charts

19
DFD Notation
• Four components– Processes
– Data flows
– Data stores
– Sources/sinks
(or )

20
Processes
• Transform data values
• Drawn as ellipses with fixed number of in-arrows and out-arrows
DivideInteger
dividend
divisor
quotient
remainder

21
Data Flows
• Connect processes• Represent intermediate data• Values are not changed by data flow• Arrow with name or type of data
integer a
copy
addresscity
zipsplit
addresscity
zip
street
aggregation
22
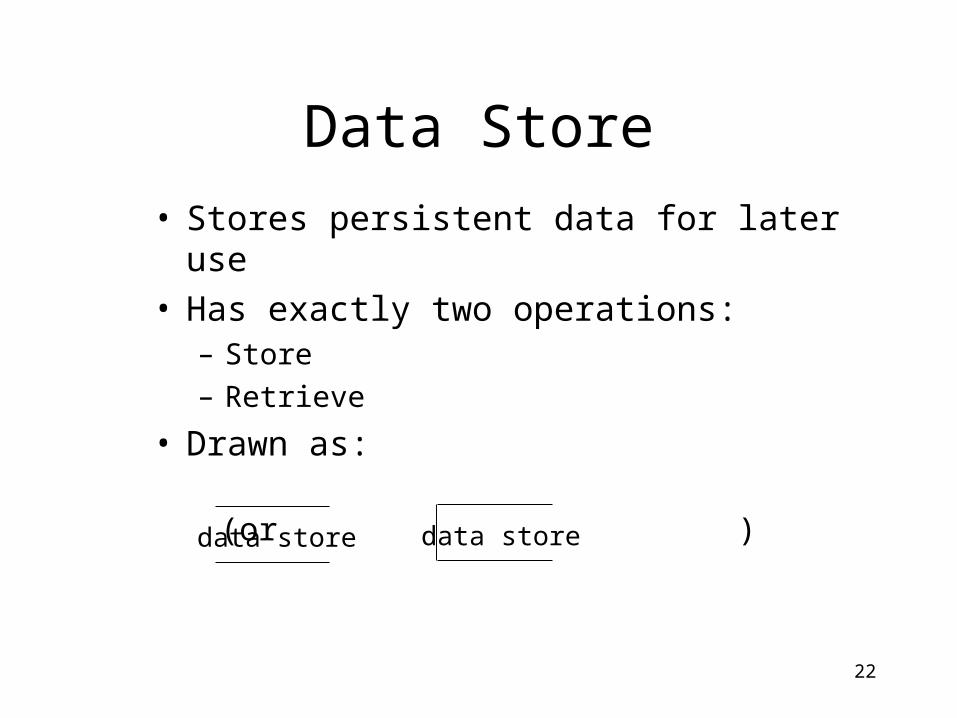
Data Store
• Stores persistent data for later use• Has exactly two operations:
– Store– Retrieve
• Drawn as:
data store (or )data store
23
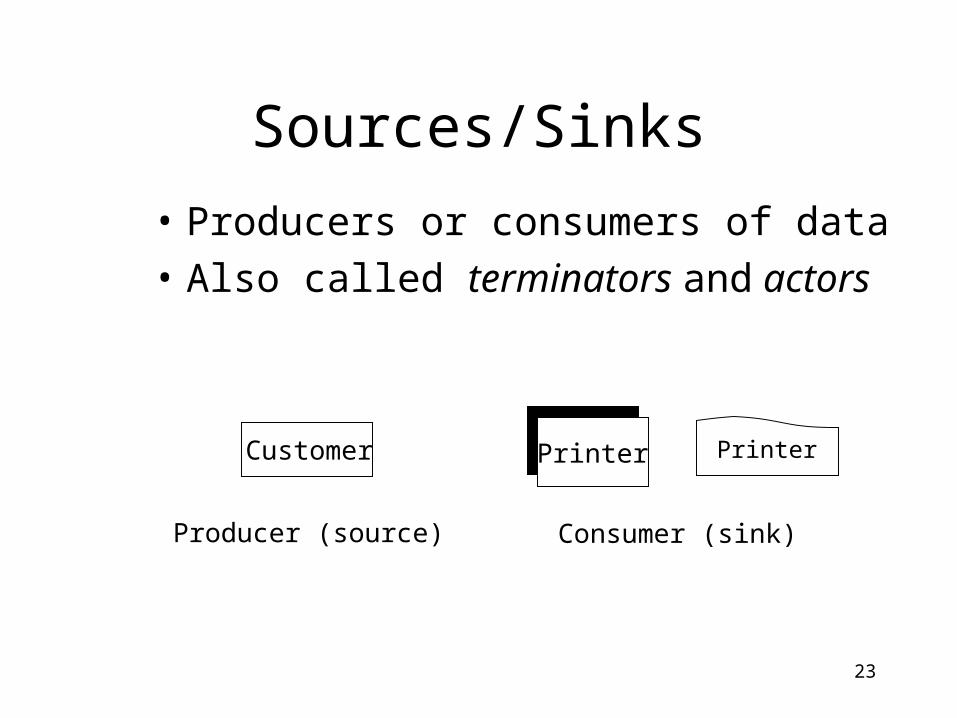
Sources/Sinks
• Producers or consumers of data
• Also called terminators and actors
Customer
Producer (source) Consumer (sink)
PrinterPrinter Printer

24
DFD Example 1
Price Lists
Find CostItem Name Cost
Price List

25
DFD Example 2
Compute statistics
Calculategrades
NamesScores
Grades
Create report
NamesScores
AverageMedian
Grade Book
NamesScores
Grades
Gradereport PrinterPrinter
AverageEnter
scores
ScoresNamesScores
Teaching Assistant

26
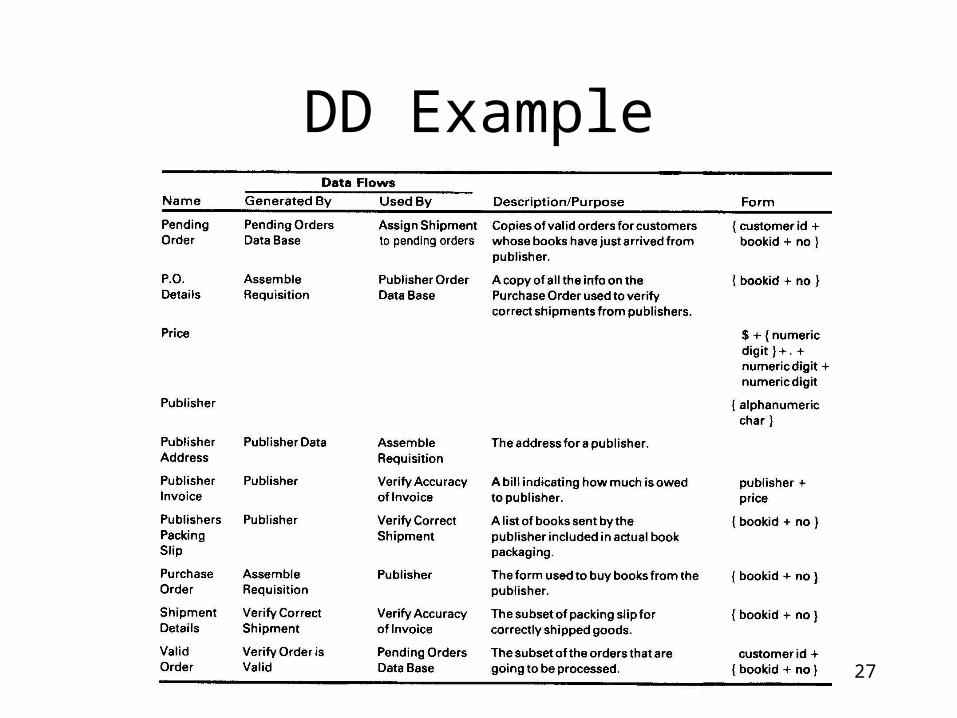
Data Dictionary• Repositories to store information about all data
items defined in the DFD• DD may include:
– Name of data item– Aliases (other names for item)– Description and purpose– Range of values– Data flow (generated by, used by)– Data structure definition and form
Alan Davis, Software Requirements, Prentice Hall, 1993.
27
DD Example

28
In Class: Candy Machine
Pairs (5 minutes): Model the function of a candy machine described below.
– Customer inserts coins – Machine validates coins– Customer selects a candy– Machine validates candy selection– Machine validates transaction– Machine dispenses change– Machine dispenses product
Outline
Definition and construction of functional models
Documenting functional models---Data flow diagram (DFD)
• Structuring and organizing DFDs
29

Problems with This DFD?

31
Organizing DFDs
• Apply levels of abstraction (leveling)• The initial DFD is:
• This can be expanded into lower levels.
• Eventually, the process must stop.– When atomic processes can be
described.
programinput output
32
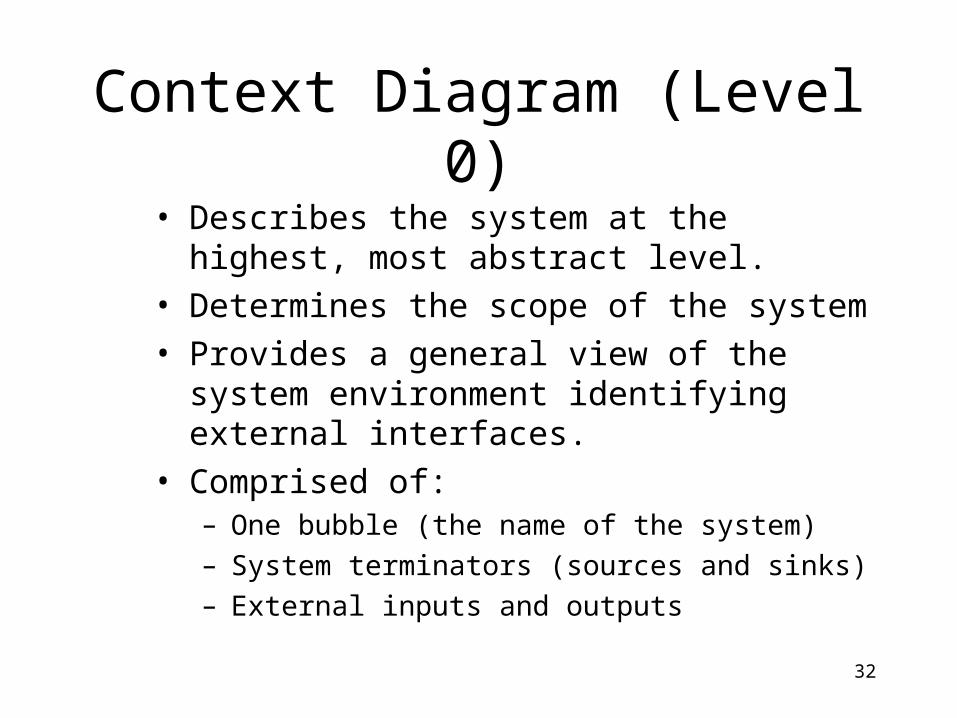
Context Diagram (Level 0)• Describes the system at the highest, most
abstract level.• Determines the scope of the system• Provides a general view of the system
environment identifying external interfaces.• Comprised of:
– One bubble (the name of the system)– System terminators (sources and sinks)– External inputs and outputs
33
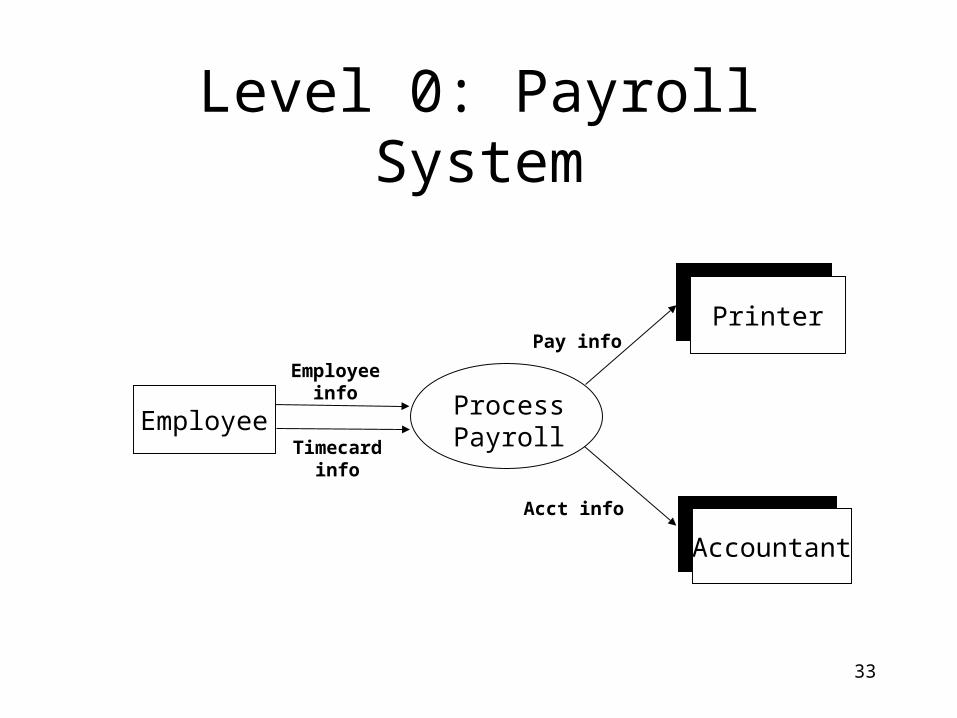
Level 0: Payroll System
ProcessPayroll
Employeeinfo
Timecardinfo
Pay info
Acct info
PrinterPrinter
PrinterAccountant
PrinterEmployee

34
Concept of Leveling: Rules of Decomposition
1. AI2
I1O
1.1 J 1.3 L
1.2 K
I1
I2
O
Data storage
dx
dy
dydz
dx
Level n
Level n+1
35
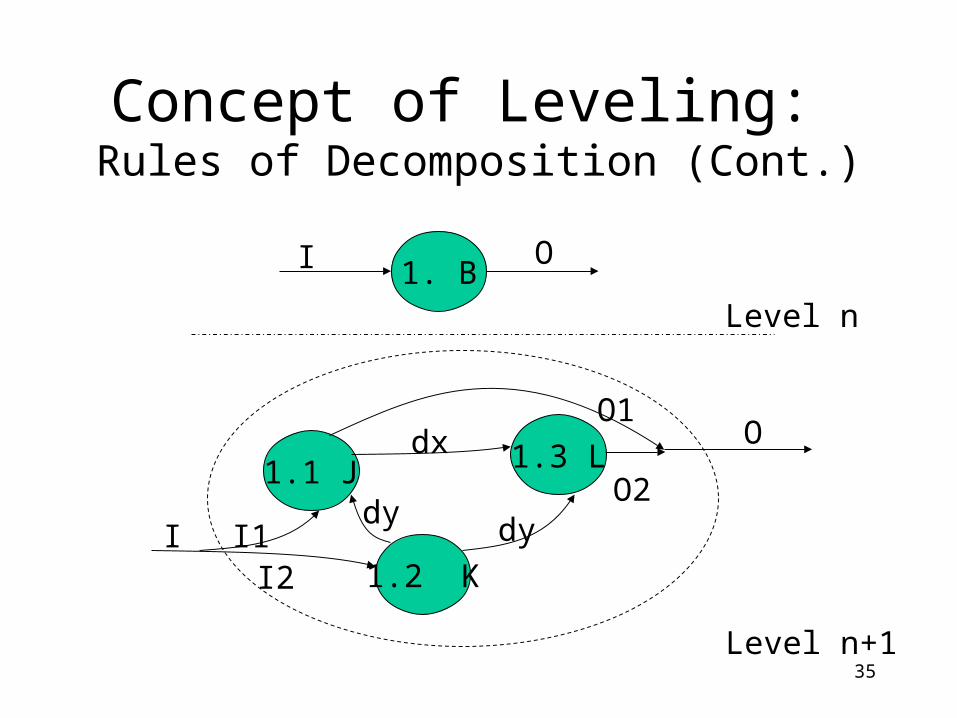
Concept of Leveling: Rules of Decomposition (Cont.)
1. BI O
1.1 J 1.3 L
1.2 KI
Odx
dydyI1
I2
O1
O2
Level n
Level n+1
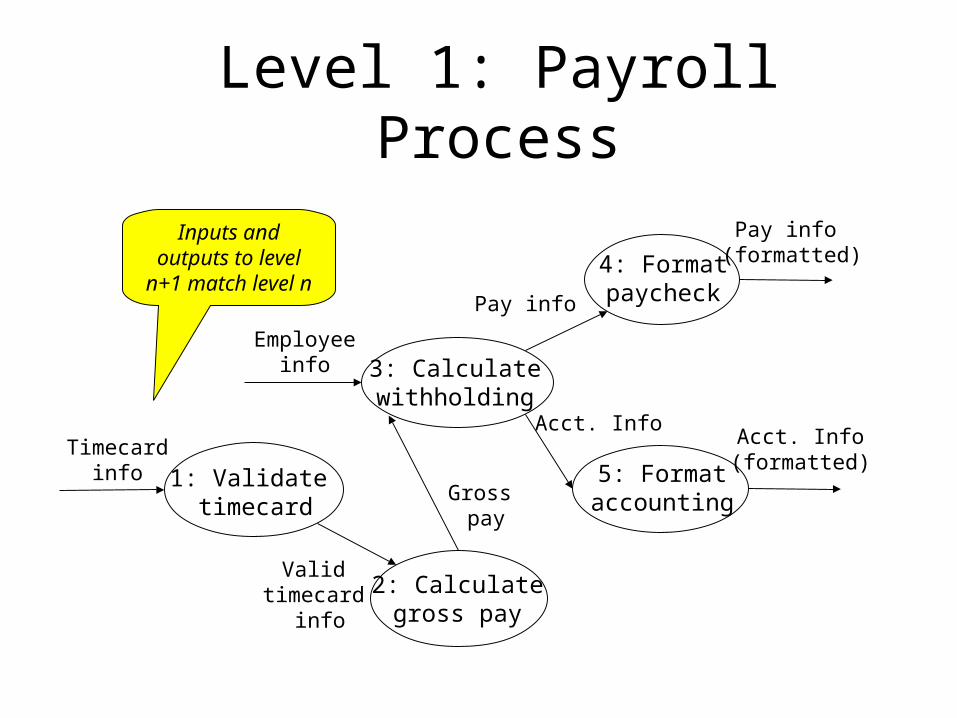
Level 1: Payroll Process
3: Calculatewithholding
4: Formatpaycheck
1: Validate timecard
2: Calculategross pay
5: Formataccounting
Employeeinfo
Acct. Info(formatted)
Acct. Info
Pay info
Gross pay
Valid timecard
info
Timecardinfo
Pay info (formatted)
Inputs and outputs to level n+1 match
level n
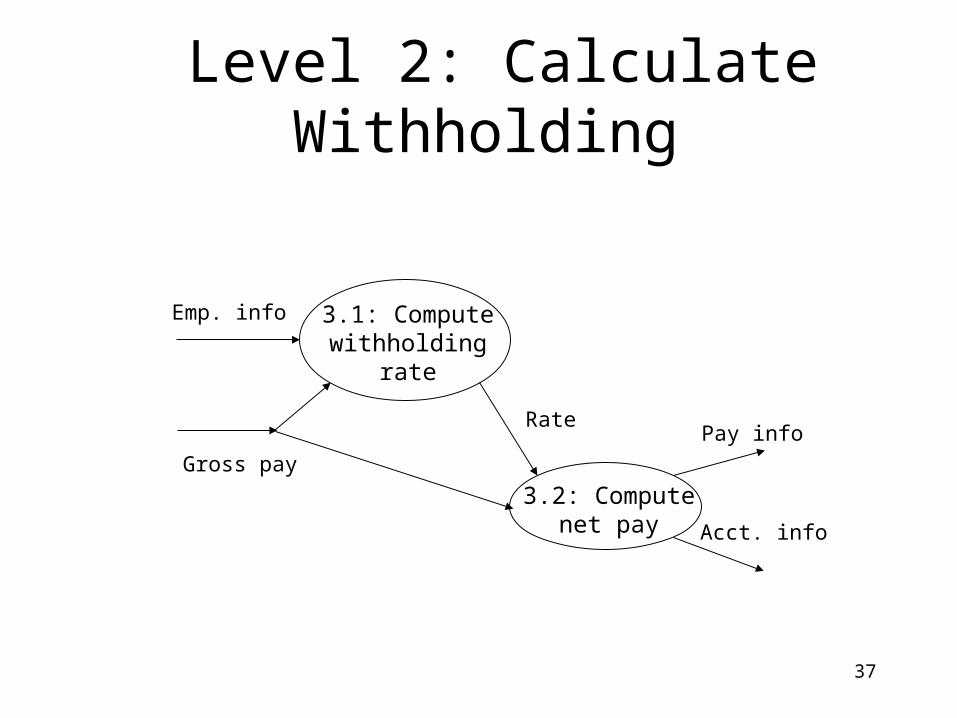
Level 2: Calculate Withholding
3.1: Computewithholding
rate
Emp. info
Acct. info
Pay info
Gross pay
3.2: Computenet pay
Rate
37
Notes:
• Show all possible computation paths for values.
• Do not show what paths are executed in what order (that’s the job of the dynamic model).
• There may be many Level N+1 diagrams for each Level N diagram. Level N+1 expands a single node of a Level N diagram.
38

39
Guidelines for Designing DFDs
1. Describe the system at the highest, most abstract level (context diagram)
2. Decompose the system and represent it as a DFD with multiple bubbles.
2.1 Document the processes
2.2 Fill out the data dictionary
3. Decompose a process (following step 2) until the problem is understood
40
Identifying Data
• At the highest level of abstraction, these are the system inputs and outputs.
• Each lower level has inputs and outputs defined by some higher level.

41
Identifying Processes
• Start with each output and determine what function computes it.
• (Or trace forward from inputs.)
• Expand each non-trivial function (process) by constructing a lower-level diagram.

Things to Check in DFDs1. Is each requirements function represented
by a transform in the DFDs?2. Is each system input and output represented
in the DFDs?3. Is each I/O from a higher-level DFD
reproduced correctly on the lower-level DFDs?
4. Is each transform in the lowest-level DFDs primitive?
42

Things to Check in DFDs
5. Are all labels of information flows in the data dictionary?
6. Do all data dictionary entries appear in the DFDs?
43

In Class: Groups of 3
• Draw the DFD for the gas pump controller (see handout).
• Draw a Level 0, Level1, and 2 Level 2 diagrams.
• (15 minutes)
44