functional renal imaging - front page · a very warm welcome to the 2nd international symposium on...
TRANSCRIPT

2nd InternationalScientific Symposium
October 11 – 13, 2017
MDC.C – Max Delbrück Communications Center
Robert-Rössle-Str. 1013125 Berlin, Germany
FUNCTIONALRENAL IMAGING:Where Physiology, Nephrology, Radiology and Physics Meet
PROGRAM & ABSTRACTS
www.renal-imaging.org
MDC25

2 2nd International Scientific Symposium · FUNCTIONAL RENAL IMAGING
MESSAGE FROM THE ORGANIZERS
MESSAGE FROM THE ORGANIZERS
Dear colleagues and friends,
A very warm welcome to the 2nd International Symposium on Functional Renal Imaging in Berlin!
This symposium is a continuation of the highly successful meeting on Functional MRI for Renal Parenchymal Disease two years ago in Bordeaux, France.
We designed this symposium to bring basic scientists, clinical scientists and clinicians from physiology, nephrology, radiology, internal medicine and related fields, as well as experts in imaging sciences and physics under the same roof. We aim to provide a plat-form for fruitful engagement with colleagues and peers, and to foster the development of local, national and international collaborations to explore multi-disciplinary imaging approaches. Participants from very different disciplines will meet-up, learn about and from each other, form new ideas and push ahead new initiatives. This symposium will provide an overview of cutting edge clinical and pre-clinical renal imaging techniques, and explore the clinical relevance of renal imaging, the future directions of renal functional MR, and the harmonization of these ap-proaches with clinical applications.
To this end, we tailored the programme on a day-to-day basis:
Talks on Day-1 introduce the participants to the must-know basic key facts, principles and methods of renal physiology, renal diseases, imaging and quantitative measure-ments.
Talks on Day-2 and Day-3 are intended to provide deeper insights into MRI methods and explore emerging imaging and postprocessing techniques. “Insights” sessions on dynamic contrast-enhanced (DCE) MRI, arterial spin labelling (ASL), ox-ygenation MRI (BOLD), and diffusion MRI (DWI, DTI) aim to go beyond the typical congress presentations focussing more on practical issues and the challenges to interpret results.
The scientific program comprises 16 sessions, covering a wide spectrum of renal physiology and pathologies, invasive quantitative approaches, optical imaging techniques, photoacoustic imaging and MR imaging. We are honoured to present an array of outstanding international speakers including first class basic scientists, technology leaders and distinguished clinical ex-perts. Focused sessions will provide deeper explanations into the most pressing imaging needs from the clinical perspective, and highlight the potential of renal imaging for the assessment of renal physiology, and the challenges en route to broader clinical applications.

Berlin, October 11 – 13, 2017 · MDC.C – MAX DELBRÜCK COMMUNICATIONS CENTER 3
MESSAGE FROM THE ORGANIZERS
Numerous power poster presentations will bring to the attention of the audience a large num-ber of poster presenters. The best posters, as judged by the audience, will receive an award.
The symposium is complemented by working group meetings on Day-3, organized by the COST action “MRI Biomarkers for Chronic Kidney Disease” (PARENCHIMA). PARENCHI-MA coordinates the research of leading European groups to: (1) improve the reproducibility and standardization of renal MRI biomarkers; (2) increase their availability by developing an open-ac-cess toolbox with software and data; (3) demonstrate biological validity and clinical utility in a prospective multicenter clinical study. All participants are invited to join these meetings!
The City of Berlin welcomes you with unique light installations and colourful illuminations of numerous landmarks during the Festival of Lights. Don’t miss the chance to go on a lightsee-ing tour!
Thank you very much for joining us in Berlin. Enjoy the symposium!
LOCAL ORGANIZERS:
Andreas Pohlmann
(MDC)
Sonia Waiczies
(MDC)
Erdmann Seeliger
(Charité)
Kathleen Cantow
(Charité)
Dirk Grosenick
(PTB)
Pontus Persson
(Charité) Thoralf Niendorf (MDC)

4 2nd International Scientific Symposium · FUNCTIONAL RENAL IMAGING
CONFERENCE INFORMATION
CONFERENCE INFORMATION
Venue:Max Delbrück Communications Center (MDC.C)Robert-Rössle-Straße 1013125 Berlin-Buch, Germany
Date: Wednesday, October 11 to Friday, October 13, 2017
Registration:Regular fee: 450 €Student fee: 200 €Day ticket: 200 €
The registration fee includes attendance at all scientific lectures and working groups, October 11 – 13, conference documents, name badge, final program and abstract book, conference bag, conference dinner (downtown), coffee breaks (a.m./p.m.), lunch and free internet access.
Posters:Posters will be displayed during the meeting in the foyer of the Max Delbrück Communications Center.
The size of a single poster should not exceed 1 m x 1,20 m (width/height).You will find the number of your poster in this abstract section. According to this number, you should mount your poster in the exhibition area.
Contact:
Lien-Georgina Dettmann & Rosita Knispelphone: +49 30 9406 2719 / +49 30 9406 4505Email: [email protected]: www.renal-imaging.org

Berlin, October 11 – 13, 2017 · MDC.C – MAX DELBRÜCK COMMUNICATIONS CENTER 5
SOCIAL EVENT
SOCIAL EVENT
Date:Thursday, 12 October 2017
Time:19:00
Address:Museum für NaturkundeInvalidenstraße 4310115 Berlin
The social event will be held at the Museum of Natural History. It is one of the most im-portant research institutions worldwide in the areas of biological and geological evolution and biodiversity and houses more than 30 million specimens. It is famous for two exhibits: the larg-est mounted dinosaur in the world, and a well-preserved specimen of the earliest known bird, Archaeopteryx. Currently it exhibits one of the best-preserved T-Rex skeletons worldwide. Guided tours will be offered during the event.
Busses are leaving from the venue at 18:00.
www.naturkundemuseum.berlin/en
Fotos: Carola Radke


Berlin, October 11 – 13, 2017 · MDC.C – MAX DELBRÜCK COMMUNICATIONS CENTER 7
ACKNOWLEDGEMENT
This symposium is co-organized by the European Cooperation in Science and Technology (COST) action “MRI Biomarkers for Chronic Kidney Disease” (PARENCHIMA, CA16103).
About COST:COST is the longest-running European framework supporting trans-national cooperation among researchers, engineers and scholars across Europe. It is a unique means for them to jointly develop their own ideas and new initiatives across all fields in science and technology, including social sciences and humanities, through pan-European networking of nationally fund-ed research activities. Based on a European intergovernmental framework for cooperation in science and technology, COST has been contributing – since its creation in 1971 – to closing the gap between science, policy makers and society throughout Europe and beyond. As a precursor of advanced multidisciplinary research, COST plays a very important role in building a European Research Area (ERA).It anticipates and complements the activities of the EU Framework Programmes, constituting a “bridge” towards the scientific communities of COST Inclusiveness Target Countries. It also increases the mobility of researchers across Europe and fosters the establishment of scientific excellence.
For further details please visit: www.cost.eu
About the COST action “MRI Biomarkers for Chronic Kidney Disease”(PARENCHIMA, CA16103):“The rising prevalence of Chronic Kidney Disease (CKD) poses a major public health challenge affecting >10% of the population. But the field has not seen a truly new therapy in over 15 years, and an alarming number of large recent CKD progression trials have failed. In order to overcome this challenge, there is an urgent need for better biomarkers to identify patients that are at risk of progression, or are likely to respond to candidate therapeutics. Magnetic Resonance Imaging (MRI) biomarkers have shown a high potential to help fill this gap as they are non-invasive and sensitive to CKD pathophysiology.Despite their potential, renal MRI biomarkers are today underused in research and in clini-cal practice due to the need for dedicated in-house expertise and development. Transferring solutions to other centres is therefore a challenge, and this leads to a significant duplication of efforts, a lack of standardisation in the methods, and difficulties in comparing results between centres. This also limits commercial exploitation, and hinders the set-up of multi-centre trials or translation into clinical practice.The overall aim of PARENCHIMA is to eliminate the main barriers to the broader study, com-mercial exploitation and clinical use of renal MRI biomarkers. PARENCHIMA will coordinate the research of leading European groups in this area to: (1) improve the reproducibility and stan-dardisation of renal MRI biomarkers; (2) increase their availability by developing an open-access toolbox with software and data; (3) demonstrate biological validity and clinical utility in a pro-spective multicentre clinical study.
For further details please visit: www.cost.eu/COST_Actions/ca/CA16103

8 2nd International Scientific Symposium · FUNCTIONAL RENAL IMAGING
ACKNOWLEDGEMENT
The organizers wish to acknowledge the generous support (PO 1869/2-1) provided by the German Research Foundation (Deutsche Forschungsgemeinschaft, DFG).
About the DFG:The DFG is the self-governing organisation for science and research in Germany. It serves all branches of science and the humanities. In organisational terms, the DFG is an association under private law. Its membership consists of German research universities, non-university re-search institutions, scientific associations and the Academies of Science and the Humanities.The DFG supports projects from all areas of science and the humanities and especially pro-motes interdisciplinary cooperation among researchers. DFG funding enables cooperation be-tween researchers from all branches of science as well as the formation of internationally visible priorities at universities and non-university research institutions.The DFG actively encourages international research cooperation: all of its programmes promote cooperation among scientists and academics in Germany and their colleagues abroad. It plac-es special emphasis on scientific collaboration within the European Research Area.The DFG funds knowledge-oriented research, and it welcomes and supports the cooperation of science with those who apply science in all areas of social life. This includes the interaction of scientific findings with the private sector and institutions such as museums, academies of music, hospitals, and in public-private partnerships.Science and research are by definition international. Thus, the DFG’s statutes include an obliga-tion to foster contacts between scientists and researchers in Germany and abroad. To advance internationalisation, the DFG has opened its funding programmes for international collaboration between researchers – an absolute necessity for Germany in its role as a pioneering and simul-taneously cosmopolitan centre of research and science.
For further details please visit: www.dfg.de

Berlin, October 11 – 13, 2017 · MDC.C – MAX DELBRÜCK COMMUNICATIONS CENTER 9
ACKNOWLEDGEMENT
The organizers wish to acknowledge the support provided by the German Research Foundation (Deutsche Forschungsgemeinschaft, DFG) Research Unit “Hemodynamic Mechanisms of Acute Kidney Injury“(FOR 1368).
About the DFG Research Unit 1368:The Research Unit consists of eight research groups with different methodological expertise and a long-standing history of collaborations. Acute kidney injury (AKI) comprises a family of syndromes characterised by a sudden decrease in glomerular filtration rate. A multitude of causes may lead to acute kidney injury, which are commonly classified according to their origin as intrarenal, pre- and postrenal. The damage leading to acute kidney injury spans from func-tional dysregulation without overt morphological features to tubular destruction. Considerable effort has been made to develop techniques to prevent acute kidney injury or to facilitate its resolution. Unfortunately, preventing the development of AKI in at-risk populations is difficult.By true collaborative and translational research with interactions between the eight groups we pursue the following goals: (1) to define the role of regional circulation, particularly the vasa afferentia and vasa efferentia, and the role of TRPV1 in the pathophysiology of acute kidney injury; (2) to elucidate the mechanisms of AKI-induced stimulation of Hypoxia inducible factor (HIF), cytochrome P450 (CYP) products and NF-B; (3) to establish a promising marker for acute kidney injury and its origin; (4) to define a new strategy to prevent or treat acute kidney injury caused by local ischemia.As a whole, this Research Unit aims at transferring new insights from the pathophysiology of acute kidney injury into prevention strategies to reduce morbidity and mortality.
For further details please visit: fg1368.charite.de

10 2nd International Scientific Symposium · FUNCTIONAL RENAL IMAGING
PROGRAM OVERVIEW
WEDNESDAY, OCTOBER 11, 2017
Foyer Axon 1 Dendrit 2/3
09:30 Registration
10:30 Opening
10:55 Renal Physiology
12:15 Light lunch
13:00 Renal Diseases & Pathophysiology – Part I
14:40 Renal MR Imaging Methods
16:00 Coffee break
16:30 (Minimally) Invasive Quantitative Measurements
18:30 Management committee meeting of the COST action PARENCHIMA
THURSDAY, OCTOBER 12, 2017
Foyer Axon 1
08:30 Registration
09:00 Insights Into Dynamic Contrast-Enhanced MRI
09:40 Insights Into Arterial Spin Labelling MRI
10:20 Coffee break
11:00 Renal Diseases & Pathophysiology – Part II
12:40 Lunch break
14:10 Insights Into Oxygenation MR Imaging
14:50 Renal Power 1 – Clinical Research
15:35 Renal Power 2 – Experimental Research
16:00 Poster session & Coffee break
16:50 Insights Into Diffusion MR Imaging
18:00 Bus Shuttle to Social Event from MDC.C to Museum für Naturkunde
19:00 Social Event – Museum für Naturkunde
PROGRAM OVERVIEW
Berlin, October 11 – 13, 2017 · MDC.C – MAX DELBRÜCK COMMUNICATIONS CENTER 11
PROGRAM OVERVIEW
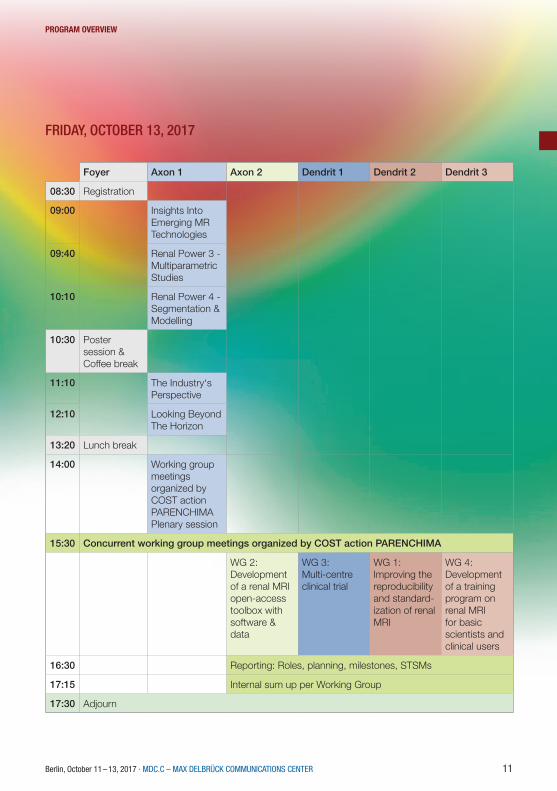
FRIDAY, OCTOBER 13, 2017
Foyer Axon 1 Axon 2 Dendrit 1 Dendrit 2 Dendrit 3
08:30 Registration
09:00 Insights Into Emerging MR Technologies
09:40 Renal Power 3 - Multiparametric Studies
10:10 Renal Power 4 - Segmentation & Modelling
10:30 Poster session & Coffee break
11:10 The Industry‘s Perspective
12:10 Looking Beyond The Horizon
13:20 Lunch break
14:00 Working group meetings organized by COST action PARENCHIMAPlenary session
15:30 Concurrent working group meetings organized by COST action PARENCHIMA
WG 2: Development of a renal MRI open-access toolbox with software & data
WG 3: Multi-centre clinical trial
WG 1:Improving the reproducibility and standard-ization of renal MRI
WG 4: Development of a training program on renal MRI for basic scientists and clinical users
16:30 Reporting: Roles, planning, milestones, STSMs
17:15 Internal sum up per Working Group
17:30 Adjourn

12 2nd International Scientific Symposium · FUNCTIONAL RENAL IMAGING
DAy 1 – WEDNESDAy, 11 OCTObER 2017
DAY 1 – WEDNESDAY, 11 OCTOBER 2017
Introduction 10:30 Welcome & objectives of meeting Organizers10:40 The PARENCHIMA initiative: Aims and roadmap Steven Sourbron, University of Leeds, UK Renal physiology
Chairs: Andrea Fekete, Semmelweis University and Hungarian Academy of Sciences, Budapest, Hungary Clive May, University of Melbourne, Australia
10:55 Renal physiology: Urine formation and salt-water balance Pontus Persson, Charité, Berlin, Germany11:15 Renal physiology: Renal oxygenation Hans Joachim Schurek, Hannover Medical School, Germany 11:35 Renal physiology: Regulation of intrarenal oxygenation Roger Evans, Monash University, Melbourne, Australia 11:55 Renal physiology: Regulation of renal perfusion Erdmann Seeliger, Charité, Berlin, Germany 12:15 Light lunch Renal diseases & pathophysiology – Part I
Chairs: Lilach Lerman, Mayo Clinic, Rochester, USA Kai-Uwe Eckardt, Charité, Berlin, Germany
13:00 Nephrological perspectives: Acute kidney injury Nicholas Selby, University of Nottingham, UK13:20 Nephrological perspectives: Diabetic nephropathy Loreto Gesualdo, University of Bari, Italy13:40 Nephrological perspectives: Chronic kidney disease Alberto Ortiz, Autonomous University of Madrid, Spain14:00 The link between cardiac and renal diseases Ags Odudu, University of Manchester, UK

DAy 1 – WEDNESDAy, 11 OCTObER 2017
Berlin, October 11 – 13, 2017 · MDC.C – MAX DELBRÜCK COMMUNICATIONS CENTER 13
14:20 Modelling renal pathophysiology: Promises and challenges of animal models Andrea Fekete, Semmelweis University and Hungarian Academy of Sciences, Budapest, Hungary Renal MR imaging methods
Chairs: Charlotte Buchanan, University of Nottingham, UK Pottumarthi Vara Prasad, NorthShore University HealthSystem, Evanston, USA
14:40 Fibrosis and microstructure: T1 relaxation, apparent diffusion, diffusion tensor imaging Neil Peter Jerome, Norwegian University of Science and Technology, Trondheim, Norway15:00 Oxygenation and blood volume: T2/T2* relaxation, BOLD, iron oxide enhancement Andreas Pohlmann, Max Delbrück Center for Molecular Medicine, Berlin, Germany15:20 Perfusion and filtration: Arterial spin labeling, dynamic contrast enhancement Fabio Nery, UCL Great Ormond Street Institute of Child Health, London, UK15:40 Molecular imaging: Hyperpolarisation, magnetisation transfer, CEST Christoffer Laustsen, Aarhus University, Denmark 16:00 Coffee break
(Minimally) invasive quantitative measurements
Chairs: Hans Joachim Schurek, Hannover Medical School, Germany Thomas Gladytz, German Metrology Institute, Berlin, Germany
16:30 The physiologists tool kit: Quantitative invasive probes Kathleen Cantow, Charité, Berlin, Germany16:50 Renal optical methods: Near infrared spectroscopy Dirk Grosenick, German Metrology Institute, Berlin, Germany17:10 Renal optical methods: Hyperspectral imaging Wenke Markgraf, Dresden University of Technology, Germany17:30 Renal optical methods: Phosphorimetric pO2 measurement Philippe Guerci, University of Amsterdam, The Netherlands17:50 Renal optical methods: Optoacoustic renal imaging Tim Devling, iThera Medical GmbH, Munich, Germany 18:30 Management committee meeting of the COST action PARENCHIMA Chair: Steven Sourbron, University of Leeds, UK

14 2nd International Scientific Symposium · FUNCTIONAL RENAL IMAGING
DAy 2 – THuRSDAy, 12 OCTObER 2017
DAY 2 – THURSDAY, 12 OCTOBER 2017 Insights into dynamic contrast-enhanced MRI
Chairs: Susmita Basak, University of Leeds, UK Gregory Ramniceanu, Chimie ParisTech, Unité de Technologies Chimiques et Biologiques pour la Santé, France
9:00 What DCE MRI can(not) tell us about renal pathophysiology Arvid Lundervold, University of Bergen, Norway9:20 Current challenges for using renal DCE MRI in the clinic Nicolas Grenier, University of Bordeaux, France Insights into arterial spin labelling MRI
Chairs: Fabio Nery, UCL Great Ormond Street Institute of Child Health, London, UK Frank Zöllner, Heidelberg University, Germany
9:40 What ASL MRI can(not) tell us about renal pathophysiology Charlotte Buchanan, University of Nottingham, UK10:00 Current challenges for using renal ASL MRI in the clinic María Fernández Seara, Universidad de Navarra, Pamplona, Spain 10:20 Coffee break
Renal diseases & pathophysiology – Part II
Chairs: Roger Evans, Monash University, Melbourne, Australia Anna Caroli, IRCCS – Istituto di Ricerche Farmacologiche Mario Negri, Ranica – Bergamo, Italy
11:00 A pharmaceutical industry’s perspective on how renal imaging can enrich clinical trials Frank Czerwiec, Otsuka Pharmaceutical Development & Commercialization Inc., Washington D.C., USA11:20 What does the nephrologist expect from functional renal imaging Kai-Uwe Eckardt, Charité, Berlin, Germany11:40 What does the pathophysiologist expect from functional renal imaging Clive May, University of Melbourne, Australia

DAy 2 – THuRSDAy, 12 OCTObER 2017
Berlin, October 11 – 13, 2017 · MDC.C – MAX DELBRÜCK COMMUNICATIONS CENTER 15
12:00 What does the radiologist expect from functional renal imaging Iosif Mendichovszky, Cambridge University Hospitals, UK12:20 What does an expert radiographer expect from renal imaging Eli Eikefjord, University of Bergen, Norway 12:40 Lunch break Insights into oxygenation MR imaging
Chairs: María Fernández Seara, Universidad de Navarra, Pamplona, Spain Thoralf Niendorf, Max Delbrück Center for Molecular Medicine, Berlin, Germany
14:10 What oxygen sensitive MRI can(not) tell us about renal pathophysiology Pottumarthi Vara Prasad, NorthShore University HealthSystem, Evanston, USA14:30 Current challenges for using renal BOLD MRI in the clinic Lilach Lerman, Mayo Clinic, Rochester, USA
Renal Power 1 – Clinical Research(13 power pitches of 3 min each)
Chair: Ags Odudu, University of Manchester, UK
14:50 Acute pyelonephritis in children: Diagnostics and comparison of two methods – static renal scintigraphy and MR imaging
Alice Bosáková, University Hospital Ostrava-Poruba, Czech Republic
Role of image and clinical-based biomarkers in renal transplant assessmentMohamed Abou El-Ghar, Urology & Nephrology Center, Mansoura University, Egypt
The effect of enhancing spatial resolution in non-contrast enhanced renal MR angiographyAnne Dorte Blankholm, Aarhus University Hospital, Denmark
Reference method for measurement of total renal function – estimated versus measured GFRMartin Šámal, First Faculty of Medicine, Charles University & General University Hos-pital, Prague, Czech Republic
The cortico-medullary ADC difference reduces inter-system variability in renal diffusion-weighted imagingIris Friedli, Geneva University Hospitals, University of Geneva, Faculty of Medicine, Switzerland

16 2nd International Scientific Symposium · FUNCTIONAL RENAL IMAGING
DAy 2 – THuRSDAy, 12 OCTObER 2017
Feasibility study of diffusion tensor imaging of the kidneys in freely breathing infants with pyelonephritisYvonne Simrén, Institute of Clinical Sciences at Sahlgrenska Academy, University of Gothenburg, Sweden
Validation of single-kidney glomerular filtration rate measurement with dynamic contrast-enhanced MRISusmita Basak, Division of Biomedical Imaging, LICAMM, University of Leeds, UK
Repeatibility of renal BOLD MRIAnneloes de Boer, University Medical Center Utrecht, The Netherlands
Feasibility of renal ASL in a pediatric cohort with impaired renal functionFabio Nery, UCL Great Ormond Street Institute of Child Health, London, UK
Kidney fibrosis assessment: T1rho and DCE permeability studyDmitry Kupriyanov, Philips Healthcare, Moscow, Russia
A pilot, multi-vendor comparison of multi-echo gradient-echo acquisitions for BOLD imaging in the kidneyPim Pullens, University Hospital Brussels, Belgium
Diffusion weighted MR imaging to investigate response to therapy: A case reportAnna Caroli, IRCCS – Istituto di Ricerche Farmacologiche Mario Negri, Bergamo, Italy
Variability reduction in renal diffusion-weighted MR imaging with motion com-pensationIris Friedli, Geneva University Hospitals, University of Geneva, Switzerland
Renal Power 2 – Experimental Research(7 power pitches of 3 min each)
Chair: Ags Odudu, University of Manchester, UK
15:35 The renal effect of anesthesia on the functional and metabolic phenotype in ratsHaiyun Qi, MR Research Centre, Department of Clinical Medicine, Aarhus University, Denmark
Simultaneous assessment of kidney perfusion and pH in an acute kidney injury murine model exploiting a dynamic CEST-MRI approachDario Longo, National Research Council of Italy, Rome, Italy
Assessment of metabolism in early renal ischemia/reperfusion injury using hy-perpolarized 13C-pyruvatePer Mose Nielsen, Department of Clinical Medicine – Biomedical Radio Isotope Tech-niques, Aarhus, Denmark

DAy 2 – THuRSDAy, 12 OCTObER 2017
Berlin, October 11 – 13, 2017 · MDC.C – MAX DELBRÜCK COMMUNICATIONS CENTER 17
Measuring renal oxygenation in a mouse model of volume-dependent hyperten-sion using BOLD MRIDexter Lee, Howard University, Washington D.C., USA
Quadrature birdcage RF coil for renal sodium (23Na) imaging in rodents at 9.4 T: Initial resultsLaura Böhmert, Max Delbrück Center for Molecular Medicine, Berlin, Germany
Noninvasive evaluation of renal pH homeostasis after ischemia reperfusion injury by CEST-MRI pH mappingDario Longo, National Research Council of Italy, Rome, Italy
Diffusion-weighted split-echo RARE imaging free of geometric distortion for renal MRI at ultrahigh fieldsJoao Periquito, Max Delbrück Center for Molecular Medicine, Berlin, Germany
16:00 Poster session & Coffee break
Insights into diffusion MR imaging
Chairs: Neil Peter Jerome, Norwegian University of Science and Technology, Trondheim, Norway João dos Santos Periquito, Max Delbrück Center for Molecular Medicine, Berlin, Germany
16:50 What diffusion MRI can(not) tell us about renal pathophysiology Jean-Paul Vallee, University of Geneva, Switzerland17:10 Current challenges for using renal diffusion MRI in the clinic Alexandra Ljimani, University of Düsseldorf, Germany 18:00 Busses are leaving from the venue
19:00 Social event

18 2nd International Scientific Symposium · FUNCTIONAL RENAL IMAGING
DAy 3 – FRIDAy, 13 OCTObER 2017
DAY 3 – FRIDAY, 13 OCTOBER 2017 Insights into emerging MR technologies
Chairs: Till Huelnhagen, Max Delbrück Center for Molecular Medicine, Berlin, Germany Laura Böhmert, Max Delbrück Center for Molecular Medicine, Berlin, Germany
9:00 Susceptibility MR: Better and bolder than BOLD Chunlei Liu, Duke University Medical Center, Durham, USA9:20 Sodium MR is worth its salt! Stefan Zbyn, University of Oulu, Finland
Renal Power 3 – Multiparametric Studies(9 power pitches of 3 min each)
Chair: Dario Longo, National Research Council of Italy, Rome, Italy
9:40 Assessment of renal stiffness in IgA nephropathy using multifrequency MRE compared to DWI and BOLD
Stephan Marticorena Garcia, Charité – Universitätsmedizin Berlin, Germany
Multiparametric kidney MR imaging to identify novel markers of disease pro-gression in autosomal dominant polycystic kidney diseaseAlbert Ong, University of Sheffield, UK
Molecular DCE MRI with high and low temporal resolution, using bimodal AGulX contrast agents and multiparametric MRI in a murine UUO modelGregory Ramniceanu, Chimie ParisTech, Unité de Technologies Chimiques et Bi-ologiques pour la Santé, France
Multiparametric MRI of renal transplant: Preliminary comparison of advanced MRI parameters in patients with functional and fibrotic renal allograftsOctavia Bane, Icahn School of Medicine at Mount Sinai Hospital, New York, USA
MR imaging to assess the pathophysiology of acute kidney injuryHuda Mahmoud, University of Nottingham, UK
Hyperpolarized [13C,15N2]urea: A novel renal O2 saturation biomarker in acute kidney injury?Christian Mariager, Department of Clinical Medicine – Biomedical Radio Isotope Tech-niques, Aarhus, Denmark
Non invasive MRI of renal physiologyPer Eckerbom, Institute for Surgical Sciences, Uppsala University, Sweden
Multiparametric assessment of chronic kidney diseaseCharlotte Buchanan, University of Nottingham, UK
Berlin, October 11 – 13, 2017 · MDC.C – MAX DELBRÜCK COMMUNICATIONS CENTER 19
DAy 3 – FRIDAy, 13 OCTObER 2017
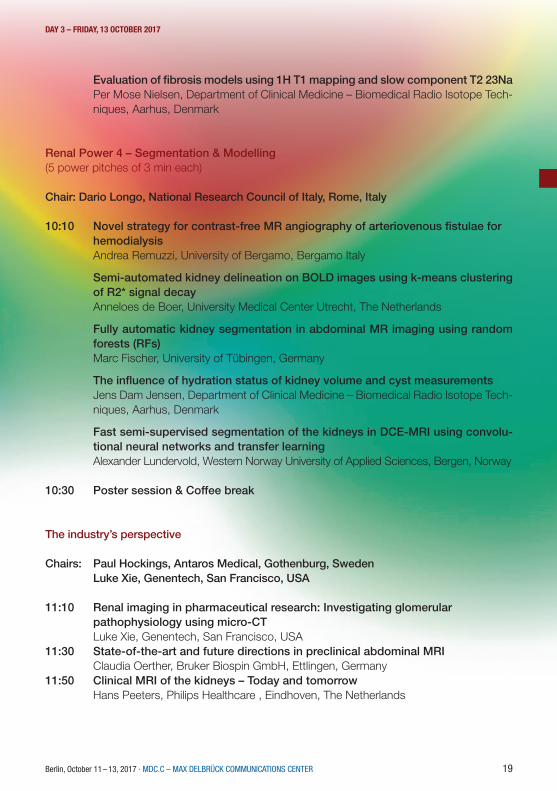
Evaluation of fibrosis models using 1H T1 mapping and slow component T2 23NaPer Mose Nielsen, Department of Clinical Medicine – Biomedical Radio Isotope Tech-niques, Aarhus, Denmark
Renal Power 4 – Segmentation & Modelling(5 power pitches of 3 min each)
Chair: Dario Longo, National Research Council of Italy, Rome, Italy
10:10 Novel strategy for contrast-free MR angiography of arteriovenous fistulae for hemodialysis
Andrea Remuzzi, University of Bergamo, Bergamo Italy
Semi-automated kidney delineation on BOLD images using k-means clustering of R2* signal decayAnneloes de Boer, University Medical Center Utrecht, The Netherlands
Fully automatic kidney segmentation in abdominal MR imaging using random forests (RFs)Marc Fischer, University of Tübingen, Germany
The influence of hydration status of kidney volume and cyst measurementsJens Dam Jensen, Department of Clinical Medicine – Biomedical Radio Isotope Tech-niques, Aarhus, Denmark
Fast semi-supervised segmentation of the kidneys in DCE-MRI using convolu-tional neural networks and transfer learningAlexander Lundervold, Western Norway University of Applied Sciences, Bergen, Norway
10:30 Poster session & Coffee break The industry’s perspective
Chairs: Paul Hockings, Antaros Medical, Gothenburg, Sweden Luke Xie, Genentech, San Francisco, USA
11:10 Renal imaging in pharmaceutical research: Investigating glomerular pathophysiology using micro-CT Luke Xie, Genentech, San Francisco, USA11:30 State-of-the-art and future directions in preclinical abdominal MRI Claudia Oerther, Bruker Biospin GmbH, Ettlingen, Germany11:50 Clinical MRI of the kidneys – Today and tomorrow Hans Peeters, Philips Healthcare , Eindhoven, The Netherlands

20 2nd International Scientific Symposium · FUNCTIONAL RENAL IMAGING
DAy 3 – FRIDAy, 13 OCTObER 2017
Looking beyond the horizon
Chairs: Marc Fischer, University of Tübingen, Germany Ludger Starke, Max Delbrück Center for Molecular Medicine, Berlin, Germany
12:10 Improving diagnostic accuracy and treatment of renal diseases with computational models Anna Caroli, IRCCS – Istituto di Ricerche Farmacologiche Mario Negri, Ranica – Bergamo, Italy12:30 Predictive analytics and machine learning for advancing renal diagnostics and therapies Kolja Bailly, Solandeo GmbH, Berlin, Germany12:50 Practical challenges of multi-center studies and clinical renal imaging trials Paul Hockings, Antaros Medical, Gothenburg, Sweden 13:10 Adjourn (symposium) Organizers 13:20 Lunch break
Working group meetings organized by COST action PARENCHIMAPlenary session
14:00 Introduction: Organization of the WG meeting Steven Sourbron – University of Leeds, UK14:05 Working Group 1 pitch: objectives, progress, task forces, questions Reproducibility and standardization Christoffer Laustsen – Aarhus University, Denmark14:20 Working Group 2 pitch: objectives, progress, task forces, questions Research and development toolbox (open-access toolbox with software & data) Frank G. Zöllner – Heidelberg University, Germany14:35 Working Group 3 pitch: objectives, progress, task forces, questions Multi-centre clinical trial Anna Caroli – IRCCS – Istituto di Ricerche Farmacologiche Mario Negri, Ranica – Bergamo, Italy14:50 Working Group 4 pitch: objectives, progress, task forces, questions Training programs Thoralf Niendorf – Max Delbrück Center for Molecular Medicine, Berlin, Germany15:05 Working Group 5 pitch: objectives, progress, task forces, questions Dissemination (incl. PARENCHIMA Action website, intl. meetings) Marcos Wolf – Center for Medical Physics and Biomedical Engineering, Vienna, Austria
15:20 Short break – move to WG spaces

Working group meetings organized by COST action PARENCHIMABreakout sessions 15:30 Working Group 1: Improving the reproducibility and standardization of renal MRI Lead: Christoffer Laustsen, Aarhus University, Denmark15:30 Working Group 2: Development of a renal MRI open-access toolbox with software & data Lead: Frank Zöllner, Heidelberg University, Germany15:30 Working Group 3: Multi-centre clinical trial Lead: Anna Caroli, IRCCS – Istituto di Ricerche Farmacologiche Mario Negri, Ranica – Bergamo, Italy15:30 Working Group 4: Development of a training program on renal MRI for basic scientists and clinical users Lead: Thoralf Niendorf, Max Delbrück Center for Molecular Medicine, Berlin, Germany
16:30 Reporting: Roles, planning, milestones, STSMs
17:15 Internal sum up per Working Group (task forces present their report; reports will be collated into a summary for newsletter/website)
17:30 Adjourn
DAy 3 – FRIDAy, 13 OCTObER 2017

22 2nd International Scientific Symposium · FUNCTIONAL RENAL IMAGING
Verbesserung der Datenvisualisierung
EINE PLATTFORM FÜR. VERSCHIEDENE ORGANE. VERSCHIEDENE HERSTELLER.
Sphere®
Für mehr informationen : www.olea-medical.com
**
*Jah
r de
r C
E-Ke
nnze
ichn
ung:
2015

Berlin, October 11 – 13, 2017 · MDC.C – MAX DELBRÜCK COMMUNICATIONS CENTER 23
SPEAKER ABSTRACTS(IN ORDER OF THE TALKS IN THE PROGRAM SCHEDULE)

24 2nd International Scientific Symposium · FUNCTIONAL RENAL IMAGING
SPEAKER AbSTRACTS
RENAL OXYGENATION. PECULIARITIES OF RENAL OXYGEN SUPPLY.
Hans-Joachim Schurek1
1Med. Hochschule Hannover
The old paradigm: “luxurious supply of the kidney by blood and oxygen” can be discarded. Compared to the heart which extracts 60% of the oxygen supplied, the whole kidney takes up only 8%, but inside the kidney, the outer medulla extracts up to 80% of the oxygen supplied and that means this is a hypoxic milieu. A blueprint thereof can be demonstrated by morphological defects which can be shown in the model of an isolated, cell-free perfused kidney (IPK) after perfusion fixation. The lesions occur in the interbundle area of the outer medulla and the base of the medul-lary rays and can be shown in the S3 part of the proximal tubule as well as the thick ascending limb of Henle´s loop (TAL). In this experimental model oxygen extraction amounts to 50% of the oxygen supplied and that is disastrous for the (interbundle area) outer medulla. Ad-dition of 5% erythrocytes prevents these defects. In vivo the tubulo-glomerular feedback (TGF) limits the workload for the TAL-segment and there-by for the proximal tubule in an oscillating fashion and adaptation. The TGF in the IPK does not function due to the extreme low filtration fraction (10% of in vivo values), which otherwise would function protectively (derived from AEG Perssons observa-tions).
The kidney´s challenge is the balancing act between oxygen deficiency, erythro-poietin reg-ulation and concentration capacity. For the concentration capacity shunt diffusion for solutes in the vascular bundles between descending and ascending vasa recta is essential to build up concentration gradients, for oxygen however, shunt diffusion reduces pO2 in the inner medulla to below 10mmHg. Early experimental data obtained by invading electrodes showed a broad spectrum of pO2 in the renal cortex between 5 to 70mmHg and the locus of erythropoietin pro-duction was localized to capillary-attached fibrocytes in the low pO2 areas of the cortex.
Now, what are the characteristics of oxygen supply of the renal cortex? One characteristic of the renal vascular architecture is that arteries run in parallel to veins from the hilum to the inter-lobular vessels. When we analyzed the pO2 in vivo at superficial glomeruli (as a landmark) in the Munic-Wistar rat strain, we found a mean of 46mmHg at 90mmHg in systemic arterial blood, so about half of the oxygen has been shunted to the venous side. Ventilation with pure oxygen increased pO2 to 600mmHg, but above glomeruli at the surface we found only 80mmHg in mean. This was coined a preglomerular shunt diffusion.

Berlin, October 11 – 13, 2017 · MDC.C – MAX DELBRÜCK COMMUNICATIONS CENTER 25
SPEAKER AbSTRACTS
In vivo studies under light halothane anesthesia in the laboratory of Paul Leyssac have detected oscillations in the hydrostatic pressure of the proximal tubule which are reflected in – phase shifted – oscillations in the sodium concentration in the early distal tubule (U. Gutsche) and as we found in the oxygen pressure in superficial glomeruli and tubules. These findings indicate that nephron efficiency oscillates as a function of its transport capacity. The critical factor here is the transport capacity of the TAL-segments, which depends on oxygen availability. When the TAL-segment is forced to shift from aerobic to anaerobic energy genera tion, this serves not so much as an emergen cy reserve but as a metabolic switch that triggers an oscillatory adjust-ment to the functional transport capacity of the nephron. The tubulo-glomerular feed back thus has a vital function in inhibiting necrosis not only in TAL-segments. In addition, it protects the proximal tubule (which has a weak capacity for glycolysis) against oxygen deficiency by reduc-ing and adjusting the single-nephron filtration rate.
Summary: The vascular architecture of the renal medulla is a prerequisite to concen-trate urine by shunt diffusion of solutes, a by-product is oxygen shunt diffusion and the risk of oxygen deficiency. The tubulo-glomerular feedback has a vital function to prevent oxygen deficiency by adaptation of the single nephron filtration rate to the available oxygen. Oxygen shunt diffusion is present in the renal cortex and therefore a good area to measure oxygen capacity and regulate erythropoietin secretion.

26 2nd International Scientific Symposium · FUNCTIONAL RENAL IMAGING
SPEAKER AbSTRACTS
REGULATION OF INTRARENAL OXYGENATION
Roger Evans1,*
1Monash University*Presenting author
Introduction: Tissue oxygenation in the kidney, as with any organ, is determined by the balance between oxygen delivery and metabolic oxygen consumption. But in the kidney, the determi-nants of oxygen delivery to tissue and cellular oxygen consumption are complex. Therefore, we propose an iterative approach to understanding the physiology and pathophysiology of kidney oxygenation that marries experimental and computational methods.
The renal circulations: The renal circulation is really multiple parallel circulations. All renal blood flow passes through the glomeruli of the renal cortex. However, the circulation of the renal me-dulla (the vasa recta) arises from the efferent arterioles of a relatively small population (~10%) of glomeruli in the innermost cortex. Thus, the medullary circulation can be considered in parallel with the vast bulk of cortical blood flow. Within the medulla, the inner medulla is perfused by the long vasa recta at the core of vascular bundles while the oxygen supply for the outer medulla mainly comes from a plexus of capillaries that arise from the periphery of the vascular bundles. Thus, we can also consider the inner and outer medulla as two circulations in parallel. Thus, to understand oxygen delivery to renal tissue we must understand how the distribution of blood flow among these renal circulations is governed.
Oxygen diffusion in the cortical circulation: In the renal cortex, arteries and veins are in a counter-current arrangement. Some veins partially wrap the walls of arteries, providing a path-way for diffusive shunting of oxygen. Simulations using computational models indicate that the quantity of oxygen shunted from arteries to veins is small under normal conditions (~1% of total renal oxygen delivery (DO2)) but increases in significance during renal ischemia, so renders the kidney susceptible to hypoxia. The latest models indicate that, under normal physiological conditions, oxygen is delivered to cortical tissue by arteries (~8% of DO2), glomeruli (~13%) and peritubular capillaries (~75%). They also indicate that tissue oxygenation is critically dependent on the density of peritubular capillaries, providing a mechanistic link between capillary rarefac-tion and cortical hypoxia in chronic kidney disease.
Oxygen diffusion in the medullary circulation: Multiple factors render the medulla suscepti-

Berlin, October 11 – 13, 2017 · MDC.C – MAX DELBRÜCK COMMUNICATIONS CENTER 27
SPEAKER AbSTRACTS
ble to hypoxia. Blood flow in the outer and inner medulla, expressed per gram of tissue, is much lower than in the cortex. Furthermore, counter-current diffusive shunting of oxygen, between descending and ascending vasa recta, acts to reduce oxygen delivery to the inner medulla. In the outer medulla, thick ascending limbs of the loop of Henle are situated at some distance from descending vasa recta, thus limiting their oxygen supply.
Regulation of renal vascular resistance: The ability of the kidney to mount a hyperemic re-sponse to tissue hypoxia is remarkably poor. This makes adaptive sense because hyperemia in response to hyperoxia would be expected to (i) increase glomerular filtration rate, and thus oxygen consumption required to drive sodium reabsorption, and (ii) interfere with the kidneys role as a ‘critmeter’. Nevertheless, the absence of a hyperemic response adds to the kidney’s susceptibility to hypoxia.

28 2nd International Scientific Symposium · FUNCTIONAL RENAL IMAGING
SPEAKER AbSTRACTS
WHAT DOES THE PATHOPHYSIOLOGIST EXPECT FROM FUNCTIONAL RENAL IMAGING
Clive May1,*
1Florey Institute of Neuroscience, University of Melbourne, Victoria, Australia.*Presenting author
Acute kidney injury is the most common cause of organ dysfunction in critically ill adults and is a serious complication following cardiac surgery. It is independently associated with increased mortality, with prolonged time in intensive care and increased cost. The leading cause of acute kidney injury is sepsis, with up to 50% of septic patients developing this condition, resulting in increased morbidity and mortality. Since there is evidence for altered micro-vascular flow in sepsis, we have examined whether there are changes in tissue perfusion and oxygenation in the renal cortex and medulla in an ovine model of hyperdynamic, hypotensive sepsis with septic AKI that has a similar phenotype to human sepsis. We have developed methodology to implant fibre-optic probes (Oxford Optronix, Oxford, UK) into the renal cortex and medulla to enable chronic measurement of cortical and medullary tissue perfusion by laser-Doppler flux and PO2 by fluorescence lifetime oximetry. Using this technique we have demonstrated that medullary perfusion and PO2 decrease early in sepsis before renal function decreases, suggesting this reduced perfusion and subsequent hypoxia may contribute to the development of septic AKI.To image changes in micro-vascular perfusion in the whole kidney, we have used superb mi-cro-vascular ultrasound imaging (Aplio 500, Toshiba) in conscious healthy and septic sheep and in anaesthetised sheep on cardiopulmonary bypass. We have compared the changes in cortical blood flow measured by micro-vascular imaging with the changes in perfusion measured by laser-Doppler flux in these different pathologies. Recent studies in which intra-renal perfusion was measured using these two techniques during sepsis and cardiopulmonary bypass, and the effects of vasopressor treatment, will be presented. Our experience is that micro-vascular imaging gives a good estimate of renal cortical perfusion in different pathologies, the technique is straightforward to master and the equipment is portable. Superb micro-vascular ultrasound imaging may therefore be a clinically useful method to image renal perfusion in situations where patients cannot be moved for MR imaging.

Berlin, October 11 – 13, 2017 · MDC.C – MAX DELBRÜCK COMMUNICATIONS CENTER 29
SPEAKER AbSTRACTS
GLOMERULI IMAGING FOR INVESTIGATING RENAL PATHOPHYSIOLOGY USING MICRO-CT
Luke Xie1,*
1Genentech, Inc*Presenting author
The number of glomeruli, and therefore nephrons, is an important risk factor for the patho-genesis of chronic kidney disease and hypertension (1,2). Several techniques exist to quantify glomeruli including acid maceration, dissector/fractionator stereology, MRI, and micro-CT (3-5). While each method has its unique strengths and weaknesses, MRI and micro-CT are non-de-structive and able to provide spatial distribution information. Micro-CT, using a vascular filling contrast agent, offers higher glomerular image contrast, faster scan times, and finer image res-olution. In this work, we present a micro-CT imaging method to characterize glomerular injury in preclinical models. We evaluate glomerular endowment and spatial density at each glomerulus and in individual cortical layers: superficial, midcortical, and juxtamedullary zones. Moreover, we demonstrate the relationship of these glomeruli metrics with renal physiology and show the response of specific glomeruli to renal injury.
Glomerular endowment can change due to a variety of different factors. In glomerular disease, the number of nuclei per glomerulus decreases, glomerular scarring increases, tufts collapse, and mesangium expands. These factors can decrease the number of functional glomeruli and prevent the perfusion of solutes such as CT contrast agents. In an example disease model, Adriamycin nephropathy, we found that glomerular number decreased significantly, and glo-merular volume distribution showed significantly higher heterogeneity compared to the control cohort (Fig. 1). The decrease in the number of glomeruli here suggests the decline of renal function caused by Adriamycin. Glomerular size can increase in cases of diabetic nephropathy, but can also decrease at late stages of Adriamycin nephropathy (6). Similarly in our advanced Adriamycin nephropathy model, there was a significant decrease in glomerular volume in the right kidney.
Glomeruli have diverse functional capacities depending on the location in the cortex, such as the superficial, midcortical, or juxtamedullary layers. For instance, juxtamedullary glomeruli are larger, have greater filtration rates, and respond differently to disease (7). Likewise, we found that glomerular volume, volume heterogeneity, and density heterogeneity were greater in the juxtamedullary layer compared to other layers. The treatment of Adriamycin increased the glo-merular volume heterogeneity only in the superficial and midcortical layers, suggesting that specific glomeruli can be resistant to the effects of Adriamycin.
In conclusion, glomerular endowment and spatial distribution are important features for evalu-ating renal pathophysiology and imaging methods provide a tool for investigating diverse inter-ventions and therapeutic drugs.

30 2nd International Scientific Symposium · FUNCTIONAL RENAL IMAGING
SPEAKER AbSTRACTS
References1. Brenner BM, et al. Glomeruli and blood pressure. Less of one, more the other?
Am J Hypertens 1988;1(4 Pt 1):335-347.2. McNamara BJ, et al. Associations between age, body size and nephron number with
individual glomerular volumes in urban West African males. Nephrology, dialysis, transplantation 2009;24(5):1500-1506.
3. Beeman SC, et al. Measuring glomerular number and size in perfused kidneys using MRI. American journal of physiology Renal physiology 2011;300(6):F1454-1457.
4. Bertram JF. Estimating glomerular number: why we do it and how. Clin Exp Pharmacol Physiol 2013;40(11):785-788.
5. Garcia-Sanz A, et al. Three-dimensional microcomputed tomography of renal vasculature in rats. Hypertension 1998;31(1 Pt 2):440-444.
6. Wang Y, et al. Progressive adriamycin nephropathy in mice: sequence of histologic and immunohistochemical events. Kidney international 2000;58(4):1797-1804.
7. Skov K, et al. Large juxtamedullary glomeruli and afferent arterioles in healthy primates. Kidney international 1999;55(4):1462-1469.
Fig. 1. Representative images and example plots of left and right kidneys from the control cohort and the Adriamycin treated cohort. Images show maximum intensity projections from 40 micro-CT slices. Glomerular volume heterogeneity is measured by coefficient of variation (CV). Statistical tests are performed between control and Adriamycin cohorts for each left kidney and right kidney (* p<0.05, ** p<0.01). Statistical tests are performed between left and right kidneys for each cohort (# p<0.05, ## p<0.01). Error bars: μ ± σ/√n.

Berlin, October 11 – 13, 2017 · MDC.C – MAX DELBRÜCK COMMUNICATIONS CENTER 31
SPEAKER AbSTRACTS
STATE-OF-THE-ART AND FUTURE DIRECTIONS IN PRECLINICAL ABDOMINAL MRI
Claudia Oerther1,*
1Bruker BioSpin MRI GmbH*Presenting author
IntroductionBecause of superior soft-tissue contrast compared to other imaging techniques, non-invasive abdominal magnetic resonance imaging (MRI) is ideal for monitoring organ regeneration, tissue repair, cancer stage, and treatment effects in a wide variety of experimental animal models. Currently, sophisticated MR protocols, including technically demanding procedures for motion artefact compensation, achieve an MRI resolution limit of <50μm under ideal conditions.
Motion artefactsIf no precautions are taken, artifacts due to peristaltic and breathing movements as well as from the gas within the intestines can easily affect the image quality.
Potential strategies for the compensation of motion artefacts.Typically a balloon sensor is used to monitor respiration and to do respiratory gating. Ecg elec-trodes are used to monitor the cardiac movement and synchronize the MRI acquisition with the ecg signal. Heavily diseased animals can have either week or very unstable physiological signals that makes it often difficult to use conventional triggering. IntraGate is Bruker’s unique self-gat-ed cardiac MRI technique, delivering unsurpassed high quality CINE cardiac and artifact –free abdominal imaging without any external triggering hardware. The acquisition of the IntraGate navigator echo is part of the MRI acquisition scheme. The IntraGate navigator echo records physiological motion. Cardiac and respiratory traces can be separated from the navigator signal individually. Using this information, acquired data are rearranged according to their correspond-ing cardiac and/or respiratory phases.
ResultsThis self-gated techniques provides synchronous multi-slice cardiac cines. Even the temporal resolution of a CINE movie or an dynamic data set can be changed without reacquiring the data.In additional the total scan time to acquire a cardiac cine or abdominal images is predictable.This technique is still applicable when conventional triggering fails in preclinical imaging, e.g. heavily diseased animals, heterotopic implanted heart, chick in egg, zebrafish,…
OutlookCombining now different modality as simultaneous devices the MRI navigator information can be used to derive the required retrospective PET data ordering scheme or improving the reso-lution in PET imaging.

32 2nd International Scientific Symposium · FUNCTIONAL RENAL IMAGING
SPEAKER AbSTRACTS
MOLECULAR IMAGING: HYPERPOLARIZATION, MAGNETIZATION TRANSFER, CEST
Christoffer Laustsen1,*
1Aarhus University*Presenting author
Nuclear Magnetic Resonance (NMR) is among the most frequently used methods for metabolic analysis due to its non-destructive nature and ease of use, combined with a high specificity en-abling accurate quantitative analysis. Magnetic Resonance Imaging (MRI), relying on the same principles, has so far not translated this potential into frequent clinical use, mainly due to the inherently low signal to noise ratio (SNR) of magnetic resonance. Two novel methods overcome this limitation: Hyperpolarized MR (more than 20.000 times enhancements of injectable meta-bolic biomarkers in vivo) and Chemical exchange saturation transfer (CEST) MRI. This talk will introduce the two methods and show how these can potentially be used to investigate renal physiology and pathophysiology.

Berlin, October 11 – 13, 2017 · MDC.C – MAX DELBRÜCK COMMUNICATIONS CENTER 33
POSTER ABSTRACTS(IN ALPHABETICAL ORDER OF FIRST AUTHOR)

34 2nd International Scientific Symposium · FUNCTIONAL RENAL IMAGING
POSTER AbSTRACTS
P 01Multiparametric MRI of renal transplant: preliminary comparison of advanced MRI pa-rameters in patients with functional and fibrotic renal allografts
Octavia Bane1,* , Stefanie Hectors1, Sonja Gordic1, Paul Kennedy1, Mathilde Wagner1, Madav Menon1, Fadi Salem1, Sara Lewis1, and Bachir Taouli1
1Icahn School of Medicine at Mount Sinai Hospital*Presenting author
PurposeThe long-term goal of our study is to validate multiparametric MRI (mpMRI) as a “virtual biopsy”, by developing an advanced quantitative MRI protocol in renal transplant patients. We report early results comparing mpMRI parameters of diffusion and hypoxia in functional vs. fibrotic renal allografts, as well as correlation to renal allograft fibrosis scores.
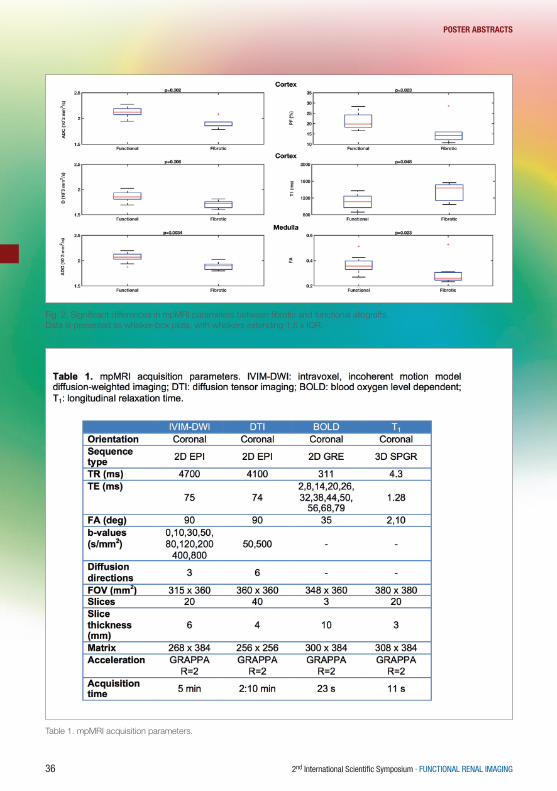
Materials and MethodsTwenty-one initial patients including 14 with stable, functional renal allografts (M/F, 8/6 mean age 55.2 y, estimated MDRD serum eGFR 47.6-87 ml/min/1.73m2) and 7 with stable renal allograft dysfunction and fibrosis confirmed by biopsy (M/F, 3/4, mean age 57.7y, eGFR 15.9- 59 ml/min/1.73 m2) were enrolled in this IRB-approved single center prospective study. All subjects gave signed informed consent. Percutaneous needle biopsy was performed 150 ± 48 days before MRI. All patients underwent mpMRI at 1.5T (Aera, Siemens) including intravoxel-incoherent motion DWI (IVIM-DWI), diffusion tractography imaging (DTI), blood oxygen level dependent (BOLD) and T1 mapping (Table 1). DTI fractional anisotropy (FA) maps were calculated from the eigenvalues of diffusion tensors. IVIM-DWI, T1 and BOLD signal curves, and DTI FA values, were measured from circular ROIs placed in the cortex and medulla at the upper, middle and lower renal allograft poles. IVIM-DWI parameters (true diffusion D, pseudodiffusion D*, perfusion fraction PF) were obtained by Bayesian fitting(1). Cortex and medulla MRI parameters were averaged across polar ROIs. Cortico-medullary differences in ADC (ΔADC) and T1 (ΔT1) were also calculated(2). MRI parameters were compared between functional and fibrotic allografts using the Mann-Whitney test. Spearman correlations were calculated between cortical MRI parameters and cortical biop-sy score for interstitial fibrosis/tubular atrophy (Banff ci, ct, IFTA=ci+ct (3)) and inflammation (i).
ResultsAmong patients with fibrotic allografts, the majority had moderate fibrosis (ci+ct=4: n=5/7 pa-tients, ci+ct=0: n=1, ci+ct=2: n=1), and no inflammation (i=0: n=4/7). FA and T1 were measured in all patients. IVIM and R2* measurements could not be obtained in 1/7 fibrotic allografts, and in 1/14 stable allografts, respectively, due to poor image quality. Qualitative assessment of advanced diffusion parametric maps (Fig. 1) shows decreased values in fibrotic vs. function-al allografts, which is confirmed by the quantitative polar ROI analysis (Fig. 2). Cortical ADC (p=0.002), PF (p=0.023) and true diffusion coefficient D (p=0.006) were significantly decreased in fibrotic vs. functional allografts. Medullary ADC (p=0.0034) and FA (p=0.023) were signifi-cantly decreased in fibrotic vs. functional allografts (Fig. 2), while PF (functional/fibrotic median

Berlin, October 11 – 13, 2017 · MDC.C – MAX DELBRÜCK COMMUNICATIONS CENTER 35
POSTER AbSTRACTS
(IQR): 22.5 (6.5)%/16(7.6)%, p=0.07) showed a decreasing trend. There was a trend of de-creasing ΔADC in fibrotic allografts (functional/fibrotic median (IQR): 0.0519 (0.105) x10-3 mm2/s /0.0074(0.057) x10-3 mm2/s, p=0.0635).T1 was significantly elevated in the cortex (p=0.048), and the absolute cortico-medullary differ-ence significantly decreased in fibrotic allografts (functional/fibrotic median (IQR): -448.3(173) ms/-106.3(227) ms, p= 0.0034). There were no significant differences in R2* between fibrotic and functional allografts (p=0.6-0.7). There were no significant correlations between MRI pa-rameters and pathology scores (p=0.09-0.99).
Discussion and conclusionsOur preliminary data shows the sensitivity of IVIM-DWI parameters to allograft fibrosis in renal transplant patients. Our study confirms earlier findings of decreasing cortico-medullary ΔADC with renal allograft fibrosis(2), and decreasing FA with allograft dysfunction(4) in renal transplant patients. The observed decrease in D and PF with fibrosis has not been shown in other human studies, but is in agreement with IVIM-DWI findings in a murine model of renal fibrosis(5). Pro-longed T1 with tissue fibrosis and inflammation also agrees with previous studies (2, 6). Due to the small number of patients with fibrosis, and the reduced range of pathology scores, we were unable to reproduce correlations between ΔADC and ΔT1 and pathology observed in a larger study (2). The value of mpMRI-derived metrics in combination for characterizing renal transplant fibrosis will be confirmed in a larger study.
References1. Jerome NP et al. JMRI. 20142. Friedli I et al. Scientific reports. 20163. Loupy A et al. AJT. 20174. Lanzman RS et al. Radiology. 20135. Boor P et al. JMRI. 20156. Hueper K et al. Eur Radiol. 2014
Fig.1. Advanced diffusion maps show overall lower values in a patient with moderate renal allograft fibrosis (G-L) compared to a patient with functional allograft (A-F).
36 2nd International Scientific Symposium · FUNCTIONAL RENAL IMAGING
POSTER AbSTRACTS
Table 1. mpMRI acquisition parameters.
Fig. 2. Significant differences in mpMRI parameters between fibrotic and functional allografts. Data is presented as whisker-box plots, with whiskers extending 1.5 x IQR.

Berlin, October 11 – 13, 2017 · MDC.C – MAX DELBRÜCK COMMUNICATIONS CENTER 37
POSTER AbSTRACTS
P 02Validation of single-kidney glomerular filtration rate measurement with dynamic con-trast-enhanced MRI
Susmita Basak1,* , Anita Banerji1, Constantina Chrysochou2, Aghogho Odudu2, David L Buckley1, Philip A Kalra2, and Steven Sourbron1
1Division of Biomedical Imaging, LICAMM, University of Leeds, Leeds, UK2Department of Renal Medicine, Salford Royal NHS Foundation Trust, Salford, UK*Presenting author
IntroductionDynamic contrast-enhanced MRI (DCE-MRI) has long been proposed as a more practical al-ternative to radioisotope methods for single-kidney glomerular filtration rate (SK-GFR) mea-surements [1]. Preliminary small-scale pilot studies [2-4] have demonstrated good agreement between MR-based values (MR-SK-GFR) and radio-isotope gold-standards (Iso-SK-GFR), but there is a lack of evidence from larger well-powered studies in a clinical population. The aim of this study is to compare MR-SK-GFR against Iso-SK-GFR in a cohort of 89 patient studies covering a wide range of renal function.
MethodsData were collected retrospectively from four separate studies (3 in patients with renal artery stenosis (RVD 1, 2, 3), 1 in diabetic nephropathy (Diab 1)) at Salford Royal Hospital. Three of those studies employed a 3.0 T MR system (Philips Medical Systems) using a phased-array body coil and a 3D spoiled gradient echo sequence with TR/TE=5/0.9 ms, FOV=400×400×400 mm, reconstruction matrix (RM) =128×128×20, FA=17°, SENSE factor=2, temporal resolution 2.1 s/volume, voxel volume =0.039 ml. The fourth study was performed at 1.0 T (Siemens), using a spine coil with (TR/TE=5.4/2.2 ms, FOV=80×306×350 mm, RM=32×112×128, vox-el volume=0.018 ml). Radioisotope measurements of SK-GFR were performed with standard nuclear medicine techniques [5]. The SK-GFR was derived from parenchymal intensity time curves fitted with a two-compartment filtration model using PMI 0.4 software [6, 7]. The whole kidney parenchymal ROIs were segmented by thresholding on area under the curve maps and by applying a connected component algorithm.
ResultsBland-Altman analysis (Fig 1a) showed a mean difference between MR-SK-GFR and Iso-SK-GFR of 0.55 ml/min with a 95% confidence interval of -29 and +30 ml/min. The corrections due to non-linearity in signal versus concentration relation in Diab 1 and RVD 2 (Fig 1b) make the slope of the linear fit to the Iso-SK-GFR vs. MR-SK-GFR plot close to 1 but the correlation remain poor (as shown by R2 values). Among the individual study groups, RVD 1 and RVD 2 show the best correlation (Fig 1c). The SK-GFRs and total GFRs (left+right kidney) show similar distributions as indicated by their mean and standard deviations (Fig 1c).

38 2nd International Scientific Symposium · FUNCTIONAL RENAL IMAGING
POSTER AbSTRACTS
Discussion and ConclusionThis larger study confirms previous results from smaller studies [2] that MR-SK-GFR is accu-rate, but insufficiently precise to be accepted as a replacement of the radioisotope method. This aligns with other recent study in healthy volunteers [4]. A possible source of error is the non-linearity in signal versus concentration estimates which has been taken into account in a smaller sub-group. The corrected data display an improvement in the accuracy but the change in precision is not significant. A further improvement in correction due to non-linearity involves incorporating measured T1-values. A second source of error is the motion effects in intra- and between frame artefacts, which have not been corrected in this study. Partial volume effects in the AIF do not play a major role as the aorta ROIs are chosen to be small. In future steps we will apply appropriate image registration techniques to correct for breathing motion, use measured T1-values to correct signal non-linearity, and evaluate the effect on MR-SK-GFR precision.
References[1] N Grenier et al., Semin Nucl Med 2008; 38:47-55.[2] SW Lim et al., Am J Physiol Renal Physiol 305: F672–F678, 2013.[3] VS Lee et al. Am J Physiol Renal Physiol 2007; 292, F1548-F1559.[4] E Eikefjord et al. Am J Roentgenol 2016; 207; 1022-1030.[5] M Rehling et al., Eur J Nucl Med 1985; 11:1–6.[6] S Sourbron et al., Magn Reson Mater Phy 2009; 22:539.[7] SP Sourbron et al., Invest Radiol 2008; 43:40–48.
AcknowledgementsStudy funded by Kidney Research UK grant nr. RP55/2012.

Berlin, October 11 – 13, 2017 · MDC.C – MAX DELBRÜCK COMMUNICATIONS CENTER 39
POSTER AbSTRACTS
P 03The effect of enhancing spatial resolution in non-contrast enhanced renal magnetic resonance angiography.
Anne Dorte Blankholm1, Bodil Ginnerup-Pedersen1, Gratien Andersen1, Brian Stausbøl-Grøn1, and Steffen Ringgaard2
1Aarhus University Hospital2Aarhus University
BackgroundIn an earlier study we evaluated a comprehensive magnetic resonance protocol, including non-contrast enhanced renal magnetic resonance angiography (NCMRA) and Computed To-mography Angiography (CTA), in 31 living renal donors. Results from nephrectomy were used as the reference standard. We concluded that an optimised MRI protocol could substitute CTA for preoperative assessment of the renal vessels before living donor nephrectomy (1). The results were perfect for assessment of more than one renal artery for both CTA and NCMRA. For early branching, CTA (Sensitivity 50%/Specificity 100%/ accuracy 90%/Kappa=0.62/p=1) performed superior to NCMRA (Sensitivity 33%/Specificity 100%/ accuracy 87%/Kappa=0.45/p=1). For supernumerary veins, NCMRA (Sensitivity 60%/Specificity 100%/ accuracy 93%/Kappa=0.72/p=1) was superior to CTA (Sensitivity 40%/Specificity 96%/ accuracy 87%/Kap-pa=0.43/p=1). During the project the scanner was upgraded from Philips Achieva to Achieva dStream enabling digitalisation in the coils and thereby achieving more signal. The MR protocol was kept constant for the study protocol.In the present work we compared CTA to NCMRA of the kidneys in potential kidney donors. Furthermore, the spatial resolution of the NCMRA was increased to approach that of CTA.
MethodsIn 51 potential living kidney donors (102 kidneys) we prospectively compared CTA and NCMRA using absolute measures, Kappa agreement and McNemar’s test. Besides, the spatial resolu-tion of the NCMRA was pushed towards that of the CTA in one volunteer and the results were visually inspected.
ResultsBased on an evaluation of agreement between CTA and MRI in 51 of potential living kidney donors, very good agreement was found for supernumerary arteries and for classification of the veins. For classification into aberrant and accessory arteries and for detecting supernumerary veins agreement was fair. When choosing CTA as the reference standard, a statistically significant difference was found only for classifying supernumerary arteries into aberrant arteries (Table 1).In this project the resolution of CTA was given by: FOV varied 250-400mm;matrix 350/512=0.68mm; reconstructed to 0.68/0.68/2mm and for NCMRA the parameters were: FOV varied; scan matrix 1.25/1.25-1.53/4mm; reconstructed matrix 0.63/0.63/2mm. As seen in figure 1 after the scanner upgrade, it was possible to push the through plane resolution even further than that of CT.

40 2nd International Scientific Symposium · FUNCTIONAL RENAL IMAGING
POSTER AbSTRACTS
Figure 1 show the results when increasing the spatial resolution. It is obvious that the enhanced resolution makes it easier to distinguish the two arteries to the right kidney. The scan time was still well below 5 min.
ConclusionEnhanced resolution could have a positive impact on depicting early branching and classifying the supernumerary arteries into accessory and aberrant arteries in NCMRA and this can be obtained within an acceptable scan time.
Reference1) Blankholm AD, Pedersen BG, Ostrat EO, Andersen G, Stausbol-Gron B, Laustsen S, et al. Noncontrast-Enhanced Magnetic Resonance Versus Computed Tomography Angiography in Pre-operative Evaluation of Potential Living Renal Donors. Acad Radiol 2015 Nov;22(11):1368-1375.
Table 1. CTA versus MRI. * indicate the reported numbers. The exact McNe-mar’s test was used when the number of positive results<5, marked by #
Figure 1. Shows the imaging results when increasing the spatial resolution and how this is helpful in depicting details. This can be achieved within an acceptable scan time.

Berlin, October 11 – 13, 2017 · MDC.C – MAX DELBRÜCK COMMUNICATIONS CENTER 41
POSTER AbSTRACTS
P 04Quadrature Birdcage RF Coil for Renal Sodium (23Na) Imaging in Rodents at 9.4 T: Initial Results
Laura Boehmert1,* , Helmar Waiczies2, Celal Oezerdem1, Daniel Wenz1, André Kuehne2, Andreas Pohlmann1, and Thoralf Niendorf3
1Berlin Ultrahigh Field Facility (B.U.F.F.), Max Delbrueck Center for Molecular Medicine2MRI.Tools GmbH, Berlin, Germany3Berlin Ultrahigh Field Facility (B.U.F.F.), Max Delbrueck Center for Molecular Medicine; MRI.Tools GmbH, Berlin, Germany*Presenting author
Introduction:Kidney diseases represent an important public health problem with increasing incidence. Around two million deaths from acute kidney injury (AKI) are reported worldwide every year [1, 2]. To address this, it is of great clinical relevance to develop non-invasive magnetic resonance (MR) techniques for diagnostic imaging and therapy guiding of AKI. Sodium (23Na) magnetic res-onance imaging (MRI) could contribute to these techniques. The renal corticomedullary sodium gradient is necessary for proper function of the kidney, thus changes of the gradient indicate a malfunction. To detect this gradient, we need a radio frequency (RF) coil which provides high sensitivity and a uniform transmit field. Therefore we designed a quadrature birdcage coil tai-lored for sodium imaging of small rodents at 9.4T. Here we present the RF coil design along with electromagnetic field simulations and preliminary images of a phantom.
Methods:The geometry of the proposed low pass (LP) birdcage coil was restricted by the size of average loading (small rat) and the size of the scanner bore. The coil was built of 16 rungs. The inner diameter was 62mm. Birdcage Builder [3] was used in order to estimate the initial values of distributed capacitors. Electromagnetic field simulations were carried out using CST Studio Suite 2016 (CST AG, Darmstadt, Germany) and included a rat-shaped 3D model (conductivity: σ=0.91S/m, relative permittivity: ε=65)(Fig. 1A) or a cylindrical phantom (σ=0.72S/m,ε=63).The casing for the proposed RF coil was designed using Autodesk Inventor. The bench mea-surements were performed on a saline phantom (V=200mL,[NaCl]=600mM, σ=0.72S/m,ε=63 using a network analyzer (Rohde & Schwarz, Memmingen, Germany). Each channel of the bird-cage coil was tuned to the resonant frequency of sodium at 9.4T (f0=105.8MHz) and matched to the impedance of 50 Ohm. Cable traps were used to eliminate common mode currents.Sodium MRI was conducted on a 9.4 Tesla animal MR system. For using the circularly-polarized mode of the coil an additional Tx/Rx switch and hybrid combiner was design and built.
Phantom image:On the same phantom we acquired SE images (TR:1000ms,TE:2.6ms,matrix:64x64,FO-V:(58x58)mm2,slice thickness:5mm) to compare the linear with the circularly-polarized mode. B1-mapping: For calculating the B1
+-field we acquired SE images with nominal excitation flip

42 2nd International Scientific Symposium · FUNCTIONAL RENAL IMAGING
POSTER AbSTRACTS
angles of 60 and 120 degrees and calculated the actual FA using the double-angle method [4]. In vivo: After 1H MRI the identically constructed 1H resonator was replaced without moving the rat by the quadrature driven 23Na birdcage and using a SE sequence (TR:70ms,TE:1.5ms,ma-trix:64x64,FOV:(77x77)mm2,slice thickness:5mm).
Results:The capacitances values derived from simulations (CSIM=27pF) match exactly the ones used in the experiment (CMEAS=27pF) (compare Fig. 2A with B). The reflection coefficients of both chan-nels (S11 and S22) were measured to be lower than -49dB and the transmission coefficient (S12) was lower than -20dB (Fig. 2B). The acquired phantom images in linearly- and circularly-polar-ized mode depicted in Figure 2C show an increase in SNR of around 40%.Figure 2D shows the simulated transmit field (B1
+) for the phantom and the measured B1+-field.
The B1+-magnitude of the simulated B1
+-field in the center of the phantom was 2.9μT/W1/2 and in the measured one 2.2μT/W1/2. The B1
+-profile over the cross-section of the cylindrical phantom ranged from 1.9–2.2μT/W1/2 for the measurement and 2.7–2.9μT/W1/2 for the simulation.The initial in vivo sodium image, without any optimization, shows the highest SNR within the kidney region (Fig. 2E).
Discussion and Conclusion:The proposed quadrature LP birdcage coil supports sodium MRI at 9.4T. Our bench measure-ments showed very good agreement with the results derived from the simulations. Both chan-nels of the birdcage coil were well decoupled. We acquired phantom images in linearly- and circularly-polarized mode and could see the expected increase in SNR. The power attenuation observed in the B1
+-map is in agreement with losses in the RF chain (amplifier, Tx/Rx switch, quadrature hybrid). After having achieved our first sodium images, we are now looking forward to optimize the sequences and to improve the image quality.

Berlin, October 11 – 13, 2017 · MDC.C – MAX DELBRÜCK COMMUNICATIONS CENTER 43
POSTER AbSTRACTS

44 2nd International Scientific Symposium · FUNCTIONAL RENAL IMAGING
POSTER AbSTRACTS
P 05Acute Pyelonephritis in Children: Diagnostics And Comparison of Two Methods – Static Renal Scintigraphy And Magnetic Resonance Imaging
Alice Bosáková1,* , Dana Šalounová2, Jaroslav Havelka1, Otakar Kraft1, Pavel Širůček1, and Michal Hladík1
1University Hospital Ostrava2VŠB-Technical University of Ostrava*Presenting author
The aim of the study:Static renal scintigraphy, using 99mTc DMSA radiopharmaceutical is regarded since decades as the gold standard for detection of inflammatory changes in the renal parenchyma in acute pyelonephritis. Diffusion weighted magnetic resonance imaging examination (DW-MRI) shows high sensitivity in the localization of inflammatory processes and changes in soft tissues. We tried to demonstrate these changes in children with acute pyelonephritis. The results of DW-MRI examination were subsequently compared with static renal scintigraphy-99mTc DMSA.
Methods:Thirty one children aged 3-18 years (30 girls), with acute pyelonephritis were examined. Both, static renal scintigraphy (using 99mTc DMSA) and magnetic resonance (DW-MRI) were performed to confirm inflammatory lesions in the kidneys of these patients. Both examinations were carried out in the first 5 days after the diagnosis. DW-MRI was performed without application of con-trast medium and without general anaesthesia.
Results:DW-MRI examination confirmed the inflammatory infiltration in kidney parenchyma in all 31 patients (100 %). On the other hand, the static renal scintigraphy with 99mTc DMSA confirmed inflammation only in 22 children (71%). %). Control examinations were performed in 31 patients after six months with both methods. Scarring was confirmed by DW-MRI in five and SRS in five patients each.
Conclusion:In conclusion, nuclear magnetic resonance (DW-MRI) imaging seems more sensitive, beneficial and accurate in the diagnostics of acute pyelonephritis when compared with 99mTc DMSA. Moreover, DW-MRI provides more accurate information on the extent of kidney damage.
Keywords:Acute pyelonephritis, 99mTc DMSA renal scintigraphyDiffusion-weighted magnetic resonance imaging ( DW-MRI),

Berlin, October 11 – 13, 2017 · MDC.C – MAX DELBRÜCK COMMUNICATIONS CENTER 45
POSTER AbSTRACTS
P 06Novel Strategy for Contrast-free Magnetic Resonance Angiography of Arteriovenous Fistulae for Hemodialysis
Michela Bozzetto1, Paolo Brambilla2, Anna Caroli1, Bogdan Ene-Iordache1, Sandro Sironi2, Giuseppe Remuzzi2, and Andrea Remuzzi3,*
1IRCCS-Istituto di Ricerche Farmacologiche Mario Negri, Bergamo2ASST-Papa Giovanni XXIII, Bergamo3University of Bergamo*Presenting author
BackgroundNative arteriovenous fistula (AVF) is the preferred vascular access (VA) for hemodialysis, but it still has high rate of failure due to vascular stenosis mainly caused by neointimal hyperplasia. A growing body of evidence supports the key role of hemodynamics in stenosis formation, there-fore longitudinal studies with repeated evaluations of local hemodynamic conditions and vas-cular structural changes over time are needed to investigate the relationship between disturbed flow and stenosis development. These studies require reliable and non-invasive investigations to obtain patient-specific 3D AVF models to perform computational fluid dynamics (CFD) simu-lations. To avoid the use of gadolinium, due to the risk of inducing nephrotoxic fibrosis in ESRD patients, novel protocols for contrast-free magnetic resonance angiography (MRA) should be designed. The purpose of our study was to explore the feasibility of a novel protocol for con-trast-free MRA to investigate the hemodynamics inside AVF, coupling this imaging technique with high-resolution CFD.
Materials and methodsWe acquired contrast-free MRA in a 78-year male with radio-cephalic side-to-end AVF. We performed 3D fast spin echo T1-weighted imaging with variable flip angles using CUBE T1 on 1.5T scanner (GE, Optima 450w GEM), with the following parameters: axial plane; 19ms echo time; 24ms echo-train length; 2mm slice thickness; 0.55x0.55x2.0mm voxel size. MRA acqui-sition was performed one week after AVF surgical creation and repeated five weeks later, after AVF maturation.AVF lumen with its limbs, the proximal artery (PA), distal artery (DA), juxta-anastomotic vein (JAV) and distal outflow vein (V), were digitally segmented using imageJ and patient-specific 3D sur-face was generated using the Vascular Modelling Toolkit (VMTK). The internal volume was then discretized using foamyHexMesh OpenFOAM mesher. We obtained meshes of 1’055’000 cells with dominant-hexahedral core cells, and we generated two thin boundary layers to capture the sharp gradients of velocity near the wall (Figure 1).Transient Navier-Stokes equations were solved using OpenFoam, an open-source CFD tool-box based on the finite volume method. Volumetric flow waveforms obtained from US exam-inations were prescribed as boundary conditions at the PA and at the DA while traction-free condition was set at the vein outflow. Vessel walls were assumed to be rigid and blood density equal to 1.05 g/cm3. Blood was modelled as patient-specific, non-Newtonian fluid using the

46 2nd International Scientific Symposium · FUNCTIONAL RENAL IMAGING
POSTER AbSTRACTS
Bird-Carreau rheological model. Three cardiac cycles were solved to avoid start-up transients and only the third cycle was saved for post-processing. We then characterized the AVF blood flow phenotype using velocity streamlines and localized normalized helicity (LNH), a descriptor of changes in the direction of the rotation of flow.
ResultsContrast-free CUBE T1 yielded high-resolution images within a reasonable scan time of 5-10 minutes. Images were suitable for segmentation of AVF lumen and reconstruction of pa-tient-specific 3D model, that was used for high-resolution CFD analysis. Velocity streamlines, representative of the peak-systolic time-point, showed secondary flows and complex vortices in the JAV of the 1-week AVF, and appeared rather evolving towards a more helicoidal flow in 6-week AVF model (Figure 2). This evidence seems to be confirmed by LNH isosurfaces classified by the blue and red colour representing clockwise and counter-clockwise rotation, respectively (Figure 3). The prevalence of blue colour seems to suggest an helical pattern with a predominant direction in 6-week AVF.

Berlin, October 11 – 13, 2017 · MDC.C – MAX DELBRÜCK COMMUNICATIONS CENTER 47
POSTER AbSTRACTS
ConclusionsThis novel contrast-free MRA protocol represents a feasible approach to obtain 3D AVF model that can be used for longitudinal investigations on the role of hemodynamics in AVF failure. The detailed study of blood flow field at the patient-specific level may help to elucidate the role of hemodynamics in vascular remodelling and stenosis formation, with the final aim of improving AVF clinical outcome, both in terms of complications immediately after surgery and in terms of long-term patency. This achievement, besides entailing a reduction in medical costs, may significantly improve the quality of life of patients.

48 2nd International Scientific Symposium · FUNCTIONAL RENAL IMAGING
POSTER AbSTRACTS
P 07Multiparametric Assessment of Chronic Kidney Disease
Charlotte Buchanan1,* , Huda Mahmoud2, Eleanor Cox1, Benjamin Prestwich1, Nick Selby2, Maarten Taal2, and Susan Francis1
1University of Nottingham2Royal Derby Hospital*Presenting author
CKD is a heterogeneous disease with structure varying widely across patients. Functional renal MRI studies have shown conflicting changes in oxygenation in CKD; some groups reporting a reduction and others reporting no differences.1 Renal cortex perfusion has been shown to be lower in CKD than in healthy subjects,2,3 and longitudinal (T1) relaxation times in both the cortex and medulla increased in CKD.4 Further, DWI has shown ADC to be reduced in CKD compared to healthy subjects5, with a recent study demonstrating correlated changes in kidney ADC and T1 which are associated with histological change.6 In this study, we apply multi-parametric MRI to assess haemodynamic and structural MRI measures in CKD patients and compare these to healthy subjects. We assess reproducibility of MRI measures and correlate MRI results with histological changes identified from biopsy.
Methods:All patients had CKD Stage 3/4 (eGFR range 23–51 ml/minute/1.73 m2) with a renal biopsy as part of routine clinical care; four patients had tubulointerstitial disease (TID), seven had isch-aemic nephropathy (Ischaemic) and fifteen had glomerulonephritis (Iga nephropathy).
Data Acquisition:26 CKD patients (20M/6F, 56±19 years, BMI 29±4 kg/m2) were scanned twice, two weeks apart to assess reproducibility. Data was also collected on 11 healthy volunteers (HV) (6M/1F). Scanning was performed on a 3T Philips Ingenia scanner (Multi-Transmit, d-Stream). Localiser bFFE scans were acquired in three orthogonal planes for volume measures. ASL, T1, and DWI maps were acquired using respiratory-triggered schemes in matched space (FOV 288x288mm, 3x3x5mm voxels, SENSE2) using a spin-echo EPI readout of 5 coronal-oblique slices. ASL used a FAIR acquisition (in-plane pre- and post-saturation, post-label delay 1800ms, Selective(S)/non-selective(NS) thickness 45/400mm, 25 pairs), inversion recovery T1 data were collected at 13 inversion times, and DWI data was acquired using 11 b-values. High spatial resolution T1 maps were also obtained using a bFFE readout (1.5x1.5mm voxels). T2* data was acquired with an mFFE scheme with 12 echo times (TE/DTE 5/12.5ms, 1x1x5mm voxels, FOV 288*288mm).
Data Analysis:Kidney volumes were computed from localiser images using Analyze9 software. All multi-para-metric maps were generated using in-house Matlab programs. Inversion recovery data was fit to form T1 maps. ASL perfusion maps were formed from the average perfusion-weighted images (S-NS) normalised to a base image and fit using the kinetic model to estimate renal

Berlin, October 11 – 13, 2017 · MDC.C – MAX DELBRÜCK COMMUNICATIONS CENTER 49
POSTER AbSTRACTS
perfusion. The mFFE data was fit to compute T2* maps. DWI data was fit to both an ADC model and an IVIM model to calculate ADC, D, D* and perfusion fraction. Cortex and medulla masks were created for each. All values reported are the mode of histogram analysis of these multi-parametric maps. To assess reproducibility, the coefficient of variance (CoV) of measures was computed between sessions.
Results:Figure 1 shows example multiparametric MRI maps. Figure 2 provides MRI parameters in the CKD and HV groups and their associated CoV. T1 significantly increased in CKD patients com-pared to HVs (P<0.001) and measures had a low CoV, the corticomedullary differentiation (DT1) was lower in CKD patients than the HV group (P<0.001). ADC and D reduced in CKD patients (P=0.01, 0.2 respectively), and cortex perfusion was lower in CKD patients than HVs (P=0.003). There was no significant difference in kidney volume (P=0.4) or T2* (P=0.9) between the groups despite low CoV in these measures. Cortical T1 showed a significant increase with increasing interstitial fibrosis (IF) score from biopsy, Figure 3.
Discussion:This multi-parametric study has demonstrated significant differences in perfusion, T1 and ADC values between CKD patients and HVs. Reproducibility was assessed in CKD patients and T1, T2*, volume and ADC measures were found to be highly reproducible, with a CoV<10%. MRI measures were found to significantly correlate with histological changes from biopsy.
References:1. Pruijm, PLoS ONE 2014; 9(4).2. Rossi, Invest Radiol, 2012; 47(8);490-6.3. Tan, Magn Reson Medl, 2014 71(2);570-9.4. Gillis, Nephron, 2016; 133(3);183-92.5. Goyal, Indian J Radiol Imaging; 2012; 22(3);155-9.6. Friedli, Nature scientific reports; 2016;10.1038.
Figure 1: Examplar multiparametric maps showing T1 with a SE-EPI read-out, T1 with a bFFE readout, ADC, T2* and perfusion

50 2nd International Scientific Symposium · FUNCTIONAL RENAL IMAGING
POSTER AbSTRACTS
Figure 2: Summary of parameters for HVs and CKD patients with corresponding coefficient of variance (CoV). Paired t-tests were performed between the HV and CKD groups *P<0.05 *.
Figure 3: Cortical T1 showed a significant increase with increasing interstitial fibrosis (IF) score from biopsy.

Berlin, October 11 – 13, 2017 · MDC.C – MAX DELBRÜCK COMMUNICATIONS CENTER 51
POSTER AbSTRACTS
P 08Diffusion Weighted Magnetic Resonance Imaging to investigate response to therapy: A case report
Anna Caroli1,* , Barbara Ruggiero2, Paolo Brambilla3, Sandro Sironi3, Giuseppe Remuzzi3, and Andrea Remuzzi4
1IRCCS – Istituto di Ricerche Farmacologiche “Mario Negri”, Bergamo, Italy2IRCCS – Istituto di Ricerche Farmacologiche “Mario Negri”, Bergamo3ASST – Papa Giovanni XXIII, Bergamo4University of Bergamo, Dalmine (BG)*Presenting author
BackgroundDiffusion weighted imaging (DWI) signal attenuation has often been described by a mono-expo-nential equation. Biexponential (intravoxel incoherent motion, IVIM) models have been recently proposed to separate pure diffusivity from perfusion effects, taking into account the complexity of the renal microstructure.Membranous nephropathy (MN) is the leading cause of nephrotic syndrome (NS) in adults trans-lating into progressive chronic kidney disease (CKD). B cell-depleting treatment by rituximab, and more recently by ofatumumab, achieves anti-PLA2R antibody depletion and NS remission in almost 80% of subjects.Our aim was to evaluate DWI-IVIM based parameters as potential biomarkers of disease pro-gression and response to therapy in a patient with stage 3 CKD, rituximab-resistant MN receiv-ing ofatumumab therapy.
Materials and methodsA 41 years-old male with MN since 1999 was admitted in 2015 at Bergamo Hospital due to persistent NS. At disease onset a 6-month course of steroid and chlorambucil was ineffective; in 2000 a two-year course of cyclosporine achieved partial remission of the NS (proteinuria <1g/day) that relapsed in 2008 requiring cyclosporine therapy for an additional year. In 2013 renal function started worsening and renal biopsy revealed significant glomerulosclerosis with stripped interstitial fibrosis and tubular lesions, typical of cyclosporine-toxicity. In 2014 a single 375mg/m2 rituximab dose failed and, after histological confirmation of moderate chronic renal lesions, in 2016 a single 300 mg ofatumumab dose was administered after GFR measurement by the Iohexol plasma clearance (Table 1). The patient underwent renal MRI after signing written informed consent, before starting ofatumumab therapy and then after 1 year. A 36 years-old male underwent MRI, as normal control (NC). He also underwent blood analysis and eGFR estimation by MDRD formula.Patient and control underwent non contrast-enhanced MRI on a 1.5T GE scanner. DWIs were acquired using a single-shot EPI sequence, with 9 b-values (0, 15, 50, 100, 200, 350, 500, 700, 1000 s/mm2). DW images were motion-corrected by affine registration along the b values, slice-wise. They were than quantified within the kidney regions, by fitting a segmented biexponential model. High b-values (350, 500, 700, 1000) were used to calculate Fp (perfusion fraction) and

52 2nd International Scientific Symposium · FUNCTIONAL RENAL IMAGING
POSTER AbSTRACTS
ADCslow, (slow diffusion coefficient, i.e. water diffusivity), while low b-values (0, 15, 50, 100, 200) were used to fit ADCfast (fast diffusion coefficient, i.e. molecular motion caused by perfusion). Fitting was performed voxel-wise, by in-house software written in Matlab. ADCslow, ADCfast and Fp mean values were computed averaging individual maps over both kidneys, excluding vessel regions (Fp > 0.65).
ResultsIn the MN patient, the administration of a single ofatumumab dose led to complete depletion of circulating B cell within 24 hrs and to remission of the NS within 6 months, which persists till today (proteinuria <1g/day, see Table 1). Pre- and 1-year ofatumumab therapy DWI parameters are reported in Table 1. Before treatment, ADCslow map shows areas with non uniform diffusivity (at the intraparenchymal level and also across the kidneys) suggestive of different degree of parenchymal lesions (Figure 1A). Baseline ADCslow values were significantly lower than those of the NC (Table 1) while ADCfast and Fp were only numerically higher. At 1-year ofatumumab therapy, ADCslow values increased significantly while ADCslow and Fp numerically decreased. The amelioration of the ADCslow values paralleled the increase in GFR after treatment.
ConclusionsIn this report, DWI showed regression of significant kidney injury in a patient with anti-PLA2R MN, mirroring the beneficial effect of ofatumumab therapy on kidney function. ADCslow, increas-ing with response to therapy, seems to be the most informative DWI parameter, with lowest ADCslow values before treatment likely associated with interstitial damage.Our findings suggest that IVIM-DWI could add on biopsy, clinical and functional parameters to localise parenchymal damage, enabling a deeper understanding of kidney structural and functional changes, and providing accurate biomarkers to monitor disease progression and response to therapy.Current results, albeit promising, should be considered as preliminary, as this was a single case study. Future clinical studies are needed to provide further evidence.

Berlin, October 11 – 13, 2017 · MDC.C – MAX DELBRÜCK COMMUNICATIONS CENTER 53
POSTER AbSTRACTS
Table 1. Clinical, functional, and DWI parameters

54 2nd International Scientific Symposium · FUNCTIONAL RENAL IMAGING
POSTER AbSTRACTS
P 09The influence of hydration status of kidney volume and cyst measurements
Jens Dam Jensen1,* , Marie Jensen1, Maria Grøstøl1, Bjarne Ørskov2, Martin Egfjord2, Bente Jespersen1, Henrik Lauridsen1, Anja Møller Jensen2, and Michael Pedersen1
1Aarhus University Hospital2Copenhagen State Hospital*Presenting author
Background:Autosomal dominant polycystic kidney disease (APKD) is the most common hereditary kidney disease characterized by renal cyst growth, hypertension, renal pain and finally end stage renal disease. Previous results showed that kidney volume (KV) determined by magnetic resonance imaging (MRI) is inversely associated with estimated glomerular filtration rate (eGFR) in APKD patients (Chapman et al.). In the light of this complex water handling in AKPD patients it could be speculated that short term water restriction also influences KV in AKPD. Furthermore, as vasopressin plays an important role in cyst formation and AKPD is characterized by an urinary concentration defect the KV may be more vulnerable or respond differently to short term water restriction than in healthy volunteers. Primary objective of this study was to study the influence of short term water restriction on kidney volume differentiated/separated into kidney tissue and cyst volume in AKPD patients.
Study design:A total of 11 APKD patients were recruited. Inclusion criteria: >18 years of age, fulfill the diag-nostic criteria for adult polycystic kidney disease CKD(1-3), blood pressure < 140/90 (treated and non-treated). Exclusion criteria: use of diuretics, pregnancy, changes in antihypertensive treatment during the last 3 months, and contraindications to MRI.
MRI:MRI was conducted with a Siemens 3 T system. We used a non-contrast-agent protocol using a 3D T1-weighted sequence, (0.8x0.8x0.8 mm3 resolution), acquisition time 9-15 min (depend-ing on respiratory rate because navigator-triggered were employed). MRI was conducted two times: Scan 1 was performed following a 20 ml/kg water intake (over a period of 1 h), whereas Scan 2 was performed following a 3 hours thirst period. All data were processed off-line, and measurements of total kidney volume (TKV) and cyst volume (CV) were assessed for each kid-ney (both Scan 1 and Scan 2) using a semiautomatic segmentation method.

Berlin, October 11 – 13, 2017 · MDC.C – MAX DELBRÜCK COMMUNICATIONS CENTER 55
POSTER AbSTRACTS
Results and Discussion:An example of segmented cyst area is showed in Fig 1. Results showed no statistical differences between the two groups (+/- water intake). TKV varied within 4% between the two scans, and CV varied within 6% between scans. These preliminary results suggest no marked influence on renal volume after water intake, and clinical monitoring of cyst development may in future advantageous-ly be made by MRI without consideration of hydration status.
References:Chapman, A. B. et al. Renal structure in early autosomal-dominant polycystic kidney disease (ADPKD): The Consortium for Radiologic Imaging Studies of Polycystic Kidney Disease (CRISP) cohort. Kidney Int 64(3), p. 1035-45.
Fig 1: Example of segmented kidneys

56 2nd International Scientific Symposium · FUNCTIONAL RENAL IMAGING
POSTER AbSTRACTS
P 10Semi-automated kidney delineation on BOLD images using k-means clustering of R2* signal decay
Anneloes de Boer1,* , Cornelis van den Berg1, Tim Leiner1, and Hans Hoogduin1
1University Medical Center Utrecht*Presenting author
IntroductionKidney delineation is often required in functional kidney imaging to obtain quantitative results. Preferably, segmentation is performed on the functional scan itself, instead of adding an ana-tomical scan for this purpose. This overcomes the need of coregistration of kidney masks and possible misalignment. Since manual segmentation is laborious, multiple approaches for kid-ney segmentation have been developed. Zöllner et al. described a method based on k-means clustering for kidney segmentation on DCE MRI data (1). Furthermore, Menzies et al. (2) used k-means clustering on BOLD data in rats to partition kidney voxels in a cortex and medullary cluster after manual kidney segmentation. We hypothesized that this approach also can be used to segment the kidney itself in human BOLD data.
MethodData of a study on reproducibility of, amongst others, blood oxygen-level dependent (BOLD) in healthy volunteers was used. For BOLD MRI, 13 subjects were scanned twice while of two subjects only a single data set was available. Subjects were scanned on a 1.5T Philips Ingenia MR, using a 2D multi-echo gradient echo sequence with SENSE 1.5. Three coronal oblique slices were acquired, one per breath-hold of 13s. Voxel size was 1.5x1.5x5.0mm3, flip angle 25° and repetition time 95ms. Twenty echoes were acquired at 4.6ms intervals, the first at 4.6ms.Post-processing was performed in Matlab. Images were cropped manually to encompass a tight rectangle around both kidneys. During k-means clustering, voxels are partitioned into a user de-fined number of clusters based on the similarity of the R2* decay curve. Next, the cluster contain-ing the kidney was identified by a mouseclick of the user. The initial mask consisted of all voxels in this cluster. In this mask, the largest connected component with eccentricity between 0.70 and 0.93 contained the kidneys (eccentricities of 0 and 1 correspond to a circle and a straight line, respectively). Erosion and dilation of the mask was used to delete, for example, the renal artery and to smooth the edge of the mask. Sometimes, the spleen had to be deleted manually because it was contained in the initial mask and connected to the kidney. The convex hull of this mask was used as region of interest, since a tool to eliminate the collecting system already was available. For comparison, also manual segmentation was performed, where the collecting system was included for consistency. To quantify similarity between the manually segmented mask and the clustered mask, the Jaccard index was used, the size of the intersection divided by the size of the union of both masks, which approaches 1 in case of perfect agreement.The R2* value was calculated with a mono-exponential fit to the signal change over the echoes. Extraction of R2* values separate for cortex and medulla was performed by fitting a Gaussian and gamma function to the histogram of the R2* values (3) using an in-house developed Matlab tool. Thresholding was used to eliminate the collecting system, as published earlier (4).

Berlin, October 11 – 13, 2017 · MDC.C – MAX DELBRÜCK COMMUNICATIONS CENTER 57
POSTER AbSTRACTS
ResultsThe spleen had to be removed manually in 7 scans (4 subjects). Final ROIs, generated both au-tomatically and manually, are shown in figure 1 for three scans. The median Jaccard index was 0.92 with interquartile range 0.90-0.94. Clustering took on average 41s for one scan (including cropping and excluding the spleen, if necessary), while manual delineation took on average 103s.
DiscussionAs expected, k-means clustering could be employed for semi-automatic segmentation of the kidneys on BOLD MRI data. A drawback is the need for manual elimination of the spleen in a quarter of the scans. In future implementations, this possibly can be automated by incorpo-ration of shape information, which probably also would overcome the need for manual image cropping. Further research must elucidate whether the algorithm also works for other functional imaging modalities.
References1. Zollner, Comput Med Imaging Graph. 2009;33(3):171-81.2. Menzies, Am J Physiol Renal Physiol. 2013;305(6):F845-852.3. Ebrahimi, Invest Radiol. 2012;47(3):175-82.4. Vink, J Hypertens. 2015;33(3):597-603.
Figure 1: Masks generated manually (red) versus auto-matically (blue) for three subjects; a,b) good agreement; c) automatically generated ROI overestimates kidney volume

58 2nd International Scientific Symposium · FUNCTIONAL RENAL IMAGING
POSTER AbSTRACTS
P 11Repeatibility of renal BOLD MRI
Anneloes de Boer1,* , Margreet Sanders1, Hans Hoogduin1, Peter Blankestijn1, and Tim Leiner1
1University Medical Center Utrecht*Presenting author
IntroductionAssuring repeatability of imaging techniques is a prerequisite for clinical implementation of kid-ney blood oxygen-level dependent (BOLD) MRI. Although good repeatability of renal BOLD MRI has been shown (1-3), variability of scan protocols between centers and vendors urged us to study the repeatability of the BOLD protocol used in our center.
MethodsFifteen subjects were scanned twice with an interval of at least one week. Multiparametric kidney MRI was performed on a 1.5T Philips Ingenia MR, but only the BOLD data is present-ed here. Using a 2D multi-echo gradient echo sequence, 20 echoes were acquired, the first at 4.6ms and the remaining at 4.6ms intervals. Repetition time was 95ms, flip angle 25° and voxel size 1.5x1.5mm with an acquisition matrix of 252x198. Three coronal 5mm thick slices were acquired during three breath holds of 13s. Post-processing was performed in an in house developed Matlab tool. Kidneys were delineated using a semi-automatic approach similar to Zöllner et al. (4). A mono-exponential fit to the signal decay was used to extract the R2* value. The collecting system was eliminated using a thresholding approach, as published earlier (5). The compartmental method (6) was used to extract separate values for cortex and medulla. Here, a Gaussian and gamma function representing cortex and medulla are fitted to the histo-gram of R2* values.In the repeatability analysis, left and right kidneys were treated as separate measurements. Bland-Altman plots, including limits of agreement, were generated in Matlab. Repeatability co-efficients (RCs) (analogous to the limits of agreement in Bland Altman plots, the maximum difference in R2* between pairs of repeated measurements for 95% of subjects) were calculated both in absolute values and in percentage of mean R2*. Intraclass correlation coefficients (ICCs) were calculated in SPSS. Values are reported as mean (sd).
Results13 complete sets of BOLD MRIs were available: in two subjects only one BOLD scan was avail-able. Median interval between scans was 21 days, ranging from 7 to 56 days. Mean cortical and medullary R2* was 13.0(0.9)s-1 and 19.5(1.9)s-1 for the first scan, respectively, and 13.0(0.6)s-1 and 20.5(2.4)s-1 for the second scan. Bland Altman plots of the R2* values are shown in figure 1. The RCs for cortex and medulla were 1.25s-1 (9.6%) and 5.3s-1 (27%). ICCs were 0.68 and 0.42 for cortex and medulla, respectively.

Berlin, October 11 – 13, 2017 · MDC.C – MAX DELBRÜCK COMMUNICATIONS CENTER 59
POSTER AbSTRACTS
Conclusion and discussionWe aimed to determine the repeatability of BOLD MRI as performed in our center. Based on the Bland-Altman plots, no systematic error was present. Repeatability of cortical R2* (RC 9.6%) was in agreement with other studies (1-2). These studies reported comparable good repeat-ability for medullary R2*, while the RC we found for medullary R2* was markedly increased: 27%. However, in these studies subjects were scanned either 1-2 weeks apart or on the same day. The larger time interval between scans in our study can be an explanation for the decreased repeatability of medullary R2*. In another study (3), subjects were scanned with intervals of about 3 months and indeed variability between scans was larger (RC of 31 and 36% for cortex and medulla, respectively, as calculated using the R2* values reported). The difference in repeat-ability between cortex and medulla in our study might be explained by the uncontrolled water and salt intake. In future research, the influence of post-processing on the repeatability can be investigated, for example compartmental analysis (6) compared to region of interest based approaches to extract separate R2* values for cortex and medulla.
References1. Khatir ea. J Magn Reson Imaging. 2014;40(5):1091-8.2. Simon-Zoula ea. NMR Biomed. 2006;19(1):84-9.3. Li L ea. J Magn Reson Imaging. 2004;19(5):610-6.4. Zollner ea. Comput Med Imaging Graph. 2009;33(3):171-81.5. Vink ea. J Hypertens. 2015;33(3):597-603.6. Ebrahimi ea. Invest Radiol. 2012;47(3):175-82.
Figure 1: Bland-Altman plots of cortical (a) and medullary (b) R2*.

60 2nd International Scientific Symposium · FUNCTIONAL RENAL IMAGING
POSTER AbSTRACTS
P 12non invasive mri of renal physiology
Per Eckerbom1,* , Eleanor Cox2, Peter Hansell3, Jan Weis1, Charlotte Buchanan2, Fredrik Palm3, Susan Francis2, and Per Liss1
1Inst for Surgical Sciences, Uppsala University, Sweden2The Sir Peter Mansfield MRI Center, Nottingham, UK3Inst for Medical Cell Biology, Uppsala University, Sweden*Presenting author
Background:Due to the risks associated with ionizing radiation and with contrast media in radiological exam-inations, (contrast induced nephropathy and nephrogenic systemic fibrosis) there is a demand for non invasive, non ionizing methods to study renal physiology. Magnetic resonance imaging (MRI) can provide information of kidney physiology and function that is safe, non-invasive and relatively fast to assess. Before carrying out studies in pathological conditions it is important to gain data of a healthy population. In this study we, with a single scan protocol determine baseline values of total and regional renal blood flow, oxygenation, true and apparent diffusion and T1 in healthy volunteers.
Methods:28 healthy volunteers (15 female, 13 male) were recruited and underwent a 3T MRI scan with a scan protocol including MRI techniques phase contrast, Arterial spin labelling (ASL), Blood level oxygen dependent (BOLD), Diffusion weighted imaging (DWI) and T1.
Results:Total RBF (Phase contrast) did not differ significantly between females and males (460±144 vs 553±116 ml/min/m2) though a significant correlation was found between total RBF and body surface area, body mass index, and renal volume. Cortical, outer and inner medullary blood flow (ASL) values were similar between females and males (288±73, 93±15 and 42±13 vs 291±57, 89±15 and 43±18 ml/min) as were also corresponding BOLD values(16.3±1.3, 26.3±1.3 and 35.4±3.7 vs 16.7±0.8, 27.4±1.8 and 38.4±3.3 ml/min), true diffusion values (2.09±0.26, 1.85±0.22 and 1.71±0.25 vs 2.14±0.20, 1.88±0.14 and 1.71±0.15 ml/min), apparent diffusion values (2.46±0.15, 2.17±0.22 and 2.06±0.21 vs 2.39±0.19, 2.11±0.16 and 1.95±0.14 ml/min) and T1 values (1171±60, 1447±170 and 1542±175 vs 1121±71, 1349±189 and 1476±249). For ASL, BOLD, DWI and T1, significant interregional differences were found between all three studied regions. No significant difference between right and left kidney or between gender was found for any of the studied parameters.
Conclusion:MRI provides reliable and robust non-invasive data on important total and regional physiologic kidney parameters. Significant interregional differences between cortex, outer and inner medulla was found for perfusion, oxygenation level, diffusion and T1.No differences were found between

Berlin, October 11 – 13, 2017 · MDC.C – MAX DELBRÜCK COMMUNICATIONS CENTER 61
POSTER AbSTRACTS
the pair of kidneys or between the genders.This is important knowledge for further studies in pathological kidney conditions
Graphs abstract Eckerbom et al. Berlin 2017

62 2nd International Scientific Symposium · FUNCTIONAL RENAL IMAGING
POSTER AbSTRACTS
P 13Fully automatic Kidney Segmentation in abdominal Magnetic Resonance Imaging (MRI) using Random Forests (RFs)
Marc Fischer1,*, Susanne Paar1, and Fritz Schick1
1University of Tübingen, Tübingen, Germany*Presenting author
ObjectiveAs a preprocessing step to analyze renal function, linking regions of interest (ROI) of functional MR images to its morphological complement may be required. In this case fully automatic kidney segmentation can be employed to alleviate the process. In the past, many explicitly designed and/or data-driven methods have been investigated. Recently it has been shown that fully automatic organ segmentation is feasible in non-contrast enhanced T2w MR images via stand-alone machine learning (ML) methods [1]. However, the applicability, given sufficient training data, is limited to expressive image modalities and robustness may vary strongly. Thus, we propose a two-step procedure consisting of versatile trained Random Forests (RF) to pro-vide a robust ML methodology. We show the feasibility of the method with respect to kidney segmentation, based on fat saturated T1w VIBE and T2w HASTE sequences, both having 1.25x1.25x3.5 mm voxel size, 16 slices and have been acquired from 10 healthy volunteers on a 3T MR scanner (see Figure 1).
TheoryA RF is comprised of an ensemble of decision trees [2]. RFs can be used in distinct ways, such as for tissue classification, organ segmentation or to estimate a distance vector to a landmark, ROI or bounding box. These categorical and continuous variables can be combined in one unified model [3], allowing for versatile applications. The annotated training data is split at each node so that similar annotations are grouped in the same leaf nodes. We make use of nodes that allow for a depth dependent importance weighting of the used variables.
MethodsTwo distinctly trained RFs are employed. First, a RF with the purpose of identifying prominent landmarks is constructed. As such, the forest identifies the upper and lower poles of the kid-neys by estimating the respective distance vectors for a given amount of randomly chosen voxels. Each voxel “votes” for a potential position, the consensus being identified as the desired landmark. Consecutively the estimated positions are used as additional input to the second RF with the goal of providing spatial context to improve the segmentation robustness. The proce-dure is illustrated in Figure 2. RFs are especially useful for the clinical setting, since a low amount of annotated data is sufficient. In contrast, classical approaches for organ segmentation such as Multi-Atlas or Statistical Shape Models require a large and/or expressive dataset in terms of variability, to cope with any unseen images. In addition, different modalities can be provided to the forests to make use of multiple modalities. Thus, the provided T1w and T2w sequences have been affinely preregistered for use in conjunction.

Berlin, October 11 – 13, 2017 · MDC.C – MAX DELBRÜCK COMMUNICATIONS CENTER 63
POSTER AbSTRACTS
ResultsWe investigate the accuracy of identified landmarks, as well as the segmentation performance with respect to manually provided annotations. We report mean values jointly for both kidneys based on two-fold cross-validation. The landmarks are reliably found, which results in a mean distance ± standard deviation of 12.49 ± 5.82 mm, 7.29 ± 4.23 mm, 9.81 ± 6.09 mm for the T1w, T2w and T1w&T2w cases respectively. The resulting kidney segmentation correlates well with the manual segmentation, which is reflected in high Dice Similarity Coefficients (DSC), and low Average Surface Distances (ASD) in Figure 3. Considering the kidney poles leads to far less misclassification with increasing distance to the actual kidneys, which can be seen in decreased ASD values. The proposed approach is superior to a single RF.
ConclusionA flexible approach making use of an efficient ML algorithm has been proposed, demonstrating the feasibility of robust segmentation of the kidneys based on few non-contrast enhanced MR data. A third RF could be consecutively employed, to further differentiate internal kidney struc-tures, as done in [4].
References[1] Lavdas et al., Med Phys. ’17[2] Criminisi et al., FTCGV ‘11[3] Glocker et al., ECCV ’12[4] Jin et al., IEEE T-MI ‘16
Figure 1: Slice from (a) a T1w VIBE and (b) a T2w HASTE abdominal MR image of a healthy volunteer.

64 2nd International Scientific Symposium · FUNCTIONAL RENAL IMAGING
POSTER AbSTRACTS
Figure 2: (a) Voting heat map illustrating landmark identification. Landmarks are depicted in light blue. (b) Segmentation result of two-step approach. (c) Manual segmentation.
Figure 3: Evaluation of segmentation performance, via Average Surface Distance (ASD) and Dice Similarity Coefficient (DSC) (red lines) ± standard deviation (blue boxes).

Berlin, October 11 – 13, 2017 · MDC.C – MAX DELBRÜCK COMMUNICATIONS CENTER 65
POSTER AbSTRACTS
P 14Variability Reduction in Renal Diffusion-Weighted Magnetic Resonance Imaging with Motion Compensation
Iris Friedli1,* , Bénédicte MA Delattre1, Lindsey A Crowe1, and Jean-Paul Vallée1
1Geneva University Hospitals, University of Geneva, Faculty of Medicine, Geneva, Switzerland.*Presenting author
Introduction:Kidney Diffusion-Weighted Magnetic Resonance Imaging (DWI) can be impacted by the pres-ence of motion artifacts, despite the use of physiological triggering schemes for respiration. The evaluation of the effect of motion is important, however, it seems to be generally neglected and vastly underestimated in renal DWI. Motion can lead to inhomogeneous signal intensity (SI) dropout, and this could be a major source of Apparent Diffusion Coefficient (ADC) variability. In liver, an artificial localized elevation of ADC values was attributed as a direct consequence of SI void in these areas1. In addition, as one single slice, or the mean DW parameter of several slices, commonly served for the analysis, inter-slice variability is lacking in the literature. In that context, the purpose of this study was to assess and reduce SI variation due to motion in multi-slice kidney DWI. These variations were evaluated and a motion correction algorithm is presented, based on the temporal maximum intensity projection (TMIP) method2.
Methods:SI and Apparent Diffusion Coefficient (ADC) variation between 4 consecutive slices was quan-tified in a phantom and sixteen healthy volunteers. Each was scanned with three acquisitions (referred as “DWI1”, “DWI2”, and “DWI3”) using a single-shot SE-EPI (ss-EPI) sequence on a PRISMA 3T MR system. DW parameters were: 2×2×5mm3 resolution, 61ms TE, 3 GRAPPA accelerator factor, PACE navigator for the respiratory gating, 10 b-values [0-900s/mm2], bipolar diffusion scheme. For the correction, a reconstructed set of images was rebuilt taking the max-imum pixel SI from the 3 acquisitions (referred as “Corrected” DWI). Also, the more traditional average ADC value was calculated from the mean SI of the 3-repeated DWI, referred to as “<DWI>i”. SI and ADC variability were compared via inter-acquisition, inter-slice, and inter-in-dividual coefficients of variation (CV). Intra-slice variability was evaluated with goodness of fit parameter, Root Mean Squared Error (RMSE). The best regression (minimum deviation of fitted to measured SI) was defined as the one with the RMSE closest to zero. The statistical inference between DW values and goodness of fit parameters was carried out using Friedman rank sum. The individual statistical differences were verified using Wilcoxon signed rank test.
Results:In contrast with the phantom where all CVs were under 3%, a heterogeneous pattern of lo-calized SI dropout was visible within different areas of the healthy parenchyma (Figure 1). In uncorrected DWI, the mean inter-acquisition CV for ADC was 8±5% (up to 23%) with 34% of slices above 10% of variability. A mean of 10% (up to 44%) SI variation was measured between slices. Inter-slice ADC CV was decreased by more than 50% for “Corrected” ADC compared

66 2nd International Scientific Symposium · FUNCTIONAL RENAL IMAGING
POSTER AbSTRACTS
to the 3-repeated DWI and the reduction was 37% compared to “<DWI>i”. Figure 2 shows the difference of inter-slice ADC CV between acquisitions. Reduction in SI variations leads to a significant reduction in RMSE of “Corrected” SI compared to “<DWI>i” SI and the 3-repeated DWI (p<0.03) SI. All RMSE values are in Figure 3. Inter-individual ADC CV for “Corrected” was under 6% (compared to 9% uncorrected and for “<DWI>i”).
Discussion:In conclusion, the present study quantified the variability, caused by motion during diffusion en-coding, in renal ADC measurement. Any real ADC changes smaller than 10% could be missed without compensation for signal dropout. Compensation for motion is therefore of importance for reliable measurement of early pathologies leading to small ADC changes. Currently, ad-vanced techniques, such as second-order motion-compensated diffusion gradient waveforms, require dedicated MR sequences that are not yet available as a commercial product. Motion compensation, using TMIP, has the clear advantage of being easily implemented with all avail-able DW sequences on clinical MR systems. Compensation for signal dropout induced by motion should be incorporated into clinical studies using renal DWI to reduce artifactual ADC variability.
References:1. Kwee et al Magma 2009;22(5):319-3252. Rapacchi et al Investigative radiology 2011;46(12):751-758
RMSE for the 4 consecutives slices of the 16 volunteers. RMSE of “Corrected” SI was significantly lower compared to the average of the 3 DWI “<DWI>i” and repeated DWI. boxes).

Berlin, October 11 – 13, 2017 · MDC.C – MAX DELBRÜCK COMMUNICATIONS CENTER 67
POSTER AbSTRACTS
DWI of the same slice in one kidney. The parenchyma of the corrected image is more homogenous compared to the 3 DWI, impacted by localized signal dropout.
Inter-slice ADC variability measured in 4 consecutive central slices of the renal cortex of 16 healthy volunteers.

68 2nd International Scientific Symposium · FUNCTIONAL RENAL IMAGING
POSTER AbSTRACTS
P 15The Cortico-Medullary ADC Difference Reduces Inter-System Variability in Renal Diffusion-Weighted Imaging
Iris Friedli1,* , Lindsey Alexandra Crowe1, Bénédicte MA Delattre1, Thomas De Perrot1, Pierre-Yves Martin1, Sophie De Seigneux1, and Jean-Paul Vallée1
1Geneva University Hospitals, University of Geneva, Faculty of Medicine, Geneva, Switzerland*Presenting author
Introduction: Apparent diffusion coefficient (ADC) from diffusion-weighted imaging (DWI) has been investi-gated for kidney pathology assessment. In a recent study, the cortico-medullary difference, ΔADC showed a better correlation than cortical ADC with interstitial fibrosis1. ΔADC decreased variability between patients with the same level of fibrosis compared to cortical ADC. ΔADC could be a valuable index to compare kidney ADC across MR systems in the case of diseases affecting primarily the cortex, such as interstitial fibrosis. This study aimed to verify if the ΔADC index was a more robust parameter, with a reduced ADC variability between MR systems, than cortical or medullary ADC.
Methods: A phantom and eight healthy volunteers were scanned on 5 MR systems with similar DWI parameters (Table 1). Volunteers were scanned on the same MR system sequentially and in random order. Inter-scan agreement of ADC measurements (phantom and volunteers) from the different MR systems was carried out via the standard deviation between ADCs from different MR systems. F test was computed to compare the variances of measured cortex, medulla and ΔADC. Significant differences of median ADC values (cortex, medulla and Δ) between MR systems were estimated using the Wilcoxon signed rank test.
Results: In the phantom, the mean standard deviation between ADCs [10-6mm2/s] was 12±5. In volun-teers the mean standard deviation was 112±32 between cortical ADCs and 120±36 between medullas. The mean standard deviation between ΔADCs was 66±34. A significant reduction of the ADCs variance was measured with the ΔADC by comparing with the ADC from the cortex (p=0.017) and ADC from the medulla (p=0.0025). The Wilcoxon test showed significant differ-ences in cortical and medullary ADC were measured between Siemens MR scanners (p=0.016 for cortex and p=0.008 for medulla between PRISMA 3T and AERA 1.5T) and between scan-ners from different vendors at 1.5T (p=0.047 for cortical ADC between AERA and INGENIA) (Figure 2). No significant difference was measured using the ΔADC parameter across all MR systems (p-values Î [0.15-0.94]).
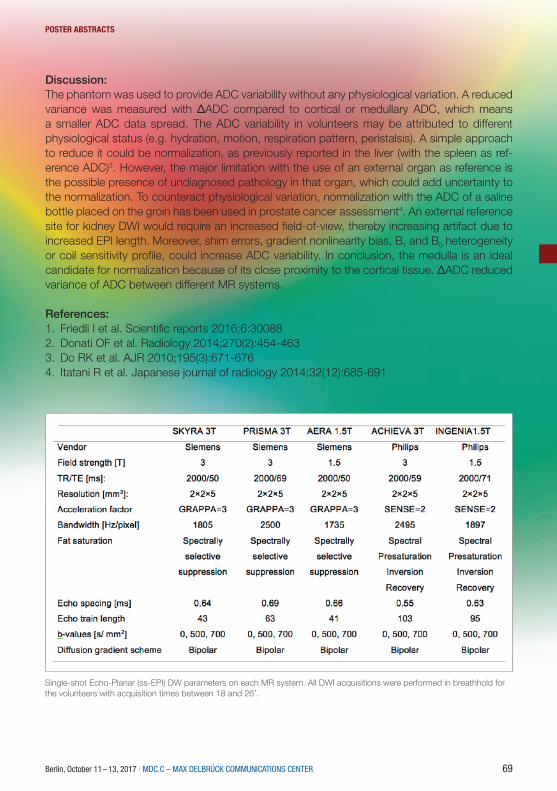
Berlin, October 11 – 13, 2017 · MDC.C – MAX DELBRÜCK COMMUNICATIONS CENTER 69
POSTER AbSTRACTS
Discussion: The phantom was used to provide ADC variability without any physiological variation. A reduced variance was measured with ΔADC compared to cortical or medullary ADC, which means a smaller ADC data spread. The ADC variability in volunteers may be attributed to different physiological status (e.g. hydration, motion, respiration pattern, peristalsis). A simple approach to reduce it could be normalization, as previously reported in the liver (with the spleen as ref-erence ADC)3. However, the major limitation with the use of an external organ as reference is the possible presence of undiagnosed pathology in that organ, which could add uncertainty to the normalization. To counteract physiological variation, normalization with the ADC of a saline bottle placed on the groin has been used in prostate cancer assessment4. An external reference site for kidney DWI would require an increased field-of-view, thereby increasing artifact due to increased EPI length. Moreover, shim errors, gradient nonlinearity bias, B1 and B0 heterogeneity or coil sensitivity profile, could increase ADC variability. In conclusion, the medulla is an ideal candidate for normalization because of its close proximity to the cortical tissue. ΔADC reduced variance of ADC between different MR systems.
References:1. Friedli I et al. Scientific reports 2016;6:300882. Donati OF et al. Radiology 2014;270(2):454-4633. Do RK et al. AJR 2010;195(3):671-6764. Itatani R et al. Japanese journal of radiology 2014;32(12):685-691
Single-shot Echo-Planar (ss-EPI) DW parameters on each MR system. All DWI acquisitions were performed in breathhold for the volunteers with acquisition times between 18 and 26’.

70 2nd International Scientific Symposium · FUNCTIONAL RENAL IMAGING
POSTER AbSTRACTS
Example of coronal-oblique slice orientation ADC maps of a right kidney. Arrows point to the cortex and medulla.
ADC values for cortex, medulla and Δ. Significant difference between the cortex and medulla of PRISMA-AERA, and AERA-INGENIA. No significant differences for ΔADC.

Berlin, October 11 – 13, 2017 · MDC.C – MAX DELBRÜCK COMMUNICATIONS CENTER 71
POSTER AbSTRACTS
P 16Kidney fibrosis assessment: t1rho and DCE permeability study.
Dmitry Kupriyanov1,*, Georgiy Chermenskiy2, and Mariya Vishnyakova2
1Philips Healthcare, Russia2Moscow Regional Research and Clinical Institute*Presenting author
Progressive fibrosis accompanies all chronic renal diseases and involves an accumulation of col-lagen in extracellular matrix. Usually fibrosis results in loss of kidney function when normal tissue is replaced with scar tissue [1]. The severity of kidney fibrosis can be evaluated by biopsy followed by histopathological assessment [2]. However, modern MRI techniques are sensitive to the com-position of biological tissues and could be used to assess fibrosis in whole kidney non-invasively. The aim of this study it to evaluate the sensitivity of MRI t1rho sequence [3] to delineate fibrotic and normal kidney tissues on t1rho maps. Also, the dynamic contrast enhancement was used to assess kidney fibrosis on the base of two compartment tissue permeability model [4].Group of patients with different kidney deceases was investigated on 3T MRI scanner (Philips Achieva 3T) using 32-channel body coil. GRE sequence (TR=2ms, TE=1ms, FA=500) with Spin Locking pre-pulse (duration 40, 30, 20, 10 and 1 ms) was used to obtain t1rho maps (calculated using Matlab tool). Dynamic contrast enhancement study (GRE, TR=4ms, TE=1ms, FA=80, dynamic scan time = 4sec) was performed after contrast injection to calculate tissue permeability maps (calculated using Philips Intellispace Portal Permeability tool). No meaningful changes in tissue permeability were found. Regions of kidney with decreased washout were suspected as areas of diffuse fibro-sis. (Pic 1). T1rho maps also demonstrate increased values of t1rho in this regions (Pic 2). Applied techniques could be used to distinguish normal and fibrotic tissues in kidneys. Hopefully, after histological evaluation the severity of kidney fibrosis can be assessed quantitatively.
Pic.1. Kidney DCE washout map.
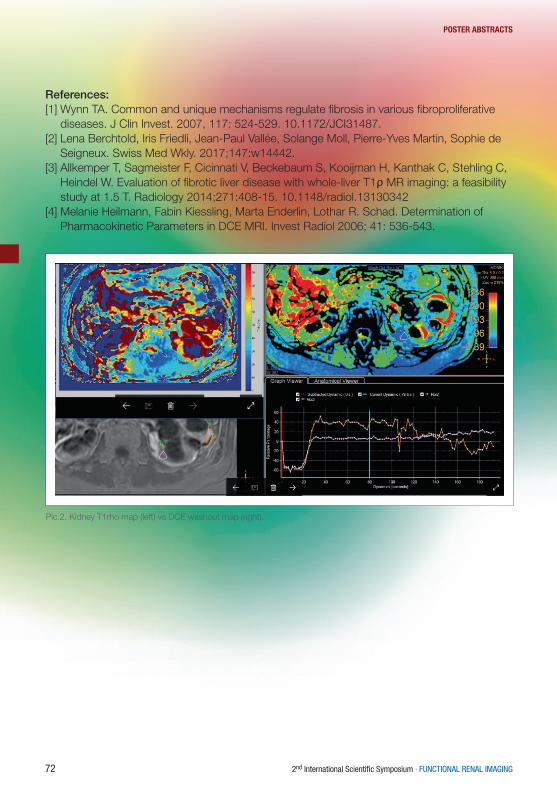
72 2nd International Scientific Symposium · FUNCTIONAL RENAL IMAGING
POSTER AbSTRACTS
References:[1] Wynn TA. Common and unique mechanisms regulate fibrosis in various fibroproliferative
diseases. J Clin Invest. 2007, 117: 524-529. 10.1172/JCI31487.[2] Lena Berchtold, Iris Friedli, Jean-Paul Vallée, Solange Moll, Pierre-Yves Martin, Sophie de
Seigneux. Swiss Med Wkly. 2017;147:w14442. [3] Allkemper T, Sagmeister F, Cicinnati V, Beckebaum S, Kooijman H, Kanthak C, Stehling C,
Heindel W. Evaluation of fibrotic liver disease with whole-liver T1ρ MR imaging: a feasibility study at 1.5 T. Radiology 2014;271:408-15. 10.1148/radiol.13130342
[4] Melanie Heilmann, Fabin Kiessling, Marta Enderlin, Lothar R. Schad. Determination of Pharmacokinetic Parameters in DCE MRI. Invest Radiol 2006; 41: 536-543.
Pic.2. Kidney T1rho map (left) vs DCE washout map (right).
Berlin, October 11 – 13, 2017 · MDC.C – MAX DELBRÜCK COMMUNICATIONS CENTER 73
POSTER AbSTRACTS
P 17Noninvasive evaluation of renal pH homeostasis after ischemia reperfusion injury by CEST-MRI pH mapping
Dario Longo1,* , Juan Carlos Cutrin2, Filippo Michelotti3, Pietro Irrera2, and Silvio Aime2
1National Research Council of Italy (CNR)2University of Torino3university of Torino*Presenting author
IntroductionIschemic renal injury is a severe clinical problem in nephrology and the major cause of acute kidney injury (AKI). Hospitalized patients commonly experience AKI, which is strongly asso-ciated with poor prognosis and high mortality [1]. Although the principal role of the kidney is the maintenance of acid-base balance, current imaging approaches are unable to assess this important parameter, and clinical biomarkers are not robust enough in evaluating the severity of kidney damage [2]. Therefore, novel noninvasive imaging approaches are needed to assess the acid-base homeostasis in vivo [3]. This study investigates the usefulness of MRI chemical exchange saturation transfer (CEST) pH imaging in characterizing moderate and severe AKI in mice following unilateral ischemia reperfusion injury.
MethodsA flank incision was made in Balb/C mice to expose the left renal pedicle to induce 20 (n=6), or 40 min (n=6) of ischemia which was followed by reperfusion. MR images were acquired with a Bruker MRI scanner operating at 7.0 Tesla before and 24h, 48h and 1 week after the I/R injury. CEST images were acquired to calculate renal pH following the i.v. injection of Iopamidol (dose: 1.0 g Iodine / kg b.w., equivalent to a human dose of 0.08 g I /kg) via a catheter into the tail vein [4]. The CEST spectrum was acquired in the frequency offset range of ±10 ppm with 37 offsets unevenly separated, using a CW saturation block pulse (3 μT for 5 s). An acquisition matrix of 96 x 96 was reconstructed to 128 x 128 with a field of view of 3 x 3 cm2 (in- plane spatial res-olution =234 μm) and a slice thickness of 1.5 mm. The acquisition time for a single MRI- CEST spectrum was about 5 min.Quantification of tubular injury score was assessed by counting the percentage of tubular ne-crosis and casts in ten fields of H/E kidney stained sections using a scale from 0 to 5.
ResultsA significant increase of renal pH values was observed as early as one day after the ischemia reperfusion damage for both moderate and severe ischemia models (Fig. 1). MRI- CEST pH imaging distinguished the evolution of moderate from severe AKI (Fig. 2B and 2D). A recovery of normal renal pH values was observed for moderate AKI, whereas a persisting renal pH increase was observed for severe AKI on Day 7 (Fig. 1A and B). Renal filtration fraction was significant-ly lower for clamped kidneys (0.54-0.57) in comparison to contralateral kidneys (0.84-0.86) following impairment of glomerular filtration (Fig. 3). The severe AKI group showed a reduced

74 2nd International Scientific Symposium · FUNCTIONAL RENAL IMAGING
POSTER AbSTRACTS
filtration fraction even after 7 days (0.38 for the clamped kidneys). Notably, renal pH values were significantly correlated with the histopathological score (Fig. 1C).
ConclusionsMRI- CEST pH mapping is a valid tool for the noninvasive evaluation of both acid-base balance and renal filtration in patients with ischemia reperfusion injury.
References[1] T. Ali et al., J Am Soc Nephrol. 2007[2] S. Uchino et al., Curr Opin Crit Care. 2010[3] D. L. Longo et al., Mag Reson Med, 2013[4] D. L. Longo et al., Mag Reson Med, 2011
Fig. 1 A, bar graph showing renal pH values before and after moderate (20 min) and severe (40 min) ischemia reperfusion injury. C, correlation of histological score and pH values.

Berlin, October 11 – 13, 2017 · MDC.C – MAX DELBRÜCK COMMUNICATIONS CENTER 75
POSTER AbSTRACTS
Fig. 2 T2w images and MRI‐CEST pH maps before and after moderate (A,B) and severe (C,D) AKI at different time points showing clamped (right) and contralateral kidney (left).
Fig. 3 A, bar graph showing filtration fraction values in clamped and contralateral kidneys before and after mod-erate (20 min) and severe (40 min) reperfusion injury.

76 2nd International Scientific Symposium · FUNCTIONAL RENAL IMAGING
POSTER AbSTRACTS
P 18Simultaneous assessment of kidney perfusion and pH in an acute kidney injury murine model exploiting a dynamic CEST-MRI approach
Dario Longo1,* , Juan Carlos Cutrin2, Pietro Irrera2, Lorena Consolino2, Frank Zoellner3, and Silvio Aime2
1National Research Council of Italy (CNR)2University of Torino3University of Heidelberg*Presenting author
IntroductionSeveral parameters can be non-invasively assessed with the MRI modality for the evaluation of renal functionality in kidney diseases [1]. An important parameter is renal perfusion that can be measured throughout the acquisition of dynamic contrast-enhanced images (DCE-MRI) upon the injection of a Gd-based contrast agent (CA) by following its transit through the kidney region [2]. Furthermore, MRI-CEST contrast agents have also been shown to be able to report on renal pH values [3] and to assess the longitudinal evolution of renal pH homeostasis and renal filtra-tion in murine models of kidney ischemia reperfusion injury (KIRI) [4]. Methods able to provide multiple information following a single CA injection could be of great interest for an improved and multiparametric characterization of renal functionality.In this study, for the first time, a dynamic CEST acquisition has been investigated for the simul-taneous assessment of renal perfusion and pH. A simple procedure for the semiquantitative determination of renal perfusion, coupled to functional pH mapping, has been set up using a single pH-responsive CEST tracer. This approach has been applied for the assessment of renal function in mice exposed to unilateral ischemia (Acute Kidney Injury, AKI). The capability of this combined approach to report on kidney damage has been compared with the DCE-MRI as-sessment of renal perfusion following the injection of Gd-based agent in the same mice.
MethodsBalb/C mice (n=6) were subjected to unilateral (left kidney) ischemia for 30 min followed by reperfusion. MR images were acquired at 7.0 Tesla before and 3 days after the ischemia/reper-fusion injury. A iodinated CA (iopamidol, dose 1.5 g iodine / kg b.w., equivalent to a human dose of 0.125 g I /kg) was injected via a catheter into the tail vein to acquire dynamic CEST imag-es (DCE-CEST) with a sampling time of 2s. The same molecule was exploited for calculating renal pH values, too. A Gd-based CA (ProHance) was injected in the same MRI session and DCE-MRI acquisition was performed with the same sampling time to validate renal perfusion estimates.Perfusion semiquantitative parameters, such as the relative area under the curve (rAUC) and the peak were calculated for different kidney regions (cortex and medulla) from the DCE-CEST contrast enhancement time curves. For DCE-MRI studies, a deconvolution approach for quan-titative analysis was also investigated for assessing renal perfusion. Tubular injury score was quantified on H/E kidney stained sections.

Berlin, October 11 – 13, 2017 · MDC.C – MAX DELBRÜCK COMMUNICATIONS CENTER 77
POSTER AbSTRACTS
ResultsThe cortex and medulla regions of the right kidneys enhanced more than the cortex of the left kidney, for both CEST-and Gd-enhanced time curves (Fig. 1A and B). A significant decrease of rAUC-CEST derived values was observed for the cortex and medulla of the left kidney in comparison to the right kidney (P<0.05). Similar findings between the healthy and the clamped kidney were obtained when applying the deconvolution approach to the DCE-MRI curves fol-lowing Gd-based agent injection. In addition, the same pH-responsive agent allowed to cal-culate in the same MRI session an increased pH value (ΔpH=+0.4), reflecting the alteration of pH homeostasis in the clamped kidneys (Fig 3). Histological staining confirmed extensive injury after the induced I/R injury in the clamped kidneys, whereas negligible damage was observed in the contralateral control kidneys.
ConclusionsThis study shows that a single-CEST MRI contrast agent can provide multiple information relat-ed to renal function and can distinguish healthy kidneys from pathological ones by combining perfusion measurements with renal pH mapping.
References[1] N. Grenier, et al., Eur J Radiol. 2006[2] F. G. Zollner, et al., Z Med Phys, 2014[3] D. L. Longo, et al., Mag Reson Med, 2013[4] D. L. Longo, et al., NMR Biomed, 2017
Fig. 1 Contrast enhancement curves following injection of CEST (A) and of Gd-based (B) contrast agents for contralateral kidney (solid line) and clamped kidney (dashed line). Fig. 3 Renal pH values in healthy and in AKI mice three days after the kidney ischemic reperfusion injury (KIRI).

78 2nd International Scientific Symposium · FUNCTIONAL RENAL IMAGING
POSTER AbSTRACTS
Fig. 2 rAUC (A) and Plasma Flow values (B) obtained from the analysis of DCE-CEST and from the deconvolution of DCE-MRI curves, respectively, three days after the AKI damage.
Fig. 3 Renal pH values in healthy and in AKI mice three days after the kidney ischemic reperfusion injury (KIRI).

Berlin, October 11 – 13, 2017 · MDC.C – MAX DELBRÜCK COMMUNICATIONS CENTER 79
POSTER AbSTRACTS
P 19Fast semi-supervised segmentation of the kidneys in DCE-MRI using convolutional neural networks and transfer learning
Alexander Selvikvåg Lundervold1,* , Jarle Rørvik2, and Arvid Lundervold3
1Western Norway University of Applied Sciences2University of Bergen and Haukeland University Hospital3University of Bergen*Presenting author
IntroductionObject segmentation is arguably the holy grail of quantitative image analysis. In medical imag-ing, accurate segmentations make it possible to obtain crucial structural and functional tissue information, including localization, shape and volume estimation, and quantification of imag-ing-derived biomarkers. In the context of DCE-MRI of the moving kidneys, frame by frame seg-mentation of the left and right kidney will enable extraction of mean parenchymal signal intensity over time. These time courses can then be used in a pharmacokinetic modeling setting, fitting model parameters such as GFR to observed data. The aim of the present study was to develop a fast and robust kidney segmentation method applied to 3D DCE-MRI recordings, an import-ant step in our development of segmentation-based predictions of GFR using machine learning.
Methods
DCE-MRI recordings. In a cohort of 20 healthy volunteers kidney DCE-MRI data were contin-uously acquired on a 1.5 T Siemens Avanto scanner using a 3D SPGR sequence (see [1] for details).
Kidney segmentation. A common stumbling block for supervised learning methods based on deep neural networks is the large number of labeled examples required for training. Creat-ing labeled data for a segmentation model typically involves producing manual delineations, a time-consuming, difficult and often unreliable process. To reduce the need for manually labeled data we used transfer learning from a different problem: segmenting the left and right hippo-campus in 3D T1-weighted MR images. After training a network to produce accurate hippo-campus segmentations, we copied the weights to a CNN designed for segmenting kidneys, freezing the weights of the first few layers in this network during training. By combining transfer learning, dropout regularization, residual connections and semi-supervised learning through pseudo-labeling, we were able to train a three-dimensional convolutional neural network (CNN) [2] that can accurately segment both the left and right kidney, based on a small number of man-ually annotated training examples. For our experiments we were using a single standard NVIDIA GeForce 1080Ti GPU for training and executing the CNN model.

80 2nd International Scientific Symposium · FUNCTIONAL RENAL IMAGING
POSTER AbSTRACTS
ResultsWith our approach we were able to obtain 3D segmentation of both the left and right kidney in less than 7 seconds per volume. Average Dice coefficient across three unseen test volumes were 0.87, 0.85 for left and right kidney, respectively. The lower right part of Fig. 1 shows the manually delineated kidneys and the predicted segmentation. Note that the ground-truth is not exact, which makes the Dice coefficient a less reliable measure of success, requiring additional visual inspection for assessment.
DiscussionThe work described above is part of our current work aimed at uncovering the parenchymal sig-nal intensity from each voxel, opening the door for voxel-wise prediction of GFR from DCE-MRI.A limitation of our experiments so far is restriction to labelling and testing only the time-frames where the kidney cortex show close to maximum enhancement. We are in the process, howev-er, to train (using deformable motion correction) and test all time-frames during the wash-in and wash-out phases in the DCE-MRI series and to perform separate segmentation of the cortex, the medulla, and the renal pelvis.Accurate segmentation of structures in medical images is crucial for a wide variety of disorders and organ systems, and our transfer learning based approach to segmentation is broadly ap-plicable. By transferring knowledge from a task with ample supply of annotated training data to another with few training examples, one can enable application specific automatic segmenta-tion with relatively modest need for manual input. We are currently investigating the breadth of applicability of this approach to CNN-based segmentation in medical images, across organs and image modalities.
References[1] E. Eikefjord et al. Acta Radiol 2017;58(6):748-757.[2] K. Kamnitsas et al. Med Image Anal 2017;36:61-78.
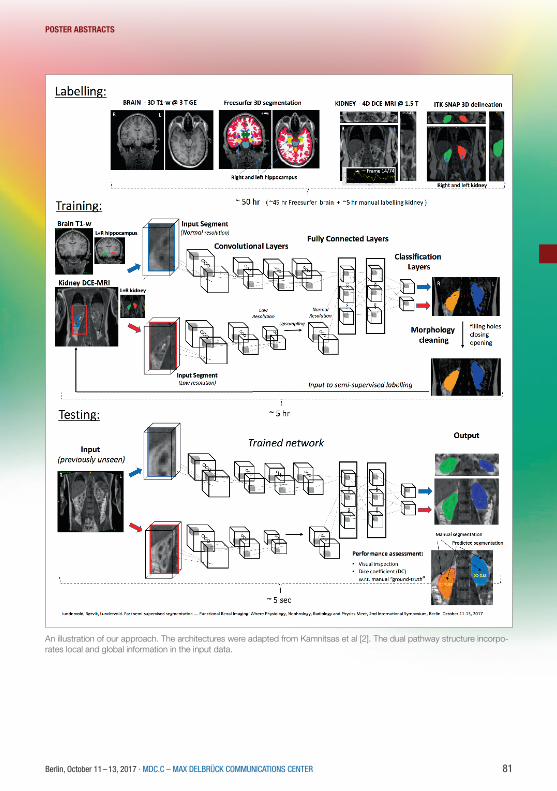
Berlin, October 11 – 13, 2017 · MDC.C – MAX DELBRÜCK COMMUNICATIONS CENTER 81
POSTER AbSTRACTS
An illustration of our approach. The architectures were adapted from Kamnitsas et al [2]. The dual pathway structure incorpo-rates local and global information in the input data.

82 2nd International Scientific Symposium · FUNCTIONAL RENAL IMAGING
POSTER AbSTRACTS
P 20Magnetic Resonance Imaging to Assess the Pathophysiology of Acute Kidney Injury
Huda Mahmoud1,* , Charlotte Buchanan1, Eleanor Cox1, Benjamin Prestwich1, Maarten Taal1, Nick Selby1, and Susan Francis1
1University of Nottingham*Presenting author
Purpose:The pathophysiology of Acute Kidney Injury (AKI) in humans is not well described, in part due to limitations in current methods of renal imaging. Recent advances in Magnetic Resonance Im-aging (MRI) show promise in assessing a range of structural and functional changes that occur in kidney disease. We performed a pilot study in which we collected multiparametric renal MRI data to assess structural and functional measures in a single scan session at the point of AKI, and subsequently applied this to longitudinally assess patients with AKI.
Methods:10 patients with AKI were studied (mean age of 49±17yrs, five male) and 11 healthy volun-teers (HV) who acted as a comparator group. The patients all had AKI stage 3 and none had pre-existing Chronic Kidney Disease (CKD). Patients underwent a multiparametric renal MRI scan at the time of AKI, 90 days after the first scan and then again a year later. Biochemical and clinical parameters were collected at each time point. MRI scans were performed on a 3 Tesla Philips Ingenia scanner. MRI measures included kidney volume assessment, and longitu-dinal-relaxation time (T1) mapping and Diffusion-Weighted Imaging (DWI) as markers of fibrosis and/or inflammation. Phase Contrast MRI and Arterial Spin Labelling (ASL) data was collected to measure renal blood flow and perfusion, whilst Blood Oxygenation Level Dependent (BOLD) data provided an indicator of renal oxygenation.
Results:AKI patients had a mean baseline serum creatinine of 78±14μmol/L which increased during the AKI episode to a peak creatinine level of 496±231μmol/L; six patients had pre-renal AKI, four patients had renal biopsies performed which revealed tubulointerstitial nephritis, ischaemic changes secondary to non-steroidals and oxalosis. For all AKI patients, their first MRI scan was performed within 7 days of peak serum creatinine. To date, 8 patients have completed their sec-ond MRI scan at 90 days, and of these 7 patients achieved complete biochemical recovery (se-rum creatinine 86±15μmol/L, p=0.08 compared to baseline). Renal volumes were significantly increased at time of AKI compared to HVs; 270±92mm3 and 189±24.6 mm3 respectively, p=0.001. T1 significantly increased in AKI patients compared to HVs. Cortical and medullary T1 values for AKI patients were 1737±94ms and 1887±46ms respectively, in comparison to corti-cal and medullary T1 values of 1416± 79ms (p=0.001 vs AKI) and 1690±86ms (p=0.001 vs AKI)

Berlin, October 11 – 13, 2017 · MDC.C – MAX DELBRÜCK COMMUNICATIONS CENTER 83
POSTER AbSTRACTS
respectively in HVs. Renal cortical T2*(BOLD) was significantly higher in AKI patients 64±7.5ms than HVs 52±5.4ms, p=0.0026. There was no significant difference between apparent diffusion coefficient and phase contrast blood flow measures. There were also significant differences in MRI measures at the time of AKI compared to MRI measures at 90 days. Renal volumes sig-nificantly reduced after 90 days (210±75mm3, p=0.04), as did cortical (1534±74ms, p<0.0001) and medullary T1 values (1740±52ms, p<0.0001), and also cortical T2* (60±5ms, p=0.0073) values. However, despite the reduction, at 90 days T1 values remained significantly higher than the HV group, p=0.003. Thus far four patients have completed one year follow up scans, these results are currently being analysed.
Discussion:This is the first study to use multiparametric MRI in patients with AKI. We successfully demon-strate that multiparametric MRI can be used to assess kidney function and structure during an episode of AKI. The increase in renal volume may be associated with increase in interstitial oedema and inflammation which is also reflected in the raised T1 values at point of injury. The persistent increase in T1 at 90 days despite normalisation of serum creatinine may indicate on-going inflammation that leads to the development of renal fibrosis after an episode of AKI. Fur-ther studies are required to build on this initial pilot work to determine how best multiparametric MRI can be used to characterise the nature of renal injury in AKI and its recovery.
Figure 1, MRI measures in AKI patients at time of injury and at 90 days post-AKI: A, Renal volume B, Cortical T2* C, Cortical T1 D, Medullary T1.

84 2nd International Scientific Symposium · FUNCTIONAL RENAL IMAGING
POSTER AbSTRACTS
P 21Hyperpolarized [13C,15N2]urea: a novel renal O2 saturation biomarker in acute kidney injury?
Christian Østergaard Mariager1,* , Per Mose Nielsen1, David Christoffer Hansen1, Haiyun Qi1, Steffen Ringgaard1, and Christoffer Laustsen1
1Department of clinical medicine, Aarhus University*Presenting author
PurposeBlood oxygenation level dependent (BOLD) magnetic resonance imaging (MRI) can image the T2* relaxation, as a surrogate marker of tissue pO2 alterations associated with renal disease. However, BOLD is limited by perfusion, vascular and tubular volume fractions, and is therefore considered a semi-quantitative method1. Improved methods are therefore needed. Hyperpo-larized [13C,15N]urea is an alternative marker of renal function that correlates well with renal oxygenation under normal conditions, while the aberrant renal oxygen consumption in diabetes diminishes this relationship2. Here we investigate the correlation between 1H BOLD MRI and 13C-urea T2 relaxation rate in an acute kidney injury (AKI) rat model.
Materials and methodsSix male (278±11 g) Wistar rats were subjected to unilateral renal ischemia 24 hours before the MRI investigation. Hyperpolarized [13C,15N]urea samples were prepared using a 5T SPINLab polarizer (GE Healthcare, DK) to a polarization of more than 35%. After dissolution, a 1.0 ml injection volume was transferred to the rats, placed in a 9.4T pre-clinical MR scanner (Agilent, UK) with a 1H/13C dual-tuned volume coil (Doty scientific, US).1H BOLD MRI was performed with; TR/TE/ΔTE=150 ms/2.25 ms/2.16 ms, FOV/matrix=60x60 mm2/128x128, flip-angle=30° and 6 mm slice thickness. Perfusion was estimated by non-con-trast flow alternating inversion recovery (FAIR) arterial spin labelling (ASL); TR/TE=4.1 ms/2.1 ms, TI=110, 180, 310, 510, 860, 1430, 2400 and 4000 ms, FOV/matrix=60x60 mm2/128x128, flip-angle=8° and 20 mm slice thickness. Label and control images were acquired with TI=1300 ms. Hyperpolarized 13C-urea T2 mapping was performed with a 2D golden-angle radial ap-proach; TR/TE=3000 ms/4.6 ms, FOV/matrix=70x70 mm2/64x512, flip-angle=90°/180° and 10 mm slice thickness2.Region of interest (ROI) analysis was performed in Matlab (MathWorks, Natick, MA, US) using ROI segmentation analysis3. Each whole kidney ROI was divided into six equidistantly spaced segment layers using this method, see Figure 1.Statistical analysis was performed in GraphPad PRISM (GraphPad Software, Inc. La Jolla, CA, US), p<0.05 was considered statistically significant.
ResultsAll rats showed clinical sign of AKI with reduced creatinine clearance (p=0.1), urine output (p=0.19) and increased plasma creatinine (p<0.0001), blood-urea nitrogen (BUN) (p=0.31). Kidney weight significantly increased in the ischemic kidney (4.2±0.3 mg/g) compared to the
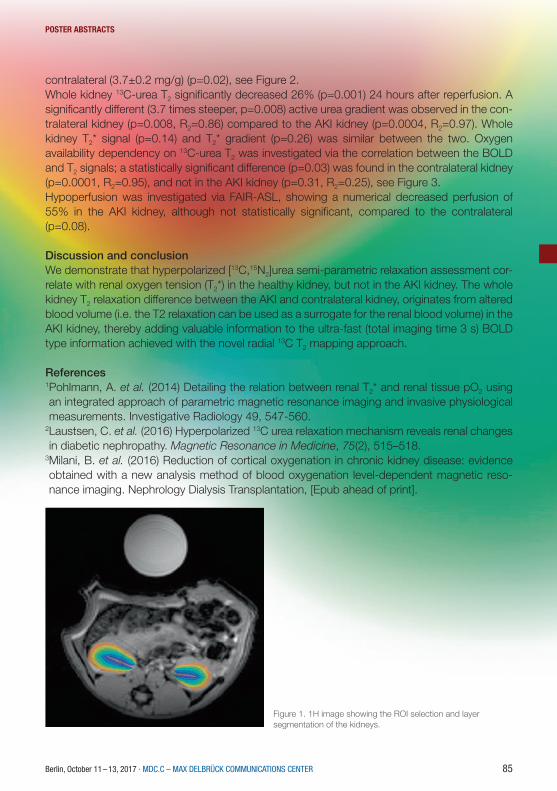
Berlin, October 11 – 13, 2017 · MDC.C – MAX DELBRÜCK COMMUNICATIONS CENTER 85
POSTER AbSTRACTS
contralateral (3.7±0.2 mg/g) (p=0.02), see Figure 2.Whole kidney 13C-urea T2 significantly decreased 26% (p=0.001) 24 hours after reperfusion. A significantly different (3.7 times steeper, p=0.008) active urea gradient was observed in the con-tralateral kidney (p=0.008, R2=0.86) compared to the AKI kidney (p=0.0004, R2=0.97). Whole kidney T2* signal (p=0.14) and T2* gradient (p=0.26) was similar between the two. Oxygen availability dependency on 13C-urea T2 was investigated via the correlation between the BOLD and T2 signals; a statistically significant difference (p=0.03) was found in the contralateral kidney (p=0.0001, R2=0.95), and not in the AKI kidney (p=0.31, R2=0.25), see Figure 3.Hypoperfusion was investigated via FAIR-ASL, showing a numerical decreased perfusion of 55% in the AKI kidney, although not statistically significant, compared to the contralateral (p=0.08).
Discussion and conclusionWe demonstrate that hyperpolarized [13C,15N2]urea semi-parametric relaxation assessment cor-relate with renal oxygen tension (T2*) in the healthy kidney, but not in the AKI kidney. The whole kidney T2 relaxation difference between the AKI and contralateral kidney, originates from altered blood volume (i.e. the T2 relaxation can be used as a surrogate for the renal blood volume) in the AKI kidney, thereby adding valuable information to the ultra-fast (total imaging time 3 s) BOLD type information achieved with the novel radial 13C T2 mapping approach.
References1Pohlmann, A. et al. (2014) Detailing the relation between renal T2* and renal tissue pO2 using an integrated approach of parametric magnetic resonance imaging and invasive physiological measurements. Investigative Radiology 49, 547-560.
2Laustsen, C. et al. (2016) Hyperpolarized 13C urea relaxation mechanism reveals renal changes in diabetic nephropathy. Magnetic Resonance in Medicine, 75(2), 515–518.
3Milani, B. et al. (2016) Reduction of cortical oxygenation in chronic kidney disease: evidence obtained with a new analysis method of blood oxygenation level-dependent magnetic reso-nance imaging. Nephrology Dialysis Transplantation, [Epub ahead of print].
Figure 1. 1H image showing the ROI selection and layer segmentation of the kidneys.

86 2nd International Scientific Symposium · FUNCTIONAL RENAL IMAGING
POSTER AbSTRACTS
Figure 2. Results of the renal funcional analysis (CL and IR denote the healthy and AKI kidney, respectively).
Figure 3. Results of the 1H and hyperpolarized 13C MRI examinations (CL and IR denote the healthy and AKI kidney, respectively).

Berlin, October 11 – 13, 2017 · MDC.C – MAX DELBRÜCK COMMUNICATIONS CENTER 87
POSTER AbSTRACTS
P 22Assessment of renal stiffness in IgA nephropathy using multifrequency MRE compared to DWI and BOLD
Stephan Rodrigo Marticorena Garcia1,* , Sophia Lang1, Markus Großmann1, Bernd Hamm1, Jür-gen Braun1, Jing Guo1, and Ingolf Sack1
1Charité – Universitätsmedizin Berlin*Presenting author
Purpose: To investigate renal stiffness in patients with IgA nephropathy using multifrequency MRE and to correlate renal stiffness with other imaging parameters such as apparent diffusion coefficient (ADC) and T2*.
Background: Immunoglobulin A (IgA) nephropathy is one of the most common kidney diseas-es. The buildup of IgA in the kidneys results in local inflammation which, over time, can lead to end-stage kidney disease. Renal biopsy is the only diagnostic method to confirm IgA, however, it is not suited for monitoring disease progression longitudinally due to its invasiveness.
Methods: 17 patients (PAT, mean age 46±11 years, 4 females) with IgA nephropathy and 16 age matched healthy controls (CTR, mean age 41±10 years, 5 females) were enrolled in the study. In vivo multifrequency MR elastography (MRE), diffusion weighted imaging (DWI) and blood oxygenation-level dependent (BOLD) imaging were performed in each subject. All ex-periments were conducted on a 1.5-T MRI scanner equipped with a 12-channel phased array surface coil. Renal MRE was performed at 40, 50, 60 and 70 Hz at 11 slices using two pressure pads placed underneath both kidneys. Shear wave speed was given in m/s. DWI and BOLD imaging were performed with a spin echo-echo planar imaging (SE-EPI) sequence and multiple gradient-recalled-echo (mGRE) sequence, respectively. For DWI, 11 slices with 2.7×2.7×5 mm3 resolution were recorded with 2 averages and b values of 0 and 500 s/mm2 in 17 seconds. For BOLD MRI, 3 slices with 2.8×2.8×5 mm3 resolution were recorded with 8 echo times (2.38-37.72 ms) in 20 seconds. All imaging protocols were executed in a paracoronal slice orientation covering both kidneys. ROIs were placed inside the nonhilar renal parenchyma.
Results: In the stiffness map, the atrophic kidneys in the patient are apparently softer than the kidneys of the healthy volunteer. As no significant differences between left and right kidneys were obtained for all imaging parameters, data from both kidneys are pooled for further group analysis. Group mean values of wave speed obtained from MRE and ADC are significantly lower in patients than in healthy volunteers (MRE: PAT, 1.85 ± 0.33 m/s vs. CTR: 2.34 ± 0.15 m/s; P < 0.0001; ADC: PAT, 163.7 ± 26.2 mm2/s vs. CTR, 181.1 ± 15.3 mm2/s; P = 0.035). No significant differences were obtained for T2* between patients and healthy volunteers (PAT, 66.2 ± 11.6 ms vs. CTR, 72.7 ± 4.9 ms, P = 0.079). We also observed linear correlations between wave speed, ADC and T2* combing both data from healthy controls and patients. A moderate correlation was found between wave speed and ADC (Pearson r = 0.422, P = 0.020) and T2*, respectively (Pear-son r = 0.529, P = 0.003). No correlation was observed between ADC and T2*.

88 2nd International Scientific Symposium · FUNCTIONAL RENAL IMAGING
POSTER AbSTRACTS
Conclusion: Patients with IgA nephropathy show a reduced renal stiffness and diffusion coeffi-cient as compared to healthy controls. Renal stiffness linearly correlates with both ADC and T2*. By mechanical vascular-solid tissue interactions, wave speed measurements by multifrequency MRE offer a quantitative measure for the noninvasive assessment of renal function.

Berlin, October 11 – 13, 2017 · MDC.C – MAX DELBRÜCK COMMUNICATIONS CENTER 89
POSTER AbSTRACTS
P 23Feasibility of Renal ASL in a Paediatric Cohort with Impaired Renal Function
Fabio Nery1,* , Enrico De Vita2, Chris Clark1, Isky Gordon1, and David L. Thomas3
1UCL Great Ormond Street Institute of Child Health2National Hospital for Neurology and Neurosurgery, Lysholm Department of Neuroradiology; UCL Institute of Neurology3UCL Institute of Neurology, Department of Brain Repair and Rehabilitation*Presenting author
IntroductionArterial Spin Labelling harnesses blood water as a freely diffusible tracer to allow for a non-inva-sive assessment of tissue perfusion. As such, it is particularly suited for subjects with impaired renal function where contrast agents are typically contra-indicated. However, technical chal-lenges such as sensitivity to movement and low SNR still limit widespread use of ASL in the clinic. In this work, we assess the feasibility of ASL in a paediatric cohort with severe kidney disease by combining a robust acquisition scheme with an optimised retrospective motion correction approach.
MethodsEleven children (8 male; age (years): 12±3 (mean±SD), 7-17 (range)) with CKD of different pathophysiological origin (eGFR (ml/min per 1.73m2) = 26±9 (mean±SD), 12-47 (range)) were scanned twice in each of two occasions (time between scans (days): 23±10 (mean±SD), 7-35 days (range)), for a total of 44 ASL runs. Estimated GFR was calculated using the bedside Schwartz equation [1] from serum creatinine measurements obtained from routine blood sampling. A single-shot, background-suppressed, respiratory-triggered FAIR 3D-GRASE ap-proach was used for data acquisition. Main scan parameters include: TR/TE=3000ms/31.5ms; 64x64x10 matrix at 4.5x4.5x6.0mm resolution; Partial Fourier (factor 3/4); 25 ASL pairs; Inflow time (TI)=1200ms. Motion correction consisted of image registration combined with weighted averaging [2]. Renal blood flow (RBF) was estimated using a standard single-compartment model using voxelwise M0 and kidney T1 obtained respectively from a separate proton-density scan and a separate saturation recovery acquisition, both with readout matching the ASL ac-quisition. Functional renal parenchyma (FRP) and whole-kidney regions of interest were manu-ally segmented in the reference M0 volumes (renal dilatations (where existing) were excluded). Good alignment between T1, M0 and ASL data was confirmed by visual inspection with scans not meeting this requirement being excluded. A Bland Altman analysis was used to assess the agreement between RBF measurements across the different scans/days and independently for left and right kidneys. The correlation between RBF (in ml/100g/min) measured using a TI of 1.2s and eGFR (ml/1.73m2/min) was evaluated by computing the Pearson’s correlation coeffi-cient, where p values smaller than 0.05 were deemed to be significant.
ResultsAll children remained clinically stable between the MR sessions. The technical success rate was 86% (38/44), where 2 runs failed during acquisition (fat shift and respiratory triggering failure)

90 2nd International Scientific Symposium · FUNCTIONAL RENAL IMAGING
POSTER AbSTRACTS
and 4 runs were deemed to have excessive movement which was unable to be corrected using image registration. One example dataset (M0, T1, perfusion-weighted data and RBF map) is shown in Figure 1. The mean FRP and whole-kidney RBF was, respectively 101±52 (mean ± SD), range=51-188 ml/100g/min and 105±44, range=61-175 ml/100g/min. In all 8 Bland-Alt-man plots (not shown – summarised in Figure 2), the mean of the RBF differences is small, with the largest bias (6.4 ml/100g/min) being found in the inter-session (i.e. different days) compari-son of the left kidneys considering the FRP ROIs. For each comparison, t-tests have shown that the null hypothesis (RBF differences coming from a distribution with zero mean) is not rejected at the 5% significance level. Plots of RBF averaged across kidneys vs. eGFR for each patient are shown in Figure 3. No statistically significant correlations were found between RBF at the inflow time of 1.2s and eGFR in both FRP and WK ROIs.
ConclusionsFor the first time, a paediatric cohort with severe kidney disease of variable origin underwent ASL. Reproducible RBF measurements were obtained, demonstrating the feasibility of ASL in a challenging patient population. The lack of correlation between RBF and eGFR suggests that the degree to which perfusion is impaired may be linked to each patients’ underlying patho-physiology.
References[1] Schwartz, G. et al., New Equations to Estimate GFR in Children with CKD, J. Am. Soc. Nephrol., vol. 20, no. 3, pp. 629–637, 2009.[2] F. Nery et al., Improved reproducibility of longitudinal renal ASL perfusion measurements in children with chronic kidney disease using retrospective motion correction, in Proc. ISMRM, 1887, 2017.
Summary of statistics from the Bland-Altman plots, where the limits of agreement (LOA) are in ml/100g/min

Berlin, October 11 – 13, 2017 · MDC.C – MAX DELBRÜCK COMMUNICATIONS CENTER 91
POSTER AbSTRACTS
Right kidney, patient #9 (Renal Cysts and Diabetes syndrome). M0, M0-perfusion weighted signal fusion images, T1 and RBF maps overlaid on M0 images (top to bottom rows).
RBF (averaged across kidneys) vs. eGFR for FRP and whole-kidney ROIs

92 2nd International Scientific Symposium · FUNCTIONAL RENAL IMAGING
POSTER AbSTRACTS
P 24Assessment of metabolism in early renal ischemia/reperfusion injury using hyperpolar-ized 13C-pyruvate
Per Mose Nielsen1, Haiyun Qi1, and Christoffer Laustsen1
1Clinical institute
Background:Renal ischemia/reperfusion injury (IRI) makes up 47% of all cases of acute kidney injury (AKI)1, and up to 1.9% of all hospitalized patients develop AKI2. Imbalance in energy metabolism and mitochondrial function is a hallmark in IRI which can be caused by mechanisms like oxidative stress, apoptosis and inflammation1. We have recently published a paper showing how meta-bolic profile change in severe unilateral IRI, but does not change significantly in mild/moderate IRI, although kidney function is reduced3. In this study we wanted to investigate metabolic changes in early IRI
Methods:Wistar Rats (220g, n=6) were subjected to unilateral renal ischemia in the scanner for 30 min followed by reperfusion for 2 min where 13C-pyruvate was injected. 13C-pyruvate was again injected after 1 hour of reperfusion. A tail vein catheter was inserted for injection of hyperpolar-ized [1-13C]pyruvate. A midline incision in the abdomen was made and the left renal artery was carefully dissected. An inflatable clamp was placed around the renal pelvis, and secured with ligature on the underlining muscle layer. After the animal was placed in the scanner the clamp was inflated, and pressure was released after 30 min giving rise to 30 min of ischemia. Tempera-ture, arterial oxygen saturation and respiration rate were monitored throughout the experiment in the 3T MR scanner.
Results and Discussion:We found an initial elevated lactate/pyruvate ratio in the post-ischemic kidney (IR) and an ele-vated bicarbonate/pyruvate ratio in both the IR kidney and the contralateral (CL) kidney. This bicarbonate/pyruvate elevation persisted in the IR kidney 60 min after ischemia, but dropped in the CL kidney. In previous studies with 24 hours of reperfusion we have previously seen an elevation in anaerobic metabolism if severe injury has been induced, or no difference in anaero-bic metabolism compared to the contralateral if mild/moderate injury has been induced3. Here we find a completely new situation with an initial metabolic boost after 2 min of ischemia, which probably is a response to waste product build, energy demand and initial hypoxia. Interestingly after 60 min of reperfusion it seems the aerobic capabilities are unaltered in the IR kidney and reduced in the CL kidney. The reason for this is currently unknown to us, but we hypothesize that it might by a shunting effect to elevated substrate delivery to the IR kidney.
Conclusion:In conclusion we here found an initial elevation lactate/pyruvate ratio in both kidneys after 30 min of ischemia and 2 min of reperfusion. This probably denotes a chock period after the isch-
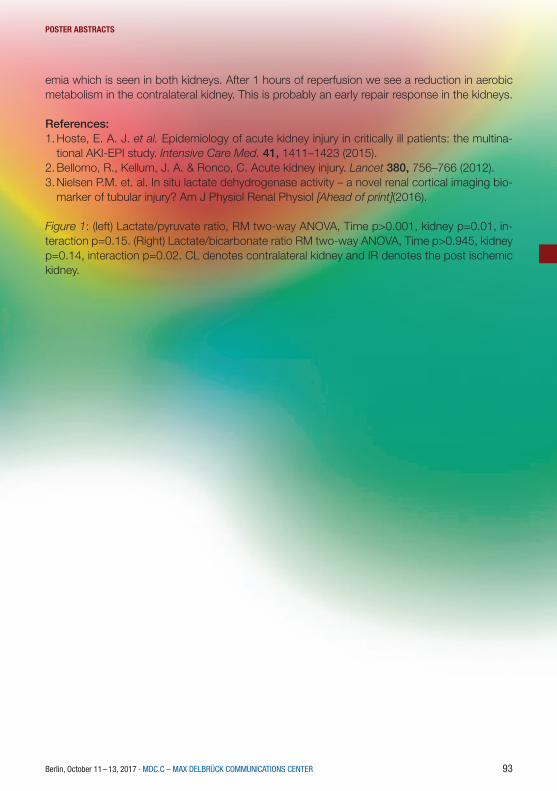
Berlin, October 11 – 13, 2017 · MDC.C – MAX DELBRÜCK COMMUNICATIONS CENTER 93
POSTER AbSTRACTS
emia which is seen in both kidneys. After 1 hours of reperfusion we see a reduction in aerobic metabolism in the contralateral kidney. This is probably an early repair response in the kidneys.
References:1. Hoste, E. A. J. et al. Epidemiology of acute kidney injury in critically ill patients: the multina-
tional AKI-EPI study. Intensive Care Med. 41, 1411–1423 (2015).2. Bellomo, R., Kellum, J. A. & Ronco, C. Acute kidney injury. Lancet 380, 756–766 (2012).3. Nielsen P.M. et. al. In situ lactate dehydrogenase activity – a novel renal cortical imaging bio-
marker of tubular injury? Am J Physiol Renal Physiol [Ahead of print](2016).
Figure 1: (left) Lactate/pyruvate ratio, RM two-way ANOVA, Time p>0.001, kidney p=0.01, in-teraction p=0.15. (Right) Lactate/bicarbonate ratio RM two-way ANOVA, Time p>0.945, kidney p=0.14, interaction p=0.02. CL denotes contralateral kidney and IR denotes the post ischemic kidney.

94 2nd International Scientific Symposium · FUNCTIONAL RENAL IMAGING
POSTER AbSTRACTS
P 25Evaluation of Fibrosis models using 1H T1 mapping and slow component T2 23Na.
Per Mose Nielsen1,* , Christian Mariager1, Marie Mølmer1, Christoffer Laustsen1, and Rikke Nør-regaard1
1Clinical institute*Presenting author
Background:Renal ischemia/reperfusion injury (IRI) makes up 47% of all cases of acute kidney injury (AKI), and up to 1.9% of all hospitalized patients develop AKI. AKI is an underestimated yet important factor leading to chronic kidney disease (CKD). Even after initial total recovery from AKI, some patients develop persistent deterioration of renal function. Therefore, the first aim of this study was to evaluate and establish an AKI model which can lead to fibrosis development. Current-ly, there is no clinical recognized non-invasive method to evaluate and quantify fibrosis in the kidney over time. The second aim is to establish a MRI sequence for fibrosis development.
1H T1 mapping has shown potential as a fibrosis marker, we therefore utilized a Look-Locker sequence for T1 mapping of fibrosis. Similar we wanted to investigate the utility of 23Na T2 mapping as fibrosis marker.
Methods:Rats were subjected to 40 min of bilateral renal ischemia and reperfusion period was either 7 (200g n=6), 14 (250g n=5) or 21 days (310g n=5). As positive control 6 animals were sub-jected to unilateral ureteral obstruction (UUO). A group of 6 animals received sham surgery. The experiments were performed in a 9.4T MR system (Agilent) equipped with a dual tuned 23Na/1H volume rat coil. A 1H T2‐weighted Fast Spin Echo coronal and axial scan was acquired for an anatomical 1H scout. For T1-measurements, a single-slice segmented Look–Locker se-quence with gradient-echo readout was used to acquire T1-weighted data. A dynamic con-trast-enhanced (DCE) T2*-weighted sequence was performed using an axial 1H gradient-echo sequence, covering both kidneys in 1 slice. A single bolus of 50 μL of Dotarem was adminis-tered. Transport rate (Kcl) was calculated using the Baumann-Rudin (BR) model from cortex to inner medulla. We performed a 2D 23Na sodium chemical shift imaging (CSI) sequence for T2* 23Na acquisition. After MRI scan sessions, kidneys, urine and plasma were stored for further biochemical analyses.
Results and Discussion:Interestingly, we found an early elevation in fibrosis markers (fibronectin and αSMA) after 7 days of reperfusion. After 21 days both fibronectin and αSMA protein levels were nearly equal to sham levels (figure 1). This trend was also observed at the mRNA expression of fibronectin and αSMA. We do currently not know the exact reason to this early elevation, but histological examinations will also be performed on tissue slices for further investigation. 1H T1 and 23Na T2 initially showed no correlation to fibrosis (figure 2). We speculated this was caused by the very different pathological conditions with high variation in water content on the different models. By

Berlin, October 11 – 13, 2017 · MDC.C – MAX DELBRÜCK COMMUNICATIONS CENTER 95
POSTER AbSTRACTS
normalizing the cortex/medulla ratio to water transport, we found a correlation between fibrosis and the MR scans.
Conclusion:In conclusion, our data showed highest expression of the fibrosis markers fibronectin and αSMA at 7 days after IRI which then drops to sham levels after 21 days. Fibrosis in UUO was highest after 7 days, as was expected. Uncorrected 1H T1 and 23Na T2 showed no correlation with fibrosis. Normalizing 1H T1 and 23Na T2 to the transport constant Kcl calculated using the BR-model from DCE-MRI, gave results similar to the fibrosis markers fibronectin and αSMA. Taken together, there is still a lot of investigation needed to establish a good CKD IRI model, and to establish a MRI sequence for fibrosis development.
Figure 1: (left) Protein levels of Fibronectin, normalized to total protein in sample. 7UUO p=0.005. (Right) Protein levels of αSMA, normalized to total protein in sample. 7UUO p=0.03
Figure 2: (left) Transport rate (Kcl) normalized to the 23Na T2 ratios of cortex and medulla. 7IR p=0.04, 5UUO p<0.001, 7UUO p<0.001. (Right) Transport rate (Kcl) normalized to the 1H T1 ratios of cortex and medulla. 5UUO p<0.001, 7UUO p<0.001.
Figure 1
Figure 2

96 2nd International Scientific Symposium · FUNCTIONAL RENAL IMAGING
POSTER AbSTRACTS
P 26Diffusion-Weighted Split-Echo RARE Imaging Free Of Geometric Distortion for Renal MRI at Ultrahigh Fields
João Periquito1,* , Katharina Paul1, Till Huelnhagen1, Yiyi Ji1, Min-Chi Ku1, Kathleen Cantow2, Erdmann Seeliger2, Bert Flemming2, Dirk Grosenick3, Andreas Pohlmann1, and Thoralf Niendorf1
1Max Delbrueck Center for Molecular Medicine, Berlin, Germany2Institut für Vegetative Physiologie, Charité – Universitätsmedizin Berlin, Berlin, Germany3Physikalisch-Tecnische Bundesanstalt (PTB), Berlin, Germany*Presenting author
IntroductionThe imbalance between oxygen demand and oxygen supply is believed to be a cause of several kidney diseases. Blood oxygenation sensitized MRI (T2*mapping) can non-invasively provide information about changes in renal oxygenation. Yet, previous experiments combining non-in-vasive MRI and invasive physiological measurements of the kidney obtained under different (patho)physiological conditions showed that T2* does not accurately represent renal tissue ox-ygenation1,2. Confounding factors such as tubular volume fraction should be taken in account for the interpretation of renal T2* mapping and for a reliable information about renal tissue oxy-genation.Diffusion-weighted imaging (DWI) provides a non-invasive method for in-vivo evaluation of tis-sue water mobility. Water mobility can serve to probe for microscopic tissue alterations. DWI holds the promise to measure relative changes in tubular volume fraction. Most DWI studies employ Dw-SE EPI or Dw-Spin Echo pulse sequences. EPI techniques are sensitive to mag-netic field inhomogeneities resulting in geometric distortions which are pronounced at ultrahigh magnetic fields, while Spin-Echo approaches result in longer acquisition time. To address this issue we propose a diffusion-weighted split-echo Rapid Acquisition Relaxation Enhancement (RARE) variant for DWI of the rat kidney free of geometric distortion3,4,5.
MethodsA diffusion phantom was built using a 50ml falcon tube filled with a 5% solution of agarose and three substances with known diffusion properties: sunflower oil, de-ionized water and ac-etone. Phantom experiments were performed to validate b-value and apparent diffusion coef-ficient (ADC) map calculation by comparing the experimental data with the literature. Ex-vivo experiments using a perfused rat kidney embedded in agarose and in-vivo experiments with an adult female dark Agouti rat with respiration triggering were performed at a 9.4 Tesla small animal scanner (Bruker Biospec, Ettlingen, Germany). Data was reconstructed offline using cus-tom-made MATLAB code. B-values used for ADC validation were: 0, 200, 400, 600 and 800 s/mm2. Geometric distortions between Dw-SE EPI and Dw Split-RARE were compared and quantified by a center gravity analysis using Dw-Spin Echo image as a reference6.
ResultsFigure 1.a shows phantom DWI images obtained, ranging from b=0 s/mm2 to b=800 s/mm2 Figure 1.b shows the corresponding ADC map. Found ADC values were 0.087, 2.180 and

Berlin, October 11 – 13, 2017 · MDC.C – MAX DELBRÜCK COMMUNICATIONS CENTER 97
POSTER AbSTRACTS
4.700s/mm2 for sunflower oil, water and acetone respectively. Figure 2 compares high res-olution images using Dw-Spin Echo, Dw-SE EPI and Dw Split-RARE in an axial view of the diffusion phantom, in a coronal view of an ex-vivo rat kidney and a coronal view of rat abdomen in-vivo. Figure 3 compares the geometric distortions between Dw-SE EPI and Dw Split-RARE using Dw-Spin Echo image as a reference. Center of gravity analysis revealed a displacement of the center of gravity in pixels with respect to the Dw-Spin Echo reference of (1.09 ± 0.45) for Dw Split-RARE, (1.82 ± 0.61) for Dw-SE EPI in the phantom and (0.37) for Dw Split-RARE and (13.77) for Dw-SE EPI in ex-vivo.
Discussion and ConclusionDiffusion-weighting was successfully implemented in RARE. ADC measurements in a diffusion phantom were in line with literature values7,8. Dw-SE EPI shows more geometric distortions than Dw Split-RARE in phantom and ex-vivo by having more displaced pixels. Unlike Dw-SE EPI, Dw Split-RARE provided high anatomic fidelity. In in-vivo experiments Dw Split-RARE outperformed Dw-SE EPI by showing both kidneys with no geometric distortions and Dw-Spin Echo by being showing to be less prone to motion artifacts due to shorter scan time. To conclude, this study demonstrates the feasibility of Dw Split-RARE at ultrahigh fields for renal imaging. Future in-vi-vo experiments are needed to evaluate the performance of this approach for the detection of changes in the tubular volume fraction.
References[1] Pohlmann, Acta Physiologica 2013; [2] Pohlmann et al. Invest. Radiol. 2014; [3] Hennig J, Magn Reson Med 1986; [4] Norris DG, Magn Reson Med, 1992; [5] Schick F, Magn Reson Med,1997 ; [6] Paul K, Investigative radiology 2015 [7] Landolt, Zahlenwert und Funktionen aus Physik, Chemie und Technik, 1969; [8] Deoni, Magn Reson Med, 2004
Figure 1: (a) Axial-view of the difusion phantom with diferent difusion-weighting (b=0, b=200, b=400, b=800 s/mm ) and corre-sponding (b) ADC map.

98 2nd International Scientific Symposium · FUNCTIONAL RENAL IMAGING
POSTER AbSTRACTS
Figure 2: High-resolution images using Dw-Spin Echo, Dw-SE EPI and Dw Split-RARE displaying the diffusion phantom, an ex-vivo rat kidney and a coronal-view of a rat abdomen

Berlin, October 11 – 13, 2017 · MDC.C – MAX DELBRÜCK COMMUNICATIONS CENTER 99
POSTER AbSTRACTS
P 27A pilot, multi-vendor comparison of multi-echo gradient-echo acquisitions for BOLD imaging in the kidney
Pim Pullens1,* , and Hubert Raeymaekers1
1University Hospital Brussels, Brussels, BE*Presenting author
IntroductionBOLD MRI may serve as an indicator of blood oxygenation in the kidney [1], [2] and could potentially be used as a biomarker in several kidney diseases. To be effective as a quantitative imaging biomarker, BOLD MRI must be an objective measure, independent of the MRI scanner model. In this study we have compared BOLD imaging of the kidney by assessing R2* values in 12 concentric layers in the kidney. R2* is measured using a multi-echo gradient echo sequence on three MRI scanners from different vendors, by keeping as many parameters as possible constant between systems.
MethodsMRI acquisition A healthy volunteer with no history of kidney disease was scanned at a 3T GE 750W DV25.1 R02, 3T Siemens Skyra VE11C and 3T Philips Achieva R5.3, using a ven-dor-specific implementation of a multi-echo gradient-echo sequence. The sequence parame-ters were based on the protocol used in [3]. After setting up the protocols on each scanner, the common denominator across all three vendors was determined, see Table 1. Resolution, TE and TR are the same, but bandwidth is not, because bandwidth cannot be chosen freely on the different systems. Scans were obtained within one hour, without eating or drinking in between scan sessions. Images acquired during breath hold. Image processing All images were convert-ed to Nifti using mrconvert from the MRtrix3 package [4]. Background noise standard deviation was calculated as with the mean noise signal in the kidney over all TEs, and L the number of receive coil channels [5]. Parameters for NLM filtering: search window 11x11, similarity window 5x5, h=1.5 [5]. R2* estimation using non-linear Levenberg-Marquardt estimation of the squared signal to a single exponential model [5]. Left and right kidney were segmented in FSLview. R2* curves were created by taking the mean R2* across 12 layers in the kidney using the 12-layer concentric object method [1], [3], implemented in Matlab. 95% confidence intervals (CI) were calculated as , with the R2* standard deviation and n the number of samples in each concentric layer.
ResultsFig 1 shows R2* maps on the three vendors. Fig 2 shows an example of a R2* map and the concentric layers in the kidney. For each layer, R2* mean and confidence interval for different scanners is shown in figure 2. In the outer layers of the kidney , R2* values between the three scanners are in the same range, but deeper layers show large variations. R2* values for the left and right kidney are similar for GE and Philips, while values for the Siemens scanner are higher, probably because of an artefact in the images. The position of the kidney is not equal between
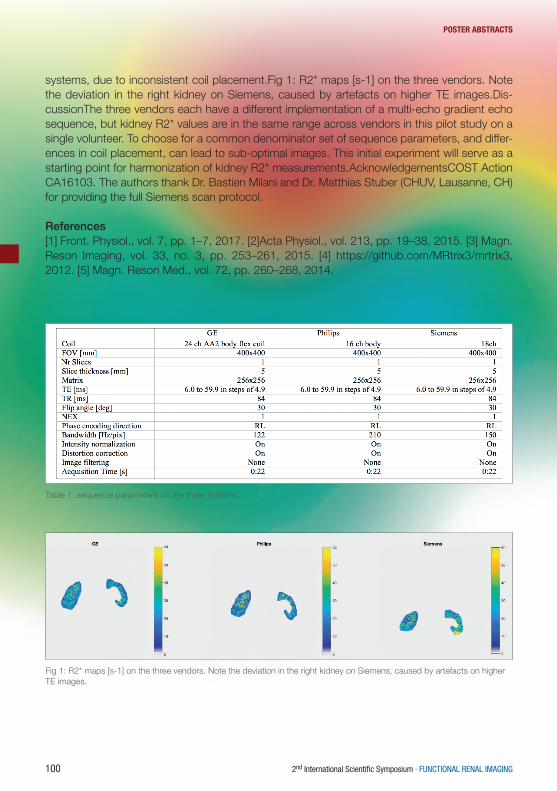
100 2nd International Scientific Symposium · FUNCTIONAL RENAL IMAGING
POSTER AbSTRACTS
systems, due to inconsistent coil placement.Fig 1: R2* maps [s-1] on the three vendors. Note the deviation in the right kidney on Siemens, caused by artefacts on higher TE images.Dis-cussionThe three vendors each have a different implementation of a multi-echo gradient echo sequence, but kidney R2* values are in the same range across vendors in this pilot study on a single volunteer. To choose for a common denominator set of sequence parameters, and differ-ences in coil placement, can lead to sub-optimal images. This initial experiment will serve as a starting point for harmonization of kidney R2* measurements.AcknowledgementsCOST Action CA16103. The authors thank Dr. Bastien Milani and Dr. Matthias Stuber (CHUV, Lausanne, CH) for providing the full Siemens scan protocol.
References[1] Front. Physiol., vol. 7, pp. 1–7, 2017. [2]Acta Physiol., vol. 213, pp. 19–38, 2015. [3] Magn. Reson Imaging, vol. 33, no. 3, pp. 253–261, 2015. [4] https://github.com/MRtrix3/mrtrix3, 2012. [5] Magn. Reson Med., vol. 72, pp. 260–268, 2014.
Table 1: sequence parameters on the three systems.
Fig 1: R2* maps [s-1] on the three vendors. Note the deviation in the right kidney on Siemens, caused by artefacts on higher TE images.

Berlin, October 11 – 13, 2017 · MDC.C – MAX DELBRÜCK COMMUNICATIONS CENTER 101
POSTER AbSTRACTS
Fig 2: Left panel: R2* map and concentric layers. Right panel: Right and left kidney R2* values measured on different systems.

102 2nd International Scientific Symposium · FUNCTIONAL RENAL IMAGING
POSTER AbSTRACTS
P 28The renal effect of anesthesia on the functional and metabolic phenotype in rats
Haiyun Qi1,* , Christian Østergaard Mariager1, Jakob Lindhard1, Per Mose Nielsen1, Hans Stødkilde-Jørgensen1, and Christoffer Laustsen1
1MR Research Centre, Department of Clinical Medicine, Aarhus University*Presenting author
PurposeTo investigate the renal functional and metabolic consequences of three typical rodent anes-thetics used in pre-clinical MRI: sevoflurane, inactin and the so called rodent cocktail, as well as the hemodynamic and physiological parameters.
MethodsEighteen 200g ten-week old female Wistar rats were anesthetized with sevoflurane, inactin or rodent cocktail (n=6 for each group). In the sevoflurane group, rats were anesthesized in a gas-chamber using 7-8 % sevoflurane in 2 l/min air, then maintained with 2.5 % sevoflurane in 2 l/min air through spontaneous respiration. In the inactin group, rats were anesthetized by sub-cutaneous injection of inactin solution with 120 mg per kg body weight. In the rodent cocktail anesthesia group, each rat was anesthetized with 0.2 ml rodent cocktail (1.25 mg/ml midazol-am, 2.5 mg/ml fluanisone and 0.079 mg/ml fentanyl citrate) per 100g body weight by subcuta-neous injection and administration of ½ of the induction volume every 30 min after anesthesia induction. Adequate depth of anesthesia was determined by the reaction to pedal withdrawal reflex. A 0.4mm catheter was inserted into the tail vein for administration of hyperpolarized [1-13C] pyruvate. Temperature, oxygen saturation and respiration rate were monitored throughout the experiment. After an equilibration period of about 45-60 min anesthesia, the hyperpolarized magnetic resonance (MR) examinations were performed in a 3.0 T clinical MR system (GE healthcare) equipped with a dual tuned 13C/1H volume rat coil (GE healthcare, Brøndby, DK). Pa-rameters were as follows: Flip angle=10º, 11 IDEAL echoes and one initial spectrum per IDEAL encoding, TR/TE/‐TE=100 ms / 0.9 ms / 0.9 ms, FOV=80 x 80 mm2, 5 x 5 mm real resolution and an axial oblique slice thickness of 15 mm covering both kidneys. Dynamic contrast-en-hanced (DCE) MRI using gadolinium was applied for measuring renal glomerular filtration rate and renal plasma flow afterwards. After finishing the MR scanning protocol, 1 ml arterial blood collected from the aortic bifurcation was analyzed immediately with a ABL-90 blood gas analyz-er (Radiometer Medical ApS, Brønshøj, DK).
ResultsA similar body weight and kidney weight were observed between the three groups, where as the rats receiving sevoflorane or rodent cocktail had higher blood glucose level than rats receiv-ing inactin (p<0.005) (Fig. 1a,b). Arterial lactate concentration in the rodent cocktail group was higher than in the sevoflurane and inactin groups (Fig. 1c). A statistical significant renal increase of 13C-lactate / 13C-pyruvate ratio (p=0.009) was observed in kidneys of rats under rodent cock-

Berlin, October 11 – 13, 2017 · MDC.C – MAX DELBRÜCK COMMUNICATIONS CENTER 103
POSTER AbSTRACTS
tail anesthesia (Fig. 2a). DCE functional MRI showed rats with rodent cocktail anesthesia had lower plasma flow in renal cortex (p=0.003) (Fig. 3b).
Discussion and conclusionThis study demonstrates different renal metabolic and functional changes under three different anesthetics, using hyperpolarized MR in rats. Inactin was found to affect the renal function and metabolic status to a lesser degree than the sevoflurane and in particular the rodent cocktail mix.The rodent cocktail has previously been demonstrated to impact myocardial function and met-abolic status in rodents1. Sevoflurane anesthesia is particularly easy to induce and maintain during the whole anesthesia procedure and as such represents a good alternate to inactin (endpoint only anesthetic), despite the fact that sevoflurane alters the glucose intolerance2
References1. Ter Horst EN, Krijnen PAJ, Flecknell P, et al. Lab Anim. 2017 Jan2. Kitamura T, Ogawa M, Kawamura G, et al. 2009 Nov;109(5):1479-85.
Figure legends:Fig. 1. Blood glucose and arterial lactate concentration in different anesthetic groups. Both peripheral capillary and artery blood glucose was higher in the sevoflorane and rodent cocktail groups than in the inactin group. Arterial lactate concentration in the rodent cocktail group was higher than in the sevoflurane and inactin groups.Fig. 2. The renal metabolism pathways in rats receiving different anesthetics. Rats receiving ro-dent cocktail had higher renal lactate-to-pyruvate ratio than rats receiving sevoflurane or inactin.Fig. 3. The renal function in rats receiving different anesthetics. Renal cortex plasma flow was lower in rats with rodent cocktail than in rats with sevoflurane or inactin anesthesia.
Fig. 1. Blood glucose and arterial lactate concentration in different anesthetic groups.

104 2nd International Scientific Symposium · FUNCTIONAL RENAL IMAGING
POSTER AbSTRACTS
Fig. 3. The renal function in rats receiving different anesthetics.
Fig. 2. The renal metabolism pathways in rats receiving different anesthetics.

Berlin, October 11 – 13, 2017 · MDC.C – MAX DELBRÜCK COMMUNICATIONS CENTER 105
POSTER AbSTRACTS
P 29Molecular DCE MRI with high and low temporal resolution, using bimodal AGulX con-trast agents and multiparametric MRI in a murine UUO model.
Gregory Ramniceanu1, François Lux2, Lucie Sancey2, Olivier Tillement2, Catherine Jager-schmidt3, Philippe Clément-Lacroix3, Daniel Sherman1, Nathalie Mignet1, and Bich-Thuy Doan1
1Chimie ParisTech, Unité de Technologies Chimiques et Biologiques pour la Santé (UTCBS),Par-is, France CNRS, UMR 8258, INSERM U 1022,2Université de Lyon, Institut Lumière Matière, UMR5306 F- 69622 Villeurbanne CEDEX, France3Galapagos, F-93230 Romainville, France
PurposeDynamic contrast enhanced DCE MRI kinetics allow to follow quantitatively the blood flow or perfusion of organs and tissues of interest, using signal enhancement which is correlated to the concentration of the tracer passing through.The judicious choice of a contrast agent in relationship with its behavior in the bloodstream and the tissue is also important to provide quantitative diagnostic perfusion parameters. In order to follow the different behaviors of the contrast agents in the body organs, an adapted temporal resolution and total acquisition time has to be adjusted according to the physiological specifics of tissues and to the physico-chemical properties of the contrast agents. In our present work, we developed a DCE and image processing method applied to the diagnosis of a kidney dys-function in a mouse model of UUO Unilateral Ureteral Obstruction.
Materials and MethodsWe propose a molecular MR imaging method by Dynamic Contrast Enhanced MRI at 7T [2] and multiparametric MRI (T2, T1 weighted and ADC maps) for the diagnosis of a renal dysfunction in mice. The developed method is adapted to the imaging probe of the multimodal intermediate size AGulX nanoparticles [1], consisting of a functionalized polyorganosiloxane matrix with Gd DOTA chelators and chromophore Cy5.5. The imaging method is based on a dynamic acquisi-tion with high and low temporal resolution, providing signal enhancement curves and numerical analysis with 3TP 3 Time Point type method [3]. Results were compared with Mann-Whitney U test. A histological study was performed by Laser Induced Breakdown Spectroscopy LIBS, HE staining and confocal microscopy.
ResultsClearly, significant signal decrease was observed between sham and contralateral as negative control compared with UUO pathological mice kidneys. The dynamic AguIX MRI data comput-ed with our developed 3TP method were compared to DCE profiles with classical commercial Gd complex contrast agent DOTAREM. Differences of 3TP parameters (respectively from p= 0,0048 to p=0.008, and from p=0,0009 to 0.0012) in the cortex were measured between sham and UUO DCE 3TP profiles. Histological study confirmed and rationalized the results in vivo from the impact of internalization of the probes into the tubules, which were specifically affected by the pathology.

106 2nd International Scientific Symposium · FUNCTIONAL RENAL IMAGING
POSTER AbSTRACTS
ConclusionHigh temporal resolution MRI DCE method combined with AguIX contrast agent allowed to di-agnose the renal tubular dysfunction in a mouse model of UUO pathology, allowing an improved kidney pathology diagnosis to be performed.
References[1] F.Lux F. , et al. Ultrasmall Rigid Particles as Multimodal Probes for Medical Applications An-gewAngew. Chem. Int. Ed. 2011, 50, 12299 –12303[2] Tofts PS. Modeling tracer kinetics in dynamic Gd-DTPA MR imaging. J Magn Reson Imaging 1997;7:91–101.[3] Furman-Haran E, et al. Critical role of spatial resolution in dynamic contrast-enhanced breast MRI. J Magn Reson Imaging. 2001;13(6):862–7
Figure 1 Dynamic profile of the DCE MRI images of the controlateral (green) /UUO (red) cortex kidney with DOTAREM and AguIX contrast agent.
Figure 2 Histological images of the AguIX Gd contrast agent in the contralateral and UUO kidney in mice models. Dilated tubules and depots in tubular regions

Berlin, October 11 – 13, 2017 · MDC.C – MAX DELBRÜCK COMMUNICATIONS CENTER 107
POSTER AbSTRACTS
P 30Reference method for measurement of total renal function – estimated versus mea-sured GFR
Martin Šámal1,* , Václav Ptáčník1, Daniela Skibová1, Hana Jiskrová1, and Adam Čepa1
1First Faculty of Medicine, Charles University and the General University Hospital in Prague*Presenting author
Introduction: Validation of the new methods for measurement of renal function and functional renal imaging requires reference standards of renal function. Inulin clearance measured during continuous i.v. infusion became obsolete due to its time and operational expenses. It was substituted by the clearance of radionuclide tracers 51Cr-EDTA and 99mTc-DTPA and that of non-radioactive x-ray contrast agents as iothalamate or iohexol, excreted by glomerular filtra-tion. All these methods provide accurate values of glomerular filtration rate (GFR) but require manipulation of small amounts of radioactivity, relatively complex analysis of tiny amounts of iodine and they are relatively expensive. That is why most clinicians rely on traditional method of endogeneous creatinine clearance (that requires potentially inaccurate long term urine collec-tion) and on prediction equations estimating GFR from plasma creatinine measured in a single blood sample. For their low cost and simplicity, prediction equations (Cockcroft-Gault, MDRD, CKD-EPI, etc) became popular also as reference methods in validating the new approaches to the assessment of renal function.
Aim: The aim of our study was to compare GFR measured by creatinine clearance and estimat-ed by prediction equations with GFR measured by 51Cr-EDTA, and to analyze conditions under which measured GFR can be substituted by estimated GFR.
Methods: In 49 adult patients with creatinine clearance 3 – 153 ml/min/1.73m2, serum creat-inine and 51Cr-EDTA clearance were measured within 1 day median interval between labora-tory and radionuclide examinations. Reference 51Cr-EDTA GFR was calculated from 2 blood samples obtained 2 and 4 hours post injection. Mean absolute and relative errors of prediction (MAE, MRE) were calculated for GFR measured by serum creatinine and creatinine clearance and estimated by several prediction equations (Cockcroft-Gault, MDRD, CKD-EPI). Diagnostic accuracy to identify the patients with GFR<30 ml/min and GFR<60 ml/min was assessed by ROC curves.
Results: In the prediction of reference 51Cr-EDTA clearance, reciprocal serum creatinine per-formed with MAE (MRE) 11.4 ml/min (35 %), creatinine clearance 7.3 ml/min (27 %), and predic-tion equations 8.9 – 9.9 ml/min (28 – 31 %). Performance of all methods was better in the GFR range below 30 ml/min (MAE 3.4 – 3.8 ml/min, MRE 22 – 24 %) than above 30 ml/min (MAE 9.2 – 18.6 ml/min, MRE 16 – 31 %). In contrast to their poor prediction accuracy, diagnostic accuracy of prediction equations indicating GFR values below certain level (here 30 and 60 ml/min) was excellent. GFR below 30 ml/min was indicated with diagnostic accuracy of 86 – 92 % (sensitivity 80 – 93 %, specificity 89 – 100 %, positive and negative predictive values 93 – 100

108 2nd International Scientific Symposium · FUNCTIONAL RENAL IMAGING
POSTER AbSTRACTS
% and 76 – 89 %, respectively). GFR below 60 ml/min was indicated with diagnostic accuracy accuracy of 94 – 98% (sensitivity 100 %, specificity 63 – 88 %, positive and negative predictive values 93 – 98 % and 100 %, respectively).
Discussion: Our findings confirm similar results in the literature reporting poor prediction but high diagnostic accuracy of prediction equations, though the fact itself has not always been explicitly emphasized and analyzed (Froissart et al 2005, Poggio et al 2005, Nyman et al 2009, Craig et al 2011, etc). Accuracy of categorical estimates (as for chronic kidney disease staging) is better than that of point estimates but not as good as accuracy of binary estimates.
Conclusions: In the studies focused on point estimation of individual patient GFR and on cat-egorical estimation of individual CKD stages, performance of prediction equations is poor. The only acceptable reference in such studies is GFR measured by radionuclide tracers or iodine x-ray contrast agents. If they are not available, creatinine clearance can be accepted with cau-tion (it outperforms prediction equations but not radionuclide methods). GFR estimates ob-tained by prediction equations should only be used to indicate whether the patient’s GFR is below or above a specified value. For such a binary estimation, prediction equations perform well with high diagnostic accuracy.

Berlin, October 11 – 13, 2017 · MDC.C – MAX DELBRÜCK COMMUNICATIONS CENTER 109
POSTER AbSTRACTS
P 31Role of Image and Clinical-based Biomarkers in Renal Transplant Assessment
Mohamed Shehata1, Mohamed Abou El-Ghar2,* , and Ayman El-Baz1
1University of Louisville, Kentucky, USA2Urology & Nephrology center, Mansoura University, Egypt*Presenting author
Background:Accurate assessment of renal transplant function (RTF) is of great importance for graft survival. Although transplantation can improve a patient’s wellbeing, there is a potential post-transplan-tation risk of kidney dysfunction that, if not treated in a timely manner, can lead to the loss of the entire graft, and even patient’s death. Thus, accurate assessment of RTF is crucial for the identification of proper treatment. Traditional evaluation of RTF is based on blood tests and urine sampling, e.g., serum plasma creatinine (SPCr) and creatinine clearance (CrCl). How-ever, a significant change in creatinine levels is only observable after 60% loss of the kidney function due to the low sensitivity of indices. Biopsy remains the gold standard, yet only as the last resort because of its invasiveness, high cost, and potential morbidity. Therefore, imaging tests are favorable because of the noninvasive nature and the ability to provide information on each kidney separately. Two of the most frequently used imaging techniques, scintigraphy (SC) and computed tomography (CT) preferred for their good functional information. However, SC does not give good spatial resolution and exposes patients to a small dose of radioactivity due to its reliance on the absolute gamma camera and CT uses nephrotoxic contrast agents and exposes patients to radiation. Thus, diffusion-weighted magnetic resonance imaging (DW-MRI) has emerged as an imaging modality as it does not involve any radiation exposure or the use of contrast agents. Here, we introduce a novel computer aided diagnostic (CAD) system for the assessment of renal transplant status using 4D DW-MRI data (3D + b-value) integrated with laboratory-based biomarkers.
Method:The presented fully automated CAD system, shown in Figure 1, integrates both clinical- (e.g., SPCr and CrCl) and image-based biomarkers. To extract the latter, our CAD system aligns the DW-MRI data using a 3D B-splines based registration to handle motion effects; Then, segments kidney from surrounding abdominal structures using level-sets; After that, estimates apparent diffusion coefficients (ADCs) to construct the discriminatory features (i.e., CDFs–cu-mulative distribution functions) for transplant status classification; Finally, both image and clinical biomarkers are fused together to assess transplant status by cascading two-stages of stacked auto-encoders. The first stage distinguishes non-rejection (NR) from abnormal (AB) transplants and the second stage classifies these AB transplants as early rejection (ER) or other kidney diseases (OD) (e.g., tubular inflammation, acute tubular injury, graft amyloidosis, etc.)
Results:Table 1. Diagnostic accuracy (ACC), sensitivity (SENS), and specificity (SPEC) for our CAD system using clinical and image-driven biomarkers.

110 2nd International Scientific Symposium · FUNCTIONAL RENAL IMAGING
POSTER AbSTRACTS
DW-MRI data sets have been collected from 58 biopsy proven-cohort. All subjects, NR (16), ER (37), and OD (5), as a part of routine medical care after transplantation, were assessed with serum creatinine laboratory values. Coronal DW-MR images were acquired before any biopsy procedure using a 1.5 T scanner (TR/TE, 8000/61.2; bandwidth, 142 kHz; matrix, 1.25×1.25 mm2; section thickness, 4 mm; intersection gap, 0 mm; FOV, 36 cm; signals acquired, 7) at different b-values of (b0, b50, b100 to b1000 with a step of 100 s/mm2). Approximately 50 sections have been obtained to cover the whole kidney. As shown in Table 1, using leave-one-sub-ject-out experiments on a cohort of 58 subjects, our CAD system achieved a 95% accuracy (sensitivity = 95% and specificity = 94%) between NR and AB transplants, and a 95% accuracy between ER and OD Transplants.
Conclusion:In total, we propose a CAD system for early assessment of renal transplant function from 4D DW-MRI data that combines automatic segmentation, estimation of diffusion parameters (ADCs), and a SNCAE classification of the transplant status using image- and clinical-biomark-ers as integral status descriptions. Our system showed high diagnostic accuracy to distinguish NR from AB transplants as well as to distinguish ER from OD, which hold promise of the pro-posed CAD system as a reliable, inexpensive, and noninvasive diagnostic tool.
Fig. 1. Block diagram of the proposed CAD system for renal function assessment
Table 1. Diagnostic accuracy (ACC), sensitivity (SENS), and specificity (SPEC) for our CAD system using clinical and im-age-driven biomarkers.

Berlin, October 11 – 13, 2017 · MDC.C – MAX DELBRÜCK COMMUNICATIONS CENTER 111
POSTER AbSTRACTS
P 32Multiparametric kidney magnetic resonance imaging to identify novel markers of dis-ease progression in Autosomal Dominant Polycystic Kidney Disease
Roslyn Simms1, Peter Wright2, Peter Metherall3, Wendy Tindale2, and Albert Ong1,*
1University of Sheffield, Sheffield2Sheffield Teaching Hospitals NHS Foundation Trust, Sheffield3Sheffield Teaching Hospitals NHS Foundation Trust, Sheffield.*Presenting author
BackgroundAutosomal dominant polycystic kidney disease (ADPKD) is the most common renal genetic disease and the fourth leading cause of kidney failure (10%) worldwide. It is characterised by the progressive development and growth of kidney cysts which eventually destroy kidney function.The use of serum creatinine to calculate estimated glomerular filtration rate (eGFR) is the stan-dard method of monitoring disease progression. However, eGFR is typically stable for decades due to compensatory glomerular hyperfiltration. More sensitive methods are therefore needed to identify patients with early disease who are at greatest risk of rapid disease progression for consideration of approved treatments to preserve kidney function.Total kidney volume (TKV) measured from magnetic resonance imaging (MRI) has been ap-proved by the EMA and FDA as a prognostic biomarker in clinical trials involving patients with ADPKD. However TKV is less reliable in patients with “early” (eGFR >90ml/min) ADPKD when TKV is lower. In this study, we assessed the feasibility of using (blood oxygenation level-depen-dent) BOLD-MRI, a multiparametric technique which provides a surrogate measure of tissue oxygenation, to identify functional changes in patients with early ADPKD.
MethodsHealthy volunteers (HV) were recruited to develop the multiparametric (no contrast) MRI proto-col and to provide comparative reference standards. Patients with ADPKD (PKD) were 18 years of age and older and had an eGFR >60ml/min. Participation involved a medical history, height, blood pressure, bloods for biochemistry profile, urinalysis and a 30 minute abdominal 3T MRI (Philips Ingenia). The MR sequence (indication) protocol included: T1 and T2 (TKV) and T2* FFE breath hold sequences (BOLD, oxygenation). Regions of interest in 3 poles of the cortex and medulla of each kidney were analysed. Statistical analyses included student’s t-test and spear-man’s rank correlation coefficient using SPSS.
Results24PKD (18F, 6M) and 15HV (7F, 8M) were studied. 6PKD had eGFR>60ml/min and 18PKD had eGFR>90ml/min. There was no significant difference in age (mean, SD) between PKD (41.8±14.0yrs) and HV (40.8±10.2yrs) or gender, although there were more women with PKD. 54% of patients with PKD had hypertension, an early manifestation of ADPKD, compared to none of the HV. There was no significant difference in haemoglobin or haematocrit between PKD and HV. Height-adjusted TKV in PKD measured by manual segmentation ranged from

112 2nd International Scientific Symposium · FUNCTIONAL RENAL IMAGING
POSTER AbSTRACTS
202.3–1059.2ml. There was a significant increase (p<0.001) in the mean cortical R2* values in PKD (45.4±20.6Hz) compared to HV (29.2±12.8Hz), which suggest reduced oxygenation in the cortex of PKD. There was no significant difference in renal blood flow in the participants where it was available (8HV, 15PKD). The mean cortical R2* values correlated significantly with mean kidney length on ultrasound (r=0.572, p=0.004) in PKD.
ConclusionsOur results suggest that renal cortical oxygenation is reduced in patients with early ADPKD, a feature significantly associated with increased kidney size. This finding may reflect an early change in the ADPKD kidney and further evaluation in a larger cohort with additional acquired MR sequences is planned. If confirmed, this feature could form part of a prognostic MR sig-nature in early disease to stratify risk such that higher risk patients can benefit from earlier treatment.
Berlin, October 11 – 13, 2017 · MDC.C – MAX DELBRÜCK COMMUNICATIONS CENTER 113
POSTER AbSTRACTS
P 33Feasibility study of diffusion tensor imaging of the kidneys in freely breathing infants with pyelonephritis
Yvonne Simrén1,* , Kerstin M Lagerstrand1, Eira Stokland1, Per-Arne Svensson1, and Sverker Hansson1
1Institute of Clinical Sciences at Sahlgrenska Academy, University of Gothenburg*Presenting author
Background: Acute pyelonephritis is a common disease in infants. Invasive imaging methods, such as scintigraphy or contrast enhanced MR, is used to evaluate the renal involvement. Diffusion weighted imaging (DWI) has the potential to visualize pyelonephritic lesions in addi-tion to identifying significant underlying malformations (1-3). DWI in multiple direction, so called diffusion tensor imaging (DTI), may add new information about the renal microstructure that may improve the ability to detect and differentiate acute pyelonephritic lesions from chronic renal damage or dysplastic changes. Recent studies have shown the potential of the method as a valuable tool in the evaluation of renal pathology in older children (4), but no studies have assessed the feasibility of the method in infants with pyelonephritis.
Objective: To study the feasibility of DTI for detection and characterization of pyelonephritic lesions in non-sedated freely breathing infants.
Materials and Methods: 5 infants age 0-6 months with pyelonephritic lesions (2 infants with bilateral involvement) verified by scintigraphy, were scanned during free breathing without se-dation using DTI. Coronar SS-EPI was performed with a 1.5T scanner, TR=2000ms, TE=66ms, acceleration factor=2, b=0 and 700s/mm², NEX=1 with 24 diffusion directions. The pyelone-phritic lesions were identified on the b=700 images and the apparent diffusion coefficient (ADC) and fractional anisotropy (FA) were calculated for regions of interests inside the lesions as well as in normal adjacent renal tissue.
Results: For all infants, the pyelonephritic lesions were clearly delineated in the ADC maps but not in the FA maps. There was a significant difference between the lesions and the normal tissue for both the ADC values (1.21±0.18 and 1.45±0.05, p=0.018) and the FA values (0.19±0.02 and 0.28±0.03, p=0.018). Figure 1 and 2 shows images of a 1 month old infant with bilateral pyelonephritic lesions visualized on scintigraphy, DWI and DTI with quantitative measurements.
Conclusion: This study shows free breathing renal DTI in infants to be a feasible tool for non-in-vasive imaging of pyelonephritis in infants. The pyelonephritic lesions showed alterations in anisotropy confirmed by significant changes in FA values in addition to ADC map changes. This finding, which should be studied in a larger cohort, suggests that DTI in addition to lesion de-tection may provide information that can be used to characterize and differentiate renal lesions in infants.

114 2nd International Scientific Symposium · FUNCTIONAL RENAL IMAGING
POSTER AbSTRACTS
References
1. Lee CH, Yoo KH, Je BK, Kim IS, Kiefer B, Park YS, et al. Using intravoxel incoherent motion MR imaging to evaluate cortical defects in the first episode of upper urinary tract infections: preliminary results. Journal of magnetic resonance imaging : JMRI. 2014;40(3):545-51.
2. Vivier PH, Sallem A, Beurdeley M, Lim RP, Leroux J, Caudron J, et al. MRI and suspected acute pyelonephritis in children: comparison of diffusion-weighted imaging with gadolini-um-enhanced T1-weighted imaging. European radiology. 2014;24(1):19-25.
3. De Pascale A, Piccoli GB, Priola SM, Rognone D, Consiglio V, Garetto I, et al. Diffu-sion-weighted magnetic resonance imaging: new perspectives in the diagnostic pathway of non-complicated acute pyelonephritis. European radiology. 2013;23(11):3077-86.
4. Jaimes C, Darge K, Khrichenko D, Carson RH, Berman JI. Diffusion tensor imaging and tractography of the kidney in children: feasibility and preliminary experience. Pediatr Radiol. 2014;44(1):30-41.

Berlin, October 11 – 13, 2017 · MDC.C – MAX DELBRÜCK COMMUNICATIONS CENTER 115
POSTER AbSTRACTS

116 2nd International Scientific Symposium · FUNCTIONAL RENAL IMAGING
POSTER AbSTRACTS
P 34Measuring Renal Oxygenation in a Mouse Model of Volume-Dependent Hypertension using BOLD MRI.
Darah Wright1, Stephen Lin1, Ping-Chan Lin1, Chung-Shieh Wu1, Dan Zhang1, Andre Duer-inckx1, and Dexter L. Lee1,*
1Howard University*Presenting author
Purpose: Hypertension is closely associated with the progression of kidney damage and dysfunction. Tissue hypoxia in the hypertensive kidney contributes to the progression of kidney damage. Peroxisome proliferator activated receptor–α (PPAR-α) is a nuclear receptor that plays an im-portant role in reducing volume-dependent hypertension. Previous reports demonstrate that a slow pressor dose of Angiotensin II (Ang II) is a model of volume-dependent hypertension. The goal of this study was to determine the role of PPAR-a on renal oxygenation using blood oxygen level-dependent (BOLD) MRI in a model of volume-dependent hypertension.
Materials and Methods: Wild-type (WT) and PPAR-α knockout (KO) mice were imaged using a multiple gradient echo BOLD sequence (12 echoes from 3.2-54ms, TR=900ms) on a 9.4T MRI to measure functional changes in renal oxygenation. Imaging was performed during baseline, day 12 of Ang II (400 ng/kg/min), and 9 days after Ang II-treatment (recovery). T2* relaxation time was measured in the cortex and medulla of the kidney.
Results: Cortex T2* values were lower in KO vs WT during baseline (11.0 ± 1.1 ms vs 13.1 ± 1.5 ms), day 12 of Ang II (11.6 ±1.2 ms vs 16.2 ±1.5 ms) and 9 days after Ang II (12.5 ± 0.7 ms vs 15.2 ± 0.3 ms). Medulla T2* values were lower on day 12 of Ang II in KO (16.5 ± 2.5 ms) vs WT (20 ± 1.6 ms) mice. Medulla T2* values were similar between KO and WT mice during baseline and the recovery period. In KO and WT mice, cortex T2* values were lower than that of the medulla, indicative of different metabolic functions between the two tissues.
Conclusion: PPAR-α plays an important role in blood pressure regulation and renal oxygenation in the cortex and medulla of the kidney during Ang II-induced hypertension.
Clinical Relevance Statement: Hypertension is a risk factor for chronic kidney disease when untreated. BOLD MRI can aid in monitoring renal oxygenation changes during hypertension and determine therapeutic interven-tions in humans.

Berlin, October 11 – 13, 2017 · MDC.C – MAX DELBRÜCK COMMUNICATIONS CENTER 117
NOTES
NOTES

118 2nd International Scientific Symposium · FUNCTIONAL RENAL IMAGING
NOTES

Innovation with Integrity
3D Scan Planning
Optimized Workflow
ConvenientData Management
Complete Suite of Applicationsand ImagingMethods
Paravision6-ad-A4-to-A5.indd 1 5/28/2014 11:06:22 AM

FUNCTIONALRENAL IMAGING:Where Physiology, Nephrology, Radiology and Physics Meet
www.renal-imaging.org
MDC25
Supported by: