functional study of long noncoding rna h19 in muscle and liver
TRANSCRIPT

University of ConnecticutOpenCommons@UConn
Doctoral Dissertations University of Connecticut Graduate School
1-23-2018
Functional Study of Long Noncoding RNA H19 inMuscle and LiverNa ZhangUniversity of Connecticut - Storrs, [email protected]
Follow this and additional works at: https://opencommons.uconn.edu/dissertations
Recommended CitationZhang, Na, "Functional Study of Long Noncoding RNA H19 in Muscle and Liver" (2018). Doctoral Dissertations. 1705.https://opencommons.uconn.edu/dissertations/1705

Functional Study of Long Noncoding RNA H19 in Muscle
and Liver
Na Zhang, PhD
University of Connecticut, 2018
Abstract
The study in this thesis mainly focus on understanding the regulatory roles of
LncRNA H19 in the muscle and liver. In order to better understand the role of H19 in muscle
differentiation, we utilized RNA-seq to compare the differential gene expression between
control and H19 knockdown cells during C2C12 myoblast differentiation. This study can
lead us to identify candidate genes that are regulated by H19 during muscle differentiation.
We also found that H19 plays an important role in the liver through regulating hepatic
glucose production (HGP), which is a major contributor to hyperglycemia in type-2 diabetes
(T2D). Results from our study revealed a novel epigenetic mechanism utilized by LncRNA
H19 in regulating HGP in both normal and pathological conditions.

Functional Study of Long Noncoding RNA H19 in Muscle
and Liver
Na Zhang
B.S., Henan Unversity, 2009
M.S., Institute of Microbiology Chinese Academy of Sciences, 2012
A Dissertation
Submitted in Partial Fulfillment of the
Requirements for the Degree of
Doctor of Philosophy
at the
University of Connecticut
2018

ii
Copyright by
Na Zhang
2018

iii
APPROVAL PAGE
Doctor of Philosophy Dissertation
Functional Study of Long Noncoding RNA H19 in Muscle
and Liver
Presented by
Na Zhang, B.S., M.S.
Major Advisor
Gordon G. Carmichael
Associate Advisor
Stormy J. Chamberlain
Associate Advisor
Yuanhao James Li
Associate Advisor
Arthur Gunzl
University of Connecticut
2018

iv
ACKNOWLEDGMENTS
My graduate school study experience at University of Connecticut Health Center is
an extremely important part of my life. I have had many happy moments, but also
experienced a lot of challenges during this period of time. Fortunately, with the help and
support from people around me, I was able to overcome those challenges and finish this
journey. Therefore, I would like to acknowledge many people who have helped me along the
way.
First of all, I would like to express my sincere gratitude to my major advisor and
mentor, Dr. Gordon Carmichael. He is very open-minded and has encouraged me to work
on any project that I was interested in. He guided me to think independently and critically
and has always been very supportive. When I want to discuss with him about my project, he
would always be ready for a discussion and providing valuable suggestions. Thanks to
Gordon’s understanding and generosity, I was able to work on a collaborate project
between Gordon’ lab and Dr. Yingqun Huang’s lab at Yale School of Medicine, from which I
have gained additional precious research experiences. Other than being a wonderful
mentor, Gordon has also been a good friend. There were a lot of happy memories left from
our lab parties. I will always be grateful for the guidance, encouragement, support and
friendship that Gordon gives to me during my graduate study.
I would also like to express my deep gratitude to my external advisor, Dr. Yingqun
Huang from Yale school of medicine. Her passion for science and her creative thinking have
made it a great pleasure to work with her. She has given me a lot of helpful suggestions on
both technique issues and project hypothesis related problems. She has also patiently
helped me on improving my presentation skills. I am very grateful to have Dr. Yingqun
Huang as my additional advisor while I was working on my thesis project.

v
I would like to express my appreciation to my committee members Dr. Stormy J.
Chamberlain, Dr. Arthur Günzl and Dr. Yuanhao James Li who have provided many valuable
suggestions and constructive advices to me throughout my thesis work.
Gordon has attracted a lot of interesting and intelligent people to work with him. I
am very glad I have worked in his lab. I would like to express my thanks to the current and
past lab members, Kim Morris, Yinzhou Zhu, Ahmad Osman, Stephan Pirnie, Seth Garren,
Xiaoxiao Hong, Tulika Sharma, Yuvabharath Kondaveeti and Joseph Autuoro, who have
created a lovely working environment in Gordon’s lab. Special thanks to Yinzhou Zhu, who
has given me a lot of help on solving my sequencing data analysis related problems.
It was also very pleasant to work with the team in Dr. Yingqun Huang’s lab. I would
like to express my thanks to Tingting Geng, Ya Liu, Yuanyuan Shen, Zhangsheng Wang,
Tiefeng Cao, Ruling Zhang, Liyong Zhu. I would like to thank Tingting Geng and Ya Liu in
particular for their significant contributions to our collaborative project.
I would also like to thank Gerald I. Shulman and Joao Paulo Camporez from Yale
School of Medicine for their help on our hyperinsulinemic/euglycemic clamp studies.
I would like to express my special thanks to Dr. Michael Duff and Dr. Justin L. Cotney
for their intellectual help and useful discussion on my sequencing data analysis.
Finally, I would like to express my special gratitude to my mom, who has always
been supportive to me along my growing up, although sometimes at the cost of her own
happiness. Without her sustaining encouragement and strong support, I wouldn’t be able to
go through many tough times and achieve the goals in my life. I would also like to deeply
thank my husband who has been by my side in the last two and half years of my graduate
study. Without his company, love, understanding and support, I wouldn’t be able to
complete my thesis.

vi
TABLE OF CONTENTS
APPROVAL PAGE.........................................................................................................................iii ACKNOWLEDGMENTS...............................................................................................................iv TABLE OF CONTENTS................................................................................................................vi LIST OF FIGURES.........................................................................................................................x LIST OF TABLES..........................................................................................................................xii I. INTRODUCTION
A. Long Noncoding RNA...............................................................................................1
B. LncRNA H19...............................................................................................................2
C. Function of LncRNA H19.........................................................................................8
D. H19 Mechanism of Action.....................................................................................10
E. Thesis Objectives....................................................................................................13
II. ROLE OF H19 IN MUSCLE DIFFERENTIATION
A. Abstract.....................................................................................................................16
B. Background..............................................................................................................17
C. Material and Methods............................................................................................19
1. Materials.............................................................................................................19
2. Cell culture and transfection..........................................................................19
3. RNA-Seq library construction........................................................................20
4. RNA-Seq data analysis.....................................................................................21
5. RNA extraction and RT-qPCR........................................................................21
6. Western blot analysis......................................................................................21

vii
7. Immunofluorescence analysis......................................................................22
D. Results
1. Knockdown of H19 in differentiating C2C12 cells...................................24
2. RNA-Seq and data analysis............................................................................24
3. RNA-Seq results suggest that H19 negatively regulates muscle
differentiation...................................................................................................29
4. H19 knockdown leads to increased expression of muscle terminal
differentiation-specific genes........................................................................34
5. H19 knockdown induces precocious myotube formation......................34
E. Discussion.................................................................................................................39
III. ROLE OF H19 IN HEPATIC GLUCOSE PRODUCTION
A. Abstract.....................................................................................................................43
B. Background..............................................................................................................44
C. Material and Methods............................................................................................49
1. Materials.............................................................................................................49
2. Animals...............................................................................................................50
3. AAV production and in vivo AAV administration.....................................50
4. Pyruvate tolerance test (PTT) and glucose tolerance test (GTT)..........51
5. Hyperinsulinemic-euglycemic clamp studies............................................51
6. Cell culture and transfection..........................................................................52
7. Methyl-MiniSeq library construction...........................................................52
8. Methyl-MiniSeq sequence alignments and data analysis........................53

viii
9. RNA-seq and data analysis.............................................................................54
10. RNA extraction and RT-qPCR........................................................................55
11. Western blot analysis......................................................................................55
12. Glucose output assay.......................................................................................56
13. Quantitative Methylation-Specific PCR (QMSP) .......................................56
14. Statistical Analysis...........................................................................................57
D. Results
1. H19 knockdown reduces gluconeogenic gene expression and
glucose production...........................................................................................59 2. H19 regulates Hnf4a promoter methylation..............................................59
3. Fasting upregulates H19 and induces hypomethylation of Hnf4a........64
4. Glucagon upregulates H19.............................................................................67
5. H19 deletion mice exhibit enhanced insulin-mediated suppression of
HGP......................................................................................................................67
6. Liver-specific H19 overexpression augments HGP..................................79
7. H19 expression is chronically increased in the liver of glucose
intolerant mice..................................................................................................79
E. Discussion.................................................................................................................88
F. Author Contributions.............................................................................................90 IV. CONCLUSIONS AND FUTURE DIRECTIONS
1. Understanding the regulatory mechanisms of H19 in muscle
differentiation...................................................................................................91
ix
2. Exploring other regulatory mechanisms of H19 in hepatic glucose
production.........................................................................................................93
V. BIBLIOGRAPHY......................................................................................................................95

x
LIST OF FIGURES
1. Schematic representation of regulation at the imprinted Igf2-H19 locus....................3
2. Transcripts from the H19 locus........................................................................................6
3. Experimental procedure and results of H19 knockdown in differentiating C2C12 cells .......................................................................................................................25
4. Flow chart of RNA-Seq analysis strategy.......................................................................27
5. Genes of Hypertrophic Cardiomyopathy (HCM) pathway that are up-regulated
in siH19 versus siCon.......................................................................................................32
6. H19 knockdown leads to increase of RNA and protein expression of MyoG and MyHC.................................................................................................................................35
7. Precocious myotube formation induced by H19 knockdown......................................37
8. Schematic representation of H19/SAHH - mediated regulation of gene
methylation.......................................................................................................................47
9. Effects of H19 knockdown on glucose production and gluconeogenic gene expression in HepG2 cells................................................................................................60
10. Sequences of DMRs in the conserved promoter region of human and mouse
Hnf4 .................................................................................................................................6
2
11. Regulation of Hnf4 promoter methylation via the H19/SAHH
pathway.........................65
12. Effects of fasting on H19 and gluconeogenic gene expression.........................................68
13. Glucagon up-regulates H19 via cAMP/PKA pathway......................................................70
14. H19 KO mice show altered Hnf4a methylation and gluconeogenic gene expression.......73
15. H19 KO mice exhibit increased insulin-mediated suppression of EGP............................75

xi
16. Hepatic expression of Igf2 and miR-675...........................................................................77
17. Mice with liver-specific H19 overexpression exhibit altered Hnf4a methylation,
gluconeogenic enzyme expression...................................................................................80
18. Mice with liver-specific H19 overexpression show elevated HGP.................................82
19. HFD mice show altered hepatic H19 expression, Hnf4a methylation, and gluconeogenic
gene expression.................................................................................................................84
20. A proposed model.............................................................................................................86

xii
LIST OF TABLES
1. Primers (Chapter II).........................................................................................................23
2. Gene ontology analysis on up-regulated genes using DAVID ......................................30
3. Primers (Chapter III) .......................................................................................................58

xiii

1
Chapter I
Introduction
A. Long Noncoding RNA
In the past decade, due to the advances in genomic sequencing and data analysis,
tens of thousands of RNA transcripts that are similar to mRNA but do not encode proteins
have been discovered. These transcripts are referred to as long noncoding RNA (lncRNA),
defined as any transcribed RNA molecules that are longer than 200 nucleotides but do not
have protein-coding potential (Engreitz et al., 2016). Although similar to mRNAs in
structure, many lncRNAs being 5’ capped, spliced and poly-adenylated (Carninci et al.,
2005), lncRNAs are much more abundant than mRNAs in the transcriptome, comprising
about 80% of all transcripts (Kapranov et al., 2007). In addition to generation from coding
region, lncRNAs can also be transcribed from intergenic and intronic regions (Ma et al.,
2013). LncRNAs are less conserved than mRNAs in sequence across different species
(Carninci et al., 2005). The expression pattern of lncRNAs seem to be highly tissue specific
(Engreitz et al., 2016). Further, lncRNAs are very heterogeneous in several additional
aspects, such as evolution, abundance, biogenesis, stability and the functional mechanisms
(Engreitz et al., 2016). Although many lncRNAs could be non-functional transcriptional
products, more and more lncRNAs have been found functional in regulating gene expression
in a variety of biological processes (Engreitz et al., 2016).

2
B. LncRNA H19
H19 is the first discovered and characterized lncRNA (Brannan et al., 1990). It is also
one of the most well-studied lncRNAs. The H19 gene is located on chromosome 11 in the
human and chromosome 7 in the mouse. Both human and mouse H19 genes contain five
exons and four introns, producing a predominantly cytoplasmic ~2.3kb RNA. Similar to the
structure of mRNAs, the spliced H19 RNA has a 5’ cap and a 3’ poly-A tail (Pope et al., 2017).
The H19 gene belongs to an imprinted gene network (IGN) that controls embryonic
growth (Varrault et al., 2006). The neighbor gene of H19 that also belongs to this IGN is
insulin-like growth factor-II (Igf2), which is an important growth-promoting factor in
development. Due to genomic imprinting, H19 is transcribed only from the maternal allele,
whereas Igf2 is transcribed from the paternal allele (Kaffer et al., 2001). This allele-specific
expression pattern of H19 and IGF2 is controlled by two kinds of cis-regulatory sequence
elements in this region: a common set of enhancers located 3’ downstream of the H19 gene
and an insulator called imprinting control region (ICR) located between the Igf2 gene and
the H19 gene. The ICR contains CTCF (CCTC-binding factor) binding sites (Szabo et al., 2004;
Kurukuti et al., 2006). The detailed regulatory mechanism of this imprinted region is
indicated in Figure 1. The ICR contains a differentially methylated region (DMR) that has
different methylation statuses between the maternal and the paternal chromosomes. On the
maternal allele, the ICR is hypomethylated, allowing the binding of CTCF to its binding sites
on the ICR. ICR/CTCF interaction mediated chromosome looping prevents the interaction
between the 3’ downstream common enhancers and the IGF2 promoter, leading to silencing
of IGF2 transcription. Meanwhile, the common enhancers would interact with H19
promoter and activate H19 transcription, resulting in H19 expression from maternal allele.
In contrast, on the paternal allele, due to hypermethylation of the ICR, CTCF/ICR interaction
is prohibited. As a result, the 3’ downstream common enhancers could be close to IGF2

3
Figure 1. Schematic representation of regulation at the imprinted Igf2-H19 locus.
A. Imprinted expression of H19 and IGF2. On the maternal allele, the imprinting control
region (ICR) is hypomethylated, allowing the binding of CTCF to its binding sites on ICR.
The enhancers activate the expression of H19. On the paternal allele, the ICR is
hypermethylated, preventing CTCF from binding to the ICR. The enhancers activate the
transcription from Igf2 promoter. B. ICR-mediated chromosome looping controls the
imprinted expression of H19 and IGF2. On the maternal allele, the chromatin loop that
mediated by ICR/CTCF interaction insulates the Igf2 gene from enhancers downstream of
H19. On the paternal allele, without ICR/CTCF interaction, a different chromatin
confirmation brings the enhancers close to Igf2 gene, leading to activation of Igf2 expression.

4
A
B
Igf2 H19 ICR
CTCF
Enhancers
Igf2 H19 ICR
Enhancers
E
H19 E
Igf2
ICR
CTCF
5’
3’
H19 E E
Igf2
CTCF
ICR
5’
3’
5
promoter and stimulate IGF2 transcription, leading to increased IGF2 expression and
repressed H19 expression on the paternal allele (Kurukuti et al., 2006, Sanli and Feil, 2015).
Disruption of genomic imprinting at the Igf2-H19 locus can result in growth disorders.
Hypermethylation at the ICR leads to loss of H19 expression and gain of IGF2 expression
from the maternal allele, resulting in the overgrowth related disorder Beckwith-
Wiedemann syndrome (BWS). On the other hand, hypomethylation at the ICR site leads to
loss of IGF2 expression and gain of H19 expression from the paternal allele, resulting in
poor growth related disorder Silver-Russell syndrome(SRS) (Nativio et al., 2011).
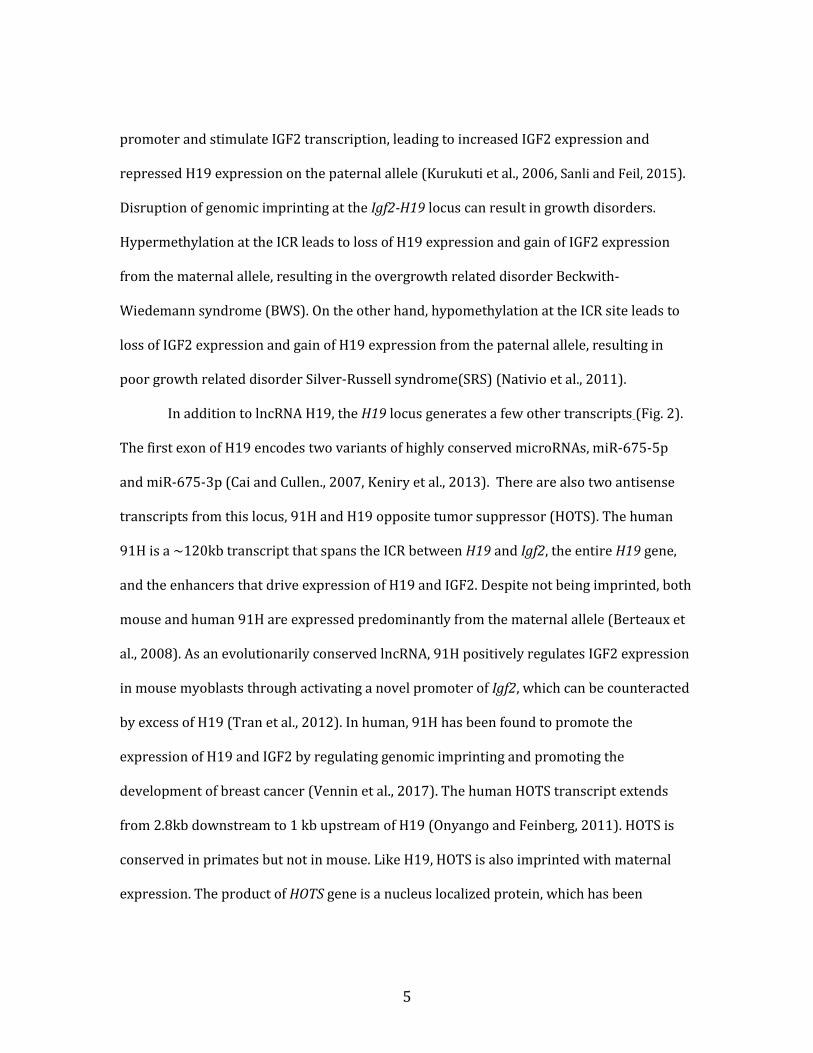
In addition to lncRNA H19, the H19 locus generates a few other transcripts (Fig. 2).
The first exon of H19 encodes two variants of highly conserved microRNAs, miR-675-5p
and miR-675-3p (Cai and Cullen., 2007, Keniry et al., 2013). There are also two antisense
transcripts from this locus, 91H and H19 opposite tumor suppressor (HOTS). The human
91H is a ~120kb transcript that spans the ICR between H19 and Igf2, the entire H19 gene,
and the enhancers that drive expression of H19 and IGF2. Despite not being imprinted, both
mouse and human 91H are expressed predominantly from the maternal allele (Berteaux et
al., 2008). As an evolutionarily conserved lncRNA, 91H positively regulates IGF2 expression
in mouse myoblasts through activating a novel promoter of Igf2, which can be counteracted
by excess of H19 (Tran et al., 2012). In human, 91H has been found to promote the
expression of H19 and IGF2 by regulating genomic imprinting and promoting the
development of breast cancer (Vennin et al., 2017). The human HOTS transcript extends
from 2.8kb downstream to 1 kb upstream of H19 (Onyango and Feinberg, 2011). HOTS is
conserved in primates but not in mouse. Like H19, HOTS is also imprinted with maternal
expression. The product of HOTS gene is a nucleus localized protein, which has been

6
reported to bind to the enhancer of rudimentary homolog protein and inhibit tumor growth
(Onyango and Feinberg, 2011).
Figure 2. Transcripts from the H19 locus.
Transcripts from the H19 locus include the well-characterized H19 lncRNA, microRNA miR-
675 encoded in the first exon of H19, 91H lncRNA and HOTS mRNA. These transcripts are
almost all transcribed from the maternal allele, except for 91H lncRNA, which can be
partially generated from the paternal allele. 91H and HOTS are antisense transcripts from
this locus. The product of HOTS gene is a nucleus-localized protein. The relative positions of
each transcript are as indicated in the picture.
7
H19 Igf2 ICR
Igf2 ICR
Enhancers
H19
91H
91H
HOTS
HOTS
Exon1 5
miR675
-137 -2 +10.5 +1 +48 K bp

8
C. Function of LncRNA H19
As a lncRNA, H19 does not have an uniformly conserved open reading frame (ORF)
among mammalian species that protein-coding genes normally have (Juan et al., 1999). But
H19 has highly conserved islands of 20-40 nucleotides across its sequence, the pattern of
which has also been observed in bacterial 16 ribosomal RNAs. Moreover, based on the
comparison of H19 genes from nine species including human, mouse, cat and rabbit, Juan
et al. found that H19 has evolutionarily conserved secondary structure. Together, these
results suggest that H19 gene exerts its function as a structured RNA. The unique expression
pattern of H19 during different developmental stages and in different tissues further
supports the notion that H19 is a functional lncRNA. H19 is prevalently expressed in all
tissues during embryonic development. But after birth, H19 expression is repressed in most
tissues except for a few tissues including skeletal muscle and heart muscle (Poirier et al.,
1991).
The high expression of H19 in embryo suggests an important role of H19 during
embryonic development. Keniry et al. found that in the second half of gestation, H19 limits
the growth of the placenta through its processed product miR-675, which can target the
insulin like growth factor 1 receptor (Igf1r), a common receptor of Insulin, IGF1 and IGF2
(Keniry et al., 2012). Full length H19 has also been reported to control embryo growth by
acting in trans to regulate the expression of IGF2 as well as other growth-promoting genes,
such as Slc38a4 (solute carrier family 38 member 4) and Peg1 (paternally expressed gene 1)
(Monnier et al., 2013). These genes, including H19 itself, are from the imprinted gene
network (IGN). Through forming a complex with the methyl-CpG-binding domain protein 1
(MBD1), H19 has been reported to recruit repressive epigenetic markers to the target genes
and down-regulate their expression (Monnier et al., 2013).

9
The sustained high expression of H19 in muscle after birth indicates a special role of
H19 in muscle tissues. In undifferentiated multipotent mesenchymal C2C12 cells, H19 was
reported to help to maintain cells in an undifferentiated status by assisting KSRP (RNA
binding protein K homology-type splicing regulatory protein) mediated decay of myogenin
mRNA (Giovarelli et al., 2014). Kallen et al. found that H19 could act as a molecular sponge
to sequester let-7 family miRNAs from their targeted transcripts, resulting in changes in
myogenic differentiation (Kallen et al., 2013). Moreover, miR-675-5p and miR-675-3p
generated from the first exon of H19 have been discovered to promote myoblast
differentiation and muscle regeneration in vivo (Dey et al., 2014).
Existing evidence suggests that H19 is involved in liver development and liver
diseases. Wang et al. found that H19 prevents overgrowth of fetal liver by inhibiting cell
proliferation through Wnt signaling. Specifically, H19 can block the hnRNP U/Actin
interaction, resulting in repression of Pol II-mediated transcription of genes involved in the
Wnt signaling pathway. On the other hand, H19 can inhibit the expression of Wnt pathway
regulator Frat1, leading to reduction of b-catenin protein and further inactivation of the
Wnt/b-catenin signaling (Wang et al, 2016). In addition to liver development, several
examples suggest the involvement of H19 in liver diseases. For instance, it has been
reported that targeting H19 could reduce apoptosis regulator BCL-2-induced liver injury in
cholestatic liver fibrosis (Zhang et al., 2016). In a study about non-alcoholic fatty liver
disease (NAFLD) in mice, down-regulating PLIN2 (Perilipin 2), an important driver of fatty
liver development, was found to dramatically increase H19 expression by 548-fold and
significantly decrease triglyceride production, indicating the involvement of H19 in NAFLD
(Imai et al., 2012). Furthermore, association of H19 with Type II diabetes (T2D) in the liver
has also been suggested in a study carried out with T2D patients. In the study, significant
decrease in methylation and increase in expression of H19 were observed in T2D livers

10
compared to control livers (Nilsson et al., 2015). The underlying molecular mechanism
behind this association needs to be further investigated.
Beside important functions in normal cells and tissues, accumulating data have
suggested that H19 is an important player in cancer (Raveh et al., 2015). H19 is expressed
in almost every human cancer and has been reported to be involved in all stages of
tumorigenesis, such as cell proliferation, differentiation, epithelial to mesenchymal
transition (EMT) and also mesenchymal to epithelial transition (MET). Although there are
controversies about the role of H19 as an oncogene or tumor repressor, it seems like the
function of H19 in a specific tumor depends on its context within the stage of tumor
progression (Raveh et al., 2015).
D. H19 Mechanism of Action
Given the evolutionarily-conserved sequence pattern and secondary structure of
H19, it is reasonable to speculate that the main mode of action of H19 is to interact with
proteins or miRNAs through its conserved binding sites. In addition, as the host of miR-675,
H19 was also considered to exert its function through miR-675 (Keniry et al., 2012; Dey et
al., 2014; Gao et al., 2012; Tsang et al., 2010; Hernandez et al., 2013). But as an independent
transcript that is different from full length H19, miR-675 does not necessarily need to share
its function with H19.
H19 can mediate gene expression regulation by binding to its protein partners.
This can occur in the nucleus or in the cytoplasm and the expression of targeted genes can
be either activated or repressed, depending on the specific protein partner that H19
interacts with. There are several examples of H19 mediated regulation in the nucleus. In
bladder cancer, Luo et al revealed that through binding to enhancer of zeste homolog 2

11
(EZH2), a component of the polycomb repressive complex 2 (PRC2), H19 could recruit PRC2
to the E-cadherin gene and silence its expression, promoting cancer metastasis (Luo et al.,
2013). Similarly, during embryonic development, H19 was found to form a complex with
MBD1, which binds to methylated DNA and recruits histone lysine methyltransferase
(KMT)-containing complexes such as SETDB1 and SUV39H1 to silent genes in the imprinted
gene network (IGN) via H3K9 methylation (Monnier et al., 2013). Other than repression of
gene expression, H19 is also involved in activation of gene expression. In a study of
hepatocellular carcinoma (HCC), Zhang et al. discovered that H19 acts as a tumor
suppressor by epigenetic activation of the miR-200 family. H19 associates with an HnRNP
U/PCAF/RNAPol II complex via binding to HnRNP U, activating the expression of miR-200
family by enhancing histone acetylation (Zhang et al., 2013). Interestingly, H19 can even
mediate epigenetic regulation of gene expression by binding to protein partners in the
cytoplasm. For instance, in our previous study, we found that H19 can regulate
genomewide DNA methylation by binding to and inhibiting S-adenosylhomocystein
hydrolase (SAHH)’s function. The details of this regulatory mechanism will be explained in
Chapter III of this dissertation. H19 has also been found to regulate gene expression at the
post-transcriptional level by interacting with cytoplasmic protein partners. For example, in
myoblast cells, H19 binds to KSRP and stabilizes the binding of KSRP to myogenin mRNA,
assisting KSRP mediated myogenin mRNA degradation (Giovarelli et al., 2014). In gastric
cancer, H19 acts as an oncogene in at least two ways. On the one hand, it binds with and
stabilizes angiogenesis inhibitor Isthmin 1 (ISM1) (Li et al., 2014). On the other hand, it
interacts with the tumor suppressor p53 to inhibit its activity (Yang et al. 2012).
H19 can act as a microRNA sponge and affect the expression of microRNA
target genes. For example, Kallen et al. found that there are predicted let-7 binding sites in

12
H19 from human, mouse, rat or even bovine subjects. Using an immunoprecipitation assay,
these authors further discovered that H19 associates with let-7 in miRNPs, suggesting
potential regulation of let-7 function by H19. In both human and mouse cells, change of H19
levels has been found to positively correlate with the expression levels of let-7 target genes
such as HMGA2 (High Mobility Group AT-Hook 2) and Dicer (Ribonuclease III) (Kallen et al.,
2013). These results suggest that H19 can bind to and sequester let-7, leading to positive
regulation of let-7 targets (Kallen et al., 2013). Another example is the association of H19
with miR-141 in gastric cancer, through which H19 can regulate the expression of ZEB1
(Zinc Finger E-Box Binding Homeobox 1) (Zhou et al., 2015).
H19-derived miR-675 plays important roles during development and in
cancer. MiR-675 has been reported to inhibit human trophoblast cell proliferation by
targeting the 3’-UTR of Nodal Modulator 1 (NOMO1) mRNA (Gao et al., 2012). During
muscle differentiation and regeneration after injury, miR-675 was found to promote muscle
differentiation by targeting and down-regulating transcriptional factor Smad and DNA
replication initiation factor Cdc6 (Cell Division Cycle 6) (Dey et al., 2014). In the case of
cancer, miR-675 has been revealed to target the tumor suppressor Rb in both AFP-secreting
hepatocellular carcinoma (Hernandez et al., 2013) and colorectal cancer (Tsang et al., 2010).
Together, these results show that H19 appears to be a multi-functional lncRNA that
utilizes distinct molecular mechanism to regulate gene expression, depending on the
biological contexts during development and disease conditions.

13
E. Thesis Objectives The studies in this thesis mainly focus on understanding the regulatory roles of H19
in the muscle and liver. In Chapter II, I will discuss the role of H19 during muscle
differentiation. In Chapter III, I will describe H19-mediated regulation of hepatic glucose
production via a novel epigenetic mechanism.
H19 is highly expressed in the muscle but not other tissues in adults (Poirier et al.,
1991). It is also known that the expression of H19 increases remarkably after the start of
muscle differentiation (Kallen et al., 2013, Dey et al., 2014). However, the significance of
these phenomena remains unclear. Previously, two studies focused on the role of H19 in
muscle differentiation have drawn contradictory conclusions. One study suggested that H19
inhibits muscle differentiation (Kallen et al., 2013), while the other one indicated that H19
promotes muscle differentiation via its embedded miR-675 (Dey et al., 2014). The goal of
my first project (Chapter II) was investigating the correlation between H19 and muscle
differentiation: Does H19 inhibit or promote muscle differentiation? To address this
question, I would compare the gene expression patterns of differentiating muscle cells with
or without H19 depletion using RNA-seq. To achieve H19 depletion in differentiating
muscle cells, H19-specific siRNA (si1H9) would be transfected into day 1 differentiating
mouse C2C12 myoblasts. I expected to observe an at least 80% of H19 knockdown in siH19
treated cells versus control. Further, RNA-seq analysis would be carried out on control and
H19 knockdown cells to examine the differential gene expression under these two
conditions. I expected to see expressional change of genes associated with cell proliferation
and/or muscle terminal differentiation. Next, the expressional change of specific genes
observed from RNA-seq data would be verified by RT-qPCR and Western blot. Finally, the
physiological effect of H19 depletion on muscle differentiation would be examined by
evaluating the status of myotube formation. If H19 inhibits muscle differentiation, I would

14
expect to see the down-regulation of cell proliferation related genes and/or the up-
regulation of muscle terminal differentiation related genes in H19 knockdown cells versus
control. In addition, premature myotube formation was also expected in H19 knockdown
versus control cells if H19 plays a negative regulatory role in muscle differentiation. In
Chapter II, through transcriptome-wide analysis, I have found that H19 plays an inhibitory
role in muscle differentiation.
As I discussed in the introduction, despite low levels of expression in the liver after
birth, H19 has been reported to be involved in liver development and diseases. The increase
of H19 expression in Type 2 diabetes (T2D) livers compared to control livers (Nilsson et al.,
2015) suggests a potential role of H19 in the development of T2D. The hallmarks of T2D are
elevated blood glucose levels (hyperglycemia) and insulin resistance. It is known that
excessive hepatic glucose production (HGP) contributes significantly to the hyperglycemia
of T2D (Rines et al., 2016). However, the causal mechanism of excessive HGP in T2D
remains poorly understood. Furthermore, our previous data have suggested a positive
correlation between H19 and a transcriptional factor HNF4A that is critical for HGP.
Previously, we found that H19 could regulate genome wide DNA methylation by binding to
SAHH and inhibiting its enzyme activity (Zhou et al., 2015). We also noticed a correlation
between low H19 expression level and high promoter DNA methylation level of Hnf4a
(Zhong et al., 2016), indicating H19 might regulate HNF4A expression by affecting Hnf4a
promoter DNA methylation through interacting with SAHH. Therefore, in my second project
(Chapter III), we hypothesized that H19 positively regulates HGP, contributing to the
progression of T2D, potentially by epigenetic regulation of Hnf4a. First, we would test our
hypothesis in a cell model HepG2, which is a widely used cell line for glucose metabolism
study. Then I would test whether H19 regulates HGP in vivo using four mouse models
including overnight fasting model, high-fat diet-induced obesity model, H19 whole-body

15
knockout model and liver-specific overexpression of H19 model. We have found that H19
knockdown led to an increase of Hnf4a promoter DNA methylation and a decrease of Hnf4a
expression and glucose production in HepG2 cells. Experimental results from our overnight
fasting mouse model and high-fat diet-induced obesity mouse model could demonstrate
that in both models, an increase of H19 expression correlates with a decrease of Hnf4a
promoter DNA methylation and an increase of HNF4A expression. Moreover, evidence from
H19 loss-of-function and H19 gain-of-function studies using H19 knockout mouse model
and liver-specific overexpression of H19 mouse model respectively further supported that
H19 negatively regulates Hnf4a promoter DNA methylation, leading to increased HNF4A
expression and enhanced hepatic glucose production in vivo.

16
Chapter II
Role of H19 in muscle differentiation A. Abstract
In skeletal muscle myogenesis, the determination and terminal differentiation of
muscle cells are thought to be controlled by evolutionarily conserved networks of
transcription factors such as MyoD, Myf5, Myogenin and Mrf4. Moreover, accumulating
evidence from recent studies suggests that microRNAs and long noncoding RNAs (lncRNAs)
are also involved and play important roles in muscle differentiation. LncRNA H19, the first
discovered lncRNA, is known to have a unique muscle-specific expression pattern in adults.
A dramatic increase in H19 expression shortly after the onset of myoblast differentiation in
vitro has been conventionally observed (Neguembor et al., 2014), which leads to interest in
studying the role of H19 during muscle differentiation. However, two previous studies
focusing on the role of H19 in muscle differentiation have reached almost opposite
conclusions. One study found that H19 acts as a molecular decoy for let-7 microRNA, thus
inhibiting muscle differentiation (Kallen et al., 2013). The other study claimed that H19
promotes muscle differentiation and regeneration due to the effects of H19-derived miR-
675 (Dey et al., 2014). In order to better understand the role of H19 in muscle
differentiation, here we utilized RNA-seq to compare the differential gene expression
between control and H19 knockdown cells during C2C12 myoblast differentiation. This
study can also lead us to identify candidate genes that are regulated by H19 during muscle
differentiation.
17
B. Background
Muscle differentiation is the process where after muscle lineage commitment,
proliferating myoblasts withdraw from the cell cycle and fuse to become multinucleated
myotubes, which have a contractile phenotype, express a series of muscle-specific genes,
and will eventually mature into myofibers (Olson, 1992). In skeletal muscle myogenesis, the
determination and terminal differentiation of muscle cells are mainly governed by the
MyoD family of basic helix-loop-helix transcription factors: MyoD, Myf5, Myogenin and Mrf4.
Among these four myogenic regulatory factors (MRFs), MyoD and Myf5 play critical roles in
specification and commitment of muscle progenitors into skeletal muscle lineage, whereas
myogenin is essential for directing the terminal differentiation of committed myoblasts
(Berkes and Tapscott, 2005). Myf4 seems to have a dual role, involving both muscle cell fate
specification and differentiation (Braun and Gautel, 2011). Given that a large set of muscle-
specific genes expressed by cardiac muscle overlap with those expressed by skeletal muscle,
a common underlying regulatory scheme may exist to control both skeletal and cardiac
muscle gene expression (Olson, 1993). Apart from these well known MRFs mentioned
above, accumulating evidence from previous studies suggests that microRNAs (miRNAs)
including let-7 and long noncoding RNAs (lncRNAs) (Neguembor et al., 2014; Mousavi et al.,
2013; Hube et al., 2010; Wang et al., 2013) including lncRNA H19, are also involved in and
play important roles in muscle differentiation.
LncRNA H19 and its role in muscle differentiation. The unique muscle-specific
expression of H19 after birth was of great interest to us. Besides, dramatic increase of H19
expression occurs shortly after onset of myoblasts differentiation in vitro (Neguembor et al.,
2014). These interesting facts lead us to ask: What is the function of H19 in muscle

18
differentiation? In the past few years, two studies focusing on the role of H19 in muscle
differentiation have reached almost opposite conclusions. In an in vitro study using C2C12
cells as a model system, Kallen, A. N. et al. found that H19 has multiple binding sites for
several miRNAs from the let-7 family, which was known to have important roles in
development and cancer. These authors also proved that H19 physically associates and
sequesters let-7 in a miRNP complexes, leading to increased expression of let-7 targets.
Moreover, they observed that both overexpression of let-7 and knockdown of H19 in day 1
differentiating C2C12 myoblasts led to precocious muscle differentiation. Therefore, they
concluded that H19 acts as a molecular sponge for let-7 microRNAs, leading to inhibition of
muscle differentiation (Kallen et al., 2013). In contrast, the other study carried out by Dey, B.
K. et al. revealed that H19 promotes skeletal muscle differentiation and regeneration due to
the effects of miR-675 generated from the H19 transcript (Dey et al., 2014). These authors
reported that, like H19, miR-675 is significantly induced during skeletal muscle
differentiation. C2C12 myoblasts with H19 knockdown displayed decreased differentiation,
which was rescued by exogenous expression of miR-675. Similarly, mice with H19
deficiency showed impaired skeletal muscle regeneration after injury, which was also
rescued by reintroduction of miR-675 (Dey et al., 2014). As a result of these contradictory
studies, the role of H19 in muscle differentiation is still controversial and needs to be
further investigated.
Is H19 playing a role to promote muscle differentiation or inhibit muscle
differentiation? Are full length H19 and its derived miR-675 acting independently or maybe
even having opposite roles in muscle differentiation? To address these questions, we first
carried out transcriptome analysis using RNA-seq to compare the differential gene
expression between differentiating C2C12 cells with or without H19 knockdown. We found

19
that many muscle terminal differentiation associated genes were up-regulated after H19
knockdown, suggesting an inhibitory role of H19 in muscle differentiation. The increase of
muscle terminal expression marker genes myogenin (MyoG) and myosin heavy chain
(MyHC) under H19 knockdown was further verified by RT-qPCR and Western blot. Finally,
we observed precocious myotube formation after H19 knockdown with
immunofluorescence staining of MyHC.
C. Material and Methods
1. Materials
Antibodies for MyoG (Santa Cruz, Dallas, TX, cat# sc-12732), MyHC (Sigma-Aldrich,
St. Louis, MO, cat# M4276 ), and Tubulin (Cell signaling, Danvers, MA, cat# 3873S) were
purchased. Mouse H19 siRNA (siH19, Invitrogen, Carlsbad, CA, cat# 4390815/n253566)
and control siRNA (siCon, Invitrogen, Carlsbad, CA, cat# 12935-200) were purchased from
Invitrogen.
2. Cell culture and transfection
Mouse C2C12 myoblasts (Sigma-Aldrich, cat# 91031101-iVL) were maintained at
undifferentiated status in growth medium (GM; DMEM, Gibco, cat# 11965-092,
supplemented with 10% fetal bovine serum, heat-inactivated, 1% penicillin/streptomycin,
1% L-glutamine and 1 mM sodium pyruvate). To induce cell differentiation, cells were
seeded in GM at a density of 2 x 10⁵ cells per well in a 6-well plate or at a density of 2 x 10⁴
per well in a 24-well plate. Two days later when cells reach confluence, GM was replaced
with differentiation medium (DM) containing 2% horse serum in place of 10% fetal bovine

20
serum to initiate myoblast differentiation. Transfection was performed at 40 h after
changing GM to DM.
To prepare siRNA transfection mix for one well of a 6-well plate, 500 pmol of siCon
or siH19 was gently mixed with 600 ul OPTI-MEM. In parallel, 25 ul lipofectamine 2000 was
mixed with 600 ul OPTI-MEM. After incubation at room temperature for 5 min, the above
two solutions were mixed gently and incubated for 20-30min at room temperature to allow
the formation of siRNA/lipid complexes. Then the final mix was added to the cells pre-
washed with OPTI-MEM. After overnight (12h – 18h) incubation, the transfection mixture
was replaced with fresh DM. RNA, protein were extracted and analyzed at the indicated
time points following transfection.
3. RNA-Seq library construction
C2C12 cells were transfected with siCon or siH19 in a 6-well plate. Cells were
harvested for RNA extraction 48 h post transfection using the Purelink RNA mini kit
(Thermo Fisher Scientific, Waltham, MA, cat# 12183018A). RNA-seq libraries were
prepared using the TruSeq Stranded Total RNA LT kit with Ribo-Zero Human/Mouse/Rat,
set A (Illumina, San Diego, CA, cat# RS-122–2201) according to the sample preparation
protocol. Briefly, 1 μg of total RNA was subjected to Ribo-Zero depletion to remove rRNAs.
The remaining RNA was purified, fragmented and primed with random hexamers for cDNA
synthesis. After first and second cDNA synthesis, cDNA fragments were adenylated and then
ligated to indexing adapters. The cDNA fragments were enriched by PCR, purified and then
sequenced on an Illumina NextSeq500 sequencer using paired-end chemistry and 76-bp
cycles. Sequencing data are available from the GEO with accession number GSE73014.

21
4. RNA-Seq data analysis
Illumina BaseSpace (https://basespace.illumina.com/)-embedding tools were used
to analyze the RNA-seq data. TopHat Alignment v1.0.0 was used to map sequencing reads to
mm10 genome. Cufflinks Assembly & DE v1.0.0 containing Cufflinks 2.1.1 and Cuffdiff 2.1.1
was applied to assemble mapped transcripts and calculate differential expression of genes.
DAVID bioinformatics resources (Huang et al., 2009) tool was used to do gene ontology and
pathway analysis. iRegulon (Janky et al., 2014) was utilized to identify transcriptional
factors (TFs) and the targets from the differentially expressed genes.
5. RNA extraction and RT-qPCR
Total RNAs were extracted from C2C12 cells using PureLink RNA Mini Kit
(ThermoFisher Scientific, Waltham, MA, cat# 12183018A). cDNA was synthesized using
iScript cDNA Synthesis Kit (BIO-RAD, Hercules, CA , cat# 1708891) in a 20ul reaction with
0.5 – 1 ug of total RNA. Real-time quantitative PCR was performed in a 15ul reaction
containing 0.5-1ul of cDNA using iQSYBRGreen (BIO-RAD, Hercules, CA, cat #1708880) in a
Bio-Rad iCycler. PCR was performed by initial denaturation at 95℃ for 5 min, followed by
40 cycles of 30 sec at 95℃, 30 sec at 60℃, and 30 sec at 72℃. Specificity was verified by
melting curve analysis and agarose gel electrophoresis. The threshold cycle (Ct) values of
each sample were used in the post-PCR data analysis. Gene expression levels were
normalized against housekeeping gene Tubulin. Real-time PCR primers are listed in Table 1.
6. Western blot analysis
C2C12 cells in a 6-well plate were washed twice with ice-cold PBS and then lysed in
the plate with cold RIPA buffer containing protease inhibitors. Cell lysate was then

22
transferred to a 1.5 ml tube and kept on ice for 10 min, followed by centrifugation at 12,000
rpm for 10 min at 4℃. The supernatant was transferred to a new tube and stored at -20℃
for further analysis. Protein concentration was determined by using the DC Protein Assay
Kit (BIO-RAD, Hercules, CA, cat# 5000112). 2 x Laemmli loading buffer (BIO-RAD, Hercules,
CA, cat# 1610737) was used to load 10 ug protein/sample into a 12% SDS-PAGE gel,
followed by western blot analysis. Western blot analysis procedure for LI-COR Odyssey
Infrared Imager was performed. For membrane blocking and antibody diluting, Odyssey
Blocking Buffer (TBS) (LI-COR Biosciences, Lincoln, NE, cat# P/N 927-50000) was used. For
secondary antibody incubation, IRDye dye-labeled secondary antibodies were used. Blots
were developed on the LI-COR Odyssey Infrared Imaging System.
7. Immunofluorescence analysis
Day 4 differentiating C2C12 myoblasts grown on glass coverslips were washed with
PBS briefly, followed by fixation with 4% paraformaldehyde in PBS pH7.4 for 10 min at
room temperature. Then cells were permeabilized with 0.1% Triton X-100 in PBS for 5 min,
followed by three times of washing in PBS for 5 min. Blocking unspecific binding of the
antibodies was performed using 5% BSA and 5% goat serum in PBS for 1h. Cells were then
incubated with anti-MyHC antibody for 1h at room temperature in a humidified chamber.
After washing with PBS for three times, cells were incubated with Alexa-488 conjugated
goat anti-mouse IgG antibody for 1h in a humidified chamber in dark, followed by three
times of washing in PBS. Cells were then mounted with mounting medium containing DAPI
(Vector Laboratories, Burlingame, CA). Images were taken using fluorescence microscopy
(LSM 780, Carl Zeiss, Oberkochen, Germany).

23
Table 1. Primers
Sequence for RT-qPCR analysis (shown 5’ to 3’)
Gene
Primer sequence
mH19 Forward AATGGTGCTACCCAGCTCAT
Reverse TCAGAACGAGACGGACTTAAAGAA
mMyHC Forward CGCAAGAATGTTCTCAGGCT
Reverse GCCAGGTTGACATTGGATTG
mMyogenin Forward CAATGCACTGGAGTTCGGT
Reverse CTGGGAAGGCAACAGACAT
mb-Actin Forward ACACCCGCCACCAGTTC
Reverse TACAGCCCGGGGAGCAT
mb-Tubulin Forward CGTGTTCGGCCAGAGTGGTGC
Reverse GGGTGAGGGCATGACGCTGAA
24
D. Results 1. Knockdown of H19 in differentiating C2C12 cells.
To determine the role of H19 in muscle differentiation, we used mouse C2C12
myoblasts as a model system. Day 2 differentiating C2C12 cells were transfected with
control siRNA (siCon) or H19-specific siRNA (siH19), followed by evaluation of knockdown
efficiency using RT-qPCR two days post transfection (Fig. 3A). Through H19-specific siRNA
mediated knockdown, H19 level was decreased by ~ 90% compared to the control (Fig. 3B).
The high knockdown efficiency of H19 is a good preparation for comparative transcriptome
analysis between control and H19 depleted cells.
2. RNA-Seq and data analysis
H19 knockdown experiments were performed in differentiating C2C12 cells as
indicated (Fig. 3A), followed by genome-wide transcriptome analysis using RNA-Seq. The
RNA-seq library construction and data analysis were performed as shown in the flow chart
(Fig. 4). Total RNA with ribosomal RNA removed was used for RNA-seq library construction.
Triplicate samples for each treatment group were included and ~ 60 million reads per
sample were acquired. The quality of raw sequencing reads was confirmed by running
FASTQC. Tophat alignment results showed on average 86% sequencing reads were
successfully aligned to the mouse mm10 reference genome, with ~ 50% of reads aligned to
the coding region, suggesting a good capture of coding transcripts in this RNA-seq
experiment. Differential expression analysis using Cufflinks Assembly & DE indicated that
among ~ 30 thousand genes identified from the sequencing reads, 3019 genes have
significant differential expression (q Value < 0.05) between siCon and siH19 samples.
Furthermore, 604 out of the 3019 genes were up-regulated by at least 1.5 fold, whereas 218
25
Figure 3. H19 knockdown in differentiating C2C12 cells.
A. Experimental procedure of H19 knockdown in differentiating C2C12 cells. Differentiating
C2C12 myoblasts were transfected with siCon or siH19 at 40 h post induction of
differentiation. Cells were harvested for further analysis at 48 h after transfection. B. RT-
qPCR analysis results of H19 knockdown. Relative RNA levels are presented. Numbers are
mean ± SD (n=3). **p<0.01.

26
A
B
siCon siH190.0
0.2
0.4
0.6
0.8
1.0
1.2
1.4
RelativeH19level
**

27
Figure 4. Flow chart of RNA-Seq analysis strategy.
Total RNA with ribosomal RNA depleted was used for Illumina TruSeq Stranded Total RNA
library construction. The RNA-Seq libraries were sequenced on an Illumina NextSeq 500
sequencer. Raw sequencing data were processed via a standard RNA-Seq data analysis
pipeline. Briefly, the raw sequencing reads were first checked by using FASTQC, then
aligned to the reference genome using TopHat, followed by gene assembly and gene reads
quantification using Cufflink, and then differential gene expression analysis using Cuffdiff.
Functional analysis on the differentially expressed genes were carried out using DAVID and
iRegulon.

28
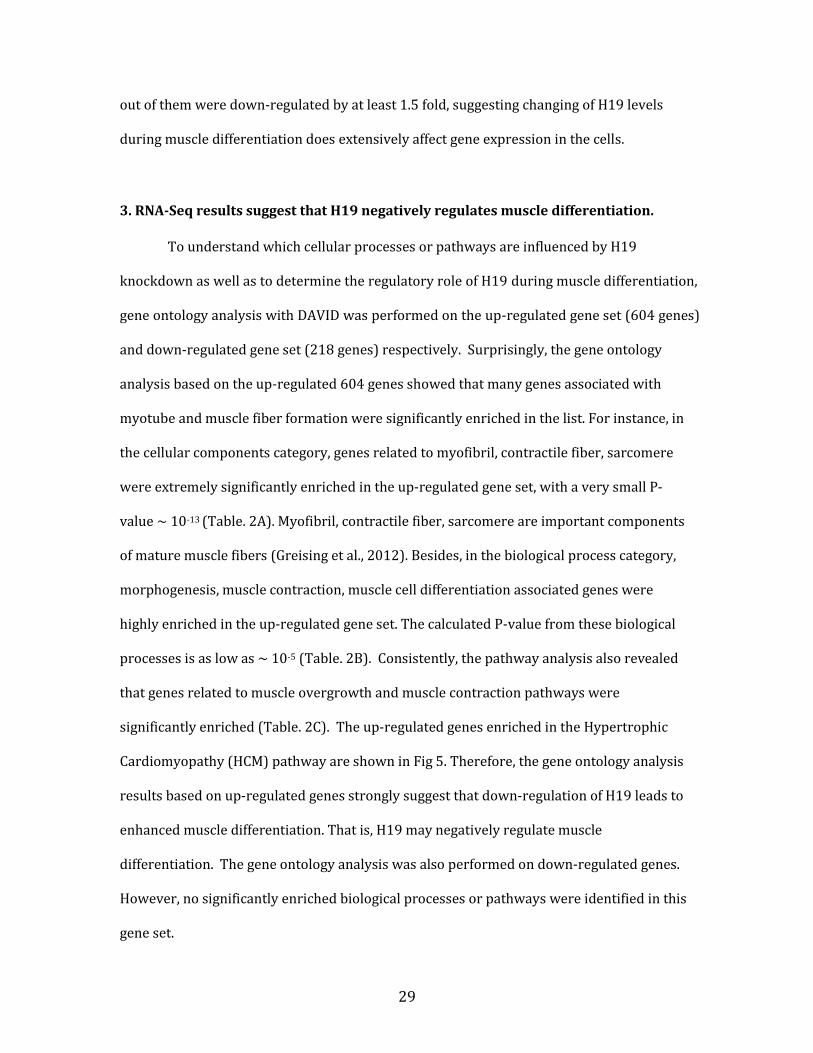
29
out of them were down-regulated by at least 1.5 fold, suggesting changing of H19 levels
during muscle differentiation does extensively affect gene expression in the cells.
3. RNA-Seq results suggest that H19 negatively regulates muscle differentiation.
To understand which cellular processes or pathways are influenced by H19
knockdown as well as to determine the regulatory role of H19 during muscle differentiation,
gene ontology analysis with DAVID was performed on the up-regulated gene set (604 genes)
and down-regulated gene set (218 genes) respectively. Surprisingly, the gene ontology
analysis based on the up-regulated 604 genes showed that many genes associated with
myotube and muscle fiber formation were significantly enriched in the list. For instance, in
the cellular components category, genes related to myofibril, contractile fiber, sarcomere
were extremely significantly enriched in the up-regulated gene set, with a very small P-
value ~ 10-13 (Table. 2A). Myofibril, contractile fiber, sarcomere are important components
of mature muscle fibers (Greising et al., 2012). Besides, in the biological process category,
morphogenesis, muscle contraction, muscle cell differentiation associated genes were
highly enriched in the up-regulated gene set. The calculated P-value from these biological
processes is as low as ~ 10-5 (Table. 2B). Consistently, the pathway analysis also revealed
that genes related to muscle overgrowth and muscle contraction pathways were
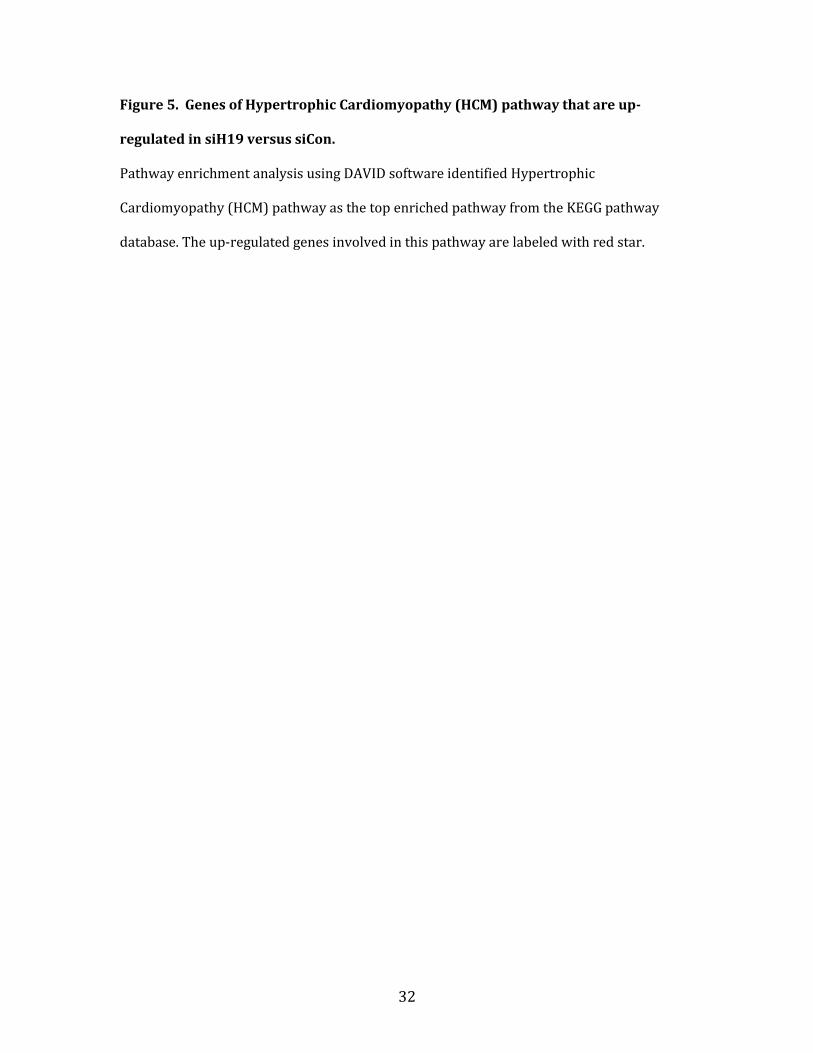
significantly enriched (Table. 2C). The up-regulated genes enriched in the Hypertrophic
Cardiomyopathy (HCM) pathway are shown in Fig 5. Therefore, the gene ontology analysis
results based on up-regulated genes strongly suggest that down-regulation of H19 leads to
enhanced muscle differentiation. That is, H19 may negatively regulate muscle
differentiation. The gene ontology analysis was also performed on down-regulated genes.
However, no significantly enriched biological processes or pathways were identified in this
gene set.

30
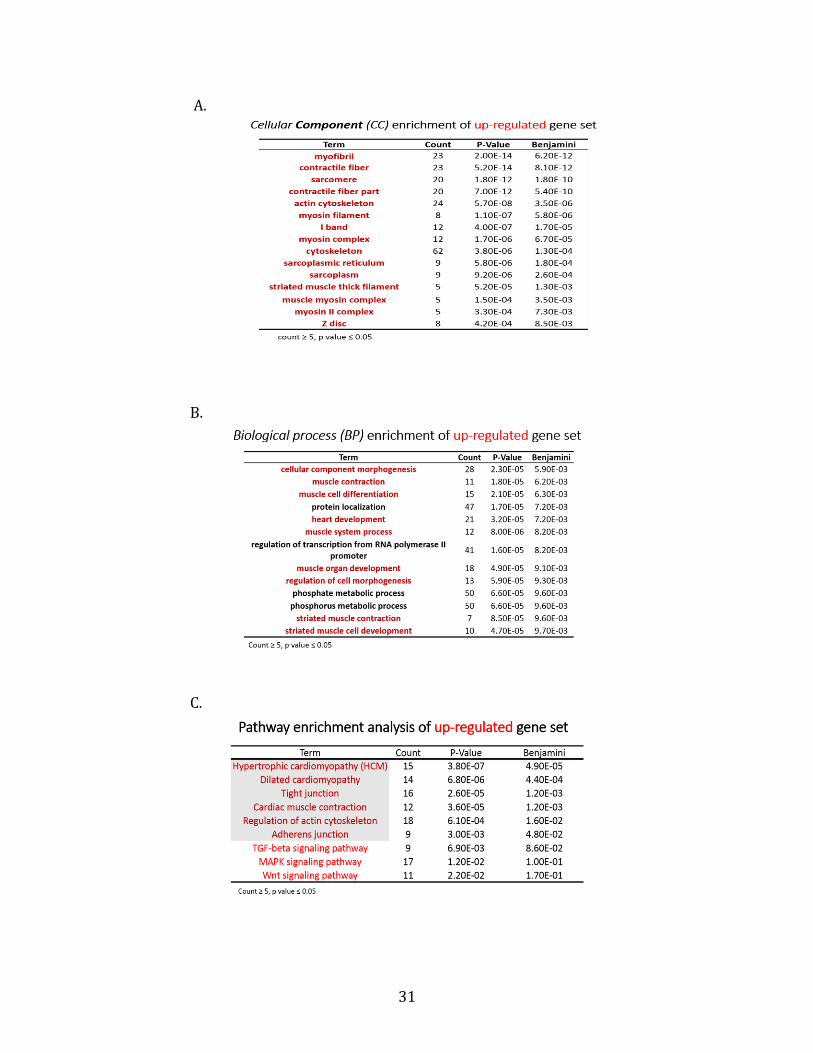
Table 2. Gene ontology analysis on up-regulated genes using DAVID.
Among 3019 genes that have significant differential expression (q Value < 0.05) between
siCon and siH19 samples, 604 genes were up-regulated by at least 1.5 fold. Gene ontology
analysis was performed on these 604 up-regulated genes. A. Cellular Component (CC)
enrichment of up-regulated gene set. B. Biological process (BP) enrichment of up-regulated
gene set. C. Pathway enrichment of up-regulated gene set. Filter: Count of genes in each
term is higher or equal to 5, P-value is smaller or equal to 0.05.
31
A.
B.
C.
32
Figure 5. Genes of Hypertrophic Cardiomyopathy (HCM) pathway that are up-
regulated in siH19 versus siCon.
Pathway enrichment analysis using DAVID software identified Hypertrophic
Cardiomyopathy (HCM) pathway as the top enriched pathway from the KEGG pathway
database. The up-regulated genes involved in this pathway are labeled with red star.

33

34
4. H19 knockdown leads to increased expression of muscle terminal differentiation-
specific genes.
Among many myotube and muscle fiber formation associated genes that were up-
regulated by H19 knockdown, we noticed a dramatic and significant increase of two critical
muscle differentiation related genes: MyoG (Myogenin) and MyHC (myosin heavy chain).
MyoG is one of the four key myogenesis transcriptional factors. It expresses at the later
stage of myotube formation and is essential for directing the terminal differentiation of
commintted myoblasts (Berkes and Tapscott, 2005). MyHC is a structure component of
muscle fibers, usually used as a maker of myotube. The increased expression of MyoG and
MyHC in siH19 versus siCon cells could strongly indicate of the negative regulatory role of
H19 in muscle differentiation. Interestingly, prediction of master regulators (TFs) from the
up-regulated set of genes using iRegulon identified MyoG as a critical TF for many genes in
the up-regulated gene set, suggesting that H19 might negatively regulate muscle
differentiation at least partially through inhibiting MyoG expression. To verify the increase
of MyoG and MyHC observed from RNA-Seq data, we did RT-qPCR to evaluate the RNA
expression change of MyoG and MyHC under siH19 vs siCon. We also measured the protein
expression change of MyoG under siH19 vs siCon. The results turned out to be consistent
with our RNA-Seq results (Fig. 6)
5. H19 knockdown induces precocious myotube formation
Since decrease of H19 leads to increased expression of MyoG and MyHC as well as
other muscle terminal differentiation associated genes, we were curious whether it could
cause observable physiological changes in myotube formation. In order to addressing this
question, we knocked down H19 using siH19 as previously described, followed by imaging
35
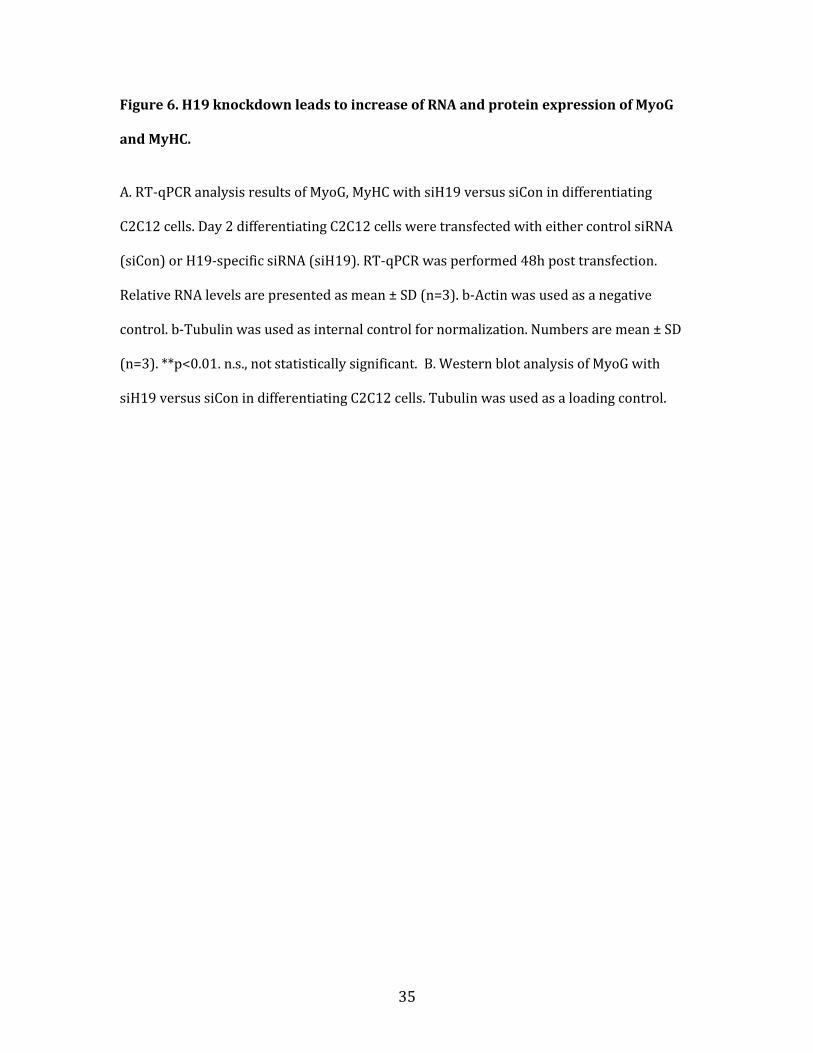
Figure 6. H19 knockdown leads to increase of RNA and protein expression of MyoG
and MyHC.
A. RT-qPCR analysis results of MyoG, MyHC with siH19 versus siCon in differentiating
C2C12 cells. Day 2 differentiating C2C12 cells were transfected with either control siRNA
(siCon) or H19-specific siRNA (siH19). RT-qPCR was performed 48h post transfection.
Relative RNA levels are presented as mean ± SD (n=3). b-Actin was used as a negative
control. b-Tubulin was used as internal control for normalization. Numbers are mean ± SD
(n=3). **p<0.01. n.s., not statistically significant. B. Western blot analysis of MyoG with
siH19 versus siCon in differentiating C2C12 cells. Tubulin was used as a loading control.

36
MyoG MyHC Actin0
1
2
3
4
RelativeRNAlevel siCon
siH19**
**
n.s.
A B

37
Figure 7. Precocious myotube formation induced by H19 knockdown.
C2C12 myoblasts were treated as described in Fig 3A. Immunostaining of MyHC was
performed on cells 48 h post siRNA transfection. The cell nucleus was stained with DAPI to
indicate the cell number under each treatment.

38

39
day 4 differentiating myotubes via immunostaining of MyHC. As shown in Fig 7, many more
myotubes were formed in siH19 cells compared to siCon cells on the 4th day of
differentiation, suggesting H19 depletion leads to precocious myotube formation.
E. Discussion In this study our discoveries clarified the controversy over the role of H19 in muscle
differentiation, revealing that H19 negatively regulates muscle differentiation. Precocious
myotube formation in response to H19 knockdown (Fig. 7) is solid physiological evidence
that supports this conclusion. The up-regulation of muscle terminal differentiation related
genes shown from our gene ontology analysis (Table. 2) and pathway analysis (Fig. 5)
constitutes further molecular evidence supporting the negative regulatory role of H19 in
muscle differentiation. We also found that the inhibition of transcriptional factor myogenin
expression by H19 (Fig. 4) could at least partially contribute to the H19-mediated inhibition
of muscle differentiation.
In fact, an in vivo study conducted later by Martinet et al. verified the
conclusions of this study. These authors discovered that adult loss-of-function H19Δ3 mice
displayed increase muscle mass with hypertrophy compared to wt mice (Martinet et al.,
2016), which is in line with our finding that H19 knockdown in differentiating myoblasts
leads to up-regulation of genes enriched in Hypertrophic Cardiomyopathy (HCM) (Fig. 5).
HCM is a disease that features abnormally thick muscle (hypertrophied) in the heart which
can make it harder for the heart to pump blood (Liew et al., 2017). In addition, Martinet et al.
also found that muscle from H19Δ3 mice has better regeneration potential after injury due
to more efficient proliferation of myoblasts. However, why have the in vitro and in vivo
studies conducted by Dey et al. drawn an opposite conclusion about the role of H19 in
muscle differentiation and regeneration? Dey et al. claimed that H19 promotes muscle
40
differentiation and regeneration through its embedded miR-675 (Dey et al., 2014). The
possible explanation could be that full length H19 and miR-675 act independently or maybe
even oppositely in regulating muscle differentiation. It is also interesting that in a recent
study using mouse models, Park et al. found that substantial overdose of IGF2 inhibits
muscle differentiation, which could not be obviously rescued by overexpression of H19
from transgene. The authors concluded that IGF2 but not H19 plays a major negative role in
regulating muscle differentiation (Park et al., 2017). It is possible that normal level of IGF2
expression is required for muscle differentiation (Yoon and Chen, 2008) while overdose of
IGF2 induces strong negative feedback on muscle differentiation. Since H19 can only
moderately regulate the level of IGF2, restoration of H19 expression could not revert the
effect of overdose of IGF2.
How does full length H19 negatively regulate muscle differentiation at
molecular level? First, H19 can control muscle growth by repressing the expression of its
co-imprinted growth-promoting genes from IGN, such as Igf2, Dlk1. Compared to wt mice,
H19Δ3 mice display increased expression of Igf2 and Dlk1 in adult muscle (Martinet et al.,
2016). Actually, 1.5 fold increase of Igf2 expression in siH19 cells versus siCon cells was also
observed from my RNA-seq data. These results suggest that the role of H19 in muscle is
similar to its role in controlling embryo growth (Gabory et al., 2009), demonstrating that
the major mission of H19 during development is acting against other IGN genes such as Igf2
to restrict growth. During embryonic development, H19 can control the expression of genes
from IGN by recruiting MBD1, bringing repressive histone marks to these target genes
(Monnier et al., 2013). Whether or not H19 uses the same mechanism in regulating muscle
growth needs further investigation. Second, H19 can regulate muscle differentiation by
acting as a molecular sponge for let-7. Our previous study has shown that H19 can bind to
let-7 and modulate its availability, thereby indirectly regulating the expression of let-7
41
target genes (Kallen et al., 2013). Interestingly, overexpression of let-7 leads to increase of
Igf2 expression, suggesting Igf2 is a downstream effector of let-7 (Kallen et al., 2013).
Moreover, H19, let-7 and IGF2 have a similar expression pattern along the progression of
muscle differentiation in vitro: their expression is increased after the onset of myoblast
differentiation, which peaks on about the third day of differentiation then decreases as cells
progress to become terminal differentiated myotubes (Kallen et al., 2013; Kou and Rotwein,
1993; Huang et al., 2014). Together these results suggest that H19 may tightly regulate Igf2
expression in an additional way by acting as a sponge for let-7. Notably, given that miRNAs
of let-7 family target to many genes, the effect of H19/let-7 axis mediated regulation is not
limited to the expression of Igf2. In addition, H19 has been predicted to have binding sites
for many other miRNAs (Kallen et al., 2013). It is possible that H19 regulates muscle
differentiation and regeneration through influencing target genes of other miRNAs that
interact with it. Finally, H19 might inhibit muscle differentiation by negatively controlling
the stability of myogenin mRNA in differentiating myoblasts similar to its negative control
of myogenin expression in myoblasts. H19 has been reported to assist KSRP in degradation
of myogenin mRNA to maintain myoblasts at undifferentiated status (Giovarelli et al., 2014).
Whether a similar mechanism exists in differentiating myoblasts remains unclear. From the
list of upregulated genes form our RNA-seq data, we have identified myogenin as
a potential master regulator that is modulated by H19 during muscle differentiation.
Therefore, further studies about the regulatory mechanism of myogenin expression
mediated by H19 is wanted.
What is the physiological significance of H19-mediated regulation of muscle
differentiation and regeneration? Adequate control of muscle production and preventing
muscle overgrowth seem to be the primary reasons. During both normal or injury induced
myoblasts differentiation, transcriptional factor myoD first initiates the upregulation of

42
genes from IGN including H19 and Igf2. The increased expression of IGN genes makes
myoblast cells transit from quiescent cells into actively proliferating cells. IGF pathway
associated genes such as IGF1 are also upregulated. As a result, after robust proliferation
and growth, myoblast cells become myotubes that lead to myofiber formation and muscle
repair after injury (Martinet et al., 2016). In this case of H19Δ3 mice, H19 depleted
myoblasts have significant higher expression of Igf2 and other IGN genes compared to
control, thereby showing enhanced potential of proliferation and growth, which eventually
leads to muscle hypertrophy and significant increase in the mass of muscles after injury
(Martinet et al., 2016). Overgrowth of muscle could possibly lead to tumorigenesis, given
the fact that children with Beckwith-Wiedemann Syndrome (BWS) (loss of H19 expression
from the maternal allele) are more likely to develop tumors such as Wilm’s tumors and
rhabdomyosarcomas (Martinet et al., 2016). Except for tumorigenesis, what are the
physiological consequences of H19 depletion associated skeletal muscle hypertrophy in
terms of myofiber structure, muscle contraction and metabolism? There is no enough
evidence to draw a conclusion yet. More comprehensive comparisons between skeletal
muscle of H19Δ3 mice and wt mice are needed to answer that question. On the other hand,
the consequences of cardiac muscle hypertrophy potentially mediated by H19 depletion is
more foreseeable leading to possible heart failure. Although there is no in vivo evidence
showing H19 knockout mice have cardiac hypertrophy or heart failure, in vitro studies have
suggested that H19 negatively regulates the differentiation of parthenogenetic embryonic
stem cells (p-ESCs) into beating cardiomyocytes (Yin et al., 2014; Ragina et al., 2012). In
addition, an in vivo study conducted by Liu et al. has demonstrated that H19 negatively
regulates cardiomyocyte hypertrophy via H19/miR-675 axis. Exacerbated cardiac
hypertrophy was observed from a pressure overload-induced mouse model with miR-675
knockdown treatment (Liu et a., 2016).

43
Chapter III
Role of H19 in hepatic glucose production
(This work has been submitted for publication: Title: H19 lncRNA modulates hepatic glucose production by epigenetic modification of Hnf4a, Authors: Na Zhang, Tingting Geng, Ya Liu, Zhangsheng Wang, Yuanyuan Shen, Joao Paulo Camporez, Luisa Dandolo, Gerald I.
Shulman, Gordon G. Carmichae, Hugh S. Taylor & Yingqun Huang)
A. Abstract
Hepatic glucose production (HGP) is crucial in maintaining blood glucose
homeostasis. During starvation, HGP is activated to sustain blood glucose levels. Excessive
HGP is a major contributor to hyperglycemia in type-2 diabetes (T2D), which leads to a lot
of complications including high blood pressure and kidney disease. The molecular
mechanism underlying the dysregulation of HGP in diabetes remains poorly understood.
During fasting, hepatocyte nuclear factor 4α (HNF4α) acts in concert with transcriptional
coactivators to promote gluconeogenesis, by activating the transcription of key
gluconeogenic enzymes including glucose-6-phosphatase (G6pc) and phosphoenolpuruvate
carboxykinase (Pck1). In this study, we show that the H19 long noncoding RNA (lncRNA)
promotes Hnf4α expression by inducing hypomethylation within a conserved promoter
region of this gene. In non-diabetic mice, hepatic H19 expression is acutely increased by
fasting, while in diet-induced glucose intolerant mice, H19 expression level is chronically
elevated. Using genome-wide DNA methylation and transcriptome analyses we demonstrate
that H19 knockdown in human hepatic cells increases promoter methylation and decreases
expression of Hnf4α, with concomitant reduction in glucose production. Consistently, H19
knockout mice show increased promoter methylation and decreased expression of Hnf4α in
the liver, with enhanced insulin-induced suppression of HGP, whereas mice with liver-
specific H19 overexpression display enhanced HGP. Moreover, we show that H19 can be up-

44
regulated by glucagon in a cAMP/PKA-dependent manner. Taken together, our results
reveal a novel epigenetic mechanism by which an evolutionarily conserved lncRNA
regulates HGP and which is unexpectedly shared by normal and pathological conditions.
B. Background
T2D and glucose homeostasis. Type-2 diabetic mellitus (T2D), a disease of
impaired glucose homeostasis, develops as a result of insulin resistance in peripheral
tissues and β-cell dysfunction. Persistently elevated blood glucose level (hyperglycemia) is
the hallmark of T2D. Chronic hyperglycemia causes damages to major organs including the
brain, eyes, heart, kidneys and blood vessels (Rines et al., 2016). Thus, treating
hyperglycemia is most critical in T2D treatment. The liver is the main organ of endogenous
glucose production (EGP), playing an important role in maintaining blood glucose levels. It
is widely accepted that excessive hepatic EGP attributed to elevated rates of
gluconeogenesis and glycogenolysis in the liver is the major contributor to the
hyperglycemia of T2D, with proportionately larger contribution from gluconeogenesis
(Rines et al., 2016). Gluconeogenesis is a process in which substrates such as amino acids,
glycerol, pyruvate and lactate are converted to glucose, while glycogenolysis is a process
wherein glycogen is degraded to generate glucose. Both processes lead to the production of
a phosphorylated form of glucose, glucose-6-phosphate, which cannot be exported into the
circulation until it is dephosphorylated by glucose-6-phosphatase (G6PC) to become
glucose. Since G6PC controls the last rate-limiting step of both gluconeogenesis and
glycogenolysis, it is a key enzyme for endogenous glucose production (Rines et al., 2016). It
has been reported that G6pc deficiency could lead to diseases in both humans and mice.
Infants with G6pc deficiency suffer from glycogen storage disease type Ia (GSD-Ia) with
severe hypoglycemia especially in the morning or before feedings (Ozen, 2007). Likewise,

45
G6pc-deficient mice showed similar symptoms to human GSD-Ia cases, with only a few mice
surviving beyond 5 weeks of age due to a failure to maintain blood glucose homeostasis (Lei
et al., 1996).
Regulation of glycogenolysis and gluconeogenesis. The primary mechanism
responsible for maintaining glucose homeostasis is the secretion of insulin and glucagon
into the blood in response to the blood glucose concentration. During fasting blood glucose
levels become low, triggering glucagon secretion from pancreatic α cells and inhibiting
insulin secretion from pancreatic β cells. After feeding the blood glucose levels increase,
leading to decreased glucagon but increased insulin secretion. Therefore, glucagon and
insulin play opposite roles in the regulation of glycogenolysis and gluconeogenesis:
Glucagon up-regulates glycogenolysis and gluconeogenesis to increase glucose production,
while insulin down-regulates these two processes to inhibit glucose production (Rines et al.,
2016). Insulin also inhibits glucagon secretion from pancreatic α cells to indirectly reduce
glucose production (Edgerton et al., 2009). Similar to the high glucagon and low insulin
status during fasting state, Type-2 diabetic individuals are known to have abnormally high
glucagon levels (Alessio, 2011) and impaired insulin signaling—which is consistent with the
aberrantly elevated gluconeogenesis and glycogenolysis in their livers (Rines et al., 2016).
The regulatory pathways of gluconeogenesis and glycogenolysis form an intricate network
that involves a lot of transcriptional factors and co-activators that regulate the expression of
key gluconeogenic genes including G6pc and Pck1. The enzyme encoded by Pck1 catalyzes
oxaloacetate to form phosphoenolpyruvate (Rines et al., 2016). PGC-1α is a transcriptional
coactivator that regulates energy metabolism by interacting with other transcriptional
activator or coactivators (Zhang et al., 2012). In fasting mice or diabetic mice, PGC-1α is
strongly induced, leading to the activation of an entire program of key gluconeogenic
enzymes including G6PC and PCK1 thereby increasing glucose output (Zhang et al., 2012).

46
Another transcriptional coactivator, the hepatocyte nuclear factor 4α (Hnf4α), is required
for PGC1-1α mediated activation of gluconeogenesis. PGC1-1α and HNF4α cooperatively
bind on the promoters of G6pc and Pck1 to activate the transcription of these genes (Yoon
et al., 2001; Rhee et al., 2003). In the studies of multiple diabetic animal models, hepatic
expression of Hnf4α, G6pc and Pck1 has been found to be up-regulated (Zhang et al., 2012;
Pauli et al., 2014; Wei et al., 2016), which is consistent with observations of enhanced
gluconeogenesis in T2D patients. Although the role of Hnf4α as a transcriptional coactivator
in promoting G6pc and Pck1 expression is well-defined, it remains unclear why the
expression of Hnf4α increases under these conditions.
LncRNA H19 and genomic DNA methylation. From our previous studies, we
found that H19 interacts with S-adenosylhomocysteine hydrolase (SAHH), the only
mammalian enzyme capable of hydrolyzing S-adenosylhomocysteine(SAH) in mouse
skeletal muscle and human cancer cells (Zhou et al., 2015; Zhong et al., 2016). H19 binds to
SAHH and inactivates it from hydrolyzing SAH, which leads to the accumulation of SAH. This
in turn inhibits SAM-dependent methyltransferases including DNA methyltransferases such
as DNMT3B, resulting in decreased DNA methylation (Zhou et al., 2015; Zhong et al., 2016).
Therefore H19 negatively regulates genome-wide DNA methylation by binding and
inhibiting SAHH (Fig. 8).
H19 is expressed at low but appreciable levels in adult livers (Zhang et al., 2016),
but its expression is elevated in the liver of T2D patients (Nilsson et al., 2015) where
gluconeogenesis as well as the expression of critical gluconeogenic genes such as Hnf4α,
G6pc and PCK1 are also abnormally enhanced. Whether there is a causal relationship
between up-regulation of H19 expression and that of gluconeogenic gene expression
remains unexplored. In human endometrial cancer cells, we noticed a correlation between
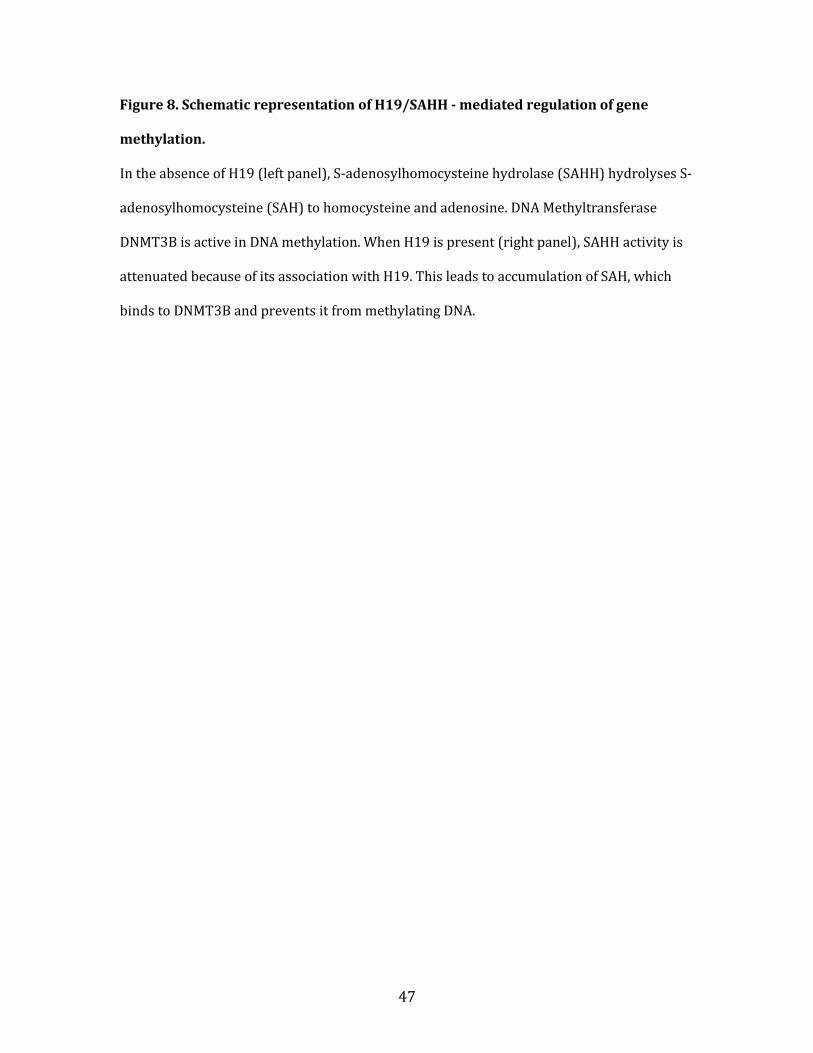
47
Figure 8. Schematic representation of H19/SAHH - mediated regulation of gene
methylation.
In the absence of H19 (left panel), S-adenosylhomocysteine hydrolase (SAHH) hydrolyses S-
adenosylhomocysteine (SAH) to homocysteine and adenosine. DNA Methyltransferase
DNMT3B is active in DNA methylation. When H19 is present (right panel), SAHH activity is
attenuated because of its association with H19. This leads to accumulation of SAH, which
binds to DNMT3B and prevents it from methylating DNA.
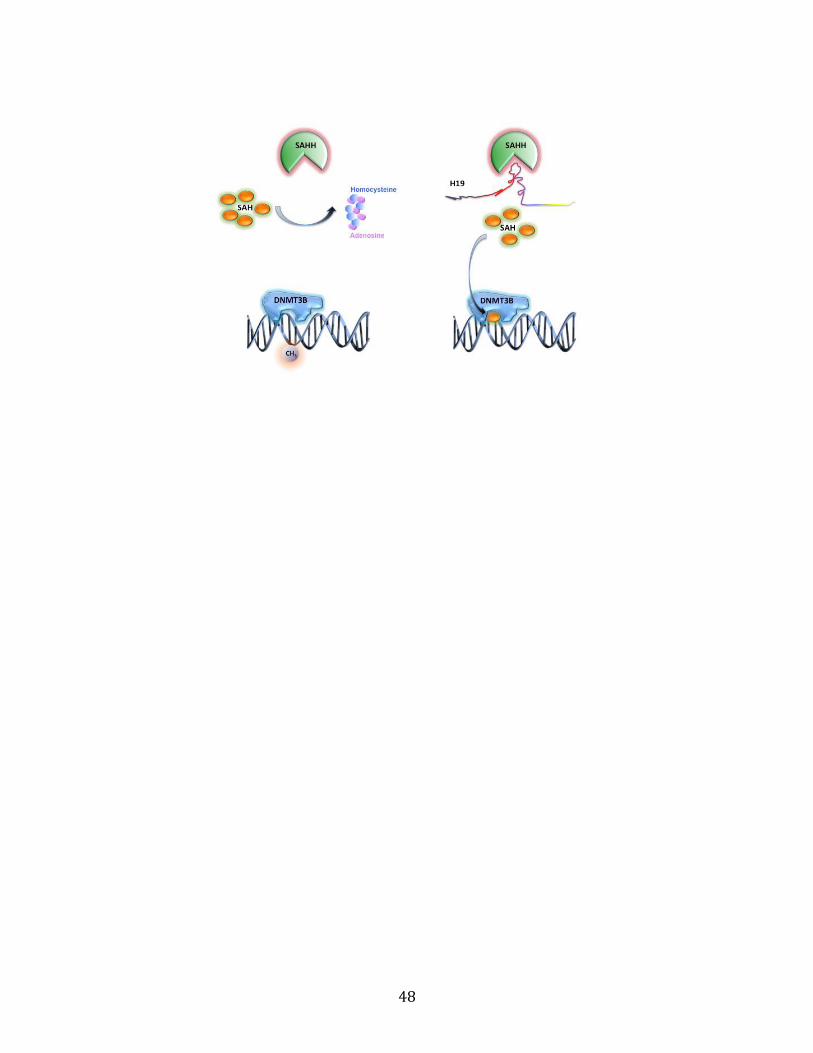
48

49
decreased H19 expression and increased promoter methylation of Hnf4α (Zhong et al.,
2016). It is possible that H19 negatively regulates DNA methylation at Hnf4α promoter via
interacting with SAHH. Given that promoter usually leads to transcriptional repression, H19
may positively regulate Hnf4α expression through inhibiting Hnf4α promoter methylation
via H19/SAHH interaction. Therefore, we hypothesize that H19 may modulate Hnf4α
expression through DNA methylation, and that increased H19 may contribute to abnormal
hepatic glucose production in T2D patients.
In this work we report that hepatic H19 expression is increased acutely during
fasting in non-diabetic mice and chronically in high fat diet (HFD) – induced glucose
intolerant mice. Using cell culture and mouse models, combined with genome-wide
methylation and transcriptome analyses we demonstrate that H19 induces promoter
hypomethylation of Hnf4α, contributing to its increased expression and subsequent
activation of the gluconeogenesis program. Thus, H19 acts as a novel epigenetic modulator
of hepatic glucose production.
C. Material and Methods 1. Materials
Antibodies for HNF4A (Abcam, Cambridge, UK, cat# ab181604; used at a dilution of
1/1000), G6PC (Abcam, cat# ab83690; used at a dilution of 1/500), PCK1 (Abcam, cat#
ab70358; used at a dilution of 1/1000), and ACTB (Cell Signaling, Danvers, MA, cat# 4967;
used at a dilution of 1/5000) were purchased. Control siRNA (siCon) and human H19 siRNA
(siH19) were previously described (Ghazal et al., 2015). Glucagon (Sigma-Aldrich, St. Louis,

50
MO, cat# G2044-1MG) and D-Eritadenine (DEA, Santa Cruz, Dallas, TX, cat# sc-207632)
were purchased. DEA was used at a final concentration of 20 μM.
2. Animals
All animal work was approved by the Yale University Institutional Animal Care and
Use Committee. All mice used in this study were male. Mice were housed at 22℃–24℃ with
a 12 h light/12 h dark cycle with standard chow (Purina Chow; Purina Mills, Richmond, IN,
USA) and water provided ad libitum. CD-1 mice were obtained from Charles River
Laboratories (Wilmington, MA, USA). The H19 KO and WT mice with C57BL/6J background
were gifts from Professor Luisa Dandolo (Institute Cochin, Paris, France). For fasting
experiments, 12-week-old mice were fasted for 12 h and then sacrificed by ether anesthesia
followed by cervical dislocation. Liver samples were collected and snap frozen in liquid
nitrogen and stored at -80℃ for further analysis. For HFD experiments, WT C57BL/6J mice
at 9-week-old were exposed to HFD for 8 weeks, followed by glucose tolerance test (GTT)
and gene expression analysis by RT-qPCR and Western blot.
3. AAV production and in vivo AAV administration
The AAV-H19 expression plasmid was created by cloning a mouse H19 fulllength
DNA (NR_001592) into an AAV8-TBG vector (Vigene Biosciences, Rockville, MD, USA).
Viruses were prepared by Vigene Biosciences Company. Wildtype CD1 mice at
16weekold were tail vein injected with AAVH19 or AAVVec (negative control) at 1x10¹⁰
gc/mouse in 150 μl of PBS/5% sorbitol. The viral dose was based on a previously published
report (Bell et al., 2016). Before injection, mice were exposed to heat lamp to dilate the tail
vein and then placed in a restrainer permitting access to the tail vein. The tail was cleansed
with 70% ethanol and the injection was made in the lateral vein, using 27gauge needles.

51
4. Pyruvate tolerance test (PTT) and glucose tolerance test (GTT)
PTT and GTT were performed as previously described (Toda et al., 2016). Briefly, Mice injected with AAVH19 or AAVVec were subjected to PTT at two
weeks following the viral injection. Mice were fasted for 16 hours before PTT being carried
out. Sodium pyruvate powder (SigmaAldrich, St. Louis, MO, cat# P5280) was resolved in
PBS and the solution was filter sterilized before injection. The body weight and the fasting
glucose levels of each mouse were measured before sodium pyruvate injection. Each mouse
received an intraperitoneal injection (i.p.) of 2 g/kg BW sodium pyruvate. Blood glucose
concentrations were measured from blood samples obtained from the tail vein at 15, 30, 45,
60, 90, and 120 minutes after the injection. Fasting plasma insulin levels were measured
using Mouse Insulin ELISA kit (EMD Millipore, Billerica, MA, cat# EZRMI13K) according to
the manufacturer’s instructions.
For GTT experiment, following overnight (12 h) fasting, the body weight and the
basal level of blood glucose of each mouse were measured. Glucose (1 g/kg BW) was
injected i.p. and the blood glucose concentration was measured from a blood sample
obtained from the tail vein 15, 30, 45, 60, 90, and 120 minutes after the glucose injection.
5. Hyperinsulinemiceuglycemic clamp studies
The experiments were carried out on 11week old WT and H19 KO mice as
previously described with minor modification (Jurczak et al., 2012) (Fig. 12C-G). Briefly,
mice were anesthetized and cannulated. After recovery for 7 days, mice were fasted
overnight (14 h) followed by infusion of D[3-3H] glucose to assess the basal rate of whole
body glucose turnover. Following the basal period, a 2 hour hyperinsulinemiceuglycemic
clamp was conducted with a fixed amount of insulin [4 mU/(kgmin)] and a variable

52
amount of 20% dextrose to maintain euglycemia. Tissues were collected at the end of the
clamp.
6. Cell culture and transfection
HepG2 cells (ATCC, Manassas, VA, cat# HB-8065) were authenticated and were free
from mycoplasma contamination. The cells were maintained in ATCC-formulated EMEM
(30-2003) supplemented with 10% fetal bovine serum, heat inactivated, and 1%
penicillin/streptomycin. To achieve H19 knockdown in HepG2 cells, H19-specific siRNA
was used and the cells were transfected in suspension. To prepare siRNA transfection
solution for one well of a 24-well plate, 2 pmol of siCon or siH19 was gently mixed with 100
μl OPTI-MEM. In parallel, 1 μl Lipofectamine 2000 was mixed with 100 μl OPTI-MEM. After
incubation at room temperature for 5min, the two mixtures were combined and incubated
at room temperature for 20 - 30 min to allow the formation of siRNA/lipid complexes.
During the above incubation period, growing HepG2 cells were collected, counted and
pelleted, with the supernatant removed. At the end of incubation, the 200 μl transfection
solution was used to re-suspend cell pellet (2 × 10⁵ cells). After incubation at room
temperature for 10 min, regular growth medium was added at a ratio of 1:2 (1 volume of
transfection solution/2 volumes of growth medium) and the cell suspension was
transferred to the culture plate. After 5 h incubation at 37 °C in 5% CO2, the medium was
replaced with fresh growth medium. RNA, genomic DNA, and protein were extracted and
analyzed at the indicated time points following transfection.
7. Methyl-MiniSeq library construction
Genomic DNA was extracted from liver tissue samples using Quick-gDNA MicroPrep
(Zymo Research Corporation, Irvine, CA; cat# D3021) according to the manufacturer’s

53
instructions. For library preparation, 200 to 500 ng of genomic DNA was digested with 60
units of TaqαI and 30 units of MspI (NEB) sequentially and then extracted with DNA Clean &
Concentrator-5 kit (Zymo Research, cat# D4003). Pre-annealed adapters containing 5’ -
methyl-cytosine instead of cytosine were ligated to the digested genomic DNA fragments
according to Illumina’s specified guidelines (www.illumina.com). Adaptor-ligated
fragments of 150–250 and 250–350 bp in size were recovered from a 2.5% NuSieve 1:1
agarose gel (Zymoclean Gel DNA Recovery Kit, Zymo Research, cat# D4001). Then the
recovered fragments were bisulfite-treated and purified using the EZ DNA Methylation-
Lightning Kit (Zymo Research, cat# D5020). The fragments were then subjected to PCR and
the resulting products were purified (DNA Clean & Concentrator, Zymo Research, cat#
D4005) for sequencing on an Illumina HiSeq.
8. Methyl-MiniSeq sequence alignments and data analysis
Sequence reads from bisulfite-treated EpiQuest libraries were identified using
standard Illumina base-calling software and then analyzed using a Zymo Research
proprietary analysis pipeline, which is written in Python and used Bismark
(http://www.bioinformatics.babraham.ac.uk/projects/bis mark/) to perform the alignment.
Index files were constructed using the bismark_genome_preparation command and the
entire reference genome. The non-directional parameter was applied while running
Bismark. All other parameters were set to default. Filled-in nucleotides were trimmed off
when doing methylation calling. The methylation level of each sampled cytosine was
estimated as the number of reads reporting a C, divided by the total number of reads
reporting a C or T. Fisher’s exact test or t-test was performed for each CpG site which has at
least five reads coverage, and promoter, gene body and CpG island annotations were added

54
for each CpG included in the comparison. Data are available from the GEO with accession
number GSE103437.
9. RNA-seq and data analysis.
HepG2 cells were transfected with siCon or siH19 in a 6-well plate. RNA was
extracted from cells 48 h after transfection using the Purelink RNA mini kit (ThermoFisher
Scientific, Waltham, MA, cat# 12183018A). RNA-seq libraries were prepared using the
Illumina TruSeq Stranded Total RNA LT kit with Ribo-Zero Human/Mouse/Rat, setA
(Illumina, San Diego, CA, cat# RS-122–2201) according to the manufacturer’s instructions.
Briefly, 1 μg of total RNA was subjected to Ribo-Zero depletion to remove rRNAs. The
remaining RNA was purified, fragmented and primed with random hexamers for cDNA
synthesis. After first and second cDNA synthesis, cDNA fragments were adenylated and then
ligated to indexing adapters. The cDNA fragments were amplified by PCR, purified and then
sequenced on an Illumina NextSeq500 using paired-end chemistry and 76-bp cycles.
Sequencing data are available from the GEO with accession number GSE103437.
Illumina BaseSpace (https://basespace.illumina.com/)-embedding tools were used
to analyze the RNA-seq data. RNA-Seq Alignment v1.0.0 was used to map sequencing reads
to hg19 genome and quantify reads of genes. DESeq2 v1.0.0 was applied to calculate
differential expression of genes. IPA (Ingenuity Pathway Analysis, QIAGEN Inc.,
https://www.qiagenbioinformatics.com/products/ingenuitypathway-analysis) was used to
identify pathways that were enriched across the differentially expressed genes.

55
10. RNA extraction and RT-qPCR
Total RNAs were extracted from HepG2 cells or mouse liver samples using PureLink
RNA Mini Kit (ThermoFisher Scientific, Waltham, MA, cat# 12183018A). cDNA synthesis
was performed with 0.5 - 1 μg of total RNA in a 20 μl reaction using PrimeScript RT Reagent
Kit (TAKARA, Japan, cat# RR037A). Real-time quantitative PCR was performed in a 15 μl
reaction containing 0.5-1 μl of cDNA using iQSYBRGreen (BIO-RAD, Hercules, CA, cat
#1708880) in a Bio-Rad iCycler. PCR program starts with initial denaturation at 95°C for 5
min, followed by 40 cycles of 30 sec at 95°C, 30 sec at 60°C, and 30 sec at 72°C. PCR
amplification specificity was verified by melting curve analysis and agarose gel
electrophoresis. The threshold cycle (Ct) values of each sample were used in the post-PCR
data analysis. Gene expression levels were normalized against house-keeping genes Hprt1
and Rpl0. Real-time PCR primers are listed in Table 3.
11. Western blot analysis
HepG2 cells in a 24-well plate were quickly lysed in the well in 2x SDS-sample buffer
(100 μl/well). Cell lysate was then immediately transferred to a 1.5 ml tube and heated at
100 °C for 5 min, with occasional vortexing, followed by centrifugation at 12,000 rpm for 10
min at room temperature. The supernatant was transferred to a new tube and stored at -20℃
for further analysis. In the case of liver samples, about 10 mg of frozen tissues were
homogenized in 200 μl of 2x SDS-sample buffer and then heated at 100 °C for 5 min, with
occasional vortexing, followed by max speed centrifugation. The supernatant of each sample
was loaded onto a 12% SDS-PAGE gel (5 μg/well), followed by western blot analysis. The
linear dynamic range of each protein of interest was determined by serial dilutions. Bands
on Western blot gels were quantified using Image J. Housekeeping gene beta-actin was used
as a loading control.

56
12. Glucose output assay
This assay was performed using Amplex Red Glucose/Glucose Oxidase Assay Kit
(Invitrogen, Molecular Probes, cat# A22189) according to the manufacturer’s instructions.
Briefly, HepG2 cells cultured in a 24-well plate were transfected with either siCon or siH19.
Forty-eight hours after transfection, glucose-free DMEM (Gibco, cat# 11966-025) was used
to replace the culture medium to let the cells use up the remaining glucose. Two hours later,
120 μl glucose production medium (glucose-free DMEM, 20 mM sodium lactate, 2 mM
sodium pyruvate, and 0.5% BSA) was used to replace the glucose-free DMEM to collect
newly synthesized glucose. After 4 h of incubation, 50 μl of glucose production medium
supernatant was used for measurement of glucose concentration, which was normalized
against total protein content of cells.
13. Quantitative Methylation-Specific PCR (QMSP)
Genomic DNA was extracted from HepG2 cells in one well of 24-well plates or from
mouse liver tissue samples using Quick-gDNA MicroPrep (Zymo Research, Irvine, CA, cat#
D3021) according to the manufacturer’s instructions. Bisulfite treatment and DNA
purification were performed using EZ DNA Methylation-Gold Kit (Zymo Research, cat#
D5006) with 200 ng of DNA as input. At the last step of purification, 100 μl of elution buffer
was used to elute DNA from each column. Real-time quantitative PCR was performed in a 15
μl reaction containing 5 μl of the eluant using iQSYBRGreen (Bio-Rad, Hercules, CA, cat#
1708880) in a Bio-Rad iCycler. Two sets of PCR primers were designed: one for
unmethylated and one for methylated DNA sequences. The PCR primers were used at a final
concentration of 0.6 μM in each PCR reaction. PCR was performed by initial denaturation at
95°C for 5 min, followed by 40 cycles of 30 sec at 95°C, 30 sec at 60°C, and 30 sec at 72°C.
PCR amplification specificity was verified by melting curve analysis and agarose gel

57
electrophoresis. The threshold cycle (Ct) values of each sample were used in the post-PCR
data analysis. The relative levels of methylated versus unmethylated DNA sequences are
presented. The primers used for QMSP are listed in Table 3.
14. Statistical Analysis
Statistical analyses and figure construction were performed using GraphPad Prism
version 7.01 (GraphPad Software, La Jolla California USA, www.graphpad.com). In vitro data
are presented as mean ± standard deviation (SD), while in vivo data are presented as mean
± standard error of the mean (SEM). Both data are analyzed using two-tailed Student t test.
P values at 0.05 or smaller (two-sided) were considered statistically significant.
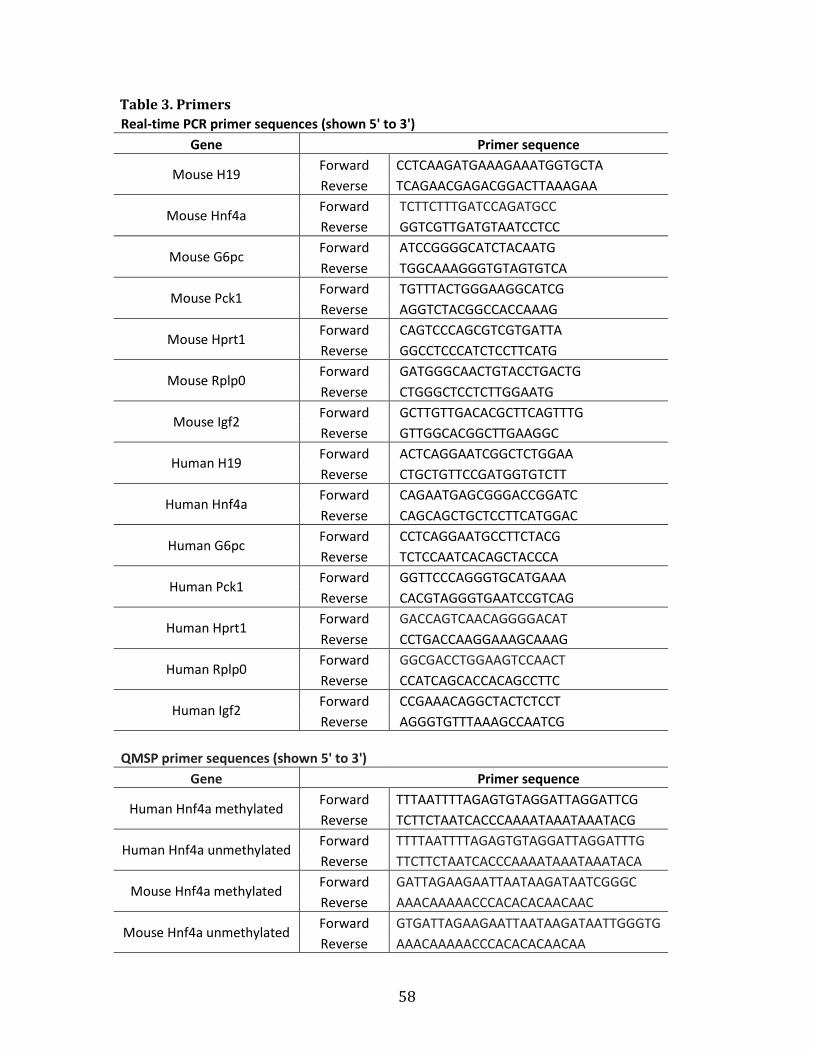
58
Table 3. Primers
Real-time PCR primer sequences (shown 5' to 3')
Gene Primer sequence
Mouse H19 Forward CCTCAAGATGAAAGAAATGGTGCTA
Reverse TCAGAACGAGACGGACTTAAAGAA
Mouse Hnf4a Forward TCTTCTTTGATCCAGATGCC
Reverse GGTCGTTGATGTAATCCTCC
Mouse G6pc Forward ATCCGGGGCATCTACAATG
Reverse TGGCAAAGGGTGTAGTGTCA
Mouse Pck1 Forward TGTTTACTGGGAAGGCATCG
Reverse AGGTCTACGGCCACCAAAG
Mouse Hprt1 Forward CAGTCCCAGCGTCGTGATTA
Reverse GGCCTCCCATCTCCTTCATG
Mouse Rplp0 Forward GATGGGCAACTGTACCTGACTG
Reverse CTGGGCTCCTCTTGGAATG
Mouse Igf2 Forward GCTTGTTGACACGCTTCAGTTTG
Reverse GTTGGCACGGCTTGAAGGC
Human H19 Forward ACTCAGGAATCGGCTCTGGAA
Reverse CTGCTGTTCCGATGGTGTCTT
Human Hnf4a Forward CAGAATGAGCGGGACCGGATC
Reverse CAGCAGCTGCTCCTTCATGGAC
Human G6pc Forward CCTCAGGAATGCCTTCTACG
Reverse TCTCCAATCACAGCTACCCA
Human Pck1 Forward GGTTCCCAGGGTGCATGAAA
Reverse CACGTAGGGTGAATCCGTCAG
Human Hprt1 Forward GACCAGTCAACAGGGGACAT
Reverse CCTGACCAAGGAAAGCAAAG
Human Rplp0 Forward GGCGACCTGGAAGTCCAACT
Reverse CCATCAGCACCACAGCCTTC
Human Igf2 Forward CCGAAACAGGCTACTCTCCT
Reverse AGGGTGTTTAAAGCCAATCG
QMSP primer sequences (shown 5' to 3')
Gene Primer sequence
Human Hnf4a methylated Forward TTTAATTTTAGAGTGTAGGATTAGGATTCG
Reverse TCTTCTAATCACCCAAAATAAATAAATACG
Human Hnf4a unmethylated Forward TTTTAATTTTAGAGTGTAGGATTAGGATTTG
Reverse TTCTTCTAATCACCCAAAATAAATAAATACA
Mouse Hnf4a methylated Forward GATTAGAAGAATTAATAAGATAATCGGGC
Reverse AAACAAAAACCCACACACAACAAC
Mouse Hnf4a unmethylated Forward GTGATTAGAAGAATTAATAAGATAATTGGGTG
Reverse AAACAAAAACCCACACACAACAA
59
D. Results 1. H19 knockdown reduces gluconeogenic gene expression and glucose production
To determine whether H19 may regulate HGP by regulating gluconeogenic genes,
we used the HepG2 human liver cell line as an in vitro model system. Thus, HepG2 cells were
transfected with control siRNA (siCon) or H19-specific siRNA (siH19) (Zhong et al., 2016)
followed by glucose production assay. When H19 was downregulated (Fig. 9A, left column),
the expression of Igf2 was not affected (right column), despite that H19 and Igf2 are co-
regulated in mouse skeletal muscle during development (Gabory et al., 2010). There was a
significant decrease in glucose output in the H19 knockdown cells (Fig. 9B), suggesting a
positive role of H19 in glucose production. Next, H19 knockdown experiments were
performed in HepG2 cells, followed by genome-wide transcriptome analysis. As shown in
Fig. 9C, RNA-seq analysis revealed a significant decrease in the expression of Hnf4 as well
as key gluconeogenic enzyme genes Pck1 and G6pc, which was further confirmed by RT-
qPCR (Fig. 9D) and Western blotting (Fig. 9E). Collectively, these results suggest that H19
increases glucose production at least in part by stimulating gluconeogenic gene expression.
2. H19 regulates Hnf4a promoter methylation
In close inspection of our previous genome-wide methylation data from human
endometrial cancer cells (Zhong et al., 2016) we noticed a correlation between decreased
H19 expression and increased methylation at multiple CpG sites within a 362-bp highly
conserved promoter region of human Hnf4 (herein designated as differentially
methylated region, or DMR) (Fig. 10). To determine whether H19 knockdown in HepG2
cells might also lead to increased methylation of the DMR, quantitative methylation-specific
PCR (QMSP) was performed using previously described methods (Zhou et al., 2015; Zhong
et al., 2016).

60
Figure 9. Effects of H19 knockdown on glucose production and gluconeogenic gene
expression in HepG2 cells.
A. Cells were transfected with siCon or siH19, followed by RNA extraction and RT-qPCR
analysis 48 h later. Transfection experiments (in a 24-well scale) were performed three
times with one representative results shown. Relative RNA levels are presented as mean ±
SD (n=3). Error bars were calculated based on triplicate PCR reactions. **p<0.01. B. Cells
were transfected with siCon or siH19 in a 24-well scale. Glucose output assays were
performed 48 h later. Relative glucose outputs are presented. Numbers are mean ± SD (n=5).
**p<0.01. C. RNA-seq results showing fold decreases in the mRNA levels of Hnf4a, Pck1 and
G6pc in siH19- versus siCon-transfected cells. Adjusted p values based on three transfected
wells in each group are shown. D. RT-qPCR results of cells transfected with siCon or siH19
at 48 h time point from C. E. Cells were transfected with siCon or siH19, followed by
Western blot analysis 48 h later. Representative gel images from three transfection
experiments are shown, with fold decreases in siH19 compared to siCon transfected cells
marked on the right. Numbers are mean ± SD (n=3). **p<0.01.

61

62
Figure 10. Sequences of DMRs in the conserved promoter region of human and mouse
Hnf4 .
The three differentially methylated cytosine residues in human or mouse are highlighted in
red. The methylation level changes of each methylated cytosine from genome-wide DNA
methylation seq data are indicated. The numbers at the beginning and end of the sequences
mark the positions of the indicated nucleotides in the chromosomes.

63

64
As shown in Fig. 11A (compare red bar to blue bar), cells treated with siH19 had an increase
in promoter methylation compared to cells treated with siCon. As increased promoter
methylation often represses gene expression, there was indeed a decrease in the Hnf4a
mRNA level in siH19 versus siCon treated cells (Fig. 11B, right column, compare red bar to
blue bar). As H19 is known to bind SAHH and inactivate it, leading to decreased DNA
methylation (Zhou et al., 2015; Zhong et al., 2016), we tested whether this H19/SAHH
pathway might be involved in the regulation of Hnf4 methylation. As expected, in the
presence of DEA, a SAHH-specific inhibitor (which mimics the inhibitory function of H19),
both methylation (Fig. 11A, compare green bar to red bar) and mRNA (Fig. 11B, right
column, compare green bar to red bar) of Hnf4 were restored to control levels. Taken
together, these results suggest that H19 regulates promoter methylation and expression of
Hnf4 in hepatic cells and that this regulation is dependent on the H19/SAHH pathway.
3. Fasting upregulates H19 and induces hypomethylation of Hnf4a
To test whether this H19-mediated regulation of Hnf4 and HGP occurs in vivo, we
took advantage of the fasting mouse model which is known to increase HGP. Overnight
fasting upregulated H19, together with Hnf4 , Pck1 and G6pc at both the mRNA (Fig. 12A)
and protein (Fig. 12B) levels. Thus, H19 expression is induced by fasting under
physiological conditions, which is not previously documented in the literature. As decreased
H19 expression increases promoter methylation of Hnf4 (Fig.10, Fig. 11A), we predicted
that fasting (which increases H19 expression) would decrease Hnf4 methylation and
subsequently increases its expression. Indeed, genome-wide DNA methylation analysis
revealed decreased methylation at multiple CpG sites within the conserved promoter region
65
Figure 11. Regulation of Hnf4 promoter methylation via the H19/SAHH pathway.
A. HepG2 cells were transfected with siCon, siH19, or siH19 plus DEA. Genomic DNAs were
extracted 15 h later and analyzed by QMSP. Numbers are mean ± SD (n=3). **p<0.01. B.
HepG2 cells were treated as described in A. RNAs were extracted 24 h later and analyzed by
RT-qPCR. Numbers are mean ± SD (n=3). **p<0.01. DEA, D-Eritadenine, a SAHH-specific
inhibitor.

66
A B
67
of Hnf4 in fasted versus control mouse livers (Fig. 10), which was further confirmed by
QMSP (Fig. 12C). Collectively, these results suggest that fasting increases hepatic H19
expression, leading to promoter hypomethylation and increased expression of Hnf4 ,
which subsequently activates gluconeogenesis and HGP. In contrast to Hnf4a whose
promoter became hypomethyalted in response to fasting, we noticed that the promoters of
both G6pc and Pck1 showed hypermethylation. This suggests that the increase in
expression of G6pc and Pck1 in fasted liver is not a direct effect of H19 but rather a result of
HNF4A-dependent regulation. Collectively, the results suggest that fasting leads to
increased hepatic H19 expression and decreased Hnf4a promoter methylation, thereby
contributing to increased Hnf4a expression and HGP.
4. Glucagon upregulates H19
During fasting glucagon is the main peptide hormone secreted from the alpha cells
of the pancreas. It acts on the glucagon receptor to increase cAMP, which activates cAMP-
dependent protein kinase A (PKA), leading to enhanced gluconeogenic gene expression
(Rines et al., 2016). Incubation of HepG2 cells with glucagon stimulated H19 expression (Fig.
13, second bar from the left), an effect which was mimicked by cAMP (third bar) and
abolished by H89, a pharmacological inhibitor of PKA (He et al., 2016) (fourth bar). These
results suggest that glucagon released during fasting may contribute to H19 up-regulation
and that the cAMP-PKA signaling may be involved in this regulation.
5. H19 deletion mice exhibit enhanced insulin-mediated suppression of HGP
The imprinted H19-Igf2 locus plays an important role in embryo development and
growth control (Gabory et al., 2010). It was not surprising that the whole-body H19

68
Figure 12. Effects of fasting on H19 and gluconeogenic gene expression.
A. CD-1 mice were fasted overnight. RT-qPCR analysis was performed on liver samples
collected from fasted and non-fasted (Ctr) animals. Scatter plots of RNA levels are shown.
The horizontal line depicts group median and the whiskers mark the interquartile range.
Numbers are mean ± SEM (n=8-9). **p<0.01; *p<0.05. B. CD-1 mice were overnight fasted,
followed by protein analysis of the indicated genes by Western blotting. Representative gel
images from three mice from each group are shown. The fold increases in fasted versus
non-fasted liver are marked on the right. Numbers are mean ± SEM (n=8-9). **p<0.01;
*p<0.05. C. Scatter plots of Hnf4 methylation as assessed by QMSP in fasted and control
livers. Numbers are mean ± SEM (n=8-9). *p<0.05.

69

70
Figure 13. Glucagon up-regulates H19 via cAMP/PKA pathway.
HepG2 cells were treated with the indicated reagents for 2 h. Then RT-qPCR was performed
on RNAs extracted from the cells. Relative H19 RNA levels are presented. Numbers are
mean ± SD (n=3). **p<0.01. cAMP, cyclic AMP, a known activator of PKA. H89, a specific
inhibitor of PKA.

71

72
knockout mice H19Δ3 showed an overgrowth phenotype and skeletal muscle hyperplasia
and hypertrophy (Ripoche et al., 1997; Martinet et al., 2016). Remarkably, hepatic H19 loss-
of-function led to increased Hnf4 promoter methylation (Fig. 14A) with decreased
expression of Hnf4 and gluconeogenic enzymes (Fig. 14B), further supporting a role of
H19 in epigenetic regulation of Hnf4 and gluconeogenic gene expression. To determine the
physiological role of H19 in HGP, hyperinsulinemic-euglycemic clamp studies were
performed on WT and KO mice. The glucose infusion rate (GIR) in the KO mice was
significantly higher compared to the WT mice (Fig. 15A), reflecting enhanced whole-body
insulin sensitivity. While neither the peripheral glucose uptake (Fig. 15B) nor the
endogenous glucose production under the basal condition (Fig. 15D) was affected, there
was a significant reduction in endogenous glucose production (EGP) under the clamp (Fig.
15C) condition (see Discussion). Thus, the improved whole-body insulin sensitivity could be
attributed to enhanced insulin-dependent suppression of EGP, which could be explained, at
least in part, by lower levels of the key gluconeogenic enzymes in the KO liver (Fig. 15E).
Taken together, these results are consistent with the view that H19 depletion leads to
increased promoter methylation of Hnf4a, thereby contributing to its decreased expression
which in turn lowers key gluconeogenic enzyme production and sensitizes the liver for
insulin-induced suppression of HGP.
To test whether miR-675 encoded by H19 and/or Igf2 (which is co-regulated with
H19) in skeletal muscle may contribute to the H19-mediated regulation, hepatic expression
of miR-675 and Igf2 are measured by RT-qPCR. In WT mice, no significant difference in
levels of Igf2 mRNA and miR-675 was detected between control and fasted liver (Fig. 16A,
Fig. 16B). Nor was there a significant difference in the Igf2 mRNA between WT and KO liver
without or with fasting (Fig. 16C and Fig. 16D). Taken together with the notion that Igf2

73
Figure 14. H19 KO mice show altered Hnf4a methylation and gluconeogenic gene
expression.
A. Genomic DNA was extracted from livers of WT (n=6) and H19 KO (n=5) mice fed ad
libitum. Promoter methylation of Hnf4 was assessed by QMSP. Numbers are mean ± SEM
(n=5-6). **p<0.01. B. Proteins were extracted from of WT (n=6) and H19 KO (n=5) mice fed
ad libitum. Levels of the indicated proteins were analyzed by Western blotting.
Representative gel images from three mice from each group are shown, with quantifications
presented on the right. Numbers are mean ± SEM (n=5-6). **p<0.01; *p<0.05.

74

75
Figure 15. H19 KO mice exhibit increased insulin-mediated suppression of EGP. A-D. Hyperinsulinemic/euglycemic clamp studies. Compared to the WT mice (n=5), the KO
mice (n=7) have an increased glucose infusion rate (A), unchanged whole-body glucose
uptake (B), and increased insulin-stimulated EGP suppression (C) with no change in basal
EGP (D). Numbers are mean ± SEM (n=5-7). **p<0.01; *p<0.05. E. Proteins were extracted
from overnight fasted WT (n=5) and KO (n=7) mice. Levels of the indicated proteins were
analyzed by Western blotting. Representative gel images from three mice from each group
are shown, with quantifications presented on the right. Numbers are mean ± SEM (n=5-7).
**p<0.01; *p<0.05.

76
A B
C D E

77
Figure 16. Hepatic expression of Igf2 and miR-675.
A-B. CD-1 mice were fasted overnight. RT-qPCR analysis was performed on liver samples
collected from fasted and non-fasted (Ctr) animals. Expressions of IGF2 and miR-675 were
assessed. Numbers are mean ± SEM (n=4-5). C-D. WT and H19 KO mice were either un-
fasted or fasted overnight, followed by RNA extraction from livers and IGF2 expression
analysis by RT-qPCR. Numbers are mean ± SEM (n=5-6). n.s., not statically significant.

78
miR-675-5p miR-675-3p0.0
0.5
1.0
1.5
miR-675
RelativeRNAlevel Control
Fastingn.s.
n.s.
Control Fasting0.0
0.5
1.0
1.5
RelativeRNAlevel
IGF2
n.s.
WT KO0.0
0.5
1.0
1.5
RelativeRNAlevel
IGF2 (Basal)
n.s.
WT KO0.0
0.5
1.0
1.5
2.0
RelativeRNAlevel
IGF2(Fasting)
n.s.
A B
C D
79
expression was not affected by H19 knockdown in HepG2 cells (Fig. 9A), we conclude that
Igf2 and miR-675 are likely not involved in the H19-dependent regulation of hepatic glucose
production.
6. Liver-specific H19 overexpression augments HGP
To determine whether hepatic H19 gain-of-function promotes Hnf4a promoter
hypomethylation and HGP, we overexpressed H19 in the mouse liver using a recombinant
adeno-associated virus serotype 8 (AAV8) vector shown to have superior tropism for liver
(Yan et al., 2012, Bell et al., 2016). Liver-specific H19 overexpression was achieved by
intravenous administration of AAV-H19 that expresses mouse full-length H19 driven by a
liver-specific promoter, thyroxin-binding globulin (TBG) (Yan et al., 2012, Bell et al., 2016)
(Fig. 17A). In H19 overexpressed livers Hnf4a promoter methylation was decreased (Fig.
17B), with concomitant increase in expression of HNF4A, G6PC and PEPCK (Fig. 17C). The
H19 gain-of-function mice also had an elevated fasting blood glucose (Fig. 18A) but with no
change in fasting insulin levels (Fig. 18B). Pyruvate tolerance tests (PPT, a readout for HGP)
(Stanya et al., 2013, Kim et al., 2011) showed that the H19-overexpression mice had higher
glucose levels following pyruvate injection (Fig. 18C). Taken together, these results suggest
that liver-specific H19 overexpression causes Hnf4a promoter hypomethylation which in
turn increases expression of HNF4A and its regulated gluconeogenic genes leading to
enhanced HPG.
7. H19 expression is chronically increased in the liver of glucose intolerant mice
To test whether increased hepatic H19 expression seen in the T2D patients (Nilsson
et al., 2015) could be recapitulated in a mouse model, we treated mice with HFD to induce
glucose intolerance (Fig. 19B). These mice displayed increased hepatic expression of H19

80
Figure 17. Mice with liver-specific H19 overexpression exhibit altered Hnf4a methylation,
gluconeogenic enzyme expression.
A. RT-qPCR results of hepatic H19 expression in livers of mice injected with AAV-Vec or
AAV-H19. n=5 animals in each group. Numbers are mean ± SEM (n=5). **p<0.01. B. QMSP
results of Hnf4 ylation. n=5 animals in each group. Numbers are mean
± SEM (n=5). *p<0.05. C. Western blot results of gluconeogenic gene expression in livers of
mice injected with AAV-Vec or AAV-H19. Numbers are mean ± SEM (n=3). *p<0.05.

81

82
Figure 18. Mice with liver-specific H19 overexpression show elevated HGP.
A. Fasting blood glucose levels from mice injected with AAV-Vec or AAV-H19. n=5 animals
in each group. Numbers are mean ± SEM (n=5). *p<0.05. B. Fasting plasma insulin levels of
mice injected with AAV-Vec or AAV-H19. Numbers are mean ± SEM (n=5). n.s., not
statistically significant. C. PTT results from mice injected with AAV-Vec or AAV-H19. n=5
animals in each group. Numbers are mean ± SEM (n=5). *p<0.05, **p<0.01.

83
A B C
84
Figure 19. HFD mice show altered hepatic H19 expression, Hnf4a methylation, and
gluconeogenic gene expression.
A. Body weight of mice fed with NC (chow, n=5) or HFD (n=7). Numbers are mean ± SEM
(n=5-7). *p<0.05, **p<0.01. B. Results of glucose intolerance tests. NC, n=5; HFD, n=7. AUC,
area under the curve. Numbers are mean ± SEM (n=5-7). **p<0.01. C. H19 expression in
livers of NC and HFD mice. Numbers are mean ± SEM (n=5). *p<0.05. D. Proteins were
extracted from livers of NC or HFD mice and subjected to Western blot analysis.
Representative gel images from two mice from each group are shown, with fold increases in
protein levels presented on the right. Numbers are mean ± SEM (n=5). *p<0.05. E. Genomic
DNA was extracted from livers of NC and HFD mice. Promoter methylation of Hnf4 was
assessed by QMSP. Numbers are mean ± SEM (n=5). *p<0.05.

85

86
Figure 20. A proposed model
Under fasting or T2D condition, H19 is up-regulated in the liver, potentially by glucagon
signaling. Through H19/SAHH axis mediated DNA methylation regulation, Hnf4a promoter
DNA methylation is decreased, associating with increased Hnf4a transcription. As a
transcriptional co-activator, increased HNF4A actives the expression of gluconeogenic
genes such as G6pc and Pck1, resulting in enhanced gluconeogenesis and increased glucose
production.
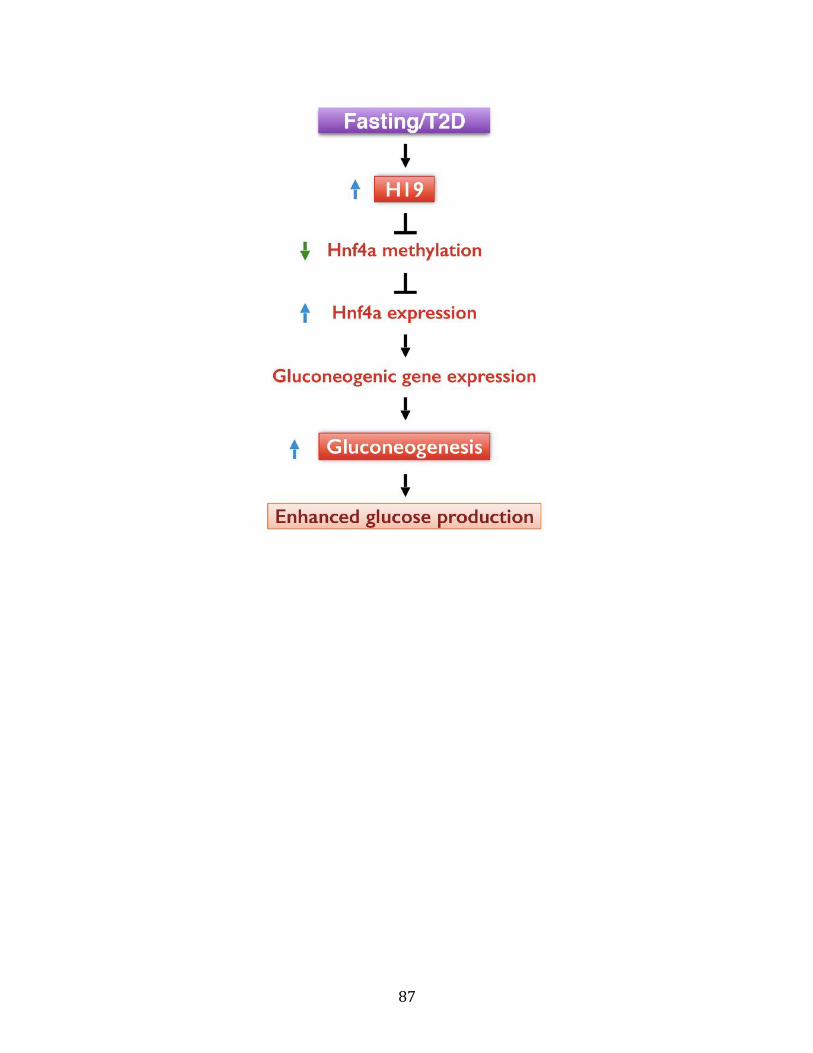
87

88
(Fig. 19C) and gluconeogenic enzymes (Fig. 19D), with a concomitant decrease in
Hnf4 promoter methylation (Fig. 19E). These results suggest that the chronic H19
increase
in the liver may contribute to reduced sensitivity of the liver to insulin-mediated
suppression of gluconeogenesis.
E. Discussion
We have discovered that H19, which normally is barely detectable in the liver, is
acutely induced by fasting under physiological conditions. This H19 elevation associates
with decreased promoter methylation and increased expression of Hnf4 , a master
gluconeogenic transcription factor, leading to gluconeogenesis activation and increased
HGP (Fig. 20). Unexpectedly, this H19-mediated mechanism is hijacked under pathological
conditions where a chronically elevated H19 is seen both in animals (Fig. 19C) and in
human subjects with T2D (Nilsson et al., 2015). While acute insulin-stimulated repression
of gluconeogenesis can occur without alteration in gluconeogenic gene expression (Perry et
al., 2015), in chronic diabetic states inhibition of rate-limiting gluconeogenic enzyme
production has been shown to reduce HGP and improve insulin sensitivity (Sharabi et al.,
2017). Along the same lines, in the H19 KO liver, the enhanced insulin-mediated
suppression of HGP (Fig. 15C) can be attributed, at least in part, to reduced expression of
the rate-limiting enzymes (Fig. 15E). It is thus conceivable that under diabetic conditions
the chronic increase in hepatic H19 leads to elevated levels of gluconeogenic enzymes,
thereby reducing the ability of insulin to suppress HGP.
89
The lack of reduction in EGP under the basal condition in the KO versus the WT
livers (Fig. 15D) was initially unexpected. Under normal conditions the liver is the major
source of EGP during fasting. However, mice with liver-specific deletion of G6pc (hence
incapable of hepatic glucose production) were able to maintain normal fasting plasma
glucose levels due to compensatory induction of gluconeogenesis in the kidney and
intestine (Mutel et al., 2011; were et al., 2014) Thus, it is possible that a compensatory
induction of extra hepatic gluconeogenesis in the H19 KO mice during fasting had helped to
maintain the basal EGP.
We show that the mechanism of action of H19 in hepatic gluconeogenesis regulation
is to induce hypomethylation of Hnf4 via the H19/SAHH axis. However, our RNA-seq
analysis revealed profound gene expression changes in H19 siRNA knockdown cells,
suggesting additional mechanisms contributing to the H19-mediated regulation, which
warrants future investigation. While we cannot exclude that tissues other than liver may
contribute to the observed in vivo effects (Fig. 15) (due to use of whole-body H19 KO mice),
our results combined from both cell and animal models suggest H19 being a novel
integrating mechanism of hepatic gluconeogenesis regulation under both physiological and
pathological conditions.
The epigenetic control of Hnf4 expression and its impact on hepatic function was
not previously documented. A recent genome-wide study of human liver revealed distinct
gene methylation patterns between fetal and adult livers (Bonder et al., 2014). It also
showed higher expression of Hnf4 in adult versus fetal livers, suggesting possible
epigenetic modification. Our results represent the first example of epigenetic regulation of

90
Hnf4 by a conserved long noncoding RNA and its significant impact on hepatic glucose
production.
It has been well established that gluconeogenesis is activated by glucagon and
inhibited by insulin. The upregulation of H19 by glucagon in hepatic cells (Fig. 13) further
supports a role of H19 in gluconeogenesis activation. The glucagon-stimulated H19
upregulation appears to be via the cAMP/PKA pathway, which is interesting because H19
upregulation by cAMP analogs or PKA activators has been reported to occur in primary
cultures of human fetal adrenal cells as well as adult human adrenocortical cells
(Voutilainen et al, 1994; Liu et al., 1995). While glucagon may promote hepatic H19
expression during fasting in healthy individuals, it may also contribute to the chronic
increase in H19 in liver of T2D patients (Nilsson et al., 2015). It has long been known that
T2D patients have chronic hyperglucagonemia in part due to inappropriately increased
alpha cell function (Unger, 1970; Godoy-Matos, 2014). The detailed molecular mechanism
by which glucagon regulates hepatic H19 expression remains to be investigated.
In summary, the findings presented in this study have important implications for
understanding the regulatory mechanisms of glucose homeostasis, and suggest that
targeting the H19/HNF4A pathway may represent a new strategy for the treatment of T2D.
F. Author Contributions
Na Zhang, Tingting Geng and Yingqun Huang designed the research and wrote the
paper. Na Zhang, Tingting Geng, Ya Liu and Yuanyuan Shen performed the experiments,
analyzed the data, and prepared the figures. Gerald I. Shulman and Joao Paulo Camporez
designed and performed the hyperinsulinemic/euglycemic clamp studies. Luisa Dandolo

91
provided the WT and H19 KO mice. Gordon G. Carmichael and Hugh S. Taylor provided
intellectual insights and critical discussion of the project.
Chapter IV
Future Directions
In summary, the studies described in this thesis have demonstrated the negative
regulatory role of H19 in muscle differentiation (Chapter II) and discovered a novel function of
H19 in regulating hepatic glucose production (Chapter III, Fig. 20). Notably, using unbiased
genome-wide transcriptome profiling, we have successfully resolved the puzzle about whether
H19 promotes or inhibits muscle differentiation. Moreover, to the best of our knowledge, we have
described the first mechanism to explain the abnormal increase of H19 in the livers of type 2
diabetic patients. Furthermore, we have found that our proposed mechanism used by H19 in
regulating hepatic glucose production is unexpectedly shared by both fasting and type 2 diabetes
conditions. In the future, we will move on to do a deeper and more comprehensive study on the
regulatory mechanisms of H19 in muscle differentiation and hepatic glucose production. The
detailed plans are described below.
1. Understanding the regulatory mechanisms of H19 in muscle differentiation.
As it has been discussed in Chapter II, the mechanisms that H19 use to negatively
regulate muscle differentiation include repressing expression of genes from the imprinted gene
network (IGN) (Martinet et al., 2016), negatively regulating IGF2 expression by acting as a
sponge for let-7 (Kallen et al., 2013) and potentially also include inhibiting myogenin
expression by contributing to KSRP-mediated myogenin mRNA degradation. However, due

92
to lacking complete and comprehensive data we still have very limited knowledge of the
mechanisms that H19 use in regulating muscle differentiation. The limitations will be
explained in the following aspects.
First, little is known about the interaction network of H19 in muscle. As a multiple
functional lncRNA with conserved secondary structure, we would expect that H19 interacts
with a lot of partners including proteins, miRNAs and DNA. H19 has been reported to interact
with proteins such as EZH2 (Luo et al., 2013), MBD1 (Monnier et al., 2013), HnRNP U (Zhang
et al., 2013), SAHH (Zhou et al., 2015), KSRP (Giovarelli et al., 2014), with miRNAs such as
let-7, miR-141, and with genomic DNA site such as p53 binding site within NOTCH1
promoter (Hadji et al., 2016). Some of these interactions have been verified in muscle but
others have not. It would be very helpful for understanding the role of H19 in muscle
differentiation if we have a more complete view of H19’s interaction network in the muscle
tissue. Second, we should keep in mind that muscle differentiation is a very dynamic process,
along which a lot of specific-myogenic factors are activated at a specific period by demethylation
at their gene locus (Carrio and Suelves, 2015). Thus, the interaction between H19 and its cofactor
at one stage of differentiation could be different at another differentiation stage. In the present
study (Chapter II), RNA-seq data analysis is restricted because samples were only harvested from
one time point of muscle differentiation. More complete data collection across the whole process
of muscle differentiation is needed. Third, multidimensional genomic profiling has been
demonstrated to help to achieve better prediction of target genes and better understanding of what
are really going on in the cell/tissue, attributed to the multiple layers of information integrated in
the analysis. Therefore, integrating data from RNA-seq, Methyl-seq and ChIRP-seq (Chromatin
isolation by RNA purification sequencing) is recommended for the study of regulatory
mechanisms of H19 in muscle differentiation. ChIRP is a powerful approach to map global
93
genomic binding sites of a lncRNA. It can also be used to identify proteins and miRNAs that bind
to a lncRNA (Chu et al., 2012).
In order to avoid the limitations described above, the following study plans will be
executed in the future. Stable H19 knockdown primary myoblast cells will be constructed using
lentivirus-mediated RNA interference technique. Control and H19 knockdown cell samples from
at least four time points along muscle differentiation including myoblast, day 1, day 3, day 5
stages will be harvested for RNA-seq, Methl-seq and ChIRP-seq analysis respectively. Then a
comprehensive comparison of RNA-seq, Methl-seq and ChIRP-seq data between control and H19
kd samples at each time point will be executed. Based on this complete and comprehensive
information, we would expect to identify a lot of H19 interacting cofactors and draw connections
among H19 and those cofactors, which would lead to promising hypotheses about novel
regulatory mechanisms of H19 in muscle differentiation. The proposed hypotheses will be tested
afterwards in vitro and in vivo.
2. Exploring other regulatory mechanisms of H19 in hepatic glucose production.
First, given the fact that H19 has many binding partners, we wouldn’t expect that
H19/SAHH axis is the only mechanism used by H19 to regulate glucose production. Similar to
the study in muscle, ChIRP-seq technique should be recruited to identify more binding partners of
H19 and establish a complete picture of H19 interaction network in the liver. Second, it is known
that H19/SAHH axis could mediate genome wide DNA methylation change (Zhou et al., 2015).
As a result, it is easy to speculate that HNF4A won’t be the only target that whose promoter
methylation and corresponding expression are regulated by H19/SAHH axis. In order to map
other target genes that are affected by H19/SAHH mediated DNA methylation regulation, data
collected from RNA-Seq, methyl-Seq and even ChIRP-Seq on the same sample and the
subsequent integrative data analysis based on these data are required. Third, in order to further
confirm the causal relationship between increased H19 and increased HGP and demonstrate that
94
H19 is a potential target in T2D treatment, in addition to using liver-specific overexpression of
H19 mouse model, liver-specific knockdown of H19 mouse model should also be used.
Comparing the effects of H19 kd in the liver between normal-chow-fed mice and high-fat-diet
mice would be very useful for evaluating whether H19 is a driver of T2D development. Last but
not least, a more precise method to quantify DNA methylation such as pyrosequencing instead of
QMSP will be used in future studies to avoid false positive/negative results. Primary hepatocytes
other than HepG2 cells will be utilized in future work to verify any proposed mechanisms in the
normal physiological conditions.

95
V. Bibliography
1. Bell, P. et al. Effects of Self-Complementarity, Codon Optimization, Transgene, and Dose on Liver
Transduction with AAV8. Hum. Gene Ther. Methods 27, 228–237 (2016).
2. Lei, K. et al. Glucose–6–phosphatase dependent substrate transport in the glycogen storage disease
type–1a mouse. Nat Genet. 13, 203–209 (1996).
3. Berteaux, N. et al. A Novel H19 Antisense RNA Overexpressed in Breast Cancer Contributes to
Paternal IGF2 Expression. Mol. Cell. Biol. 28, 6731–6745 (2008).
4. Bonder, M. et al. Genetic and epigenetic regulation of gene expression in fetal and adult human
livers. BMC Genomics 15, 860 (2014).
5. Brannan, C. I., Dees, E. C., Ingram, R. S. & Tilghman, S. M. The product of the H19 gene may
function as an RNA. Mol Cell Biol 10, 28–36. (1990).
6. Cai, X. & Cullen, B. R. The imprinted H19 noncoding RNA is a primary microRNA precursor. Rna
13, 313–316 (2007).
7. Carninci, P. et al. The Transcriptional Landscape of the Mammalian Genome. Science 309, 1559–
1563 (2006).
8. Carrió, E. & Suelves, M. DNA methylation dynamics in muscle development and disease. Front.
Aging Neurosci. 7, 19 (2015).
9. Chu, C., Quinn, J. & Chang, H. Y. Chromatin isolation by RNA purification (ChIRP). J. Vis. Exp.
(61): 3912 (2012)
10. Churchill, G. A. et al. Classes and a Possible Function for. Science 316, 1484–1488 (2007).
11. D’Alessio, D. The role of dysregulated glucagon secretion in type 2 diabetes. Diabetes, Obes.
Metab. 13, 126–132 (2011).
12. Dey, B. K., Pfeifer, K. & Dutta, A. The H19 long noncoding RNA gives rise to microRNAs miR-
675-3p and miR-675-5p to promote skeletal muscle differentiation and regeneration. Genes Dev.
28, 491–501 (2014).
13. Edgerton, D. S. et al. Effects of insulin on the metabolic control of hepatic gluconeogenesis in vivo.
Diabetes 58, 2766–2775 (2009).
14. Engreitz, J. M., Ollikainen, N. & Guttman, M. Long non-coding RNAs: Spatial amplifiers that
control nuclear structure and gene expression. Nat. Rev. Mol. Cell Biol. 17, 756–770 (2016).

96
15. Gabory, A., Jammes, H. & Dandolo, L. The H19 locus: role of an imprinted non-coding RNA in
growth and development. Bioessays 32, 473–80 (2010).
16. Gao, W. et al. The imprinted H19 gene regulates human placental trophoblast cell proliferation via
encoding miR-675 that targets Nodal Modulator 1 (NOMO1). RNA Biol. 9, 1002–1010 (2012).
17. Ghazal, S. et al. H19 lncRNA alters stromal cell growth via IGF signaling in the endometrium of
women with endometriosis. EMBO Mol. Med. 7, 996–1003 (2015).
18. Giovarelli, M. et al. H19 long noncoding RNA controls the mRNA decay promoting function of
KSRP. Proc. Natl. Acad. Sci. 111, E5023–E5028 (2014).
19. Godoy-Matos, A. F. The role of glucagon on type 2 diabetes at a glance. Diabetol. Metab. Syndr. 6,
91 (2014).
20. Greising, S. M., Gransee, H. M., Mantilla, C. B. & Sieck, G. C. Systems biology of skeletal
muscle: fiber type as an organizing principle. Wiley Interdiscip. Rev. Syst. Biol. Med. 4, 457–73
(2012).
21. Hadji, F. et al. Altered DNA Methylation of Long Noncoding RNA H19 in Calcific Aortic Valve
Disease Promotes Mineralization by Silencing NOTCH1 Clinical Perspective. Circulation 134,
1848–1862 (2016).
22. He, L. et al. Activation of the cAMP-PKA pathway antagonizes metformin suppression of hepatic
glucose production. J. Biol. Chem. 291, 10562–10570 (2016).
23. Hernandez, J. M. et al. MiR-675 mediates downregulation of twist1 and rb in afp-secreting
hepatocellular carcinoma. Annals of Surgical Oncology 20, 625–635 (2013).
24. Huang, D. W., Sherman, B. T. & Lempicki, R. A. Systematic and integrative analysis of large gene
lists using DAVID bioinformatics resources. Nat. Protoc. 4, 44–57 (2009).
25. Huang, Y. Z. et al. Transcription factor ZBED6 mediates IGF2 gene expression by regulating
promoter activity and DNA methylation in myoblasts. Sci. Rep. 4, 1–10 (2014).
26. Hurst, L. D. & Smith, N. G. C. Molecular evolutionary evidence that H19 mRNA is functional.
Trends Genet. 15, 134–135 (1999).
27. Imai, Y. et al. Effects of perilipin 2 antisense oligonucleotide treatment on hepatic lipid metabolism
and gene expression. Physiol. Genomics 44, 1125–31 (2012).
28. Jae, B. K. et al. Polony multiplex analysis of gene expression (PMAGE) in mouse hypertrophic
cardiomyopathy. Science 316, 1481-1484 (2007).
29. Janky, R. et al. iRegulon: From a Gene List to a Gene Regulatory Network Using Large Motif and
Track Collections. PLoS Comput. Biol. 10, (2014).
30. Juan, V., Crain, C. & Wilson, C. Evidence for evolutionarily conserved secondary structure in the
H19 tumor suppressor RNA. Nucleic Acids Res. 28, 1221-1227 (2000).
97
31. Jurczak, M. J. et al. Dissociation of Inositol-requiring Enzyme (IRE1α)-mediated c-Jun N-terminal
kinase activation from hepatic insulin resistance in conditional X-box-binding Protein-1 (XBP1)
knock-out mice. J. Biol. Chem. 287, 2558–2567 (2012).
32. Kallen, A. N. et al. The Imprinted H19 LncRNA Antagonizes Let-7 MicroRNAs. Mol. Cell 52,
101–112 (2013).
33. Keniry, A. et al. The H19 lincRNA is a developmental reservoir of miR-675 that suppresses growth
and Igf1r. Nat. Cell Biol. 14, 659–65 (2012).
34. Kim, D. H. et al. FoxO6 integrates insulin signaling with gluconeogenesis in the liver. Diabetes 60,
2763–2774 (2011).
35. Kou, K. & Rotwein, P. Transcriptional activation of the insulin-like growth factor-II gene during
myoblast differentiation. Mol. Endocrinol. 7, 291–302 (1993).
36. Kurukuti, S. et al. CTCF binding at the H19 imprinting control region mediates maternally
inherited higher-order chromatin conformation to restrict enhancer access to Igf2. Proc. Natl. Acad.
Sci. 103, 10684–10689 (2006).
37. Lei, K. J. et al. Glucose-6-phosphatase dependent substrate transport in the glycogen storage
disease type-1a mouse. Nat. Genet. 13, 203–209 (1996).
38. Li, H. et al. Overexpression of lncRNA H19 enhances carcinogenesis and metastasis of gastric
cancer. Oncotarget 5, 2318–2329 (2014).
39. Liew, A., Vassiliou, V., Cooper, R. & Raphael, C. Hypertrophic Cardiomyopathy - Past, Present
and Future. J. Clin. Med. 6, 118 (2017).
40. Liu, J., Kahri, A. I., Heikkilä, P., Ilvesmäki, V. & Voutilainen, R. H19 and insulin-like growth
factor-II gene expression in adrenal tumors and cultured adrenal cells. J. Clin. Endocrinol. Metab.
80, 492–496 (1995).
41. Liu, L. et al. The H19 long noncoding RNA is a novel negative regulator of cardiomyocyte
hypertrophy. Cardiovasc. Res. 111, 56–65 (2016).
42. Locus, I. H., Kaffer, C. R., Grinberg, A. & Pfeifer, K. Regulatory Mechanisms at the Mouse
Regulatory Mechanisms at the Mouse Igf2 / H19 Locus. Mol. Cell. Biol. 21, 8189–8196 (2001).
43. Luo, M. et al. Long non-coding RNA H19 increases bladder cancer metastasis by associating with
EZH2 and inhibiting E-cadherin expression. Cancer Lett. 333, 213–221 (2013).
44. Ma, L., Bajic, V. B. & Zhang, Z. On the classification of long non-coding RNAs. RNA Biol. 10,
924–933 (2013).
45. Martinet, C. et al. H19 controls reactivation of the imprinted gene network during muscle
regeneration. Development 143, 962–971 (2016).
46. Monnier, P. et al. H19 lncRNA controls gene expression of the Imprinted Gene Network by
recruiting MBD1. Proc. Natl. Acad. Sci. 110, 20693–20698 (2013).

98
47. Mutel, E. et al. Control of blood glucose in the absence of hepatic glucose production during
prolonged fasting in mice: Induction of renal and intestinal gluconeogenesis by glucagon. Diabetes
60, 3121–3131 (2011).
48. Nativio, R. et al. Disruption of genomic neighbourhood at the imprinted IGF2-H19 locus in
Beckwith-Wiedemann syndrome and Silver-Russell syndrome. Hum. Mol. Genet. 20, 1363–1374
(2011).
49. Nilsson, E. et al. Epigenetic Alterations in Human Liver From Subjects With Type 2 Diabetes in
Parallel With Reduced Folate Levels. J. Clin. Endocrinol. Metab. 100, E1491–E1501 (2015).
50. Onyango, P. & Feinberg, A. P. A nucleolar protein, H19 opposite tumor suppressor (HOTS), is a
tumor growth inhibitor encoded by a human imprinted H19 antisense transcript. Proc. Natl. Acad.
Sci. 108, 16759–16764 (2011).
51. Özen, H. & Bayraktar Y. Glycogen storage diseases: new perspectives. World J Gastroenterol 13,
2541–2553 (2007).
52. Park, K.-S., Mitra, A., Rahat, B., Kim, K. & Pfeifer, K. Loss of imprinting mutations define both
distinct and overlapping roles for misexpression of IGF2 and of H19 lncRNA. Nucleic Acids Res.
45, 12766–12779 (2017).
53. Pauli, L. S. S. et al. Exercise training decreases mitogen-activated protein kinase phosphatase-3
expression and suppresses hepatic gluconeogenesis in obese mice. J. Physiol. 592, 1325–1340
(2014).
54. Penhoat, A., Fayard, L., Stefanutti, A., Mithieux, G. & Rajas, F. Intestinal gluconeogenesis is
crucial to maintain a physiological fasting glycemia in the absence of hepatic glucose production in
mice. Metabolism. 63, 104–111 (2014).
55. Perry, R. J. et al. Hepatic acetyl CoA links adipose tissue inflammation to hepatic insulin resistance
and type 2 diabetes. Cell 160, 745–58 (2015).
56. Poirier, F. et al. The murine H19 gene is activated during embryonic stem cell differentiation in
vitro and at the time of implantation in the developing embryo. Development 113, 1105–1114
(1991).
57. Pope, C., Mishra, S., Russell, J., Zhou, Q. & Zhong, X.-B. Targeting H19, an Imprinted Long Non-
Coding RNA, in Hepatic Functions and Liver Diseases. Diseases 5, 11 (2017).
58. Ragina, N. P. et al. Downregulation of H19 improves the differentiation potential of mouse
parthenogenetic embryonic stem cells. Stem Cells Dev. 21, 1134–44 (2012).
59. Raveh, E., Matouk, I. J., Gilon, M. & Hochberg, A. The H19 Long non-coding RNA in cancer
initiation, progression and metastasis - a proposed unifying theory. Mol. Cancer 14, 1–14 (2015).
60. Rhee, J. et al. Regulation of hepatic fasting response by PPAR coactivator-1 (PGC-1):
Requirement for hepatocyte nuclear factor 4 in gluconeogenesis. Proc. Natl. Acad. Sci. 100, 4012–
4017 (2003).
61. Rines, A. K., Sharabi, K., Tavares, C. D. J. & Puigserver, P. Targeting hepatic glucose metabolism
in the treatment of type 2 diabetes. Nat. Rev. Drug Discov. 15, 786-804 (2016).

99
62. Ripoche, M. a, Kress, C., Poirier, F. & Dandolo, L. Deletion of the H19 transcription unit reveals
the existence of a putative imprinting control element. Genes Dev. 11, 1596–1604 (1997).
63. Runge, S. et al. H19 RNA binds four molecules of insulin-like growth factor II mRNA-binding
protein. J. Biol. Chem. 275, 29562–9 (2000).
64. Sanli, I. & Feil, R. Chromatin mechanisms in the developmental control of imprinted gene
expression. Int. J. Biochem. Cell Biol. 67, 139–147 (2015).
65. Sharabi, K. et al. Selective Chemical Inhibition of PGC-1α Gluconeogenic Activity Ameliorates
Type 2 Diabetes. Cell 169, 148–160 (2017).
66. Stanya, K. J. et al. Direct control of hepatic glucose production by interleukin-13 in mice. J. Clin.
Invest. 123, 261–271 (2013).
67. Szabo, P. E., Tang, S. E., Silva, F. J., Tsark, W. M. K. & Mann, J. R. Role of CTCF Binding Sites
in the Igf2 / H19 Imprinting Control Region. Mol. Cell. Biol. 24, 4791–4800 (2004).
68. Toda, C. et al. UCP2 Regulates Mitochondrial Fission and Ventromedial Nucleus Control of
Glucose Responsiveness. Cell 164, 872–882 (2016).
69. Tran, V. G. et al. H19 antisense RNA can up-regulate IGF2 transcription by activation of a novel
promoter in mouse myoblasts. PLoS One 7, (2012).
70. Tsang, W. P. et al. Oncofetal H19-derived miR-675 regulates tumor suppressor RB in human
colorectal cancer. Carcinogenesis 31, 350–358 (2010).
71. Unger, R. H., Aguilar-Parada, E., Müller, W. A. & Eisentraut, A. M. Studies of pancreatic alpha
cell function in normal and diabetic subjects. J. Clin. Invest. 49, 837–848 (1970).
72. Varrault, A. et al. Zac1 Regulates an Imprinted Gene Network Critically Involved in the Control of
Embryonic Growth. Dev. Cell 11, 711–722 (2006).
73. Vennin, C. et al. The long non-coding RNA 91H increases aggressive phenotype of breast cancer
cells and up-regulates H19/IGF2 expression through epigenetic modifications. Cancer Lett. 385,
198–206 (2017).
74. Voutilainen, R. et al. Parallel regulation of parentally imprinted H19 and insulin-like growth factor-
II genes in cultured human fetal adrenal cells. Endocrinology 134, 2051–2056 (1994).
75. Wang, S. et al. Long noncoding RNA H19 inhibits the proliferation of fetal liver cells and the Wnt
signaling pathway. FEBS Lett. 590, 559–570 (2016).
76. Wei, S. et al. Berberine Attenuates Development of the Hepatic Gluconeogenesis and Lipid
Metabolism Disorder in Type 2 Diabetic Mice and in Palmitate-Incubated HepG2 Cells through
Suppression of the HNF-4α miR122 Pathway. PLoS One 11, (2016).
77. Yan, Z., Yan, H. & Ou, H. Human thyroxine binding globulin (TBG) promoter directs efficient and
sustaining transgene expression in liver-specific pattern. Gene 506, 289–294 (2012).
78. Yang, F. et al. Up-regulated long non-coding RNA H19 contributes to proliferation of gastric
cancer cells. FEBS J. 279, 3159–3165 (2012).

100
79. Yin, Y. et al. Knockdown of H19 enhances differentiation capacity to epidermis of parthenogenetic
embryonic stem cells. Curr. Mol. Med. 14, 737–48 (2014).
80. Yoon, J. C. et al. Control of hepatic gluconeogenesis through the transcriptional coactivator PGC-1.
Nature 413, 131–138 (2001).
81. Yoon, M. & Chen, J. PLD regulates myoblast differentiation through the mTOR-IGF2 pathway. J.
Cell Sci. 121, 282–289 (2008).
82. Zhang, L. et al. The interplay of LncRNA-H19 and its binding partners in physiological process
and gastric carcinogenesis. Int. J. Mol. Sci. 18, (2017). 18, (2017).
83. Zhang, L. et al. Epigenetic activation of the MiR-200 family contributes to H19-mediated
metastasis suppression in hepatocellular carcinoma. Carcinogenesis 34, 577–586 (2013).
84. Zhang, M. et al. Sodium caprate augments the hypoglycemic effect of berberine via AMPK in
inhibiting hepatic gluconeogenesis. Mol. Cell. Endocrinol. 363, 122–130 (2012).
85. Zhang, Y. et al. Bcl2 is a critical regulator of bile acid homeostasis by dictating Shp and lncRNA
H19 function. Sci. Rep. 6, 20559 (2016).
86. Zhong, T. et al. Metformin alters DNA methylation genome-wide via the H19/SAHH axis.
Oncogene 36, 2345-2354 (2016).
87. Zhou, J. et al. H19 lncRNA alters DNA methylation genome wide by regulating S-
adenosylhomocysteine hydrolase. Nat. Commun. 6, 1–13 (2015).
88. Zhou, X. et al. The Interaction Between MiR-141 and lncRNA-H19 in Regulating Cell
Proliferation and Migration in Gastric Cancer. Cell. Physiol. Biochem. 36, 1440–1452 (2015).