functional testing for lower extremity rehabilitation
TRANSCRIPT

1
R O B E R T C . M A N S K E , P T , D P T , M E D , S C S , A T C , C S C S
P R O F E S S O R
W I C H I T A S T A T E U N I V E R S I T Y D E P A R T M E N T O F P H Y S I C A L T H E R A P Y
V I A C H R I S T I O R T H O P E D I C A N D S P O R T S P H Y S I C A L T H E R A P Y
Functional Testing and Return to Sport for Lower Extremity Rehabilitation
Disclosures
E L S E V I E R S C I E N C E
H U M A N K I N E T I C S
I N T E R N A T I O N A L J O U R N A L O F S P O R T S P H Y S I C A L T H E R A P Y
R E H A B C H A M P I O N S C E
Reiman MP, Manske RC. The Assessment of Function: How is it measured? A Clinical Perspective. J Man Manip Ther. 2011;19(2):91-99.
Reiman MP, Manske RC. The Assessment of Function. Part II: Clinical Perspective of a Javelin Thrower with Low Back and Groin Pain. J Man Manip Ther. 2012;20(2):83-89.
Manske RC, Reiman M. Functional Performance Testing for Power and Return to Sports. Sports Health. 2013;5(3):244-250.
Davies GJ, McCarthy E, Provencher M, Manske RC. ACL Return to Sports Guidelines and Criteria. Curr Rev Musculosk Med. 2017; DOI 10.1007/s12178-017-9420-9
1 2
3 4
5 6

2
Clinical Decision Making
ACL injuries common (350,000) ACLR
annually
Both short and long-term implications
Sugimoto D, LeBlancc JC, Wooley SE, et al. The effectiveness of a functional knee brace on joint position in anterior cruciate ligament-reconstructed individuals. J Sport Rehabil. 2016;25(2):190-194.
Heard BJ, Solbak NM, Achari Y, et al. Changes of early post-traumatic osteoarthritis in an ovine model of simulated ACL reconstructions are associated with transient acute post-injury synovial inflammation and tissue catabolism. Osteoarthritis Cartilage. 2013;21(12):1942-1949.
Risberg MA, Oiestad BE, Gunderson R, et al. Changes in knee osteoarthritis, symptoms, and function after anterior cruciate ligament reconstruction: a 20-year prospective follow-up study. Am J Sports Med. 2016;44(5):1215-1224
Clinical Decision Making
Extremely high re-injury rate
Multi-factorial
What are modifiable and trainable risk factors
Kamath GV, Murphy T, Creighton RA, et al. Anterior cruciate ligament injury, return to play, and reinjury in the elite collegiate athlete: Analysis of an NCAA Division I cohort. Am J Sports Med. 2014;42(7):1638-1643.
Risk of 2nd ACL Injury
2nd injury – 15% 8% ipsilateral ; 7% contralateral
Patients < 25 years
21%
Patients who returned to sports <25 years 23%
Wiggins AJ, Grandhi R, Schneider DK, Stanfield D, Webster KE, Myer GD. Risk of secondary injury in younger athletes after anterior cruciate ligament reconstruction: a systematic review and meta-analysis. Am J Sports Med. 2016;44:1861-1876.
Risk of 2nd ACL Injury
Overall rate of 2nd rupture
4.5% ipsilateral; 7.5% contralateral
< age of 20
29% either knee
Returning to high risk sports
Increased odds of ipsilateral – 3.9 -fold
Increased odds contralateral – 4.9 - fold
Webster KE, Feller JA, Leight WB, Richmond AK. Younger patients are at increased risk for graft rupture and contralateral injury after anterior cruciate ligament reconstruction. Knee Surg Sports Traumatol Arthrosc. 2014;22:1142-1148.
Clinical Decision Making
What are criteria used for clinical reasoning
and decision making for return to sports
Systematic review of 264 studies
105 (40%) failed to provide any criteria
84 (32%) time post op was only criteria
40 (15%) time and subjective criteria
35 (13%) objective criteria
Barber-Westin SD, Noyes FR. Factors used to determine return to unrestricted sports activities after anterior cruciate ligament reconstruction. Arthroscopy. 2011;27(12):1697-1705.
7 8
9 10
11 12

3
Clinical Decision Making
Systematic review
RTS after ACLR – 7556 athletes
81% returned some level of sport
65% returned to pre-injury level
55% returned to competitive sport
Arden CL, et al. Fifty-five per cent return to competitive sport following anterior cruciate ligament reconstruction surgery: an updated systematic review and meta-analysis including aspects of physical functioning and contextual factors. Br J Sports Med. 2014;48:1543-1552.
Clinical Decision Making
Increased odds of returning to sports
Limb-to limb symmetry – hop performance
Younger age
Males
BPTB Auto > odds of returning to sports
Hamstring > odds of returning to competitive sports
Arden CL, et al. Fifty-five per cent return to competitive sport following anterior cruciate ligament reconstruction surgery: an updated systematic review and meta-analysis including aspects of physical functioning and contextual factors. Br J Sports Med. 2014;48:1543-1552.
Clinical Decision Making
Meta-analysis
55% return to premorbid level after ACLR
3 of 4 quantitative physical criteria
influencing ability to RTS are non modifiable
1) age, 2) male gender, 3) playing elite sports, 4) positive psychological attitude
Arden CL, Taylor NF, Feller JA, et al. Return-to-sport outcomes at 2 to 7 years after anterior cruciate ligament reconstruction surgery. Am J Sports Med. 2012;40(1):41-48.
Clinical Decision Making
Return to Sports…
Very few guidelines published
Few objective tests documented to support clinical
decision making process
Limited evidence to support our approach
Clinical Decision Making
How often do we have specific criteria that would stand up to:
1) Critical peer review
2) High levels of evidence to support decision making
3) Medico-legal critical analysis
Don’t Feel Alone!
• Almost 90% of the orthopaedic literature represents research findings from non randomized
study designs ranging from case series to prospective cohort studies
Obremskey WT, et al. Levels of evidence in orthopaedic journals. J Bone Joint Surg. 2005; 87A:2632-2638.
13 14
15 16
17 18

4
Medico-legal!
• If a physician, physical therapist, athletic trainer allows an athlete to return to sports they may be
legally held responsible if the athlete encounters a serious injury!
Creighton DW, et al. Return-to-play in sport: A decision-based model. Clin J Sports Med. 2010;20(5):379-385.
Strength Deficits
Muscle strength deficits, and kinematic and kinetic deficits persist even after a patient has successfully
returned to sports!
Delahunt E, Sweeney L, Chawke M, et al. Lower limb kinematic alterations during drop vertical jumps in female athletes who have undergone anterior cruciate ligament reconstruction. J Orthop Res. 2012;30:72-78.
DeVita P, Horobagyi T, Barrier J. Gait biomechanics are not normal after anterior cruciate ligament reconstruction and accelerated rehabilitation. Med Sci Sports Exerc. 1998;30:1481-1488.
Georgoulis AD, Ristanis S, Moraiti CE, et al. ACL injury and reconstruction: clinical related in vivio biomechanics. Orthop Traumatol Surg Res. 2010;96:S119-S128.
Moraiti CO, Stergiou N, Vasiladis HS, Motsis E, Georgeoulis A. Anterior cruciate ligament reconstruction results in alterations in gait variability. Gait Posture. 2010;32:169-175.
Team Effort – Key Stakeholders
Individual patient
Patient family
Orthopedic surgeon
Physician
Physical therapist
Athletic trainer
SC specialist
Sports psychologist
Coaches
Importance of Testing
Evaluate rehab program and/or individuals
Is the rehab program working?
Strengths and weaknesses of program and/or individuals
Is the athlete ready for return to sport?
Data for research
Functional Testing Algorithm
Patients are initially stratified into activity levels:
General orthopedic patients
Recreational athletes
Competitive athletes
19 20
21 22
23 24

5
Problems in Testing
Inconsistent rules and/or the way the tests are performed
“Cheaters”
Too many tests
Testing too often
Lack of “trained” testers
Testing Terms
Validity- does the test actually measure what it is designed to measure
Reliability- test/ re-test accuracy
Increasing Accuracy
Properly prepare the person to be tested1. Understand testing procedures
2. Ability to practice unusual testing aspects beforehand
3. Adherence to pre-testing instructions
4. Follow protocol exactly
5. “Trained” testers
6. Calibration of equipment
7. Consistent motivation from tester
Test Selection
Testing protocol?
Simple to complex
Single plane to multiple planes of movement
“Isolation to integration”
Environment
Age and gender
Soft tissue healing constraints
Test Selection
• Physician restrictions
• Personal physical characteristics
• Previous physical performance capabilities
• Sport specificity
• Metabolic specificity
• Must be safe, challenging, stress multiple planes of movement, be derived from fundamental movement skills, and should apply directly to a sport specific skill
Equipment Available
Weights
Benches
Stop watches
Jump equipment
Space
Flooring/ surface
“Toys”
25 26
27 28
29 30

6
Test Administration
Warm-up
Consistency
Do not allow person
tested to record results
Motivation- helping person reach their full potential
Test Order
Physical characteristics
Power tests
Speed and agility tests
Strength tests
Anaerobic tests
Cardiovascular test
Testing on separate days?
Functional testing algorithm
Analysis
Involved/non-involved
% to BW, height, accepted standards
Previous test results
SD, Mean, Median, Mode
Basic Functional Tests
Patient reported (Subjective) measures
Tegner, SF36, Lysholm scale
Anthropometrics
AROM, PROM
Flexibility
Gait
Balance/proprioception/kinesthesia
Special tests- passive joint laxity
Anthropometrics
Use consistent and specific locations
Some common measurements: JL; 10 & 20 cm above JL, 15 cm below JL
31 32
33 34
35 36

7
KT 1000/2000
Use of static ligament stability testing may be controversial for some.
Prefer to see < 3-5 mm side-side difference
Balance/Proprioception/Kinesthesia
Pacinian and Ruffini receptors, as well as GTO’s have been found in ACL tissue
Damage to neural tissue in the capsule, ligaments, muscles or surrounding skin is likely to affect afferent information available for processing at the CNS
Increased likelihood of re-injury due to inadequate restoration of the proprioceptive feedback system
Proprioception
Active repositioning-almost exclusively performed in non-
functional positions such as seated open chain extension (Harter et.al. 1992)
Balance/Proprioception/Kinesthesia
• Kennedy et al. (1982) suggested that proprioceptive loss after ACL injury contributed to increased laxity rather than being caused by the stretching effect of chronic increased laxity
Types of Balance
Static
Transitional
Dynamic
37 38
39 40
41 42

8
Methods of Balance Testing
Static balance*single-leg stance*force plate, NeuroCom, KAT, FASTEX, etc.
Dynamic balance*same as static*Functional Reach test
Static Balance
Compare involved to non-involved
Time?
Testing equipment- ? force plate, Neuro-Com, KAT
Postural sway
Perturbation
Star Excursion Balance Test
Star-Excursion Balance Test
Tests all 3 planes of movement in 8
different diagonals
Goal is to force subjects to disturb their equilibrium to a near maximum
Star-Excursion Balance Test
Reliability = Moderate to High Manske and Andersen
Intratester = 0.94 to 0.98
Hertel et al
Intratester = 0.85 to 0.96
Intertester = 0.81 to 0.93
Kinzey and Armstrong
Intratester = 0.67 to 0.87
43 44
45 46
47 48

9
M A N S K E R C , A N D E R S E N J . J O R T H O P S P O R T S P H Y S T H E R 2 0 0 4 ; 3 4 ( 1 ) : A 5 2 - 5 3 .
Test-Retest Reliability of the Lower Extremity Functional Reach Test
Purpose
To determine test retest reliability of the LEFRT
Determine differenced between dominant and non-dominant LE’s during LEFRT
Manske RC, Andersen J. Test –Retest Reliability of the Lower Extremity Functional Reach Test. J Orthop Sports Phys Ther 2004;34(1):A52-53.
Subjects
Sex Males
11
Females
28
Dominant
Extremity
Right 35 Left 4
Mean SD
Age (years) 24.7 3.8011
Weight (lbs) 153.175 30.6007
Height (in) 66.5750 4.1933
Manske RC, Andersen J. Test-Retest Reliability of the Lower Extremity Functional Reach Test. J Orthop Sports Phys Ther 2004;34(1):A52-53.
Methods
Balance on one leg while reaching as far as possible with other leg
Anterior reach
Anterior medial (45°)
Medial
Posterior medial (45°)
Posterior
Manske RC, Andersen J. Test-Retest Reliability of the Lower Extremity Functional Reach Test. J Orthop Sports Phys Ther 2004;34(1):A52-53.
Results
Anterior 45 Ant Medial 45 Post Post
Dominant .9346 .9515 .9342 .9681 .9547
Non-
Dominant
.9795 .9774 .9371 .9672 .9734
Manske RC, Andersen J. Test-Retest Reliability of the Lower Extremity Functional Reach Test. J Orthop Sports Phys Ther 2004;34(1):A52-53.
Results
Dominant X Non-Dom X Signifigance
Anterior 72.6325 72.5983 .972
45 Ant 80.2650 79.7094 .566
Medial 72.4017 72.5983 .853
45 Post 79.0256 79.2479 .706
Post 78.3846 78.5385 .830
Manske RC, Andersen J. Test-Retest Reliability of the Lower Extremity Functional Reach Test. J Orthop Sports Phys Ther 2004;34(1):A52-53.
49 50
51 52
53 54

10
Eccentric Step-Down Test
Reps completed involved to non-involved LE
?? 50 repetition maximum
Set standardized protocol- height, reps, type of surface, etc.
No known reliability studies performed
Isokinetic Testing
Isokinetic resistance- fixed speed with a variable resistance that is accommodating to the individual throughout the ROM
Has been argued that limb position and speed of limb movement of testing are not representative of sporting functional movements (Lephart et al. 1992; Greenberger & Paterno 1995)
Significant correlation (moderate) between isokinetic strength testing and functional performance (Wilk 1994; Barber et al. 1990)
Isokinetic Testing
Methodology in studies is variable- making comparisons between them difficult
Gross et al. (1991)- measurement data could not be generalized from one type of isokinetic device to another (Cybex and Biodex)
Contralateral limb comparisons can be used as normative data or as a control if there is no precluding injury
Also can look at peak torque to body weight, Q/H ratios, etc.
CKC Isokinetic Testing
Considered more “functional” vs. OKC
Testing “integrated” motion versus “isolation” in OKC
“Weak link”
Lido Linea- good to excellent test-retest
reliability(Davies &
Heiderscheit 1997)
Normative Date for Isokinetic Testing
Outcome Measure
Unilateral Ratio:Ham/Quad
60°/Sec ~ 60%-70%
180°/Sec ~ 70% - 80%
300°/Sec ~ 85% - 95%
Descriptive Allometric Scaling for Isokinetic Testing of Quads
Outcome Measure
AllometricScaling
60°/Sec Males : ~ 90-100% BWFemales: ~ 80-90% BW
180°/Sec Males: ~ 70-80% BWFemales: ~ 60-70% BW
300°/Sec Males: ~ 45-55% BWFemales: ~ 30-40% BW
55 56
57 58
59 60

11
M A N S K E R C , S M I T H B S , R O G E R S M , W Y A T T F . C L O S E D K I N E T I C C H A I N I S O K I N E T I C T E S T I N G : R E L A T I O N S H I P S T O F U N C T I O N A L T E S T I N G . I S O K I N E X S C I . 2 0 0 3 ; 1 1 : 1 7 1 - 1 7 9 .
CKC Isokinetic Testing: Relationships to Functional Testing
29 normal subjects with no history of injury
CKC isokinetic test: 3 sets bilateral reciprocal, 3 sets bilateral coupled
Velocities 10, 20 and 30 in/sec
Following isokinetic testing functional tests performed
Manske RC, Smith BS, Rogers M, Wyatt F. Closed Kinetic Chain Isokinetic Testing: Relationships to Functional Testing. Isokin Ex Sci. 2003;11:171-179.
Functional Tests
Bilateral vertical jump
Unilateral vertical jump
Double-leg jump
Single-leg hop
Single-leg timed hop (6m)
Mean scores of 3 attempts used
Manske RC, Smith BS, Rogers M, Wyatt F. Closed Kinetic Chain Isokinetic Testing: Relationships to Functional Testing. Isokin Ex Sci. 2003;11:171-179.
Manske et al
-0.6
-0.4
-0.2
0
0.2
0.4
0.6
0.8
BR-DL10 BR-NDL10 BR-DL20 BR-NDL20 BR-D30 BR-NDL30
Correlation coefficients for bilateral
reciprocal concentric isokinetic peak force
and single-leg functional test scores
SLHD
SLHN
VJD
VJN
STHD
STHN
0
0.1
0.2
0.3
0.4
0.5
0.6
0.7
BR-DL10 BR-NDL10 BR-DL20 BR-NDL20 BR-D30 BR-NDL30
Correlation coefficients for bilateral reciprocal concentric
isokinetic peak force and two-legged functional test scores
VJD
VJN
Conclusions
A significant relationship exists between CKC isokinetic tests and selected functional test scores
In at least 50% of these scores a moderate relationship exists
Manske RC, Smith BS, Rogers M, Wyatt F. Closed Kinetic Chain Isokinetic Testing: Relationships to Functional Testing. Isokin Ex Sci. 2003;11:171-179.
61 62
63 64
65 66

12
“Functional” Tests
M A N S K E R C , S M I T H B S , W Y A T T F . T E S T R E T E S T R E L I A B I L I T Y O F L E F U N C T I O N A L T E S T S A F T E R A C K C I S O K I N E T I C B O U T . J S P O R T S R E H A B . 2 0 0 3 ; 1 2 ( 2 ) : 1 1 9 - 1 3 2 .
Purpose
To determine if a CKC isokinetic bout would alter test-retest reliability of functional tests that follow
Manske RC, Smith BS, Wyatt F. Test Retest Reliability of LE Functional Tests after a CKC Isokinetic Bout. J Sports Rehab. 2003;12(2):119-132.
Subjects and Methods
28 normal subjects
Velocity spectrum CKC isokinetic bout consisting of 3 sets bilateral reciprocal and 3 sets bilateral coupled
Same functional tests as described previously
Manske RC, Smith BS, Wyatt F. Test Retest Reliability of LE Functional Tests after a CKC Isokinetic Bout. J Sports Rehab. 2003;12(2):119-132.
Results
ICC’s between day 1 and day 2 for functional tests ranged from 0.91 to 0.98
Despite following a CKC bout, functional test reliability remains very high.
Manske RC, Smith BS, Wyatt F. Test Retest Reliability of LE Functional Tests after a CKC Isokinetic Bout. J Sports Rehab. 2003;12(2):119-132.
CKC Isokinetic Testing
Negrete & Brophy (2000) found significant correlations between functional test scores (single-
leg vertical jump and single-leg hop) and CKC isokinetic test scores
Low to moderate correlations (Manske 2003) with single and bilateral vertical jump test, double leg jump for distance, single-leg hop for distance, and single-leg timed 6-meter hop
67 68
69 70
71 72

13
Standing Long Jump
For the propulsive phase- hip 45.9%, knee 3.9%, and ankle 50.2%(Robertson & Fleming
1987)
Indicator of explosive power- often use in strength & conditioning field
Standing Long Jump
Constantine and Sullivan: 38 Males; 7 trials; 30-40s rest = 0.99
Glencross: 85 males; Barefoot, best of 3 trials; 0.96
Manske et al, 28 subjects; mean of 3 trials; 0.97
Standing Long Jump
Normative Values
Females Males
90% of height 100% of height
Single-Leg Hop
Take off and land on same leg
Criteria for good jump
Index (Involved/non-I)
Only 50% of ACL deficient patients with c/o during sports showed a (+) deficiency(Noyes et al. 1991)
Single-Leg Hop
Bandy: 18 subjects; 2 trials; 2-5m; 0.93
Bolga and Keskula: 20 subjects; 0.96
Booher: 18 subjects; 1 trial; 0.99
Greenberger and Paterno: 20 subjects; 3trials D; 0.92; 2 trials ND; 0.96
73 74
75 76
77 78

14
Single-Leg Hop
Manske et al: 28 subjects; mean of 3;
D=0.96; ND=0.97
Single-Leg Hop for Distance
Normative Values
Females Males
80% of Height 90% of Height
Jumping Comparisons: Segmental Contributions
Vertical Jump Horizontal Jump
Hip 40.0 45.9
Knee 24.2 3.9
Ankle/Foot 35.8 50.2
Biomechanical Perspective
Gauffin & Tropp (Am J Sports Med 1992) studied bilateral kinematic, kinetic, and muscular activation patterns at the ankle, knee, and hip joints during a 1-leg jump in subjects who were chronically ACL deficient
Results revealed similar involved and non-involved limb scores
Movement patterns and muscle activity patterns differed between injured and non-injured limbs
ACL deficient- greater flexion angles for the hip and knee joints at touchdown; also a reduction in EMG activity of quads while hamstring activity remained similar
? Improved capacity of the hamstrings to control anterior tibial sheer during landing
Rudolph et al(Knee Surg Sports Traumatol Arthrosc. 2000)
looked at “copers”, “non-copers” and normals
Reported very little difference in kinematic, kinetic, and EMG variables between copers and normals
Suggested copers used more contribution from the hip in maintaining support vs. normals
No differences in VGRF between copers and controls
Non-copers hopped differently- less knee flexion during ground contact and had lower peak VGRF
Non-copers also had greater contributions from the hip and lesser contributions from the knee during the transition from weight acceptance to hop propulsion
Conclusion- comprehensive assessment that includes the analysis of kinetic, kinematic, and EMG data to thoroughly describe the biomechanical and neuromuscular profiles of the stable and unstable lower extremity
79 80
81 82
83 84

15
6 Meter Timed Hop Test
Single-leg timed hop over distance of 6 meters
Encourage large, forceful 1-legged propulsive hop the measured distance (Wilket al. 1994)
Propulsion-deceleration-propulsion, etc.
6 Meter Timed Hop Test
Bandy: 18 subjects; 2 trials; 2-5min; 0.92
Bolga & Keskula: 20 subjects; 3 trials; 40s; 0.66
Booher: 18 subjects; 1 trial; 0.77
Manske et al: 28 subjects; mean of 3 trials; Dom 0.92; ND 0.96
Triple-Hop For Distance
Three consecutive hops on one foot in a straight line direction
Encourage 3 maximum distance
Triple-Hop For Distance
Riseberg: 21 subjects; mean 3.9weeks (1-7); difference in distance recorded;D=0.92;ND=0.97
Single-Leg Cross-Over Hop For Distance
Three consecutive hops on one foot crossing 15 cm marking strip with each hop
Encourage 3 maximum distance hops
Limb symmetry index
Maximal Controlled Leap
Test of force absorption (Juris et al JOSPT 1997)
Leaping is the projection on the body from one limb onto the other
Testing grid- 1.91 cm wide, 3 m long, and marked at 10 cm increments
Hop and stop test involved a maximal hop for distance and a maximal controlled leap
85 86
87 88
89 90

16
Force production- maximal hop for distance
Constraints of hands on hips and not allowing swinging the suspended leg
This eliminated movement strategies involving leg and arm swing
Measurement at point of contact of hopping/leaping toe
Hopping distance was normalized to the subject’s stature vs. absolute value
Maximal hopping distance from each limb divided by the subject’s height (both in meters), x 100
Force production symmetry = larger hop/smaller hop
Stop symmetry = larger stop-to-hop ratio of the two limbs into the smaller ratio x 100
Data suggest this protocol does accurately assess functional and dysfunctional knees, and that force absorption may be more critical than force production in determining functional capacity
LEFT Test
Dimensions (30ft. long by 10 ft. wide) designed base on clinic space constraints
Negrete & Brophy (2000) demonstrated correlation of the LEFT test with other tests to measure performance
Quantity and quality of performance evaluated
Very stressful to the anaerobic CV system
May need to consider age, fitness level, sport,etc
LEFT Test
1. Sprint (forward)
2. Sprint (retro-run)
3. Side shuffles (both ways)
4. Cariocas (both ways)
5. Figure-of-eights (both ways)
6. 45-degree angle cuts (outside foot) (both ways)
7. 90-degree angle cuts (outside foot) (both ways)
8. Crossover step (both ways)
9. Sprint (forward)
10. Sprint (retro-run)
91 92
93 94
95 96
17
LEFT Test
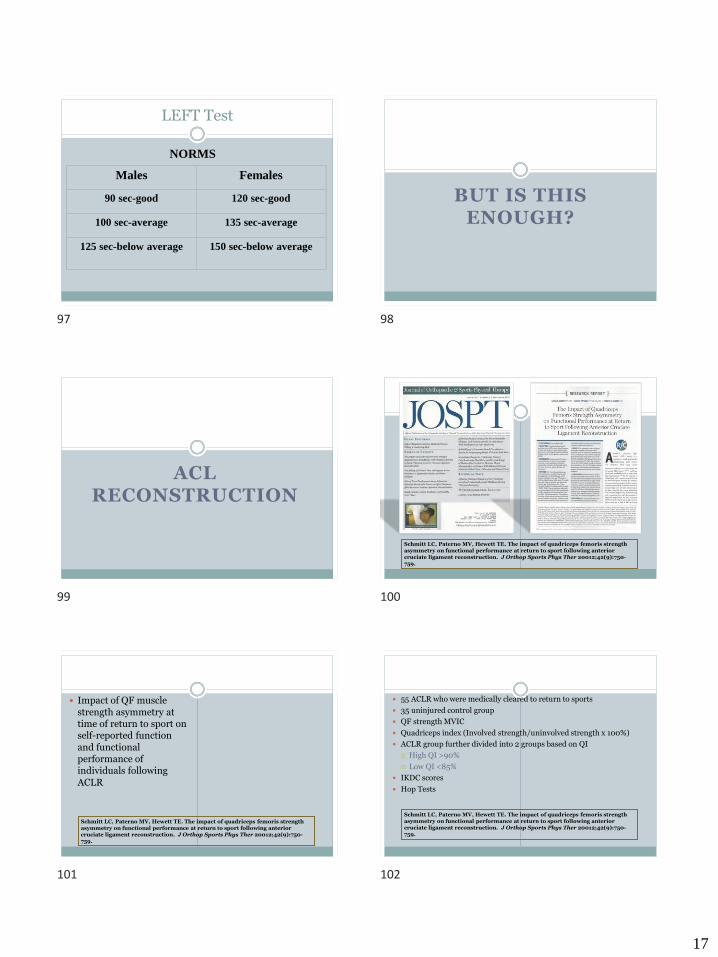
NORMS
Males Females
90 sec-good 120 sec-good
100 sec-average 135 sec-average
125 sec-below average 150 sec-below average
BUT IS THIS ENOUGH?
ACL RECONSTRUCTION
Schmitt LC, Paterno MV, Hewett TE. The impact of quadriceps femoris strength asymmetry on functional performance at return to sport following anterior cruciate ligament reconstruction. J Orthop Sports Phys Ther 20012;42(9):750-759.
Impact of QF muscle strength asymmetry at time of return to sport on self-reported function and functional performance of individuals following ACLR
Schmitt LC, Paterno MV, Hewett TE. The impact of quadriceps femoris strength asymmetry on functional performance at return to sport following anterior cruciate ligament reconstruction. J Orthop Sports Phys Ther 20012;42(9):750-759.
55 ACLR who were medically cleared to return to sports
35 uninjured control group
QF strength MVIC
Quadriceps index (Involved strength/uninvolved strength x 100%)
ACLR group further divided into 2 groups based on QI
High QI >90%
Low QI <85%
IKDC scores
Hop Tests
Schmitt LC, Paterno MV, Hewett TE. The impact of quadriceps femoris strength asymmetry on functional performance at return to sport following anterior cruciate ligament reconstruction. J Orthop Sports Phys Ther 20012;42(9):750-759.
97 98
99 100
101 102

18
ACLR group weaker
ACLR group reported worse subjective function
Schmitt LC, Paterno MV, Hewett TE. The impact of quadriceps femoris strength asymmetry on functional performance at return to sport following anterior cruciate ligament reconstruction. J Orthop Sports Phys Ther 20012;42(9):750-759.
ACLR group worse on hop tests than Control
LQI worse than HQI and Control
Hop test performance not different from HQI and Control
Strength predicted performance on hop tests
Schmitt LC, Paterno MV, Hewett TE. The impact of quadriceps femoris strength asymmetry on functional performance at return to sport following anterior cruciate ligament reconstruction. J Orthop Sports Phys Ther 20012;42(9):750-759.
Examine clinical utility of FPTs with patients < = 1 year PO.
Systematic review using PRISM guidelines
12 studies included for analysis
Of 12 articles 41.7% used as outcome measure
58.3% used as measure of function
None utilized FPTs as measure to determine readiness to return to sports
Narducci E, et al. The clinical utility of functional performance tests within one-year post-ACL reconstruction: A systematic review. Int J Sports Phys Ther. 2011;6(4):333-342.
Develop and enhance a useful checklist type tool following use of Delphi study
Delphi technique series of survey or questions to experts by controlled feedback to obtain reliable consensus of opinion in timely and orderly fashion
Haines S, et al. Development of a physical performance assessment checklist for athletes who sustained a lower extremity injury in preparation for return too sport: a Delphi study. Int J Sports Phys Ther. 2012;8(1):44-53.
Haines S, et al. Development of a physical performance assessment checklist for athletes who sustained a lower extremity injury in preparation for return too sport: a Delphi study. Int J Sports Phys Ther. 2012;8(1):44-53.
Functional Performance Testing
Testing for outcomes can take many forms
Self reported measures
Impairment based measures
Physical performance measures
Use of cluster
Use of continuum of tests
FPT algorithm
Reiman MP, Manske RC. The assessment of function: how is it measured? A clinical perspective. J Man Manip Ther. 2011;19(2):91-99.
103 104
105 106
107 108

19
Reiman MP, Manske RC. The assessment of function: how is it measured? A clinical perspective. J Man Manip Ther. 2011;19(2):91-99.
Reiman MP, Manske RC. The assessment of function: how is it measured? A clinical perspective. J Man Manip Ther. 2011;19(2):91-99.
Reiman MP, Manske RC. The assessment of function: how is it measured? A clinical perspective. J Man Manip Ther. 2011;19(2):91-99.
Common Themes in Literature
1. No consensus on which specific tests should be used
2. Quad deficits, particularly force development quickness appears to be critical factor in RTS
3. Hop tests appear to have some predicative ability for future performance
4. There should be a battery of tests assessing strength, power, laxity, and “fear”
5. No published studies have good predictive ability for RTS
Conclusion
No one specific type of testing, or specific “functional” test has been proven superior
Most authors agree that a comprehensive, systematic evaluation of the athlete is necessary for the most successful return to the athletic arena
Does the test battery determine dysfunction?
Step by step testing with successive advancement protects not only the athlete but the clinician as well
The best testing may be actually “breaking down” their specific sport and position in that sport
Thank [email protected]
@robptatcscs
109 110
111 112
113 114