fund review september’11 - idfc mutual funds review september’11. ... confidence in general...
TRANSCRIPT

M U T U A L F U N D
FUND REVIEW SEPTEMBER’11

Commentary
Global markets continued to hold centre stage in the month of August. While the US debt
ceiling issue got resolved in the nick of time, rating agency S&P downgraded US thus
taking away its AAA rating for the first time. This event triggered a sell-off in global equities
and commodities; a phenomenon which got accentuated by a pronounced turned
downwards in economic data coming from the west. The Euro zone debt issues
continued to plague the market. Reminding participants of 2008, equity short selling
bans were instituted in several European nations while interbank risk spiked between
European banks. Some semblance of temporary stability seemed underway towards
month close as asset and commodity markets rebounded somewhat from month lows.
However, confidence in general continues to remain thin with participants cautious as to
next round of weakness in economic data and / or further adverse developments with
respect to the European debt situation.
Domestic markets took most of their cues from global developments. While the massive
risk aversion globally took the US 10 year yield towards 2 %, our own 10 year government
bond headed towards 8.15% briefly. However, continued hawkish comments from RBI
officials as well as incessant bond supply took its inevitable toll taking the 10 year back
towards 8.30% levels by month close. April – June 2011 GDP posted a shade stronger
than expected growth at 7.7%. However, the April – June 2010 growth was revised
downward thereby providing a more favorable than earlier expected base to the number.
Also, the new base year for industrial production was incorporated to this quarter's
growth but not to previous data, thereby making comparisons that much more difficult.
System liquidity remained within a range of deficit INR 25,000 – 50,000 crores for most
part of the month. Government spending continued to be robust with the government
running over draft with the RBI for most of the month.
Going Forward
The biggest domestic trigger will be the RBI's policy review around mid-September.
Given that the last rate hike of 50 bps was more aggressive than anticipated, that it has
been almost fully passed through by banks via lending rate hikes, and that the global
environment has deteriorated visibly over the last month; sections of the market are
hoping that the RBI will go on pause. Consensus expectation is, however, of one more 25
bps hike and then a pause.
System liquidity is expected to deteriorate towards advance tax payments mid-
September but should regain the current range towards end of the month as tax
collections get spent. Bank CD activity as picked up on refinancing requirements but is
unlikely to cause undue pressure on rates at the short end given falling credit to deposit
ratios.
Equity Debt
Equity Markets Index % Change % Change P/EYTD MTD
Nifty 5,001.00 -18.48% -8.77% 13.76
Sensex 16,676.75 -18.69% -8.36% 13.99
Dow Jones 11,559.95 -0.15% -4.80% 11.31
Shanghai 2,566.60 -8.60% -5.00% 11.42
Nikkie 8,953.90 -12.46% -8.94% 14.22
Hang Seng 20,204.17 -12.29% -9.96% 10.48
FTSE 5,268.66 -10.70% -9.40% 9.23
MSCI E.M. 1,013.68 -11.96% -10.90% 10.19
MSCI D.M. 1,196.18 -6.55% -8.41% 11.31
MSCI (India) (USD) 647.78 -20.16% -8.79% 13.91
Currency & Last Price % Change % Change Commodities YTD MTD
USD / INR 46.10 3.11% 4.32%
Dollar Index 73.95 -6.43% 0.07%
Gold 1,835.43 29.18% 12.75%
Crude Oil
WTI (NYMEX) 88.90 -2.71% -7.11%
Brent Crude 114.02 20.34% -2.33%
India Macro Ananlysis Latest
GDP 7.70
IIP 8.80
Inflation (WPI Monthly) 9.22
Inflation (CPI Monthly) 8.62
Commodity (CRB Index) 541.84
Flows USD Mn
FII (USD mln)
YTD 53.96
MTD -2,106.89
*DII (USD mln)
YTD 1,382.69
MTD 541.69
*Domestic Mutual Funds
An eventful August! Risk aversion was at its high with the MSCI emerging market index
falling 11%. The key highlights of the month was that S&P downgraded US one notch
questioning the unquestionable credit worthiness of sovereigns and also sending global
markets in a tizzy increasing speculation of more sovereign downgrades across the
globe. There were no announcements on QE3 at the much awaited annual Jackson Hole
meeting. In fact the mood there suggested action by central bankers would be moderate
and incremental and need for fiscal consolidation and austerity was voiced.
Markets cheered the end of Anna Hazare's fast post the Government acquiesced to his
demands on the Jan Lokpal bill.
On the Economic front the Industrial Production Index (IP) increased sharply by 8.7% yoy
in June, much above the revised 5.9% yoy (from 5.6% yoy) growth in May. The IP reading
was significantly higher than the Bloomberg consensus expectation of 5.5% yoy . For the
first quarter of FY12, IP grew 6.8% yoy compared to 9.7% yoy growth in FY11. The upward
surprise in the IIP was mainly from the usually volatile Capital Goods Index. The Capital
Goods Index rose significantly by 9.5% mom, after having negative growth for the last two
months. Sequentially, the Consumer Goods Index continued to have negative growth for
the fourth consecutive month, driven by both consumer durables and non-durables.
The GDP no for the first quarter came in at 7.7%. The industrial sector experienced higher
growth on the back of the manufacturing sector (7.2% yoy) and electricity, gas and water
supply (7.9% yoy). Services' growth came out robust. Construction sector growth slowed
down to 1.2% yoy from 8.2% yoy in the previous quarter. However, the trade, hotels,
transport and communication sector grew at a strong 12.8% yoy. Policy inaction coupled
high interest rates and dampened sentiment led to this moderation in growth.
Global headwinds exits both in terms of growth and sovereign risks and markets will
continue to be volatile based on news flow, comments and economic data points. Back
home monsoon are now above average and spatial distribution is good which should
ease food inflation concerns. Markets would be keenly observing the outcome and
stance of the monetary policy meeting on September 16 to determine further course of
action. While there is moderation in growth as reflected by the Q1FY12 GDP growth at 7.7
% there is still excess demand (Inflation still above 9%) in the economy where supply has
not kept pace and it will be a while before moderation in growth can close the output gap.
Though India is a long term structural play that is sheltered from global economic
spillovers supported by a strong consumption and high domestic savings but markets
movement depends on flows which are volatile and fluid depending on the changing risk
preference of the world. Indian markets will continue to be volatile pending clarity on
Interest rates peaking and inflation coming off domestically, resolution of the impending
global sovereign crisis, pickup in global growth. It is matter of time we all know but how
much time?
Source: Bloomberg 02

IDF
C E
qu
ity
Fu
nd
FUND FEATURES
Nature: Equity
Fund Manager: Mr. Kenneth Andrade
Investment objective: The investment objective of the scheme
is to seek to generate capital growth from a portfolio of
predominantly equity and equity related instruments (Including
Equity derivatives). The scheme may also invest in debt and
money market instruments to generate reasonable income.
However there is no assurance that the investment objective of
the scheme will be realized.
Investment strategy (in brief): The strategy of the fund is to
create outperformance over the NIFTY by allocating money
passively into the NIFTY sector weights and doing active stock
selection within these sectors. The fund will participate in IPO's
and capture opportunities in cash future arbitrage (index and
constituents) as well.
Investment style: The Scheme endeavours to generate capital
appreciation through investing in equities by inter alia adopting
the mode of applying for IPOs or subsequent public offering
made by companies. If well priced IPOs are not available the
funds collected may be invested in the index, hence generating
market return from the index and the alpha from the premium on
listing of IPOs.
Entry load: Nil
Exit load: All Investment including SIP/Micro SIP/STP/FOF if
redeemed / switched out within 365 days from the date of
allotment - 1%. No Exit Loads / CDSC will be chargeable in case
of switches made between different options of the Scheme.
(w.e.f. September 01, 2009)
In case of Switches, Exit load shall be NIL for all switch
transactions between equity schemes of IDFC Mutual Fund.
(w.e.f. October 12, 2009.)
Options available: Growth, Dividend
Minimum investment amount: ̀
Additional investment amount: ̀ 1
SIP (minimum amount): ̀ 1000 (w.e.f. July 6, 2009)
Inception Date: 9 June 2006
Statistical Measures:
Beta (BSE 200) 0.86
R Square (BSE 200) 0.89
Beta (Nifty) 0.91
R Square (Nifty) 0.93
Standard deviation 4.62%
5,000 (w.e.f. July 6, 2009)
(IDFC - EF) An Open Ended Equity Fund
Last 3 Dividends (`/unit) :
Date Plan Dividend NAV
18 Mar 11 - 1.00 11.6030
28 Jul 09 - 1.00 10.7530
14 May 08 - 1.50 13.0106
NAV (`) :
Plan Option NAV
Plan A Growth 14.3796
Plan A Dividend 10.8580
Plan B Growth 11.8617
Plan B Dividend 9.9226
Face value (`/unit): 10Asset allocation (equity/debt/cash/derivatives): 76.18% / 19.44% / 4.38% / -Fund manager's comment:IDFC Equity Fund is benchmarked to Nifty, mapping its sectors weightages with active stock selection within the sector. The portfolio will take advantage of cash future arbitrages (portfolio constituents) in addition to the primary and secondary market valuation arbitrages.
Fund PerformanceUnder The IDFC-EF-Growth
Asset Allocation
Portfolio :
IDFC-EF Growth S&P CNX Nifty
30 August 2011
SIP Returns
Period Investment Value Scheme BenchmarkReturn Return
Since Inception 62000 70029 4.66 5.02
5 years 60000 67195 4.48 4.59
3 years 36000 40338 7.54 7.12
2 years 24000 22633 -5.54 -6.56
1 year 12000 10604 -20.83 -22.13
Mahindra & Mahindra Ltd 677.81 1.77Bajaj Auto Ltd 597.95 1.56Tata Motors Ltd 496.47 1.30Hero Motocorp Ltd 410.35 1.07
ICICI Bank Ltd 2103.71 5.50HDFC Bank Ltd 1779.72 4.65State Bank of India 1085.59 2.84Axis Bank Ltd 643.65 1.68
Larsen & Toubro Ltd 1608.95 4.21
ITC Ltd 2200.00 5.75Hindustan Unilever Ltd 480.60 1.26
Tata Steel Ltd 594.18 1.55Jindal Steel & Power Ltd 422.66 1.11
HDFC Ltd 1661.13 4.34
GAIL (India) Ltd 410.60 1.07
Bharat Heavy Electricals Ltd 530.51 1.39
Sterlite Industries Ltd 516.75 1.35
Oil & Natural Gas Corporation Ltd 762.48 1.99
Reliance Industries Ltd 2558.95 6.69
Dr. Reddy's Laboratories Ltd 523.60 1.37Sun Pharmaceutical Industries Ltd 487.88 1.28
NTPC Ltd 425.79 1.11
Tata Consultancy Services Ltd 1757.89 4.60Infosys Ltd 1522.92 3.98HCL Technologies Ltd 513.69 1.34
Bharti Airtel Ltd 1057.69 2.77
Grand Total 38234.57 100.00Nifty Index 8842.80 23.13
Auto Total 2182.58 5.71
Banks Total 5612.68 14.68
Construction Project Total 1608.95 4.21
Consumer Non Durables Total 2680.60 7.01
Ferrous Metals Total 1016.85 2.66
Finance Total 1661.13 4.34
Gas Total 410.60 1.07
Industrial Capital Goods Total 530.51 1.39
Non - Ferrous Metals Total 516.75 1.35
Oil Total 762.48 1.99
Petroleum Products Total 2558.95 6.69
Pharmaceuticals Total 1011.48 2.65
Power Total 425.79 1.11
Software Total 3794.50 9.92
Telecom - Services Total 1057.69 2.77Other Equity Total 3293.69 8.61Commercial Paper Total 6963.26 18.21*Call / Reverse Repo/ CBLO Total 470.10 1.23*Net Current Asset 1676.00 4.38*
Equity Futures Total 8842.80 23.13
Name Market Value in Lac(`)
% of NAV
*Cash or cash equivalents with residual maturity of less than 91 days may be treated as not creating any exposure.
Past performance may or may not be sustained in future.Benchmark: S&P CNX Nifty
3 Month (Absolute)
6 Month (Absolute)
Last 1 Year (CAGR)
Last 2 Years (CAGR)
Last 3 Years (CAGR)
Last 5 Years (CAGR)
Since Inception (09-06-2006)
(CAGR)
Text
ile P
rod
ucts
Ga
s
Cem
en
t
Ind
ust
ria
l Ca
pita
lG
oo
ds
Oil
No
n -
Ferr
ou
sM
eta
ls
Tele
co
m -
Serv
ices
Po
wer
Ph
arm
aceu
tica
ls
Ferr
ou
s M
eta
ls
Co
nst
ructio
nP
roje
ct
Fin
an
ce
Au
to
Petr
ole
um
Pro
du
cts
Co
nsu
mer
No
nD
ura
ble
s
So
ftw
are
Ba
nks
0.35% 0.70% 1.07% 1.17% 2.18% 2.34% 2.60% 2.66% 2.73% 2.77% 3.38% 4.21% 4.34%5.71% 6.69% 7.01%
9.92%
16.33%
Co
nst
ructio
n
7.20%
11.24%
6.37%
4.88%3.96%
-6.30%-5.74%-9.40%
7.83%
5.21%3.58%
-7.45%-6.23%-10.06%
03

FUND FEATURES
Nature: Equity
Fund Manager: Mr. Tridib Pathak (w.e.f. 26 April 2010)
Investment objective: The investment objective of the Scheme is to seek to
generate capital appreciation and/or provide income distribution from a
portfolio of predominantly equity and equity related instruments. There is no
assurance or guarantee that the objectives of the scheme will be realized.
Investment style: The Scheme seeks to invest predominantly in companies
based on the potential value unlocking (subsidiary listing), strong growth in
domestic demand and emerging sectors in the Indian economy.
Ideal investment horizon: 3 years or more
Entry load: Nil
Exit load: All Investment including SIP/Micro SIP/ STP/ FOF if redeemed
/switched out within 365 days from the date of allotment - 1%. No Exit Loads /
CDSC will be chargeable in case of switches made between different options
of the Scheme. (w.e.f. September 01, 2009).
In case of Switches, Exit load shall be NIL for all switch transactions between
equity schemes of IDFC Mutual Fund. (w.e.f. October 12, 2009.)
Options available: Growth, Dividend. Reinvestment facility is available under
the Dividend Option.
Minimum investment amount: 5,000
Additional investment amount: ̀ 1
SIP (minimum amount):`1,000
Inception Date: 16 March 2006
Statistical Measures:
Beta 0.88
R Square 0.94
Standard deviation 7.71%
`
(IDFC - IEF) An Open Ended Equity Fund
Last 3 Dividends (`/unit) :
NAV (`) :
Plan A Growth 17.8782
Plan A Dividend 12.9413
Plan B Growth 15.4077
Plan B Dividend 12.3833
Face value (`/unit): 10Asset allocation (equity/debt/cash/derivatives): 92.62% / 4.91% / 2.28% / 0.19%Fund manager's comment:Imperial fund is a diversified large cap biased fund. The portfolio construction has revolved around selecting well established companies which have high capital efficiency or are moving towards improving their capital efficiency further and are available at reasonable valuations.
Asset Allocation
IDFC Imperial Equity Fund
30 August 2011
SIP Returns
Period Investment Value Scheme BenchmarkReturn Return
Since Inception 65000 82198 8.59 5.34
5 years 60000 73337 7.96 4.65
3 years 36000 41077 8.77 7.21
2 years 24000 23069 -3.76 -6.56
1 year 12000 10886 -16.74 -22.13
Rating & Ranking
Value Research Ranking
Past performance is no guarantee of future results.For Methodology of Ranking Please refer Page No. 29.
Date Plan Dividend NAV
25 Jan 11 Plan B 2.00 13.4751
25 Jan 11 Plan A 2.00 14.0831
15 Jun 09 Plan A 1.20 12.0942
08 Jun 09 Plan A 1.20 12.4523
14 May 08 - 1.50 13.9431
Bharat Heavy Electricals Ltd 1422.32 3.89
Zee Entertainment Enterprises Ltd 1033.28 2.83
Coal India Ltd 1949.98 5.34
Sterlite Industries Ltd 1026.61 2.81
Oil & Natural Gas Corporation Ltd 2050.89 5.62Oil India Ltd 978.38 2.68
Reliance Industries Ltd 1212.47 3.32Reliance Industries Ltd. (Futures) 309.76 0.85Indian Oil Corporation Ltd 642.81 1.76
Dr. Reddy's Laboratories Ltd 1092.08 2.99Torrent Pharmaceuticals Ltd 885.52 2.42Pfizer Ltd 780.61 2.14Cipla Ltd 758.92 2.08
Infosys Ltd 1660.03 4.55Tata Consultancy Services Ltd 941.39 2.58Wipro Ltd 823.04 2.25HCL Technologies Ltd 499.19 1.37
Bharti Airtel Ltd 2150.71 5.89
Grand Total 36519.69 100.00
Industrial Capital Goods Total 1422.32 3.89
Media & Entertainment Total 1033.28 2.83
Minerals/Mining Total 1949.98 5.34
Non - Ferrous Metals Total 1026.61 2.81
Oil Total 3029.26 8.29
Petroleum Products Total 2165.04 5.93
Pharmaceuticals Total 3517.13 9.63
Software Total 3923.64 10.74
Telecom - Services Total 2150.71 5.89Derivative Total 67.86 0.19Certificate of Deposit Total 737.68 2.02*Call / Reverse Repo/ CBLO Total 400.09 1.10*
Morningstar Rating
Portfolio :
Name Market Value in Lac(`)
% of NAV
Co
nsu
mer
Du
rab
les
Med
ia &
En
tert
ain
men
t
Petr
ole
um
P
rod
ucts
Ind
ust
ria
l Ca
pita
lG
oo
ds
Ferr
ou
s M
eta
ls
No
n -
Ferr
ou
sM
eta
ls
Min
era
ls/M
inin
g
Tele
co
m -
Serv
ices
Oil
Au
to
Ph
arm
aceu
tica
ls
Co
nsu
mer
No
nD
ura
ble
s
So
ftw
are
Ba
nks
1.05%2.61% 2.81% 2.83%
3.89%5.34% 5.89% 5.93%
8.24% 8.29%9.63%
10.74% 11.41%
18.02%
*Cash or cash equivalents with residual maturity of less than 91 days may be treated as not creating any exposure.
Portfolio :
Name Market Value in Lac(`)
% of NAV
Mahindra & Mahindra Ltd 1509.52 4.13Bajaj Auto Ltd 1487.46 4.07Hero Motocorp Ltd 1171.32 3.21
Bank of Baroda 1613.96 4.42HDFC Bank Ltd 1564.51 4.28Punjab National Bank 1208.42 3.31ICICI Bank Ltd - Future 1178.08 3.23ICICI Bank Ltd 582.81 1.60Jammu & Kashmir Bank Ltd 432.69 1.18
Whirlpool of India Ltd 382.81 1.05
ITC Ltd 1730.55 4.74Titan Industries Ltd 1279.41 3.50
Jindal Steel & Power Ltd 954.55 2.61
Auto Total 4168.30 11.41
Banks Total 6580.46 18.02
Consumer Durables Total 382.81 1.05
Consumer Non Durables Total 3009.97 8.24
Ferrous Metals Total 954.55 2.61
Fund PerformanceUnder The IDFC-IEF-Growth
IDFC-IEF Growth S&P CNX NiftyPast performance may or may not be sustained in future.Benchmark: S&P CNX Nifty
3 Month (Absolute)
6 Month (Absolute)
Last 1 Year (CAGR)
Last 2 Years (CAGR)
Last 3 Years (CAGR)
Last 5 Years (CAGR)
Since Inception (16-03-2006)
(CAGR)
11.23%8.36%
-7.54%
-2.65%
-6.73%
4.90%
9.12% 11.32%
-10.06%-6.23% -7.45%
3.58% 4.67%
7.93%
03

FUND FEATURES
Nature: Equity
Fund Manager: Mr. Kenneth Andrade
Investment objective: The investment objective of the Scheme is to seek to
generate capital appreciation from a diversified portfolio of equity and equity
related instruments.
The Scheme will predominantly invest in small and midcap equity and equity
related instruments. Small and Midcap equity and equity related instruments
will be the stocks included in the CNX Midcap index or equity and equity
related instruments of such companies which have a market capitalization
lower than the highest components of CNX Midcap Index.
The Scheme may also invest in stock other than mid cap stocks (i.e. in stocks,
which have a market capitalization of above the market capitalization range of
the defined small midcap stocks) and derivatives. On defensive
considerations, the Scheme may also invest in debt and money market
instruments. However there is no assurance that the investment objective of
the scheme will be realized.
Investment style: The Scheme will predominantly invest in small and mid-
cap equity and equity related instruments. Small and Mid-cap equity and
equity related instruments will be the stocks included in the CNX Mid-Cap
Index or equity and equity related instruments of such companies which have
a market capitalization lower than the highest components of CNX Mid-Cap
Index. The scheme would predominantly create a portfolio of emerging
business and companies that are aspiring leaders in their respective field of
operations. Some part of the portfolio would be in stocks/ companies that do
not have a significant history of being listed.
Ideal investment horizon: 3 years or more
Entry load: Nil
Exit load: The scheme is converted into open ended scheme w.e.f.
September 11, 2009.w.e.f. September 11, 2009 Exit Load - If redeemed within
365 days from the date of purchase(s) applying First in First out basis
(including purchase made through the STP/SIP) - 1.00%. No exit load /CDSC
will be chargeable in case of switches made between different options of the
schemes.
In case of Switches, Exit load shall be NIL for all switch transactions between
equity schemes of IDFC Mutual Fund (w.e.f. October 12, 2009)
Options available: Growth, Dividend
Minimum investment amount: ̀ 5,000
Additional investment amount: ̀ 1
SIP (minimum amount): ̀ 1,000
Inception Date: 7 March 2008
Statistical Measures:
Beta 0.71
R Square 0.90
Standard deviation 4.02%
(IDFC - SMEF) An Open Ended Equity Fund
Last 3 Dividends (`/unit) :
Date Plan Dividend NAV
29 Apr 2011 - 1.50 13.9282
29 Apr 2010 - 1.60 13.9863
29 Sep 2009 - 1.10 12.3972
NAV (`) :
Plan NAV
Growth 17.6151
Dividend 13.1220
Face value (`/unit): 10Asset allocation (equity/debt/cash/derivatives): 89.78%/9.20%/1.02%/-Fund manager's comment:The fund philosophy is to capture the potential of the small and mid - cap companies in the country. The underlying companies in the portfolio are growth oriented and at a second level the fund seeks to optimize valuations in this space. With markets buoyant the portfolio shifts have been reasonably aggressive in tune with the changing valuations. The strategy is expected to remain invested in smaller companies with low business risk and extreme valuation comfort.
Fund PerformanceUnder IDFC-SMEF-Growth Fund
Asset Allocation
Portfolio :
IDFC-SMEF Growth CNX Midcap
SIP Returns
Period Investment Value Scheme BenchmarkReturn Return
Since Inception 41000 60195 23.12 11.44
3 years 36000 50781 23.74 13.23
2 years 24000 25205 4.79 -6.21
1 year 12000 11378 -9.46 -22.40
Bajaj Auto Ltd 3108.26 2.82
Apollo Tyres Ltd 3134.95 2.84
Nestle India Ltd 5071.69 4.59VST Industries Ltd 4794.63 4.34Piramal Glass Ltd 3300.47 2.99
Mahindra & Mahindra Financial Services Ltd 5093.96 4.61ICRA Ltd 2894.00 2.62
Suzlon Energy Ltd 2579.50 2.34
Eros International Media Ltd 3651.60 3.31
Rallis India Ltd 3446.19 3.12
Castrol India Ltd 5021.25 4.55
Hexaware Technologies Ltd 4281.05 3.88
Idea Cellular Ltd 4897.55 4.44Tulip Telecom Ltd 3258.22 2.95
Vardhman Textiles Ltd 4009.25 3.63
Grand Total 110387.13 100.00Nifty Index 3051.83 2.76Union Bank of India - Futures 245.11 0.22
Auto Total 3108.26 2.82
Auto Ancillaries Total 3134.95 2.84
Consumer Non Durables Total 13166.79 11.93
Finance Total 7987.96 7.24
Industrial Capital Goods Total 2579.50 2.34
Media & Entertainment Total 3651.60 3.31
Pesticides Total 3446.19 3.12
Petroleum Products Total 5021.25 4.55
Software Total 4281.05 3.88
Telecom - Services Total 8155.77 7.39
Textiles - Cotton Total 4009.25 3.63Top 15 Equity Total 58542.58 53.03Other Equity Total 40558.65 36.74Certificate of Deposit Total 8063.29 7.30*Call / Reverse Repo/ CBLO Total 2094.03 1.90*Net Current Asset 1128.57 1.02*
Equity Futures Total 3296.94 2.99
Name Market Value in Lac(`)
% of NAV
Rating & Ranking
Value Research Ranking
Past performance is no guarantee of future results.For Methodology of Ranking Please refer Page No. 29.
Past performance may or may not be sustained in future.Benchmark: CNX Midcap
30 August 2011
3 Month (Absolute)
6 Month (Absolute)
Last 1 Year (CAGR)
Last 2 Years (CAGR)
Last 3 Years (CAGR)
Since Inception (07-03-2008)
(CAGR) Ind
ust
ria
lP
rod
ucts
Cem
en
t
Mis
cella
neo
us
Min
era
ls/M
inin
g
Fert
ilise
rs
Po
wer
Co
nst
ructio
n
Au
to
Pa
per
Ba
nks
Tra
nsp
ort
atio
n
Tele
co
m -
Serv
ices
Ind
ust
ria
l Ca
pita
lG
oo
ds
Pest
icid
es
Med
ia &
En
tert
ain
men
t
Ph
arm
aceu
tica
ls
Text
iles
- C
ott
on
Petr
ole
um
Pro
du
cts
Au
to A
ncill
aries
So
ftw
are
IDFC Small & Midcap Equity (SME) Fund
Ga
s
Ch
em
ica
ls
-3.52%
5.32%
17.64%
25.55%
17.66%
-1.02%
9.80% 8.97%3.36%
-9.55%-5.45%
-16.00%
Morning Star Rating
*Cash or cash equivalents with residual maturity of less than 91 days may be treated as not creating any exposure.
0.00% 0.08% 0.52% 0.64% 0.64% 0.66% 0.85% 0.97% 1.27%1.90% 2.02% 2.31%
3.81% 3.82% 3.88%4.39%
4.85% 5.07% 5.19%5.70%
6.66% 7.39%
11.66%
15.50%
Fin
an
ce
Co
nsu
mer
No
nD
ura
ble
s

IDF
C In
fra
stru
ctu
re F
un
dFUND FEATURES
Nature: Equity
Fund Manager: Mr. Kenneth Andrade
Investment objective: The investment objective of the scheme
is to seek to generate long-term capital growth through an active
diversified portfolio of predominantly equity and equity related
instruments of companies that are participating in and
benefiting from growth in Indian infrastructure and
infrastructural related activities. However, there can be no
assurance that the investment objective of the scheme will be
realized.
Ideal investment horizon: 3 years or more
Entry load: Nil
Exit load: 1% if redeemed within 365 days from the date of
allotment/investment. No load shall be applicable for switches
between equity schemes of IDFC Mutual Fund and for switches
between options of the schemes.
Options available: Growth & Dividend. Reinvestment facility is
also available under the Dividend Option.
Minimum investment amount: ̀
Additional investment amount: ̀ 1
SIP (minimum amount): ̀ 1000
Inception Date: 8 March 2011
Dividend frequency: To be decided from time to time.
5,000 & in multiples of ̀ 1
(IDFC - IF) An Open Ended Equity Fund
NAV (`) :
Plan NAV
Growth 9.3580
Dividend 9.3595
Face value (`/unit): 10Asset allocation (equity/debt/cash/derivatives): 92.93% / 6.91% / 0.16% / -
Fund PerformanceUnder the IDFC-IF-Growth
Portfolio :
IDFC-IF Growth BSE 200
30 August 2011
Ambuja Cements Ltd 299.36 3.45
IRB Infrastructure Developers Ltd 220.13 2.53Ahluwalia Contracts India Ltd 140.13 1.61
Larsen & Toubro Ltd 617.84 7.11
Petronet Lng Ltd 435.88 5.02Gujarat Gas Co Ltd 364.56 4.20Gujarat State Petronet Ltd 325.49 3.75Indraprastha Gas Ltd 300.51 3.46Gail (India) Ltd 246.36 2.84
Alstom Projects India Ltd 328.08 3.78Siemens Ltd 272.93 3.14Honeywell Automation India Ltd 156.67 1.80BEML Ltd 99.65 1.15
ABG Infralogistics Ltd 337.53 3.88
Oil India Ltd 234.35 2.70
Power Grid Corporation Ltd 587.17 6.76NTPC Ltd 507.90 5.85Tata Power Co Ltd 208.95 2.40Torrent Power Ltd 178.80 2.06
Bharti Airtel Ltd 776.93 8.94Idea Cellular Ltd 456.77 5.26Tulip Telecom Ltd 185.56 2.14
Mundra Port & Special Eco Zone Ltd 425.88 4.90Gateway Distriparks Ltd 226.48 2.61
Grand Total 8689.31 100.00
Cement Total 299.36 3.45
Construction Total 360.26 4.15
Construction Project Total 617.84 7.11
Gas Total 1672.79 19.25
Industrial Capital Goods Total 857.34 9.87
Miscellaneous Total 337.53 3.88
Oil Total 234.35 2.70
Power Total 1482.82 17.06
Telecom - Services Total 1419.26 16.33
Transportation Total 652.36 7.51Other Equity Total 141.24 1.63Call / Reverse Repo/ CBLO Total 600.13 6.91Net Current Asset 14.03 0.16
Name Market Value in Lac(`)
% of NAV
Past performance may or may not be sustained in future.Benchmark: BSE 200
Asset Allocation
3 Month (Absolute)
Since Inception (08-03-2011) (Absolute)
Oil
Min
era
ls/M
inin
g
Cem
en
t
Tra
nsp
ort
atio
n
Co
nst
ructio
n
Ga
s
Co
nst
ructio
nP
roje
ct
Tele
co
m -
Serv
ices
Ind
ust
ria
lC
ap
ital G
oo
ds
Po
wer
2.70% 3.45% 3.88% 4.77%7.51% 8.11%
9.87%
16.33% 17.06%19.25%
-5.94%-6.42%
-10.45%-8.86%

FUND FEATURES
Nature: Equity
Fund Manager: Mr. Kenneth Andrade
Investment objective: The Scheme shall seek to generate long-term capital
growth from an actively managed portfolio of predominantly equity and equity
related instruments. However there is no assurance that the investment
objective of the scheme will be realized.
Investment style: Focus on buying great companies at low valuation with a
longer term perspective. The scheme portfolio would seek to acquire, inter
alia, small and medium size business with good long term potential, which are
available at cheap valuation. Such securities would be identified through
disciplined fundamental research keeping in view medium to long term trends
in the business environment. The Scheme shall endeavor to accumulate long
term investor wealth by opening subscriptions to units during periods when
stocks are available at reasonable valuations. By doing so, the fund
managers would endeavor to prevent short term money from flowing into the
fund which can prove detrimental to the interest of long term investors.
Ideal investment horizon: 3 years or more
Entry load: Nil
Exit load: All investment including SIP/Micro SIP/STP/FOF if redeemed /
switched out within 365 days from the date of allotment - 1%. No Exit Loads /
CDSC will be chargeable in case of switches made between different options
of the Scheme. (w.e.f. September 01, 2009)
In case of Switches, Exit load shall be NIL for all switch transactions between
equity schemes of IDFC Mutual Fund. (w.e.f. October 12, 2009.)
Options available: Growth, Dividend. Reinvestment facility is available
under the Dividend Option.
Minimum investment amount: 25,000
Additional investment amount: ̀ 1
SIP (minimum amount):`2,000
Inception Date : 28 September 2005
Statistical Measures:
Beta 0.89
R Square 0.86
Standard deviation 8.74%
`
IDFC Premier Equity Fund
(IDFC - PEF) An Open Ended Equity Fund
Last 3 Dividends (`/unit) :
Face value (`/unit): 10Asset allocation (equity/debt/cash/derivatives): 79.68% / 19.25% / 1.07% / -Fund manager's comment:The portfolio has attempted to identify emerging themes & segment leaders which have a strong correlation to the growth of the economy. The fund is invested close to 90% with the balance in cash. The investment process & the diversification have not undergone any radical shift. The focus remains on buying into emerging business & taking a call on the entrepreneur /organization to ride through successfully the growth curve of the business cycle.
Fund PerformanceUnder the IDFC-PEF-Growth
Asset Allocation
Portfolio :
Kotak Mahindra Bank Ltd 6861.85 2.88
IRB Infrastructure Developers Ltd 6112.14 2.56
Asian Paints Ltd 12947.04 5.43
Glaxosmithkline Consumer Healthcare Ltd 10318.47 4.33
Bata India Ltd 9545.25 4.00
Kaveri Seed Company Ltd 5343.23 2.24
Coromandel International Ltd 10974.82 4.60
Shriram Transport Finance Co Ltd 7280.65 3.05
Gujarat State Petronet Ltd 9514.25 3.99
Siemens Ltd 6227.21 2.61
Torrent Power Ltd 5872.36 2.46
Page Industries Ltd 12783.11 5.36
Arvind Ltd 6650.48 2.79
Redington India Ltd 5505.40 2.31
Blue Dart Express Ltd 7738.36 3.25
Grand Total 238354.93 100.00
Bank Total 6861.85 2.88
Construction Total 6112.14 2.56
Consumer Non Durables Total 38153.99 16.01
Fertilisers Total 10974.82 4.60
Finance Total 7280.65 3.05
Gas Total 9514.25 3.99
Industrial Capital Goods Total 6227.21 2.61
Power Total 5872.36 2.46
Textile Products Total 19433.59 8.15
Trading Total 5505.40 2.31
Transportation Total 7738.36 3.25
Top 15 Equity Total 123674.61 51.89
Other Equity Total 66247.46 27.79
Certificate of Deposit Total 11343.63 4.76
Corporate Bond Total 7744.08 3.25
Commercial Paper Total 10352.68 4.34
Floating Rate Note Total 7937.72 3.33
Fixed Deposit Total 1500.00 0.63
Call / Reverse Repo/ CBLO Total 6997.60 2.94
Net Current Asset 2557.15 1.07
Name Market Value % of NAV in Lac(`)
IDFC-PEF Growth BSE 500
30 August 2011
SIP Returns
Period Investment Value Scheme BenchmarkReturn Return
Since Inception 142000 267731 21.35 6.36
5 years 120000 200088 20.57 4.82
3 years 72000 105607 26.56 8.67
2 years 48000 52992 9.84 -7.59
1 year 24000 23658 -2.63 -22.88
Rating & Ranking
Value Research Ranking Morningstar Rating
Past performance is no guarantee of future results.For Methodology of Ranking Please refer Page No. 29.
Past performance may or may not be sustained in future.Benchmark: BSE 500
Date Plan Dividend NAV
29 Mar 11 Plan B 2.00 18.6550
29 Mar 10 Plan B 2.00 18.4696
29 Mar 11 Plan A 2.40 22.5858
29 Mar 10 Plan A 2.40 22.3426
28 Apr 09 - 1.50 13.1031
NAV (`) :
Plan A Growth 32.2592
Plan A Dividend 23.6318
Plan B Growth 23.7893
Plan B Dividend 19.5189
3 Month (Absolute)
6 Month (Absolute)
Last 1 Year (CAGR)
Last 2 Years (CAGR)
Last 3 Years (CAGR)
Last 5 Years (CAGR)
Since Inception (28-09-2005)
(CAGR)
Reta
ilin
g
Cem
en
t
So
ftw
are
Ba
nks
Med
ia &
En
tert
ain
men
t
Au
toA
ncill
aries
Tra
din
g
Co
nsu
mer
Du
rab
les
Ind
ust
ria
lP
rod
ucts
Co
nst
ructio
n
Ind
ust
ria
lC
ap
ital G
oo
ds
Po
wer
Tra
nsp
ort
atio
n
Ga
s
Fert
ilise
rs
Fin
an
ce
Text
ileP
rod
ucts
Co
nsu
mer
No
n D
ura
ble
s
0.42% 0.42% 0.75% 1.07% 2.02% 2.31% 2.56% 2.69% 2.86% 2.88% 2.95% 3.62% 3.82%5.05% 5.17% 5.17% 5.90%
8.15%
21.87%
Mis
cella
nceo
us
21.86%
10.85%
0.64%
9.64%
-2.86%
19.58% 19.36%
24.72%
-10.32%-5.30%
-11.04%
3.60% 4.82%7.96%

FUND FEATURES
Nature: Equity
Fund Manager: Mr. Neelotpal Sahai. (w.e.f 23 Dec 2010)
Investment objective: The investment objective of the scheme is to seek to
generate long-term capital appreciation by investing in Equity and Equity
related instruments. The scheme aims to capture the growth in India's Gross
Domestic Product (GDP). The scheme would endeavour to represent the
growth in GDP by capturing the growth in the constituents of the GDP. The
scheme may also invest in debt and money market instruments.
There is no assurance or guarantee that the objectives of the scheme will be
realized and the scheme does not assure or guarantee any returns.
Investment style: The Scheme will invest in well-managed growth
companies that are available at reasonable value. Companies would be
identified through a systematic process of forecasting earnings based on a
deep understanding of the industry growth potential and interaction with
company management.
Entry load: Nil
Exit load: All Investment including SIP/Micro SIP/STP/FOF if redeemed /
switched out within 365 days from the date of allotment - 1%. No Exit Loads /
CDSC will be chargeable in case of switches made between different options
of the Scheme. (w.e.f. September 01, 2009)
In case of Switches, Exit load shall be NIL for all switch transactions between
equity schemes of IDFC Mutual Fund . (w.e.f. October 12, 2009.)
Options available: Growth, Dividend. Reinvestment facility is also available
under the dividend option.
Minimum investment amount: ̀ 5,000
Additional investment amount: ̀ 1
SIP (minimum amount): ̀ 2,000
Inception Date: 11 March 2009
Statistical Measures:
Beta 0.55
R Square 0.75
Standard deviation 5.33%
(IDFC - IGGF) An Open Ended Equity Fund
Last 3 Dividends (`/unit) :
Date Plan Dividend NAV
31 May 11 - 1.50 12.6652
31 May 10 - 2.00 12.6450
NAV (`) :
Plan NAV
Growth 15.2739
Dividend 11.7914
Face value (`/unit): 10Asset allocation (equity/debt/cash/derivatives): 95.44% / 4.09% / 0.47% / -Fund manager's comment:The fund is benchmarked to the components of India’s GDP in the proportion of the contribution of each component to GDP growth. The fund is invested mainly in the services sector, followed by industrials and then agriculture. Around 60% of the fund’s portfolio is currently invested in midcap stocks.
Fund PerformanceUnder the IDFC-GDP-Growth
Asset Allocation
Portfolio :
IDFC-GDP Growth BSE 500
30 August 2011
Tata Motors Ltd 44.54 1.82
ICICI Bank Ltd 139.72 5.71Bank of Baroda 117.81 4.81State Bank of India 98.69 4.03Axis Bank Ltd 26.82 1.10
India Cements Ltd 83.75 3.42
IRB Infrastructure Developers Ltd 73.38 3.00
Larsen & Toubro Ltd 64.36 2.63
Hitachi Home & Life Solutions (India) Ltd 75.00 3.06
Mcleod Russell India Ltd 36.21 1.48Bajaj Corp Ltd 29.81 1.22Shree Renuka Sugars Ltd 28.90 1.18Godrej Consumer Products Ltd 25.64 1.05
Jindal Steel & Power Ltd 104.18 4.26
Gujarat State Fertilizers & Chemicals Ltd 39.10 1.60
Power Finance Corporation Ltd 101.89 4.16
GAIL (India) Ltd 61.59 2.52Gujarat State Petronet Ltd 50.08 2.05
EROS International Media Ltd 85.92 3.51
Oil & Natural Gas Corporation Ltd 65.83 2.69
Rallis India Ltd 42.09 1.72
Reliance Industries Ltd 125.22 5.12
Lupin Ltd 67.31 2.75Cadila Healthcare Ltd 63.38 2.59
Tata Consultancy Services Ltd 135.51 5.54Infosys Ltd 117.15 4.79HCL Technologies Ltd 82.19 3.36
Bharti Airtel Ltd 80.93 3.31Idea Cellular Ltd 49.98 2.04
Arvind Ltd 78.55 3.21
Vardhman Textiles Ltd 57.32 2.34
Cox And Kings Ltd 60.23 2.46
Grand Total 2447.79 100.00
Auto Total 44.54 1.82
Banks Total 383.04 15.65
Cement Total 83.75 3.42
Construction Total 73.38 3.00
Construction Project Total 64.36 2.63
Consumer Durables Total 75.00 3.06
Consumer Non Durables Total 120.56 4.93
Ferrous Metals Total 104.18 4.26
Fertilisers Total 39.10 1.60
Finance Total 101.89 4.16
Gas Total 111.67 4.56
Media & Entertainment Total 85.92 3.51
Oil Total 65.83 2.69
Pesticides Total 42.09 1.72
Petroleum Products Total 125.22 5.12
Pharmaceuticals Total 130.69 5.34
Software Total 334.85 13.68
Telecom - Services Total 130.91 5.35
Textile Products Total 78.55 3.21
Textiles - Cotton Total 57.32 2.34
Transportation Total 60.23 2.46Other Equity Total 23.24 0.95Call / Reverse Repo/ CBLO Total 100.02 4.09Net Current Asset 11.50 0.47
Name Market Value in Lac(`)
% of NAV
SIP Returns
Period Investment Value Scheme BenchmarkReturn Return
Since Inception 58000 59861 2.55 0.60
2 years 48000 46665 -2.69 -7.59
1 year 24000 21665 -17.52 -22.88
Past performance may or may not be sustained in future.Benchmark: BSE 500
3 Month (Absolute)
6 Month (Absolute)
Last 1 Year (CAGR)
Last 2 Years (CAGR)
Since Inception (11-03-2009)
(CAGR)
Fert
ilise
rs
Text
iles
Co
tto
n
Co
nst
ructio
nP
roje
ct
Oil
Pest
icid
es
Cem
en
t
Co
nst
ructio
n &M
ed
iaE
nte
rta
inm
en
t
Text
ile P
rod
ucts
Ferr
ou
s M
eta
ls
Ph
arm
aceu
tica
ls
Petr
ole
um
Pro
du
cts
Co
nsu
mer
No
nD
ura
ble
s
-
Tele
co
mS
erv
ices
Fin
an
ce
So
ftw
are
Ba
nks
IDFC India GDP Growth Fund
1.60% 1.72% 1.82% 2.34% 2.46% 2.63% 2.69% 3.00% 3.06% 3.21% 3.42% 3.51% 4.16% 4.26% 4.56% 4.93% 5.12% 5.34% 5.35%
13.68%
16.60%
Au
to
Tra
nsp
ort
atio
n
Co
nsu
mer
Du
rab
les
Ga
s
-1.57%
-9.57%
6.47%
-10.32% -11.04%
36.94%
18.70%
-6.90% -5.30%
3.60%
IDF
C S
tra
teg
ic S
ecto
r (5
0-5
0)
Eq
uity
Fu
nd
FUND FEATURES
Nature: Equity
Fund Manager: Mr. Kenneth Andrade
Investment objective: The investment objective of the scheme
is to seek to generate long-term capital appreciation by
investing in Equity and Equity related instruments.
The investment objective of the fund shall be achieved by
investing up to fifty percent of the assets of the scheme in a
chosen sector (sector specific exposure) while the balance
amount may be invested in companies across market
capitalizations and across sectors (diversified exposure). The
scheme may also invest in debt and money market instruments.
There is no assurance or guarantee that the objectives of the
scheme will be realized and the scheme does not assure or
guarantee any returns.
Ideal investment horizon: 3 years or more
Entry load: Nil
Exit load: All investment including SIP/Micro SIP/STP/FOF if
redeemed / switched out within 365 days from the date of
allotment - 1%. No Entry / Exit Loads / CDSC will be chargeable
in case of switches made between different options of the
Scheme. (w.e.f. September 01, 2009)
In case of Switches, Exit load shall be NIL for all switch
transactions between equity schemes of IDFC Mutual Fund.
(w.e.f. October 12, 2009.)
Options available: Growth, Dividend. Reinvestment facility is
available under the Dividend Option.
Minimum investment amount: 5,000
Additional investment amount: ̀ 1
SIP (minimum amount):`1,000
Inception Date: 3 October 2008
Statistical Measures:
Beta 0.87
R Square 0.95
Standard deviation 6.86%
Dividend Frequency: NA
`
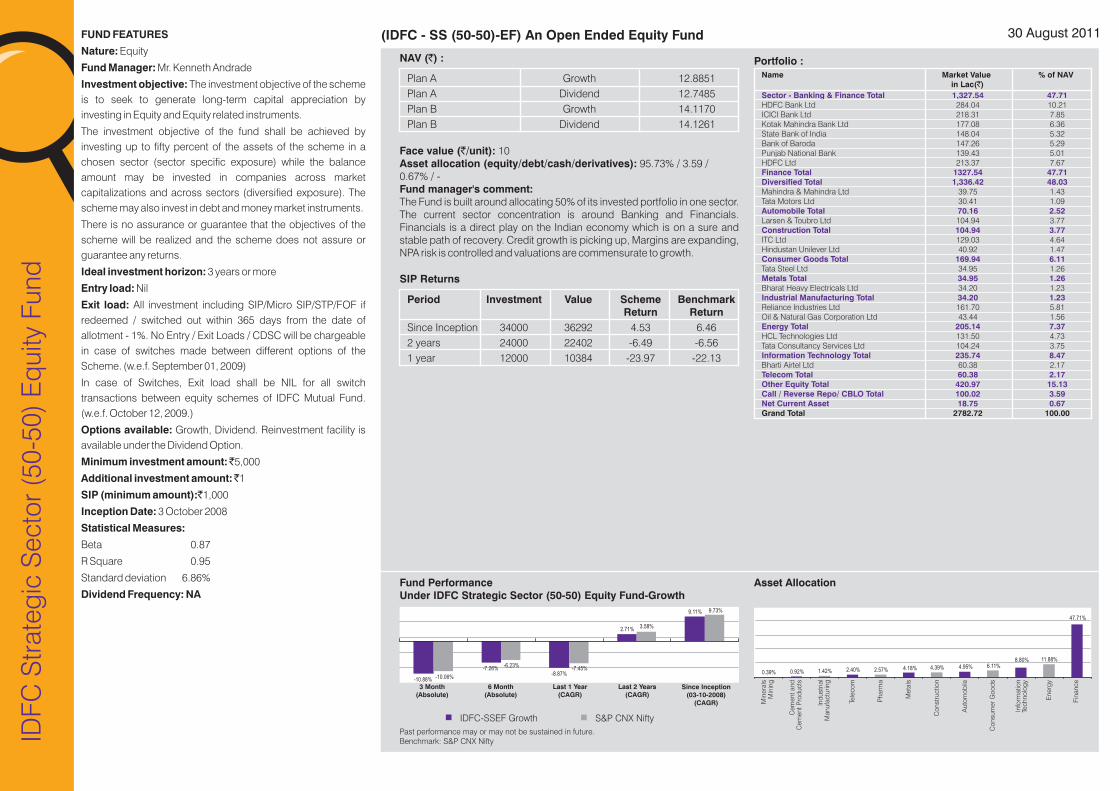
(IDFC - SS (50-50)-EF) An Open Ended Equity Fund
Face value (`/unit): 10Asset allocation (equity/debt/cash/derivatives): 95.73% / 3.59 / 0.67% / -Fund manager's comment:The Fund is built around allocating 50% of its invested portfolio in one sector. The current sector concentration is around Banking and Financials. Financials is a direct play on the Indian economy which is on a sure and stable path of recovery. Credit growth is picking up, Margins are expanding, NPA risk is controlled and valuations are commensurate to growth.
Fund PerformanceUnder IDFC Strategic Sector (50-50) Equity Fund-Growth
Asset Allocation
Portfolio :
IDFC-SSEF Growth S&P CNX Nifty
30 August 2011
NAV (`) :
Plan A Growth 12.8851
Plan A Dividend 12.7485
Plan B Growth 14.1170
Plan B Dividend 14.1261
SIP Returns
Period Investment Value Scheme BenchmarkReturn Return
Since Inception 34000 36292 4.53 6.46
2 years 24000 22402 -6.49 -6.56
1 year 12000 10384 -23.97 -22.13
Past performance may or may not be sustained in future.Benchmark: S&P CNX Nifty
Sector - Banking & Finance Total 1,327.54 47.71
Finance Total 1327.54 47.71Diversified Total 1,336.42 48.03
Automobile Total 70.16 2.52
Construction Total 104.94 3.77
Consumer Goods Total 169.94 6.11
Metals Total 34.95 1.26
Industrial Manufacturing Total 34.20 1.23
Energy Total 205.14 7.37
Information Technology Total 235.74 8.47
Telecom Total 60.38 2.17Other Equity Total 420.97 15.13Call / Reverse Repo/ CBLO Total 100.02 3.59Net Current Asset 18.75 0.67
HDFC Bank Ltd 284.04 10.21ICICI Bank Ltd 218.31 7.85Kotak Mahindra Bank Ltd 177.08 6.36State Bank of India 148.04 5.32Bank of Baroda 147.26 5.29Punjab National Bank 139.43 5.01HDFC Ltd 213.37 7.67
Mahindra & Mahindra Ltd 39.75 1.43Tata Motors Ltd 30.41 1.09
Larsen & Toubro Ltd 104.94 3.77
ITC Ltd 129.03 4.64Hindustan Unilever Ltd 40.92 1.47
Tata Steel Ltd 34.95 1.26
Bharat Heavy Electricals Ltd 34.20 1.23
Reliance Industries Ltd 161.70 5.81Oil & Natural Gas Corporation Ltd 43.44 1.56
HCL Technologies Ltd 131.50 4.73Tata Consultancy Services Ltd 104.24 3.75
Bharti Airtel Ltd 60.38 2.17
Grand Total 2782.72 100.00
Name Market Value in Lac(`)
% of NAV
3 Month (Absolute)
6 Month (Absolute)
Last 1 Year (CAGR)
Last 2 Years (CAGR)
Since Inception (03-10-2008)
(CAGR) Min
era
lsM
inin
g
Co
nst
ructio
n
Cem
en
t a
nd
Ind
ust
ria
l
Tele
co
m
Au
tom
ob
ile
Fin
an
ce
-10.06%
-6.23% -7.45%
3.58%
9.73%9.11%
2.71%
-8.87%-7.26%
-10.88%0.39% 0.92% 1.42% 2.40% 2.57% 4.18% 4.39% 4.95% 6.11%
8.80% 11.88%
47.71%
Cem
en
t P
rod
ucts
Ma
nu
factu
rin
g
Ph
arm
a
Meta
ls
Co
nsu
mer
Go
od
s
Info
rma
tion
Tech
no
log
y
En
erg
y

IDFC Nifty Fund
FUND FEATURES
Nature: Equity
Fund Manager: Mr. Tridib Pathak
Investment objective: The investment objective of the scheme is to
replicate the S&P CNX Nifty Index by investing in securities of the S&P CNX
Nifty Index in the same proportion/weightage. However, there is no assurance
or guarantee that the objectives of the scheme will be realized and the
scheme does not assure or guarantee any returns.
Investment style: The Scheme will be managed passively with investments
in stocks in a proportion that it is as close as possible to the weightages of
these stocks in the S&P CNX Nifty Index. The investment strategy would
revolve around reducing the tracking error to the least possible through
rebalancing of the portfolio, taking into account the change in weights of
stocks in the index as well as the incremental collections/redemptions from
the Scheme.
Ideal investment horizon: 3 years or more
Entry load: Nil
Exit load: Nil (w.e.f Jul 25, 2011)
Options available: Growth, Dividend, Reinvestment facility is available
under the Dividend Option.
Minimum investment amount: ̀ `
Additional investment amount: ̀ 1
SIP (minimum amount): ̀ 500
Inception Date: 30 April 2010
500/- & in multiples of 1
(IDFC - NF) An Open Ended Index Linked Equity Scheme
NAV (`) :
Growth 9.6102
Dividend 9.6717
Face value (`/unit): 10Asset allocation (equity/debt/cash/derivatives):90.70% / 6.69% / 2.61%/ -Benchmark: S&P CNX Nifty Index
Fund PerformanceUnder The IDFC-NF-Growth
IDFC-NF Growth S&P CNX Nifty
30 August 2011
Portfolio :
SIP Returns
Period Investment Value Scheme BenchmarkReturn Return
Since Inception 16000 14483 -13.34 -14.89
1 year 12000 10644 -20.25 -22.13
Past performance may or may not be sustained in future.Benchmark: S&P CNX Nifty
Reliance Industries Ltd 107.40 7.98Infosys Ltd 91.98 6.83ITC Ltd 86.38 6.42ICICI Bank Ltd 81.85 6.08HDFC Ltd 70.04 5.20Larsen & Toubro Ltd 69.92 5.19HDFC Bank Ltd 68.56 5.09Tata Consultancy Services Ltd 43.00 3.19State Bank of India 41.25 3.06Bharti Airtel Ltd 39.73 2.95Oil & Natural Gas Corporation Ltd 28.82 2.14Mahindra & Mahindra Ltd 28.09 2.09Hindustan Unilever Ltd 26.86 2.00Tata Steel Ltd 25.22 1.87Bharat Heavy Electricals Ltd 22.67 1.68Axis Bank Ltd 22.44 1.67Tata Motors Ltd 21.13 1.57NTPC Ltd 17.70 1.31Bajaj Auto Ltd 17.23 1.28Jindal Steel & Power Ltd 16.46 1.22Hero Motocorp Ltd 15.84 1.18Hindalco Industries Ltd 15.77 1.17Dr. Reddy's Laboratories Ltd 15.27 1.13Sun Pharmaceutical Industries Ltd 15.05 1.12GAIL (India) Ltd 14.98 1.11Sterlite Industries Ltd 14.86 1.10Wipro Ltd 13.78 1.02Tata Power Co Ltd 13.72 1.02Kotak Mahindra Bank Ltd 12.73 0.95Maruti Suzuki India Ltd 11.71 0.87Cipla Ltd 11.57 0.86Power Grid Corporation Ltd 11.55 0.86Grasim Industries Ltd 11.17 0.83IDFC Ltd 10.46 0.78Punjab National Bank 10.05 0.75Cairn India Ltd 9.17 0.68Ambuja Cements Ltd 8.89 0.66Siemens Ltd 8.57 0.64HCL Technologies Ltd 8.10 0.60ACC Ltd 7.82 0.58Sesa Goa Ltd 7.34 0.55Bharat Petroleum Corporation Ltd 7.06 0.52Ranbaxy Laboratories Ltd 5.84 0.43DLF Ltd 5.80 0.43Jaiprakash Associates Ltd 5.69 0.42Steel Authority of India Ltd 5.14 0.38Reliance Infrastructure Ltd 4.93 0.37Reliance Communications Ltd 4.29 0.32Reliance Power Ltd 3.79 0.28Reliance Capital Ltd 3.52 0.26
Grand Total 1346.39 100.00Nifty Index 120.07 8.92
Nifty Stock Total 1221.20 90.70Call / Reverse Repo/ CBLO Total 90.02 6.69*Net Current Asset 35.18 2.61*
Equity Futures Total 120.07 8.92
Name Market Value in Lac(`)
% of NAV
Asset Allocation
*Cash or cash equivalents with residual maturity of less than 91 days may be treated as not creating any exposure
3 Month (Absolute)
6 Month (Absolute)
Last 1 Year (CAGR)
Since Inception (30-04-2010)
(CAGR)
Min
era
lsM
inin
g
Text
ile P
rod
ucts
Co
nst
ructio
n
Cem
en
t
Ga
s
Ind
ust
ria
l Ca
pita
lG
oo
ds
No
n F
err
ou
sM
eta
ls Oil
Tele
co
mS
erv
ices
Ph
arm
aceu
tica
ls
Ferr
ou
s M
eta
ls
Po
wer
Co
nst
ructio
nP
roje
ct
Fin
an
ce
Au
to
Co
nsu
mer
No
nD
ura
ble
s
Petr
ole
um
Pro
du
cts
So
ftw
are
Ba
nks
0.55% 0.83% 0.85% 1.11% 1.24% 2.27% 2.32% 2.82% 3.27% 3.48% 3.55% 3.84%5.19% 6.24% 6.98%
8.41% 8.50%
11.65%
17.59%
-2.94%
-6.67%
-4.68%
-8.70%
-3.96%
-7.45%-6.23%
-10.06%

FUND FEATURES
Nature: Equity
Fund Manager: Mr. Tridib Pathak
Investment objective: The investment objective of the scheme is to seek to
generate long term capital growth from a diversified portfolio of predominantly
equity and equity related instruments.However there is no assurance that the
investment objective of the scheme will be realized.
Investment style: The Scheme seeks to achieve outperformance through
sector rotation, theme selection, market cap bias and bottom up stock
picking.
Ideal investment horizon: 3 years or more
Entry load: Nil
Exit load: All investment including SIP/Micro SIP/STP/FOF if redeemed
/switched out within 365 days from the date of allotment - 1%. No Exit Loads /
CDSC will be chargeable in case of switches made between different options
of the Scheme. (w.e.f. September 01, 2009)
In case of Switches, Exit load shall be NIL for all switch transactions between
equity schemes of IDFC Mutual Fund . (w.e.f. October 12, 2009.)
Options available: Growth, Dividend. Reinvestment facility is available under
the Dividend Option.
Minimum investment amount: ̀ 5,000 & in multiples of ̀ 1
Additional investment amount: ̀ 1
SIP (minimum amount): ̀ 1,000
Inception Date: 9 August 2005
Statistical Measures:
Beta 0.86
R Square 0.95
Standard deviation 7.88%
(IDFC - CEF) An Open Ended Equity Fund
Last 3 Dividends (`/unit) :
Face value (`/unit): 10
Asset allocation (equity/debt/cash/derivatives ): 94.86% / 2.98% /
1.85% / 0.30%
Fund manager's comment:
Run as a well-diversified portfolio, the opportunity for the fund is to capture
the breadth of the market across sectors, market capitalizations, styles and
themes. The fund has around 35% exposure to midcaps and has maintained
higher diversification across sectors.
Fund PerformanceUnder The IDFC-CEF-Growth
Asset Allocation
Portfolio :
IDFC-CEF Growth BSE 200
30 August 2011
Mahindra & Mahindra Ltd 650.30 3.88TVS Motor Company Ltd 588.41 3.51Hero Motocorp Ltd 426.76 2.54
Jammu & Kashmir Bank Ltd 583.26 3.48Punjab National Bank 513.11 3.06ING Vysya Bank Ltd 430.06 2.56ICICI Bank Ltd 427.89 2.55ICICI Bank Ltd. (Futures) 163.62 0.98Bank of Baroda 250.34 1.49
Havells India Ltd 505.93 3.02Whirlpool of India Ltd 377.11 2.25Hitachi Home & Life Solutions (India) Ltd 198.00 1.18
Titan Industries Ltd 575.96 3.43ITC Ltd 388.00 2.31
VA Tech Wabag Ltd 299.11 1.78
Jindal Steel & Power Ltd 350.57 2.09
Bharat Heavy Electricals Ltd 515.83 3.07
Zee Entertainment Enterprises Ltd 615.35 3.67
COAL India Ltd 772.30 4.60
Manappuram Finance Ltd 594.02 3.54
Hindustan Zinc Ltd 543.35 3.24
Oil & Natural Gas Corporation Ltd 679.31 4.05Oil India Ltd 597.60 3.56
Castrol India Ltd 582.07 3.47Hindustan Petroleum Corporation Ltd 410.80 2.45Hindustan Petroleum Corporation Ltd (Futures) 101.11 0.60Reliance Industries Ltd 259.82 1.55Reliance Industries Ltd - Futures 172.52 1.03
Torrent Pharmaceuticals Ltd 510.78 3.04Cipla Ltd 322.81 1.92
Infosys Ltd 606.82 3.62HCL Technologies Ltd 285.67 1.70KPIT Cummins Infosystem Ltd 258.24 1.54Educomp Solutions Ltd 249.58 1.49Tata Consultancy Services Ltd 205.03 1.22Everonn Education Ltd 181.89 1.08
Bharti Airtel Ltd 728.37 4.34
Grasim Industries Ltd 349.61 2.08
Grand Total 16780.05 100.00
Auto Total 1665.48 9.93
Banks Total 2368.28 14.11
Consumer Durables Total 1081.04 6.44
Consumer Non Durables Total 963.96 5.74
Engineering Services Total 299.11 1.78
Ferrous Metals Total 350.57 2.09
Industrial Capital Goods Total 515.83 3.07
Media & Entertainment Total 615.35 3.67
Minerals/Mining Total 772.30 4.60
Miscellaneous Total 594.02 3.54
Non - Ferrous Metals Total 543.35 3.24
Oil Total 1276.91 7.61
Petroleum Products Total 1526.32 9.10
Pharmaceuticals Total 833.59 4.97
Software Total 1787.23 10.65
Telecom - Services Total 728.37 4.34
Textile Products Total 349.61 2.08Other Equity Total 84.20 0.50Derivative Total 50.90 0.30Call / Reverse Repo/ CBLO Total 373.65 2.23*
Name Market Value in Lac(`)
% of NAVDate Plan Dividend NAV
25 Feb 11 Plan B 2.00 10.3406
25 Feb 11 Plan A 2.00 11.9167
22 Oct 07 Plan A 1.50 15.2703
28 May 07 Plan A 1.50 13.2659
22 Aug 06 - 1.50 11.5580
NAV (`) :
Plan A Growth 18.2319
Plan A Dividend 11.2972
Plan B Growth 14.4934
Plan B Dividend 9.8072
SIP Returns
Period Investment Value Scheme BenchmarkReturn Return
Since Inception 72000 81351 4.02 6.75
5 years 60000 63257 2.09 4.88
3 years 36000 38245 3.97 8.26
2 years 24000 21676 -9.48 -7.69
1 year 12000 10374 -24.10 -22.98
*Cash or cash equivalents with residual maturity of less than 91 days may be treated as not creating any exposure
Past performance may or may not be sustained in future.Benchmark: BSE 200
3 Month (Absolute)
6 Month (Absolute)
Last 1 Year (CAGR)
Last 2 Years (CAGR)
Last 3 Years (CAGR)
Last 5 Years (CAGR)
Since Inception (09-08-2005)
(CAGR)
IDFC Classic Equity Fund
Ind
ust
ria
lP
rod
ucts
Ferr
ou
s M
eta
ls
En
gin
eerin
gS
erv
ices
Text
ile P
rod
ucts
Ind
ust
ria
l Ca
pita
lG
oo
ds
No
n F
err
ou
sM
eta
ls
Min
era
lsM
inin
g &M
ed
iaE
nte
rta
inm
en
t
Mis
cella
neo
us
Tele
co
mS
erv
ices
Oil
Au
to
Petr
ole
um
Pro
du
cts
Co
nsu
mer
No
nD
ura
ble
s
Ph
arm
aceu
tica
ls
Co
nsu
mer
Du
rab
les
Ba
nks
So
ftw
are
0.50%1.78% 2.08% 2.09%
3.07% 3.24% 3.54% 3.67% 4.34% 4.60% 4.97%5.74%
6.44%7.61%
9.10%9.93%
10.65%
14.11%
10.42%
-10.04%
-5.94%
-14.87%
0.94%2.65%
6.74%
12.91%
-10.45%
-5.71%
-10.53%
3.33%4.96%
8.06%

IDF
C T
ax
Ad
van
tag
e (
ELS
S)
Fu
nd
FUND FEATURES
Nature: Equity
Fund Manager: Mr. Neelotpal Sahai. (w.e.f. 22 Sep, 2010)
Investment objective: The investment objective of the
Scheme is to seek to generate long term capital growth from a
diversified portfolio of predominantly equity and equity related
securities.
There can be no assurance that the investment objective of the
scheme will be realized.
Investment style: The Scheme will invest in well-managed
growth companies that are available at reasonable value.
Companies would be identified through a systematic process of
forecasting earnings based on a deep understanding of the
industry growth potential and interaction with company
management.
Entry load: Nil
Exit load: Nil (w.e.f. September 04, 2009)
Options available: Growth, Dividend. Reinvestment facility is
available under the Dividend Option.
Minimum investment amount: ̀ 500
Additional investment amount: ̀ 500
SIP (minimum amount): ̀ 500
Inception Date: 26 December 2008
Statistical Measures:
Beta 0.75
R Square 0.90
Standard deviation 6.47%
(IDFC - TA (ELSS)Fund) An Open Ended Equity Linked Saving Scheme with Lock in Period of 3 Years
Last 3 Dividends (`/unit) :
Date Plan Dividend NAV
23 Mar 11 - 1.00 11.6497
04 Feb 11 - 2.50 12.7651
23 Mar 10 - 1.00 14.3869
NAV (`) :
Plan NAV
Growth 17.8279
Dividend 10.9950
Face value (`/unit): 10Asset allocation (equity/debt/cash/derivatives): 94.74% / 4.01% / 1.24% / -Fund manager's comment:The focus is to invest in long term growth stocks at reasonable price. The portfolio is an diverse mix of companies across sectors and is agnostic to capitalization bias. Given the plethora of opportunities which is there in domestic economy, the fund seeks to invest in companies with strong track record of execution, high operating leverage and reasonable valuations.
Fund PerformanceUnder The IDFC TA (ELSS)-Growth
Asset Allocation
Portfolio :
IDFC-TA (ELSS) Growth BSE 200
30 August 2011
Apollo Tyres Ltd 147.88 1.19
ICICI Bank Ltd 698.60 5.60Bank of Baroda 589.04 4.72State Bank of India 493.45 3.96Axis Bank Ltd 160.91 1.29United Bank of India 152.40 1.22Punjab National Bank 139.43 1.12
India Cements Ltd 335.00 2.69
IRB Infrastructure Developers Ltd 220.13 1.77
Larsen & Toubro Ltd 241.34 1.94
Shree Renuka Sugars Ltd 231.20 1.85Asian Paints Ltd 197.16 1.58
Jindal Steel & Power Ltd 520.90 4.18
Coromandel International Ltd 154.63 1.24
Power Finance Corporation Ltd 436.65 3.50Muthoot Finance Ltd 214.98 1.72
GAIL (India) Ltd 307.95 2.47
EROS International Media Ltd 483.30 3.88
Oil & Natural Gas Corporation Ltd 394.95 3.17
Reliance Industries Ltd 665.21 5.34
Lupin Ltd 448.75 3.60Cadila Healthcare Ltd 401.40 3.22
NTPC Ltd 169.30 1.36PTC India Ltd 158.74 1.27
Tata Consultancy Services Ltd 625.44 5.02HCL Technologies Ltd 513.69 4.12Infosys Ltd 468.59 3.76
Bharti Airtel Ltd 505.81 4.06IDEA Cellular Ltd 249.88 2.00
Arvind Ltd 471.30 3.78KPR Mills Ltd 148.35 1.19
Vardhman Textiles Ltd 382.10 3.06
Cox And Kings Ltd 200.75 1.61
Grand Total 12468.50 100.00
Auto Ancillaries Total 147.88 1.19
Banks Total 2233.84 17.92
Cement Total 335.00 2.69
Construction Total 220.13 1.77
Construction Project Total 241.34 1.94
Consumer Non Durables Total 428.36 3.44
Ferrous Metals Total 520.90 4.18
Fertilisers Total 154.63 1.24
Finance Total 651.63 5.23
Gas Total 307.95 2.47
Media & Entertainment Total 483.30 3.88
Oil Total 394.95 3.17
Petroleum Products Total 665.21 5.34
Pharmaceuticals Total 850.15 6.82
Power Total 328.04 2.63
Software Total 1607.72 12.89
Telecom - Services Total 755.69 6.06
Textile Products Total 619.65 4.97
Textiles - Cotton Total 382.10 3.06
Transportation Total 200.75 1.61Other Equity Total 284.06 2.28Call / Reverse Repo/ CBLO Total 500.11 4.01Net Current Asset 155.13 1.24
Name Market Value in Lac(`)
% of NAV
SIP Returns
Period Investment Value Scheme BenchmarkReturn Return
Since Inception 16000 17856 8.18 5.71
2 years 12000 11599 -3.24 -7.69
1 year 6000 5339 -19.77 -22.98
Past performance may or may not be sustained in future.Benchmark: BSE 200
3 Month (Absolute)
6 Month (Absolute)
Last 1 Year (CAGR)
Last 2 Years (CAGR)
Since Inception (26-12-2008)
(CAGR)
Fert
ilise
rs
Po
wer
Au
to A
ncill
aries
Co
nst
ructio
nP
roje
ct
Co
nst
ructio
n
Tra
nsp
ort
atio
n
Cem
en
t
Oil
Text
iles
Co
tto
n
Ferr
ou
s M
eta
ls
Co
nsu
mer
No
nD
ura
ble
s &M
ed
iaE
nte
rta
inm
en
t
Petr
ole
um
Pro
du
cts
Text
ile P
rod
ucts
Tele
co
mS
erv
ices
Ph
arm
aceu
tica
ls
Fin
an
ce
Ba
nks
So
ftw
are
Co
nsu
mer
Du
rab
les
Ga
s
-3.63%
-8.03%
9.43%
-10.45%-5.71%
-10.53%
25.76%
-8.14%
24.11%
3.33%
0.63% 1.19% 1.24% 1.77% 1.94% 2.41% 2.47% 2.63%2.69% 3.06% 3.17% 3.88% 4.18% 4.29% 4.97% 5.23% 5.34% 6.06% 6.82%
12.89%
17.92%

IDFC Arbitrage Fund
FUND FEATURES
Nature: Equity & Equity Derivatives
Fund Manager: Mr. Kenneth Andrade & Mr. Suyash Choudhary (w.e.f. 25
March 2011)
Investment objective: The investment objective of the Scheme is to
generate capital appreciation and income by predominantly investing in
arbitrage opportunity in the cash and the derivative segments of the equity
markets and the arbitrage opportunity available within the derivative
segments and by investing the balance in debt and money market
instruments. However there is no assurance that the investment objective of
the scheme will be realized.
Investment style: The Scheme seeks to capture the “Cost of Carry” by
executing simultaneous buy (in the cash market) and sell (In the futures)
trades. The amount not so invested is invested in FDs and money market
instruments.
Ideal investment horizon: 1 year or more
Entry load: Nil
Exit load: 0.25% if redemption / switch is requested within 30 days from the
date of purchase, during ongoing period. (w.e.f. August 24, 2009)
In case of Switches, Exit load shall be NIL for all switch transactions between
equity schemes of IDFC Mutual Fund . (w.e.f. October 12, 2009.)
Options available: Growth, Dividend & Dividend Sweep (w.e.f. 16-Nov-
2009)
Minimum investment amount: Plan A: ̀ 5,000, Plan B: ̀ 25,00,000
(w.e.f. July 6, 2009)
Additional investment amount: ̀ 1
SIP (minimum amount): NA
Inception Date: 21 December 2006
Statistical Measures:
Standard deviation 0.30%
Dividend frequency: Monthly, subject to availability of distributable
surplus
(IDFC - AF) An Open Ended Equity Fund
Last 3 Dividends (`/unit) :
Date Plan Dividend NAV
Plan A 0.02 10.3285
11-Feb-10 Plan A 0.02 10.3249
10-Mar-10 Plan A 0.01 10.3287
11-May-10 Plan B 0.01 10.5498
21-Jun-10 Plan B 0.01 10.5834
12-Jul-10 Plan B 0.01 10.5929
12-Jan-10
NAV (`) :
Plan Option NAV
Plan A Growth 13.4847
Plan A Dividend 11.4118
Plan B Growth 13.8049
Plan B Dividend 11.6334
Face value (`/unit): 10Asset allocation (equity/debt/cash/derivatives): 68.50% / 32.68% / -1.18% / -
Fund PerformanceUnder The IDFC-AF-Growth
Portfolio :
Hexaware Technologies Ltd 179.83 2.94 -180.19
Apollo Tyres Ltd 156.16 2.55 -156.68
Balrampur Chini Mills Ltd 150.14 2.45 -150.70
Bharat Petroleum Corporation Ltd 145.04 2.37 -142.38
Cairn India Ltd 150.69 2.46 -150.82
Canara Bank 14.94 0.24 -14.94
Cipla Ltd 123.51 2.02 -123.93
Development Credit Bank Ltd 89.38 1.46 -89.47
Dena Bank 35.99 0.59 -36.01
Kingfisher Airlines Ltd 26.57 0.43 -26.73
GAIL (India) Ltd 96.49 1.58 -96.96
HCL Technologies Ltd 207.53 3.39 -207.81
Hindalco Industries Ltd 164.15 2.68 -162.96
Hindustan Petroleum Corporation Ltd 145.65 2.38 -140.83
ICICI Bank Ltd 157.19 2.57 -157.08
Oracle Financial Serv Software Ltd 36.32 0.59 -36.56
Indusind Bank Ltd 106.04 1.73 -106.36
Infosys Ltd 164.01 2.68 -164.18
ITC Ltd 156.00 2.55 -156.39
Jindal Steel & Power Ltd 195.34 3.19 -194.91
Jsw Steel Ltd 94.95 1.55 -95.35
Lanco Infratech Ltd 106.39 1.74 -107.33
Orchid Chemicals & Pharmaceuticals Ltd 67.34 1.10 -67.57
Pantaloon Retail (India) Ltd 271.35 4.43 -272.04
Power Finance Corporation Ltd 149.92 2.45 -148.78
Petronet Lng Ltd 149.94 2.45 -150.46
PTC India Ltd 87.48 1.43 -86.43
Reliance Industries Ltd 162.39 2.65 -162.72
TVS Motor Company Ltd 48.62 0.79 -48.84
Sterlite Industries Ltd 167.25 2.73 -168.16
Shree Renuka Sugars Ltd 39.30 0.64 -39.44
UCO Bank 45.71 0.75 -45.84
Axis Bank Ltd 144.82 2.37 -144.83
Yes Bank Ltd 155.43 2.54 -156.18
Grand Total 6119.84 100.00
Equities Total 4191.84 68.50
Mutual Fund Units: Debt Total 850.21 13.89
Margin Fixed Deposit Total 1000.00 16.34
CBLO 150.03 2.45
Net Current Asset -72.24 -1.18
Name Market Value % of NAV Value of in Lac(`) Futures
IDFC-AF Growth Crisil Liquid Fund Index
30 August 2011
Past performance may or may not be sustained in future.Benchmark: Crisil Liquid Fund Index
3 Month (Absolute)
6 Month (Absolute)
Last 1 Year (CAGR)
Last 2 Years (CAGR)
Last 3 Years (CAGR)
Since Inception (21-12-2006)
(CAGR)
1.90%
3.83%
8.19%
5.94% 5.74%6.58%
1.94%
3.95%
7.58%
5.67%6.23%
6.70%
FUND FEATURES
Nature: Equity Derivatives
Fund Manager: Mr. Kenneth Andrade & Mr. Suyash Choudhary (w.e.f. 25
March 2011)
Investment objective: The investment objective of the scheme is to
generate income (absolute to low volatility returns) by taking advantage of
opportunities in the cash and the derivative segments of the equity markets
including the arbitrage opportunities available within the derivative segment,
by using other derivative based strategies and by investing the balance in
debt and money market instruments. However there is no assurance that the
investment objective of the scheme will be realized.
Investment style: The fund aimed to generate absolute returns by investing
in trades in the equity and derivative markets. The trades can consist of cash-
futures arbitrage as well as relative value (such as pair trades and corporate
event- based strategies) and derivatives strategies.
Ideal investment horizon: 1 year or more
Entry load: Nil
Exit load: 0.50% of NAV on investors who purchase/switch in and seek to
redeem/switch out such units within 365 days such from the date of effecting
such purchase/switch in. (w.e.f. August 24, 2009)
In case of Switches, Exit load shall be NIL for all switch transactions between
equity schemes of IDFC Mutual Fund. (w.e.f. October 12, 2009.)
Options available: Growth, Dividend & Dividend Sweep (w.e.f. 16-Nov-
2009)
Minimum investment amount: Plan A: `5,000, Plan B: `25,00,000 (w.e.f.
July 6, 2009)
Additional investment amount: ̀ 1
SIP (minimum amount): NA
Inception Date: 09 June 2008
Statistical Measures:
Standard deviation 0.54%
Dividend frequency: Monthly, subject to availability of distributable
surplus
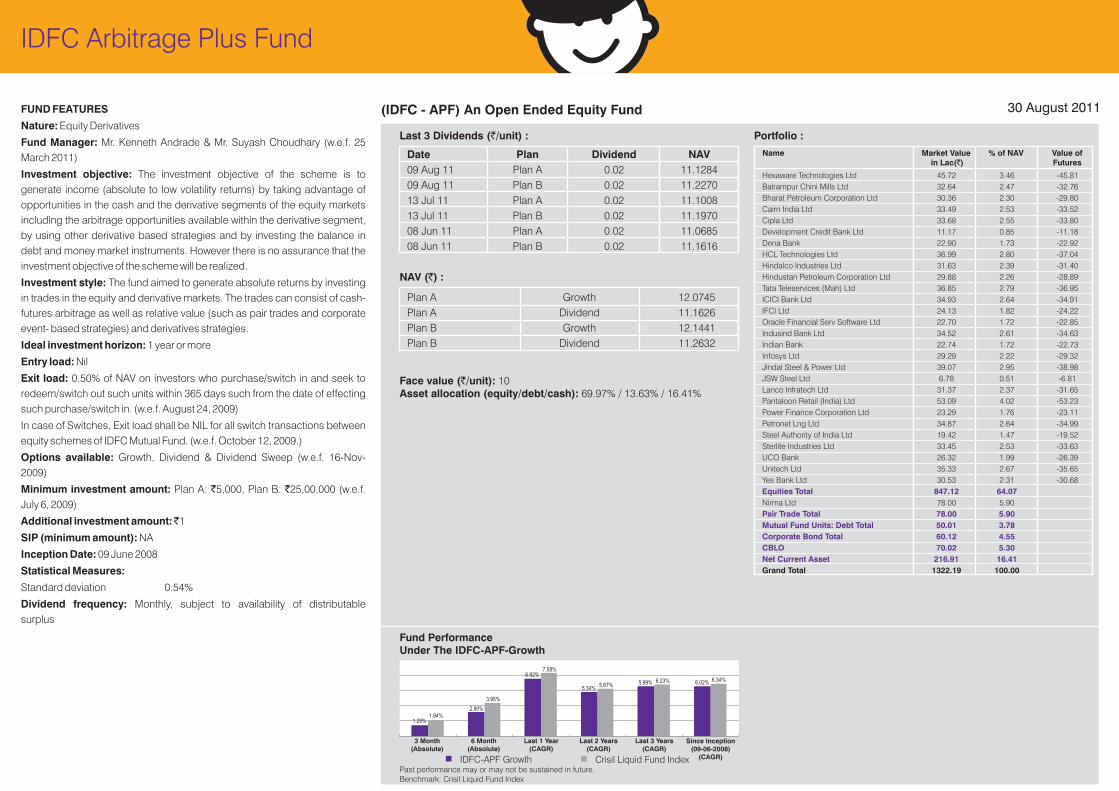
(IDFC - APF) An Open Ended Equity Fund
Last 3 Dividends (`/unit) :
Date Plan Dividend NAV
09 Aug 11 Plan A 0.02 11.1284
09 Aug 11 Plan B 0.02 11.2270
13 Jul 11 Plan A 0.02 11.1008
13 Jul 11 Plan B 0.02 11.1970
08 Jun 11 Plan A 0.02 11.0685
08 Jun 11 Plan B 0.02 11.1616
Face value (`/unit): 10Asset allocation (equity/debt/cash): 69.97% / 13.63% / 16.41%
Fund PerformanceUnder The IDFC-APF-Growth
Portfolio :
Hexaware Technologies Ltd 45.72 3.46 -45.81
Balrampur Chini Mills Ltd 32.64 2.47 -32.76
Bharat Petroleum Corporation Ltd 30.36 2.30 -29.80
Cairn India Ltd 33.49 2.53 -33.52
Cipla Ltd 33.68 2.55 -33.80
Development Credit Bank Ltd 11.17 0.85 -11.18
Dena Bank 22.90 1.73 -22.92
HCL Technologies Ltd 36.99 2.80 -37.04
Hindalco Industries Ltd 31.63 2.39 -31.40
Hindustan Petroleum Corporation Ltd 29.88 2.26 -28.89
Tata Teleservices (Mah) Ltd 36.85 2.79 -36.95
ICICI Bank Ltd 34.93 2.64 -34.91
IFCI Ltd 24.13 1.82 -24.22
Oracle Financial Serv Software Ltd 22.70 1.72 -22.85
Indusind Bank Ltd 34.52 2.61 -34.63
Indian Bank 22.74 1.72 -22.73
Infosys Ltd 29.29 2.22 -29.32
Jindal Steel & Power Ltd 39.07 2.95 -38.98
JSW Steel Ltd 6.78 0.51 -6.81
Lanco Infratech Ltd 31.37 2.37 -31.65
Pantaloon Retail (India) Ltd 53.09 4.02 -53.23
Power Finance Corporation Ltd 23.29 1.76 -23.11
Petronet Lng Ltd 34.87 2.64 -34.99
Steel Authority of India Ltd 19.42 1.47 -19.52
Sterlite Industries Ltd 33.45 2.53 -33.63
UCO Bank 26.32 1.99 -26.39
Unitech Ltd 35.33 2.67 -35.65
Yes Bank Ltd 30.53 2.31 -30.68
Nirma Ltd 78.00 5.90
Grand Total 1322.19 100.00
Equities Total 847.12 64.07
Pair Trade Total 78.00 5.90
Mutual Fund Units: Debt Total 50.01 3.78
Corporate Bond Total 60.12 4.55
CBLO 70.02 5.30
Net Current Asset 216.91 16.41
Name Market Value % of NAV Value of in Lac(`) Futures
IDFC-APF Growth Crisil Liquid Fund Index
30 August 2011
NAV (`) :
Plan A Growth 12.0745
Plan A Dividend 11.1626
Plan B Growth 12.1441
Plan B Dividend 11.2632
Past performance may or may not be sustained in future.Benchmark: Crisil Liquid Fund Index
3 Month (Absolute)
6 Month (Absolute)
Last 1 Year (CAGR)
Last 2 Years (CAGR)
Last 3 Years (CAGR)
Since Inception (09-06-2008)
(CAGR)
IDFC Arbitrage Plus Fund
1.29%
2.90%
6.92%
5.34%5.99% 6.02%
1.94%
3.95%
7.58%
5.67%6.23% 6.34%

FUND FEATURES
Nature: Fund of Fund
Fund Manager: Mr. Kenneth Andrade & Mr. Suyash Choudhary (w.e.f. 23
Dec 2010)
Investment objective: The primary objective of Scheme is to generate
capital appreciation through investment in different Mutual Funds schemes
primarily local funds based on a defined asset allocation model. However,
there can be no assurance that the investment objective of the scheme will be
realized.
Investment style: IDFC Asset Allocation (AA) Fund aims to generate capital
appreciation through investments in different mutual fund schemes based on
a defined asset allocation model. The fund offers 3 different plans with
different asset allocations linked to the targeted risk profiles for investors.
Conservative plan offers the lowest risk profile followed by Moderate plan.
Aggressive plan offers the highest risk profile amongst the 3 plans.
Asset allocation allows investors to improve their risk adjusted returns as
different asset classes such as equity, fixed income and commodities offer
lower correlations with each other. The scheme will be a Fund of Fund scheme
that can invest in a mix of ETFs, domestic and offshore Mutual Fund schemes.
FoFs give fund manager the flexibility of tailoring portfolios by participating in
funds with different styles within each asset class and to easily switch styles
depending on the view of the markets.
Ideal investment horizon: 1 year or more
Entry load: Nil
Exit load: IDFC-AAF -AP (for all plans) : 1.50% of the NAV shall be applicable
if investor who redeem/switch out such investment within 18 months from the
date of subscription applying First in First out basis, (including investments
through SIP/STP). Switches between plans (within the scheme) shall not
attract load.
The exit load/CDSC of up to 1% of the redemption value charged to the unit
holder by the Fund on redemption of units shall be retained by each of the
schemes in a separate account and will be utilized for payment of
commissions to the ARN Holder and to meet other marketing and selling
expenses. Any amount in excess of 1% of the redemption value charged to
the unit holder as exit load/ CDSC shall be credited to the respective scheme
immediately
Options available: Growth, Dividend (payout & reinvestment)
Minimum investment amount: Purchase (non SIP) `5,000/- & in multiples
of `1/- for purchases and in multiples of `0.01 for switches. Additional
ongoing purchase (Non SIP) – ̀ 1,000/- and in multiples of ̀ 1/- thereafter SIP
purchase - ̀ 1,000/- (subject to minimum of 6 installments of ̀ 1,000/- each).
Additional investment amount: ̀ 1
SIP (minimum amount):`1,000
Inception Date: 11 February 2010
Dividend frequency: Such other frequency as decided from time to time.
(IDFC-AAF-AP) An Open Ended Fund of Funds Scheme
Last 3 Dividends (`/unit) :
NAV (`) :
Plan NAV
Dividend 11.0271
Growth 11.3385
Face value (`/unit): 10
Other Parameter:
Average Maturity (for Debt scheme): 1.39 Years
Benchmark: Crisil Balanced Fund Index
Modified duration (for Debt scheme): 1.33 Years
Fund PerformanceUnder The IDFC-AAF-AP-Growth
Asset Allocation
Portfolio :
IDFC-AAF-AP- Growth Crisil Balanced Fund Index
30 August 2011
Date Other I & H
09 Aug 11 11.0566 0.0453 0.0529
15 Apr 11 11.0829 0.0493 0.0529
06 Dec 10 11.1770 0.0491 0.0527
NAV
Past performance may or may not be sustained in future.
Clearing Corporation of India Ltd 1.62
Gold Benchmark ETF (Gold Bees) 10.62
IDFC Small & Midcap Equity (SME) Fund 27.35
IDFC Imperial Equity Fund 21.90
IDFC Super Saver Income Fund - Investment Plan 28.17
IDFC Money Manager Fund - Treasury Plan 10.43
IDFC Money Manager Fund - Investment Plan 1.88
Grand Total 100.00
CBLO Total 1.62
Gold Total 10.62
Equity Total 49.26
Debt Total 40.49
Net Current Asset -1.98
Name Rating % of NAV
CAGR Last 1 Year CAGR Since Allotment 11/02/2010
1 Mutual Fund Units - Equity 49.26%
2 Mutual Fund Units - Debt 40.49%
3 Exchange Traded Funds 10.62%
4 CBLO 1.62%
5 Net Current Asset -1.98%
12
34 5
IDFC Asset Allocation Fund – Aggressive Plan
3.51%
8.45%
-2.61%
3.86%

IDF
C A
sset
Allo
ca
tion
Fu
nd
– M
od
era
te P
lan
FUND FEATURES
Nature: Fund of Fund
Fund Manager: Mr. Kenneth Andrade & Mr. Suyash Choudhary
(w.e.f. 23 Dec 2010)
Investment objective: The primary objective of Scheme is to
generate capital appreciation through investment in different
Mutual Funds schemes primarily local funds based on a defined
asset allocation model. However, there can be no assurance
that the investment objective of the scheme will be realized.
Investment style: IDFC Asset Allocation Fund aims to
generate capital appreciation through investments in different
mutual fund schemes based on a defined asset allocation
model. The fund offers 3 different plans with different asset
allocations linked to the targeted risk profiles for investors.
Conservative plan offers the lowest risk profile followed by
Moderate plan. Aggressive plan offers the highest risk profile
amongst the 3 plans.
Asset allocation allows investors to improve their risk adjusted
returns as different asset classes such as equity, fixed income
and commodities offer lower correlations with each other. The
scheme will be a Fund of Fund scheme that can invest in a mix of
ETFs, domestic and offshore Mutual Fund schemes. FoFs give
fund manager the flexibility of tailoring portfolios by participating
in funds with different styles within each asset class and to easily
switch styles depending on the view of the markets.
Ideal investment horizon: 1 year or more
Entry load: Nil
Exit load: IDFC-AAF -MP (for all plans): 1.50% of the NAV shall
be applicable if investor who redeem/switch out such
investment within 18 months from the date of subscription
applying First in First out basis, (including investment s through
SIP/STP).
Switches between plans (within the scheme) shall not attract
load.
The exit load/ CDSC of up to 1% of the redemption value
charged to the unit holder by the Fund on redemption of units
shall be retained by each of the schemes in a separate account
and will be utilized for payment of commissions to the ARN
Holder and to meet other marketing and selling expenses. Any
amount in excess of 1% of the redemption value charged to the
unit holder as exit load/ CDSC shall be credited to the respective
scheme immediately
Options available: Growth, Dividend (payout & reinvestment)
Minimum investment amount: Purchase (non SIP) ̀ 5,000/- &
in multiples of `1/- for purchases and in multiples of `0.01 for
switches. Additional ongoing purchase (Non SIP) – `1,000/-
and in multiples of `1/- thereafter SIP purchase - `1,000/-
(subject to minimum of 6 installments of ̀ 1,000/- each).
Additional investment amount: ̀ 1
SIP (minimum amount): ̀ 1,000
Inception Date: 11 February 2010
Dividend frequency: Such other frequency as decided from
time to time
(IDFC-AAF-MP) An Open Ended Fund of Funds Scheme
Last 3 Dividends (`/unit) :
NAV (`) :
Plan NAV
Growth 11.2285
Dividend 11.0208
Face value (`/unit): 10
Other Parameter:
Average Maturity (for Debt scheme): 2.27 Years
Benchmark: Crisil MIP Blended Index
Modified duration (for Debt scheme): 2.16 Years
Fund PerformanceUnder The IDFC-AAF-MP-Growth
Asset Allocation
Portfolio :
IDFC-AAF-MP-Growth Crisil MIP Blended Index
30 August 2011
Date Other I & H
13 Jul 11 11.0263 0.0302 0.0352
15 Apr 11 10.9071 0.0329 0.0352
06 Dec 10 10.7844 0.0327 0.0351
NAV
Clearing Corporation of India Ltd 0.29
Gold Benchmark ETF (Gold Bees) 5.11
IDFC Small & Midcap Equity (SME) Fund 14.05IDFC Imperial Equity Fund 11.51
IDFC Super Saver Income Fund - Investment Plan 44.66IDFC Money Manager Fund - Treasury Plan 15.67IDFC Money Manager Fund - Investment Plan 9.35
Grand Total 100.00
CBLO Total 0.29
Gold Total 5.11
Equity Total 25.57
Debt Total 69.68Net Current Asset -0.65
Name Rating % of NAV
Past performance may or may not be sustained in future.
CAGR Last 1 Year CAGR Since Allotment 11/02/2010
1 Mutual Fund Units - Debt 69.68%
2 Mutual Fund Units - Equity 25.57%
3 Exchange Traded Funds 5.11%
4 CBLO 0.29%
5 Net Current Asset -0.65%
1
2
3 45
5.50%
7.77%
3.98%
5.42%

IDFC Asset Allocation Fund – Conservative Plan
FUND FEATURES
Nature: Fund of Fund
Fund Manager: Mr. Kenneth Andrade & Mr. Suyash Choudhary (w.e.f. 23
Dec 2010)
Investment objective: The primary objective of Scheme is to generate
capital appreciation through investment in different Mutual Funds schemes
primarily local funds based on a defined asset allocation model. However,
there can be no assurance that the investment objective of the scheme will be
realized.
Investment style: IDFC Asset Allocation (AA) Fund aims to generate capital
appreciation through investments in different mutual fund schemes based on
a defined asset allocation model. The fund offers 3 different plans with
different asset allocations linked to the targeted risk profiles for investors.
Conservative plan offers the lowest risk profile followed by Moderate plan.
Aggressive plan offers the highest risk profile amongst the 3 plans.
Asset allocation allows investors to improve their risk adjusted returns as
different asset classes such as equity, fixed income and commodities offer
lower correlations with each other. The scheme will be a Fund of Fund scheme
that can invest in a mix of ETFs, domestic and offshore Mutual Fund schemes.
FoFs give fund manager the flexibility of tailoring portfolios by participating in
funds with different styles within each asset class and to easily switch styles
depending on the view of the markets.
Ideal investment horizon: 1 year or more
Entry load: Nil
Exit load IDFC-AAF-CP (for all plans):1.50% of the NAV shall be applicable
if investor who redeem/ switch out such investment within 18 months from the
date of subscription applying First in First out basis, (including investment s
through SIP/STP). Switches between plans (within the scheme) shall not
attract load. The exit load/ CDSC of up to 1% of the redemption value charged
to the unit holder by the Fund on redemption of units shall be retained by each
of the schemes in a separate account and will be utilized for payment of
commissions to the ARN Holder and to meet other marketing and selling
expenses. Any amount in excess of 1% of the redemption value charged to
the unit holder as exit load/ CDSC shall be credited to the respective scheme
immediately
Options available: Growth, Dividend (payout & reinvestment)
Minimum investment amount: Purchase (non SIP) ` 5,000/- & in multiples
of `1/- for purchases and in multiples of `0.01 for switches. Additional
ongoing purchase (Non SIP) – ̀ 1,000/- and in multiples of ̀ 1/- thereafter SIP
purchase - ̀ 1,000/- (subject to minimum of 6 installments of ̀ 1,000/- each).
Additional investment amount: ̀ 1
SIP (minimum amount): ̀ 1,000
Inception Date: 11 February 2010
Dividend frequency: Such other frequency as decided from time to time
(IDFC-AAF-CP) An Open Ended Fund of Funds Scheme
NAV (`) :
Plan NAV
Dividend 10.5505
Growth 10.8589
Face value (`/unit): 10
Other Parameter:
Average Maturity (for Debt scheme): 2.20 Years
Benchmark: Crisil MIP Blended Index
Modified duration (for Debt scheme): 2.09 Years
Fund PerformanceUnder The IDFC-AAF-CP-Growth
Asset Allocation
Portfolio :
IDFC-AAF-CP Growth Crisil MIP Blended Index
30 August 2011
Last 3 Dividends (`/unit) :
Date Other I & H
09 Aug 11 10.5479 0.0151 0.0176
13 Jul 11 10.5855 0.0151 0.0176
08 Jun 11 10.4750 0.0151 0.0176
NAV
IDFC Small & Midcap Equity (SME) Fund 8.38IDFC Imperial Equity Fund-Plan 6.81
IDFC Super Saver Income Fund - Investment Plan 43.04IDFC Cash Fund 40.15
Grand Total 100.00
Equity Total 15.20
Debt Total 83.19Net Current Asset 1.61
Name Rating % of NAV
CAGR Last 1 Year CAGR Since Allotment 11/02/2010
1 Mutual Fund Units - Debt 83.19%
2 Mutual Fund Units - Equity 15.20%
3 Net Current Asset 1.61%
1
23
Past performance may or may not be sustained in future.
5.47%4.69%
5.42%
3.98%
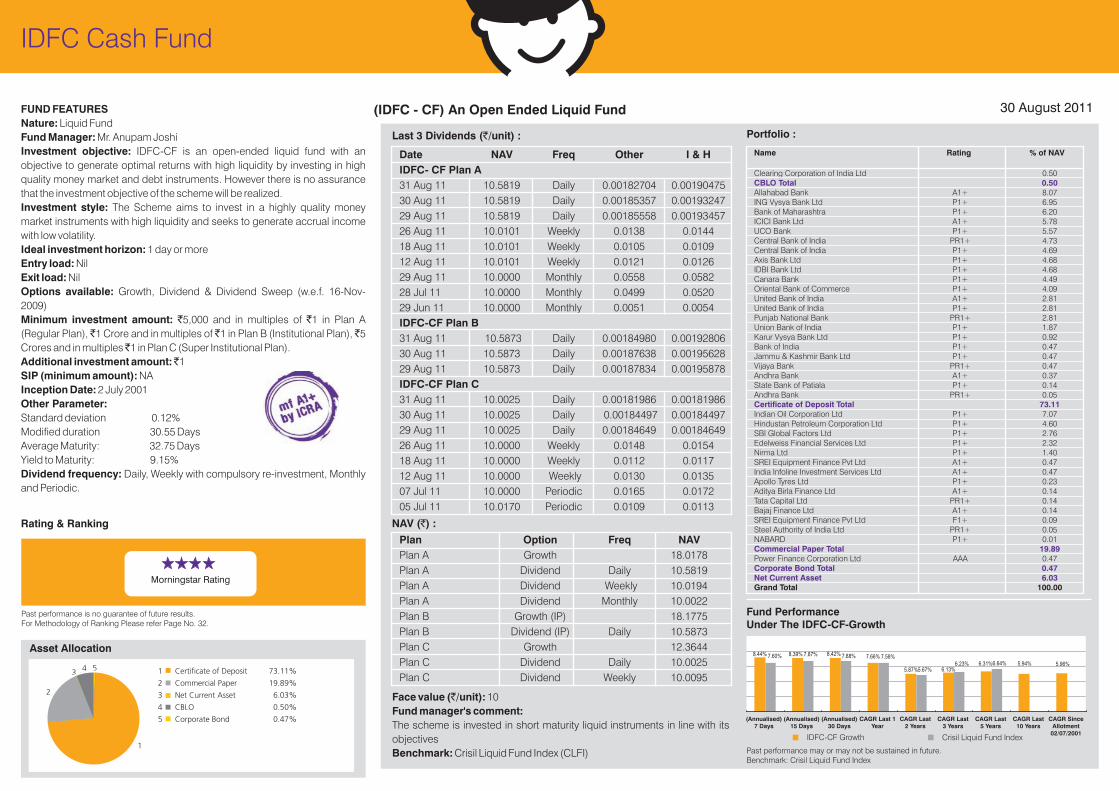
IDFC Cash Fund
FUND FEATURES
Nature: Liquid Fund
Fund Manager: Mr. Anupam Joshi
Investment objective: IDFC-CF is an open-ended liquid fund with an
objective to generate optimal returns with high liquidity by investing in high
quality money market and debt instruments. However there is no assurance
that the investment objective of the scheme will be realized.
Investment style: The Scheme aims to invest in a highly quality money
market instruments with high liquidity and seeks to generate accrual income
with low volatility.
Ideal investment horizon: 1 day or more
Entry load: Nil
Exit load: Nil
Options available: Growth, Dividend & Dividend Sweep (w.e.f. 16-Nov-
2009)
Minimum investment amount: `5,000 and in multiples of `1 in Plan A
(Regular Plan), ̀ 1 Crore and in multiples of ̀ 1 in Plan B (Institutional Plan), ̀ 5
Crores and in multiples ̀ 1 in Plan C (Super Institutional Plan).
Additional investment amount: ̀ 1
SIP (minimum amount): NA
Inception Date: 2 July 2001
Other Parameter:
Standard deviation 0.12%
Modified duration 30.55 Days
Average Maturity: 32.75 Days
Yield to Maturity: 9.15%
Dividend frequency: Daily, Weekly with compulsory re-investment, Monthly
and Periodic.
(IDFC - CF) An Open Ended Liquid Fund
Last 3 Dividends (`/unit) :
Face value (`/unit): 10
Fund manager's comment:
The scheme is invested in short maturity liquid instruments in line with its
objectives
Benchmark: Crisil Liquid Fund Index (CLFI)
NAV (`) :
Plan Option Freq NAV
Plan A Growth 18.0178
Plan A Dividend Daily 10.5819
Plan A Dividend Weekly 10.0194
Plan A Dividend Monthly 10.0022
Plan B Growth (IP) 18.1775
Plan B Dividend (IP) Daily 10.5873
Plan C Growth 12.3644
Plan C Dividend Daily 10.0025
Plan C Dividend Weekly 10.0095
Date Freq Other I & H
IDFC- CF Plan A
31 Aug 11 10.5819 Daily 0.00182704 0.00190475
30 Aug 11 10.5819 Daily 0.00185357 0.00193247
29 Aug 11 10.5819 Daily 0.00185558 0.00193457
26 Aug 11 10.0101 Weekly 0.0138 0.0144
18 Aug 11 10.0101 Weekly 0.0105 0.0109
12 Aug 11 10.0101 Weekly 0.0121 0.0126
29 Aug 11 10.0000 Monthly 0.0558 0.0582
28 Jul 11 10.0000 Monthly 0.0499 0.0520
29 Jun 11 10.0000 Monthly 0.0051 0.0054
IDFC-CF Plan B
31 Aug 11 10.5873 Daily 0.00184980 0.00192806
30 Aug 11 10.5873 Daily 0.00187638 0.00195628
29 Aug 11 10.5873 Daily 0.00187834 0.00195878
IDFC-CF Plan C
31 Aug 11 10.0025 Daily 0.00181986 0.00181986
30 Aug 11 10.0025 Daily 0.00184497 0.00184497
29 Aug 11 10.0025 Daily 0.00184649 0.00184649
26 Aug 11 10.0000 Weekly 0.0148 0.0154
18 Aug 11 10.0000 Weekly 0.0112 0.0117
12 Aug 11 10.0000 Weekly 0.0130 0.0135
07 Jul 11 10.0000 Periodic 0.0165 0.0172
05 Jul 11 10.0170 Periodic 0.0109 0.0113
NAV
30 August 2011
Fund PerformanceUnder The IDFC-CF-Growth
IDFC-CF Growth Crisil Liquid Fund Index
Past performance may or may not be sustained in future.Benchmark: Crisil Liquid Fund Index
Portfolio :
Clearing Corporation of India Ltd 0.50
Allahabad Bank A1+ 8.07ING Vysya Bank Ltd P1+ 6.95Bank of Maharashtra P1+ 6.20ICICI Bank Ltd A1+ 5.78UCO Bank P1+ 5.57Central Bank of India PR1+ 4.73Central Bank of India P1+ 4.69Axis Bank Ltd P1+ 4.68IDBI Bank Ltd P1+ 4.68Canara Bank P1+ 4.49Oriental Bank of Commerce P1+ 4.09United Bank of India A1+ 2.81United Bank of India P1+ 2.81Punjab National Bank PR1+ 2.81Union Bank of India P1+ 1.87Karur Vysya Bank Ltd P1+ 0.92Bank of India P1+ 0.47Jammu & Kashmir Bank Ltd P1+ 0.47Vijaya Bank PR1+ 0.47Andhra Bank A1+ 0.37State Bank of Patiala P1+ 0.14Andhra Bank PR1+ 0.05
Indian Oil Corporation Ltd P1+ 7.07Hindustan Petroleum Corporation Ltd P1+ 4.60SBI Global Factors Ltd P1+ 2.76Edelweiss Financial Services Ltd P1+ 2.32Nirma Ltd P1+ 1.40SREI Equipment Finance Pvt Ltd A1+ 0.47India Infoline Investment Services Ltd A1+ 0.47Apollo Tyres Ltd P1+ 0.23Aditya Birla Finance Ltd A1+ 0.14Tata Capital Ltd PR1+ 0.14Bajaj Finance Ltd A1+ 0.14SREI Equipment Finance Pvt Ltd F1+ 0.09Steel Authority of India Ltd PR1+ 0.05NABARD P1+ 0.01
Power Finance Corporation Ltd AAA 0.47
Grand Total 100.00
CBLO Total 0.50
Certificate of Deposit Total 73.11
Commercial Paper Total 19.89
Corporate Bond Total 0.47Net Current Asset 6.03
Name Rating % of NAV
(Annualised)7 Days
(Annualised)15 Days
(Annualised)30 Days
CAGR Last 1Year
CAGR Last2 Years
CAGR Last3 Years
CAGR Last5 Years
CAGR Last10 Years
CAGR SinceAllotment
02/07/2001
5.96%
8.44% 8.39% 8.42% 7.66%
5.87% 6.13%6.31% 5.94%
7.60% 7.87% 7.88% 7.58%
5.67%6.23% 6.64%
Asset Allocation
1 Certificate of Deposit 73.11%
2 Commercial Paper 19.89%
3 Net Current Asset 6.03%
4 CBLO 0.50%
5 Corporate Bond 0.47%
1
2
3 4 5
Rating & Ranking
Morningstar Rating
Past performance is no guarantee of future results.For Methodology of Ranking Please refer Page No. 32.

IDF
C M
on
ey
Ma
na
ger
Fu
nd
– T
rea
sury
Pla
nFUND FEATURESNature: DebtFund Manager: Mr. Anupam JoshiInvestment objective: Seek to generate stable returns with a low risk strategy by creating a portfolio that is substantially invested in good quality floating rate debt or money market instruments, fixed rate debt or money market instruments swapped for floating returns and fixed rate debt and money market instruments. However there is no assurance that the investment objective of the scheme will be realized.Investment style: The Scheme aims to invest only in highly rated money market instruments including floating rate instruments with short term benchmarks. The Scheme seeks to generate returns predominantly through accrual income.Ideal investment horizon: 1 day or moreEntry load: NilExit load: IDFC-MMF – TP: Plan A, Plan B, Plan C, Plan D & Plan F : Nil.Options available: Growth, Dividend & Dividend SweepMinimum investment amount: ̀ 5,000 and in multiples of ̀ 1 in Plan A (Regular Plan), `5 Crore and in multiples of `1 in Plan B (Institutional Plan), `10 Crores and in multiples `1 in Plan C (Super Institutional Plan), `25,000 and in multiples `1 in Plan D, `5,000 and in multiples of ̀ 1 in Plan F. (w.e.f. July 1, 2011)Additional investment amount: ̀ 1SIP (minimum amount): In Plan A ̀ 1,000Inception Date: 18 February 2003Other Parameter: Standard deviation 0.12%Modified duration: 60.81 Days Average Maturity: 64.70 Yield to Maturity: 9.25%Dividend frequency: Monthly & Daily / Weekly with compulsory reinvestment
Days
(IDFC - MMF - TP) An Open Ended Income Fund
Last 3 Dividends (`/unit) :
Face value (`/unit): 10Fund manager's comment:The scheme is invested in short maturity liquid instruments in line with its objectivesBenchmark: NSE MIBOR INDEX
NAV (`) :
Plan Option Freq NAVPlan A Growth 16.2963Plan A Dividend Daily 10.0699Plan A Dividend Weekly 10.0279Plan A Dividend Monthly 10.1769Plan B Growth 16.2922Plan B Dividend Daily 10.0703Plan B Dividend Weekly 10.0474Plan B Dividend Monthly 10.0869Plan C Growth 12.0900Plan C Dividend Daily 10.0015Plan C Dividend Weekly 10.0666Plan C Dividend Monthly 10.0034Plan D Growth 11.2471Plan D Dividend Daily 10.0033Plan F Growth 11.0577
Date Freq Other I & H
IDFC- MMF -TP Plan A
29 Aug 11 10.1746 Monthly 0.0566 0.0661
28 Jul 11 10.1746 Monthly 0.0522 0.0610
29 Jun 11 10.1746 Monthly 0.0536 0.0625
IDFC-MMF -TP Plan B
29 Aug 11 10.0844 Monthly 0.0590 0.0689
28 Jul 11 10.0844 Monthly 0.0545 0.0636
29 Jun 11 10.0844 Monthly 0.0559 0.0652
IDFC-MMF -TP Plan C
29 Aug 11 10.0010 Monthly 0.0587 0.0684
28 Jul 11 10.0007 Monthly 0.0544 0.0634
29 Jun 11 10.0007 Monthly 0.0555 0.0647
NAV
30 August 2011
Name Rating % of NAV
Portfolio :
Name Rating % of NAV
Clearing Corporation of India Ltd 3.12
Vijaya Bank PR1+ 8.37Andhra Bank PR1+ 7.78ICICI Bank Ltd A1+ 7.22Indusind Bank Ltd A1+ 6.05Jammu & Kashmir Bank Ltd P1+ 5.30Punjab & Sind Bank A1+ 4.77Axis Bank Ltd P1+ 4.72Bank of Maharashtra P1+ 4.26Allahabad Bank A1+ 4.19Andhra Bank A1+ 3.70State Bank of Patiala P1+ 1.74Karur Vysya Bank Ltd A1+ 1.74Oriental Bank of Commerce P1+ 1.59Federal Bank Ltd P1+ 1.24
CBLO Total 3.12
State Bank of Travancore P1+ 1.23Bank of India A1+ 0.88Kotak Mahindra Bank Ltd P1+ 0.87State Bank of Bikaner & Jaipur P1+ 0.86State Bank of India P1+ 0.86Central Bank of India PR1+ 0.86IDBI Bank Ltd A1+ 0.86State Bank of Mysore A1+ 0.71HDFC Bank Ltd PR1+ 0.60State Bank of Patiala A1+ 0.44Bank of India P1+ 0.44Indian Overseas Bank A1+ 0.44Axis Bank Ltd A1+ 0.43State Bank of Mysore P1+ 0.43Indian Bank F1+ 0.42State Bank of Hyderabad A1+ 0.31United Bank of India P1+ 0.17Yes Bank Ltd A1+ 0.09Punjab & Sind Bank P1+ 0.09UCO Bank P1+ 0.08
NABARD P1+ 8.62Hindustan Petroleum Corporation Ltd P1+ 2.16Sesa Goa Ltd P1+ 1.68
Export Import Bank of India AAA 4.08National Housing Bank AAA 3.72Tata Capital Ltd AA+ 0.80SREI Equipment Finance Pvt Ltd AA 0.53Power Finance Corporation Ltd AAA 0.45Reliance Utilities & Power Pvt Ltd AAA 0.03Tata Sons Ltd AAA 0.02Sundaram Bnp Paribas Home Fina Ltd AA+ 0.01Shriram Transport Finance Co Ltd AA 0.002
HDFC Ltd AAA 0.07
91 DAYS TBILL (MD 09/09/2011) SOV 0.3791 DAYS TBILL (MD 25/11/2011) SOV 0.35364 DAYS TBILL (MD 24/02/2012) SOV 0.26182 DAYS TBILL (MD 02/09/2011) SOV 0.09
Grand Total 100.00
Certificate of Deposit Total 73.75
Commercial Paper Total 12.46
Corporate Bond Total 9.64
Zero Coupon Bond Total 0.07
Treasury Bill Total 1.07Net Current Asset -0.11
Fund PerformanceUnder The IDFC-MMF-TP-Growth
IDFC-MMF-TP Growth NSE Mibor Index
Past performance may or may not be sustained in future.Benchmark: NSE Mibor Index
(Annualised) 7Days
(Annualised)15 Days
(Annualised)30 Days
CAGR Last 1Year
CAGR Last 2Years
CAGR Last 3Years
CAGR Last 5Years
CAGR SinceAllotment
18/02/2003
Asset Allocation
1 Certificate of Deposit 73.75%
2 Commercial Paper 12.46%
3 Corporate Bond 9.64%
4 CBLO 3.12%
5 Treasury Bill 1.07%
6 Zero Coupon Bond 0.07%
7 Net Current Asset -0.11%1
2
3 4 567
8.33% 8.36% 8.40%7.85%
6.11% 6.50% 6.41% 5.89%
8.04% 8.05% 8.07%7.26%
5.66% 5.60% 6.23% 5.85%

IDFC Super Saver Income Fund – Short Term
FUND FEATURES
Nature: Debt
Fund Manager: Mr. Suyash Choudhary (w.e.f. 11 March 2011)
Investment objective: Seek to generate stable returns with a low risk
strategy by investing in good quality fixed income securities and money
market securities. However there is no assurance that the investment
objective of the scheme will be realized.
Investment style: The Scheme seeks to invest in a mix of government
securities and highly rated corporate bonds and aims to generate stable long-
term returns through mix of accrual income and capital appreciation.
Ideal investment horizon: 9 months or more
Entry load: Nil
Exit load: Exit Load 0.50% of NAV on investors who purchase / switch in and
seek to redeem / switch out such units within 6 months from the date of
effecting such purchase / switch in. Investors opting for PEP / Dividend
reinvestment option / SWP or switch between options will not be levied an exit
load. (w.e.f March 01, 2011)
Options available: Growth, Dividend & Dividend Sweep
Minimum investment amount: `5,000 and in multiples of `1 in Plan A
(Regular Plan), `5 Crore and in multiples of `1 in Plan B (Institutional Plan),
`10 Crores and in multiples ̀ 1 in Plan C , ̀ 5000 and in multiples of ̀ 1 in Plan D
(MF Plan), ̀ 5000 and in multiples of ̀ 1 in Plan F. (w.e.f July 01, 2011)
Additional investment amount: ̀ 1
SIP (minimum amount): in Plan A ̀ 1,000
Inception Date: 14 December 2000
Other Parameter:
Standard deviation 0.72%
Modified duration 1.49 Years
Average Maturity: 1.69 Years
Yield to Maturity: 9.81%
Dividend frequency: Monthly, Fortnightly
(IDFC - SSIF - ST) An Open Ended Income Fund
Last 3 Dividends (`/unit) :
Face value (`/unit): 10
Fund manager's comment:
The fund is invested in a mix of certificate of deposits and short duration
corporate bonds to optimize performance.
Benchmark: CRISIL Short-Term Bond Fund Index (CSTBFI)
NAV (`) :
Plan Option Freq NAV
Plan A Growth 20.9284
Plan A Dividend Fortnightly 10.2232
Plan A Dividend Monthly 10.0652
Plan B Growth 11.6162
Plan B Dividend Fortnightly 10.8938
Plan B Dividend Monthly 10.2096
Plan C Growth 11.7086
Plan C Dividend Fortnightly 10.1041
Plan C Dividend Monthly 10.6092
Plan D Growth 13.5383
Plan D Dividend Fortnightly 10.7316
Plan D Dividend Monthly 10.8188
Plan F Growth 11.0344
Date Freq Other I & HIDFC- SSIF-ST Plan A26 Aug 11 10.2180 Fortnightly 0.0282 0.032912 Aug 11 10.2180 Fortnightly 0.0417 0.048629 Jul 11 10.2180 Fortnightly 0.0159 0.018529 Aug 11 10.0654 Monthly 0.0745 0.086928 Jul 11 10.0654 Monthly 0.0652 0.076129 Jun 11 10.0654 Monthly 0.0911 0.1062IDFC- SSIF-ST Plan B02 Jul 10 10.1285 Fortnightly 0.0020 0.002118 Jun 10 10.1077 Fortnightly 0.0027 0.002904 Jun 10 10.1077 Fortnightly 0.0106 0.011429 Aug 11 10.2097 Monthly 0.0776 0.090628 Jul 11 10.2097 Monthly 0.0679 0.079229 Jun 11 10.2097 Monthly 0.0815 0.0951IDFC-SSIF-ST Plan C26 Aug 11 10.0985 Fortnightly 0.0292 0.034112 Aug 11 10.0985 Fortnightly 0.5515 0.643518 Jun 10 10.0800 Fortnightly 0.0026 0.002829 Aug 11 10.6093 Monthly 0.0817 0.095328 Jul 11 10.6093 Monthly 0.0716 0.083529 Jun 11 10.6093 Monthly 0.0812 0.0947IDFC-SSIF-ST Plan D03 Dec 10 10.0567 Fortnightly 0.0053 0.005719 Nov 10 10.0567 Fortnightly 0.014 0.01504 Nov 10 10.0567 Fortnightly 0.0219 0.023530 Nov 10 10.1361 Monthly 0.0252 0.027129 Sep 10 10.0931 Monthly 0.0421 0.045231 Aug 10 10.0931 Monthly 0.0059 0.0063
NAV
30 August 2011
Portfolio :
Clearing Corporation of India Ltd 0.19
ICICI Bank Ltd A1+ 11.61IDBI Bank Ltd A1+ 6.33State Bank of Bikaner & Jaipur P1+ 5.62Federal Bank Ltd P1+ 3.19Syndicate Bank PR1+ 3.13Axis Bank Ltd P1+ 3.11Punjab National Bank PR1+ 0.13
HDFC Ltd AAA 12.80Mahindra & Mahindra Financial Services Ltd AA+ 12.71Shriram Transport Finance Co Ltd AA+ 11.17Tata Sons Ltd AAA 6.19Bajaj Finance Ltd AA+ 5.38Shriram Transport Finance Co Ltd AA 2.36L&T Finance Ltd AA+ 2.01Bajaj Finance Ltd LAA+ 1.99Sundaram Finance Ltd LAA+ 1.86
Bajaj Finance Ltd P1+ 6.25
Sundaram Finance Ltd LAA+ 5.84
Grand Total 100.00
CBLO 0.19
Certificate of Deposit Total 33.11
Corporate Bond Total 56.47
Commercial Paper Total 6.25
Zero Coupon Bond Total 5.84Net Current Asset -1.86
Total
Name Rating % of NAV
Fund PerformanceUnder The IDFC-SSIF-ST - Growth
IDFC-SSIF-ST Growth Crisil Short Term Bond Fund Index
Past performance may or may not be sustained in future.
Asset Allocation
1 Corporate Bond 56.47%
2 Commercial Paper 6.25%
3 Zero Coupon Bond 5.84%
4 Net Current Asset -1.86%
5 CBLO 0.19%
6 Certificate of Deposit 33.11%
23 45
CAGR Last 1Year
CAGR Last 2Years
CAGR Last 3Years
CAGR Last 5Years
CAGR Last 10Years
CAGR Since
Allotment
14/12/2000
1
6
5.96%
8.27% 7.89%7.14%7.52% 6.98%
6.75%5.87%
7.41% 7.11%
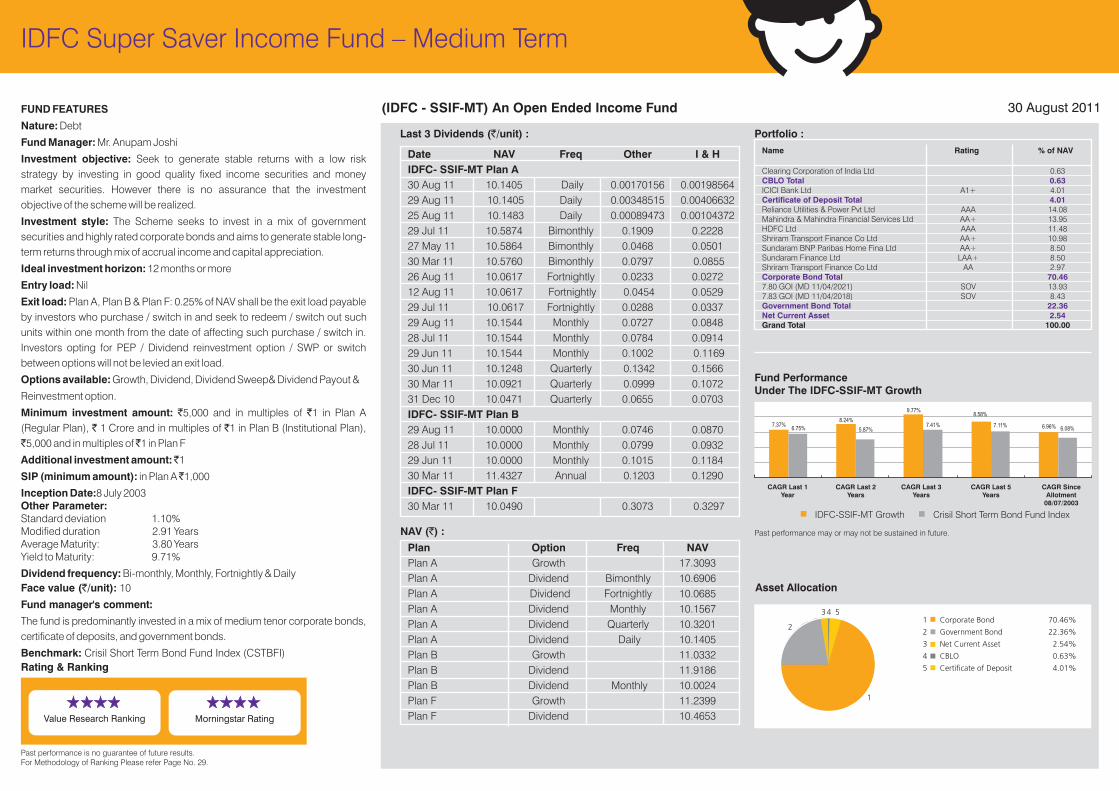
IDFC Super Saver Income Fund – Medium Term
(IDFC - SSIF-MT) An Open Ended Income Fund
Last 3 Dividends (`/unit) :
Face value (`/unit): 10
Fund manager's comment:
The fund is predominantly invested in a mix of medium tenor corporate bonds,
certificate of deposits, and government bonds.
Benchmark: Crisil Short Term Bond Fund Index (CSTBFI)
Fund PerformanceUnder The IDFC-SSIF-MT Growth
Portfolio :
IDFC-SSIF-MT Growth Crisil Short Term Bond Fund Index
30 August 2011FUND FEATURES
Nature: Debt
Fund Manager: Mr. Anupam Joshi
Investment objective: Seek to generate stable returns with a low risk
strategy by investing in good quality fixed income securities and money
market securities. However there is no assurance that the investment
objective of the scheme will be realized.
Investment style: The Scheme seeks to invest in a mix of government
securities and highly rated corporate bonds and aims to generate stable long-
term returns through mix of accrual income and capital appreciation.
Ideal investment horizon: 12 months or more
Entry load: Nil
Exit load: Plan A, Plan B & Plan F: 0.25% of NAV shall be the exit load payable
by investors who purchase / switch in and seek to redeem / switch out such
units within one month from the date of affecting such purchase / switch in.
Investors opting for PEP / Dividend reinvestment option / SWP or switch
between options will not be levied an exit load.
Options available: Growth, Dividend, Dividend Sweep& Dividend Payout &
Reinvestment option.
Minimum investment amount: `5,000 and in multiples of `1 in Plan A
(Regular Plan), ` 1 Crore and in multiples of `1 in Plan B (Institutional Plan),
`5,000 and in multiples of ̀ 1 in Plan F
Additional investment amount: ̀ 1
SIP (minimum amount): in Plan A ̀ 1,000
Inception Date:8 July 2003Other Parameter: Standard deviation 1.10%Modified duration 2.91 YearsAverage Maturity: 3.80 YearsYield to Maturity: 9.71%
Dividend frequency: Bi-monthly, Monthly, Fortnightly & Daily
NAV (`) :
Plan Option Freq NAV
Plan A Growth 17.3093
Plan A Dividend Bimonthly 10.6906
Plan A Dividend Fortnightly 10.0685
Plan A Dividend Monthly 10.1567
Plan A Dividend Quarterly 10.3201
Plan A Dividend Daily 10.1405
Plan B Growth 11.0332
Plan B Dividend 11.9186
Plan B Dividend Monthly 10.0024
Plan F Growth 11.2399
Plan F Dividend 10.4653
Date Freq Other I & H
IDFC- SSIF-MT Plan A
30 Aug 11 10.1405 Daily 0.00170156 0.00198564
29 Aug 11 10.1405 Daily 0.00348515 0.00406632
25 Aug 11 10.1483 Daily 0.00089473 0.00104372
29 Jul 11 10.5874 Bimonthly 0.1909 0.2228
27 May 11 10.5864 Bimonthly 0.0468 0.0501
30 Mar 11 10.5760 Bimonthly 0.0797 0.0855
26 Aug 11 10.0617 Fortnightly 0.0233 0.0272
12 Aug 11 10.0617 Fortnightly 0.0454 0.0529
29 Jul 11 10.0617 Fortnightly 0.0288 0.0337
29 Aug 11 10.1544 Monthly 0.0727 0.0848
28 Jul 11 10.1544 Monthly 0.0784 0.0914
29 Jun 11 10.1544 Monthly 0.1002 0.1169
30 Jun 11 10.1248 Quarterly 0.1342 0.1566
30 Mar 11 10.0921 Quarterly 0.0999 0.1072
31 Dec 10 10.0471 Quarterly 0.0655 0.0703
IDFC- SSIF-MT Plan B
29 Aug 11 10.0000 Monthly 0.0746 0.0870
28 Jul 11 10.0000 Monthly 0.0799 0.0932
29 Jun 11 10.0000 Monthly 0.1015 0.1184
30 Mar 11 11.4327 Annual 0.1203 0.1290
IDFC- SSIF-MT Plan F
30 Mar 11 10.0490 0.3073 0.3297
NAV
Clearing Corporation of India Ltd 0.63
ICICI Bank Ltd A1+ 4.01
Reliance Utilities & Power Pvt Ltd AAA 14.08Mahindra & Mahindra Financial Services Ltd AA+ 13.95HDFC Ltd AAA 11.48Shriram Transport Finance Co Ltd AA+ 10.98Sundaram BNP Paribas Home Fina Ltd AA+ 8.50Sundaram Finance Ltd LAA+ 8.50Shriram Transport Finance Co Ltd AA 2.97
7.80 GOI (MD 11/04/2021) SOV 13.937.83 GOI (MD 11/04/2018) SOV 8.43
Grand Total 100.00
CBLO 0.63
Certificate of Deposit Total 4.01
Corporate Bond Total 70.46
Government Bond Total 22.36Net Current Asset 2.54
Total
Name Rating % of NAV
Past performance may or may not be sustained in future.
Rating & Ranking
Value Research Ranking Morningstar Rating
Asset Allocation
1 Corporate Bond 70.46%
2 Government Bond 22.36%
3 Net Current Asset 2.54%
4 CBLO 0.63%
5 Certificate of Deposit 4.01%
1
2
34 5
CAGR Last 1Year
CAGR Last 2Years
CAGR Last 3Years
CAGR Last 5Years
CAGR SinceAllotment
08/07/2003
8.24%
9.77%8.58%
7.37% 6.96%6.75% 5.87%7.41% 7.11%
6.08%
Past performance is no guarantee of future results.For Methodology of Ranking Please refer Page No. 29.

IDF
C S
up
er
Sa
ver
Inco
me F
un
d –
In
vest
men
t P
lan
FUND FEATURES
Nature: Debt
Fund Manager: Mr. Suyash Choudhary (w.e.f. 15 Oct 2010)
Investment objective: Seek to generate stable returns by
creating a portfolio that is invested in good quality fixed income
and money market securities. However there is no assurance
that the investment objective of the scheme will be realized.
Investment style: The Scheme seeks to invest in a mix of
government securities and highly rated corporate bonds and
aims to generate stable long-term returns through mix of accrual
income and capital appreciation.
Ideal investment horizon: 1 year or more
Entry load: Nil
Exit load: IDFC-SSIF-IP - Plan A , Plan B, Plan C & Plan F :
1.00% of NAV on investors who purchase/switch in and seek to
redeem/switch out such units within 365 days such from the
date of effecting such purchase/switch in. Investors opting for
PEP / Dividend reinvestment option / SWP or switch between
options will not be levied an exit load.
Options available: Growth, Dividend & Dividend Sweep
Minimum investment amount: `5,000 and in multiples of ` 1
in Plan A (Regular Plan), ̀ 5 Crore and in multiples of ̀ 1 in Plan B
(Institutional Plan), ` 10 Crores and in multiples of `1 in Plan C,
`5,000 and in multiples of ̀ 1 in Plan D. (w.e.f July 1, 2011)
Additional investment amount: ̀ 1
SIP (minimum amount): in Plan A ̀ 1,000
Inception Date: 14 July 2000
Other Parameter:
Standard deviation 1.54%
Modified duration 3.59 Years
Average Maturity: 4.94 Years
Yield to Maturity: 9.40%
Dividend frequency: Quarterly, Half Yearly, Annually
(IDFC - SSIF - IP) An Open Ended Income Fund
Last 3 Dividends (`/unit) : Portfolio :
30 August 2011
NAV (`) :
Plan Option Freq NAV
Plan A Growth 23.9814
Plan A Dividend Annual 12.4858
Plan A Dividend Quarterly 11.3434
Plan A Dividend Half Yearly 11.3018
Plan B Growth 11.6221
Plan B Dividend 10.8278
Plan C Growth 11.2575
Plan C Dividend 11.1414
Plan F Growth 10.7250
Face value (`/unit): 10Fund manager's comment:The fund is predominantly invested in a mix of corporate bonds and government bonds. The fund will actively monitor the dynamic interest rate and credit spread environment to optimize performance. Benchmark: Crisil Composite Bond Fund Index (CCBFI)
Date Freq Other I & H
IDFC-SSIF-IP-Plan A
30 Jun 11 11.1408 Quarterly 0.0097 0.0113
30 Jun 10 10.7028 Quarterly 0.0470 0.0504
31 Dec 09 10.4941 Quarterly 0.0090 0.0097
30 Mar 11 10.9548 Half Yearly 0.1240 0.1330
29 Sep 10 10.8973 Half Yearly 0.1801 0.1933
29 Sep 09 10.6641 Half Yearly 0.3636 0.3907
30 Mar 09 10.9413 Annual 0.7663 0.8234
IDFC-SSIF-IP-Plan B
31 Mar 11 10.4778 0.3585 0.3847
31 Dec 09 10.2880 0.0296 0.0318
30 Jun 09 10.2589 0.1223 0.1314
IDFC-SSIF-IP-Plan C
31 Dec 09 10.1529 0.0227 0.0244
30 Jun 09 10.1243 0.0408 0.0438
NAV
ICICI Bank Ltd A1+ 2.11Axis Bank Ltd P1+ 0.61
HDFC Ltd AAA 14.42Sundaram Finance Ltd LAA+ 9.62Tata Sons Ltd AAA 8.99Mahindra & Mahindra Financial Services Ltd AA+ 8.96Shriram Transport Finance Co Ltd AA+ 6.62HDFC Bank Ltd AAA 5.28Shriram Transport Finance Co Ltd AA 4.63Mahindra & Mahindra Financial Services Ltd AA 3.22Reliance Ports and Terminals Ltd AAA 2.35
7.80 GOI (MD 11/04/2021) SOV 20.197.83 GOI (MD 11/04/2018) SOV 9.98
Grand Total 100.00
Certificate of Deposit Total 2.72
Corporate Bond Total 64.07
Government Bond Total 30.16Net Current Asset 3.05
Name Rating % of NAV
Asset Allocation
Fund PerformanceUnder The IDFC-SSIF-IP Growth
IDFC-SSIF-IP Growth Crisil Composite Bond Fund Index
Past performance may or may not be sustained in future.
1 Corporate Bond 64.07%
2 Government Bond 30.16%
3 Net Current Asset 3.05%
4 Certificate of Deposit 2.72%
1
2
3 4
CAGR Last 1Year
CAGR Last 2Years
CAGR Last 3Years
CAGR Last 5Years
CAGR Last10 Years
CAGR SinceAllotment
14/07/2000
7.90% 8.17%7.30%
6.21%5.22%
8.12%
6.08%7.12%
5.80%5.86%
Rating & Ranking
Morningstar Rating
Past performance is no guarantee of future results.For Methodology of Ranking Please refer Page No. 32.
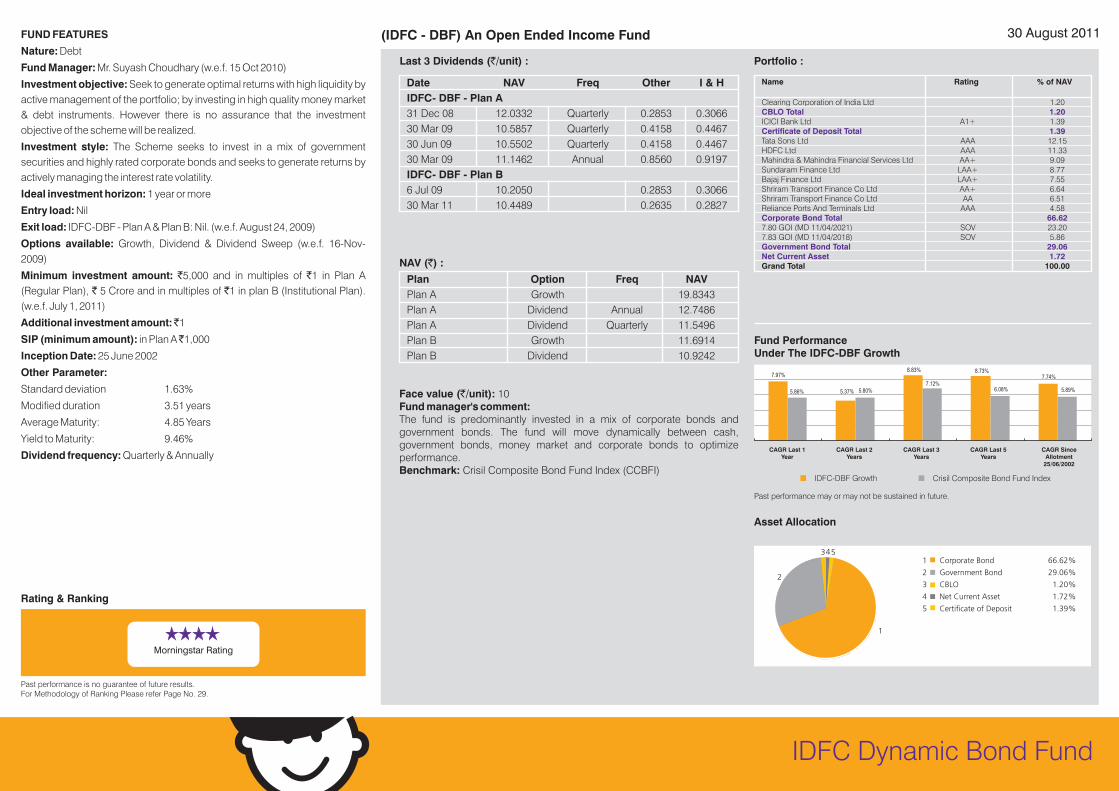
IDFC Dynamic Bond Fund
FUND FEATURES
Nature: Debt
Fund Manager: Mr. Suyash Choudhary (w.e.f. 15 Oct 2010)
Investment objective: Seek to generate optimal returns with high liquidity by
active management of the portfolio; by investing in high quality money market
& debt instruments. However there is no assurance that the investment
objective of the scheme will be realized.
Investment style: The Scheme seeks to invest in a mix of government
securities and highly rated corporate bonds and seeks to generate returns by
actively managing the interest rate volatility.
Ideal investment horizon: 1 year or more
Entry load: Nil
Exit load: IDFC-DBF - Plan A & Plan B: Nil. (w.e.f. August 24, 2009)
Options available: Growth, Dividend & Dividend Sweep (w.e.f. 16-Nov-
2009)
Minimum investment amount: `5,000 and in multiples of `1 in Plan A
(Regular Plan), ` 5 Crore and in multiples of `1 in plan B (Institutional Plan).
(w.e.f. July 1, 2011)
Additional investment amount: ̀ 1
SIP (minimum amount): in Plan A ̀ 1,000
Inception Date: 25 June 2002
Other Parameter:
Standard deviation 1.63%
Modified duration 3.51 years
Average Maturity: 4.85 Years
Yield to Maturity: 9.46%
Dividend frequency: Quarterly & Annually
(IDFC - DBF) An Open Ended Income Fund
Last 3 Dividends (`/unit) : Portfolio :
30 August 2011
Date NAV Freq Other I & H
IDFC- DBF - Plan A
31 Dec 08 12.0332 Quarterly 0.2853 0.3066
30 Mar 09 10.5857 Quarterly 0.4158 0.4467
30 Jun 09 10.5502 Quarterly 0.4158 0.4467
30 Mar 09 11.1462 Annual 0.8560 0.9197
IDFC- DBF - Plan B
6 Jul 09 10.2050 0.2853 0.3066
30 Mar 11 10.4489 0.2635 0.2827
Face value (`/unit): 10Fund manager's comment:The fund is predominantly invested in a mix of corporate bonds and government bonds. The fund will move dynamically between cash, government bonds, money market and corporate bonds to optimize performance. Benchmark: Crisil Composite Bond Fund Index (CCBFI)
NAV (`) :
Plan Option Freq NAV
Plan A Growth 19.8343
Plan A Dividend Annual 12.7486
Plan A Dividend Quarterly 11.5496
Plan B Growth 11.6914
Plan B Dividend 10.9242
Clearing Corporation of India Ltd 1.20
ICICI Bank Ltd A1+ 1.39
Tata Sons Ltd AAA 12.15HDFC Ltd AAA 11.33Mahindra & Mahindra Financial Services Ltd AA+ 9.09Sundaram Finance Ltd LAA+ 8.77Bajaj Finance Ltd LAA+ 7.55Shriram Transport Finance Co Ltd AA+ 6.64Shriram Transport Finance Co Ltd AA 6.51Reliance Ports And Terminals Ltd AAA 4.58
7.80 GOI (MD 11/04/2021) SOV 23.207.83 GOI (MD 11/04/2018) SOV 5.86
Grand Total 100.00
CBLO 1.20
Certificate of Deposit Total 1.39
Corporate Bond Total 66.62
Government Bond Total 29.06Net Current Asset 1.72
Total
Name Rating % of NAV
Fund PerformanceUnder The IDFC-DBF Growth
IDFC-DBF Growth Crisil Composite Bond Fund Index
Asset Allocation
Past performance may or may not be sustained in future.
1 Corporate Bond 66.62%
2 Government Bond 29.06%
3 CBLO 1.20%
4 Net Current Asset 1.72%
5 Certificate of Deposit 1.39%
1
2
34
CAGR Last 1Year
CAGR Last 2Years
CAGR Last 3Years
CAGR Last 5Years
CAGR SinceAllotment
25/06/2002
5
5.37%
8.83% 8.73%7.74%7.97%
5.89%6.08%7.12%
5.80%5.86%
Rating & Ranking
Morningstar Rating
Past performance is no guarantee of future results.For Methodology of Ranking Please refer Page No. 29.

IDFC Money Manager Fund – Investment Plan
FUND FEATURES
Nature: Debt
Fund Manager: Mr. Anupam Joshi
Investment objective: Seek to generate stable returns with a low risk
strategy by creating a portfolio that is substantially invested in good quality
floating rate debt or money market instruments, fixed rate debt or money
market instruments swapped for floating returns and fixed rate debt and
money market instruments. However there is no assurance that the
investment objective of the scheme will be realized.
Investment style: The Scheme aims to invest only in highly rated money
market instruments including floating rate instruments with short term
benchmarks. The Scheme seeks to generate returns predominantly through
accrual income.
Ideal investment horizon: 6 months or more
Entry load: Nil
Exit load: Plan A, Plan B & Plan F: Exit Load for all investment including SIP/
Micro SIP/STP shall be 0.25% of the applicable NAV if redeemed/ switched
out within One Month from the date of allotment. (w.e.f 1 March 2011)
Options available: Growth, Dividend & Dividend Sweep
Minimum investment amount: `5000 and in multiples of `1 in plan A
(Regular Plan), `5 Crore and in multiplies of `1 in plan B (institutional Plan),
`5000 and in multiples of ̀ 1 in plan F.
Additional investment amount: ̀ 1
SIP (minimum amount): In Plan A ̀ 1,000
Inception Date: 9 August 2004
Other Parameter:
Standard deviation 0.16%
Modified duration: 180.56 Days
Average Maturity: 189.51 Days
Yield to Maturity: 9.35%
Dividend frequency: Daily, weekly (with reinvest facility in both plan A & plan
B), Monthly, Quarterly & Annual.
(IDFC - MMF - IP) An Open Ended Income Fund
Last 3 Dividends (`/unit) : Portfolio :
30 August 2011
Plan Option Freq NAV
Plan A Growth 15.4686
Plan A Dividend Annual 12.1732
Plan A Dividend Daily 10.0093
Plan A Dividend Monthly 10.0458
Plan A Dividend Quarterly 10.4957
Plan A Dividend Weekly 10.0248
Plan B Growth 15.8255
Plan B Dividend Daily 10.1667
Plan B Dividend Monthly 10.0507
Plan B Dividend Weekly 10.0746
Plan F Growth 10.5451
Date Freq Other I & H
IDFC- MMF -IP Plan A
30 Aug 11 10.0093 Daily 0.00178206 0.00207916
26 Aug 11 10.0102 Daily 0.00177593 0.00207203
25 Aug 11 10.0102 Daily 0.00165138 0.00192669
26 Aug 11 10.0233 Weekly 0.0214 0.0250
18 Aug 11 10.0233 Weekly 0.0086 0.0100
12 Aug 11 10.0233 Weekly 0.0103 0.0121
29 Aug 11 10.0434 Monthly 0.0598 0.0698
28 Jul 11 10.0434 Monthly 0.0479 0.0559
29 Jun 11 10.0434 Monthly 0.0801 0.0935
30 June 11 10.3500 Quarterly 0.1517 0.1770
30 Mar 11 10.3184 Quarterly 0.1154 0.1239
31 Dec 10 10.2622 Quarterly 0.1146 0.1230
30 Mar 09 10.5505 Annually 0.4158 0.4467
IDFC-MMF-IP Plan B
30 Aug 11 10.1667 Daily 0.00186201 0.00217244
26 Aug 11 10.1673 Daily 0.00185965 0.00216969
25 Aug 11 10.1673 Daily 0.00173598 0.00202540
26 Aug 11 10.0727 Weekly 0.0219 0.0255
18 Aug 11 10.0727 Weekly 0.0090 0.0105
12 Aug 11 10.0727 Weekly 0.0107 0.0125
29 Aug 11 10.0483 Monthly 0.0615 0.0718
28 Jul 11 10.0483 Monthly 0.0495 0.0577
29 Jun 11 10.0483 Monthly 0.0817 0.0953
NAV
NAV (`) :
Clearing Corporation of India Ltd 2.02
Oriental Bank of Commerce P1+ 11.12Canara Bank P1+ 10.01State Bank of India P1+ 9.65Indian Overseas Bank A1+ 7.26Axis Bank Ltd P1+ 7.26State Bank of Patiala P1+ 7.23State Bank of Hyderabad A1+ 6.35State Bank of Patiala A1+ 4.84Bank of India P1+ 4.84Syndicate Bank P1+ 4.83State Bank of Bikaner & Jaipur P1+ 4.83Bank of India A1+ 4.82Corporation Bank P1+ 2.42State Bank of Mysore P1+ 2.41Bank of Baroda P1+ 2.41State Bank of Travancore P1+ 2.01Syndicate Bank PR1+ 1.69Union Bank of India P1+ 1.27Central Bank of India PR1+ 0.97Canara Bank A1+ 0.70Punjab National Bank PR1+ 0.61Bank of Baroda A1+ 0.49Andhra Bank PR1+ 0.47
Grand Total 100.00
CBLO 2.02
Certificate of Deposit Total 98.47Net Current Asset -0.49
Total
Name Rating % of NAV
Fund PerformanceUnder The IDFC-MMF-IP Growth
IDFC-MMF-IP Growth NSE MIBOR INDEX
Asset Allocation
Past performance may or may not be sustained in future.
Face value (`/unit): 10
Fund manager's comment:
The scheme is invested in CDs up to 7 months maturity in order to optimize
portfolio yields
Benchmark: NSE Mibor Index
1 Certificate of Deposit 98.47%
2 Net Current Asset -0.49%
3 CBLO 2.02%
1
23
(Annualised) 7Days
(Annualised)15 Days
(Annualised)30 Days
CAGR Last 1Year
CAGR Last 2Years
CAGR Last 3Years
CAGR Last 5Years
CAGR SinceAllotment09/08/2004
4.32%
8.36%9.01%
7.76%
6.33% 6.39%6.88%
6.37%
8.04% 8.05% 8.07%7.26%
5.66% 5.60%6.23% 6.05%
Rating & Ranking
Morningstar Rating
Past performance is no guarantee of future results.For Methodology of Ranking Please refer Page No. 32.

IDFC Arbitrage Plus Fund(IDFC - APF)
IDFC Classic Equity Fund(IDFC - CEF)
IDFC Premier Equity Fund(IDFC - PEF)
IDFC Small & Midcap Equity Fund (IDFC - SMEF)
IDFC Imperial Equity Fund(IDFC - IEF)
IDFC Strategic Sector 50-50 Equity Fund (IDFC - SSEF)
IDFC Equity Fund(IDFC - EF)
IDFC India GDP Growth Fund (IDFC - IGGF)
Nature of the Scheme Open-ended Equity Fund Open-ended Equity Fund Open-ended Equity Fund Open-ended Equity Fund Open-ended Equity Fund Open-ended Equity Fund Open-ended Equity Fund Open-ended Equity Fund
Inception Date June 9, 2008 August 9, 2005 September 28, 2005 March 7, 2008 March 16, 2006 October 3, 2008 June 9, 2006 March 11, 2009
Investment Objective The investment objective of the Scheme is to generate income (absolute to low volatility returns) by taking advantage of opportunities in the cash and the derivative segments of the equity markets including the arbitrage opportunities available within the derivative segment, by using other derivat ive based strategies and by investing the balance in debtand money market instruments. However there is no assurance that the investment objective of the scheme will be realized.
The investment objective of the Scheme is to seek to generate long term capital growth from a diversified portfolio of predominantly equity and equity related instruments. However, there is no assurance or guarantee that the objectives of the scheme will be realized.
The Scheme shall seek to generate long-term capital growth from an actively managed portfolio of predominantly equity and equity related instruments. However there is no assurance or guarantee that the objectives of the scheme will be realized.
The investment objective of the Scheme is to seek to generate capital appreciation from a diversified portfolio of equity and equity related instruments. The Scheme will predominantly invest in small and midcap equity and equity related instruments. Small and Midcap equity and equity related instruments will be the stocks included in the CNX Midcap index or equity and equity related instruments of such companies which have a market capitalization lower than the highest components of CNX Midcap Index. The Scheme may also invest in stock other than mid cap stocks (i.e. in stocks, which have a market capitalisation of above the market capitalisation range of the defined small midcap stocks) and derivatives. On defensive consideration, the Scheme may also invest in debt and money market instruments. However there is no assurance that the investment objective of the scheme will be realized.
The investment objective of the scheme is to seek to generate capital appreciation and/or provide income distribution from a portfolio of predominantly equity and equity related instruments. There is no assurance or guarantee that the objectives of the scheme will be realized.
The investment objective of the scheme is to seek to generate long-term capital appreciation by investing in Equity & Equity related instruments. The investment objective of the fund shall be achieved by investing up to fifty percent of the asset of the scheme in a chosen sector (Sector Specific Exposure) while the balance amount may be invested in c o m p a n i e s a c r o s s m a r k e t capitalizations and across sectors (Diversified Exposure). The scheme may also invest in debt & money market instruments. There is no assurance or guarantee that the objectives of the scheme will be realized and the scheme does not assure or guarantee any returns.
The investment objective of the scheme is to seek to generate capital g r o w t h f r o m a p o r t f o l i o o f predominantly equity and equity related instruments (including Equity Derivatives). The scheme may also invest in debt & money market instruments to generate reasonable income. However there is no assurance or guarantee that the objectives of the scheme will be realized.
The investment objective of the scheme is to seek to generate long-term capital appreciation by investing in equity and equity related instruments. The scheme aims to capture the growth in India's Gross Domestic Product (GDP). The scheme would endeavour to represent the growth in GDP by captur ing the growth in the constituents of the GDP. The scheme may also invest in debt & money market instruments. There is no assurance or guarantee that the objectives of the scheme will be realized and the scheme does not assure or guarantee any returns.
Fund Manager Kenneth Andrade & Suyash Choudhary
Tridib Pathak Kenneth Andrade Kenneth Andrade Tridib Pathak Kenneth Andrade Kenneth Andrade Neelotpal Sahai
Ideal Investment Horizon 1 Year or more 3 Years or more 3 Years or more 3 Years or more 3 Years or more 3 Years or more 3 Years or more 3 Years or more
Minimum Investment Amount Plan A
Plan B
` 5,000/- and in multiples of ` 1/- thereafter.
` 25 Lacs and in multiples of ` 1/- thereafter.
` 5,000/- and in multiples of ` 1/- thereafter.
` 5,000/- and in multiples of ` 1/- thereafter.
` 25,000/- and in multiples of ` 1/- thereafter.
` 25,000/- and in multiples of ` 1/- thereafter.
` 5,000/- and in multiples of ̀ 1/-thereafter
` 5,000/- and in multiples of ` 1/- thereafter.
` 5,000/- and in multiples of ` 1/- thereafter.
` 5,000/- and in multiples of ` 1/- thereafter.
` 5,000/- and in multiples of ` 1/- thereafter.
` 5,000/- and in multiples of ` 1/- thereafter.
` 5,000/- and in multiples of ` 1/- thereafter.
` 5,000/- and in multiples of ` 1/- thereafter.
Additional Investment Amount
` 1/- ` 1/- ` 1/- ` 1/- ` 1/- ` 1/- ` 1/- ` 1/-
Entry Load Nil Nil Nil Nil Nil Nil Nil Nil
Exit Load 0.50% if redeemed before 365 days from the date of investment. (w.e.f. 24 Aug 2009)
1.00% if redeemed before 365 days from the date of investment. (w.e.f. 1 Sept 2009)
1.00% if redeemed before 365 days from the date of investment. (w.e.f. 1 Sept 2009)
1.00% if redeemed before 365 days from the date of investment. (w.e.f. 11 Sept 2009)
1.00% if redeemed before 365 days from the date of investment. (w.e.f. 1 Sept 2009)
1.00% if redeemed before 365 days from the date of investment. (w.e.f. 1 Sept 2009)
1.00% if redeemed before 365 days from the date of investment. (w.e.f. 1 Sept 2009)
1% if redeemed before 365 days from the date of investment. (w.e.f.) 01 Sept 2009)
Options Available Growth, Dividend & Dividend Sweep Growth & Dividend Reinvestment facility is available under the Dividend Option
Growth & Dividend Reinvestment facility is available under the Dividend Option.
Growth & Dividend Growth & Dividend Reinvestment facility is available under the Dividend Option.
Growth,& Dividend .Reinvestment facility is available under the Dividend Option.
Growth & Dividend Growth & Dividend Reinvestment facility is also available under the dividend option.
Dividend Frequency When available
Dividend Re-investment At Ex-Dividend NAV At Ex-Dividend NAV At Ex-Dividend NAV At Ex-Dividend NAV At Ex-Dividend NAV At Ex-Dividend NAV At Ex-Dividend NAV At Ex-Dividend NAV
SIP (Minimum Amount) NA ̀ 1,000/- ̀ 2,000/- ` 1,000/- ̀ 1,000/- ̀ 1,000/- ̀ 1,000/- ` 2,000/-
SIP Frequency NA Daily, Weekly, Fortnightly, Monthly Weekly, Fortnightly, Monthly Daily, Weekly, Fortnightly, Monthly Daily, Weekly, Fortnightly, Monthly Daily, Weekly, Fortnightly, Monthly Daily, Weekly, Fortnightly, Monthly Daily, Weekly, Fortnightly, Monthly
Benchmark Crisil Liquid Fund Index BSE 200 BSE 500 CNX Midcap S&P CNX Nifty S&P CNX Nifty S&P CNX Nifty BSE 500
NAV Frequency All Business Days All Business Days All Business Days All Business Days All Business Days All Business Days All Business Days All Business Days
Face Value (`/Unit) ` 10/- ` 10/- ` 10/- ` 10/- ` 10/- ` 10/- ` 10/- ` 10/-
Lock in Period Nil Nil Nil Nil Nil Nil Nil Nil
SIP Dates, Weekly FortnightlyMonthly
NA 7,14,21,281, 16Any day of Month
7,14,21,281, 16Any day of Month
7,14,21,281, 16Any day of Month
7,14,21,281, 16Any day of Month
7,14,21,281, 16Any day of Month
7,14,21,281, 16Any day of Month
7,14,21,281, 16Any day of Month
Fund Snapshot

IDFC Cash Fund IDFC Money Manager Fund - Treasury Plan
IDFC Money Manager Fund - Investment Plan
IDFC Super Saver Income Fund - Short Term Plan
IDFC Super Saver Income Fund - Medium Term Plan
IDFC Super Saver Income Fund - Investment Plan
IDFC Dynamic Bond Fund
Nature of the Scheme Open-ended Liquid Fund Open-ended Income Fund Open-ended Income Fund Open-ended Income Fund Open-ended Income Fund Open-ended Income Fund Open-ended Income Fund
Inception Date July 2, 2001 February 18, 2003 August 9, 2004 December 14, 2000 July 8, 2003 July 14, 2000 June 25, 2002
Investment Objective IDFC - CF is an open-ended liquid fund with an objective to generate optimal returns with high liquidity by investing in high quality money market and debt instruments. However, there can be no assurance that the investment objectives of the scheme will be realized.
Seek to generate stable returns with a low risk strategy by creating a portfolio that is substantially invested in good quality floating rate debt or money market instruments, fixed rate debt or money market instruments swapped for floating returns and fixed rate debt and money market instruments. However, there can be no assurance that the investment objectives of the scheme will be realized.
Seek to generate stable returns with a low risk strategy by creating a portfolio that is substantially invested in good quality floating rate debt or money market instruments, fixed rate debt or money market instruments swapped for floating returns and fixed rate debt and money market instruments. However there is no assurance that the investment objective of the scheme will be realized.
The primary investment objective of the scheme is to seek to generate stable returns with a low-risk strategy by creating a portfolio that is invested in good quality fixed income & Money Market securities. However, there can be no assurance that the investment objectives of the scheme will be realized.
The primary investment objective of the scheme is to seek to generate stable returns with a low-risk strategy by creating a portfolio that is invested in good quality fixed income & Money Market securities. However, there can be no assurance that the investment objectives of the scheme will be realized.
The primary investment objective of the scheme is to seek to generate stable returns with a low-risk strategy by creating a portfolio that is invested in good quality fixed income & Money Market securities. However, there can be no assurance that the investment objectives of the scheme will be realized.
Seek to generate optimal returns with high liquidity by active management of the portfolio; by investing in high quality money market & debt instruments. However there can be no assurance that the investment objectives of the Scheme will be realized.
Fund Manager Anupam Joshi Anupam Joshi Anupam Joshi Suyash Choudhary Anupam Joshi Suyash Choudhary Suyash Choudhary
Ideal Investment Horizon 1 Day or more 1 Day or more 6 Months or more 9 Months or more 12 Months or more 1 Year or more 1 Year or more
Minimum Investment Amount Plan A: ` 5,000 and in multiples of ` 1/- thereafter, Plan B: ` 1 Crore and in multiples of ` 1/- thereafter, Plan C: ` 5 Crores and in multiples ̀ 1/- thereafter.
Plan A: ` 5,000 and in multiples of ` 1/- thereafter, Plan B: ` 5 Crore and in multiples of ̀ 1/- thereafter, Plan C: ̀ 10 Crores and in multiples ` 1/- thereafter, Plan D: ` 25,000/- and in multiples of `1/- thereafter, Plan F: ` 5,000/- and in multiples of ̀ 1/- thereafter.
Plan A: ` 5,000 and in multiples of ` 1/- thereafter, Plan B: ` 5 Crore and in multiples of ` 1/- thereafter, Plan F: ` 5,000 and in multiples ̀ 1/- thereafter,
Plan A: ` 5,000 and in multiples of ` 1/- thereafter, Plan B: ` 5 Crore and in multiples of ̀ 1/- thereafter, Plan C: ̀ 10 Crores and in multiples ` 1/- thereafter, Plan D: ̀ 5,000/- and in multiples of ̀ 1/- thereafter. Plan F: ` 5,000/- and in multiples of ̀ 1/- thereafter.
Plan A: ` 5,000 and in multiples of ` 1/- thereafter, Plan B: ` 1 Crore and in multiples of ` 1/- thereafter, Plan F: ` 5,000 and in multiples of ̀ 1/- thereafter.
Plan A: ` 5,000 and in multiples of ` 1/- thereafter, Plan B: ` 5 Crore and in multiples of ̀ 1/- thereafter, Plan C: ̀ 10 Crores and in multiples ` 1/- thereafter, Plan F: ` 5,000 and in multiples of ` 1/- thereafter
Plan A: ̀ 5,000 and in multiples of ̀ 1/- thereafter, Plan B: ` 5 Crore and in multiples of ̀ 1/- thereafter
Additional Investment Amount ` 1/- ` 1/- ` 1/- ` 1/- ` 1/- ` 1/- ` 1/-
Entry Load Nil Nil Nil Nil Nil Nil Nil
Exit Load Nil Plan A: NilPlan B: NilPlan C: NilPlan D: NilPlan F: Nil
Plan A, Plan B & Plan F: Exit Load for all investment including SIP/Micro SIP/STP shall be 0.25% of the applicable NAV if redeemed / switched out within One Month from the date of allotment. (w.e.f March 01, 2011)
0.50% of NAV on investors who purchase / switch in and seek to redeem / switch out such units within 6 months from the date of effecting such purchase / switch in. Investors opting for PEP / Dividend reinvestment option / SWP or switch between options will not be levied an exit load. (w.e.f 01 March, 2011)
0.25% of NAV shall be the exit load payable by investors who purchase / switch in and seek to redeem / switch out such units within one month from the date of affecting such purchase / switch in. Investors opting for PEP / Dividend reinvestment option / SWP or switch between options will not be levied an exit load
Plan A, Plan B, Plan C & Plan F: 1.00% if redeemed before 365 days from the date of investment.
Plan A: Nil Plan B: Nil (w.e.f. 24 Aug 2009)
Options Available Growth, Dividend & Dividend Sweep (w.e.f. 16-Nov-2009)
Growth, Dividend & Dividend Sweep Growth, Dividend & Dividend Sweep Growth, Dividend & Dividend Sweep Growth, Dividend, Dividend Sweep &Dividend Payout & Reinvestment option
Growth, Dividend & Dividend Sweep Growth, Dividend & Dividend Sweep (w.e.f. 16-Nov-2009)
Dividend Frequency Dai ly, Weekly wi th compulsory reinvestment, Monthly and Periodic
Daily & Weekly with Compulsory reinvestment & Monthly
Daily & Weekly (with reinvest facility in both plan A & plan B), Monthly, Quarterly & Annual.
Fortnightly & Monthly Daily, Bi - Monthly (once in two months) i.e. in the months of March, May, July, September, November & January, Fortnightly, Monthly& Quarterly (with reinvestment facility) (for Plan A) Monthly and Quarterly (with reinvestment) under Plan B
Quarterly (March, June, September & December), Half Yearly (March & September) & Annual (March)
Quarterly (March, June, September & December) & Annual (March)
Dividend Re-investment At Ex-Dividend NAV At Ex-Dividend NAV At Ex-Dividend NAV At Ex-Dividend NAV At Ex-Dividend NAV At Ex-Dividend NAV At Ex-Dividend NAV
SIP (Minimum Amount) Plan A: ̀ 1,000/- ` 1,000/- Plan A: ̀ 1,000/- Plan A: ̀ 1,000/- Plan A: ̀ 1,000/- Plan A: ̀ 1,000/- Plan A: ̀ 1,000/-
SIP Frequency Daily, Weekly, Fortnightly, Monthly Daily, Weekly, Fortnightly, Monthly Daily, Weekly, Fortnightly, Monthly Daily, Weekly, Fortnightly, Monthly Daily, Weekly, Fortnightly, Monthly Daily, Weekly, Fortnightly, Monthly Daily, Weekly, Fortnightly, Monthly
SIP Dates, Weekly FortnightlyMonthly
7,14,21,281, 16Any day of Month
7,14,21,281, 16Any day of Month
7,14,21,281, 16Any day of Month
7,14,21,281, 16Any day of Month
7,14,21,281, 16Any day of Month
7,14,21,281, 16Any day of Month
7,14,21,281, 16Any day of Month
Lock in Period Nil Nil Nil Nil Nil Nil Nil
Benchmark Crisil Liquid Fund Index NSE MIBOR Index NSE MIBOR Index CRISIL Short Term Bond Fund Index CRISIL Short Term Bond Fund Index CRISIL Short Term Bond Fund Index CRISIL Composite Bond Fund Index
NAV Frequency Daily All Business Days All Business Days All Business Days All Business Days All Business Days All Business Days
Face Value (`/Unit) ` 10/- ` 10/- ` 10/- ` 10/- ` 10/- ` 10/- ` 10/-
Fund Snapshot

Value Research Rating
ICRA Mutual Fund Awards Disclaimer
ICRA Credit Risk Rating
Value Research Fund Ratings are a composite measure of
historical risk-adjusted returns. In the case of equity and hybrid
funds this rating is based on the weighted average monthly
returns for the last 3 and 5-year periods. In the case of debt funds
this rating is based on the weighted average weekly returns for
the last 18 months and 3-year periods and in case of short-term
debt funds - weekly returns for the last 18 months. These ratings
do not take into consideration any entry or exit load. Each
category must have a minimum of 10 funds for it to be rated.
Effective, July 2008, we have put an additional qualifying criteria,
whereby a fund with less than Rs 5 crore of average AUM in the
past six months will not be eligible for rating.
Five-stars indicate that a fund is in the top 10% of its category in
terms of historical risk-adjusted returns. Four stars indicate that a
fund is in the next 22.5%, middle 35% receive three stars, the next
22.5% are assigned two stars while the bottom 10% receive one
star. The number of schemes in each category is mentioned
along side the categories name. Equity: Large Cap (40), Equity:
Large & Mid Cap (58), Equity: Multi Cap (43), Equity: Mid & Small
Cap (48) Equity: Tax Planning (28), Equity: Infrastructure (20),
Hybrid: Equity-oriented (24), Hybrid: Debt-oriented Aggressive
(14), Hybrid: Debt-oriented Conservative (42), Hybrid: Arbitrage
(15) Debt: Income (62), Debt: Gilt Medium & Long Term (32),
Debt: Short Term (17), Debt: Ultra Short Term (137), Debt: Liquid
(102). These Fund Ratings are as on August 31, 2011.
The Value Research Ratings are published in Monthly Mutual
Fund Performance Report and Mutual Fund Insight. The Ratings
are subject to change every month. The Rating is based on
primary data provided by respective funds, Value Research
does not guarantee the accuracy.
IDFC Premier Equity Fund – Plan A has been ranked as a
Seven Star Fund in the category of 'Open Ended Equity
Diversified - Aggressive' schemes for its 3 years performance till
December 31, 2010.
The rank is an outcome of an objective and comparative analysis
against various parameters, including: risk adjusted return, fund
size, company concentration and liquidity. The ranking
methodology did not take into account entry and exit loads
imposed by the Fund. There were 81 schemes considered in
'Open Ended quity Diversified - Aggressive' category for the
ranking exercise. The rank is neither a certificate of statutory
compliance nor any guarantee on the future performance of
IDFC Premier Equity Fund – Plan A.Ranking Source & Publisher: ICRA Online Limited
IDFC Money Manager Fund - Treasury Plan: “Credit Risk Rating
mfAAA” - The Fund carries the lowest credit risk, similar to that associated
with long-term debt obligations rated in the highest-credit-quality category.
IDFC Money Manager Fund – Investment Plan: “Credit Risk Rating
mfAAA” - The Fund carries the lowest credit risk, similar to that associated
with long-term debt obligations rated in the highest-credit-quality category.
IDFC Cash Fund: “Credit Risk Rating mfA1+” - The highest-credit-quality
short-term rating assigned by ICRA to debt funds. Debt funds rated in this
category carry the lowest credit risk in the short term and are similar to that of
fixed income obligations of highest-credit-quality category with maturity of
upto one year. This rating should however, not be construed as an indication of
the performance of the Mutual Fund scheme or of volatility in its returns.
IDFC Super Saver Income Fund - Short Term Plan: “Credit Risk Rating
mfAAA” - The Fund carries the lowest credit risk, similar to that associated
with long-term debt obligations rated in the highest-credit-quality category.
Source: ICRA Ltd.
IDFC Super Saver Income Fund - Investment Plan: “Credit Quality Rating
AAAf” - The assigned rating AAAf is valid only for “IDFC Super Saver Income
Fund - Investment Plan”. The rating of CRISIL is not an opinion on the Asset
Management Company's willingness or ability to make timely payments to the
investor. The rating is also not an opinion on the stability of the NAV of the
Fund, which could vary with market developments.
CRISIL's credit quality ratings are based on the analysis of the credit risk of
securities held by the fund. CRISIL has developed a Credit Quality Matrix to
evaluate fund's overall level of protection against losses associated with credit
default. The matrix is a set of credit factors and credit scores derived
scientifically from CRISIL's rating default and transition rates.
This Morningstar-sourced information is provided to you by IDFC AMC and is
at your own risk. Morningstar is not responsible for any damages or losses
arising from any use of this information. Also, this information must not be
relied upon without appropriate verification. IDFC AMC informs you as follows:
(i) no investment decision should be made in relation to any of the information
provided other than on the advice of a professional financial advisor; (ii) past
performance is no guarantee of future results; and (iii) the value and income
derived from investments can go down as well as up.
The Morningstar fund rating methodology is based on a fund's risk-adjusted
return within a given Morningstar category. Morningstar ratings are calculated
every month for the 3 year, 5 year and 10 year period. Within each rating
period, the top 10% funds receive a five star rating, the next 22.5% earn a four
star rating, the next 35% get three stars, the next 22.5% receive two stars, and
the bottom 10% get one star. Loads are not considered for the rating purpose.
CRISIL Credit Quality Rating
CRISIL Credit Quality Rating Methodology
Morningstar Rating
The rating is based on NAV provided by respective funds. The current fund
rating is for the 3 year period as of August 31, 2011. IDFC Premier Equity Fund
Growth has been rated 5-Star fund in the category of Small/Mid Cap schemes
(143 Schemes), IDFC Small & Midcap Equity Fund Growth has been rated 5-
Star fund in the category of Small/Mid Cap schemes (143 Schemes), IDFC
Imperial Equity Fund Growth has been rated 4-Star fund in the category of
Large Cap schemes (283 Schemes), IDFC Dynamic Bond Fund Growth has
been rated 4-Star fund in the category of Intermediate Bond schemes (118
Schemes), IDFC Savings Advantage Fund Growth has been rated 4-Star fund
in the category of Ultrashort Bond schemes (282 Schemes), IDFC Gov Sec PF
Fund Growth has been rated 4-Star fund in the category of Intermediate
Government schemes (67 Schemes), IDFC SS Inc M/T Fund Growth has been
rated 4-Star fund in the category of Short-term Bond schemes (99 Schemes),
IDFC SS Inc IP Fund Growth has been rated 4-Star fund in the category of
Intermediate Bond schemes (118 Schemes), IDFC Cash Fund Growth has
been rated 4-Star fund in the category of Liquid schemes (263 Schemes),
IDFC Money Mgr Invmt Growth has been rated 4-Star fund in the category of
Ultrashort Bond schemes (282 Schemes).
IDFC Premier Equity Fund – Plan A
Methodology
Classification averages are calculated with all eligible share classes for each
eligible classification. The calculation periods extend over 36, 60, and 120
months. The highest Lipper Leader for Consistent Return (Effective Return)
value within each eligible classification determines the fund classification
winner over three, five, or ten years. There were 189 funds under the category -
Global classification.
The lowest average decile1 rank of the three years' Consistent Return measure
of the eligible funds per asset class and group will determine the asset class
group award winner over the three year period. In cases of identical results the
lower average percentile rank will determine the winner. The decile ranking is
obtained by the percentile ranking according to the formula: INT(((( Percentile
Rank – 1 ) * ( 1 – 0.01 )) / 10 ) +1 ).
Although Lipper makes reasonable efforts to ensure the accuracy and
reliability of the data contained herein, the accuracy is not guaranteed by
Lipper. Users acknowledge that they have not
relied upon any warranty, condition, guarantee, or representation made by
Lipper. Any use of the data for analyzing, managing, or trading financial
instruments is at the user's own risk. This is
not an offer to buy or sell securities.
Lipper Fund Awards, India, 2010
Disclaimer
Meth
od
olo
gy
of
Ra
nki
ng

Risk Factors: Mutual Funds and securities investments are subject to market
risks, reinvestment risk, changes in political, economic environment and
government policy and there is no assurance or guarantee that the objectives of
the Scheme/s will be achieved. The NAV of the Scheme/s can go up or down
depending on factors and forces affecting the Securities Market including
fluctuation in interest rates, trading volumes and reinvestment risk. Past
performance of the Sponsor/AMC/Mutual Fund is not necessarily indicative of the
future performance of the Scheme/s and may not necessarily provide a basis for
comparison with other investments. IDFC Classic Equity Fund (IDFC - CEF), IDFC
Equity Fund (IDFC - EF), IDFC Infrastructure Fund (IDFC-IF),IDFC Imperial Equity
Fund (IDFC - IEF), IDFC Nifty Fund (IDFC NF), IDFC Premier Equity Fund (IDFC -
PEF), IDFC Arbitrage Fund (IDFC - AF), IDFC Arbitrage Plus Fund (IDFC - APF),
IDFC Small & Midcap Equity (SME) Fund (IDFC - SMEF), IDFC Strategic Sector
(50-50) Equity Fund IDFC-SS (50-50)-EF, IDFC India GDP Growth Fund (IDFC-
IGGF), IDFC Super Saver Income Fund - Investment Plan (IDFC - SSIF-IP), IDFC
Tax Advantage (ELSS) Fund (IDFC TA-ELSS), IDFC Super Saver Income Fund -
Medium Term (IDFC-SSIF-MT), IDFC Super Saver Income Fund - Short Term
(IDFC-SSIF-ST), IDFC Cash Fund (IDFC-CF), IDFC Money Manager Fund -
Treasury Plan (IDFC-MMF-TP), IDFC Money Manager Fund - Investment
Plan(IDFC – MMF-IP), IDFC Asset Allocation Fund – Aggressive Plan (IDFC-AAF-
AP) IDFC Asset Allocation Fund – Conservative Plan (IDFC-AAF-CP), IDFC Asset
Allocation Fund – Moderate Plan (IDFC-AAF-MP), IDFC Dynamic Bond Fund
(IDFC – DBF) are names of the Schemes and do not in any manner indicate either
the quality of the Schemes, their future prospects or returns. The Sponsor or any of
its associates is not responsible or liable for any loss resulting from the operation of the
Schemes beyond the corpus of the Trust of Rs. 30,000/-. Terms of Issue & Load
Structure: IDFC-CEF, IDFC-IEF, IDFC NF IDFC-PEF, IDFC-AF, IDFC - EF, IDFC-APF, IDFC-
SMEF, IDFC-SS(50-50)-EF,IDFC – IF, IDFC-IGGF, IDFC-SSIF (IP), IDFC-SSIF (MT), IDFC
TA( ELSS ) IDFC-SSIF (ST), IDFC-CF,IDFC-MMF-TP,IDFC-MMF-IP,IDFC-AAF-AP IDFC-
AAF-CP, IDFC-AAF-MP, IDFC-DBF: During the continuous offer the AMC calculates and
publishes NAVs and offers for sale and redemption of units of the Scheme on all Business
days . Entry Loads – Nil for all the schemes. Exit Load - For all the equity schemes (other
than IDFC Arbitrage Fund, IDFC Arbitrage plus Fund and ELSS Schemes of IDFC): All
investment including SIP/STP/Micro SIP/STP/FOF if redeemed / switched out within 365
days from the date of allotment-1%. No Entry Load/ Exit Loads/CDSC shall be chargeable
in case of switches made between different options of the scheme. IDFC-AF - (Plan A &
Plan B): is an Open Ended Equity scheme. 0.25% if redemption / switch is requested within
30 days from the date purchase during on going period. IDFC-APF - (Plan A & Plan B):
0.50% of NAV on investors who purchase / switch and seek to redeem / switch out such
investments within 365 days from the date of effecting such purchase / switch in. IDFC-
SMEF: The scheme is converted into open ended scheme w.e.f. September 11, 2009. After
then during the Ongoing Offer Period load will be charged as follows: If redeemed within 1
year from the date of purchase(s) applying First in First out basis (including purchase
made through the STP/SIP) -1.00%.No exit load /CDSC will be chargeable in case of
switches made between different options of the schemes IDFC Tax Advantage (ELSS)
Fund: Nil. India IDFC-SSIF Investment Plan (IP) – Plan A Plan B, plan C & Plan F - 1% of NAV
on investors who purchase / switch and seek to redeem / switch out such investments
within 365 days from the date of effecting such purchase / switch in. Investors opting for
PEP / Dividend reinvestment option / SWP or switch between options within the plan will not
be levied an exit load. IDFC –DBF (Plan A & Plan B):-Nil, IDFC-SSIF Medium Term Plan
(MT) Plan A , Plan B& Plan F: 0.25% of NAV on investors who purchase / switch and seek to
redeem / switch out such investments within one month from the date of effecting such
purchase / switch in. Investors opting for PEP / Dividend reinvestment option / SWP or
switch between options within the plan will not be levied an exit load(w.e.f July 25, 2011).
IDFC-SSIF Short Term Plan (ST) – Plan A, B, C, D & F: 0.50% of NAV on investors who
purchase / switch in and seek to redeem / switch out such units within 6 months from the
date of effecting such purchase / switch in. Investors opting for PEP / Dividend
reinvestment option / SWP or switch between options will not be levied an exit load. (with
participating in and benefiting from growth in Indian infrastructure and infrastructural
related activities. However, there can be no assurance that the investment objective of the
scheme will be realized. IDFC - SSIF-IP: Seek to generate stable returns by creating a
portfolio that is invested in good quality fixed income and money market securities.
However there is no assurance that the investment objective of the scheme will be realized.
IDFC TA (ELSS): The investment objective of the Scheme is to seek to generate long term
capital growth from a diversified portfolio of predominantly equity and equity related
securities. There can be no assurance that the investment objective of the scheme will be
realized. IDFC – NF: The investment objective of the scheme is to replicate the S&P CNX
Nifty Index by investing in securities of the CNX Nifty Index in the same
proportion/weigtage. However, there is no assurance or guarantee that the objectives of
the scheme will be realized and the scheme does not assure or guarantee any returns.
IDFC-SSIF-MT: Seek to generate stable returns with a low risk strategy by investing in good
quality fixed income securities and money market securities. However there is no
assurance that the investment objective of the scheme will be realized. IDFC-SSIF-ST:
Seek to generate stable returns with a low risk strategy by investing in good quality fixed
income securities and money market securities. However there is no assurance that the
investment objective of the scheme will be realized. IDFC-CF: IDFC-CF is an open-ended
liquid fund with an objective to generate optimal returns with high liquidity by investing in
high quality money market and debt instruments. However there is no assurance that the
investment objective of the scheme will be realized. IDFC-MMF-TP& IDFC-MMF-IP: Seek
to generate stable returns with a low risk strategy by creating a portfolio that is substantially
invested in good quality floating rate debt or money market instruments, fixed rate debt or
money market instruments swapped for floating returns and fixed rate debt and money
market instruments. However there is no assurance that the investment objective of the
scheme will be realized. IDFC-AAF-AP, IDFC-AAF-CP, and IDFC-AAF-MP: The primary
objective of Scheme is to generate capital appreciation through investment in different
mutual fund schemes primarily local funds based on a defined asset allocation model.
However, there can be no assurance that the investment objective of the scheme will be
realized. The recurring expense of the scheme is in addition to the expenses of the
schemes in which the Fund of Fund scheme makes investment. IDFC MIP: The primary
objective of Scheme is to generate regular returns through investment primarily in debt
securities. The secondary objective of the Scheme is to generate long-term capital
appreciation by investing a portion of the Scheme's assets in equity securities. Monthly
Income is not assumed and the same is subject to availability of distributable surplus. IISL
Disclaimer: “S&P®” and “Standard and Poor's®” are trademarks of the McGraw-hill
Companies, Inc. (“S&P”), and have been licensed for use by India Index Services &
Products Limited in connection with the S&P CNX Nifty Index. “The Product is not
sponsored, endorsed, sold or promoted by India Index Services & Products Limited ("IISL")
or Standard & Poor's, a division of The McGraw-Hill Companies, Inc. ("S&P"). Neither IISL
nor S&P makes any representation or warranty, express or implied, to the owners of the
Product or any member of the public regarding the advisability of investing in securities
generally or in the Product. Please read the full Disclaimers in relation to the S&P CNX Nifty
Index in the Offer Document / Prospectus / Information Statement." Statutory Details:
IDFC Mutual Fund has been set up as a trust by Infrastructure Development Finance
Company Limited (IDFC) (liability restricted to corpus of Trust of Rs. 30,000) with IDFC
AMC Trustee Company Ltd as the trustee and IDFC Asset Management Company Ltd as
the investment manager. Investors in the scheme(s) are not being offered any guaranteed
or assured rate of return. Copy of Scheme Information Document and Key Information
Memorandum along with application form for all the schemes may be obtained from the
office of IDFC Mutual Fund, One India Bulls Centre, 841, Jupiter Mills Compound, Senapati
Bapat Marg,, Elphinstone Road, (West), Mumbai 400 013. Contact 1-800-226622 for
details.
For details please read the respective Scheme Information Document (SID)
(including those of FMPs)/ Offer Document (OD) / Statement of Additional
Information (SAI) carefully before investing.
effect from March 01, 2011) IDFC –CF – Plan A & Plan B; Nil. IDFC MMF TP (Plan A, Plan
B, Plan C, Plan D & Plan F) –Nil, IDFC-MMF-IP-(Plan A, Plan B & Plan F): Exit Load for all
investment including SIP/Micro SIP/STP shall be 0.25% of the applicable NAV if
redeemed / switched out within One Month from the date of allotment. (with effect from
March 01, 2011), IDFC NF: NIL(w.e.f July 25, 2011). IDFC-AAF-AP, IDFC-AAF-CP, and
IDFC-AAF-MP: 1.50% of the NAV shall be applicable if investors who redeem / switch out
such investments within months from the date of subscription applying First in First Out
basis, (including investments through SIP/STP). Switches between Plans (within the
scheme) shall not attract load. IDFC-IF: 1% if redeemed within 365 days from the date of
allotment/investment. Investment Objective: IDFC – CEF: The investment objective of
the scheme is to seek to generate long term capital growth from a diversified portfolio of
predominantly equity and equity related instruments. However there is no assurance that
the investment objective of the scheme will be realized. IDFC-IEF: The investment
objective of the Scheme is to seek to generate capital appreciation and/or provide
income distribution from a portfolio of predominantly equity and equity related
instruments. There is no assurance or guarantee that the objectives of the scheme will be
realized. IDFC-PEF: The Scheme shall seek to generate long-term capital growth from an
actively managed portfolio of predominantly equity and equity related instruments.
However there is no assurance that the investment objective of the scheme will be
realized. IDFC-AF & IDFC APF: The investment objective of the Scheme is to generate
capital appreciation and income by predominantly investing in arbitrage opportunity in
the cash and the derivative segments of the equity markets and the arbitrage opportunity
available within the derivative segments and by investing the balance in debt and money
market instruments. However there is no assurance that the investment objective of the
scheme will be realized. The recurring expense of the scheme is in addition to the
expenses of the schemes in which the Fund of Fund scheme makes investment.IDFC-
EF: The investment objective of the scheme is to seek to generate capital growth from a
portfolio of predominantly equity and equity related instruments (Including Equity
derivatives). The scheme may also invest in debt and money market instruments to
generate reasonable income. However there is no assurance that the investment
objective of the scheme will be realized. IDFC-SMEF: The investment objective of the
Scheme is to seek to generate capital appreciation from a diversified portfolio of equity
and equity related instruments. The Scheme will predominantly invest in small and
midcap equity and equity related instruments. Small and Midcap equity and equity
related instruments will be the stocks included in the CNX Midcap index or equity and
equity related instruments of such companies which have a market capitalization lower
than the highest components of CNX Midcap Index. The Scheme may also invest in stock
other than mid cap stocks (i.e. in stocks, which have a market capitalization of above the
market capitalization range of the defined small midcap stocks) and derivatives. On
defensive consideration, the Scheme may also invest in debt and money market
instruments. However there is no assurance that the investment objective of the scheme
will be realized. IDFC-SS (50-50)-EF: The investment objective of the scheme is to seek to
generate long-term capital appreciation by investing in Equity and Equity related
instruments. The investment objective of the fund shall be achieved by investing up to fifty
percent of the assets of the scheme in a chosen sector (sector specific exposure) while
the balance amount may be invested in companies across market capitalizations and
across sectors (diversified exposure). The scheme may also invest in debt and money
market instruments. There is no assurance or guarantee that the objectives of the
scheme will be realized and the scheme does not assure or guarantee any returns.. IDFC
–IGGF: The investment objective of the scheme is seek to generate long term capital
appreciation by investing in Equity and Equity related instruments. The scheme aims to
capture the growth in India's Gross Domestic Product (GDP). The scheme would
endevour to represent the growth in GDP by capturing the growth in the constituents of
the GDP. The scheme may also invest in Debt and money market instruments. There is no
assurance or guarantee that the objectives of the scheme will be realized and the scheme
does not assure or guarantee any returns. IDFC-IF: The investment objective of the
scheme is to seek to generate long-term capital growth through an active diversified
portfolio of predominantly equity and equity related instruments of companies that are
Risk Factors

This p
age is
inten
tiona
lly lef
t blan
k

A rejection can cost you dear!
R E J E C T E D
Rejection is not something most of us take lightly, be it in any walk of life.
The same holds true while investing.
Our records point out that most of the rejected applications are for the simple reason of oversight.
Most of the times it is the inconsistency in entering the data, that proves to be the stumbling block.
And what does it result in? You stand not only to lose the time & effort, but also the investing opportunity because sometimes the financial markets don’t wait
for you to correct the mistakes.
Important Tips to ensure successful SIP.
You need to fill 2 forms. a) Common Application Form ( CAF ) and b) SIP Forms.
The SIP start date and End date should tally in the CAF and SIP Form.
The SIP Frequency should be the same across all forms.
The Scheme Name and the SIP amount should tally in both forms.
Mandatory to state the 9 digit MICR code. It is on the basis of this that your bank account is correctly debited.
Your signature is needed in 2 places in the Mandate Form for ECS viz. below the Signatures section & Authorization of the Bank Account Holder.
Please do submit a copy of the cheque along with the Mandate form for ECS at the time of subscription.
In case you change your bank account no, please do let us know else your SIP will be rejected. Please keep sufficient balance in your bank account on SIP due date.
In case of any overwriting in the ECS/ Standing Instruction Form, please ensure the same is authenticated by your Signature.
In case of “Payable at par cheques”, please check with your bank for the branch MICR code.
Note: Form #2 (HDFC/ SCB Standing Instructions) & Form #3 (Mandate Form for ECS) will be sent to your bank to process your request. Therefore, it is essential that
you update all your information correctly to avoid your request being rejected by your bank.
?
?
?
?
?
?
?
?
?
?
Please Turn Overleaf for Contact Details.
[email protected]. www.idfcmf.com
IDFC AMC OfficesWESTAhmedabad : Ground Floor, Zodiac Avenue, Opp. Mayor’s Bunglow, Near Law Garden, Ahmedabad - 380 006. Tel.: +91-79-64505881/ 5857.Bhopal : Plot No. 49, First Floor, Above Tata Capital Limited, M P Nagar, Zone II, Bhopal [M.P.] - 462011Goa : Advani Bussiness Centre, Neelkamal Arcade, A. B. Road, Panjim, Goa - 403 001.
Tel.: +91-832-6650403, Fax: +91-832-6650310. Mobile: +91-9823289903.Indore : 405, 4th Floor, 21/ 1, D. M. Tower, Race Course Road, Indore - 452 001. Tel.: +91-731-4206927/ 4208048. Fax: +91-731-4206923.Mumbai : 17/18, 3rd Floor, Vasvani Mansion, 120, Dinshaw Vachha Road, Opp. K. C. College, Churchgate,
Mumbai - 400 020. Tel.: +91-22-22876419.Mumbai (Thane) : Shop No. 25, Rajdeep Society, Gokhale Road, Opp. Income Tax Office, Thane (West) - 400 602.Nagpur : Fortune Business Centre, First Floor, 6, VasantVihar, W. H. C. Rd., Shankar Nagar, Nagpur - 440 010. Tel.: +91-712-6451428/ 2525657.Nashik : Kavita Complex, 2nd Floor, Madan Services, Near Big Bazar, College Road, Nasik - 422 005. Mobile: +91-9970625856.Pune : 1st Floor, Dr. Herekar Park Building, Next to Kamala Nehru Park, Off. Bhandarkar Road, Pune - 411 004. Tel.: +91-20-66020965/ 4.Raipur : 227-228, 2nd Floor, Lalganga Shopping Mall, G. E. Road, Raipur - 492 001. Mobile: +91-9926908790.Rajkot : “Star Plaza”, 2nd Floor, Office No. 201, Phulchab Chowk, Rajkot - 360 001. Tel.: +91-281-6626012.Surat : U 15/16, Jolly Plaza, Athvagate, Surat - 395 001. Tel.: +91-261-2475060, 2475070.Vadodara : Ground Floor, Akash Ganga Complex, Adjacent to Vanijya Bhavan, Race Course Circle, Vadodara - 390 007. Tel.: +91-265-6620919/ 39.
NORTHAgra : 9/4, Shanker Point Ground Floor, Near Income Tax Building, Sanjay Place, Agra-282002, Tel.:+915624064889Amritsar : 6-FUF, 4th Floor, Central Mall, 32, Mall Road, Amritsar - 143 001. Mobile: 09356126222, Tel.: +91-183-5030393.Chandigarh : SCO 2475-76, 1st Floor, Sector 22, Chandigarh - 160 022. Tel.: +91-172-5071918/ 19/ 21/ 22, Fax: +91-172-5071918.Dehradun : C/o. EBD BUSINESS CENTRE, Cubicle No. 3, 49, Rajpur Road, Dehradun - 248 001. Mobile.: +91-8859222287, Tel: 2650373 extension-29Jaipur : G-7, G-8, Anukampa Towers, Church Road, Jaipur - 302 001. Tel.: +91-141-5105797, 5105798.Jalandhar : 1st floor, Satnam Complex, BMC Chowk, G.T.Road, Jalandhar-144001. Punjab-India. Tel.: 01815018264/ 01815061378/ 88.Kanpur : Office No. 214-215, IInd Floor, KAN Chambers, 14/113, Civil Lines, Kanpur - 208 001. Tel.: +91-512-2331071, 2331119.Lucknow : Flat No. 2, 1st Floor, SAS House, 6B, Tej Bhadur Sapru Marg, Lucknow - 226 001.
Tel.: +91-522-3056900/ 01/ 02/ 03/ 04/ 05.Fax: +91-522-3056900.Ludhiana : SCO 122, 2nd Floor, Feroze Gandhi Market, Ludhiana - 140 001. Tel.: +91-161-5022155, 5022156.Moradabad : +91-9837572638New Delhi : 4th Floor, NarainManzil, 23, Barakhamba Road, New Delhi - 110 001. Tel.: +91-11-47311301/ 02/ 03/ 04/ 05.Varanasi : Premise 2,3rd Floor,Kuber Complex, Rathyatra, Varanasi-221010. Tel.: 0542 - 2226527, 6540214
SOUTHBangalore : 6th Floor, East Wing, Raheja Towers, #26 & 27, M. G. Road, Bangalore - 560 001. Tel.: +91-80-66111504/ 05/ 06.Chennai : KRM Tower, 8th floor, No. 1, Harrington Road, Chetpet, Chennai - 600 031. Tel.: +91-44-45644201/ 202.Cochin : 39/3993 B2, Gr. Floor, Vantage Point, VRM Rd, Ravipuram, Cochin - 682 016. Tel: +91-484-3012639/ 4029291, Fax: +91-484-2358639.Coimbatore : Red Rose Plaza, 509 H, II Floor, D. B. Road, R. S. Puram, Coimbatore - 641 002. Tel.: +91-422-2542645, 2542678.Hyderabad : 4th Floor, Central Plaza, #6-3-902/A, Raj Bhavan Road, Somajiguda, Hyderabad - 500 082.
Tel.: +91- 40-42014646/ 47, Fax: +91-40-40037521.Madurai : Shop No 9, 2nd Floor, Ram Niwas, Door No. 279, Goodshed Street, Madurai – 625001, Tel.: +91 98943 69124Mangalore : Raj Business Centre, 3rd Floor, Raj Towers, Balmatta Road, Manglore - 575001. Tel. : +91 99010 33822Trivandrum : Cabin No.502, 5th Floor, Karimpanal Statue Avenue, G.H.Road, Statue, TRIVANDRUM-695001
(Contact No. : Raj Narayanan - 094470 48028)Visakhapatnam : Visakha Executive Centre, 47-11-1/5, Eswar Arcade, Dwarakanagar,1st Lane, Visakhapatnam-530016, Tel.:+91 9701163444
EASTBhubaneswar : Shop No. 208, 2nd Floor, Janpath Tower, Ashok Nagar, Bhubaneswar - 751 002.Guwahati : 4E, 4th Floor, Ganapati Enclave, G. S. Road, Ulubari, Opp. Bora Service Station, Guwahati - 781 007. Mobile: +91-9957568099.Jamshedpur : Room No 111, Ist Floor, Yash Kamal Complex, Main Road, Bishtupur, Jamshedpur 831001.Mobile 9431102883Kolkata : Oswal Chambers, 1st Floor, 2 Church Lane, Kolkata - 700 001. Tel.: +91-33-40171000/ 1005.Patna : 406, AshianaHariniwas, New Dakbanglow Road, Patna - 800 001. Tel.: +91-612-6510353.