fundamental analysis workshop series trading psychology ... · fundamental analysis workshop series...
TRANSCRIPT

Fundamental Analysis Workshop Series
Trading Psychology and Risk Management
Session 14
6.15PM

NUS Students’ Investment Society
DISCLOSURES & DISCLAIMERSThis research material has been prepared by NUS Invest.
NUS Invest specifically prohibits the redistribution of this material in whole or in part without the
written permission of NUS Invest.
The research officer(s) primarily responsible for the content of this research material, in whole or
in part, certifies that their views are accurately expressed and they will not receive direct or
indirect compensation in exchange for expressing specific recommendations or views in this
research material.
REVERSALPATTERNS
Q & AINTRODUCTION PRACTICE

DISCLOSURES & DISCLAIMERSNothing in this research material constitutes a representation that any investment strategy or
recommendation contained herein is suitable or appropriate to a recipient’s individual
circumstances or otherwise constitutes a personal recommendation. It is published solely for
information purposes, it does not constitute an advertisement and is not to be construed as a
solicitation or an offer to buy or sell any securities or related financial instruments.
No representation or warranty, either expressed or implied, is provided in relation to the
accuracy, completeness or reliability of the information contained herein. The research material
should not be regarded by recipients as a substitute for the exercise of their own judgement. Any
opinions expressed in this research material are subject to change without notice.
CHARTCONSTRUCTION
SUPPORT &RESISTANCE
TRENDLINES &CHANNELS
Q & ACHART TYPES PIVOTPOINTSS
REVERSALPATTERNS
Q & AINTRODUCTION PRACTICE

Profile BBA1/ARS1
Investing since 2008 – Equities, Forex, In-Game Items
FA/TA and more recently Statistical and Psychological
Analysis
First official trade – HiP International, 2008/2009
Tactical Asset Management
REVERSALPATTERNS
Q & AINTRODUCTION PRACTICE

Agenda
• What is Trading Psychology?• Case Studies• “Live Analysis” (If there’s time)
Key Takeaways:1. Know Yourself2. Know the Crowd, and be Rational3. Plan and execute the trade well.

Trading Psychology
GREED FEAR

Can you ‘see’ the Psychology?

Super Group

USD/JPY

Hypothetical Case Study
• It has been a few months and you have had -$600 in your trading position (short term )
• Recently, a piece of good news related to yourstock occurred – You find yourself profiting by$250
• It is 11 am, Singapore time, the stock is acompany listed in SGX

Risk Management
• Stop Loss and Take Profit levels• The concept of RISK• Risk management strategies – 2% vs Fixed
Dollar method• Simulation and Excel modelling as a tool.

• Osim International Ltd (BUY)• Ticker: OSIM SP
Last Closed Price: 2.2612M TP: 2.7Upside/Downside Potential: 19.48%
• Entered at 2.22, exited at 2.42, then re-entered at 2.38…then…

• Bad news: On 17/2/14 around 8pm there wasa news release regarding one of the TWGfounders suing Osim and its directors for usingcorporate actions to dilute his stake in TWGTea.
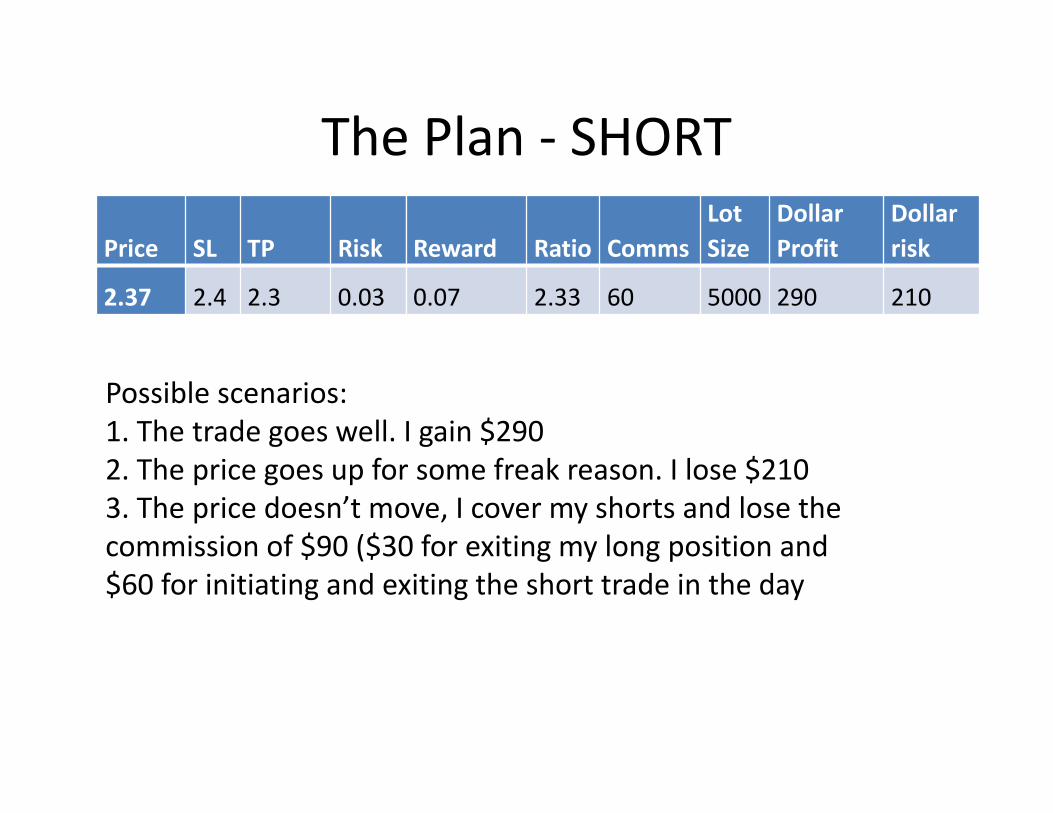
The Plan - SHORT
Price SL TP Risk Reward Ratio CommsLotSize
DollarProfit
Dollarrisk
2.37 2.4 2.3 0.03 0.07 2.33 60 5000 290 210
Possible scenarios:1. The trade goes well. I gain $2902. The price goes up for some freak reason. I lose $2103. The price doesn’t move, I cover my shorts and lose thecommission of $90 ($30 for exiting my long position and$60 for initiating and exiting the short trade in the day
What Actually Happened
• The Short order only managed to clear 2 lots or2000 shares for me.
• Detrimental because it meant I would need asteeper price drop to overcome commissions andmake a profit.
• For SGX, short sells must be covered on the sameday with a corresponding buy order equal to orexceeding the short sell amount
• Basically meant I needed a substantial drop inprice in 1 day by 5pm

The Reality
Price SL TP Risk Reward Ratio Comms Lot SizeDollarProfit
Dollarrisk
2.37 2.4 2.33 0.03 0.04 1.33 60 2000 20 120

The Exit – 1530 hrs
Price SL TP Risk Reward RatioComms
LotSize
DollarProfit
Dollarrisk
2.37 2.4 2.34 0.03 0.03 1 60
BUY
3000 30 180
In one day:
Made $30
Repositioned my Previous Long Entry from 2.38 to 2.34 (higherupside potential)
Exited long entry upon testing of resistance at 2.51 (somewhereduring Finance Midterms)

• Know yourself – are you being greedy orfearful?
• Know the crowd – are THEY being greedy orfearful?
• Have a plan• Monitor your trading plan – adjustments to
plan should be made ONLY IF NECESSARYAND IN A RATIONAL, EMOTIONLESSMANNER.

The 2 Pillars for Consistent Profits
1. Your “Hit-Rate” – How often you makewinning trades. Depends on yourtrading skills. (FA, TA, SA, etc)
2. Your Trading Psychology and MoneyManagement – How much you earnwhen you make a winning trade andhow much you lose when you make alosing trade.

Thank You!
Session Fourteen
Money Management
Puah Yong KinNUS Invest, Research Analyst

DISCLOSURES & DISCLAIMERSThis research material has been prepared by NUS Invest.
NUS Invest specifically prohibits the redistribution of this material in whole or in part without thewritten permission of NUS Invest.
The research officer(s) primarily responsible for the content of this research material, in wholeor in part, certifies that their views are accurately expressed and they will not receive direct orindirect compensation in exchange for expressing specific recommendations or views in thisresearch material.
Nothing in this research material constitutes a representation that any investment strategy orrecommendation contained herein is suitable or appropriate to a recipient’s individualcircumstances or otherwise constitutes a personal recommendation. It is published solely forinformation purposes, it does not constitute an advertisement and is not to be construed as asolicitation or an offer to buy or sell any securities or related financial instruments.
No representation or warranty, either expressed or implied, is provided in relation to theaccuracy, completeness or reliability of the information contained herein. The research materialshould not be regarded by recipients as a substitute for the exercise of their own judgement.Any opinions expressed in this research material are subject to change without notice.

Agenda• Self Introduction
• What is Money Management
• Why Money Management
• Money Management for Investors and Traders
• Summary

Profile
• Year 1 Pharmacy Student
- 1 year plus trading experience
• Trade in both Singapore and US markets
• Focused on Technical Analysis

http://www.investmentmoats.com/budgeting/earn-6000-a-month-yet-broke-at-35-years-old/

What is Money Management
• The process of budgeting, saving, investing,spending or otherwise in overseeing the cashusage of an individual

Why Money Management
• Be the master of YOUR life– Control your own finance– Streamline on spending– Savings for rainy days– Investment
• Financial Freedom– Passive Income > Active Income
Getting Started
• Clear Objectives– I want to get my own house in 8 years time
• Get Organised– Money inflow and outflow– Tracking and streamlining your expenses
• Budgeting• Savings and Investment• Continue Tracking and Modify when necessary


ExampleItems Amount budgeted
Transport $100
Food $300
Shopping $100
Birthday Presents $100
Savings $200
Investment S200
Total $1000
Example of a pharmacy scholarunder MOHH not staying inschool
Investors and Traders
• Different kind of beliefs so different moneymanagement strategies
• One thing in common– Do not put all your money in one basket– Split into at least 3 portions

Investors
Investors
• Find ROI• Dollar Cost Averaging

Rate Of Investment(ROI)
• A performance measure used to evaluate theefficiency of an investment or to compare theefficiency of a number of differentinvestments.

Dollar Cost Averaging
• The technique of buying a fixed dollar amountof a particular investment on a regularschedule, regardless of the share price.
• More shares are purchased when prices arelow, and fewer shares are bought when pricesare high.

Class Part 1
Assuming that you want to invest in CompanyABC and you have $7200, by applying dollar costaveraging, you will split your money equally intobuying shares over 3 months• Jan – Price: $1.00• Feb – Price: $0.80• Mar – Price: $ 1.20Calculate how many shares you can buy eachmonth.

Class Part 1
• Jan – 2400 shares• Feb – 3000 shares• Mar – 2000 shares
Tedious right? However…..Price Per Share = (Total Amount Invested)/(Total Number Of Shares)
= $7200/7400= $0.97
Price now is $0.97 instead of $1.00 if you choose to invest all at the start

Traders
• Cut Loss• Risk Reward Ratio• Number of shares to buy• Profit-taking• Scaling In

Cut Loss
• Cut your losses short and let your winners run.• The objective, therefore, is not to avoid losses,
but to minimize the losses.• Realizing a capital loss before it gets out of
hand separates successful traders from therest.
• 5%-8%
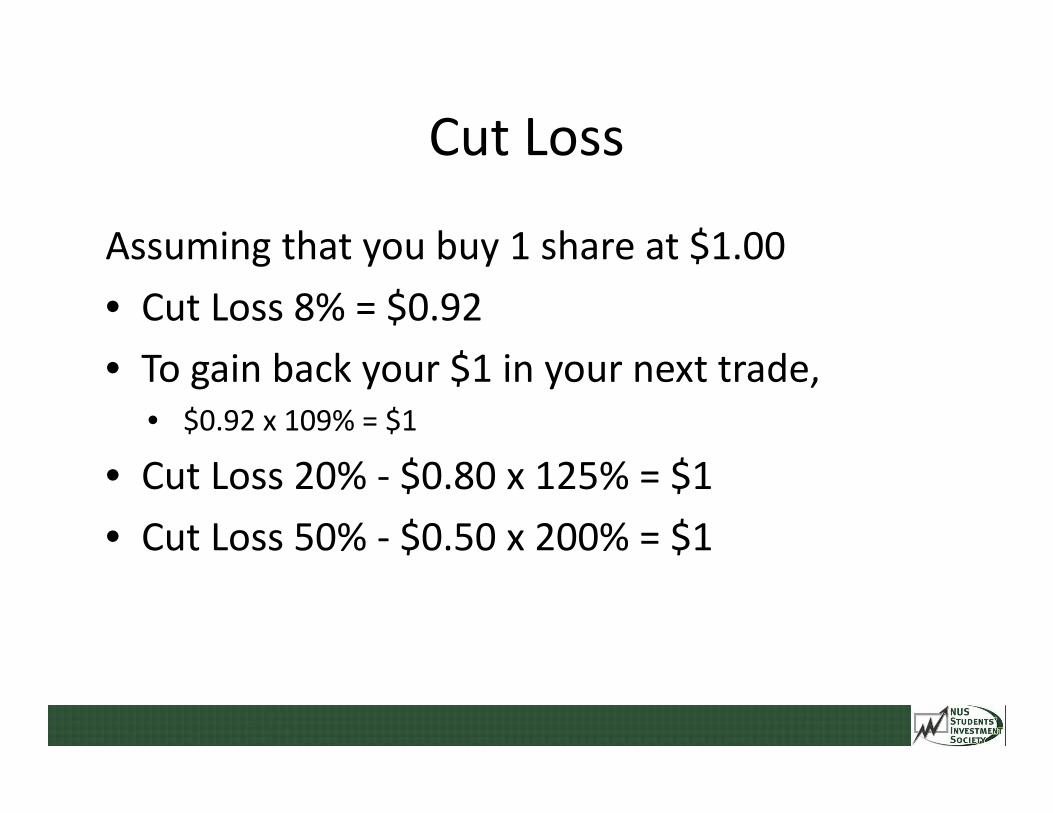
Cut Loss
Assuming that you buy 1 share at $1.00• Cut Loss 8% = $0.92• To gain back your $1 in your next trade,
• $0.92 x 10⁹% = $1
• Cut Loss 20% - $0.80 x 125% = $1• Cut Loss 50% - $0.50 x 200% = $1

Risk Reward Ratio(RRR)
• A ratio used by many investors to compare theexpected returns of an investment to theamount of risk undertaken to capture thesereturns.
• RRR 1:n, (n>2)
RRR = Amount Risked : Returns Expected

Number of Shares to Buy
• Calculate the number of shares you can buyusing the amount of money you are risking inthe trade and not by expected returns
Number of Shares to buy= Amount at risk/(Buy Price – Cut Loss Price)

Class Part 2
Price of ABC stock is at $1.20 per share now.Given that your risk is $300 and you practice 5%cut loss level, how many shares can you buy?
Number of Shares to buy = $300/(0.05 x $1.20)= 5000

Scaling In
• Art of increasing your profits
Risk Reward Ratio = 1:3
Assuming the amount you risk is $100,Number of Shares to buy = $100/$0.10
= 1000 shares
Total Cost of Investment = $1 x 1000= $1000
Target Price - $1.30
Current Price - $1.00
Cut Loss - $0.90
Profits = $1.30 x 1000 - $1000 = $300

Scaling In
Cut Loss - $0.90
Price Bought - $1.00
End of 1st Day Price - $1.10
Profits after end of 1st Day = $100
Scaling in,Number of Shares to buy = $100/$0.10
= 1000 shares
Cut Loss now set at $1.00=> Risk = $0

Scaling In
Cut Loss - $0.90
Price Bought - $1.00
Price Bought - $1.10
End of 2nd Day Price - $1.20
Profits after 2nd Day = $300
Scaling In,Number of Shares to Buy = $100/$0.10
= 1000 shares
Cut Loss now = $1.10=> Risk = $0

Scaling In
Target Price - $1.30
Price Bought - $1.00, 1000 shares
Cut Loss - $0.90
Price Bought - $1.10, 1000 shares
Price Bought - $1.20, 1000 shares
Profits on Day 3 = $300 + $200 + $100 = $600

Scaling In
• Advantages– Increase your profit margin– Risk is reduced
• Disadvantages– Need capital– Incur more brokerage commission
Summary
• Money Management– What and Why
• Getting Started• Money Management
– Investors– Traders
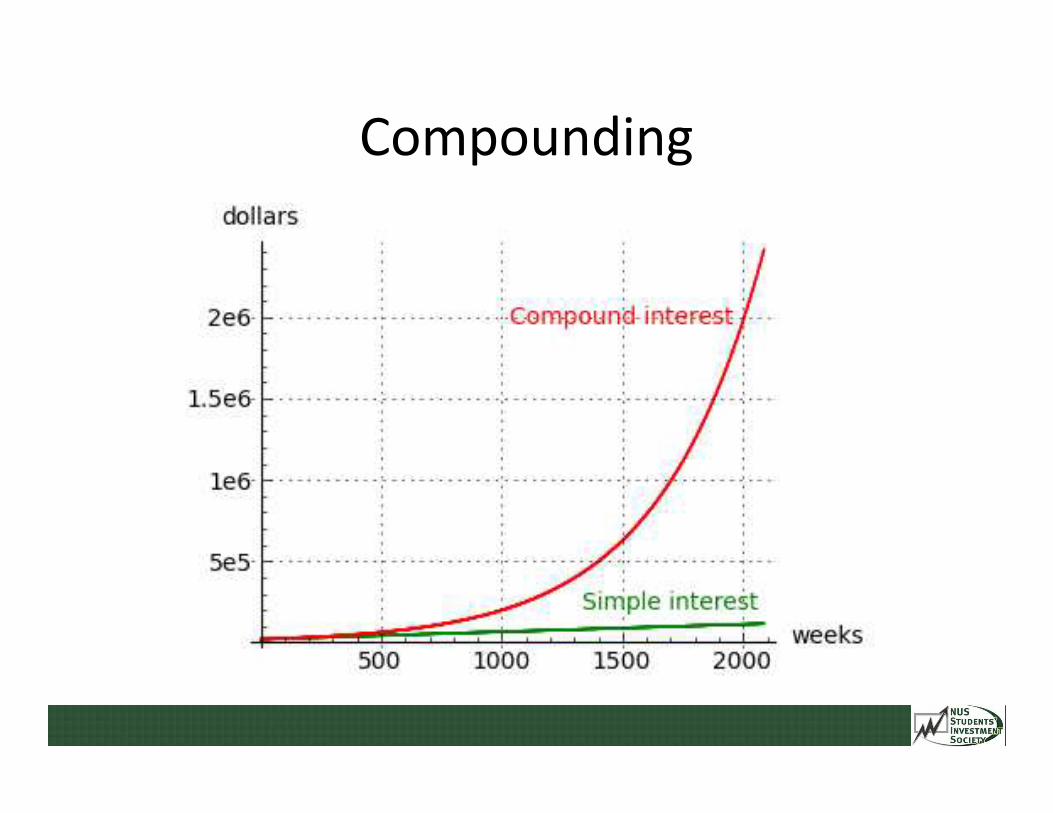
Compounding
