fundamental properties of afro-american hair as related to ... · i would also like to gratefully...
TRANSCRIPT

Fundamental propertiesof Afro-American hair
as related to theirstraightening/relaxing behaviour
Von der Fakultät für Mathematik, Informatik und Naturwissenschaften derRheinisch-Westfälischen Technischen Hochschule Aachen
zur Erlangung des akademischen Grades eines Doktorsder Naturwissenschaften genehmigte Dissertation
vorgelegt von
Diplom-Chemikerin
Jutta Maria Quadflieggeb. Bußmann
aus Dortmund
Berichter: Prof. Dr. Hartwig HöckerProf. Dr. Franz-Josef Wortmann
Tag der mündlichen Prüfung: 05. September 2003
Diese Dissertation ist auf den Internetseiten der Hochschule online verfügbar.


Für Joachim
Für Joachim


"The secret of patience: Do something else in the meantime."
Detlev Rossilyo [American philosopher, born 1942]
"The secret of patience: Do something else in the meantime."
Detlev Rossilyo [American philosopher, born 1942]


Acknowledgements I would like to thank Prof. Dr. Dr. h.c. Hartwig Höcker for making this thesis possible and for his friendly support. I am indebted to my outstanding supervisor Prof. Dr. Franz-Josef Wortmann for critically reading the manuscript and letting me do exercises in patience. Special thanks go to Prof. Dr. Dr. h.c. mult. Helmut Zahn for intensive discussions about hair. I would also like to gratefully acknowledge Namasté Laboratories L.L.C. for the financial support of the project and especially Mr. Gary Gardner for being always very interested and supportive for my work. This thesis would hardly have become possible without the critical and creative discussions with Dr. Leszek Wolfram. I thank Dr. Hô Phan and Franz Steffens for preparing the electron microscopic pictures. Moreover, I would like to give thanks to Dr. Carla Sanchez Scanavez de Paula for letting me use her SEM pictures. In great recognition of his service in performing amino acid analyses I would like to mention Dr. Josef Föhles. I would like to thank Dr. Rebecca Elliott for reducing my worst offences against the English language. I am very grateful to all members of “Alte Bibliothek”. They made a big contribution for me enjoying the time at DWI. A very special thank goes to my beloved parents Franz-Josef and Barbara Bußmann for their support in any situation. Finally, I am filled with a deep sense of gratitude to my beloved husband Joachim Quadflieg. Without him I would not have come as far as I am now.
Acknowledgements I would like to thank Prof. Dr. Dr. h.c. Hartwig Höcker for making this thesis possible and for his friendly support. I am indebted to my outstanding supervisor Prof. Dr. Franz-Josef Wortmann for critically reading the manuscript and letting me do exercises in patience. Special thanks go to Prof. Dr. Dr. h.c. mult. Helmut Zahn for intensive discussions about hair. I would also like to gratefully acknowledge Namasté Laboratories L.L.C. for the financial support of the project and especially Mr. Gary Gardner for being always very interested and supportive for my work. This thesis would hardly have become possible without the critical and creative discussions with Dr. Leszek Wolfram. I thank Dr. Hô Phan and Franz Steffens for preparing the electron microscopic pictures. Moreover, I would like to give thanks to Dr. Carla Sanchez Scanavez de Paula for letting me use her SEM pictures. In great recognition of his service in performing amino acid analyses I would like to mention Dr. Josef Föhles. I would like to thank Dr. Rebecca Elliott for reducing my worst offences against the English language. I am very grateful to all members of “Alte Bibliothek”. They made a big contribution for me enjoying the time at DWI. A very special thank goes to my beloved parents Franz-Josef and Barbara Bußmann for their support in any situation. Finally, I am filled with a deep sense of gratitude to my beloved husband Joachim Quadflieg. Without him I would not have come as far as I am now.


Table of contents
I
Table of contents I
Summary V
List of abbreviations X
1. Objectives of the investigation 1
2. Introduction 4
2.1. Human hair 4
2.1.1. Structure of hair 4
2.1.1.1. The cuticle 5
2.1.1.2. The cell membrane complex 6
2.1.1.3. The cortex 7
2.1.1.4. Cross-links in the proteins of hair 9
2.1.2. Origin of curls in Afro hair 10
2.2. Hair straightening/relaxing 13
2.2.1. Thermal straightening – hair pressing 13
2.2.2. Chemical hair straightening 14
2.2.2.1. Differences between hair straightening and relaxing 14
2.2.2.2. The chemistry of hair straightening 15
2.2.2.3. The history of hair relaxing 17
2.2.2.4. The chemistry of hair relaxing 18

Table of contents
II
3. Results and discussion 19
3.1. Investigations of hair cross-sections 19
3.1.1. Introduction 19
3.1.2. Influences of age and gender 21
3.1.3. Comparison of pigmented and non-pigmented Afro hair 24
3.2. Comparison of Afro, Asian and Caucasian hair 26
3.2.1. Characterization of hair samples 27
3.2.2. Hair treatments 29
3.2.3. Quality of the hair samples after treatment 30
3.2.3.1. Surface quality of the hair 30
3.2.3.1.1. Scanning electron microscopy 30
3.2.3.1.2. Gloss measurements 33
3.2.3.2. Amino acid composition 36
3.2.3.3. Thermal properties 51
3.3. Evaluation of hair straightening efficacy 60
3.3.1. Relaxer creams 60
3.3.2. Treatments 60
3.3.3. Procedure for single hair relaxing 61
3.3.4. Results of single hair relaxing 63
3.3.4.1. Comparison of simulated and natural Afro hair 63
3.3.4.2. Comparison of different treatments of natural Afro hair 67
3.4. Study of hair relaxing 71
3.4.1. Kinetics of cystine degradation 71
3.4.2. Quality of the hair after modified relaxer treatments 74
3.4.2.1. Amino acid composition 74
3.4.2.2. Thermal properties 87

Table of contents
III
3.5. Permanent waving of relaxed hair 96
3.5.1. Performing single hair waving 96
3.5.2. Quality of hair after treatment 99
3.5.2.1. Waveability of hair 99
3.5.2.2. Amino acid composition 105
3.5.2.3. Thermal properties 109
3.6. Swelling and diffusion 114
3.6.1. Experimental aspects 114
3.6.2. Analysis of swelling 115
3.6.3. Analysis of diffusion 123
4. Experimental part 135
4.1. Materials 135
4.1.1. Hair 135
4.1.2. Chemicals 136
4.2. General experimental techniques and analyses 137
4.2.1. Devices 137
4.2.2. Cross-section determination 137
4.2.3. Scanning electron microscopy 138
4.2.4. Gloss determination 138
4.2.5. Amino acid analysis 138
4.2.6. HP-DSC measurements 138
4.2.7. Determination of hair straightening efficacy 139
4.2.8. Ring test 139
4.2.9. Diffusion and swelling measurements 140

Table of contents
IV
4.3. Treatment of hair 141
4.3.1. Preparation and pre-treatment of hair 141
4.3.2. Relaxing treatment with commercial products 141
4.3.3. Permanent waving treatments 142
4.4. Statistical Annotations 143
4.4.1. Introduction 143
4.4.2. Description of a population and sample 144
4.4.3. t-Test for independent samples 146
4.4.4. Simple linear regression 147
4.4.5. General linear model 148
5. References 149

Summary
V
Summary
The aim of this thesis is to improve the current understanding of straightening
processes in Afro hair by alkaline treatment. It is therefore fundamentally
important to gain a more detailed insight into the properties of Afro-American
hair.
The geometry of Afro hair has been initially investigated.
• Apparent diameter of Afro-American hair is dependent on gender. An
apparent diameter of 73.3 ± 6.2 µm has been found for male, and 59.4 ± 7.6
µm for female Afro-American hair.
• Ellipticity and apparent diameter of pigmented and non-pigmented hair of a
single Afro-American hair sample differ significantly.
Furthermore, differences between Caucasian, Asian and Afro hair, with respect
to their morphology, chemical composition, and thermal properties, have been
evaluated after various treatments such as perming and relaxing, and
combination of these treatments.
• Scanning electron microscopy studies, as well as luster measurements,
showed no significant changes of the surface after these treatments.
• Amino acid analysis of treated hair leads to the conclusion that dehydro-
alanine residues, which are generated upon alkaline relaxing of hair, are quite
stable. They are converted with cysteine residues to form lanthionine cross-
links. Lanthionine residues occur with a higher frequency after perming
treatment of relaxed hair.
• The thermal properties of hair show that relaxer treatments result in a greater
loss of helical content in hair than perming treatments. Furthermore, the loss
of helical domains is not only dependent of degradation of cystine. The
keratin associated proteins of the matrix are strongly affected by relaxing
treatments. Subsequent perming leads on the one hand to a further loss of
helical domains, on the other hand to an increase of denaturation temperature.
Summary
V
Summary
The aim of this thesis is to improve the current understanding of straightening
processes in Afro hair by alkaline treatment. It is therefore fundamentally
important to gain a more detailed insight into the properties of Afro-American
hair.
The geometry of Afro hair has been initially investigated.
• Apparent diameter of Afro-American hair is dependent on gender. An
apparent diameter of 73.3 ± 6.2 µm has been found for male, and 59.4 ± 7.6
µm for female Afro-American hair.
• Ellipticity and apparent diameter of pigmented and non-pigmented hair of a
single Afro-American hair sample differ significantly.
Furthermore, differences between Caucasian, Asian and Afro hair, with respect
to their morphology, chemical composition, and thermal properties, have been
evaluated after various treatments such as perming and relaxing, and
combination of these treatments.
• Scanning electron microscopy studies, as well as luster measurements,
showed no significant changes of the surface after these treatments.
• Amino acid analysis of treated hair leads to the conclusion that dehydro-
alanine residues, which are generated upon alkaline relaxing of hair, are quite
stable. They are converted with cysteine residues to form lanthionine cross-
links. Lanthionine residues occur with a higher frequency after perming
treatment of relaxed hair.
• The thermal properties of hair show that relaxer treatments result in a greater
loss of helical content in hair than perming treatments. Furthermore, the loss
of helical domains is not only dependent of degradation of cystine. The
keratin associated proteins of the matrix are strongly affected by relaxing
treatments. Subsequent perming leads on the one hand to a further loss of
helical domains, on the other hand to an increase of denaturation temperature.

Summary
VI
• Caucasian and Asian hair respond to the different treatments in a very similar
way. However, Afro hair is considerably more affected by the treatments.
This can be traced back to its smaller diameter (56 µm) compared to
Caucasian (77 µm) or Asian (84 µm) hair. It is assumed that Afro hair is more
rapidly penetrated by alkali, and thus a greater damage of the fiber occurs.
In addition, a detailed study to properties of “simulated” Afro hair has been
made. Hair companies sell simulated Afro hair (so-called “Afro hair – kinked”).
This hair is actually Asian hair, which has been crimped using steam /29/. Part
of this work evaluates the extent to which the properties of this modified Asian
hair resemble those of natural Afro hair, so that the results obtained may be
realistically transferred.
• Whereas simulated Afro hair behaves chemically and thermally like the other
hair samples during perming treatments, it is more significantly affected by
relaxing treatments. Furthermore, simulated Afro hair shows more rapid
straightening than natural Afro hair does. Hence, the cosmetic research
companies are advised against using simulated Afro hair as a model for
natural Afro hair.
Besides these topics, the straightening efficacy of modified relaxer creams (pure
creams and creams containing added thioles) on Afro hair has been investigated.
• A test method has been developed, using single hairs, to determine the
straightening effect of relaxer creams. The time-depending straightening
effect can be described by a pseudo first-order kinetics function. The model
includes a time lag. This induction period has been associated with the
structure of hair. The cuticle act as a natural barrier for chemicals.
• Faster straightening has been measured at pH 12.9 than at pH 12.5. Addition
of thioles to the relaxer creams (1 % w/w TGA or cysteine) straightens hair
considerably faster than pure relaxer creams do. Addition of TGA causes an
even faster straightening than the addition of cysteine. However, the hair
becomes softer and is more susceptible to breakage when TGA is used.

Summary
VII
A further chapter deals with the chemical and thermal properties of modified
relaxed hair.
• The degradation of cystine is dependent on relaxing time, and follows first-
order kinetics for Caucasian and Afro hair.
• The straightening effect is mainly based on the cleavage of disulfide bridges
which are either reduced to Cysteine (especially in the presence of additional
thioles), or form dehydroalanine. Most of the generated dehydroalanine reacts
to with cysteine to produce lanthionine. A portion of dehydroalanine remains
in the hair after relaxing.
• Formation of lanthionine is not primary requirement for permanent hair
straightening.
• The mechanism of the alkaline degradation of cystine is not dependent on pH,
but on the compostion of the relaxer creams. Additional thioles cleave cystine
even under alkaline conditions and thus reduce the extent to which
β-elimination of cystine by alkali takes place. Within the same time pure
relaxer creams induce more degradation of cystine than thiole containing
creams.
• For straightening effects between 5 and 80 %, a nearly linear relationship
between loss of denaturation enthalpy and degree of straightening is found.
• The non-helical domains of the outer area of the fiber (cuticle) are more
affected by an alkaline treatment than the non-helical domains of the inner
area, which is shown by the change of denaturation temperatue.
The possibility to perm hair after relaxing, and the chemical and thermal
changes caused upon perming have been investigated.
• The longer the duration of relaxer cream treatment, and thus the more
straightened the hair fibers are, the less effectively the hair can be
subsequently permed. The dependence of waveability on a prior obtained
straining effect can be mathematically described.
Summary
VIII
• The additional degree of damage of relaxed hair caused by the permanent
waving corresponds to the degree of damage associated with perming
treatments alone.
• The greater the extent of cystine reduction that occurs during relaxing
treatment, the better is the perm set of hair.
In summary, besides a more rapid straightening of hair, the presence of thioles
during the relaxing process leads subsequently to a better waveability of hair.
This effect is more significant for TGA compared with cystine as the additional
thiole. However, such relaxed hair is softer and has to be handled with the great
care.
The last chapter contains results about the swelling of hair at high pH, and
diffusion of alkaline solution and thioles (TGA or cysteine) into iodid-dyed hair
fiber, which is recorded as a result of the visible color change.
• Swelling of hair follows pseudo-first order kinetics at pH 12.4 and 12.8, and
is related to the proportion of broken disulfide bridges. Thiole containing
solutions at pH 12.8, and the solution at pH 13.4, do not show a first-order
relationship. This is associated with the additional cleavage of disulfide
bridges by thioles, and increasing hydrolysis of protein chains by alkali,
respectively.
• A sharp front between the colorless outer area and the colored inner area of
the fiber was observed, and is attributed to the penetration of alkali. Thiole
containing solutions showed two penetration fronts, the first front
representing the penetration of alkali and the second front the penetration of
thiole.
• Penetration into and swelling of the hair fiber did not always cease at the
same time.
• The higher the pH, the faster is the penetration rate.
• The penetration of thioles starts with a time lag, compared to the alkali. The
faster the rate of penetration, the shorter is the time lag.

Summary
IX
• The diffusion coefficient of thioles is not constant. The diffusion of alkali thus
does not show simple Fickian behavior.
• Occasionally, hair fibers showed different penetration rates under similar
conditions. This might be attributed to differences in degree of mechanical
pre-damage of tips and roots of hair.

Abbreviation list
X
List of abbreviations
α Turnover
a Long axis of hair fiber cross-section
a First fitting parameter of polynomial equation
AA Amino acid
AAA Amino acid analysis
b Short axis of hair fiber cross-section
b Second fitting parameter of polynomial equation
c Third fitting parameter of polynomial equation
Cys Cysteine
[CyS-SCy] Cystine concentration
CySO3H Cysteic acid
CyS-SCy Cystine
d Diameter
D Diffuse reflection
D Diffusion coefficient
dR Rod diameter
DSC Differential scanning calorimetry
E Ellipticity
err. Error
ESt Straightening effect
EST Straightening effect
Fig. Figure
GL Gloss index
GML General linear model
h Fitting parameter of exponential algorithm
∆HD Denaturation enthalpy
HP-DSC High-pressure differential scanning calorimetry

Abbreviation list
XI
HP-DTA High-pressure differential thermoanalysis
I Intensity
k Reaction rate constant
KAP Keratin associated proteins
kS Effective rate constant of perm set
L True length of hair fiber
la Extended length after treatment
Lan Lanthionine
[Lan] Lanthionine concentration
lb Extended length before treatment
LC Extent of supercontraction
lR Length of the hair ring
Lye Sodium hydroxide
Lys Lysine
LysAla Lysinoalanine
NaOH Sodium hydroxide = Lye
PW Permanent wave
r Radius
R2 Coefficient of determination
RLan Lanthionine rate
RT Room temperature
s Standard deviation
s Distance between the fiber ends of a hair ring
S Specular reflection
S% Swelling
s2 Variance
SDS Sodium dodecylsulfate
SEM Scanning electron microscopy
SP Perm set

Abbreviation list
XII
[SS] Number of intact disulfide bridges
Std. err. Standard error
t Treatment time
τ Characteristic straightening time
∆t Time lag of straightening
Tab. Table
TGA Thioglycolic acid
V Volume of the hair
WCC White cell count
X Arithmetic Mean
xt Penetration depth at time t
∆Φ Difference in power

1. Objectives of the investigation
1
1. Objectives of the investigation
The structure and chemistry of human head hair have been of great practical
interest for a long time. This particularly applies to those working in the
toiletries industry in seeking to understand the effects of topically-applied
preparations to beautify the individual. This might range from hair shampoos
and sprays through to bleaching and dyeing and to systems for re-structuring
hair.
However, in the past the main interest in hair science has been directed at the
properties of and applications for Caucasian and Asian hair. This has markedly
changed during the last decade, with a general increase of investigations directed
at Afro hair. There is a need for special formulations namely for this hair type
due to its inherent properties: Difficulty of combing, limited styling ability,
dryness and brittleness, and low tensile strength. Nevertheless, there is
comparatively little detailed knowledge of the basic properties of Afro hair and
how these relate to one of the most important ethnic cosmetic treatments, the
mechanisms of hair straightening by alkaline creams.
To reduce this gap of knowledge, the general aim of this project was to
investigate the shape of Afro hair, to examine for disparities between different
hair races and to look in depth into various aspects of the mechanism of hair
straightening, also referred to as relaxing.
The first objective of this project was to study the size and shape of hair. The
common approach for the analysis of these properties is the investigation of hair
cross-sections. Investigations of the dependence of diameter and ellipticity on
gender and age of the hair owner were a good starting point for the current
investigations. Furthermore, differences between pigmented and non-pigmented
hair were of interest.
1. Objectives of the investigation
1
1. Objectives of the investigation
The structure and chemistry of human head hair have been of great practical
interest for a long time. This particularly applies to those working in the
toiletries industry in seeking to understand the effects of topically-applied
preparations to beautify the individual. This might range from hair shampoos
and sprays through to bleaching and dyeing and to systems for re-structuring
hair.
However, in the past the main interest in hair science has been directed at the
properties of and applications for Caucasian and Asian hair. This has markedly
changed during the last decade, with a general increase of investigations directed
at Afro hair. There is a need for special formulations namely for this hair type
due to its inherent properties: Difficulty of combing, limited styling ability,
dryness and brittleness, and low tensile strength. Nevertheless, there is
comparatively little detailed knowledge of the basic properties of Afro hair and
how these relate to one of the most important ethnic cosmetic treatments, the
mechanisms of hair straightening by alkaline creams.
To reduce this gap of knowledge, the general aim of this project was to
investigate the shape of Afro hair, to examine for disparities between different
hair races and to look in depth into various aspects of the mechanism of hair
straightening, also referred to as relaxing.
The first objective of this project was to study the size and shape of hair. The
common approach for the analysis of these properties is the investigation of hair
cross-sections. Investigations of the dependence of diameter and ellipticity on
gender and age of the hair owner were a good starting point for the current
investigations. Furthermore, differences between pigmented and non-pigmented
hair were of interest.

1. Objectives of the investigation
2
Three major racial types of hair are known: Afro, Asian and Caucasian hair. The
differences between these hair types are particularly related to diameter,
geometry, crimp and color. These differences have an influence on the degree of
change and damage after a treatment. The quality/condition of the hair types
may be studied after various treatments, such as relaxing and perming as well as
after a combination of these treatments. The current investigations included the
morphology, chemical composition, and thermal properties of hair.
Since long, untreated, natural Afro hair is difficult to obtain, many hair
companies sell a substitute for it. This is Asian hair, which has been crimped
with steam. Part of this work was to investigate the correspondence between so-
called “simulated” and natural Afro hair behaviour and properties, and the extent
to which the simulated Afro hair is a suitable alternative for natural Afro hair for
experimental purposes.
Great emphasis was placed on the relaxing treatment of hair. Tightly curled hair
needs to be relaxed in order to be straightened and to improve its manageability.
To gain a better understanding of this process, the changes of the chemical and
thermal hair properties with relaxing time and straightening effect were studied.
A suitable method to determine the straightening effect was devised.
The current relaxer technology is based on pH conditions which are higher than
pH 11. It is known that during the relaxing process part of the disulfide bridges
(cystine) in hair are re-formed into a different type of cross-link (lanthionine).
This process is called lanthionization. In general, it is assumed that the
formation of lanthionine is a primary requirement for the straightening of hair
/58/. A closer look was taken at this assumption.

1. Objectives of the investigation
3
Emphasis was given to investigations of new formulations and methods for hair
styling. As most relevant approach, different thioles were added to relaxer
creams to investigate their influence on the straightening effect and on the
properties of hair after relaxing. Furthermore, it was of great interest to
determine to what extent hair could be permed after a relaxing treatment. To curl
the hair after a relaxing treatment is the favored way to obtain a desired hair
style. The quality of the hair was investigated after the relaxing and
subsequently perming treatment. The analysis concerned chemical composition
and thermal properties of hair.
The last objective of this project was to investigate the diffusion of alkali into
hair as well as its swelling under various conditions. It was of great interest to
investigate to what extent α-helcial structures remain in the inner part of the
relaxed hair. For this, hair was dyed with iodine. Diffusion of alkaline as well as
swelling of hair were recorded microscopically in real time due to the
disproportionation reaction of iodine into colorless products under strongly
alkaline condition. On the basis of this method, the kinetics of diffusion and
swelling were investigated.

2. Introduction
4
2. Introduction
2.1. Human hair
Hair is undoubtedly one of the most important attributes of people in all
cultures. Style, length and color changes are influenced by fashion trends. The
hair reflects feelings of health and beauty, and thus its properties are of great
importance. Therefore, the physics and chemistry of hair have been studied
extensively /3, 79/.
2.1.1. Structure of hair
Hair is composed of a type of protein, called keratin, which is different from
other proteins because it contains disproportionate amounts of sulfur. It is this
sulfur that allows us to perm and straighten hair. Human hair is a keratinized
skin addition which grows out of the follicles that are tubular recesses of the
skin.
Hair consists of three, sometimes four morphological components /1/. The
cuticle – located on the outside – consists of flat, overlapping, tile-like cells that
coat the cortex in several layers. The cortex, which constitutes the larger
proportion of the hair mass, is composed of oblong, spindle-shaped cells which
mutually penetrate each other. Thicker hair often shows a tube-like structure in
the center which is called medulla. Cuticular as well as cortical cells are
separated by the cell membrane complex which consists of lipids and proteins.
The general structure of a keratin fiber is illustrated in Fig. 1 for wool as a
keratin fiber.
2. Introduction
4
2. Introduction
2.1. Human hair
Hair is undoubtedly one of the most important attributes of people in all
cultures. Style, length and color changes are influenced by fashion trends. The
hair reflects feelings of health and beauty, and thus its properties are of great
importance. Therefore, the physics and chemistry of hair have been studied
extensively /3, 79/.
2.1.1. Structure of hair
Hair is composed of a type of protein, called keratin, which is different from
other proteins because it contains disproportionate amounts of sulfur. It is this
sulfur that allows us to perm and straighten hair. Human hair is a keratinized
skin addition which grows out of the follicles that are tubular recesses of the
skin.
Hair consists of three, sometimes four morphological components /1/. The
cuticle – located on the outside – consists of flat, overlapping, tile-like cells that
coat the cortex in several layers. The cortex, which constitutes the larger
proportion of the hair mass, is composed of oblong, spindle-shaped cells which
mutually penetrate each other. Thicker hair often shows a tube-like structure in
the center which is called medulla. Cuticular as well as cortical cells are
separated by the cell membrane complex which consists of lipids and proteins.
The general structure of a keratin fiber is illustrated in Fig. 1 for wool as a
keratin fiber.

2. Introduction
5
Fig. 1: Schematic diagram of the general structure of keratin fibers (here:
wool); adapted from /2/.
2.1.1.1. The cuticle
The cuticle is the outer protective layer of the hair. The cells near the root fit
closer at the hair shaft than the cells at the tip because they are mechanically
stressed due to their age /3/. Each cuticle has a dimension of approximately
55 x 55 µm2 and is about 0.5 µm thick. Generally, the cuticle of human hair
consists of 5-11 cell layers. The edges of the cuticle are smooth close to the
scalp but become rougher along hair length. Also abrasion of sections of the
cuticle cells is observed. The longer the hair, the greater is the abrasion of the
cuticle. In the worst case, a complete loss of the cuticle is observed, namely at
the tip (so called “spliss”).

2. Introduction
6
The individual cuticle cell is composed of several morphological components
(Fig. 2). There are three main layers, the A-layer with a high cystine content
(> 30 %), the likewise sulfur-rich exocuticle (cystine content > 15 %) and the
endocuticle with a low cystine content of approx. 3 %. Between the cuticle cells
is a layer which predominantly consists of lipids and membrane proteins. It is
called cell membrane complex (CMC) or cellular cement. The proteins of the
cuticle are of a predominantly amorphous in nature /7/.
Fig. 2: Schematic diagram of a longitudinal section through the hair
surface, and the lamellar substructure of each cuticle cell /4/.
2.1.1.2. The cell membrane complex
The CMC is the vital substance that consists of cell membranes and adhesive
material that glues the cuticle and cortical cells together. The CMC contains a
lower proportion of sulfur containing amino acids (AAs) compared to other
intercellular proteins. The endocuticle and the intercellular proteins form the
“non-keratinous regions”.
Fractured scale edge
Hair surfaceA-layer
ExocuticleEndocuticle
Cell membrane complex

2. Introduction
7
The non-keratinous regions gain increasing importance in cosmetic science
because they are believed to be the primary pathway for the diffusion of
ingredients into hair. In addition, during stretching or extension, cuticle
separation and damage occur in these regions.
Together, these structures of cell membrane and adhesive material are
approximately 0.03 - 0.06 µm thick. A number of sublayers of the CMC have
been identified. The most important of these is the central δ-layer /5/. The
δ-layer is the intercellular cement. Its proteins are low in cystine (< 2 %) and
high in polar AAs. This layer is sandwiched by other layers, sometimes called
the inert β-layers. They consist of lipids such as squalene and fatty acids that are
rich in palmitic, stearic, and oleic acids.
2.1.1.3. The cortex
The cortex is composed of spindle-shaped cells, which are 1 - 6 µm thick and
approximately 100 µm long /4/. The cells are separated by the CMC. The major
part of the cortical cells of human hair consists of fibrous structures called
macrofibrils or macrofilaments approximately 0.1 to 0.4 µm in diameter. The
macrofibrils consist again of fibrous structures which are the intermediate
filaments (IF), formerly called microfibrils. A macrofibril contains up to 900 of
these 10 nm thick IFs (Fig.1). The IFs are surrounded be the matrix, a less
organized structure, which is often referred to as the amorphous region.
The microfibrils are composed of 4 subunits, so-called protofibrils (Fig. 3). Each
protofibril has a diameter of 4.5 nm and can be separated into two
protofilaments. The 2 nm thick protofilaments are made up of heterodimers
which are composed of two protein subunits /6/. The helical domains of these
protein chains are approximately 0.001 µm in diameter, including side chains.

2. Introduction
8
Fig. 3: Model of the composition of the intermediate filament /8/. The
white rectangles indicate the coiled coil dimer. The black squares point to the C- and N-terminal amorphous sequences and their overlap upon tetramer formation. Arrows show the direction of the protein chains.
Various estimations of the relative ratio of matrix to IF protein have been made
for wool and human hair /9, 10/. Although the relative quantities vary, the
matrix-to-IF ratio in human hair is generally greater than 1.
The matrix forms the largest structural unit of the cortex of human hair fibers. It
contains the highest concentration of disulfide bonds /11/. The proteins that form
the matrix between the Ifs are the keratin associated proteins (KAPs) /77/. In the
1960’s these proteins were classified into the three classes “high sulfur”, “ultra-

2. Introduction
9
high sulfur” and “glycine/tyrosine rich” proteins. Rogers et al. have subdivided
these three classes further into 15 distinct KAP multigene families, based on AA
homologies and the nature of their repeat structures /78/.
2.1.1.4. Cross-links in the proteins of hair
There are three types of cross-links in the proteins of hair (Fig. 4):
NH
CH2
H3NCH2
COO
NH
CO
CH CH2
S S CH2
CHOC
NH
COR
NH
OC
NH
CONH
OC
NH
R
OC
42
+
Hydrogen bond
Disulfide bond
Salt linkage-
Fig. 4: Cross-links in polypeptides.
represents the continuous polypeptide chains
• Disulfide bonds
These are the most important bonds as far as perming and straightening are
concerned; these bonds are broken to allow the alteration of the hair shape.
The AA cystine (CyS-SCy) forms a link between two adjacent polypeptide
chains. The bonds are covalent and can only be altered chemically.
• Salt linkages (also called ionic or electrostatic interactions)
The proteins of hair contain amino acid residues with basic and acid side
groups. The ionic interactions between these groups are much weaker than
disulfide linkages and are thus easily broken by weak acids or alkalis.

2. Introduction
10
• Hydrogen bonds
These weak bonds arise from the electrostatic attraction between hydrogen
atoms and atoms with free electrons (like oxygen or nitrogen). This bond
formation occurs within a polypeptide chain or between adjacent protein
chains. Although the hydrogen bonds are relatively weak, they are the most
frequent interaction in hair. Hydrogen bonds can be broken by water, acids,
and bases.
2.1.2. Origin of curls in Afro hair
The quality of the hair of an individual depends on heredity and cannot be
changed. Many people believe that Afro hair has completely different
characteristics compared to Caucasian hair, so that products must be used in
different ways. Afro hair has the tightest curl of any hair type that the
hairdresser must deal with. As the hair grows out of the follicle, it hardens and
develops the characteristic twists, crimps, and curls of Afro hair (Fig. 5 and 6). It
has been suggested that the shape and direction of the hair follicle has an
influence on the hair shape. Alternatively, the different sides of the hair could
grow with different speeds. But until now, none of these theories has been
verified.
Fig. 5: Crimp in an Afro hair
2. Introduction
11
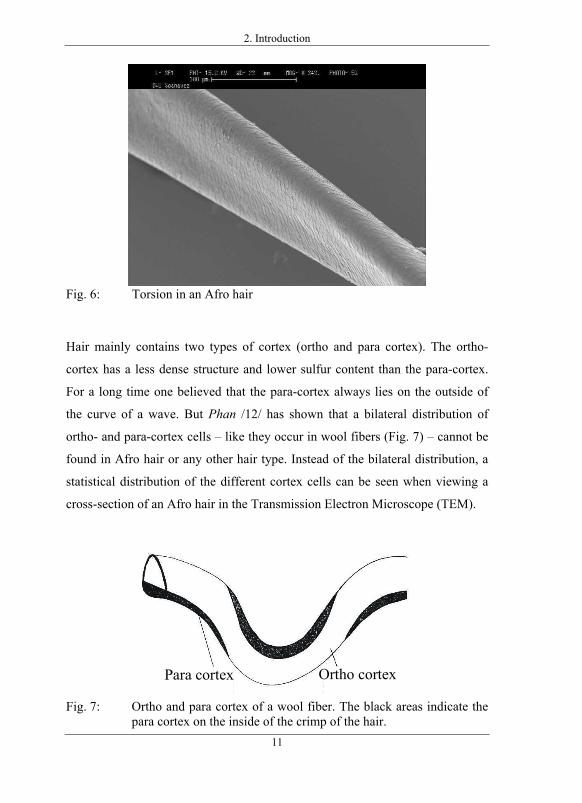
Fig. 6: Torsion in an Afro hair
Hair mainly contains two types of cortex (ortho and para cortex). The ortho-
cortex has a less dense structure and lower sulfur content than the para-cortex.
For a long time one believed that the para-cortex always lies on the outside of
the curve of a wave. But Phan /12/ has shown that a bilateral distribution of
ortho- and para-cortex cells – like they occur in wool fibers (Fig. 7) – cannot be
found in Afro hair or any other hair type. Instead of the bilateral distribution, a
statistical distribution of the different cortex cells can be seen when viewing a
cross-section of an Afro hair in the Transmission Electron Microscope (TEM).
Para cortex Ortho cortex
Fig. 7: Ortho and para cortex of a wool fiber. The black areas indicate the para cortex on the inside of the crimp of the hair.
2. Introduction
11
Fig. 6: Torsion in an Afro hair
Hair mainly contains two types of cortex (ortho and para cortex). The ortho-
cortex has a less dense structure and lower sulfur content than the para-cortex.
For a long time one believed that the para-cortex always lies on the outside of
the curve of a wave. But Phan /12/ has shown that a bilateral distribution of
ortho- and para-cortex cells – like they occur in wool fibers (Fig. 7) – cannot be
found in Afro hair or any other hair type. Instead of the bilateral distribution, a
statistical distribution of the different cortex cells can be seen when viewing a
cross-section of an Afro hair in the Transmission Electron Microscope (TEM).
Para cortex Ortho cortex
Fig. 7: Ortho and para cortex of a wool fiber. The black areas indicate the para cortex on the inside of the crimp of the hair.

2. Introduction
12
Consequently, the existence of curls cannot be explained by the existence of
more disulfide bonds on the inside of the curve.
Until today no verified explanation exists for the origin of curls namely in Afro
hair. But new investigation methods will surely give an answer to this question.
Recent surveys by synchrotron X-ray micro-diffraction have given information
about the keratinization process in human hair follicle /13/. This process can be
expected to have an influence on the shape of human hair.
2.2. Hair straightening/relaxing
Hair straightening, like permanent waving, is an operation in which a permanent
deformation of hair is the objective. Permanent waving effects a lasting trans-
formation of straight hair into waved hair. Hair straightening does just the
opposite, making naturally curly or kinky hair more or less straight.
2.2.1. Thermal straightening – hair pressing
The tight curl of Afro hair limits the number of ways it can be styled. One of the
first methods to make Afro hair straigther, and therefore more easy to style, was
to straighten it temporarily using heat. In the United States during the second
half of the nineteenth century, tin cans were heated in fires and the hair was
wrapped around them and stretched /14/.
During the straightening process of hair hydrogen bonds between the
polypeptide chains of keratin are broken under the influence of heat in the
presence of water. Then, upon rapid cooling, as long as tension is maintained,
new hydrogen bonds are formed which keep the hair in straight form. The
greater the heat used, the more bonds are broken (pressing combs as shown in
Fig. 9 operate between 140 °C and 260 °C). This means that the hair-dresser is

2. Introduction
13
always trying to use the highest possible temperature, which means that
permanent damage from heat is likely. This kind of straightening is temporary
rather than permanent.
Hair pressing can cause partial straightening but this process causes damage to
the surface of the fiber. Extensive loss of cuticle is frequently observed in hair of
Negroid origin which has been subjected to this type of treatment, resulting in
poor mechanical and fracture behavior /15/.
Fig. 9: Hair pressing comb.
2.3.2. Chemical hair straightening
The disadvantage of hair pressing is the temporary nature of the change, because
straightening is achieved by breaking and reforming weak hydrogen bonds.
There are two ways that curly hair can be chemically altered to become straight:
straightening and relaxing. Although both of these methods are permanent, new
hair growth must be treated every few months to maintain overall straightness.
2.3.2.1. Differences between hair straightening and relaxing
Many publications apply inconsistent definitions of straightening and relaxing,
as if they were the same process. Although the desired result is the same, the

2. Introduction
14
chemical process to achieve it is different. Relaxing produces superior results.
The following distinctions can be made between the two processes:
• Straightening is a two-step chemical process involving reduction and
oxidation.
• Relaxing is a one-step chemical process applying strong alkali.
2.3.2.2. The chemistry of hair straightening
The way a chemical straightener works is very similar to the permanent waving
process. The active ingredient of the straightener is a thiole, mostly ammonium
thioglycolate. The straightener creams may contain up to 12 % ammonium
thioglycolate, adjusted to a pH of 8.6 to 9.5 depending on the product.
The thiole as reducing agent cleaves the disulfide bond (CyS-SCy) of the keratin
For the sake of simplicity Fig. 10 shows a schematic diagram of this reaction
(chemical descriptions are given in the chapter 3.2.3.2.). During the reduction
phase the hair is mechanically straightened with a comb. The deformation
occurs on the molecular level through the sliding of polypeptide chains with
respect to each other, leading to changes in their relative positions (Fig. 11).
Fig. 10: Schematic diagram of reduction and oxidation of two polypeptide
chains which are linked by a disulfide bridge /15a/.
S S
Reduction(Excess thiole)
Oxidation(Hydrogen peroxide)
SH HS

2. Introduction
15
During the process the hair must be kept as straight as possible, and only
“heavy” (highly viscous) emulsions can do this. Finally the deformation has to
be fixed. The CyS-SCy linkages are reformed by an oxidizing agent, mostly
hydrogen peroxide. As a side product, the oxidation leads to the formation of
cysteic acid, CySO3H (Fig. 11).
SS
S
SS
SSO H3
A B
Fig. 11: Relative positions of two polypeptide chains and their disulfide
cross links in human hair before (A) and after (B) straightening. As a side reaction the formation of cysteic acid (–SO3H) occurs during the process.
During the reduction stage the hair is fragile. As soon as it is in contact with an
active compound, the hair must be handled with great care. This is why, in cold
waving, loose rolling is recommended immediately after moistening, with no
pulling of the hair. In the case of straightening the situation is different; as soon
as the application is started, and then again after the process period is over, the
hair needs to be combed out straight. This is the contradiction that embodies the
primary difficulty of this operation. To do this correctly and avoid hair damage,
great care and extensive experience both with the products as well as with Afro
hair are absolutely essential. The risk of hair breakage is very high.

2. Introduction
16
Straighteners based on ammonium thioglycolate are not as popular as the
relaxers based on NaOH, because for Afro hair they process more slowly and
straightening is not as effective as with relaxers. Straightening is particularly
used for Caucasian and Asian hair.
With the current techniques hair straightening methods are still far from perfect.
The most recent, successful process of permanent hair straightening applies a
hot iron press technique to hair treated with an alkaline solution containing
thioglycolic acid and dithiodiglycolic acid /16/.
2.3.2.3. The history of hair relaxing
In the 1930s many hairdressers tried to use reverse heat permanent waving to
straighten hair (this was the forerunner of cold permanent waving), but this
usually caused unacceptable damage. By about 1940 the modern cold wave,
based on ammonium thioglycolate, had been developed and was in general use
as a hair straightener. The aqueous formulation of the cold wave lotion was
thickened with flour or talc so that the weight would help to straighten the hair.
An acceptable process for permanently relaxing the hair had still not been found.
In the mid 1950s, extensive research finally resulted in the development of
special emulsions which made safe and effective hair relaxation a reality. The
active ingredient, incorporated into a heavy cream, was sodium hydroxide
(NaOH). These early products were strongly alkaline and required the use of a
protective cream which was applied to the scalp and around the entire hairline.
This prevented the alkaline chemicals of the relaxer from coming into contact
with the skin. This protective cream was known as a “base”, and application of
the base to the scalp was known as basing. Another ten years passed before
further noteworthy improvements were made for hair relaxer products. A “no
base” relaxer was introduced so that the application of a base cream was no

2. Introduction
17
longer required. This reduced the application time and made relaxing more
pleasant. These relaxers contain extra conditioning agents and skin coolers to
lessen possible scalp irritation.
2.3.2.4. The chemistry of hair relaxing
The most popular and widely used relaxers for Afro hair are still based on
NaOH (in the USA the common name for NaOH is “Lye”). Since it is well
known that it can damage the hair, many products claim that they do not contain
lye. Marketing experts perceive that hairdressers will be attracted to such “No-
Lye” products. However, these just contain alternative hydroxides – calcium,
potassium, lithium or guanidine hydroxides – and are still damaging the hair.
The pH of a relaxer may range from 11 to as high as 14. Generally, the pH is in
the region of 12-13.
The advantages of NaOH relaxers are:
• Fast processing time (the more NaOH a relaxer formation contains, the
shorter the processing time)
• Good smooth relaxation
• High efficacy with reduced tendency of the hair to re-curl on shampooing
However, the relaxer treatment also has various disadvantages:
• Cleavage of CyS-SCy (disulfide bridge), formation of lanthionine (Lan;
monosulfide bridge) and hydrolysis of proteins inducing pronounced hair
damage
• Irritation of the scalp
• Contact with the eyes may lead to blindness
• Hair cannot be permed further on, dyeing and bleaching are only partly
possible

2. Introduction
18
Relaxers are available in formulations of different strength to be suitable for
various hair types. The amount of NaOH present in relaxers varies between 1.8
to 2.5 % by weight.
The chemistry of hair relaxing differs from the chemistry of hair straightening.
During the relaxing process both disulfide bridges and protein chains are broken.
In contrast to the straightening process in which disulfide bonds are reformed by
oxidation, Lan is formed during the alkaline treatment, which is an irreversible
step. Fig. 12 shows a schematic diagram of the formation of Lan, which is a
monosulfide bridge between the protein chains. The detailed reaction is
discussed in chapter 3.2.3.2.
Fig. 12: Schematic diagram of the formation of lanthionine (monosulfide bridge) from CyS-SCy (disulfide bridge) during an alkaline treatment.
Furthermore, the alkaline relaxing treatment also hydrolyses protein chains
which build up the backbone of the hair fibers. This step is irreversible, too, and
causes strong damage to hair.
S S S SAlkali +

3. Results and Discussion
19
3. Results and discussion
3.1. Investigations of hair cross-sections
3.1.1. Introduction
Form and size of hair is of great interest. Publications on this topic date back to
the beginning of the last century /17, 18/. As a general rule, human hair has an
elliptical shape. Only Afro hair sometimes shows a triangular shape /19/. The
apparent diameter of hair affects various single fiber as well as collective
properties, including body, hair volume, combability, waveability, luster and
styling set /20, 21/.
Fig. 13 shows a typical cross-section of Afro hair in the light microscope. To
characterize cross-sections of fibers, very thin cuts are investigated using light
microscopy. The lengths of the long and short axes of at least 100 fibers of each
sample are determined. These values are averaged and used for calculation of
ellipticity E and apparent (equivalent) diameter. The ellipticity is calculated as
follows:
(3.1)
Where a represents the long axis and b the short axis.
Shape of hair is genetically fixed. The intensively crimped Negroid hair
possesses the most distinct ellipticity (1.6 – 1.9) followed by lightly waved
Caucasian hair (1.3 – 1.5). Cross-sections of Oriental or Asian hair are nearly
round (1.1 – 1.3) /22, 23/. The natural ellipticity has even been used for anthro-
pological investigations /23, 24/.
baE =

3. Results and Discussion
20
a
b
Fig. 13: Cross-sections of Afro hair. a: long axis, b: short axis
The apparent diameter d, which is the diameter of a circle with the same area, is
calculated by the following equation assuming an elliptical shape of hair: (3.2)
Hairs of Caucasian people reach an average apparent diameter of about 60 µm
and they are ca. 25 % thinner than hairs of Negroid people (~ 75 µm). The
apparent diameter of Asian hair is even thicker with around 90 µm /22, 25/.
abd =

3. Results and Discussion
21
3.1.2. Influences of age and gender
Ellipticity and apparent diameter of 12 hair samples were investigated. The
origins of these samples are known. The results were correlated with age
(between 4 and 91) and gender (7 samples of female and 5 samples of male
origin) of the hair donors. The results are shown in Tab. 1 and are summarized
in Figs. 14 and 15.
Tab.1: Results of the cross-section investigations of Afro hair (± Standard deviation, number of cross-sections: 100).
Gender Age in years Ellipticity Apparent diameter
in µm
6 1.83 ± 0.23 51.5 ± 9.0 11 1.63 ± 0.31 62.2 ± 12.6 41 1.91 ± 0.27 70.4 ± 11.4 50 1.71 ± 0.18 59.5 ± 8.3 51 1.82 ± 0.24 56.5 ± 7.9 84 1.68 ± 0.24 61.5 ± 11.4
Female
90 1.66 ± 0.23 53.1 ± 10.1
Overall Mean 1.75 ± 0.26 59.4 ± 7.6
17 1.92 ± 0.30 76.2 ± 13.7
18 1.84 ± 0.21 78.9 ± 9.3
23 1.64 ± 0.18 73.2 ± 11.6
41 1.94 ± 0.23 73.3 ± 8.9
41 1.69 ± 0.23 84.5 ± 15.2
Male
43 1.74 ± 0.18 63.2 ± 6.6
Overall Mean 1.80 ± 0.23 75.1 ± 6.2

3. Results and Discussion
22
Fig. 14: Ellipticity of Afro hair samples in relation to age and gender. = male, = female
Fig. 15: Apparent diameter of Afro hair samples in relation to age and gender. = male, = female
1.5
1.6
1.7
1.8
1.9
2
0 20 40 60 80 100Age in years
Elip
ticity
40
50
60
70
80
90
0 20 40 60 80 100Age in years
App
aren
t dia
met
er in
µm

3. Results and Discussion
23
To test the parameters ellipticity and apparent diameter for their mutual
dependencies as well as on age and gender, statistical tests are done. Since
gender signifies a category, age is a continuous variable, and ellipticity and
apparent diameter are assumed to be normally distributed, a general linear model
is used for testing (c.f. chapter 4.4.5.).
The statistical test shows that ellipticity shows no dependency on age, gender
and apparent diameter. Furthermore, the apparent diameter is independent of
age. But in contrast to this, the apparent diameter is dependent on gender.
The t-test for independent samples (eq. 6.7) is used to determine the degree of
independence. The test evaluates the significant differences in means between
the apparent diameter of males and females. The t-test for independent samples
shows that on the 99 %-level the apparent diameter of male (with 73.3 µm) and
female (with 59.4 µm) hair differs significantly. A box & whisker plot of the
values for the apparent diameter depending on gender is given in Fig. 16:
Male Female50
55
60
65
70
75
80
85 ±1.96*Std.Err.
±1.00*Std.Err.
Mean
Fig. 16: Apparent diameters of male (n = 6) and female (n = 7) Afro hairs in
the form of a box & whisker plot. 1.00*Std.Err. = standard error (c.f. chapter 4.4.4) 1.96*Std.Err. = expectation range for the 95 % confidence limits. Numer of cross sections in each individual case is n = 100.
App
aren
t dia
met
er in
µm

3. Results and Discussion
24
3.1.3. Comparison of pigmented and non-pigmented Afro hair
For one of the available samples a comparison of pigmented (black) and non-
pigmented (gray) hair was possible. The proportion of gray hairs of this sample
is about 40 %. The results for ellipticity and apparent diameter of this individual
hair sample are given in Tab. 2:
Tab. 2: Cross-sectional parameter values of pigmented and non-pigmented hairs from an individual grey Afro hair sample.
Pigmented hair Non-pigmented hair
Mean 1.72 1.55
Number of cases 61 37
Ellip
ticity
Standard error 0.02 0.04
Mean 56.0 51.1
Number of cases 61 37
App
aren
t
di
amet
er
Standard error 1.4 1.3
The t-test for independent samples shows that on the 99 %-level the ellipticity of
pigmented and non-pigmented hairs of this sample differ significantly. The
apparent diameters of pigmented and non-pigmented hairs of this sample differ
significantly on the 98 %-level.
Graphical summaries for these results for ellipticity and apparent diameter
depending on hair color are shown in Figs. 17 and 18.

3. Results and Discussion
25
Black Grey
1.4
1.5
1.6
1.7
1.8 ±1.96*Std.Err.
±1.00*Std.Err.
Mean
Fig. 17: Ellipticity of black and grey hair of an individual Afro hair
sample.
Ellip
tictiy
Black Grey46
48
50
52
54
56
58
60 ±1.96*Std.Err.
±1.00*Std.Err.
Mean
Fig. 18: Apparent diameter of black and grey hair of an individual Afro hair
sample.
App
aren
t dia
met
er in
µm
3. Results and Discussion
25
Black Grey
1.4
1.5
1.6
1.7
1.8 ±1.96*Std.Err.
±1.00*Std.Err.
Mean
Fig. 17: Ellipticity of black and grey hair of an individual Afro hair
sample.
Ellip
tictiy
Black Grey
46
48
50
52
54
56
58
60 ±1.96*Std.Err.
±1.00*Std.Err.
Mean
Fig. 18: Apparent diameter of black and grey hair of an individual Afro hair
sample.
App
aren
t dia
met
er in
µm

3. Results and Discussion
26
3.2. Comparison of Afro, Asian and Caucasian hair
Three major racial types of hair are known: Afro, Asian and Caucasian hair.
Tab. 3 shows the percentage of each of the three racial groups globally and in
the USA population.
Tab. 3: Percentage of the three major racial groups globally and in the USA population.
% of earth’s population /26/
% of USA population /27/
Caucasoid 56 86.9
Negroid 10 11.5
Asiatic 34 < 1.6
The differences between these hair types are particularly related to diameter,
geometry, crimp and color (Fig. 19).
Fig. 19: Specific properties of hairs of different racial origins /28/.
AxialShape differences
Cross-sectionalShape differences
Ellipticity1.1-1.3 1.3-1.5 1.6-1.9
Asian Caucasian Afro
3. Results and Discussion
27
These differences have an influence on the degree of damage after a chemical
treatment. Crimp (curvature) is perhaps the most important fiber characteristic
for styling, combing, and other aspects of hair behavior. Permanent waving and
hair relaxers primarily change fiber curvature to either a curlier or a straighter
form. When curvature is low (the hair is straight) other fiber properties play a
more important role for hair behavior. However, when curvature is high (hair is
very curly), this fiber property dominates other fiber properties and controls hair
performance. In the following discussion the chemical and thermal properties of
the hair types are compared after various treatments.
3.2.1. Characterization of hair samples
Besides the three major racial hair types - Afro, Asian, and Caucasian - natural
and so-called simulated Afro hair have been investigated. In practice it is in fact
very difficult to obtain longer length of untreated Afro hair for testing. For this
reason hair companies sell simulated Afro hair. This hair is actually Asian hair
which has been crimped using steam /29/. This method inevitably imposes
damage to the hair /30/. Part of this work evaluates the extent to which this
modified Asian hair has properties comparable to natural Afro hair, so that
results obtained are realistically transferable.
The Caucasian, Asian, and simulated Afro hair used in this study are mixed
source samples. In contrast, the natural Afro hair samples originates in each case
from a single source. This means that results obtained for mixed head hair
samples reflect the typical properties of the particular racial group. In contrast,
the results for natural Afro hair indicate the properties of only a particular
sample. Results of light microscopic investigations of hair cross-sections are
summarized in Figs. 20 (Ellipticity) and 21 (Apparent hair diameter),
respectively.

3. Results and Discussion
28
Fig. 20: Ellipticities of different ethnic hair samples.
Ellip
ticity
1
1.2
1.4
1.6
1.8
2
Natural Afro Simulated Afro
Caucasian Asian
±1.96*Std. Err.±1.00*Std. Err.Mean
A
Natural AfroSimulated Afro
Caucasian Asian
50
60
70
80
90
100
±1.96*Std.Err.
±1.00*Std.Err.
Mean
Fig. 21: Apparent diameters of different ethnic hair samples.
App
aren
t dia
met
er in
µm

3. Results and Discussion
29
The measured values for ellipticity of all natural hair types correspond with
literature data /28/. As expected the simulated Afro hair (1.39) has a degree of
ellipticity similar to that of Asian hair (1.30). While the diameter of the Asian
and simulated Afro hair (82 and 86 µm), and the Caucasian hair (76 µm) agree
with literature data /25/, the natural Afro hair (55 µm) has a small diameter
compared with the reference (~ 75 µm) /25/. However, this measured diameter
fits with a typical diameter for an African female as shown in the prior chapter
(Fig. 16).
3.2.2. Hair treatments
To investigate differences between the hair types, the hair samples were treated
as shown in Tab. 4. Every treatment was made under specific conditions which
were not changed during the test series.
Tab. 4: Hair treatments
Abbreviation Treatment
Untreated
Untreated hair
PW
Permanent wave (treatment with an aqueous solution of
ammonium thioglycolate followed by a peroxide treatment)
No-Lye
Relaxing treatment with a relaxer cream, which contains no
sodium hydroxide (NaOH = Lye), pH 12.9
No-Lye + PW
Treated with the No-Lye cream, followed by a permanent
wave
NaOH
Relaxing treatment with a NaOH containing relaxer cream,
pH 12.5
NaOH + PW
Treated with the NaOH-cream, followed by a permanent
wave

3. Results and Discussion
30
3.2.3. Quality of hair samples after treatment
In this work four different methods of analysis are employed to characterize the
hair and the degree of damage after different treatments. Morphology, chemical
composition and thermal properties are investigated.
3.2.3.1. Surface quality of the hair
The morphology of the hair was investigated by using Scanning Electron
Microscopy (SEM) to obtain a visual impression of the surface. Additionally,
gloss measurements were made to obtain an impression of the roughness of the
surface.
3.2.3.1.1. Scanning Electron Microscopy
The surface quality of the hair was investigated by using the knot test. For this
purpose a single hair is simply knotted (Fig. 22).
Fig. 22: Knot in an undamaged Caucasian hair in the SEM
Because of the tensile strain, namely on the outside of the knot, damages become readily apparent.

3. Results and Discussion
31
At the outer region of the knot strong tensile strains are imposed on the scales of
the cuticle. Scales which protrude from the surface (“fir cone” effect) suggest a
high level of damage as shown in Fig 23. In contrast to this, undamaged hair
shows a generally smooth surface (see Fig. 22). At least ten hairs per sample
were investigated by SEM /31/.
The examination of the different ethnic hairs after the various treatments
according to Tab. 4 suggested no significant changes compared to untreated
hair. The scales showed no “fir cone” effect. The only damage which was
observed was the appearance of small cracks in the cuticle, especially at the
points which were more stretched – for example at the outer side of the knot
(Fig. 24). This is prominent on hair which was treated with the relaxer creams
plus the PW. If the cuticle splits, very often the whole cuticle fractures so that
the cortex is exposed (Fig. 25). The fracture of the cuticle is associated with a
reduction of adhesion in the cuticle-cortex interface. This observation may have
a bearing on styling and combing of hair.
Fig. 23: Typical hair damage (“fir cone” effect) of an Caucasian hair induced
by a strong PW or bleaching.

3. Results and Discussion
32
Fig. 24: Damaged Caucasian hair after a relaxer plus PW treatment.
Fig. 25: Fracture of the cuticle of an Caucasian hair after a relaxing and
subsequent perming treatment.
3. Results and Discussion
32
Fig. 24: Damaged Caucasian hair after a relaxer plus PW treatment.
Fig. 25: Fracture of the cuticle of an Caucasian hair after a relaxing and
subsequent perming treatment.

3. Results and Discussion
33
3.2.3.1.2. Gloss measurements
Determing hair gloss by measuring the intensity distribution of reflected laser
light on individual hairs gives an extremely good correlation with the subjective
perception of hair luster. Moreover, this technique is particularly effective due to
high accuracy and reproducibility /32/.
When a light beam hits the surface of the hair, a first fraction of light S is
specularely reflected (Fig. 26). A second, principal fraction of light D is
diffusely scattered and reflected at and near the fiber surface, namely at surface
roughnesses, at the various interfaces between the cuticle cell layers of human
hair, the interface of cuticle and cortex, and at optical imperfections of the
cortex, such as voids and inclusion /33/. If the surface of the hair is rough and
uneven then the amount of specular reflection is low, and the scattered amount is
correspondingly higher.
The definition of hair gloss (eq. 3.3) is based on the hypothesis that gloss results
from the contrast between specular reflection and the overall light reflection
(Fig. 27). A gloss index (GL) is determined which corresponds to the percentage
ratio of the specular reflections (S) to the total reflected light
(S + D). A higher gloss index corresponds to glossier looking hair.
%100DS
SGL += (3.3)
Ten single hairs of a sample were measured at different positions. Fig. 28 shows
the gloss index with a standard error of a 95 % level of significance for the
treated Caucasian and Asian hair.

3. Results and Discussion
34
Fig. 26: Principles of light reflection and backward scattering on and in a
hair fiber /34/. S is specularly reflected light, D is diffusely scattered and reflected light, ND is the normal direction with respect to the fiber axis and in the horizontal plane.
Fig. 27: Gonio-photometric-curve data (──) for an Asian hair /34/.
Distributions for specularly (⋅⋅⋅⋅) and diffusely (---) reflected light, as fitted to the curve.

3. Results and Discussion
35
Fig. 28: Box & whisker plot of the gloss indices of Caucasian and Asian hair before and after different treatments. A: Caucasian hair
B: Asian hair
I
UntreatedPW
No-Lye No-Lye + PW
NaOHNaOH + PW
45
50
55
60
65
70
±1.96*Std.Err.
±1.00*Std.Err.
Mean
AG
loss
inde
x in
%
G
untreatedPW
No-LyeNo-Lye + PW
NaOHNaOH + PW
45
50
55
60
65
70
±1.96*Std.Err.
±1.00*Std.Err.
Mean
B
Glo
ss in
dex
in %
3. Results and Discussion
35
Fig. 28: Box & whisker plot of the gloss indices of Caucasian and Asian hair before and after different treatments. A: Caucasian hair
B: Asian hair
I
UntreatedPW
No-Lye No-Lye + PW
NaOHNaOH + PW
45
50
55
60
65
70
±1.96*Std.Err.
±1.00*Std.Err.
Mean
A
Glo
ss in
dex
in %
G
untreatedPW
No-LyeNo-Lye + PW
NaOHNaOH + PW
45
50
55
60
65
70
±1.96*Std.Err.
±1.00*Std.Err.
Mean
B
Glo
ss in
dex
in %

3. Results and Discussion
36
The different treatments have no significant influence on the gloss of the hairs.
As was shown by SEM, the roughness of the hair surface, assessed visually,
does not change during the treatments. However, gloss is largely determined by
the roughness of the hairs. Since the roughness does not change after treatment,
the gloss index is not significantly altered, too. Therefore, the objective luster
measurement corroborates the SEM investigations.
Since the different treatments according Tab. 4 on Caucasian and Asian hair
showed no influence on the gloss of hair, it was assumed there no different gloss
indexes would be found for simulated and natural Afro hair. Thus, it was
decides to stand aside for cost’s benefit to do measurements on these hair types.
3.2.3.2. Amino acid composition
Dry hair consists of 90 to 95 % proteins. 19-20 different amino acids (AA) can
be found after an acid hydrolysis /3/ according to the method of Moore and Stein
/35/. A change in the amino acid composition indicates hair damage, especially
changes of the amounts of cysteic acid (CySO3H), cystine (CyS-SCy) and
lanthionine (Lan). During hydrolysis the pre-existing cysteine (Cys) is oxidized
to CyS-SCy. Damages caused by oxidizing agents (such as used during a
permanent wave or bleaching treatment) are indicated by an increase in CySO3H
/28/, originating from CyS-SCy. CyS-SCy in a protein chain is oxidized into two
residues of CySO3H (Scheme 1).

3. Results and Discussion
37
COHC
NHCH2
SH
COHC
NHCH2
SO3H
SH CH2
CHCO
NH
HO3S CH2
CHCO
NH
COHC
NHCH2
S S CH2
CHCO
NH
ReductionOxidation
Cystine Cysteine
Cysteic acid
Cysteine
+
+
Cysteic acid
Oxidation
Scheme 1: Formation of cysteic acid via cysteine from cystine during PW /24/.
Damages caused by an alkaline treatment (like a relaxing treatment) are detected
by changes of Lan, which also originates from CyS-SCy (Scheme 2). In the first
step, CyS-SCy reacts to form dehydroalanine residues and Cys in a
β-elimination reaction. In a second step dehydroalanine and Cys are able to react
with each other to form Lan /36, 37/. This reaction is supported by kinetic
calculations /38/. One CyS-SCy residue can generate, at most, one Lan residue
as shown in Scheme 2.

3. Results and Discussion
38
CO
CNH
CH2
S S CH2
CHCO
NH
COHC
NHCH2
S S CH2
CHCO
NH
S S CH2
CHCO
NH
CO
NH
CH2
S CH2
CHCO
NH
CO
NHCH2 S
COHC
NHCH2
S CH2
CHCO
NH
+ + +
Lantionine
Cystine
Dehydroalanine Cysteine Sulfur
ß-elimination
-+ OH-- H2O
+ H+
+ H+
Scheme 2: Reaction of cystine into lanthione and sulfur caused by an alkali
treatment /45, 46/.

3. Results and Discussion
39
Besides this main reaction, side reactions occur during an alkali treatment. The
most important reactions are the hydrolysis of CyS-SCy /39, 40/ as shown in
Scheme 3 and the formation of lysinoalanine (LysAla) /30, 41, 42, 43/ as shown
in Scheme 4.
Hydrolysis of CyS-SCy produces dehydroalanine, together with an aldehyde and
hydrogen sulfide (Scheme 3). This reaction competes with the β-elimination,
which produces dehydroalanine, sulfur, and Cys. The side reaction is mainly
initiated after long treatment times (ca. 30 min) /44/.
The formation of LysAla competes with the formation of Lan (Scheme 4).
LysAla is formed by reaction of dehydroalanine with lysine (Lys) which is also
found in hair keratin. Dehydroalanine cannot be determined by amino acid
analysis (AAA) because it decomposes during the acid treatment of AAA.
LysAla is formed just in small quantities. Since it has an experimentally
absolutely unacceptable retention time in AAA, it was not analysed for the
current investigations. The results for the most relevant AAs - such as CyS-SCy,
Lan, and CySO3H - are given in Fig. 29-30 (CyS-SCy), 31-32 (Lan) and 33-34
(CySO3H).

3. Results and Discussion
40
COHC
NHCH2
S S CH2
CHCO
NH
CO
NHCH2
CO
NHCH2
SH CH2
CHCO
NHCHCO
NH
O
H
S
Cystine
Main reactionß-elimination
Side reactionHydrolysis
Dehydroalanine Dehydroalanine
+ +
Cysteine Aldehyde
+ +Hydrogen
sulfide H2SSulfur
Alkali
2
Scheme 3: Competing reactions of cystine with alkali. Main reaction: β-elimination Side reaction: Hydrolysis

3. Results and Discussion
41
SH CH2
CHCO
NH
COHC
NHCH2
NH
CH2
CHCO
NH4
COHC
NHCH2
S CH2
CHCO
NH
CH2
NH2 CHCO
NH4
CO
NHCH2 Dehydroalanine
Lanthionine Lysinoalanine
Main reaction Side reaction+ Cysteine + Lysine
Alkali
Scheme 4: Reaction of dehydroalanine with different AA residues during
alkaline treatment. Main reaction: With cysteine into lanthionine Side reaction: With lysine into lysinoalanine

3. Results and Discussion
42
0
2
4
6
8
10
untreated PW No-Lye No-Lye + PW
NaOH NaOH + PW
Con
tent
of C
ystin
e in
mol
%
B
Fig. 29: Content of cystine in natural and simulated Afro hair samples
The error bars represent the maximum and minimum value for this AA.
A: Natural Afro hair B: Simulated Afro hair
0
2
4
6
8
10
untreated PW No-Lye No-Lye + PW
NaOH NaOH + PW
Con
tent
of C
ystin
e in
mol
%A
3. Results and Discussion
42
0
2
4
6
8
10
untreated PW No-Lye No-Lye + PW
NaOH NaOH + PW
Con
tent
of C
ystin
e in
mol
%
B
Fig. 29: Content of cystine in natural and simulated Afro hair samples
The error bars represent the maximum and minimum value for this AA.
A: Natural Afro hair B: Simulated Afro hair
0
2
4
6
8
10
untreated PW No-Lye No-Lye + PW
NaOH NaOH + PW
Con
tent
of C
ystin
e in
mol
%
A

3. Results and Discussion
43
Fig. 30: Content of cystine in Caucasian and Asian hair sample. The error bars represent the maximum and minimum value for this AA. A: Caucasian hair B: Asian hair
0
2
4
6
8
10
untreated PW No-Lye No-Lye + PW
NaOH NaOH + PW
Con
tent
of C
ystin
e in
mol
%A
0
2
4
6
8
10
untreated PW No-Lye No-Lye+ PW
NaOH NaOH+ PW
Con
tent
of C
ystin
e in
mol
%
B
3. Results and Discussion
43
Fig. 30: Content of cystine in Caucasian and Asian hair sample. The error bars represent the maximum and minimum value for this AA. A: Caucasian hair B: Asian hair
0
2
4
6
8
10
untreated PW No-Lye No-Lye + PW
NaOH NaOH + PW
Con
tent
of C
ystin
e in
mol
%
A
0
2
4
6
8
10
untreated PW No-Lye No-Lye+ PW
NaOH NaOH+ PW
Con
tent
of C
ystin
e in
mol
%
B

3. Results and Discussion
44
Fig. 31: Content of lanthionine in natural and simulated Afro hair samples
The error bars represent the maximum and minimum value for this AA. A: Natural Afro hair B: Simulated Afro hair
0
1
2
3
4
5
untreated PW No-Lye No-Lye + PW
NaOH NaOH + PW
Con
tent
of L
anth
ioni
ne
in m
ol%
A
0
1
2
3
4
5
untreated PW No-Lye No-Lye + PW
NaOH NaOH + PW
Con
tent
of L
anth
ioni
ne
in m
ol%
B

3. Results and Discussion
45
Fig. 32: Content of lanthionine in Caucasian and Asian hair samples The error bars represent the maximum and minimum value for this AA. A: Caucasian hair B: Asian hair
0
1
2
3
4
5
untreated PW No-Lye No-Lye+ PW
NaOH NaOH+ PW
Con
tent
of L
anth
ioni
ne
in m
ol%
B
0
1
2
3
4
5
untreated PW No-Lye No-Lye + PW
NaOH NaOH + PW
Con
tent
of L
anth
ioni
nein
mol
%A
3. Results and Discussion
45
Fig. 32: Content of lanthionine in Caucasian and Asian hair samples The error bars represent the maximum and minimum value for this AA. A: Caucasian hair B: Asian hair
0
1
2
3
4
5
untreated PW No-Lye No-Lye+ PW
NaOH NaOH+ PW
Con
tent
of L
anth
ioni
ne
in m
ol%
B
0
1
2
3
4
5
untreated PW No-Lye No-Lye + PW
NaOH NaOH + PW
Con
tent
of L
anth
ioni
nein
mol
%
A

3. Results and Discussion
46
Fig. 33: Content of cysteic acid in natural and simulated Afro hair samples The error bars represent the maximum and minimum value for this AA. A: Natural Afro hair B: Simulated Afro hair
0
0.5
1
1.5
2
2.5
untreated PW No-Lye No-Lye + PW
NaOH NaOH + PW
Con
tent
of C
yste
ic a
cid
in m
ol%
A
0
0.5
1
1.5
2
2.5
untreated PW No-Lye No-Lye+ PW
NaOH NaOH+ PW
Con
tent
of C
yste
ic a
cid
in m
ol%
B

3. Results and Discussion
47
Fig. 34: Content of cysteic acid in Caucasian and Asian hair samples The error bars represent the maximum and minimum value for this AA. A: Caucasian hair B: Asian hair
0
0.5
1
1.5
2
2.5
untreated PW No-Lye No-Lye+ PW
NaOH NaOH + PW
Con
tent
of C
yste
ic a
cid
in m
ol%
A
0
0.5
1
1.5
2
2.5
untreated PW No-Lye No-Lye+ PW
NaOH NaOH+ PW
Con
tent
of C
yste
ic a
cid
in m
ol%
B

3. Results and Discussion
48
The amino acid content of the untreated natural hair samples corresponds to
literature values /47/. Only the simulated Afro hair (crimped Asian hair /29/)
shows differences in the AA compostion. In comparison to the Asian hair the
CyS-SCy content is low (30 % less), and the Lan content is significantly higher
(up to 20 times higher than in the other samples). These differences are
attributed to the steam treatment to crimp the hair /30/.
As expected, the CyS-SCy content (Figs. 29-30) of the various ethnic hair
samples (natural Afro, Asian, and Caucasian hair) decreases after waving (PW)
by about 0.5 - 1.5 mol%. This is a significant change because the error of this
method is ± 0.3 mol%. Some CyS-SCy is oxidized into CySO3H (via Cys or
cystine oxides), as verified through amino acid analysis (AAA) (Figs. 33-34).
The CySO3H content increases by about 1.0 – 2.0 mol%. This is a surprisingly
large rise in CySO3H. This effect might be due to an excess of peroxide, either
resulting from the liquor to hair ratio used or from the long time of exposure.
Additional Lan (Figs. 31-32) is not generated because the reducing solution is
not sufficiently alkaline (pH 8.8). The simulated Afro hair behaves chemically
as the other hair samples during PW.
The relaxer creams (No-Lye and NaOH) have an entirely different influence on
the AA content than the perming treatment. As a result of the high alkalinity of
the creams (pH 12.9 and 12.5) a high proportion of CyS-SCy reacts to form
dehydroalanine and Cys. This Cys and dehydroalanine may subsequently form
Lan. The natural hair samples lose between 40 to 50 % of their original disulfide
bridges (corresponding to 3 – 4 mol% of CyS-SCy) as seen in Figs. 29-30. The
newly formed Lan stabilizes the hair by the formation of intermolecular sulfide
bridges. Around 1.5 - 2.0 mol% of Lan are generated. Because just half of the
lost CyS-SCy reappears in the AA composition as Lan, one may assume that the
other half reacts either with Lys to form LysAla, or the formation of Lan does
not proceed to completion and the reaction remains at the stage of dehydro-
alanine formation.

3. Results and Discussion
49
A small increase in CySO3H (+ 0.2 - 0.4 mol%) is measured after the relaxing
process for all types of hair. Beside the other mentioned reaction, alkali reacts
with CyS-SCy to form small amounts of sulfenic acid which is easily oxidized
by air during the AAA to form CySO3H (Scheme 5).
COHC
NHCH2
S S CH2
CHCO
NH
COHC
NHCH2
S OH S CH2
CHCO
NH
COHC
NHCH2
SO3H
Oxidation
Cystine CysteineSulfenic acid
+
Cysteic acid
OH-+
Scheme 5: Side reaction of Cys into sulfenic acid and Cys caused by an alkali
treatment /45, 46/.
The simulated Afro hair behaves differently during the relaxing treatment
compared to the other hair samples. Although the CyS-SCy content decreases by
around 60 % (from 6.8 mol% to 2.9 mol%) no additional Lan is detected. The
explanation is the same as above. After cleavage of the CyS-SCy S-S-bonds by
the alkali, the polypeptide chains are no longer fixed in their position and the
reacting partners may drift apart. The chain residues are not able to react with
each other. They either remain as dehydroalanine and Cys or react with another
partner (like dehydroalanine with Lys to form LysAla).

3. Results and Discussion
50
A subsequent perming treatment of relaxed hair (No-Lye + PW, NaOH + PW)
leads to a small decrease of the CyS-SCy content compared to just relaxed hair
(decrease of 0.2 - 0.5 mol% CyS-SCy). This decrease corresponds approxi-
mately to the loss of CyS-SCy during perming of untreated hair. In contrast to
the CyS-SCy, the Lan content nearly doubles (rise from 1.5 - 2.0 mol% up to
2.5 - 3.2 mol%), particularly in the case of the No-Lye + PW treated hair. The
difference between the two relaxer creams relates to their different pH values.
The increase in Lan can be explained as follows. During the reduction step of
the waving treatment a high amount of Cys is formed. If one assumes that the
hypothesis of the remaining dehydroalanine during the relaxing process is
correct, this remaining dehydroalanine reacts now with the large supply of Cys
formed during the waving process to produce Lan. The amount of CySO3H of
relaxed hair increases after a perming treatment. But the increase is not as high
as in the case of perming untreated hair. This can be attributed to the lower
amount of CyS-SCy which is available during the reduction step of perming.
During relaxing, part of the CyS-SCy has already reacted to form Lan. Thus,
less CySO3H can be formed.
The relaxed and subsequently waved simulated Afro hair shows a similar
change in the AA composition. However, because of its pre-history of steaming,
the level of CyS-SCy is lower, Lan higher.
Overall, the different ethnic hair samples respond to the treatments in very
similar ways. The natural Afro hair reacts more strongly to the treatments. This
can be reasonably explained by its smaller diameter (55 µm) compared to the
Asian (82 µm) and Caucasian hair (76 µm). The reagents may penetrate the fiber
faster, therefore, the concentration of chemicals is higher in the fiber and the
damage of the fiber is stronger.

3. Results and Discussion
51
3.2.3.3. Thermal properties
The method of thermal analysis contains a multiplicity of analytic techniques to
measure the properties of materials or their changes with temperature and time
/48/. By using these methods many physical processes, like crystallization,
melting, desorption or phase conversions and many chemical reactions may be
investigated /49/.
Calorimetry in which a sample is subjected to a temperature-time-power-
compensated-program is called scanning calorimetry. Differential calorimetry
measures two systems simultaneously. One system contains the test sample, the
other system the reference sample. Both samples are heated simultaneously. The
difference in power, ∆Φ, is measured between the heating element in contact
with the test sample and the heating element in contact with the reference
sample. The amount of heat absorbed or released is determined by integration of
the heat flow difference curve over time, and corresponds to the peak area
(Fig. 35) /50/.
Keratin fibers - like hair – are composite systems, which are physically and
chemically heterogeneous. From the point of view of elastics properties the
important difference in these compounds is based on their α-helical domains or
amorphous (matrix) character. This has lead to the two-phase filament-matrix
model for keratin fibers, originally proposed by Feughelman /51/. Spei et al. /52/
used conventional DSC to investigate the melting behavior of different, dried
keratins. The endothermic “melting peak” at 240 °C signifies the change from
α-helix into an unordered structure. Crighton and Hole /53/ developed a special
form of high-pressure differential thermoanalysis (HP-DTA) to determine the
denaturation of α-keratins in water. Thereby “the melting point” shifts to a
temperature range between 130 and 155 °C.

3. Results and Discussion
52
-5
0
5
10
15
120 130 140 150 160Temperature in °C
Hea
t flo
w in
mW
Denaturation temperature
Denaturationenthalpy
Fig. 35: HP-DSC diagram (black line) of relaxed Caucasian hair in water.
The highest point of the black curve represents the denaturation temperature, the grey shaded area beneath the curve (integration of the heat flow curve over time) the denaturation enthalpy.
In this work a combination of both methods has been used in so-called High-
Pressure Differential Scanning Calorimetry (HP-DSC). For this commercial,
pressure resistant capsules are used for the measurement of the hair moistened
by water /54/. Denaturation enthalpy and temperature for the different treated
hair types are given in Figs. 36-37 (enthalpy) and 38-39 (temperature).
Denaturation enthalpy represents the helical content of hair. The greater the
denaturation enthalpy, the higher is the helical content of hair. Denaturation
temperature reflects the influence of treatments to the matrix of hair.

3. Results and Discussion
53
The denaturation enthalpy of the investigated untreated hair is between 18 and
22 J/g (Figs. 36-37). Caucasian hair has the highest, and simulated Afro hair the
lowest value for denaturation enthalpy. A reduction in enthalpy of between 2
and 5 J/g is measured after perming for all treatments, corresponding to a
reduction in the helical content.
Both relaxer treatments (NaOH and No-Lye) lead to a stronger decrease of
enthalpy than just the perming treatment. But, whereas Caucasian and Asian hair
retain more than 60 % of their initial helical content, natural and simulated Afro
hair lose around 60 %. No-Lye treatment causes a stronger reduction of
denaturation enthalpy than NaOH treatment. This can be traced back to the
higher pH of No-Lye cream and thus higher concentration of the active
ingredient, the alkali.
When relaxed hair is subsequently permed, the denaturation enthalpy decreases
again. Especially for natural and simulated Afro hair a very low helical content
is detected after No-Lye + PW treatment. Caucasian and Asian hair still retain
around 50 % of their initial helical content after this treatment.
Generally, Caucasian and Asian hair are less affected by relaxer creams than the
two Afro hair samples. The reasons are the same as mentioned in the previous
chapter. Because of its small diameter, the natural Afro hair may be more
rapidly penetrated by alkali, and thus a greater damage of this sample occurs.
The simulated Afro hair is more affected by the alkali because of its pre-damage
by steaming.

3. Results and Discussion
54
0
5
10
15
20
25
untreated PW No-Lye No-Lye+ PW
NaOH NaOH + PW
Den
atur
atio
n en
thal
py in
J/g
B
Fig. 36: Denaturation enthalpy of natural and simulated Afro hair samples The error bars represent the standard deviation (n = 5). A: Natural Afro hair B: Simulated Afro hair
0
5
10
15
20
25
untreated PW No-Lye No-Lye+ PW
NaOH NaOH + PW
Den
atur
atio
n en
thal
py in
J/g
A3. Results and Discussion
54
0
5
10
15
20
25
untreated PW No-Lye No-Lye+ PW
NaOH NaOH + PW
Den
atur
atio
n en
thal
py in
J/g
B
Fig. 36: Denaturation enthalpy of natural and simulated Afro hair samples The error bars represent the standard deviation (n = 5). A: Natural Afro hair B: Simulated Afro hair
0
5
10
15
20
25
untreated PW No-Lye No-Lye+ PW
NaOH NaOH + PW
Den
atur
atio
n en
thal
py in
J/g
A

3. Results and Discussion
55
0
5
10
15
20
25
untreated PW No-Lye No-Lye+ PW
NaOH NaOH + PW
Den
atur
atio
n en
thal
py in
J/g
B
Fig. 37: Denaturation enthalpy of Caucasian and Asian hair samples
The error bars represent the standard deviation (n = 5). A: Caucasian hair B: Asian hair
0
5
10
15
20
25
untreated PW No-Lye No-Lye+ PW
NaOH NaOH + PW
Den
atur
atio
n en
thal
py in
J/g
A3. Results and Discussion
55
0
5
10
15
20
25
untreated PW No-Lye No-Lye+ PW
NaOH NaOH + PW
Den
atur
atio
n en
thal
py in
J/g
B
Fig. 37: Denaturation enthalpy of Caucasian and Asian hair samples
The error bars represent the standard deviation (n = 5). A: Caucasian hair B: Asian hair
0
5
10
15
20
25
untreated PW No-Lye No-Lye+ PW
NaOH NaOH + PW
Den
atur
atio
n en
thal
py in
J/g
A

3. Results and Discussion
56
135
140
145
150
155
untreated PW No-Lye No-Lye + PW
NaOH NaOH + PW
Den
atur
atio
n te
mpe
ratu
re in
°CA
135
140
145
150
155
untreated PW No-Lye No-Lye + PW
NaOH NaOH + PW
Den
atur
atio
n te
mpe
ratu
re in
°C
B
Fig. 38: Denaturation temperature of natural and simulated Afro hair
samples The error bars represent the standard deviation (n = 5). A: Natural Afro hair B: Simulated Afro hair
3. Results and Discussion
56
135
140
145
150
155
untreated PW No-Lye No-Lye + PW
NaOH NaOH + PW
Den
atur
atio
n te
mpe
ratu
re in
°C
A
135
140
145
150
155
untreated PW No-Lye No-Lye + PW
NaOH NaOH + PW
Den
atur
atio
n te
mpe
ratu
re in
°C
B
Fig. 38: Denaturation temperature of natural and simulated Afro hair
samples The error bars represent the standard deviation (n = 5). A: Natural Afro hair B: Simulated Afro hair

3. Results and Discussion
57
135
140
145
150
155
untreated PW No-Lye No-Lye + PW
NaOH NaOH + PW
Den
atur
atio
n te
mpe
ratu
re in
°CA
135
140
145
150
155
untreated PW No-Lye No-Lye + PW
NaOH NaOH + PW
Den
atur
atio
n te
mpe
ratu
re in
°C
B
Fig. 39: Denaturation temperature of Caucasian and Asian hair samples
The error bars represent the standard deviation (n = 5). A: Caucasian hair B: Asian hair
3. Results and Discussion
57
135
140
145
150
155
untreated PW No-Lye No-Lye + PW
NaOH NaOH + PW
Den
atur
atio
n te
mpe
ratu
re in
°C
A
135
140
145
150
155
untreated PW No-Lye No-Lye + PW
NaOH NaOH + PW
Den
atur
atio
n te
mpe
ratu
re in
°C
B
Fig. 39: Denaturation temperature of Caucasian and Asian hair samples
The error bars represent the standard deviation (n = 5). A: Caucasian hair B: Asian hair

3. Results and Discussion
58
A comparison of denaturation enthalpy and CyS-SCy content for the same
treatments shows that the treatments have different strong effects on each of
these properties. For example, Asian hair loses about 60 % of its initial helical
content after the relaxing treatments, whereas the CyS-SCy content decreases by
approximately 50 % for the same treatments. For both types of Afro hair just a
small residual denaturation enthalpy is detected after the No-Lye + PW
treatment (~ 10 % of the initial value). In contrast, the CyS-SCy content for both
hair types is around 50 % of the initial content for this treatment. Thus, loss of
helical structure is not directly related to degradation of CyS-SCy.
The denaturation temperature of untreated hair is found to be around 152 ± 2 °C
for all hair types (Figs. 38-39). A lower temperature is detected for natural Afro
hair and Caucasian hair after perming treatment of virgin hair (~ 4 °C), whereas
denaturation temperature of Asian and simulated Afro (steamed, crimped Asian)
hair is largely unchanged after the perming treatment. This indicates a higher
resistance of Asian hair against reduction agents or a higher reforming of
disulfide bridges in the matrix.
All hair types show a significant decrease in the denaturation temperature after
the relaxing treatments. Since the denaturation temperature is a measure of the
condition of the hair matrix, the matrix around the helical domains is altered,
becoming weaker after relaxing treatments. The matrix proteins (KAPs) contain
the highest concentration of disulfide bonds in hair, most of which are probably
intrachain bonds /11/. The decreases of denaturation temperature (Figs. 38-39)
and of CyS-SCy content (Figs. 29-30) suggest that the KAPs are strongly
affected by the relaxing treatment.
When the relaxed hair is subsequently permed, a significant increase in the
denaturation temperature is observed for all hair types. The denaturation

3. Results and Discussion
59
temperature for all natural hair samples reaches approximately the same value as
for untreated hair. Thus, a strengthening of the matrix is effected by perming
treatment. This could be attributed to the formation of Lan as described in the
prior chapter. The additional bridges within the protein fibers support the protein
fibers of the matrix.
The denaturation temperature of simulated Afro hair also increases after
perming of relaxed hair. However, the measured temperature does not reach the
value of “untreated” simulated Afro hair as the natural hair samples. The AAA
has shown that “untreated” simulated Afro hair already has a chemically
changed initial state compared to the natural hair samples. The CyS-SCy content
is lower and the Lan content is much higher. Lan is a chemical end product
which does not react anymore. Since less amount of CyS-SCy is available,
simulated Afro hair cannot form new bonds to the same extent as the natural hair
samples. Therefore, the denaturation temperature after relaxing and subsequent
perming treatment is not as high as for its “untreated” state.

3. Results and Discussion
60
3.3. Evaluation of hair straightening efficacy
One of the most important quality aspects of relaxer creams is at what speed the
product decurls hair. Apart from tests in hair saloons on hair in vivo, tests are
made with curly hair in the laboratory. As a rule hair for such tests is purchased
from companies who trade in hair. But these companies usually only sell so-
called “Afro Hair – Natural Hair Kinked”. This hair is obviously Asian hair,
curled by steam as discussed above. Natural Afro hair is very difficult to obtain,
most often not through commercial but rather through private sources. In what
follows a comparison will be made between this simulated “Afro” hair and
natural Afro hair with respect to their decurling behavior, as well as the
influence of different relaxer creams on natural Afro hair.
3.3.1. Relaxer creams
In this work two commercial relaxer creams were used. These creams contain
different ingredients to reach the high pH levels:
• pH 12.5, relaxer cream with sodium hydroxide (NaOH = lye) as alkali (in
what follows referred to as “NaOH relaxer cream”)
• pH 12.9, relaxer cream with calcium hydroxide and guanidine carbonate as
alkali (No-Lye relaxer cream)
3.3.2. Treatments
The two different relaxer creams are used for the comparison of the simulated
versus the natural Afro hair. In addition to the classical relaxer creams (NaOH
and No-Lye), a combination of relaxer cream plus a small amount of thiole
(thioglycolic acid or cysteine) was investigated. Thioglycolic acid (TGA) is the
typical commercial reduction reagent for a permanent wave treatment. It is
responsible for the cleavage of the disulfide bridges (Fig. 10). Cysteine (Cys) is
also able to cleave disulfide bonds but it is easily oxidized by air oxygen in

3. Results and Discussion
61
aqueous alkaline solutions to form CyS-SCy /55/. The influences of these two
thioles on the relaxing process are studied for natural Afro hair. The following
list gives the investigated treatments and their abbreviations used in this work.
• NaOH
Relaxing treatment with NaOH relaxer cream, pH 12.5
• NaOH + TGA
Relaxing treatment with NaOH relaxer cream + 1 % w/w TGA, pH 12.5
• NaOH + Cys
Relaxing treatment with NaOH relaxer cream + 1 % w/w L-Cysteine,
pH 12.5
• No-Lye
Relaxing treatment with No-Lye relaxer cream, pH 12.9
• No-Lye + TGA
Relaxing treatment with No-Lye relaxer cream + 1 % w/w TGA, pH 12.9
• No-Lye + Cys
Relaxing treatment with No-Lye relaxer cream + 1 % w/w L-Cysteine,
pH 12.9
3.3.3. Procedure for single hair relaxing
To determine the extent of decurling caused by relaxer creams, a suitable test
method of practical relevance had to be developed. Since only small amounts of
each natural Afro hair sample were available, the new test had to be based on
single hairs. The following procedure was found to be suitable.
Single hairs are mechanically straightened and fixed on a glass plate. They are
then treated with a relaxer cream. After treatment the hair is removed from the
plate and wetted in warm water in its unfixed state. As a result of wetting the
influence of secondary cross-links (salt linkages and hydrogen bonds) is
removed and the permanent component of straightening is observed. Finally the
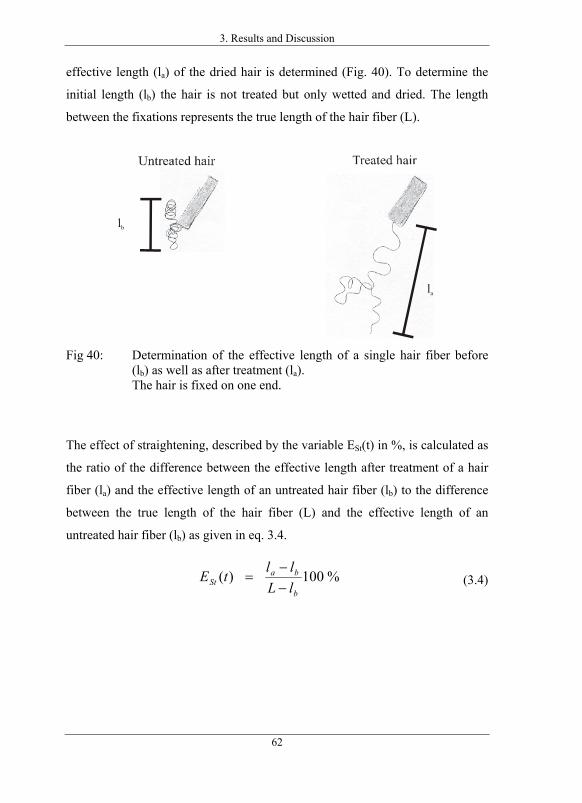
3. Results and Discussion
62
effective length (la) of the dried hair is determined (Fig. 40). To determine the
initial length (lb) the hair is not treated but only wetted and dried. The length
between the fixations represents the true length of the hair fiber (L).
lb
la
Fig 40: Determination of the effective length of a single hair fiber before
(lb) as well as after treatment (la). The hair is fixed on one end.
The effect of straightening, described by the variable ESt(t) in %, is calculated as
the ratio of the difference between the effective length after treatment of a hair
fiber (la) and the effective length of an untreated hair fiber (lb) to the difference
between the true length of the hair fiber (L) and the effective length of an
untreated hair fiber (lb) as given in eq. 3.4.
(3.4)
%100)(b
baSt lL
lltE−−
=

3. Results and Discussion
63
3.3.4. Results of single hair relaxing
3.3.4.1. Comparison of simulated and natural Afro hair
To photograph the treated hair, two examples are illustrated in Fig. 41. The
photos show simulated and natural Afro hair that were treated 3 and 15 min with
NaOH, after the final wetting. The difference between these two hair samples is
clearly visible. At all times simulated Afro hair is more effectively straightened
than natural Afro hair. The results for the straightening effect with treatment
time are summarized in Fig. 42 for both the NaOH and the No-Lye treatment.
5 cm
3 min treated 15 min treated
NaturalAfro hair
SimulatedAfro hair
Fig. 41: Photos of simulated and natural Afro hair treated for 3 min and
15min, respectively, with NaOH.

3. Results and Discussion
64
Fig 42: The straightening effect of the relaxer creams (NaOH and No-Lye) for simulated and natural Afro hair versus treatment time.
The error bars represent the standard deviation (n = 8). A: NaOH treatment B: No-Lye treatment
0
20
40
60
80
100
0 5 10 15 20 25Treatment time in min
Stra
ight
enin
g ef
fect
in %
SimulatedAfro hair
NaturalAfro hair
A
0
20
40
60
80
100
0 5 10 15 20 25Treatment time in min
Stra
ight
enin
g ef
fect
in % B
SimulatedAfro hair
NaturalAfro hair

3. Results and Discussion
65
As expected, the straightening effect increases with relaxing time.
The experimental data for the dependence of straightening on treatment time
have been fitted by eq. 3.5, which corresponds to a pseudo first-order kinetics
function. The equation contains a theoretical time lag, ∆t, to take into
consideration that the straightening effect ESt shows an induction period, in that
the straightening is very slow at the beginning of the treatment. This time lag
can be explained by the structure of the hair. Initially, the alkali has to pass the
cuticle, a natural barrier of the hair.
(3.5)
Parameter maxStE stands for the maximum value the straightening effect can
reach. Values greater than 100 % would mean a lengthening of the hair fiber.
Assuming from the inspection of Fig. 42 that straightening always approaches
completeness (100 %), eq. 3.5 simplifies:
(3.6)
Longer treatment times lead to dissolution of hair fibers so that the theoretical
straightening effect of 100 % cannot be checked practically.
τ is called the characteristic straightening time. The smaller τ, the faster the
straightening takes place. When (t-∆t) is equal to τ, the effect of straightening
has reached a value of (1-1/e), which is 63.2 %.
Tab. 5 gives an account of the calculated parameters which are fitted to the
experimental obtained data of the straightening experiments with natural and
−=
∆−
−τ
tt
StSt eEtE 1)( max
%1001)(
−=
∆−
−τ
tt
St etE

3. Results and Discussion
66
simulated Afro hair using eq. 3.6. The smaller the characteristic straightening
time, τ, the faster the straightening occurs.
Tab. 5: Calculated time lag, ∆t, characteristic straightening time, τ (± standard error) of the fitted curves for simulated and natural Afro hair (n = 8) using eq. 3.6.
Type of hair Treatment ∆t in min
τ in min
NaOH 1.6 ± 0.6 14 ± 4 Simulated
Afro hair No-Lye 0.0 ± 0.2 11 ± 2
NaOH 3.9 ± 0.5 26 ± 7 Natural
Afro hair No-Lye 0.9 ± 0.2 21 ± 4
No-Lye causes a faster straightening of both hair types than NaOH, which is
expressed by the characteristic straightening time, τ. It is always smaller for
No-Lye treatments than for NaOH treatments. This can be explained by the
higher pH of the No-Lye cream and thus a higher concentration of reacting
agent - the alkali. This effect is also expressed by the time lag. Because of the
higher concentration of alkali in the No-Lye cream, the alkali is able to pass the
cuticle faster. The calculated values of ∆t confirm this. The time lag is much
larger for NaOH treatments.
Furthermore, it turned out that in both treatments simulated Afro hair shows
faster straightening than natural Afro hair does. This is expressed by the
characteristic straightening time, τ, as well as by the time lag, ∆t. τ is
approximately two times smaller for simulated Afro hair. When simulated Afro
hair is treated with alkali, nearly no time lag is observed. This can be attributed
to the pre-damage of the simulated Afro hair.

3. Results and Discussion
67
Since simulated Afro hair had previously been steam treated, the structure is
damaged and it is not possible to compare simulated with natural Afro hair. Due
to this results, the cosmetic research and companies are advised against using
simulated Afro hair as being a relevant model for natural Afro hair.
3.3.4.2. Comparison of different treatments of natural Afro hair
In the second test series the straightening effect of different thioles added to the
relaxer creams was investigated. By this, a second chemical reaction will take
place during relaxing. Besides the cleavage of the disulfide bonds by alkali (and
subsequent formation of Lan), a breakage of the disulfide bonds by the thioles
occurs. Scheme 6 shows this reaction.
COHC
NHCH2
S S CH2
CHCO
NHSR
COHC
NHCH2
S S S CH2
CH
CO
NHR
COHC
NHCH2
S S CH2
CH
CO
NH
_
S SR R- SR+R = Cystleine residue or TGA residue
Cystine
+ +
+
Cysteinyl Mixed Disulfide
CysteinylCysteinyl Scheme 6: Cleavage of the disulfide cross-link (cystine) between two protein
chains through the formation of cysteine. R-S-S-R = Dithio diglycolic acid, when R = TGA residue
= Cystine, when R = cysteine residue = Protein chain

3. Results and Discussion
68
The complete reduction of CyS-SCy is a two-step mechanism. Besides Cys as
main product, mixed disulfide can be formed containing TGA and cysteine
residues. The break-down of disulfide bonds leads to flexibility of the protein
chains and to softening of the whole hair. Thus, it is to be expected that addition
of thioles leads to faster straightening. The results are demonstrated in Fig. 43.
The curves are fitted again by the eq. 3.6. The calculated parameters are given in
Tab. 6.
Tab. 6: Calculated time lag, ∆t, characteristic straightening time, τ (± standard error) of the curves in Fig. 43 for differently treated natural Afro hair samples using eq. 3.6 for fitting (Average of 8 single treated hairs per relaxing time and experiment).
Treatment ∆t in min
τ in min
NaOH 3.9 ± 0.5 26 ± 7
NaOH + TGA 3.3 ± 0.7 13 ± 2
NaOH + Cys 4.0 ± 0.6 19 ± 3
No-Lye 0.9 ± 0.2 21 ± 4
No-Lye + TGA 0.8 (fixed) 7 ± 2
No-Lye + Cys 0.8 ± 0.3 10 ± 3

3. Results and Discussion
69
Fig. 43: Straightening effect (natural Afro hair) of different relaxer creams (with and without TGA or cysteine) versus relaxing time. The error bars represent the standard deviation (n = 8).
A: NaOH treatment B: No-Lye treatment
0
20
40
60
80
100
0 5 10 15 20 25Treatment time in min
Stra
ight
enin
g ef
fect
in %
NaOHNaOH + TGANaOH + Cys
A
0
20
40
60
80
100
0 5 10 15 20 25Treatment time in min
Stra
ight
enin
g ef
fect
in %
No-LyeNo-Lye + TGANo-Lye + Cys
B

3. Results and Discussion
70
Indeed, the results show that the presence of additional thioles (1 % w/w thiole)
straightens hair considerably faster than pure relaxer creams do. Whereas NaOH
treatment causes a straightening effect of 50 % after 20 min, NaOH + Cys
treatment straightens hair up to 60 %.
Addition of TGA causes an even faster straightening than the addition of
cysteine. NaOH + TGA treatment causes a straightening effect of 50 % after
11 min. The same effect is reached by cysteine containing cream after 16 min
and without thiole after 20 min (comparative data of No-Lye series for
straightening effect of 50 %: plus TGA in 5 min; plus Cys in 7.5 min, without
thiole in 16 min).
It was not possible to measure the straightening effect of the relaxer creams +
TGA for longer treatment times since hair becomes very soft and weak upon this
treatment. During rinsing under running water the hair stretched longitudinally
(sometimes more than 200 %) and broke afterwards. This phenomenon also
occurred occasionally for hair which was treated with relaxer creams + Cys,
though for longer treatment times (15 – 20 min). The stretching indicates that
the amount of internal linkages of hair has been diminished to a large extent. It
corroborates the above mentioned proposition of the additional cleavage of
disulfide bonds by added thioles. Since only values for two treatment times
(3 and 6 min) were able to determine for the treatment of No-Lye + TGA, it is
not possible to calculate the complete set of parameters for this treatment. That
is why an additional parameter had to be fixed. The values for time lag for the
different NaOH treatments as well as for the No-Lye treatment are always very
similar. Thus, on the basis of lag times of the No-Lye series, the time lag of the
No-Lye + TGA treatment was fixed to 0.8 min. A reliable value for τ was thus
determined.

3. Results and Discussion
71
3.4. Study of hair relaxing
Natural Afro hair cannot be obtained commercially. Hair shops only sell
simulated Afro hair. Thus, natural Afro hair has to be obtained through more or
less private contacts, which proves to be very difficult for large amounts of hair.
To avoid the general problems of the availability of Afro hair, Caucasian hair
has been used for those treatments which are afterwards investigated chemically.
The comparison of natural Afro hair and Caucasian hair has shown that they
react chemically in a very similar way.
Two kinds of comparisons were made for the following part of the
investigations. First, a NaOH treatment of Caucasian and natural Afro hair was
investigated. Second, the chemical effects of different relaxer treatments (see
chapter 3.3.3.) on Caucasian hair were analyzed.
3.4.1. Kinetics of cystine degradation
Klibanov et al. /56/ have shown that proteins undergo heat-induced β-elimi-
nation of CyS-SCy residues in the pH range from 4 to 8. The time course of this
process closely follows first-order kinetics. During an alkali treatment of
keratins the β-elimination in CyS-SCy is presumed to be the first reaction step,
too (c.f. Scheme 2). With the help of AAA the degradation of CyS-SCy can be
examined for its kinetics.
The amount of CyS-SCy in Afro and Caucasian relaxed hair depends on the
time of relaxing (NaOH treatment) as shown in Fig. 44. For each treatment time
a new experiment was carried out. Thus, the obtained data are not received from
a continuous reaction but from a stop-flow reaction. This statement is valid for
all the following experiments.

3. Results and Discussion
72
4
5
6
7
8
9
10
0 5 10 15 20 25Treatment time in min
Cys
tine
cont
ent i
n m
ol%
Caucasian hair
Natural Afro hair
Fig. 44: Time dependent degradation of CyS-SCy in Afro ( ) and Caucasian
( ) hair during treatment with NaOH relaxer cream at 21 °C. The mean value of two AAAs for each relaxing time is shown. The error bars give the minimum and maximum value.
A reaction of first-order kinetics is described by eq. 3.7; with [CyS-SCy]0 as the
initial CyS-SCy concentration, and [CyS-SCy]t the amount of CyS-SCy at time
t.
k is the rate constant.
(3.7)
Integration results in:
(3.8)
ktSCyCySSCyCyS t −=
−−
0][][
ln
tt SCyCySk
dtSCyCySd
][][
−=−
−

3. Results and Discussion
73
A plot of ln ([CyS-SCy]t/[CyS-SCy]0) against t yields a straight line, in case the
degradation of CyS-SCy follows first-order kinetics (Fig. 45). The slope of the
straight line gives the rate constant as -k.
Fig. 45: Time dependent degradation of CyS-SCy (standardized to initial amount of CyS-SCy) in Afro ( ) and Caucasian ( ) hair during treatment with NaOH relaxer cream at 21 °C after integration. The lines shown are the regression lines corresponding to the first-order model. The average values of Fig. 45 are used for calculation (coefficient of determination R2 ≥ 0.98).
Fig. 45 shows that the degradation of CyS-SCy in both hair types follows first-
order kinetics. Thus, the same kind of alkali reaction takes place in both hair
types. But the two hair samples possess different rate constants. The CyS-SCy of
Afro hair (kAfro = 0.021 min-1) is converted faster than for Caucasian hair
(kCaucasian = 0.017 min-1). This could be a result of variances for the hair of
different races or to the smaller diameter of Afro hair (Fig. 21), which probably
allows a faster penetration of the hair by alkali.
y = - 0.017x
y = - 0.021x
-0.5
-0.4
-0.3
-0.2
-0.1
0
0 5 10 15 20 25Relaxing time in min
ln [C
yS-S
Cy]
t / [C
yS-S
Cy]
0
Natural Afro hair
Caucasian hair

3. Results and Discussion
74
Since both hair types follow first-order kinetics, Caucasian hair can be used for
further chemical investigations instead of Afro hair. One has to keep in mind,
however, that the obtained results for Caucasian hair in the following chapters
cannot be directly transferred to Afro hair but they give an impression of the
degree of the efficacy of treatments and the extent of hair damage.
3.4.2. Quality of the hair after modified relaxer treatments
To investigate the chemical influence of the additional thioles in the relaxing
process, the hair samples were subjected to AAA. Furthermore, the changes of
hair structure caused by alkali and thioles were investigated by DSC.
3.4.2.1. Amino acid composition
20 different AA were detected and determined after an acid hydrolysis of the
untreated and treated hair samples. Despite the addition of TGA, no mixed
disulfides or other derivates of TGA were found. The concentration of the
additional TGA seems to be too small. Therefore, one can assume that the
additional Cys in the relaxer cream also plays no significant role for the AA
composition. Cys itself is not determined in the AAA because it is oxidized by
air into CyS-SCy during the course of the AAA.
Tab. 7 summarizes the AA contents of the untreated and 12 min treated hair
samples. CyS-SCy and Lan are typed in bold since they are indicators of
chemical damage. It is shown that the content of the other AAs does not differ
significantly upon the different treatments. A matter of particular interest are the
changes of CyS-SCy and Lan depending on treatment time, as shown in Fig. 46
(cystine content) and 47 (lanthionine content).

3. Results and Discussion
75
Tab. 7: Amino acid content in mol% of untreated and treated (12 min relaxed) Caucasian hair samples. CyS-SCy and Lan are the only AAs which change significantly.
Untreated NaOH NaOH+ TGA
NaOH+ Cys No-Lye No-Lye
+ TGANo-Lye+ Cys
Cysteic acid 0.5 0.5 0.4 0.4 0.5 0.4 0.4
Aspartic acid+ asparagine 5.8 5.9 6.4 6.3 6.2 6.1 6.0
Threonine 7.7 8.3 7.7 7.8 7.7 7.7 7.7
Serine 10.1 10.3 9.7 10.8 10.7 10.4 10.0
Glutamic acid+ glutamine 13.8 13.4 13.8 14.0 13.8 14.0 13.6
Proline 8.7 9.0 8.0 7.9 8.5 8.7 9.0
Glycine 6.8 6.7 6.9 7.0 7.2 6.8 7.0
Alanine 4.8 5.1 5.1 5.0 5.0 5.1 4.8
Valine 6.4 6.6 6.3 6.5 6.2 6.6 6.4
Cystine 9.0 7.3 8.2 7.7 6.6 7.4 7.2
Methionine 0.5 0.5 0.6 0.4 0.5 0.4 0.5
Isoleucine 3.5 3.3 3.4 3.5 3.4 3.3 3.4
Leucine 7.5 7.2 7.8 8.2 7.5 7.7 7.9
Tyrosine 2.1 2.3 2.1 1.7 1.9 2.0 2.1
Phenylalanine 1.9 1.9 2.1 1.8 2.0 1.9 1.9
Ornithine 0.1 0.1 0.1 0.1 0.2 0.1 0.1
Lysine 2.6 2.7 2.7 2.7 2.7 2.7 2.8
Histidine 0.9 0.8 0.8 0.8 0.9 0.9 0.8
Arginine 7.2 7.5 7.3 6.4 7.1 6.9 7.0
Lanthionine 0.1 0.6 0.5 0.8 1.2 0.9 1.3
Amino acid
Treatment

3. Results and Discussion
76
Fig. 46: Cystine content versus treatment time. A: NaOH treatments B: No-Lye treatments The points are fitted using eq. 3.8.
4
5
6
7
8
9
10
0 5 10 15 20Relaxing time in min
Cys
tine
cont
ent i
n m
ol%
NaOHNaOH + TGANaOH + Cys
A
4
5
6
7
8
9
10
0 5 10 15 20Relaxing time in min
Cys
tine
cont
ent i
n m
ol%
No-LyeNo-Lye + TGANo-Lye + Cys
B

3. Results and Discussion
77
Fig. 47: Lanthionine content versus treatment time A: NaOH treatments B: No-Lye treatments
As guide for the eye, the data are emphasized by fitted curves using a polynomial Equation of second power.
0
0.5
1
1.5
2
0 5 10 15 20Relaxing time in min
Lant
hion
ine
cont
ent i
n m
ol%
NaOHNaOH + TGANaOH + Cys
A
0
0.5
1
1.5
2
0 5 10 15 20Relaxing time in min
Lant
hion
ine
cont
ent i
n m
ol%
No-LyeNo-Lye + TGANo-Lye + Cys
B

3. Results and Discussion
78
As a basic principle, No-Lye treatments degrade CyS-SCy and generate Lan
faster than NaOH treatments. These results point at a greater damage in hair and
can be explained by the higher pH of the No-Lye-cream compared to the NaOH-
cream.
Within both series the same ranking can be observed. Relaxer creams without
any thiole (NaOH and No-Lye) show the lowest amount of CyS-SCy, followed
by relaxer creams with additional Cys. The largest amount of CyS-SCy was
detected in samples which were treated with relaxer creams + TGA. It appears
that the alkali and the thioles compete for CyS-SCy. The thioles cleave
CyS-SCy into Cys. Thus, less β-elimination by alkali takes place. Since Cys is
air-oxidized into CyS-SCy in the course of the acid AAA (Scheme 7), the
amount of detected CyS-SCy is high.
On the assumption that the formed Cys is completely oxidized into CyS-SCy,
the difference of the initial CyS-SCy content and the detected CyS-SCy content
equals the amount of CyS-SCy which is degraded by alkali. Since TGA is a
stronger reducing agent than Cys, it gives a higher “protection” of the CyS-SCy
against β-elimination by alkali. Thus, more CyS-SCy is found for samples,
which are treated with relaxer creams + TGA. According to that, pure relaxer
creams provoke more degradation of CyS-SCy than thiole containing creams.

3. Results and Discussion
79
Relaxing treatment
COHC
NHCH2
S S CH2
CHCO
NH
COHC
NHCH2
S S CH2
CHCO
NH
COHC
NHCH2
S CH2
CHCO
NH
CO2HHC
NH2
CH2
S CH2
CHCO2H
NH2
CO2HHC
NH2
CH2
S S CH2
CHCO2H
NH2
CO2HHC
NH2
CH2
SH SH CH2
CHCO2H
NH2AAA
Lanthionine in protein chain
Reduction by thioles underalkaline conditions
Cystine in protein chain
Cysteinyl anion in protein chain
Lanthionine Cystine
Not reactedprotein chain
Alkaline reaction(β-elimination)
+
Cysteine
Oxidation by air
+
Cysteine
Acid hydrolysisAcid hydrolysisAcid hydrolysis
Scheme 7: Chemical reactions of cystine and its products during relaxing
treatment and AAA.

3. Results and Discussion
80
The degradation curves of CyS-SCy in Fig. 46 can be fitted by eq. 3.8. Thus, the
degradation of CyS-SCy follows first-order kinetics for all treatments. This
corroborates the prior statement that the difference between initial and
determined CyS-SCy content reflects the amount of CyS-SCy which is
degraded by alkali. If other parameters had influenced the CyS-SCy deter-
mination, the degradation would not follow first-order kinetic. Tab. 8 shows the
calculated first-order rate constant, k.
Tab. 8: First-order rate constants, k, ± standard error of the different treatments using eq. 3.8.
Treatment k in min-1
NaOH 0.017 ± 0.004
NaOH + TGA 0.009 ± 0.004
NaOH + Cys 0.015 ± 0.005
No-Lye 0.027 ± 0.004
No-Lye + TGA 0.016 ± 0.009
No-Lye + Cys 0.017 ± 0.004
Another ranking can be observed for the Lanthionine content. The data show
that the amount of Lan formed is not directly related to the degradation of
CyS-SCy by alkali under these conditions.

3. Results and Discussion
81
The lowest Lan content is obtained by a treatment of relaxer creams + TGA,
followed by a treatment of pure relaxer creams. Samples treated with relaxer
creams + Cys show the highest amount of Lan. Probably, the added free Cys
catches immediately the emerged dehydroalanine and forms Lan. Thus, most of
the generated dehydroalanine is reacting to Lan. The side reaction – the
formation of lysinoalanine – would be suppressed.
Arai et al. /57/ showed that after the reaction of wool with aqueous KCN the
sum of CyS-SCy and Lan stays constant over time from the start. This suggests
that all of the Lan originates from CyS-SCy residues and that the degraded
CyS-SCy is completely transferred into Lan. This behavior could not be
observed in this work. Fig. 48 shows the change of the sum of CyS-SCy plus
Lan content over time for different treatments. The values of the fitted curves of
Fig. 46 (CyS-SCy vs. t) and 47 (Lan vs. t) are used. The curve of the CyS-SCy
content is calculated using eq. 3.8. The values for k are taken from Tab. 8. The
Lan curves are fitted by a polynomial equation of second power:
cbxaxy ++= 2 (3.9)
The fitted values of a, b, and c are given in Tab. 9.
The sum of CyS-SCy plus Lan decrease with treatment time and rapidly
approaches equilibrium. The sum is thus not constant as Arai found in his
experiments. Therefore, beside the main reaction – the formation of Lan – side
reactions definitely have occurred. Products of possible side reactions (c.f.
Schemes 3 and 4) were not determined within this work. At equilibrium the
amount of formed Lan corresponds to the amount of degraded CyS-SCy by
alkali. The complete degraded CyS-SCy has formed Lan at this time. Side
reactions are totally suppressed.

3. Results and Discussion
82
Tab. 9: Calculated parameters of a polynomial equation of second power (eq. 3.9) for different treatments of the lanthionine data versus t.
Treatment a b c
NaOH 0.0011 0.0259 0.0485
NaOH + TGA 0.0008 0.0190 0.1079
NaOH + Cys 0.0009 0.0545 0.0377
No-Lye 0.0005 0.0864 0.0288
No-Lye + TGA 0.0001 0.1067 0.0786
No-Lye + Cys 0.0009 0.0649 0.0656
Fig. 48: The change of cystine content plus lanthionine contents versus relaxing time for different treatments.
The curves are calculated by resolving eq. 3.8 and 3.9 to t, equating them and using the values of Tab. 8 and 9.
6.5
7.5
8.5
9.5
0 5 10 15 20Relaxing time in min
Cys
+ L
an in
mol
%
No-LyeNo-Lye + TGANo-Lye + CysNaOHNaOH + TGANaOH + Cys

3. Results and Discussion
83
In 1969 Robson et al. postulated that when fibers are set in boiling water, a new
cross-linkage, namely, either Lan or lysinoalanine is formed for every SS-bond
undergoing cleavage. Thus, the sum of Lan and lysinoalanine corresponds to the
amount of degraded CyS-SCy /30/. Lysinoalanine was not determined in this
work. But if this behavior applies to an alkaline treatment as well, the
percentage of CyS-SCy which forms Lan should be constant in relation to
degraded CyS-SCy. This percentage is called lanthionine ratio, RLan, and is
defined by eq. 3.10; with [Lan]0, [CyS-SCy]0 being the initial amounts of Lan
and CyS-SCy, and [Lan]t, [CyS-SCy]t the amount of Lan and CyS-SCy at time t:
%100][][
][][
0
0
t
tLan SCyCySSCyCyS
LanLanR
−−−−
= (3.10)
Fig. 49 shows the lanthionine ratio versus time. For calculating the lanthionine
ratio the fitted values of Lan and CyS-SCy content have been used as outlined
above.
The data show that after an initial, strong increase in most cases the lanthionine
ratio rises continuously for all treatments. The steady increase of Lan can be
explained by the limited amount of lysine. While Cys, which is necessary to
form Lan, is continuously generated from CyS-SCy by alkali, lysine is used up
during the treatment.
Treatments with No-Lye convert a higher percentage of degraded CyS-SCy into
Lan than NaOH. This can be explained by the different pH values of the creams.
The higher concentration of hydroxyl ions in the No-Lye cream effects a faster
degradation of CyS-SCy. Since more dehydroalanine and Cys are formed, the
probability increases that these residues interact and form Lan. This
circumstance causes a higher concentration of Lan.

3. Results and Discussion
84
Fig. 49: Percentage of degraded cystine (by alkali) which is transformed into lanthionine (lanthionine ratio) versus relaxing time.
The curves are calculated for different times by using eq. 3.8 and 3.9, and the values of Tab. 8 and 9.
Relaxer creams + Cys generate the highest percentage of degraded CyS-SCy to
be transferred into Lan, followed by TGA containing creams. The smallest
amount of Lan is formed by the pure relaxer creams. The thioles generate
additional Cys by reduction (Scheme 7). Thus, the probability increases that a
dehydroalanine residue and a Cys residue can interact to form Lan. Therefore,
thiole containing treatments lead to a higher percentage of Lan. Moreover, the
additionally added Cys is able to react directly with dehydroalanine into Lan.
Such a Lan is obviously not a new crosslink between two protein fibers but
rather a Lan side chain. AAA is not able to differ between Lan side groups and
Lan bridges.
0
20
40
60
80
100
0 5 10 15 20Relaxing time in min
Lant
hion
ine
ratio
in %
No-Lye NaOHNo-Lye + TGA NaOH + TGANo-Lye + Cys NaOH + Cys
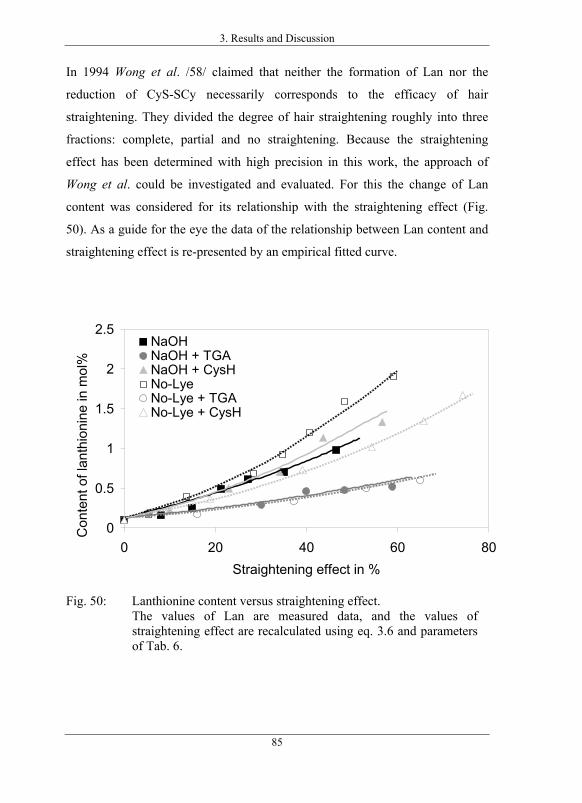
3. Results and Discussion
85
In 1994 Wong et al. /58/ claimed that neither the formation of Lan nor the
reduction of CyS-SCy necessarily corresponds to the efficacy of hair
straightening. They divided the degree of hair straightening roughly into three
fractions: complete, partial and no straightening. Because the straightening
effect has been determined with high precision in this work, the approach of
Wong et al. could be investigated and evaluated. For this the change of Lan
content was considered for its relationship with the straightening effect (Fig.
50). As a guide for the eye the data of the relationship between Lan content and
straightening effect is re-presented by an empirical fitted curve.
0
0.5
1
1.5
2
2.5
0 20 40 60 80Straightening effect in %
Con
tent
of l
anth
ioni
ne in
mol
% NaOH
NaOH + TGANaOH + CysHNo-LyeNo-Lye + TGANo-Lye + CysH
Fig. 50: Lanthionine content versus straightening effect. The values of Lan are measured data, and the values of
straightening effect are recalculated using eq. 3.6 and parameters of Tab. 6.

3. Results and Discussion
86
If the straightening effect was inherently dependent on the Lan content, the
curves for all treatments would fall on top of each other. This is not observed. It
is thus concluded that straightening conditions lead, as expected, to an
increasing formation of Lan. This effect parallels that of hair straightening, but it
is not the primary mechanism for permanent hair straightening. The above
mentioned statement of Wang et al. /58/ is thus corroborated.
The straightening effect is mainly based on the cleavage of disulfide bridges.
Since the CyS-SCy content according to the AAA reflects only the amount of
CyS-SCy which is degraded by alkali, and not additionally the amount of
CyS-SCy which is reduced by the thioles, the influence of the thioles cannot be
determined. Thus, a comparison of the straightening effect with the CyS-SCy
content is not meaningful.

3. Results and Discussion
87
3.4.2.2. Thermal properties
Denaturation enthalpy and temperature of modified relaxed Caucasian hair are
measured by using high-pressure differential scanning calorimetry (HP-DSC).
While the enthalpy relates to the native α-helical content, the temperature gives
evidence of the thermal stability of the matrix, which is the non-helical fraction
of the fiber.
Fig. 51 shows the relationship between denaturation enthalpy and time of
relaxing. As a guide for the eye the data of the relationship between denaturation
enthalpy and relaxing time are represented by an empirical fitted curve. The
denaturation enthalpy decreases with the duration of treatment. The ranking for
NaOH and No-Lye is equal in both series (Fig. 51). The strongest decline of
enthalpy is observed for the TGA containing treatments. Treatments with pure
and with Cys containing relaxer creams cause nearly the same reduction of
denaturation enthalpy. After 20 min NaOH and NaOH + Cys samples have lost
around 50 % of their helix content, NaOH + TGA samples already around 65 %.
In general, the enthalpies for the No-Lye series - due to their higher pH - are
lower than for the NaOH series. Applications of the pure and of the Cys
containing No-Lye cream lead to only around 1/3 of the initial helix content
after 20 min processing time; the TGA treated samples yield only 12 %.
The analysis of the relationship between denaturation enthalpy and CyS-SCy
content, at equal relaxing times t, shows to what extent the denaturation enthalpy
depends on the amount of CyS-SCy, which is cleaved by alkali. Fig. 52
represents this relationship. The content of degraded CyS-SCy, ∆[CyS-SCy], is
defined as the initial amount of CyS-SCy, [CyS-SCy]0, minus the determined
amount of CyS-SCy at time t, [CyS-SCy]t, as shown in Equ. 3.11.

3. Results and Discussion
88
Fig. 51: Denaturation enthalpy versus relaxing time for different treatments. A: NaOH treatments B: No-Lye treatments
0
5
10
15
20
0 5 10 15 20Relaxing time in min
Den
atur
atio
n en
thal
py in
J/g
NaOHNaOH + TGANaOH + Cys
A
0
5
10
15
20
0 5 10 15 20Relaxing time in min
Den
atur
atio
n en
thal
py in
J/g
No-LyeNo-Lye + TGANo-Lye + Cys
B

3. Results and Discussion
89
t0 SCy]-[CySSCy]-[CySSCy]-[CyS −=∆ (3.11)
The amount of degraded CyS-SCy is calculated by using the fitted data of
CyS-SCy and the initial CyS-SCy content with [CyS-SCy]0 = 9.0 mol%. The
data of CyS-SCy content are calculated using eq. 3.8 and 3.11, the values for k
are taken from Tab. 8. The data of denaturation enthalpy are measured data. As
a guide for the eye the data of the relationship between denaturation enthalpy
and relaxing time are represented by an empirical fitted curves (grey, broken
lines).
Fig. 52: Relationship between denaturation enthalpy, ∆HD, and the amount of alkaline degraded cystine, ∆[CyS-SCy], of Caucasian hair.
The data of CyS-SCy content are calculated using eq. 3.8 and 3.11, the values for k are taken from Tab. 8. The data of denaturation enthalpy are measured data.
0
0.5
1
1.5
2
2.5
0 20 40 60 80Straightening effect in %
Con
tent
of l
anth
ioni
ne in
mol
% NaOH
NaOH + TGANaOH + CysNo-LyeNo-Lye + TGANo-Lye + Cys

3. Results and Discussion
90
Generally, the more CyS-SCy is degraded by alkali the smaller the residual
enthalpy. Since the denaturation enthalpy reflects the amount of helix content in
hair, degradation of CyS-SCy leads to denaturation of the protein chains and
thus to a decrease of the helix content.
The curves for both pure relaxer creams treated samples lie on top of each other.
The same behavior can be observed for the curves of samples which were
treated with Cys or TGA containing creams. The TGA containing creams cause
the strongest reduction of enthalpy, the pure relaxer creams the lowest. When
2 mol% of CyS-SCy are degraded by alkali, the samples treated with pure
relaxer creams have already lost 50 % of their initial native helix content; for the
Cys and TGA containing creams the value reaches 60 % and 80 %, respectively.
Any alteration of the protein structure leads to a change of denaturation
enthalpy. The greater reduction of enthalpy by the thiole containing creams is
attributed to the additional cleavage of disulfide bridges. The overlapping curves
for NaOH and No-Lye treated samples show that the mechanism of the alkaline
degradation of CyS-SCy is not dependent on pH for the investigated pH range.
To describe empirically the relationship between alkaline degraded CyS-SCy,
∆[CyS-SCy], and denaturation enthalpy, ∆HD, the data are fitted by using the
following simple exponential algorithm, with 0DH∆ as initial amount of
denaturation enthalpy and h as fitting parameter:
hSCyCyS
DD eHH][
0−∆
−∆=∆ (3.12)
The calculated values for the fitting parameter, h, are given in Tab. 10.

3. Results and Discussion
91
Tab. 10: Fitting parameter, h (± standard error) of eq. 3.12 (relationship between denaturation enthalpy and alkaline degraded cystine) for the different creams.
Treatment h in mol%
NaOH
No-Lye 3.2 ± 0.4
NaOH + TGA
No-Lye + TGA 1.3 ± 0.2
NaOH + Cys
No-Lye + Cys 2.3 ± 0.3
In 2000 Ogawa et al. /59/ reported on the relationship between denaturation
enthalpy and degree of supercontraction, LC, of Asian hair fibers. The extent of
supercontraction was determined by measuring the length of the straight hair in
a microcapillary before treatment. The extent of supercontraction, LC, was
calculated as the ratio of the length change, (L0 – L) over the initial dry length,
L0:
%1000
0
LLL
LC−
= (3.13)
They obtained an approximately linear relationship between supercontraction
and denaturation enthalpy and claimed: “Supercontraction up to a level of 10 %
is due to the breakdown of the α-crystallites. Higher supercontraction is traced
back to alterations resulting from the changes in the matrix components, in the
cortex, as well as in non-keratin components of the cell membrane complex.”

3. Results and Discussion
92
Ogawa et al. /59/ evaluated the effectiveness of straightening as a function of
supercontraction. Their results, as well as those of Wang et al. /58/, showed that
permanent hair straightening is achieved by supercontraction above 5 %. In a
practical application, a range of about 5 to 8 % supercontraction of hair has been
recommended for successful straightening, while at higher contraction levels the
smoothness of the fiber surface tended to be lost /60/. Ogawa et al. /60/ assume
that supercontraction of less than 10 % is caused by randomization of the α-
helix because at this level no more helical content could be found.
Ogawa et al. /59/ divided the degree of hair straightening into three fractions
like Wang et al. /58/ has done as described above. Since in this thesis the
straightening effect has been exactly determined, it is possible to investigate the
relationship between the degree of hair straightening and helical content as
related to changes of the denaturation enthalpy.
Fig. 53 illustrates the relationship graphically, whereby denaturation enthalpy
and helical content are plotted on the abscissa. Helical content expresses the
denaturation enthalpy in percent as shown in eq. 3.14, with 0DH∆ as initial
amount of denaturation enthalpy, and tDH∆ as amount of denaturation enthalpy
at time t:
%1000D
tD
HHcontentHelical
∆∆
= (3.14)

3. Results and Discussion
93
Fig. 53: Dependence of the straightening effect on the denaturation enthalpy. The results show that the lower the enthalpy (and the lower the helical content),
the higher the degree of straightening. To achieve even a small straightening
effect, the helical content would have to be diminished substantially. A loss of
helical content after relaxing of around 10-30 % leads only to a straightening
effect of around 5 % (broken, horizontal grey line). To reach the maximum
degree of hair straightening of around 80 % (horizontal grey line), 60 - 90 % of
the α-crystallites must be destroyed. It strongly depends on the composition of
relaxing cream to what extent the helical content must be destroyed. Pure relaxer
creams reduce the amount of helical content to a higher degree than thiole
containing creams to reach equal straightening effect. Thus, fewer α-crystallites
must be destroyed to obtain identical hair straightening using additional thioles
during relaxing. The difference between thiole containing and pure relaxer
creams is not so highly developed within the NaOH -series.
0
20
40
60
80
100
0 5 10 15 20Denaturation enthalpy in J/g
Stra
ight
enin
g ef
fect
in %
NaOHNaOH + TGANaOH + CysNo-LyeNo-Lye + TGANo-Lye + Cys
Helical content in %10050200

3. Results and Discussion
94
For straightening effects between 5 and 80 % the curves demonstrate a nearly
linear relationship between loss of enthalpy and degree of straightening. Ogawa
et al. /60/ found an approximately linear relationship between supercontraction
and denaturation enthalpy. Thus, it can be assumed that the straightening effect
will have a linear dependency on the degree of supercontraction of the hair fiber.
Fig. 54 illustrates the relationship between denaturation temperature with
relaxing time for different treatments. As a guide for the eye, empirical curves
are plotted to represent the course of the data.
The result shows that the denaturation temperature decreases within the first
5 min for all treatments. Beyond this time the denaturation temperature remains
largely unchanged. These results suggest that mainly the non-helical domains of
the outer area of the fiber (especially the cuticle) are affected by alkali.
However, the strong decrease of denaturation enthalpy and the only slight
decrease of the denaturation temperature show that alkali has a greater effect on
the helical part than on the non-helical domains of the hair fiber.
In 1987 Wortmann and Souren /61/ reported similar results for the reduction of
disulfide bridges on the basis of mechanical properties. They found that
reduction mainly affects the properties of the α-helical filaments in the hair
fiber, while the properties of the matrix are largely unchanged.

3. Results and Discussion
95
Fig. 54: Denaturation temperature versus relaxing time for different
treatments. A: NaOH treatments B: No-Lye treatments
130
140
150
160
0 5 10 15 20Relaxing time in min
Den
atur
atio
n te
mpe
ratu
re in
°C
NaOH
NaOH + TGA
NaOH + Cys
A
130
140
150
160
0 5 10 15 20Relaxing time in min
Den
atur
atio
n te
mpe
ratu
re in
°C
No-LyeNo-Lye + TGANo-Lye + Cys
B

3. Results and Discussion
96
3.5. Permanent waving of relaxed hair
The ability to curl the hair after a relaxing treatment would be a new way to
obtain desirable hair styling. In this chapter the wave behavior of relaxed hair is
examined and the thus treated hair is characterized.
3.5.1. Performing single hair waving
The determination of the permanent wave set is performed through the ring test
described by Wortmann and Souren /61/. Single hair fibers are wound around a
steel rod and fixed. After the treatment the hairs are cut along the rod. The
resulting hair rings, usually about 2 - 4 mm, are wetted and the distance of the
ring ends, s, is determined (Fig. 55).
Fig. 55: Hair ring after wetting. S = Distance between fiber ends
d = Diameter of the hair ring
The spontaneous bending relaxation, caused by wetting the hair, is complete
after 10 min and the remaining set of the hair is traced back to the influence of
covalent bonds. The ratio of the cylindrical rod diameter (dR) over the average
hair ring diameter ( d ) yields the degree of set of permanent wave, SP (perm set,
eq. 3.15).
Hair ring
1 mm sd

3. Results and Discussion
97
(3.15)
When the set is smaller than 50 %, the diameter cannot be measured anymore
directly. It is then determined by using the measurable distance between the
fiber ends, s, and by the length of the hair ring, lR. The diameter, d, and the
distance between the fiber ends, s, are linked by eq. 3.16.
(3.16)
There is no precise mathematical solution for the recalculation of d. By plotting
values of s versus d, the resulting curve makes it possible to assign the
experimentally determined distance of ring ends, s, to the diameter, d.
One can assume that relaxed hair would show a lower perm set than untreated
hair. Perm sets less then 40 % possess high standard errors because of the
difficulty to determine the real distance of the ring ends. To avoid small values
of perm set - even with longer relaxing treatment times - the starting point
(“untreated” hair) should show a perm set around 95 %. The intensity of
permanent wave depends on the pH and the concentration of the TGA solution.
Sauer /62/ has shown that a reduction solution of pH 9.0 and a TGA
concentration more than 5 % w/w produces high perm sets when the reducing
species is present in a large excess.
%100ddS R
P =
dlds Rsin=

3. Results and Discussion
98
The permanent waving process is performed in two steps: #1 reduction with a
TGA solution, and #2 oxidation with an unbuffered 2.3 % w/w hydrogen
peroxide solution. The concentration of the most suitable TGA solution has to
be determined. The perm set should be around 95 % for this treatment. A lower
initial value could lead to inappropriately small results of the relaxed and
subsequently permed hair samples. Perm sets around 100 % or higher provoke
partial supercontraction of hair, an additional damage which is undesirable.
Three different TGA concentrations were tested at pH 9.0. The results are
summarized in Tab. 11. It was shown that a TGA concentration of 8 % w/w at
pH 9.0 yields a perm set of 95.3 %; the optimum starting point of previously
untreated hair for further investigations.
Tab. 11: Perm set, 0PS , of previously untreated Caucasian hair at different
TGA concentrations. Perm parameters: Reduction with TGA solution (pH 9.0) for 10 min at 30 °C, rinsing for 15 min at RT, oxidation with H2O2 solution (3 %) for 10 min at 30 °C, rinsing for 10 min at RT.
Concentration of TGA in % w/w
Perm set 0PS
in % ± standard error
6.0 88.4 ± 1.9
7.0 93.5 ± 0.6
8.0 95.3 ± 0.7

3. Results and Discussion
99
3.5.2. Quality of hair after treatment
Besides the waveability the relaxed and permed Caucasian hair samples were
also investigated by AAA and DSC.
3.5.2.1. Waveability of hair
Fig. 56 shows the perm set of the hair samples which had previously been
treated with the different relaxer creams. For a better differentiation, samples
which were subsequently permed are annotated with “PW” (permanent wave).
As expected, perm set decreases with relaxing time. The ranking of perm set
within the treatment series is as follows. The samples without thioles show the
lowest perm set, followed by the samples containing Cys. The highest perm set
is achieved after relaxing with the TGA-containing samples. The ranking can be
explained by the number of remaining CyS-SCy bridges and Cys residues after
the relaxing treatment. Permanent waving is mainly a reaction of these groups;
firstly reduction of the disulfide bridges into Cys, followed by oxidation of the
Cys back into CyS-SCy (Scheme 1). The remaining CyS-SCy and the Cys
residues are given by the amount of CyS-SCy which can be detected after the
relaxing treatment. This has been shown in the previous chapter. Thus, the
ranking of perm set corresponds to the amount of CyS-SCy after the relaxing
treatment (Fig. 46). The stronger the reduction of CyS-SCy during relaxing
treatment, the better is the waveability of hair.

3. Results and Discussion
100
Fig. 56: Waveability of previously relaxed Caucasian hair. A: NaOH treatments B: No-Lye treatments
60
70
80
90
100
0 4 8 12 16Relaxing time in min
Per
m s
et in
%
No Lye, PWNo Lye + TGA, PWNo Lye + Cys, PW
B
60
70
80
90
100
0 4 8 12 16Relaxing time in min
Per
m s
et in
%
NaOH, PWNaOH + TGA, PWNaOH + Cys, PW
A

3. Results and Discussion
101
There seems to be generally a linear relationship between perm set and relaxing
time, described by eq. 3.17, where SP(t) is the perm set at relaxing time t and kS
the effective rate constant.
tktStS SPP −= )()( 0 (3.17)
The slope, kS, is given in Tab. 12 for the different treatments.
Tab. 12: Calculated rate constants for the relation between perm set and
relaxing time for differently relaxed and subsequently permanent waved (PW) hair
Treatment Rate constant, kS
± standard deviation in min-1
NaOH, PW 1.5 ± 0.2
NaOH + TGA, PW 0.7 ± 0.4
NaOH + Cys, PW 1.0 ± 0.2
No-Lye, PW 2.1 ± 0.6
No-Lye + TGA, PW 0.9 ± 0.5
No-Lye + Cys, PW 1.6 ± 0.2

3. Results and Discussion
102
The relationship between perm set and straightening effect shows to what extent
hair can be sufficiently waved when it is relaxed before. The fit equations of the
straightening effect (3.5) and the perm set (3.18) are compared via the relaxing
time as eqs. 3.18 and 3.19 show, with SP(t) being the perm set at relaxing time t,
SP(t0) the perm set for the untreated hair, kS the effective rate constant of perm
set, ∆t the time lag of straightening, τ the characteristic straightening time, ESt(t)
the straightening effect at time t, and maxStE the maximum straightening effect
(100%):
−−∆=
−− max
0 )(1ln
)()(
St
St
S
PP
EtE
tk
tStSτ (3.18)
Transformation leads to the dependence of the perm set on the straightening
effect:
−−∆−= max0
)(1ln)()(
St
StSPP E
tEtktStS τ (3.19)
A graphical plot of this dependency is shown in Fig. 57. The data of Tab. 6 and
12 are used for calculations of the straightening effect and the perm set at time t
with SP(t0) = 95.3 %.
Generally, the more the hair is straightened, the less it can be waved. The
creams of the No-Lye-series preserve hair waveability to a higher degree than
the creams of the NaOH-series for equal straightening effects. Waveability is
mainly attributed to the amount of intact disulfide bridges /3/. The longer the
hair is relaxed, the lower is the amount of CyS-SCy and thus the poorer the hair
can be waved. Furthermore, hair which is relaxed by creams of the NaOH series
has a higher amount of intact disulfide bridges than hair which is relaxed by
creams of the No-Lye series (c.f. chapter 3.4.2.1.).

3. Results and Discussion
103
Fig. 57: Perm set versus straightening time. The data are calculated by using eq. 3.18, with SP(t0) = 95.3 % and the parameter values of Tabs. 6 and 12.
Generally, a perm set of around 85 % is practically an acceptable waving value.
In order to obtain a perm set of around 85 % (grey horizontal line in Fig. 57), the
hair must not be straightened by more than 10 -20 % with pure relaxer creams,
30 – 40 % with Cys containing creams, and 60 - 80 % with TGA containing
creams. Let one assume that for Afro hair a minimum straightening effect of
50 % (grey vertical line in Fig. 57) is needed in order to be manageable as to put
one’s hair on curlers, only treatments with TGA containing creams reach
subsequently suitable waving efficacy of around 85 %.
As an example, Tab. 13 shows the calculated values of possible perm set when
the hair is 50 % straightened. Furthermore, the relaxing times which are
necessary to reach a straightening of 50 % are displayed. The data are calculated
by using eq. 3.18 and 3.5 with SP(t0) = 95.3 % as well as the data of Tabs. 6 and
12.
50
60
70
80
90
100
0 20 40 60 80Straightening effect in %
Per
m s
et in
%
NaOHNaOH + TGANaOH + CysNo-LyeNo-Lye + TGANo-Lye + Cys

3. Results and Discussion
104
Tab. 13: Calculated values for perm set and relaxing time for different treatments, when hair is 50 % straightened.
Eq. 3.5 and 3.18 with SP(t0) = 95.3 % and the data of Tabs. 6 and 12 were used for the calculation.
Treatment Perm set
in %
Relaxing time
in min
NaOH, PW 62.7 21.7
NaOH + TGA, PW 86.6 12.4
NaOH + Cys, PW 78.0 17.3
No-Lye, PW 62.4 15.7
No-Lye + TGA, PW 90.3 5.6
No-Lye + Cys, PW 82.5 8.0
Tab. 13 shows that treatments of hair with TGA containing creams produce high
perm set values at short relaxing times. Even Cys containing creams lead to
better results than the pure relaxer creams.

3. Results and Discussion
105
3.5.2.2. Amino acid composition
20 different AAs were detected and determined after acid hydrolysis of the
previously relaxed and permed hair samples. Tab. 14 exemplifies the AA
content of permed hair which was either previously untreated hair or relaxed for
12 min with the different relaxer creams. The AAs CyS-SCy and Lan are bold
typed to highlight significant changes.
The relationships between CyS-SCy and Lan content of permed hair with the
previous relaxing time is shown in Fig. 58 (CyS-SCy content) and 59 (Lan
content). In order to compare the AA contents of relaxed hair before and after
perming, the results for both the relaxed (cf. Fig. 46/CyS-SCy and 47/Lan) and
the relaxed plus permed hair are shown in the same figure. The fitted AA values
for the relaxed hair (eq. 3.8 and 3.9, and data of Tabs. 8 and 9) are drawn as
curves; the experimental AA contents for the relaxed plus permed hair are given
as dots. Additionally, the value of only permed (relaxing time = 0) hair is
shown.
The results demonstrate that a permanent wave leads to a further decrease of the
CyS-SCy (Fig. 58) and increase of the Lan content (Fig. 59) for previously
relaxed hair. In contrast to this, previously untreated hair shows no increase of
Lan after the perm treatment.

3. Results and Discussion
106
Fig. 58: Change of CyS-SCy content after a perm treatment versus previous relaxing time. The curves represent the fitted values of the only relaxed hair; the dots are the determined CyS-SCy contents of the relaxed and permed hair; = CyS-SCy content of only permed hair.
A: NaOH treatments B: No-Lye treatments
4
5
6
7
8
9
10
0 3 6 9 12 15Relaxing time in min
Cys
tine
cont
ent i
n m
ol%
NaOH, PWNaOH + TGA, PWNaOH + Cys, PW
NaOHNaOH + TGANaOH + Cys
PW
A
4
5
6
7
8
9
10
0 3 6 9 12 15Relaxing time in min
Cys
tine
cont
ent i
n m
ol%
No-Lye, PWNo-Lye + TGA, PWNo-Lye + Cys, PW
No-LyeNo-Lye + TGANo-Lye + Cys
PW
B

3. Results and Discussion
107
Fig. 59: Change of Lan content after a perm treatment versus previous relaxing time. The curves represent the fitted values of the only relaxed hair; the dots are the determined Lan contents of the relaxed and permed hair; = Lan content of only permed hair.
A: NaOH treatments B: No-Lye treatments
0
0.5
1
1.5
2
0 3 6 9 12 15Relaxing time in min
Lant
hion
ine
cont
ent i
n m
ol%
NaOH, PWNaOH + TGA, PWNaOH + Cys, PW
NaOHNaOH + TGANaOH + CysPW
A
0
0.5
1
1.5
2
0 3 6 9 12 15Relaxing time in min
Lant
hion
ine
cont
ent i
n m
ol%
No-Lye, PWNo-Lye + TGA, PWNo-Lye + Cys, PW
No-LyeNo-Lye + TGANo-Lye + Cys
PW
B

3. Results and Discussion
108
Tab. 14: Amino acid content in mol% of permed Caucasian hair which was either previously untreated or relaxed by different treatments.
PW NaOH
PW
NaOH + TGA
PW
NaOH + Cys PW
No-Lye PW
No-Lye + TGA
PW
No-Lye + Cys PW
Cysteic acid 2.1 1.9 1.9 2.0 1.8 1.7 1.8
Aspartic acid + asparagine 6.2 6.3 6.4 6.3 6.2 6.1 6.3
Threonine 7.7 7.8 7.5 7.8 7.7 8.1 7.4
Serine 10.6 10.4 10.4 10.5 10.7 11.3 10.5
Glutamic acid + glutamine 14.0 13.7 12.8 13.0 13.7 13.5 13.9
Proline 8.9 8.8 8.7 9.2 8.4 7.7 8.1
Glycine 6.8 6.9 6.9 6.9 7.2 7.0 6.9
Alanine 4.8 5.1 5.2 5.2 5.1 5.2 4.7
Valine 6.5 6.5 6.6 6.6 6.5 6.5 6.3
Cystine 7.8 6.2 6.9 6.7 6.5 7.1 6.5
Methionine 0.5 0.4 0.4 0.3 0.2 0.1 0.3
Isoleucine 3.2 3.3 3.6 3.3 3.1 3.0 3.4
Leucine 6.6 7.1 7.5 7.4 7.2 7.1 7.4
Tyrosine 2.1 2.1 2.0 1.4 1.8 1.8 2.2
Phenylalanine 1.9 1.6 1.7 1.8 1.8 1.8 1.8
Ornithine 0.2 0.2 0.2 0.2 0.2 0.2 0.3
Lysine 2.6 2.7 2.8 2.7 2.8 2.9 2.8
Histidine 0.9 0.9 0.9 0.9 0.8 0.8 0.9
Arginine 6.5 6.7 6.8 6.8 6.8 6.8 6.7
Lanthionine 0.1 1.3 0.8 1.0 1.4 1.2 1.7
Treatment
AA

3. Results and Discussion
109
Lan originates from the reaction between dehydroalanine and Cys. Dehydro-
alanine is rarely formed during perm treatment. The formation of Lan in the
previously relaxed samples indicates that after the relaxing treatment part of the
alkaline degraded CyS-SCy remains as dehydroalanine. The decrease of
CyS-SCy and increase of Lan after waving is nearly equal for all relaxing
treatments. The decrease of CyS-SCy varies between 0.7 and 1.2 mol%; the
increase of Lan between 0.2 and 0.5 mol%. The increase of CySO3H is between
1.2 and 1.6 mol%.
Thus, alkaline degraded CyS-SCy which is not transferred into Lan, gives rise to
cysteic acid formation. The damage imposed by the subsequent perm treatment
corresponds to the damage associated with a normal permanent wave. The
former relaxing treatment does not intensify the damage related to the
permanent wave.
3.5.2.3. Thermal properties
Fig. 60 shows the changes of denaturation enthalpy after permanent wave of hair
previously relaxed for different length of time. The enthalpy values as well as
the curves for the just relaxed hair are given to enable a direct comparison.
The enthalpy decreases after further perm treatment. Permanent waving thus
leads to an increased degradation of helical domains in hair. The decrease of
enthalpy of hair is stronger for hair which has been previously treated with a
TGA containing relaxer cream, than for hair which has previously treated with
Cys containing relaxer cream or with pure relaxer creams. This indicates that
additional TGA during the relaxing process enables a further denaturation of
helix domains in the hair fiber during the waving treatment. The decrease of
enthalpy after a subsequent wave is approximately the same for both kinds of
creams.

3. Results and Discussion
110
Fig. 60: Relationship between denaturation enthalpy of relaxed and subsequently permed hair and relaxing time. The curves represent the fitted values of enthalpy for the only relaxed hair; the dots are values for the relaxed and permed hair; = enthalpy of only permed hair. Error bars represent the standard deviation.
A: NaOH treatments B: No-Lye treatments
0
5
10
15
20
0 3 6 9 12 15Relaxing time in min
Den
atur
atio
n en
thal
py in
J/g
No-Lye, PWNo-Lye + TGA, PWNo-Lye + Cys, PW
No-LyeNo-Lye + TGANo-Lye + Cys
PW
B
0
5
10
15
20
0 3 6 9 12 15Relaxing time in min
Den
atur
atio
n en
thal
py in
J/g
NaOH, PW NaOH + TGA, PWNaOH + Cys, PW
NaOHNaOH + TGANaOH + Cys
PW
A

3. Results and Discussion
111
A different behavior is observed for the denaturation temperature. The
relationship between denaturation temperature and relaxing time is shown in
Fig. 61. The denaturation temperature of permed hair is lower than that of
untreated hair. Therefore, the matrix around the helical domains is altered. In
contrast to this, a higher denaturation temperature is observed for previously
relaxed hair after perm treatment. Whereas the denaturation temperature of the
NaOH series increases by around 2 °C independent of relaxing time or of cream
composition, the denaturation temperature of the No-Lye-series treatments
increases with relaxing time. The increase of denaturation temperature can be
caused by a strengthening of the matrix by additional covalent bonds, e.g.
disulfide bridges or isodipeptide bonds.
Fig. 62 shows the dependence of perm set on the helical content of hair (before
waving). The values of the fitted curves of Fig. 60 (denaturation enthalpy versus
time) and of Fig. 56 (perm set versus relaxing time) are used for Fig. 62. The
curves of perm set are calculated using eq. 3.18, the values for the effective rate
constant, kS, are taken from Tab. 12. The data of the relationship between
denaturation enthalpy and perm set are represented by an empirical fitted curve.
The less helical domains are detected the worse is the perming performance of
the hair. But perm set is not only dependent on denaturation enthalpy. It is of
great importance how the helical content has been reduced. The NaOH-series
and No-Lye-series differ in pH. Therefore, the overlapping curves express that
the reactions during relaxing are not dependent on pH but on the ingredients of
the creams.

3. Results and Discussion
112
Fig. 61: Relationship between denaturation temperature of relaxed and subsequently permed hair with relaxing time.
The curve represents the fitted values of denaturation temperature for the only relaxed hair (which are nearly the same for all treatments); the dots are the determined denaturation temperatures of the relaxed and permed hair and of only permed hair, respectively. Error bars represent the standard deviation.
A: NaOH treatments B: No-Lye treatments
130
140
150
0 3 6 9 12 15Relaxing time in min
Den
atur
atio
n te
mpe
ratu
re in
°C
NaOH, PWNaOH + TGA, PWNaOH + Cys, PWPWNaOH
A
130
140
150
0 3 6 9 12 15Relaxing time in min
Den
atur
atio
n te
mpe
ratu
re in
°C
No-Lye, PWNo-Lye + TGA, PWNo-Lye + Cys, PWPWNo-Lye
B

3. Results and Discussion
113
Fig. 62: Dependence of perm set on denaturation enthalpy. The data of perm set are calculated using eq. 3.16, the parameters
are taken from Tab. 12. The data of denaturation enthalpy are measured data.
Hair which is relaxed with TGA containing creams reaches higher perm set with
equal helix content compared to hair which is relaxed with pure relaxer creams
or Cys containing creams. TGA reduces a higher amount of disulfide bridges
than Cys during relaxing. This reduction leads to change of the molecular
structure of the helical domains. The domains change into amorphous structure
and thus, less denaturation enthalpy is detected with DSC. Since the protein
fiber itself is not completely destroyed, it can be re-structured by a permanent
wave. Cys is able to reduce disulfide bonds, too, but re-oxidation of the bridges
takes place more often during relaxing when additional Cys is available. Hence,
the amount of helical domains does not alter considerably for Cys containing
creams compared to pure relaxing creams.
0
5
10
15
20
5060708090Perm set in %
Den
atur
atio
n en
thal
py
of re
laxe
d ha
ir in
J/g
NaOHNaOH + TGANaOH + CysNo-LyeNo-Lye + TGANo-Lye + Cys

3. Results and Discussion
114
3.6. Swelling and diffusion experiments
Tests for waveability of relaxed hair showed that the longer the hair was relaxed,
the lower the waveability. Since the waveability of relaxed hair is dependent on
the amount of not degraded CyS-SCy of hair, it is of interest to determine which
CyS-SCy bridges of the fiber are destroyed by alkali. There are two possibilities
for the alkaline degradation of the fiber. Either a rapid diffusion of alkali takes
place and the reactions of alkali with the hair proteins occur more or less over
the whole fiber, or the diffusion of the reagent is time dependent. This would
lead to a diffusion front of the reagent and thus to a reaction front. To resolve
this issue, Sauer /62/ used the method of Herrmann /63/ to monitor the
penetration of TGA into fibers pre-dyed with iodine. The method is based on the
assumption that the cleavage of disulfide bridges and the disproportion of iodine
occur simultaneously. The swelling of the hair fiber and the removal of color,
which is caused by the disproportion of iodine, were observed under a light
microscope and recorded on video. On the assumption that the cleavage of
disulfide bridges is the prerequisite for fiber swelling, for the alkali treatment the
analysis of the swelling yields information on the kinetics of the β-elimination.
Conclusions can be drawn about diffusion and reaction from the nature and rate
of color removal.
3.6.1. Experimental aspects
Since the color of iodine dyed Afro hair is very similar to the natural color of
Afro hair it is not possible to distinguish between an iodine dyed and a naturally
colored area of Afro hair. Thus, blond, untreated Caucasian hair was used for the
experiments.
The hair was dyed with aqueous iodine and pre-swollen with water. Excess
water is then removed and replaced by the alkaline solution. The fiber

3. Results and Discussion
115
environment was kept constant by a continuous supply of fresh solution.
Swelling and color changes were recorded on video and subsequently analyzed
by image analysis. Alkaline solutions with pH 12.4, 12.8 and 13.4, as well as
solutions which contained 1 % w/w Cys or TGA at pH 12.8 were investigated.
The pH was adjusted with sodium hydroxide.
3.6.2. Analysis of swelling
In the previous chapter it was shown that degradation of CyS-SCy during
relaxing follows pseudo-first order kinetics:
(3.20)
Where α is the degree of conversion (0 ≤ α ≤ 1). The end point of the reaction is
reached when all disulfide bridges are broken. k is the rate constant. Integration
results in eq. 3.21:
(3.21)
In a plot of -ln(1-α) against time the slope of the straight line provides the rate
constant, k.
Reese and Eyring /64/, Kubu and Montgomery /65/, Katz and Wakelin /66/, and
Wickett /67/ showed that the stress developed in hair fibers, subjected to a
defined strain, is directly proportional to the concentration of intact disulfide
bridges. Since swelling (and thus the increase in volume) is caused by breaking
disulfide bridges, a direct relationship is assumed between the number of broken
disulfide bridges, ∆[SS], and the increase of hair volume, ∆V:
(3.22)
)1( αα−= k
dtd
kt=−− )1ln( α
VSS ∆∝∆ ][

3. Results and Discussion
116
On this basis the increase of volume during the reaction is used as a measure of
the extent of reaction. The conversion, α, is thus defined as follows:
0
0
VVVVt
−−
=∞
α (3.23)
Where Vt is the volume of hair at time t, and V0 and V∞ are the initial and final
hair volume, respectively. Instead of the volume, the diameter (d) of the hair is
measured. It is assumed that the volume of hair increases homogenously during
the reaction. Volume changes related to changes of fiber length are neglected.
Thus, volume and diameter of hair are linked by eq. 3.24:
2
4dV π
= (3.24)
Since the reaction time is limited for practical reasons, a direct determination of
the maximum diameter is not possible (hair dissolves at longer reaction times of
alkaline treatments). To determine the final diameter (dmax) of hair, the diameter,
dt, were fitted by the exponential function 3.25, which describes first-order
kinetics. Thus, parameter b is the rate constant of this reaction.
0max )1( dedd btt +−= −
(3.25)
The conversion, α, is calculated by eq. 3.26, with d0 being the diameter of the
untreated, pre-swollen hair:
20
2max
20
2
ddddt
−−
=α (3.26)
Fig. 63 shows the typical process of swelling of a hair fiber at pH 13.4. Always
the same region of the fiber is shown. The alkali reacts with the elemental iodine
(black areas) to form the colorless products iodate and iodide (scheme 6).

3. Results and Discussion
117
3 I2 + 6 OH- IO3- + 5I- + 3 H2O
Scheme 6: Disproportionation of iodine into iodate and iodide.
Start 28 sec
Fig. 63: Process of swelling of a blond, Caucasian hair fiber at pH 13.4. The
pictures always show the same segment of the hair fiber for different treatment times.
Fig. 64 shows the results of the swelling experiments for hair which was treated
with alkaline solutions at different pHs, and Fig. 65 shows the results of the
swelling experiments for hair which was treated with solutions at pH 12.8
containing additional Cys or TGA. In order to compare the results of hair fibers
with different initial diameters, the swelling, S%, is given in percent which is
calculated by eq. 3.27:
%1001%
−=
o
t
dd
S (3.27)

3. Results and Discussion
118
0
25
50
75
100
0 30 60 90Treatment time in min
Sw
ellin
g in
%A
0
25
50
75
100
0 30 60 90Treatment time in min
Swel
ling
in %
B
0
50
100
150
200
0 30 60 90Treatment time in min
Sw
ellin
g in
%
C
Fig. 64: Swelling of blond, Caucasian hair fibers when treated at different
pHs. Each symbol shows a single experiment. Lines represent examples for fitted data by using eq. 3.25. A: pH 12.4 B: pH 12.8 C: pH 13.3
3. Results and Discussion
118
0
25
50
75
100
0 30 60 90Treatment time in min
Sw
ellin
g in
%
A
0
25
50
75
100
0 30 60 90Treatment time in min
Swel
ling
in %
B
0
50
100
150
200
0 30 60 90Treatment time in min
Sw
ellin
g in
%
C
Fig. 64: Swelling of blond, Caucasian hair fibers when treated at different
pHs. Each symbol shows a single experiment. Lines represent examples for fitted data by using eq. 3.25. A: pH 12.4 B: pH 12.8 C: pH 13.3

3. Results and Discussion
119
0
50
100
150
200
0 10 20 30 40Treatment time in min
Sw
ellin
g in
%A
0
50
100
150
0 10 20 30 40Treatment time in min
Swel
ling
in %
B
Fig. 65: Swelling of blond, Caucasian hair fibers during different treatments
at pH 12.8. Each symbol shows a single experiment. A: pH 12.8 + TGA B: pH 12.8 + Cys
3. Results and Discussion
119
0
50
100
150
200
0 10 20 30 40Treatment time in min
Sw
ellin
g in
%
A
0
50
100
150
0 10 20 30 40Treatment time in min
Swel
ling
in %
B
Fig. 65: Swelling of blond, Caucasian hair fibers during different treatments
at pH 12.8. Each symbol shows a single experiment. A: pH 12.8 + TGA B: pH 12.8 + Cys

3. Results and Discussion
120
The graphs show that the swelling of hair is dependent on the treatment solution.
The higher the pH, the more rapid and extensive is the swelling. Solutions which
contain thioles also cause a faster and higher level of swelling of the hair fiber
than solutions without thiole. Tab. 15 shows the maximum swelling of hair
fiber, max%S for different diffusion conditions.
Tab. 15: Mean maximum swelling of hair fiber, max%S (± standard deviation)
under different diffusion conditions (n = 5).
Diffusion conditions Maximum swelling, max
%S
in %
pH 12.4 34 ± 11
pH 12.8 80 ± 19
pH 13.3 161 ± 29
pH 12.8 + TGA 147 ± 17
pH 12.8 + Cys 126 ± 13
As Figs. 64-65 and Tab. 15 show, alkaline solutions with a pH of 12.4 lead to a
mean maximum swelling ob about 35 %. For pH 13.3 the mean maximum
swelling is around 160 %. Addition of thioles leads to a greater swelling. While
fibers swell on average by about 80 % at pH 12.8, with the addition of 1 % w/w
TGA they swell by about 150 %, and with additional Cys about 125 % at the
same pH.
The cleavage of disulfide bridges by alkali leads to negatively charged Cys
residues. The protein chains of hair fibers repel each other. Since the bridges
between the protein chains are broken, the distance between the protein chains is
increased and the solution diffuses faster and to a greater extent into the fiber.

3. Results and Discussion
121
Thus, the hair fiber swells. With the concentration of alkali the number of
negative charges increases within the fiber, and hence swelling increases.
Addition of thioles leads to more cleaved disulfide bridges as well as to the
formation of Cys residues and thus, to more negative charges of the protein
chains. Therefore, the hair swells faster and more extensively compared to hair
which is treated without additional thioles at the same pH.
To compare the results on a kinetic basis, for each experiment the average
swelling result, assuming first-order kinetics, was plotted as –ln(1-α) against
time t using eq. 3.26 for calculating the degree of conversion, α. For those
experiments where a linear relationship between these two quantities was
observed, the rate constant, k, was determined from the slope. The plots are
shown in Fig. 66.
It becomes clear that a linear relationship is observed only for the experiments at
pH 12.4 and 12.8 without thioles (but with deviation at long treatment times).
Thus, swelling follows pseudo-first order kinetics for these treatments. The rate
constant, k, of the experiments was determined to be 0.023 min-1 for pH 12.4
and pH 12.8. Thiole containing solutions at pH 12.8 and the solution at pH 13.4
show no first-order relationship.
Sauer /62/ has shown that a direct relationship exists between swelling and the
amount of broken disulfide bridges, when swelling follows pseudo first-order
kinetics. The degradation of CyS-SCy of relaxed hair at pH 12.4 and 12.8
– determined by AAA – within this thesis has shown that it follows pseudo first-
order kinetics. Thus, the existence of a direct relationship between swelling and
the amount of broken disulfide bridges is confirmed for these conditions.

3. Results and Discussion
122
y
= 0.
023x
R2 =
0.9
9
0
0.51
1.52
2.53
030
6090
Tim
e in
min
-ln(1- )
y =
0.02
3xR
2 = 0
.99
0
0.51
1.52
030
6090
Tim
e in
min
-ln(1- )
012345
020
4060
Tim
e in
min
-ln(1- )
0123456
010
2030
40
Tim
e in
min
-ln (1- )
pH 1
2.82
+ T
GA
pH 1
2.82
+ C
yste
ine
pH 1
2.42
pH 1
2.82
pH 1
3.44
α α
αα
Fig.
66:
R
elat
ions
hip
betw
een
degr
ee o
f con
vers
ion,
α (c
alcu
late
d fr
om p
seud
o fir
st-o
rder
kin
etic
s), a
nd re
actio
n tim
e, t,
for d
iffer
ent t
reat
men
ts. T
he sl
ope,
k, r
epre
sent
s the
rate
con
stan
t.
3. Results and Discussion
122
y =
0.02
3xR
2 = 0
.99
0
0.51
1.52
2.53
030
6090
Tim
e in
min
-ln(1- )
y =
0.02
3xR
2 = 0
.99
0
0.51
1.52
030
6090
Tim
e in
min
-ln(1- )
012345
020
4060
Tim
e in
min
-ln(1- )
0123456
010
2030
40
Tim
e in
min
-ln (1- )
pH 1
2.82
+ T
GA
pH 1
2.82
+ C
yste
ine
pH 1
2.42
pH 1
2.82
pH 1
3.44
α α
αα
Fig.
66:
R
elat
ions
hip
betw
een
degr
ee o
f con
vers
ion,
α (c
alcu
late
d fr
om p
seud
o fir
st-o
rder
kin
etic
s), a
nd re
actio
n tim
e, t,
for d
iffer
ent t
reat
men
ts. T
he sl
ope,
k, r
epre
sent
s the
rate
con
stan
t.

3. Results and Discussion
123
Swelling does not follow pseudo first-order kinetics at higher pH or with
addition of thiole at pH 12.8. Therefore, one must assume that these treatments
lead to further reactions beside β-elimination. These could include hydrolysis of
the protein fiber at higher pH, or additional cleavage of disulfide bridges in the
case of addition of thioles.
3.6.3. Analysis of diffusion
Simultaneously with the swelling, the removal of the color of the iodine resulted
in the development of a sharp border line between the colorless outer area and
the colored inner area of the fiber. The border line is clearly visible until it
vanishes at complete fiber penetration (Figs. 67-68). Such a behavior can be
often found for the swelling of vitreous polymers with or without simultaneous
reaction. For example in 1947 Hermanns /68/ described such a process for the
diffusion in gels.
Fig. 67 shows the diffusion process at different pH conditions. The diffusion
processes for solutions which contain additional TGA or Cys at pH 12.8 are
shown in Fig. 68. The penetration fronts were not visible from the very
beginning for all experiments, but became increasingly well-defined in the
course of the experiment. At the end of the diffusion process it was often not
possible to separate the two areas exactly, especially at lower pH. The faster the
diffusion occurred, the clearer the penetration front is.

3. Results and Discussion
124
A
Start 20 252 7 141 60
13 206 10 123.5 30 60Start
B
Start
C
17 sec 19 sec11 sec3 sec 30 min5 min
Fig. 67: Penetration of alkali into the hair fiber and swelling of the hair fiber
at different pH. The same part of the fiber is always shown. Time is given in minutes, except for pH 13.4. There, the exact time is given for each picture.
A: pH 12.4 B: pH 12.8 C: pH 13.4

3. Results and Discussion
125
A
Start 0.5 1 2 3 4 5 20
B
3 3.251 1.5 20.5 4 30Start Fig. 68: Penetration of alkali and thioles into the hair fiber and swelling of
the hair fiber at pH 12.8. The same part of the fiber is always shown. Time is given in minutes.
A: pH 12.8 + TGA B: pH 12.8 + Cys
3. Results and Discussion
125
A
Start 0.5 1 2 3 4 5 20
B
3 3.251 1.5 20.5 4 30Start Fig. 68: Penetration of alkali and thioles into the hair fiber and swelling of
the hair fiber at pH 12.8. The same part of the fiber is always shown. Time is given in minutes.
A: pH 12.8 + TGA B: pH 12.8 + Cys

3. Results and Discussion
126
The thiole containing solutions showed two penetration fronts (Fig. 68). The
distance between these fronts is nearly constant over the complete period of
time. Since this behavior did not appear without thiole, one can assume that one
of the penetration fronts is associated with the alkali, and the other one with the
thiole. Most likely, the alkali diffuses first into the fiber because the alkaline
molecules are much smaller than the thiole molecules. It is easier for the thiole
molecule to penetrate into the fiber after it has been swollen by the alkali. Thus,
the inner penetration fronts were used for comparisons of the rate of penetration
of the alkali.
The migration of a substance is characterized by the diffusion coefficient, D. For
the description of the process of diffusion of a solute into a solid cylinder, to
apply Fick’s second law is the traditional approach. It expresses the rate of
change of the concentration C of substance at the point r within the cylinder
with time t. This is proportional to the second derivative of the concentration
gradient according to the following equation (r is the radius of the cylinder):
2
2
drCdD
dtdC
= (3.28)
Fick’s equation is purely descriptive. It takes no account of molecular details
and provides no basis for the prediction of the magnitude of the diffusion
coefficient in a given system. However, it can be integrated to enable the
evaluation of diffusion coefficients from experimental data. The complexity of
the diffusion process leads to a study of diffusion on the basis of simple
idealized systems.

3. Results and Discussion
127
The calculations must therefore be simplified by the inference of a number of
assumptions /69, 70, 71/. Since the amount of diffusing alkali cannot be
determined directly, Sauer /62/ used the penetration depth as a measure of the
amount of diffused solute, according to eq. 3.29, where is the xt penetration
depth at time t:
π4Dtxt = (3.29)
A straight line is obtained in a plot of xt against t . The diffusion coefficient
can be calculated from the slope of the straight line. However, Sauer showed
that the diffusion coefficient of reducing agents (TGA) at pH 8.7 is not constant,
because he obtained a parabola instead of a straight line /62/. The same behavior
was obtained for the results within this work. Thus, the diffusion of alkali does
not show simple Fickian behavior. A diffusion coefficient cannot be determined
with eq. 3.29 from the penetration depth.
Alfrey et al. /72/ described a special diffusion behavior, which they called
“Case II” diffusion. It occurs in cylindrical or spherical, vitreous polymers
which come into contact with a solvent. It is characterized by the formation of a
sharp swelling front. This penetration front separates the vitreous nucleus from
the swollen curved surface and penetrates constantly into the center of the
polymer. While Fick’s diffusion is described by the diffusion coefficient, Case II
diffusion is characterized by the location of the penetration front which changes
linearly with time. This corresponds to pseudo zero-order kinetics according to
eq. 3.30 where xt is the penetration depth at time t, and k the penetration rate
constant:
ktxt = (3.30)

3. Results and Discussion
128
Fig. 69 shows the penetration curves at different pH values, and Fig 70 the
curves produced for alkaline solutions with added thioles at pH 12.8. The inner
penetration front was used to assess the treatments with added thiole. The plots
of penetration depth versus time show that the penetration of alkali does not
exhibit the same rate for all experiments at pH 12.4, 12.8 and at pH 12.8 with
additional Cys. Two groups were observed under these conditions. This could be
explained by differences in the aging of tips and roots. At the tip, the solvent
might diffuse more rapidly into the fiber because of the damage associated with
its age.
The penetration rate of alkali shows normal distributed values for both the
treatments at pH 13.4 and with added TGA at pH 12.8. It may be possible that
the reactions under these conditions are so fast that differences between tip and
root of hair are of no consequence and thus cannot be differentiated anymore.
Treatments at pH 13.4 and at 12.8 with added TGA follow a linear course of
penetration. Penetration follows the mechanism of Case II diffusion for these
treatments. Another behavior occurs at pH 12.4 and 12.8 as well as for the
treatment with added Cys. Within the first minutes of the experiment a linear
course of penetration is observed, too, but the longer the treatment continues, the
more the penetration differs from a linear course. Thus, penetration does not
follow the mechanism of Case II diffusion over the whole time range of the
experiment under these conditions.
To compare the differences in penetration rates, a linear regression was applied
for a suitable time range. Tab. 16 gives an account of the determined penetration
rates.

3. Results and Discussion
129
Tab. 16: Penetration rates for the inner diffusion front (alkali) with different treatments (± standard deviation), (3 ≤ n ≤ 6).
Treatment
pH 12.4 2.5 ± 0.3 0.5 ± 0.1
pH 12.8 8.4 ± 0.7 3.1 ± 0.4
pH 13.4
pH 12.8 + TGA
pH 12.8 + Cys 19.0 ± 8.1 3.4 ± 0.3
Rate of (inner) penetration in 10-8*ms-1
148.2 ± 46.1
25.1 ± 17.1
Presumed region Tip Root
The results show that the higher the pH, the faster the penetration rate.
Furthermore, the penetration of alkali was approximately two times faster when
a thiole was added, though it should be noted that the penetration rate was larger
with addition of TGA than with Cys. The effect of faster penetration is attributed
to the greater and more rapid swelling of the fiber. The greater the extent of fiber
swelling, the easier it is for the molecules to penetrate. However, the additional
reduction of the disulfide bridges resulting from the presence of the thioles leads
to enhanced swelling. Thus, it is a matter of mutual enhancement. Since TGA is
a stronger reducing agent than Cys, more disulfide bridges are cleaved and thus
the penetration of the molecules is faster.

3. Results and Discussion
130
0
20
40
60
0 10 20 30 40 50 60Time in min
Pene
tratio
n de
pth
in µ
mA
0
20
40
60
0 5 10 15 20Time in min
Pene
tratio
n de
pth
in µ
m
B
0
20
40
60
0 0.5 1Time in min
Pene
tratio
n de
pth
in µ
m
C
Fig. 69: Penetration depth versus time at different pH.
Each symbol corresponds to the result of one diffusion experiment. The time scale is not equal for the different treatments.
A: pH 12.4 B: pH 12.8 C: pH 13.4
3. Results and Discussion
130
0
20
40
60
0 10 20 30 40 50 60Time in min
Pene
tratio
n de
pth
in µ
m
A
0
20
40
60
0 5 10 15 20Time in min
Pene
tratio
n de
pth
in µ
m
B
0
20
40
60
0 0.5 1Time in min
Pene
tratio
n de
pth
in µ
m
C
Fig. 69: Penetration depth versus time at different pH.
Each symbol corresponds to the result of one diffusion experiment. The time scale is not equal for the different treatments.
A: pH 12.4 B: pH 12.8 C: pH 13.4

3. Results and Discussion
131
0
20
40
60
0 5 10 15 20Time in min
Pene
tratio
n de
pth
in µ
m A
0
20
40
60
0 5 10 15 20Time in min
Pen
etra
tion
dept
h in
µm B
Fig. 70: Penetration depth versus time at different pH.
Each symbol corresponds to the result of one diffusion experiment. A: pH 12.8 + TGA B: pH 12.8 + Cys

3. Results and Discussion
132
Fig. 71 shows the penetration of the inner and outer fronts for the treatments
with added thiole. Only a typical result for each kind of penetration is shown.
Tab. 17 gives each of the determined penetration rates. The data show that the
rate of penetration of the thiole is approximately the same as that of the alkali.
However, the penetration of thioles starts with a time lag, compared to the alkali.
The faster the rate of penetration, the shorter the time lag.
Tab. 17: Penetration rates of inner (alkali) and outer (thiole) penetration fronts (± standard deviation), (3 ≤ n ≤ 6).
Rate of inner penetration in 10-8*ms-1
Rate of outer penetration in 10-8*ms-1
(Time lag in min)
Treatment Presumed region
Tip Root Presumed region
Tip Root
pH 12.8 + TGA 25.1 ± 17.1 27.0 ± 18.2
(0.6 ± 0.4)
pH 12.8 + Cys 19.0 ± 8.1 3.4 ± 0.3 19.7 ± 6.9
(1.2 ± 0.8) 2.1 ± 0.2
(5.0 ± 1.1)

3. Results and Discussion
133
0
10
20
30
40
50
0 5 10 15 20Time in min
Pene
tratio
n de
pth
in µ
m
Alkali
TGA
A
0
10
20
30
40
50
0 5 10 15 20Time in min
Pen
etra
tion
in µ
m
AlkaliCys
Alkali
Cys
B
Fig. 71: Penetration depth of inner (alkali) and outer (thiole) penetration
front versus time at pH 12.82 + TGA or Cys. While the black dots represent the alkali penetration, the grey dots show the thiole penetration. Mean results are given. A: pH 12.8 + TGA B: pH 12.8 + Cys

3. Results and Discussion
134
In 1983 Wickett /73, 74/ developed a kinetic model to describes the rate of
reduction of keratins by TGA at pH 10 and above. The so-called “Moving
boundary”-model infers that the rate of reduction is so fast compared to the rate
of diffusion that nearly complete reduction occurs as penetration of the fiber
proceeds. Under these circumstances, diffusion is the rate limiting step. The
penetration picture in Fig. 71 and the swelling and penetration data for the TGA
containing experiment support this theory. Swelling of the hair fiber ceased,
when the fiber was completely penetrated by TGA. When Cys was used as
reducing agent swelling of the hair continued for a further short time. Thus, the
rate of reduction of Cys does not follow moving boundary kinetics.
A comparison of swelling and penetration under different pH conditions showed
that penetration and swelling did not always cease at the same time of the
experiment. Whilst the swelling ceased with penetration of the alkali at pH 12.4,
the swelling approximately started at the point of complete penetration of the
alkali at pH 13.4. Thus, the nature of the reaction of alkali with keratin is
dependent on pH.
4. Experimental part
135
4. Experimental part
4.1. Materials
4.1.1. Hair
The Caucasian hair sample was purchased from Kerling Internationale
Haarfabrik GmbH (Backnang, Germany). The hair was about 25 cm long,
untreated, medium brown and a blend of a large number of individual hair
samples. The root ends of the hairs were embedded in silicon resin. Single,
naturally blond hairs from a female colleague were used for the swelling
experiments. This hair was about 20 cm long and untreated. The simulated Afro
hair sample (so-called “Afro Hair – Natural Hair Kinked”) was purchased from
DEMEO Brothers INC. (New York, USA). This black hair was about 40 cm
long and the root ends were embedded in silicon resin. The diameter of the curls
was about 10 mm at the roots and 5 mm at the tips. The natural Afro hair
samples were either acquired privately from the USA or provided by Namasté
Laboratories L.L.C. (Blue Island, IL, USA). These hair samples varied in length
from 5 to 20 cm, in color from middle brown to black, and in diameter of the
curls from 2 to 8 mm.
4. Experimental part
135
4. Experimental part
4.1. Materials
4.1.1. Hair
The Caucasian hair sample was purchased from Kerling Internationale
Haarfabrik GmbH (Backnang, Germany). The hair was about 25 cm long,
untreated, medium brown and a blend of a large number of individual hair
samples. The root ends of the hairs were embedded in silicon resin. Single,
naturally blond hairs from a female colleague were used for the swelling
experiments. This hair was about 20 cm long and untreated. The simulated Afro
hair sample (so-called “Afro Hair – Natural Hair Kinked”) was purchased from
DEMEO Brothers INC. (New York, USA). This black hair was about 40 cm
long and the root ends were embedded in silicon resin. The diameter of the curls
was about 10 mm at the roots and 5 mm at the tips. The natural Afro hair
samples were either acquired privately from the USA or provided by Namasté
Laboratories L.L.C. (Blue Island, IL, USA). These hair samples varied in length
from 5 to 20 cm, in color from middle brown to black, and in diameter of the
curls from 2 to 8 mm.

4. Experimental part
136
4.1.2. Chemicals
The relaxer creams was purchased from a supermarket for ethnic products in
Aachen. The pH of the creams was 12.5 for the NaOH cream and 12.9 for the
No-Lye cream.
NaOH relaxer cream: sofn’free, Trend for Men (M&M Products Company,
Atlanta, GA 30309, USA)
Only the relaxing cream (S-Control Texturizer, pH
12.5) and the neutralization shampoo (pH 4.7) were
used. The pre-conditioner sachet and the herbal oil
moisturizer were not used.
No-Lye relaxer cream: Creme of Nature, super (Revlon Professional, Inc.
Dist.; New York, NY 10022, USA)
For the relaxing treatments, a fresh mixture (pH 12.9)
of the Relaxer Cream and the Soft Blend Activator as
well as the neutralization shampoo (ph 5.0) were used.
The conditioner (Corrective Salon Hair Treatment) was
not used.
L-Cysteine was obtained from SIGMA Chemie GmbH, (Deisenhofen,
Germany). TGA (for synthesis), iodine solution (c(I2) = 0.05 mol/l) and
collodion 4 % were purchased from Merck KGaA (Darmstadt, Germany). The
quality of other chemicals used in this project was pro analysi and they were
purchased either from Merck or SIGMA.

4. Experimental part
137
4.2. General experimental technique and analyses
4.2.1. Devices
Projection microscope:
No. 66503, Carl Zeiss, Germany
Scanning electron microscopy (SEM):
SEM S 360, Cambridge Instr., acceleration voltage 15-25 kV, working
distance 15 mm
Amino acid analyzer:
LC 6000 and LC 5000, Biotronic, Germany
DSC apparatus:
DSC 7, Perkin-Elmer, Überlingen, Germany
Tensile tester:
Instron 1122, Instron International LTD., Ludwigshafen, Germany
pH-meter:
PHM 83 Autocal pH.meter, Radiometer
4.2.2. Cross-section determination
The cross-sectional parameters of all hair samples were determined according to
an experimental procedure developed by Philippen /20/. A bundle of about 100 -
150 hairs was placed in a thin shrinkage tube. During shrinkage of the tube by
heating the jutting ends of the hairs were mechanical stretched. The tube was cut
perpendicularly to its length and the fiber ends embedded in an ether-starch
solution (collodion 4 %) by dipping the tube into the solution. Sections of 100 -
200 µm thickness were cut, though it should be noted that the more intensive the
hair is pigmented the thinner it must be the cut.

4. Experimental part
138
The slices were fixed on a slide and investigated under a light microscope with
ca. 600 x magnifications. Diameters of the long and short axes were measured,
and ellipticity and equivalent diameter thus calculated.
4.2.3. Scanning electron microscopy
The dried hair fibers were fixed on a suitable holder and sputter-coated with
gold. Afterwards the samples were investigated by means of the SEM.
4.2.4. Luster determination
The experiments were carried out by Fiantec GmbH (Aachen, Germany) /75/.
4.2.5. Amino acid analysis
To 8-10 mg of hair were added 8 ml of 6 N hydrochloric acid in a pressure-
resistant glass tube. The tube was evaporated and sealed. It was then heated for
24 h at 110 °C. The hydrolysate was reduced in vacuo at 70 °C and three times
washed with distilled water and finally evaporated to dryness at 70 °C. The
residue was analyzed by means of cationic exchange chromato-graphy.
4.2.6. HP-DSC measurements
Samples (5-10 mg) of chopped hair were introduced into pressure-resistant
capsules (steal capsules, PerkinElmer) together with 50 µl distilled water. The
filled capsule and an empty one as reference were heated up to 200 °C at a rate
of 10 °C/min.

4. Experimental part
139
4.2.7. Determination of hair straightening efficacy
Single hairs were fixed with tape in a straightened state on a glass plate with a
defined length of 9 cm. They were treated with a relaxer cream for a defined
period of time at 20 °C, rinsed with tap water, treated with a neutralizing
shampoo for 3 min, rinsed again and air-dried. The hair was removed from the
plate by lifting one of the tapes and cutting the end of the hair directly at the
other tape. The fibers were soaked for at least 10 min in tap water (30-35 °C) in
their unfixed state. As a result of soaking the influence of secondary cross-links
(salt linkages and hydrogen bonds) was removed and the obtained straightening
can be attributed to the remaining covalent bonds. Finally the effective length
(la) of the dried hair was determined (Fig. 42).
The effect of straightening, described by the variable ESt in %, was calculated as
the ratio of the difference between the effective length after treatment of a hair
fiber (la) and the effective length of an untreated hair fiber (lb) to the difference
between the true length of the hair fiber (L) and the effective length of an
untreated hair fiber (lb) as shown in eq. 3.4.
4.2.8. Ring test
To determine waveability of hair, 10 hairs each with a length of 5 cm were
wound around a steal rod with a diameter of 2 mm and their ends fixed with fast
glue. Care was taken to ensure that the fiber loops were parallel to each other
and the fiber axis perpendicular to the rod axis. Each rod was treated in a single
test tube. After the treatment the hair loops were cut open with a razor blade and
dropped into a Petri dish which was filled with distilled water. The loops were
soaked for at least 30 min. A 400 x enlargement of the Petri dishes was made
using a normal photocopier. The distance between the ends of the hair curls was
determined with a ruler.

4. Experimental part
140
4.2.9. Diffusion and swelling measurements
To determine the degree of diffusion and swelling, blond hairs were dyed with
elemental iodine. The hairs were suspended in 0.1 N iodine solutions for 4 h at
30 °C, briefly rinsed with distilled water and dried in air. About 1 cm of a dyed
hair fiber was fixed on a slide, protected with a cover slide and examined under
a light microscope. The fiber was pre-swollen with distilled water for at least
15 min. The water was then removed with a piece of paper tissue and replaced
by the alkaline solution (22 °C). The temperature and concentration of the
solution was maintained constant by minimizing the exposure to light in the
microscope, and with a continuous supply of new solution during the
experiment. Since the iodine reacts with the alkali according to a dispro-
portionation into colorless IO- and I-, it was possible to observe the swelling and
color removal and record it on video. Snapshots from this video were taken and
both the fiber diameter and the front of diffusion were measured using image
analysis. Thus, the swelling of the fiber and the penetration depth of the alkali
were determined.

4. Experimental part
141
4.3. Treatment of hair
4.3.1. Preparation and preliminary treatment of the hair
The hair tresses were soaked for 5 min at 35 °C in tap water, then shampooed
with a 15 % SDS-solution for 2 min and finally rinsed for 3 min under running
tap water (35 °C) and subsequently air-dried.
4.3.2. Relaxing treatment with commercial relaxing products
Relaxer cream was applied on the air-dried hair samples using a cosmetic
paintbrush. The hair samples were brushed from both sides to ensure that each
fiber was thoroughly soaked in the cream. Durations and temperatures of the
relaxing treatments are shown in Tab. 18 for the different treatments. After
treatment the hair tresses were rinsed with tap water for one minute and twice
washed with the neutralization shampoo. The duration of shampooing and
rinsing was two minutes each. The samples were dried in air.
Tab. 18: Duration and temperature for different treatments with relaxing cream
Treatment Processing time
of cream in min
Temperature in °C
NaOH 10 22 Comparison of different hair types No-Lye 15 22
NaOH 0 - 20 20 Hair relaxing investigations No-Lye 0 - 20 20

4. Experimental part
142
4.3.3. Permanent waving treatments
Hair was permed two weeks after the relaxing treatment.
Treatments for the comparison of different hair types (chapter 3.2.):
The hair tresses were soaked at RT for 15 min in water. The tresses were then
exposed to an 8 % w/w TGA-solution (adjusted with ammonia (30 %) to pH
8.8) for 25 min at 25 °C. Since the hair was very soft, it was rinsed by putting it
in a tap-water-filled glass box for 10 min at 35 °C. The tap water was exchanged
after 2 and again after 5 min. The subsequent oxidation took place upon
treatment with a 3 % hydrogen peroxide solution (adjusted with phosphoric acid
to pH 2.4) for 25 min at 25 °C. Afterwards, the hair was rinsed with running tap
water of 35 °C for 10 min and air-dried.
Treatment for testing the waveability of relaxed hairs (chapter 3.4.):
Single hairs were wound on steel rods and soaked at RT for 5 min. Afterwards,
the hairs were subjected to an 8 % w/w TGA-solution (adjusted with ammonia
(30 %) to pH 9.0) for 10 min at 30 °C. Every steel rod was placed in one test
tube. The rods were taken out of the TGA-solution, briefly held under running
tap water, and put in a water-filled glass beaker for 15 min at RT. The hair was
then subjected to 3 % hydrogen peroxide solution adjusted with phosphoric acid
to pH 2.3 at 30 °C for 10 min with a, deposited in an water-filled beaker for 10
min at RT and subsequently air-dried.
All experimental solutions were used in large excess.

4. Experimental part
143
4.4 Statistical annotations
4.4.1 Introduction
Statistics are used to analyze and interpret data /76/. They objectively evaluate
and reliably judge conclusions based on the data. In the research of human hair,
the analysis of data has to consider:
• The natural variability of the material
• Differences of the raw material due to its chemical and physical prehistory
• The limited number of available data
Before data can be analyzed, they must be collected. Statistical considerations
are obligatory in the design of experiments and in the conception of the
hypotheses. The aim of all experiments is to find chemical or physical
alterations after a treatment or to find primary differences between raw
materials.
For this purpose random samples of a population are taken. Measured results
establish the basis of the evaluation of the population. Three claims are linked to
the evaluation:
• Unbiased statistics:
It is desirable that if one takes an indefinitely large number of samples from a
population, the long run average of the obtained statistics will equal the
parameter.
• Consistent statistics:
As the sample size increases, consistent statistics will become a better
estimate of the parameter it is appraising.

4. Experimental part
144
• Reliability:
The estimate should result from a variation as small as possible. Since
frequently only one sample is secured from a population, it is important to
arrive at a close estimate of a parameter from a single sample.
The program Statistica 5.0 is used for all statistical calculations.
4.4.2 Description of a population and sample
In samples, as well as in populations, one generally finds a preponderance of
values somewhere around the middle of the range of observed values. The
description of this concentration near the middle is an average to the layman,
and a measure of central tendency to the statistician. The most widely used
measure of central tendency is the arithmetic mean:
∑=
=n
i
i
nx
x1
(4.1)
Where xi represents the individual observation and n is the number of
observations.
In addition to a measure of central tendency, it is generally desirable to have a
measure of the dispersion/variability of data. This is an indication of the scatter
of measurements around the center and is normally given by the standard
deviation (eq. 4.3). The square of the standard deviation is the variance (eq. 4.2):
1
)( 2
2
−
−=
∑n
xxs i
i
(4.2)

4. Experimental part
145
2ss = (4.3)
The standard error of the mean is defined as:
nssx
2
= (4.4)
Confidence limits: The statistical procedure for addressing a question first
involves the concise statement of the hypothesis to be tested; statistically this is
referred to as null hypothesis (abbreviated H0).
It is necessary to consider how small a probability can lead one to reasonably
conclude that H0 is false. The probability conventionally used in scientific
statistics is 0.05 (i.e. 5%) referred to as α, the level of significance of the
statistical test.
The confidence interval for a sample mean is defined as:
xstxq ⋅±= α%95 (4.5)
Where tα is tabulated for the most common α values and numbers of obser-
vations. For n equal to infinity tα becomes 1.96 (α = 0.05).
Hair can be analyzed in two ways. If the sample consists of single hairs the
experiment must contain at least 40 hairs because of the natural variability of the
hair. The results are presented in so-called Box and Whisker plots illustrating the
arithmetic mean (Mean), standard error (1.00*Std. Err.), and the limiting value

4. Experimental part
146
for the 95 % confidence limit (1.96*Std. Err.). A typical legend of such a plot is
shown in Fig. 79.
±1.96*Std. Err.
±1.00*Std. Err.
Mean Fig. 79: Legend of a typical Box and Whisker plot frequently used in this
work to present results. When experiments were performed with larger amounts of hair, the natural
variability of hair is averaged. To verify the results, at least two analyses have to
be performed per experiment. The results of these tests are represented by the
mean and the standard variation.
4.4.3 t-Test for independent samples
The terms dependent and independent variable apply mostly to experimental
work where some variables are manipulated, and in this sense they are
"independent" from the initial reaction patterns, features, intentions, etc. of the
subjects. Some other variables are expected to be "dependent" on the
manipulation or experimental conditions. That is to say, they depend on "what
the subject will do" in response. Independent variables are those that are
manipulated whereas dependent variables are only measured or registered.
Somewhat contrary to the nature of this distinction, these terms are also used in
studies where we do not literally manipulate independent variables, but only
assign subjects to "experimental groups" based on some preexisting properties
of the subjects. For example, if in an experiment, males are compared with
females regarding their white cell count (WCC), Gender could be called the
independent variable and WCC the dependent variable.

4. Experimental part
147
The t-test is the most commonly used method to evaluate the differences
between the means of two groups. For example, the t-test can be used to test for
a difference in test scores between a group of patients who were given a drug
and a control group who received a placebo.
To reject the null hypothesis, H0, that the samples do not differ, the calculated
t value must be bigger than the critical value, which is a tabulated value for the
most common α values and numbers of observations.
valuecriticalcalculated ttiffalseisH >0 (4.6)
The t value is calculated by the following equation:
21
22
21
21
nnss
xxtcalculated
++
−=
(4.7)
4.4.3 Simple linear regression
The relationship between two variables may be a function of dependence of one
on the other. The magnitude of one of the variables, y, is assumed to be
determined by – i.e., is a function of – the magnitude of the second variable, x,
whereas the reverse is not true. In the following, the dependent variable, y,
represents the property of treated hair; the independent variable, x, is mostly the
time of treatment.
Such a dependent relationship is termed a regression; the term simple regression
refers to the fact that only two variables are being considered. In the case of
simple regression, a direct straight line is described as “linear” relationship
between the two variables (eq. 4.8).

4. Experimental part
148
bxay += (4.8)
a represents the intercept of the line and b is the slope of the straight line. They
are population parameters and, therefore, constants.
The proportion (or percentage) of the total variation in y that is explained or
accounted for by the fitted regression, is termed the coefficient of determination,
R2 (eq. 4.9). It may be thought of as a measure of the strength of the straight-line
relationship:
( )
( ) ( )∑ ∑∑ ∑∑ ∑ ∑
−⋅−
−= 2222
2
2
)()()()(
iiii
iiii
yynxxnyxyxn
R (4.9)
The maximum value of R2 is 1. Generally, R2 > 0.95 features a strong linear
dependency of the variable y on the variable x.
4.4.4. General linear model
The general linear model (GLM) is a generalization of the linear regression
model, such that effects can be tested (1) for categorical predictor variables (e.g.
gender), as well as for effects for continuous predictor variables (e.g. age) and
(2) in designs with multiple dependent variables (e.g. ellipticity or diameter) as
well as in designs with a single dependent variable. GLM uses the methods of
smallest squares to estimate effects and to test hypotheses.

5. References
149
5. References
1 J.A. Swift, Morphology and Histochemistry of Human Hair, in P. Jollès,
H. Zahn, H. Höcker (Editors), Formation and structure of Human Hair,
Birkhäuser Verlag, Basel, 1997, 149-175.
2 R. Eichner, P. Rew, A. Engel, U. Aebi, Ann. N.Y. Acad. Sci., 1985, 455,
381.
3 C.R. Robbins, Chemical and pyhsical behavior of human hair, 3rd ed.,
Springer Verlag, New York, 1994.
4 J.A. Swift, Int. J. Cosmet. Sci., 1991, 13, 143.
5 J.A. Swift, S.W. Holes, Test. Res. J., 1965, 35, 1014.
6 U. Aebi, Ann. New York Academy Sci., 1985, 455, 381-402.
7 J.H. Bradbury, G.V. Chapman. A.N. Hambly, Nature, 1966, 210, 1333.
8 H. Zahn, F.-J. Wortmann, H. Höcker, CHIUZ, 1997, 31, 280-290.
9 R. Consdon, S.H. Gordon, Biochem. J., 1950, 46, 8.
10 A.J. Hailwood, S. Harrobein, Trans. Faraday Soc., 1946, 42B, 84.
11 R.J. Randebrook, J. Soc. Cosmet. Chem., 1964, 15, 691.
12 K.H. Phan, Ph.D.-thesis, RWTH-Aachen, 1994.
13 F. Baltenneck, B.A. Bernard, J.-C. Garson, P. Engström, C. Riekel, F.
Leroy, A. Franbourg, J. Doucet, Cel. Mol. Biol, 2000, 46 (5), 1017-1024.
14 Afro Hair, A Salon Handbook; Editor: Phillip Hatton, Blackwell Scientific
Publications, Oxford, 1994, 91-133.
15a M. Friedman, The Chemistry and Biochemistry of the Sulfhydryl Group in
Amino Acids, Peptides and Proteins, Pergamon Press, Oxford, 1973, 1-25.
15 Lesley and Phillip Hatton, Perming and Straightening, A Salon Handbook,
2nd ed., Blackwell Scientific Publications, Oxford, 1993, 6-7.
16 S. Ogawa, K. Fujii, K. Kaneyama, K. Arai, K., Poster: A novel method for
permanent hair straightening, 10th IWTRC, Nov 2000, Aachen.
17 M. Trotter, Amer, J. Phys. Anthrop., 1930, 14, 433-445.
5. References
149
5. References
1 J.A. Swift, Morphology and Histochemistry of Human Hair, in P. Jollès,
H. Zahn, H. Höcker (Editors), Formation and structure of Human Hair,
Birkhäuser Verlag, Basel, 1997, 149-175.
2 R. Eichner, P. Rew, A. Engel, U. Aebi, Ann. N.Y. Acad. Sci., 1985, 455,
381.
3 C.R. Robbins, Chemical and pyhsical behavior of human hair, 3rd ed.,
Springer Verlag, New York, 1994.
4 J.A. Swift, Int. J. Cosmet. Sci., 1991, 13, 143.
5 J.A. Swift, S.W. Holes, Test. Res. J., 1965, 35, 1014.
6 U. Aebi, Ann. New York Academy Sci., 1985, 455, 381-402.
7 J.H. Bradbury, G.V. Chapman. A.N. Hambly, Nature, 1966, 210, 1333.
8 H. Zahn, F.-J. Wortmann, H. Höcker, CHIUZ, 1997, 31, 280-290.
9 R. Consdon, S.H. Gordon, Biochem. J., 1950, 46, 8.
10 A.J. Hailwood, S. Harrobein, Trans. Faraday Soc., 1946, 42B, 84.
11 R.J. Randebrook, J. Soc. Cosmet. Chem., 1964, 15, 691.
12 K.H. Phan, Ph.D.-thesis, RWTH-Aachen, 1994.
13 F. Baltenneck, B.A. Bernard, J.-C. Garson, P. Engström, C. Riekel, F.
Leroy, A. Franbourg, J. Doucet, Cel. Mol. Biol, 2000, 46 (5), 1017-1024.
14 Afro Hair, A Salon Handbook; Editor: Phillip Hatton, Blackwell Scientific
Publications, Oxford, 1994, 91-133.
15a M. Friedman, The Chemistry and Biochemistry of the Sulfhydryl Group in
Amino Acids, Peptides and Proteins, Pergamon Press, Oxford, 1973, 1-25.
15 Lesley and Phillip Hatton, Perming and Straightening, A Salon Handbook,
2nd ed., Blackwell Scientific Publications, Oxford, 1993, 6-7.
16 S. Ogawa, K. Fujii, K. Kaneyama, K. Arai, K., Poster: A novel method for
permanent hair straightening, 10th IWTRC, Nov 2000, Aachen.
17 M. Trotter, Amer, J. Phys. Anthrop., 1930, 14, 433-445.

5. References
150
18 M. Trotter, Dawson, H.L., Amer, J. Phys. Anthrop., 1934, 18, 443-456.
19 Kneberg, M., Amer, J. Phys. Anthrop., 1935, 20, 51-67.
20 D. Teasdale, H. Philippen, R. Schlüter, H. Meichelbeck, G. Blankenburg,
Ärzt. Kosm., 1981, 11, 161-170.
21 E.Y. Naling, R.H. Kinsinger, W.S. Tolgyesi, E.M. Cottington, J. Soc.
Cosm. Chem. 1977, 28, 139-150.
22 D. Teasdale, H. Philippen, R. Schlüter, H. Meichelbeck, G. Blankenburg,
Ärzt. Kosm., 1981, 12, 425-433.
23 D.G. Vernall, Amer. J. Phys. Antrop., 1961, 19, 345-350.
24 A. Chatt, S. Katz, Hair Analysis, VCH New York, 1st edition, 1988, Vol.1.
25 C.R. Robbins, Chemical and Physical Behavior of Human hair, 1988,
Springer-Verlag, New York, Vol. 2.
26 World Cook Encyclopedia, Field Enterprises Educational Corp., Chicago,
1969.
27 Statistical Abstracts of the United States, 1976.
28 C.R. Robbins, Chemical and physical behavior of human hair, 3rd ed.,
Springer Verlag, New York, 1994.
29 Personal note of DeMeo Brothers Inc., New York.
30 A. Robson, M.J. Williams, J.M. Woodhouse, J. Tex. Inst., 1969, 90,
140-151.
31 J. Chao, A.E. Newson, I.M. Wainwright, R.A. Mathews, J. Soc. Cosm.
Chem., 1979, 30, 410.
32 E. Schulze zur Wiesche, F.-J. Wortmann, COSSMA, 2000, 6, 12-13.
33 F.-J. Wortmann, E. Schulze zur Wiesche, B. Bourceau, 22nd IFSCC
Congress, Edinburgh, 2002.
34 F.-J. Wortmann, E. Schulze zur Wiesche, A. Bierbaum, J. Cosmet. Sci.,
2003, 54, 301-316.
36 H.D. Spackman, W.H. Stein, S. Moore, Anal. Chem., 1958, 30, 1190-1206.
36 J.P. Danehy, W.E. Hunter, Biochem. Z., 1940, 25, 264-266.

5. References
151
37 A. Schöberl, H. Gräfje, Naturwiss., 1956, 43, 445-446.
38 C. Popescu, private communication, 2001.
39 J.A. Crowder, M. Harris, Amer. Dyes. Rep., 1936, 25, 264-266.
40 A. Schöberl, E. Eck, Annalen d. Chem., 1936, 522, 97.
41 Z. Bohak, J. Biol. Chem., 1964, 239, 2878-2887.
42 W.G. Crewther, R.C.B. Fraser, F.G. Lennox, H. Lindley, Adv. Protein
Chem., 1965, 20, 252-256.
43 R.S. Asquith, A.K. Booth, J.D. Skinner, Biochim. Biophys. Acta, 1969,
181, 164-170.
44 I. Steenken, Ph.D. thesis, RWTH-Aachen, 1982.
45 K. Martinek, I.V. Berezin, Y.L. Khmelnitski, N.L. Kliachko, A.V.
Levashov, Biocatalysis, 1987, 1, 9.
46 H. Zahn, H.-G. Gattner, Hair sulfur amino acid analysis, in P. Jollès, H.
Zahn, H. Höcker (ed.), Formation and Structure of Human Hair,
Birkhäuser Verlag Basel, 1997, 239-258.
47 J. Menkart, L.J. Wolfram, I. Mao, J. Soc. Cosm. Chem., 1966, 17, 769-787.
48 W.F. Hemmiger, H.K. Cammenga, Labo, 1990, 18, 7-20.
G. Lombardi, For Better Thermal Analysis, 2nd ed.; published by the Int.
Confederation for Thermal Analysis (ICTA), 1980.
49 W.F. Hemminger, G. Höhne, Calorimetry-Fundamentals and Practice,
Verlag Chemie, Weinheim 1984.
50 W.F. Hemminger, H.K. Cammenga, Methoden der Thermischen Analyse,
Springer Verlag Berlin, 1988.
Perkin-Elmer Handbuch zum DSC-System 7, Bodenseewerk Perkin-Elmer
& Co GmbH, Überlingen 1982.
51 M. Feughelman, Text. Res. J. 1959, 29, 223-228.
52 M. Spei, R. Holzem, Colloid and Polymer Sci., 1987, 265, 965.
M. Spei, R. Holzem, Mell. Text., 1987, 68, 923.

5. References
152
53 J.S. Crighton, E.R. Hole, Proc. 7th Int. Wool Text. Res. Conf., 1985, 1,
283-292.
54 H. Deutz, Ph.D. thesis, RWTH Aachen, 1993.
55 CD Römpp Chemie Lexikon, Version 1.0, J. Falbe, M. Regitz (ed.),
Thieme Verlag, Stuttgart, New York, 1995.
56 D.B. Volkin, A.M. Klibanov, J. Biol. Chem., 1987, 262, 2945-2950.
57 K. Arai, M. Sakamoto, S. Naito, T. Takahashi, J. Appl. Polym. Sci., 1989,
38, 29-44.
58 M. Wong, G. Wis-Surel, J. Epps, J. Soc. Cosm. Chem., 1994, 45,
347-352.
59 S. Ogawa, K. Fujii, K. Kaneyama, K. Arai, K. Joko, J. Cosm. Sci, 2000,
51, 379-399.
60 S. Ogawa, K. Fujii, K. Kaneyama, K. Arai, K. Joko, J. Soc. Cosm. Chem.
Japan, 2000, 34, 63-71.
61 F.-J. Wortmann, I. Souren, J. Soc. Cosm. Chem., 1987, 38, 125-140.
62 R. Sauer, Ph.D. thesis, RWTH Aachen, 2001.
63 K.W. Herrmann, Trans. Farad. Soc. 1963, 59, 1663-1671.
64 C.E. Reese, H. Eyring, Text. Res. J., 1950, 20, 743-750.
65 E.T. Kubu, D.J. Montgomery, Text. Res. J., 1952, 22, 778-782.
66 S.M. Katz, E.T. Kubu, J.H. Wakelin, Text. Res. J., 1950, 20, 754-760.
67 R.R. Wickett, J. Soc, Cosmet, Chem, 1983, 43, 301-316.
68 J.J. Hermanns, J. Coll. Sci., 1947, 2, 387.
69 P.R. Brady, Rev. Prog. Coloration, 1992, 22.
70 J.N. Etters, Text. Chem. Colourist, 1980, 12, 140.145.
71 F. Jones, In The theory of coloration of textiles, 2nd edn., A.E. Johnson,
Chapter 5, 1989.
72 T.Alfrey, E.F. Grunee, W.G. Lloyd, J. Polym. Sci., 1966, Part C, 249-261.
73 R.R. Wickett, J. Soc. Cosmet. Chem., 1983, 34, 301-316.
74 R.R. Wickett, B.G. Barman, J. Soc. Cosmet. Chem., 1985, 36, 75-86.

5. References
153
75 http://pweb.uunet.de/fiantec.ac/
76 J.H. Zar, Biostatistical Analysis, Prentice-Hall, Inc.; Englewood Cliffs,
New Jersey, 1984, 2nd edition.
77 B.C. Powell, G.E. Rogers, The role of keratin proteins and their genes in
the growth, structure and properties of hair, in P. Jollès, H. Zahn, H.
Höcker (Editors), Formation and structure of Human Hair, Birkhäuser
Verlag, Basel, 1997.
78 G.E. Rogers, L. Langbein, H. Winter, C. Ehmann, S. Praetzel, B. Korn, J.
Schweizer, J. Biol. Chem., 2001, 276, 19440-19451.
79 C. Zviak, The Science of Hair Care, Marcel Dekker, New York, 1986.

Lebenslauf
154
Lebenslauf
Jutta Maria Quadflieg geb. Bußmann
Geburtsdatum: 10.12.1971
Geburtsort: Dortmund
Eltern: Franz-Josef Anton Bußmann
Barbara Bußmann geb. Hildebrand
Familienstand: verheiratet
1976 – 1980 Kerschensteiner Grundschule, Dortmund
1980 – 1991 Mallinckrodt-Gymnasium, Dortmund
1991 – 1998 Studium der Chemie an der RWTH Aachen
Diplomarbeit am Deutschen Wollforschungsinstitut an der
RWTH Aachen e.V.
Thema: Enyzmbehandlung von Haaren
1998 – 2002 Promotion am Deutschen Wollforschungsinstitut an der
RWTH Aachen e.V.
05.09.2003 Tag der mündlichen Prüfung
seit 01/2003: Wissenschaftliche Mitarbeiterin bei Institute Dr. Schrader,
Holzminden
Lebenslauf
154
Lebenslauf
Jutta Maria Quadflieg geb. Bußmann
Geburtsdatum: 10.12.1971
Geburtsort: Dortmund
Eltern: Franz-Josef Anton Bußmann
Barbara Bußmann geb. Hildebrand
Familienstand: verheiratet
1976 – 1980 Kerschensteiner Grundschule, Dortmund
1980 – 1991 Mallinckrodt-Gymnasium, Dortmund
1991 – 1998 Studium der Chemie an der RWTH Aachen
Diplomarbeit am Deutschen Wollforschungsinstitut an der
RWTH Aachen e.V.
Thema: Enyzmbehandlung von Haaren
1998 – 2002 Promotion am Deutschen Wollforschungsinstitut an der
RWTH Aachen e.V.
05.09.2003 Tag der mündlichen Prüfung
seit 01/2003: Wissenschaftliche Mitarbeiterin bei Institute Dr. Schrader,
Holzminden