fundamentals august 2016
TRANSCRIPT
THE NEWS MAGAZINE OF OLD MUTUAL INVESTMENT GROUPFUNDAMENTALS
WHAT YOU'LL FIND INSIDESA EQUITIES RESILIENT DESPITE TOUGH ENVIRONMENT
PETER BROOKE
QUEST FOR YIELD WHITEWASHING SA’S WOES
WIKUS FURSTENBERG
A RARE STREAM OF GOOD ECONOMIC NEWS LIFTS SA
RIAN LE ROUX
THE SHRINKING TOOLBOX:HOW BIG IS TOO BIG?
CRAIG CHAMBERS
AUGUST 2016

2
WILL FISCAL STIMULUS BE THE PANACEA FOR GLOBAL GROWTH?TINYIKO NGWENYA
5
A RARE STREAM OF GOOD ECONOMIC NEWS LIFTS SARIAN LE ROUX
7
GLOBAL QUEST FOR YIELD IS WHITEWASHING SA’S ECONOMIC WOESWIKUS FURSTENBERG
10
SA EQUITIES RESILIENT DESPITE TOUGH ENVIRONMENTPETER BROOKE
13
THE SHRINKING TOOLBOX:HOW BIG IS TOO BIG?CRAIG CHAMBERS
17
INSIDE THIS ISSUE
FOR MORE INFORMATION
WYNAND GOUWSHead of MarketingTel: +27 21 509 5601Email: [email protected]
JANINA SLAWSKIDirector of Marketing and DistributionTel: +27 11 217 1873Email: [email protected]

3

4
KEY TAKEOUTS:• PMI SIGNALS A UK RECESSION
• JAPAN INITIATES NEW STIMULUS PACKAGE
• IS FISCAL STIMULUS THE WAY FORWARD?
• A GLOBAL MIGRATION TO EMERGING MARKETS

5
GLOBAL ECONOMIC OVERVIEW AND OUTLOOK
WILL FISCAL STIMULUS BE THE PANACEA FOR GLOBAL GROWTH?TINYIKO NGWENYA | ECONOMIST AT OLD MUTUAL INVESTMENT GROUP
Post-Brexit effects are still being felt within the UK economy as
investors shift their focus to exit negotiations with the European
Union (EU). The sharp devaluation of the British pound, and recent
data releases such as the UK’s purchasing managers index (PMI)
and various confidence barometers, all signal that the country may
soon enter a recession. This has prompted the Bank of England
(BOE) to indicate a willingness to provide additional monetary
stimulus. There is also mounting speculation of fiscal stimulus being
added to the mix.
JAPAN’S NEW PLANS TO RESUSCITATE GROWTHThe UK has not been alone in considering fiscal stimulus, as
Japan recently announced a large government package aimed at
financing infrastructure projects and providing low-income earners
with cash handouts. Before the announcement, the Bank of Japan
apparently toyed with the idea of “helicopter money” − providing
the government with non-interest-bearing and non-repayable cash
for direct fiscal stimulation. In a largely stagnant economy, the
surge in the Japanese yen and depressed inflation expectations
are putting pressure on the authorities to consider increasingly
unorthodox expansionary policies.
The concept of “helicopter money” may sound ludicrous, but it
does point to a world still facing deflationary pressures and central
banks' concern that monetary stimulus may have reached the limits
of its potential to fuel growth and inflation. The consequence
is a growing pressure for fiscal policy stimulus measures to be
introduced by governments around the world.
US RATE HIKES ON THE CARDSThe US Federal Reserve (the Fed), on the other hand, appeared a
little more upbeat than expected in their statement following their
July meeting − on the back of better jobs data in June. Although
consumer-related indicators remain strong in the US, durable goods
orders have been relatively weak for several months now and
business investment has contracted for a few quarters in succession.
While individual US Fed members continue to suggest that two
interest rate hikes are still possible over the remainder of the year,
market commentators are generally of the opinion that they will
only hike rates once later this year, most probably in November or
December.
EMERGING MARKETS A FAVOURED DESTINATIONThe rising possibility of another round of global policy easing,
combined with expectations that the US Fed will only raise
rates later this year, has been positive for emerging markets.
Notwithstanding the renewed drop in the oil price, the overall
commodity basket has remained broadly stable. This, coupled
with growing expectations that global interest rates will remain low
for even longer, has increased the attractiveness of higher-yielding
emerging market assets. As a result, emerging market currencies
have recently stabilised, with some actually firming quite notably,
including the rand. With the effects of Brexit likely to be felt more in
developed markets, the growth differential between emerging and
developed markets is set to widen this year and into next, improving
the relative prospects of emerging markets.
6
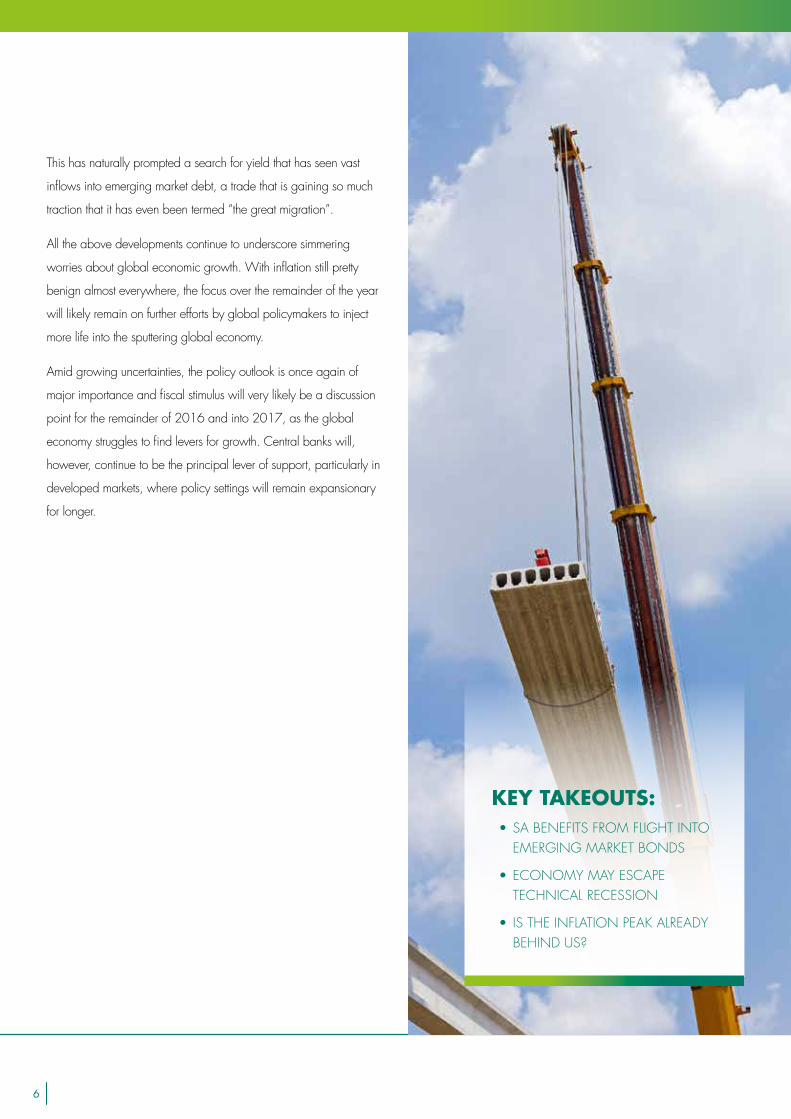
KEY TAKEOUTS:• SA BENEFITS FROM FLIGHT INTO
EMERGING MARKET BONDS
• ECONOMY MAY ESCAPE TECHNICAL RECESSION
• IS THE INFLATION PEAK ALREADY BEHIND US?
This has naturally prompted a search for yield that has seen vast
inflows into emerging market debt, a trade that is gaining so much
traction that it has even been termed “the great migration”.
All the above developments continue to underscore simmering
worries about global economic growth. With inflation still pretty
benign almost everywhere, the focus over the remainder of the year
will likely remain on further efforts by global policymakers to inject
more life into the sputtering global economy.
Amid growing uncertainties, the policy outlook is once again of
major importance and fiscal stimulus will very likely be a discussion
point for the remainder of 2016 and into 2017, as the global
economy struggles to find levers for growth. Central banks will,
however, continue to be the principal lever of support, particularly in
developed markets, where policy settings will remain expansionary
for longer.
7
LOCAL ECONOMIC OVERVIEW AND OUTLOOK
The past month was a relatively good one for South Africa.
Importantly, we benefited from the global investor flight into higher-
yielding emerging market bonds − on account of a growing
perception that global central banks will keep interest rates lower for
even longer after the Brexit vote. As a result, the rand firmed further
to end July at about R13.80 to the US dollar, substantially firmer
than the almost R17/US$ the currency reached around the middle
of January. The strong performance of the rand was in contrast
to predictions from some circles that the currency would weaken
into the run-up to the local elections on 3 August (on account of
political risks associated with the event). The elections were not only
logistically very successful, but all parties accepted the outcome
and there was no serious violence during or immediately after the
elections.
DEFICIT NARROWS, GROWTH REBOUNDS AND INFLATION SLOWS July saw some bits of good economic news. First, the monthly
foreign trade balance, which unexpectedly recorded a large
surplus of R18 billion in May, saw another sizeable surplus of
R13 billion in June. The implication is that the overall balance
on the current account, which is also taking into account SA’s
large income account deficit with the rest of the world, will shrink
materially in the second quarter of 2016. We estimate that the
current account deficit could narrow to about 2.5% of GDP in the
second quarter, or about half the 5.1% of GDP recorded in the first
quarter. Prospects of a much narrower overall foreign trade shortfall
also lent support to the rand.
More good news, albeit tentative, is that it appears that the
economy bounced back quite sharply in the second quarter from
the more than 1% annualised contraction in the first quarter. Better
output numbers in mining and especially manufacturing, as well
as strong foreign tourism growth, tentatively point to an annualised
growth rebound of about 2% in the second quarter. This implies
that the economy likely escaped a technical recession in the
second quarter, although the second half of the year is unlikely to
see a repeat of the good second-quarter growth.
A third piece of good news was on the inflation front. While
inflation rose moderately from 6.1% in May to 6.3% in June,
forward-looking inflation indicators have improved notably.
Importantly, the oil price has weakened sharply recently (leading
to a large petrol price cut early in August), the rand is much firmer
and grain prices have declined sharply over the past few months.
The latest numbers suggest that instead of still being ahead of us,
the cyclical peak in inflation may in fact already be behind us at
7.0% in February this year.
Lastly, the stronger rand, together with the improved inflation
outlook, resulted in the South African Reserve Bank (SARB) leaving
interest rates unchanged at its July meeting. Indeed, developments
over the past month strengthened our conviction, held since early-
June, that the SARB will not raise rates again in this cycle, even
though inflation is likely to stay out of the 3% - 6% target range for
most of the rest of the year. However, while we do not expect the
SARB to raise rates again in the cycle, we also do not see it cutting
rates anytime soon either. The SARB is unlikely to consider lowering
rates before inflation is not decisively back in the inflation target
range and, at this stage, forward-looking inflation indicators must
still look promising for the SARB to start considering interest rate
relief.
A RARE STREAM OF GOOD ECONOMIC NEWS LIFTS SARIAN LE ROUX | OLD MUTUAL INVESTMENT GROUP’S CHIEF ECONOMIST

8
GROWTH-FRIENDLY REFORMS CONSPICUOUSLY ABSENTWhile SA has undoubtedly seen a rather rare stream of good
news over the past month, we remain saddled with considerable
structural challenges, key of which is a very weak growth dynamic.
Moreover, an important lesson from Brexit is that the now increased
downside risks to the world economy mean that SA cannot rely
on a global growth spurt to pull us out of our own slow growth rut.
Broad growth- and confidence-enhancing macroeconomic reforms
remain key, but are so far an absent ingredient to a brighter local
economic outlook over the medium to longer term.
The bottom line of all of the above is that prospects for 2016 and
2017 unfortunately still look pretty bleak.
9
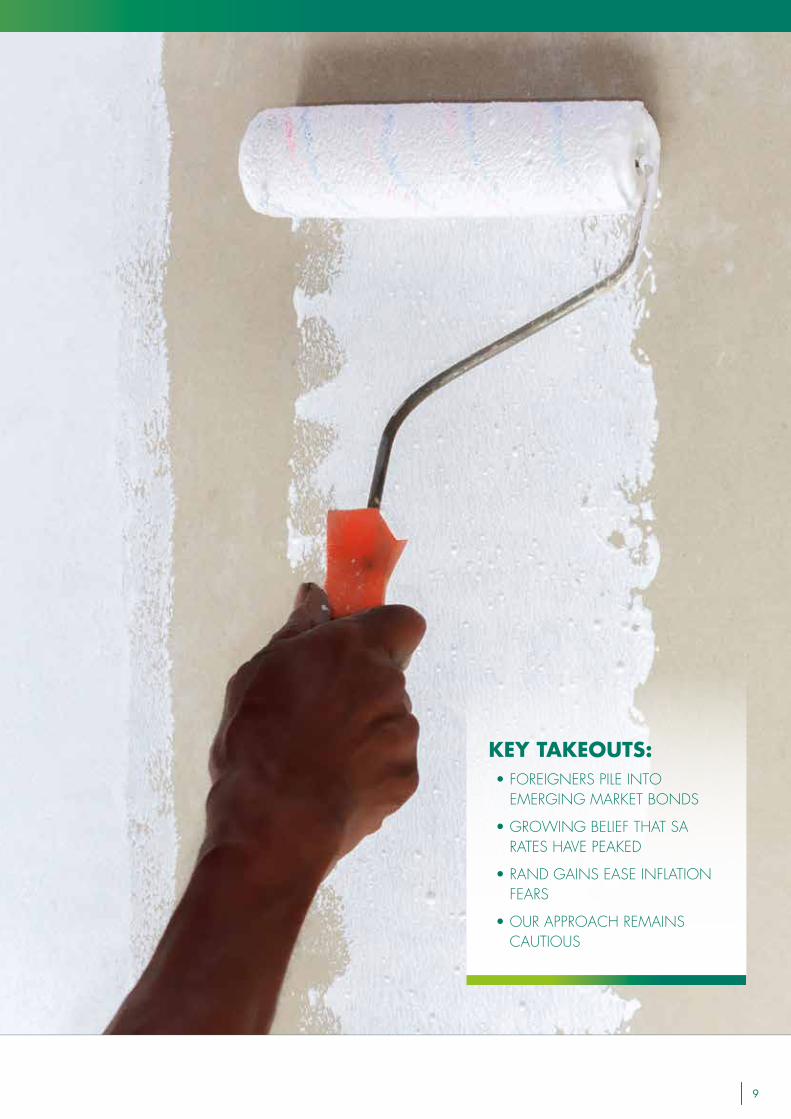
KEY TAKEOUTS:• FOREIGNERS PILE INTO
EMERGING MARKET BONDS
• GROWING BELIEF THAT SA RATES HAVE PEAKED
• RAND GAINS EASE INFLATION FEARS
• OUR APPROACH REMAINS CAUTIOUS
10
The global stampede into emerging market bonds continued in
July. If anything, the Brexit fallout merely served to boost market
expectations that the unprecedently loose monetary policy,
especially in developed economies, will be left unchanged for
longer than previously expected. Even expectations of policy
normalisation in the US are being pushed out. With a number of
G7 government bond yield curves sinking deeper into negative
territory, and little prospects of them rising soon, the global search
for higher-yielding investments (read riskier), which include credit
markets and emerging market debt, had to follow.
As a direct result of this, non-resident net purchases of rand-
denominated government bonds continued to rise sharply and
are now at levels reminiscent of the large inflows of 2012 (at
that point, sparked by an earlier global reach for yield and also
technical factors such as the inclusion of South Africa into the
Citi Group Global Bond Index). These flows more than offset net
equity sales by foreign investors and were clearly one of the main
drivers of the recent strong appreciation in the rand.
WEAK GROWTH SUGGESTS INTEREST RATE PEAKIn addition to higher foreign demand for local currency bonds,
interest rate bulls received support from the majority of local
data releases. Of particular interest to market participants was
the external monthly trade data, which points to a significant
recovery of the current account in the second quarter of this
year. As was widely expected, the South African Reserve Bank
(SARB) left the repo rate unchanged at the July policy meeting.
The fact that the SARB adjusted its own GDP growth and inflation
estimates lower, boosted mounting expectations that the interest
rate cycle had peaked and that the possibility of rate cuts next
year should at least be considered.
GLOBAL QUEST FOR YIELD IS WHITEWASHING SA’S ECONOMIC WOES WIKUS FURSTENBERG | PORTFOLIO MANAGER AT FUTUREGROWTH
Against this backdrop, bond yields continued their march back to levels last seen prior to the Nenegate debacle in December 2015. The yield of the benchmark R186 (maturity 2026) closed the month almost 20 basis points lower at 8.625%. As a result, the JSE All Bond Index rendered a strong return of 2.2% for the month, well above that of the official inflation-linked index (0.1%) and cash (0.6%).
GLOBAL RISK APPETITE WILL REMAIN VOLATILEThe global growth recovery remains fragile and patchy, which sets the scene for a modest future inflation profile as well as significant monetary policy divergence. It also implies a steady and shallow tightening cycle for the few economies that are in a position to normalise monetary policy, especially the US. This should cap global bond yields. On the negative side, the continued uncertainty about the global, and particularly the Chinese, growth outlook remains a risk − especially for emerging market commodity producers with a weak external position in both absolute and relative terms, like South Africa. We also expect global risk appetite to remain volatile and do not regard market rallies boosted by expectations of more policy easing, especially from monetary authorities, as a sustainable driver.
REACH FOR YIELD CONCEALS SA RISKSLocally, recent rand appreciation will ease fears about the near-term inflation outlook, although we still expect a bout of upward pressure on inflation over the next few months. We have to concede that it has become increasingly difficult for the SARB to maintain a firm tightening bias, especially considering persistently weak growth. Although the Minister of Finance is clearly determined to rectify the damage to fiscal policy credibility and, by implication, to avoid a sovereign credit downgrade to non-investment status, the jury is still out on actual delivery. For
INTEREST RATE MARKET OVERVIEW AND OUTLOOK
11
instance, we still await much-needed changes at the troubled
state-owned enterprises. Therefore, the risk of a credit rating
downgrade over the next 12 months still hovers. In the short
term, local political uncertainty remains a nagging risk. This is
particularly worrying considering how much risk has been priced
out of the market in recent weeks, mostly as a result of the global
reach for yield, which tends to whitewash the economic sins of
emerging markets like South Africa.
Considering the above, we will continue to approach the market with caution. The emphasis remains on capital preservation. For this reason we have a large holding of variable rate bonds and longer-dated money market instruments that are offered at reasonable yields, but with significantly lower market risk. We also believe that inflation-linked bonds may still benefit from the expected rise in inflation from current levels during the second half of this year. Apart from lower than expected inflation, the biggest risk to our cautious stance is sustained foreign inflows into the bond market.
Australia
Canada Denmark
Sweden
Singapore
Norway
Germany
USAFrance
UK
South KoreaChinaJapan Slovakia
Mexico
Poland
Spain
Philippines
Italy
SOUTH AFRICA
Indonesia
HungaryPortugal
Brazil
Turkey
Sri Lanka
Greece
-2
0
2
4
6
8
10
AAA
AAA
AAA
AAA
AAA
AAA
AAA
AA+
AA AA AA-
AA-
A+ A+
BBB+
BBB+
BBB+ BB
B
BBB-
BBB-
BB+
BB+
BB+ BB BB B+ B-
10
-yea
r yi
eld
to
ma
turi
ty(%
)
Sources: Bloomberg, Futuregrowth
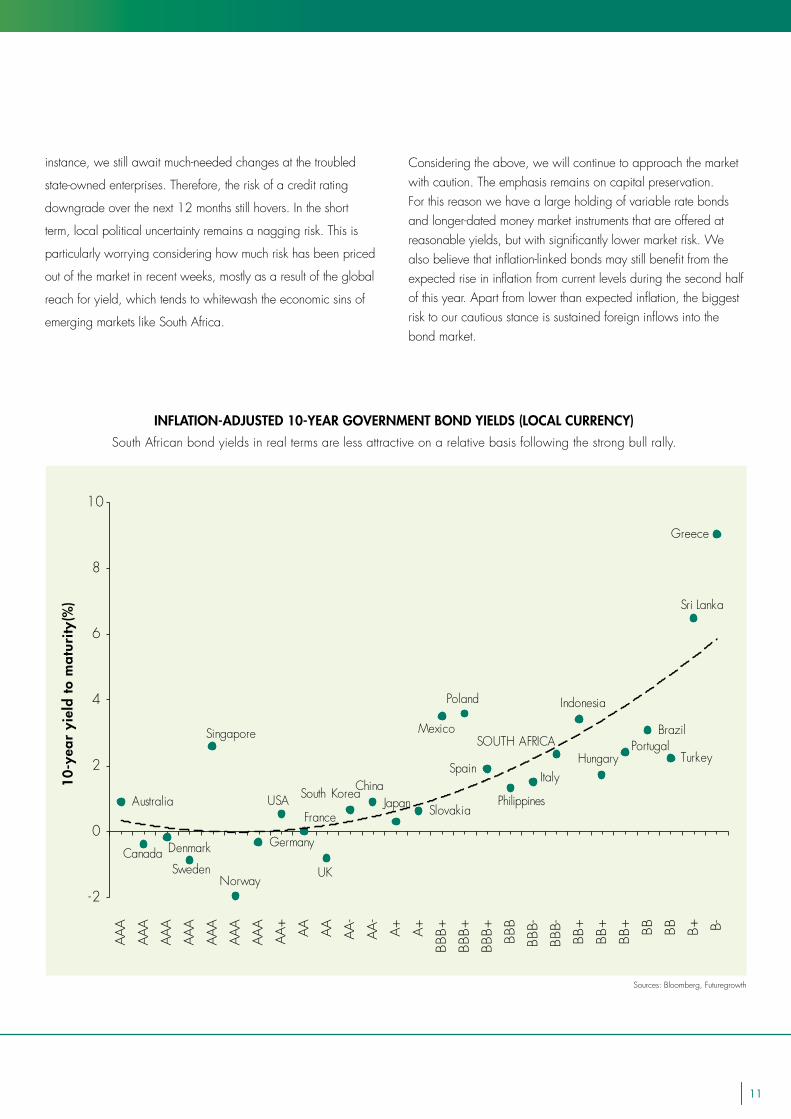
INFLATION-ADJUSTED 10-YEAR GOVERNMENT BOND YIELDS (LOCAL CURRENCY)
South African bond yields in real terms are less attractive on a relative basis following the strong bull rally.

12
KEY TAKEOUTS:• LOW-GROWTH WORLD DRIVES
QUEST FOR YIELD
• EMERGING MARKETS ARE OFFERING UPSIDE
• GLOBAL EQUITY SHIELDS SA-SPECIFIC RISKS
• SA EARNINGS AT MERCY OF EMBATTLED ECONOMY
13
The global environment suggests a continued period of low
growth, low inflation, low interest rates and a low return world.
We have previously referred to this as a state of “purgatory”
or no man’s land and we think this is driving a quest for yield.
In this environment, growth assets are the only opportunity to
deliver decent real returns, despite the higher level of risk.
A recent shift is that emerging markets are offering upside −
based on stronger currencies, cyclical rebounds from very
depressed levels and reasonable valuations. With extremely
low global yields, the value on offer in emerging markets is
looking attractive.
Locally, the main shift in emphasis is that we are getting closer
to the peak in inflation, and hence a peak in interest rates.
Over the longer term (out into 2017/18), we expect to see a
cut in rates.
ASSET CLASS COMMENTARY
SOUTH AFRICASA equity
Local equities have remained resilient in the face of a very
tough macroeconomic environment, due to the abilities of SA’s
excellent company management teams to deliver earnings
growth. Looking forward, we expect stronger average rand
exchange rates to act as a headwind for our rand hedge
companies. However, we also see some improvement in the
outlook for local companies going into 2017. The environment
remains undoubtedly tough, hence a fairly subdued real return
outlook of 4.5% a year over the next five years.
SA propertyThis sector remains in a difficult operating environment, especially in offices, but the top-down environment is more favourable. Very low global yields mean the defensive yields on offer in SA listed property are attractive. We think there is selective value and expect a real return of 5% a year going forward.
SA bondsIn line with all emerging market bonds, SA bonds are offering a good real yield compared with developed market bonds. With inflation peaking in the second half of 2016, and the resultant peak in interest rates, these yields are attractive.
SA cashCash in SA is still offering good returns, but we think interest rates have peaked. This means it will be harder to lock in these good returns on a longer-term basis. While premature, interest rate cuts may be put on the table late next year.
INTERNATIONALGlobal equity Global equity offers a higher yield than global cash and bonds, but earnings growth is needed to produce decent real returns. There are tentative signs of a cyclical improvement, but the high level of political uncertainty will create continued volatility. Global equity remains our preferred diversifier from SA-specific risks.
Global bonds The uncertainty triggered by Brexit has caused global bond yields to lurch lower – to the extent that many of them are negative on a nominal basis. We have cut our longer-term real return outlook to -2% a year over the next five years, coupled with a high level of capital risk.
SA EQUITIES RESILIENT DESPITE TOUGH ENVIRONMENT
PETER BROOKE | HEAD OF MACROSOLUTIONS
14
Global cashOur theme of purgatory suggests continued easy monetary policy and lower cash yields – and hence no return on cash, with the US Federal Reserve (Fed) being the most important wild card. An aggressive Fed is one of the biggest risks to markets and to the rand.
REAL RETURN (P.A.) VIEW
SA + Rand has weakened considerably
Equity 4.5% Neutral− Key risk is earnings delivery as economy battles
Property 5.0% + Defensive yield in a yield-scarce world
Bonds 3.0% Neutral+ Inflation peaking this year
Cash 1.0% − Local rates have peaked
International − Emerging markets look relatively more attractive
Equity 5.0% + Tentative signs of a cyclical improvement
Bonds -2.0% − Record low yields = low returns
Cash -1.0% − Cash is trash
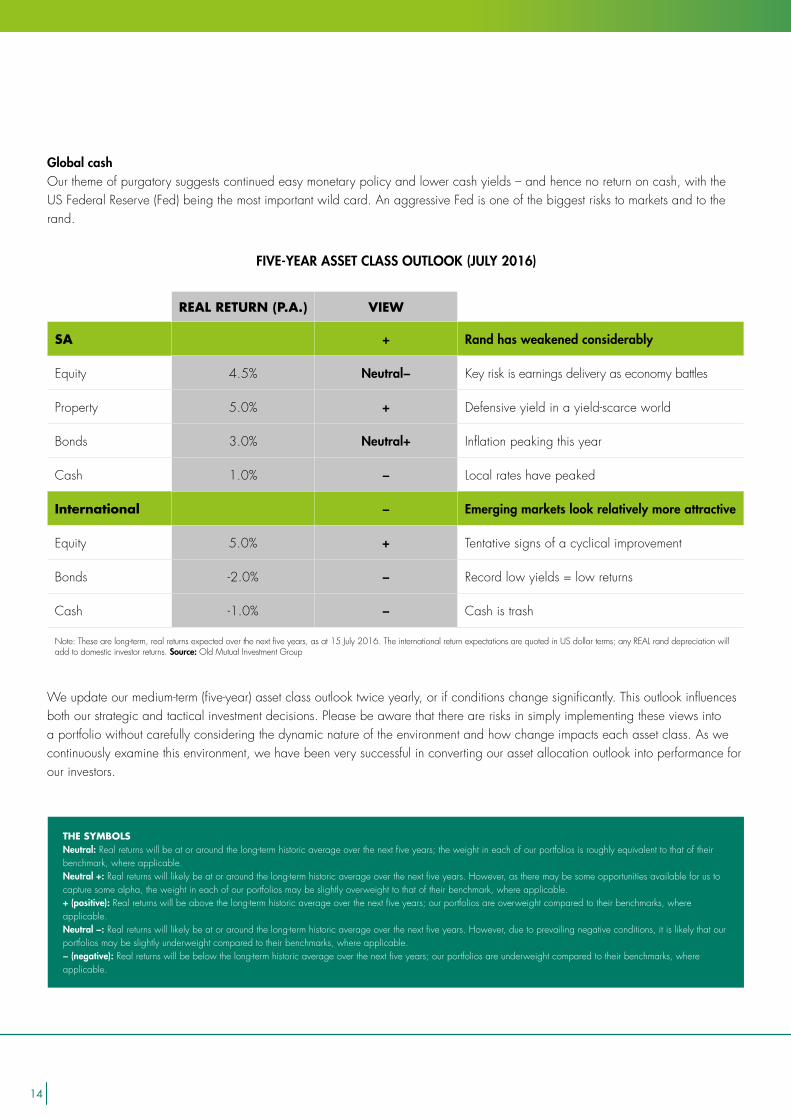
Note: These are long-term, real returns expected over the next five years, as at 15 July 2016. The international return expectations are quoted in US dollar terms; any REAL rand depreciation will add to domestic investor returns. Source: Old Mutual Investment Group
FIVE-YEAR ASSET CLASS OUTLOOK (JULY 2016)
THE SYMBOLSNeutral: Real returns will be at or around the long-term historic average over the next five years; the weight in each of our portfolios is roughly equivalent to that of their benchmark, where applicable.Neutral +: Real returns will likely be at or around the long-term historic average over the next five years. However, as there may be some opportunities available for us to capture some alpha, the weight in each of our portfolios may be slightly overweight to that of their benchmark, where applicable.+ (positive): Real returns will be above the long-term historic average over the next five years; our portfolios are overweight compared to their benchmarks, where applicable.Neutral −: Real returns will likely be at or around the long-term historic average over the next five years. However, due to prevailing negative conditions, it is likely that our portfolios may be slightly underweight compared to their benchmarks, where applicable.− (negative): Real returns will be below the long-term historic average over the next five years; our portfolios are underweight compared to their benchmarks, where applicable.
We update our medium-term (five-year) asset class outlook twice yearly, or if conditions change significantly. This outlook influences both our strategic and tactical investment decisions. Please be aware that there are risks in simply implementing these views into a portfolio without carefully considering the dynamic nature of the environment and how change impacts each asset class. As we continuously examine this environment, we have been very successful in converting our asset allocation outlook into performance for our investors.

15
“Son, please check if there is some money left in the investment?” Trautmann asked. “We are moving to the old-age home and I found this certificate while packing. A little bit of money will help with the moving costs.”
After 50 years, the R400 investment was worth R634 825! That is a return of 16.7% a year. Inflation over that same period was 9.4% a year (as at 30 June 2016).
“Being a financial adviser is not always easy,” explains Hennie. “You have to talk to people about their death, discuss retirement plans with the young and help people with dreams shattered by time and inflation. This is a great example of Old Mutual doing great things.”
OLD MUTUAL INVESTORS’ FUND
When an elderly gentleman walked into financial adviser Hennie Coetzee’s office with a unit trust certificate dating back to 1968, neither ever imagined the outcome. Johannes Trautmann held in his hand a piece of paper showing a R400 lump sum investment in Old Mutual Investors’ Fund.
CEEBRATING 50 YEARS OFOLD MUTUAL INVESTORS' FUND
SOUTH AFRICA'S LONGESTRUNNING UNIT TRUST
MANAGED BY OLD MUTUAL EQUITIES
The performance includes income distributions prior to the deduction of taxes and distributions are reinvested on the ex-dividend date. Past performance is not a guide to future performance. Annualised returns are the weighted average compound growth rate over the performance period measured. The actual highest, average and lowest 12-month return figures since inception to 30 June 2016 are 96.0% (highest), 20.1% (average) and -45.7% (lowest). The fund was launched on 31 October 1966. Sources: Morningstar, Old Mutual Investment Group
16
KEY TAKEOUTS:• SA INFLOWS SURPASS MARKET
LIQUIDITY
• SHRINKING TOOLBOX CREATES RETURN DISPERSION
• OWNERSHIP LIMITS FURTHER SHRINK UNIVERSE
• HOW WE COMBAT AUM OBSTACLES
17
THE SHRINKING TOOLBOX:HOW BIG IS TOO BIG? CRAIG CHAMBERS | HEAD OF INTERNATIONAL DISTRIBUTION
A few years ago we had the privilege of meeting Jack Bogle, founder and chairman of the Vanguard Group, the second largest asset management firm on the planet, with almost US$3 trillion in assets under management (AUM). During our conversation, Jack made a throwaway comment that went something like this, “Surely your local pension funds would never invest more than 5% of their assets in South African equities?” Of course, Jack was totally unaware of our 25% foreign exchange control limitations. He simply assumed that this degree of diversification would be logical, given the size and depth of our SA market relative to his US environment. His comment was based on gut feel. However, the reality is even more pronounced than he realised.
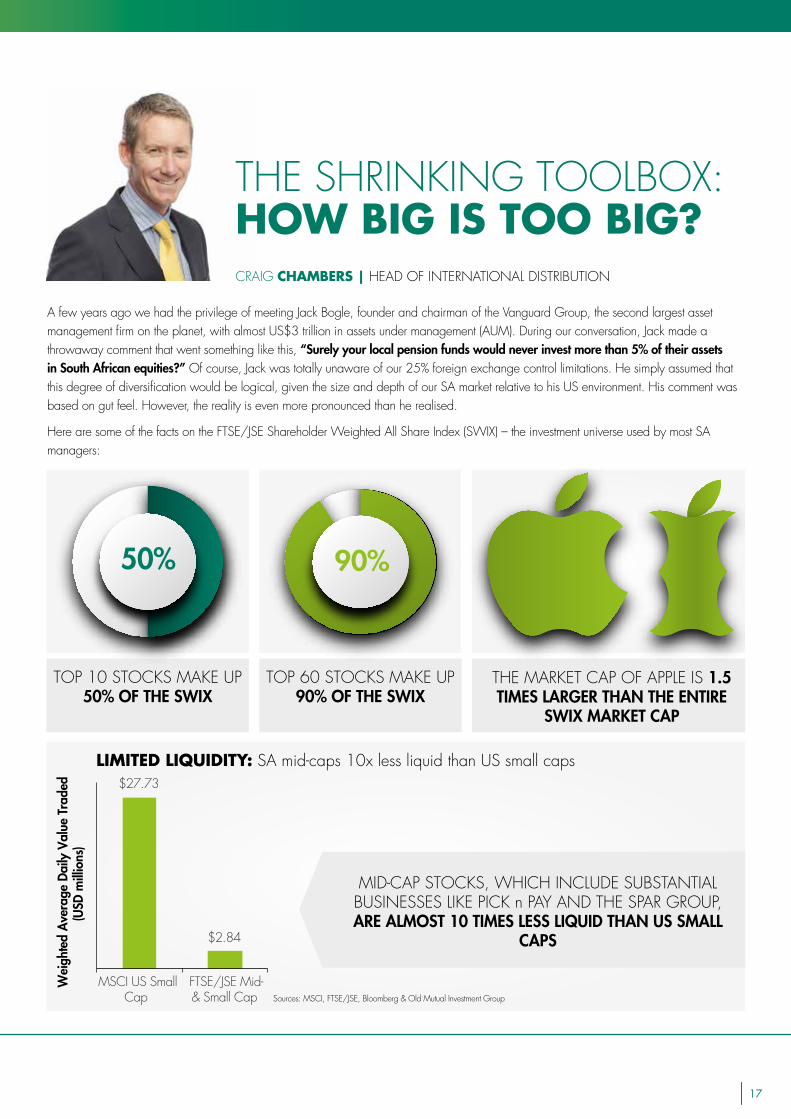
Here are some of the facts on the FTSE/JSE Shareholder Weighted All Share Index (SWIX) – the investment universe used by most SA managers:
50%
TOP 10 STOCKS MAKE UP 50% OF THE SWIX
TOP 60 STOCKS MAKE UP 90% OF THE SWIX
THE MARKET CAP OF APPLE IS 1.5 TIMES LARGER THAN THE ENTIRE
SWIX MARKET CAP
MID-CAP STOCKS, WHICH INCLUDE SUBSTANTIAL BUSINESSES LIKE PICK n PAY AND THE SPAR GROUP, ARE ALMOST 10 TIMES LESS LIQUID THAN US SMALL
CAPS
90%
$27.73
$2.84
MSCI US SmallCap
FTSE/JSE Mid-& Small Cap
Wei
ghte
d A
vera
ge D
aily
Val
ue T
rade
d(U
SD m
illio
ns)
LIMITED LIQUIDITY: SA mid-caps 10x less liquid than US small caps
Sources: MSCI, FTSE/JSE, Bloomberg & Old Mutual Investment Group
18
Source: Old Mutual Investment Group
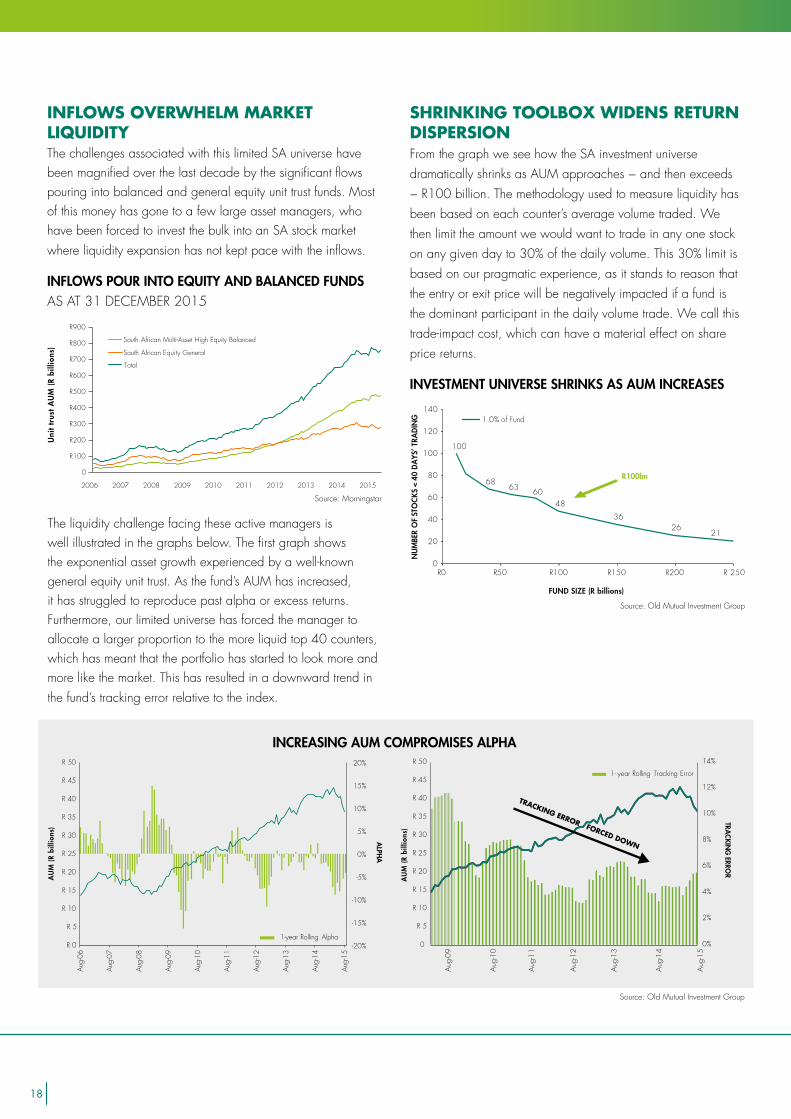
INFLOWS OVERWHELM MARKET LIQUIDITY The challenges associated with this limited SA universe have been magnified over the last decade by the significant flows pouring into balanced and general equity unit trust funds. Most of this money has gone to a few large asset managers, who have been forced to invest the bulk into an SA stock market where liquidity expansion has not kept pace with the inflows.
INFLOWS POUR INTO EQUITY AND BALANCED FUNDS AS AT 31 DECEMBER 2015
The liquidity challenge facing these active managers is well illustrated in the graphs below. The first graph shows the exponential asset growth experienced by a well-known general equity unit trust. As the fund’s AUM has increased, it has struggled to reproduce past alpha or excess returns. Furthermore, our limited universe has forced the manager to allocate a larger proportion to the more liquid top 40 counters, which has meant that the portfolio has started to look more and more like the market. This has resulted in a downward trend in the fund’s tracking error relative to the index.
-20%
-15%
-10%
-5%
0%
5%
10%
15%
20%
R 0
R 5
R 10
R 15
R 20
R 25
R 30
R 35
R 40
R 45
R 50
Aug
-06
Aug
-07
Aug
-08
Aug
-09
Aug
-10
Aug
-11
Aug
-12
Aug
-13
Aug
-14
Aug
-15
ALPH
A
1-year Rolling Alpha
AU
M (
R bi
llion
s)
Aug
-09
Aug
-10
Aug
-11
Aug
-12
Aug
-13
Aug
-14
Aug
-15
0%
2%
4%
6%
8%
10%
12%
14%
0
R 5
R 10
R 15
R 20
R 25
R 30
R 35
R 40
R 45
R 50
1- year Rolling Tracking Error
TRACKIN
G ERRO
R
TRACKING ERROR FORCED DOWN
AU
M (
R bi
llion
s)
Source: Old Mutual Investment Group
NU
MBE
R O
F ST
OCK
S <
40 D
AYS
’ TRA
DIN
G
FUND SIZE (R billions)
100
6863 60
48
3626
21
0
20
40
60
80
100
120
140
R0 R50 R100 R150 R200 R 250
R100bn
1.0% of Fund
Source: Morningstar
Uni
t tr
ust
AU
M (
R bi
llion
s)
0
R100
R200
R300
R400
R500
R600
R700
R800
R900
2006 2007 2008 2009 2010 2011 2012 2013 2014 2015
South African Multi-Asset High Equity Balanced
South African Equity General
Total
INCREASING AUM COMPROMISES ALPHA
SHRINKING TOOLBOX WIDENS RETURN DISPERSIONFrom the graph we see how the SA investment universe dramatically shrinks as AUM approaches − and then exceeds − R100 billion. The methodology used to measure liquidity has been based on each counter’s average volume traded. We then limit the amount we would want to trade in any one stock on any given day to 30% of the daily volume. This 30% limit is based on our pragmatic experience, as it stands to reason that the entry or exit price will be negatively impacted if a fund is the dominant participant in the daily volume trade. We call this trade-impact cost, which can have a material effect on share price returns.
INVESTMENT UNIVERSE SHRINKS AS AUM INCREASES
19
Based on these assumptions, we are then able to determine how many stocks a fund can "realistically" invest in, as AUM increases. We define "realistic" as being able to trade into or out of a stock within 40 trading days. The graphic indicates that to achieve a 1% weighting in a stock, a R25 billion fund would have access to a realistic universe of about 70 counters. This universe declines to 65 counters at R50 billion and about 50 stocks at R100 billion. Based on this analysis, it is reasonable to assume that a material increase in a fund’s AUM can significantly impact future excess return generation, especially if historic performance relied on high tracking errors and frequent trading.
In an attempt to counter this shrinking universe, very large funds can no longer increase tracking error via mid- and small cap bets. Instead, they are forced to take bigger and bigger sector bets (think resources). They do this in an attempt to avoid “benchmark hugging” which, in turn, produces style drift away from their successful historic recipe.
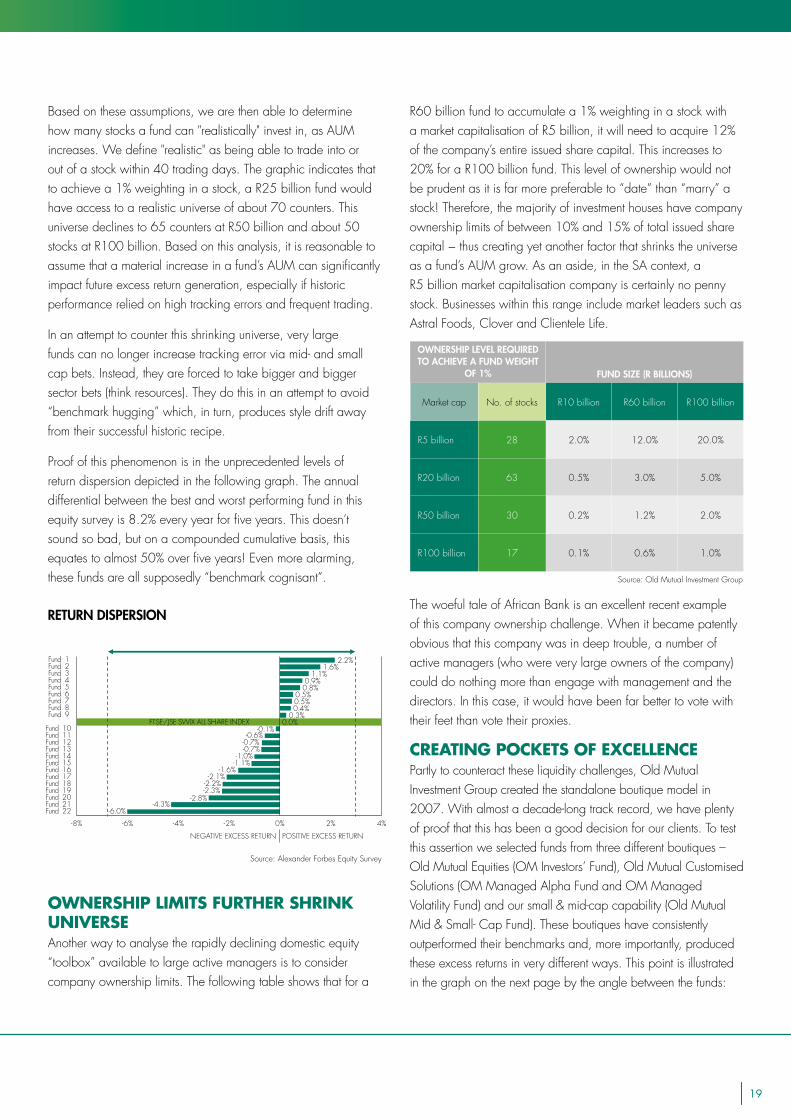
Proof of this phenomenon is in the unprecedented levels of return dispersion depicted in the following graph. The annual differential between the best and worst performing fund in this equity survey is 8.2% every year for five years. This doesn’t sound so bad, but on a compounded cumulative basis, this equates to almost 50% over five years! Even more alarming, these funds are all supposedly “benchmark cognisant”.
RETURN DISPERSION
OWNERSHIP LIMITS FURTHER SHRINK UNIVERSEAnother way to analyse the rapidly declining domestic equity “toolbox” available to large active managers is to consider company ownership limits. The following table shows that for a
-6.0%-4.3%
-2.8%-2.3%-2.2%-2.1%
-1.6%-1.1%-1.0%
-0.7%-0.7%-0.6%
-0.1%0.0%
0.3%0.4%0.5%0.5%
0.8%0.9%
1.1%1.6%
2.2%
-8% -6% -4% -2% 0% 2% 4%
Fund 22Fund 21Fund 20Fund 19Fund 18Fund 17Fund 16Fund 15Fund 14Fund 13Fund 12Fund 11Fund 10
Fund 9Fund 8Fund 7Fund 6Fund 5Fund 4Fund 3Fund 2Fund 1
FTSE/JSE SWIX ALL SHARE INDEX
NEGATIVE EXCESS RETURN POSITIVE EXCESS RETURN
Source: Alexander Forbes Equity Survey
R60 billion fund to accumulate a 1% weighting in a stock with a market capitalisation of R5 billion, it will need to acquire 12% of the company’s entire issued share capital. This increases to 20% for a R100 billion fund. This level of ownership would not be prudent as it is far more preferable to “date” than “marry” a stock! Therefore, the majority of investment houses have company ownership limits of between 10% and 15% of total issued share capital − thus creating yet another factor that shrinks the universe as a fund’s AUM grow. As an aside, in the SA context, a R5 billion market capitalisation company is certainly no penny stock. Businesses within this range include market leaders such as Astral Foods, Clover and Clientele Life.
The woeful tale of African Bank is an excellent recent example of this company ownership challenge. When it became patently obvious that this company was in deep trouble, a number of active managers (who were very large owners of the company) could do nothing more than engage with management and the directors. In this case, it would have been far better to vote with their feet than vote their proxies.
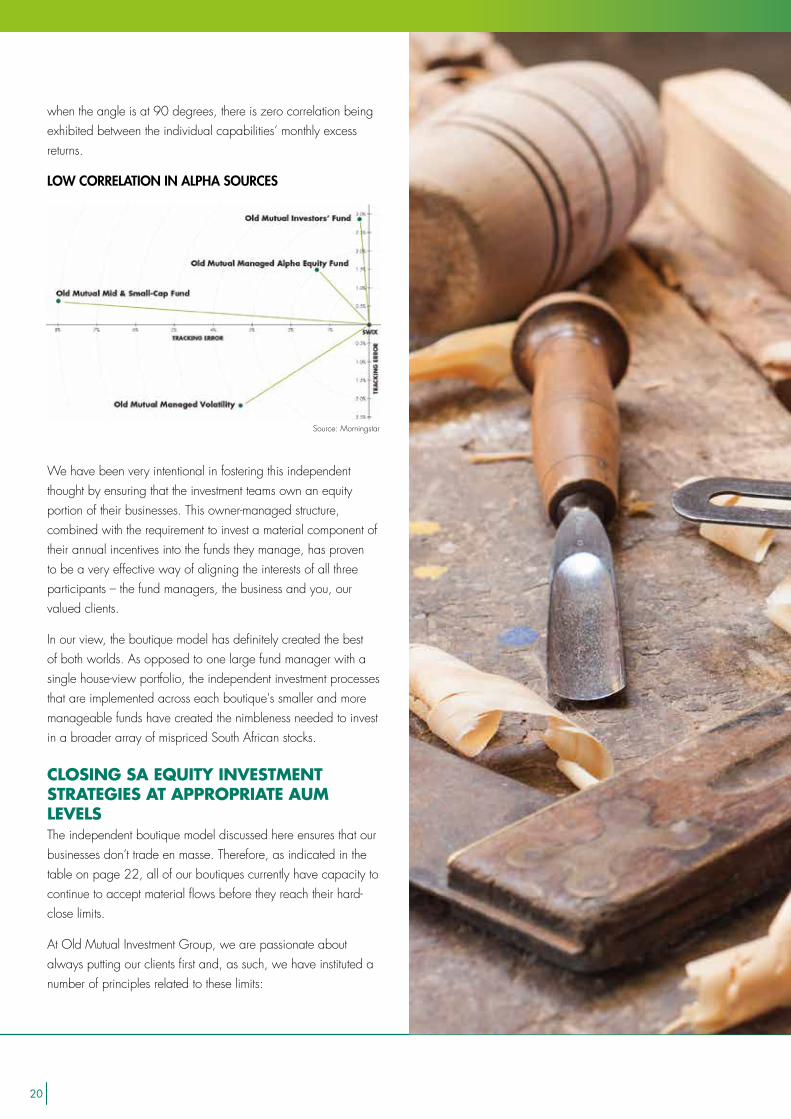
CREATING POCKETS OF EXCELLENCE Partly to counteract these liquidity challenges, Old Mutual Investment Group created the standalone boutique model in 2007. With almost a decade-long track record, we have plenty of proof that this has been a good decision for our clients. To test this assertion we selected funds from three different boutiques – Old Mutual Equities (OM Investors’ Fund), Old Mutual Customised Solutions (OM Managed Alpha Fund and OM Managed Volatility Fund) and our small & mid-cap capability (Old Mutual Mid & Small- Cap Fund). These boutiques have consistently outperformed their benchmarks and, more importantly, produced these excess returns in very different ways. This point is illustrated in the graph on the next page by the angle between the funds:
OWNERSHIP LEVEL REQUIRED TO ACHIEVE A FUND WEIGHT
OF 1% FUND SIZE (R BILLIONS)
Market cap No. of stocks R10 billion R60 billion R100 billion
R5 billion 28 2.0% 12.0% 20.0%
R20 billion 63 0.5% 3.0% 5.0%
R50 billion 30 0.2% 1.2% 2.0%
R100 billion 17 0.1% 0.6% 1.0%
Source: Old Mutual Investment Group
20
when the angle is at 90 degrees, there is zero correlation being exhibited between the individual capabilities’ monthly excess returns.
LOW CORRELATION IN ALPHA SOURCES
We have been very intentional in fostering this independent thought by ensuring that the investment teams own an equity portion of their businesses. This owner-managed structure, combined with the requirement to invest a material component of their annual incentives into the funds they manage, has proven to be a very effective way of aligning the interests of all three participants – the fund managers, the business and you, our valued clients.
In our view, the boutique model has definitely created the best of both worlds. As opposed to one large fund manager with a single house-view portfolio, the independent investment processes that are implemented across each boutique's smaller and more manageable funds have created the nimbleness needed to invest in a broader array of mispriced South African stocks.
CLOSING SA EQUITY INVESTMENT STRATEGIES AT APPROPRIATE AUM LEVELS The independent boutique model discussed here ensures that our businesses don’t trade en masse. Therefore, as indicated in the table on page 22, all of our boutiques currently have capacity to continue to accept material flows before they reach their hard-close limits.
At Old Mutual Investment Group, we are passionate about always putting our clients first and, as such, we have instituted a number of principles related to these limits:
Source: Morningstar

21
• The discipline related to a hard-close is paramount and must
be visible to the market via clearly defined liquidity metrics,
such as participation in a maximum of 30% of average daily
trade.
• There is obviously a trade-off between profitability and a
shrinking toolbox. In other words, at some point, accepting
additional flows to boost profitability will start to detrimentally
impact client returns. Given the boutique environment, where
professional service costs are allocated across boutiques,
we have the added benefit of being able to set lower hard-
close limits as these shared costs produce better margins
and therefore decent boutique profitability. The individual
businesses are therefore able to avoid the temptation to push
limits to unrealistic levels or never really shutting the doors by
accepting additional flows from their existing clients. (We
don’t believe that this kind of soft-close environment is in our
clients' best interests, especially if pre-determined targets are
being breached.)
GARAGE VERSUS GOVERNANCEThe liquidity analysis presented above has shown that the
number of counters available to SA equity managers declines
precipitously as funds under management increase. One
could therefore reach the logical conclusion that the smaller a
manager’s AUM, the better. But in reality, “too big” isn’t great, but
neither is “too small”.
In other words, the investment houses operating out of their
garages with gmail addresses might be ultra-nimble, but the
sustainability of their business models is a real risk. These small
shops often don’t have access to the best research, resources and
systems. In addition, their capital adequacy tends to be at the
margin, while compliance is typically thin on the ground.
Therefore, you need to consider an investment capability that
provides the best of both worlds: plenty of AUM capacity to
continue to produce excess returns (tools in the toolbox) while
also having sufficient economies of scale to ensure your assets
are being appropriately safeguarded via rigorous oversight.
We believe that our boutique model exhibits both of these
attributes and that these independently managed businesses
are well positioned to continue producing benchmark-beating
performance without compromising on governance.
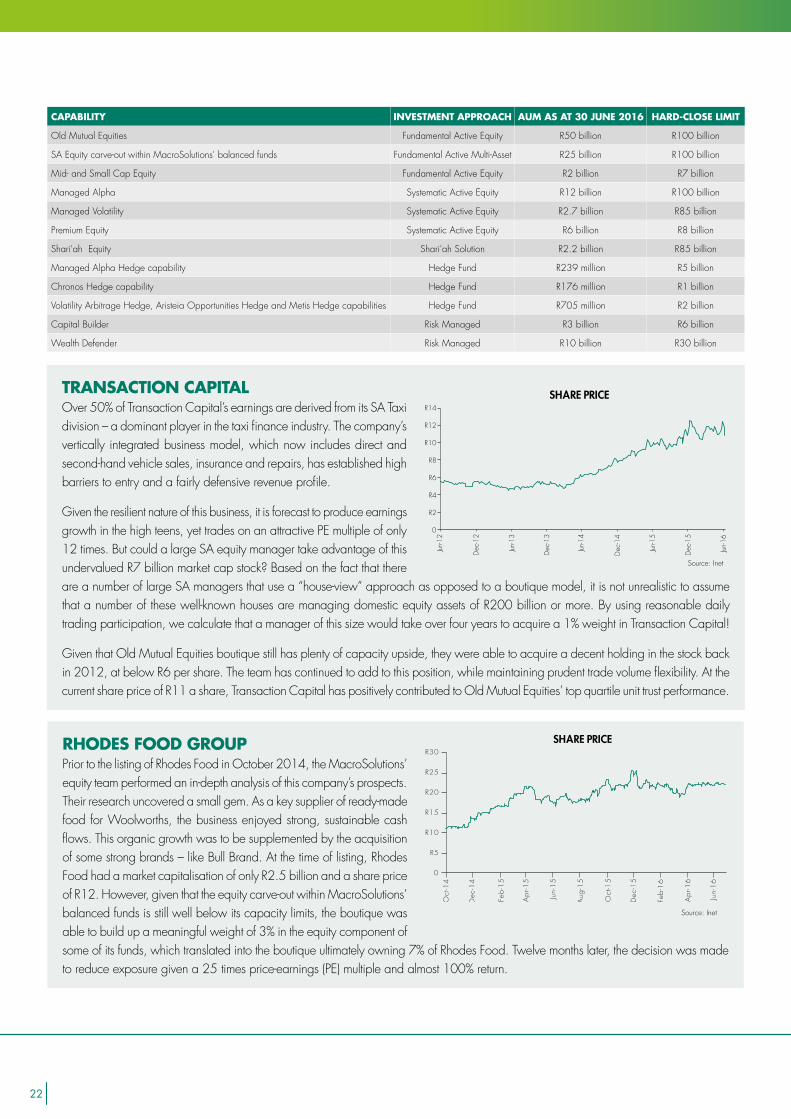
RHODES FOOD GROUPPrior to the listing of Rhodes Food in October 2014, the MacroSolutions’ equity team performed an in-depth analysis of this company’s prospects. Their research uncovered a small gem. As a key supplier of ready-made food for Woolworths, the business enjoyed strong, sustainable cash flows. This organic growth was to be supplemented by the acquisition of some strong brands – like Bull Brand. At the time of listing, Rhodes Food had a market capitalisation of only R2.5 billion and a share price of R12. However, given that the equity carve-out within MacroSolutions’ balanced funds is still well below its capacity limits, the boutique was able to build up a meaningful weight of 3% in the equity component of some of its funds, which translated into the boutique ultimately owning 7% of Rhodes Food. Twelve months later, the decision was made to reduce exposure given a 25 times price-earnings (PE) multiple and almost 100% return.
SHARE PRICE
0
R5
R10
R15
R20
R25
R30
Oct
-14
Dec
-14
Feb-1
5
Apr-1
5
Jun-
15
Oct
-15
Dec
-15
Feb-1
6
Apr-1
6
Jun-
16
Aug
-15
Source: Inet
TRANSACTION CAPITALOver 50% of Transaction Capital’s earnings are derived from its SA Taxi division – a dominant player in the taxi finance industry. The company’s vertically integrated business model, which now includes direct and second-hand vehicle sales, insurance and repairs, has established high barriers to entry and a fairly defensive revenue profile.
Given the resilient nature of this business, it is forecast to produce earnings growth in the high teens, yet trades on an attractive PE multiple of only 12 times. But could a large SA equity manager take advantage of this undervalued R7 billion market cap stock? Based on the fact that there are a number of large SA managers that use a “house-view” approach as opposed to a boutique model, it is not unrealistic to assume that a number of these well-known houses are managing domestic equity assets of R200 billion or more. By using reasonable daily trading participation, we calculate that a manager of this size would take over four years to acquire a 1% weight in Transaction Capital!
Given that Old Mutual Equities boutique still has plenty of capacity upside, they were able to acquire a decent holding in the stock back in 2012, at below R6 per share. The team has continued to add to this position, while maintaining prudent trade volume flexibility. At the current share price of R11 a share, Transaction Capital has positively contributed to Old Mutual Equities’ top quartile unit trust performance.
0
R2
R4
R6
R8
R10
R12
R14
Jun-1
2
Dec
-12
Jun-1
3
Dec
-13
Jun-1
4
Dec
-14
Jun-1
5
Dec
-15
Jun-1
6
SHARE PRICE
Source: Inet
22
CAPABILITY INVESTMENT APPROACH AUM AS AT 30 JUNE 2016 HARD-CLOSE LIMIT
Old Mutual Equities Fundamental Active Equity R50 billion R100 billion
SA Equity carve-out within MacroSolutions' balanced funds Fundamental Active Multi-Asset R25 billion R100 billion
Mid- and Small Cap Equity Fundamental Active Equity R2 billion R7 billion
Managed Alpha Systematic Active Equity R12 billion R100 billion
Managed Volatility Systematic Active Equity R2.7 billion R85 billion
Premium Equity Systematic Active Equity R6 billion R8 billion
Shari'ah Equity Shari'ah Solution R2.2 billion R85 billion
Managed Alpha Hedge capability Hedge Fund R239 million R5 billion
Chronos Hedge capability Hedge Fund R176 million R1 billion
Volatility Arbitrage Hedge, Aristeia Opportunities Hedge and Metis Hedge capabilities Hedge Fund R705 million R2 billion
Capital Builder Risk Managed R3 billion R6 billion
Wealth Defender Risk Managed R10 billion R30 billion
23
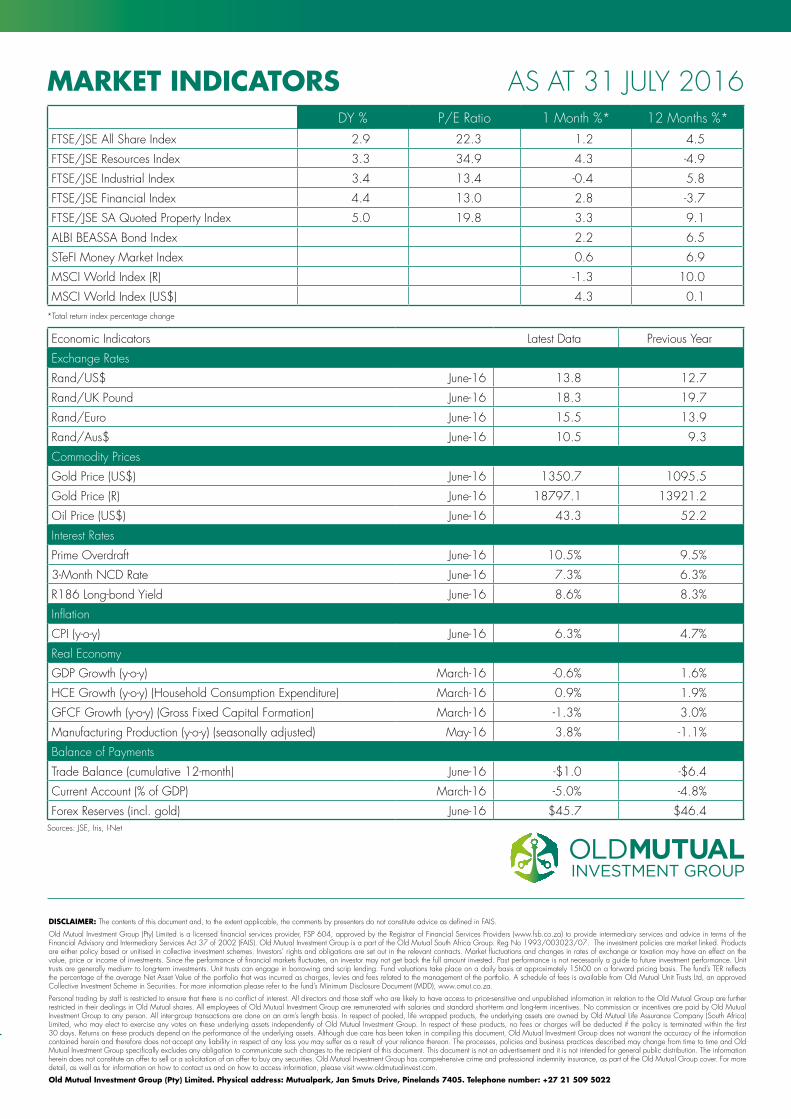
DY % P/E Ratio 1 Month %* 12 Months %*FTSE/JSE All Share Index 2.9 22.3 1.2 4.5
FTSE/JSE Resources Index 3.3 34.9 4.3 -4.9
FTSE/JSE Industrial Index 3.4 13.4 -0.4 5.8
FTSE/JSE Financial Index 4.4 13.0 2.8 -3.7
FTSE/JSE SA Quoted Property Index 5.0 19.8 3.3 9.1
ALBI BEASSA Bond Index 2.2 6.5
STeFI Money Market Index 0.6 6.9
MSCI World Index (R) -1.3 10.0
MSCI World Index (US$) 4.3 0.1
Economic Indicators Latest Data Previous Year
Exchange Rates
Rand/US$ June-16 13.8 12.7
Rand/UK Pound June-16 18.3 19.7
Rand/Euro June-16 15.5 13.9
Rand/Aus$ June-16 10.5 9.3
Commodity Prices
Gold Price (US$) June-16 1350.7 1095.5
Gold Price (R) June-16 18797.1 13921.2
Oil Price (US$) June-16 43.3 52.2
Interest Rates
Prime Overdraft June-16 10.5% 9.5%
3-Month NCD Rate June-16 7.3% 6.3%
R186 Long-bond Yield June-16 8.6% 8.3%
Inflation
CPI (y-o-y) June-16 6.3% 4.7%
Real Economy
GDP Growth (y-o-y) March-16 -0.6% 1.6%
HCE Growth (y-o-y) (Household Consumption Expenditure) March-16 0.9% 1.9%
GFCF Growth (y-o-y) (Gross Fixed Capital Formation) March-16 -1.3% 3.0%
Manufacturing Production (y-o-y) (seasonally adjusted) May-16 3.8% -1.1%
Balance of Payments
Trade Balance (cumulative 12-month) June-16 -$1.0 -$6.4
Current Account (% of GDP) March-16 -5.0% -4.8%
Forex Reserves (incl. gold) June-16 $45.7 $46.4
MARKET INDICATORS
Sources: JSE, Iris, I-Net
*Total return index percentage change
AS AT 31 JULY 2016
DISCLAIMER: The contents of this document and, to the extent applicable, the comments by presenters do not constitute advice as defined in FAIS.
Old Mutual Investment Group (Pty) Limited is a licensed financial services provider, FSP 604, approved by the Registrar of Financial Services Providers (www.fsb.co.za) to provide intermediary services and advice in terms of theFinancial Advisory and Intermediary Services Act 37 of 2002 (FAIS). Old Mutual Investment Group is a part of the Old Mutual South Africa Group. Reg No 1993/003023/07. The investment policies are market linked. Products are either policy based or unitised in collective investment schemes. Investors’ rights and obligations are set out in the relevant contracts. Market fluctuations and changes in rates of exchange or taxation may have an effect on the value, price or income of investments. Since the performance of financial markets fluctuates, an investor may not get back the full amount invested. Past performance is not necessarily a guide to future investment performance. Unit trusts are generally medium- to long-term investments. Unit trusts can engage in borrowing and scrip lending. Fund valuations take place on a daily basis at approximately 15h00 on a forward pricing basis. The fund’s TER reflects the percentage of the average Net Asset Value of the portfolio that was incurred as charges, levies and fees related to the management of the portfolio. A schedule of fees is available from Old Mutual Unit Trusts Ltd, an approved Collective Investment Scheme in Securities. For more information please refer to the fund’s Minimum Disclosure Document (MDD), www.omut.co.za.
Personal trading by staff is restricted to ensure that there is no conflict of interest. All directors and those staff who are likely to have access to price-sensitive and unpublished information in relation to the Old Mutual Group are further restricted in their dealings in Old Mutual shares. All employees of Old Mutual Investment Group are remunerated with salaries and standard short-term and long-term incentives. No commission or incentives are paid by Old Mutual Investment Group to any person. All inter-group transactions are done on an arm’s length basis. In respect of pooled, life wrapped products, the underlying assets are owned by Old Mutual Life Assurance Company (South Africa) Limited, who may elect to exercise any votes on these underlying assets independently of Old Mutual Investment Group. In respect of these products, no fees or charges will be deducted if the policy is terminated within the first 30 days. Returns on these products depend on the performance of the underlying assets. Although due care has been taken in compiling this document, Old Mutual Investment Group does not warrant the accuracy of the information contained herein and therefore does not accept any liability in respect of any loss you may suffer as a result of your reliance thereon. The processes, policies and business practices described may change from time to time and Old Mutual Investment Group specifically excludes any obligation to communicate such changes to the recipient of this document. This document is not an advertisement and it is not intended for general public distribution. The information herein does not constitute an offer to sell or a solicitation of an offer to buy any securities. Old Mutual Investment Group has comprehensive crime and professional indemnity insurance, as part of the Old Mutual Group cover. For more detail, as well as for information on how to contact us and on how to access information, please visit www.oldmutualinvest.com.
Old Mutual Investment Group (Pty) Limited. Physical address: Mutualpark, Jan Smuts Drive, Pinelands 7405. Telephone number: +27 21 509 5022
Old Mutual Investment Group (Pty) Limited is a licensed financial services provider, FSP 604, approved by the Registrar of Financial Services Providers (South Africa) (www.fsb.co.za) to provide intermediary services and advice in terms of the Financial Advisory and Intermediary Services Act 37 of 2002.Old Mutual Unit Trust Managers (RF) (Pty) Ltd (OMUT) is a registered manager in terms of the Collective Investment Schemes Control Act 45 of 2002. The fund fees and costs that we charge for managing your investment is accessible on the relevant fund’s Minimum Disclosure Document (MDD) or Table of fees and charges, both available on our public website, or from our contact centre. Past performance is not a guide to future performance.
Start by investing where the fund managers invest.
This year Old Mutual Investment Group is proud to celebrate the 50th anniversary of South Africa’s longest-running unit trust fund: Old Mutual Investors’ Fund. With 50 years of resilient investing through all market conditions, we’ve been helping South Africans to answer their most important investment questions and realise their dreams and life goals.
To invest where the fund managers invest, speak to an adviser or your broker or call 0860 INVEST (468378)
www.oldmutualinvest.com/asinvested
WHEN IT COMES TO INVESTING IN YOUR FUTURE, THERE’S ONLY ONE QUESTION TO ASK:
“WHERE DO I START?”
FCB10019565JB/E
Celebrating50 years
of answeringyour investment
questions
10019565JB_OMIG 50th Print 5_A4.indd 1 2016/08/19 9:23 AM