fundamentals for effective lfa service delivery
TRANSCRIPT

Fundamentals for Effective LFA Service Delivery
LFA TRAINING 2019/20

2
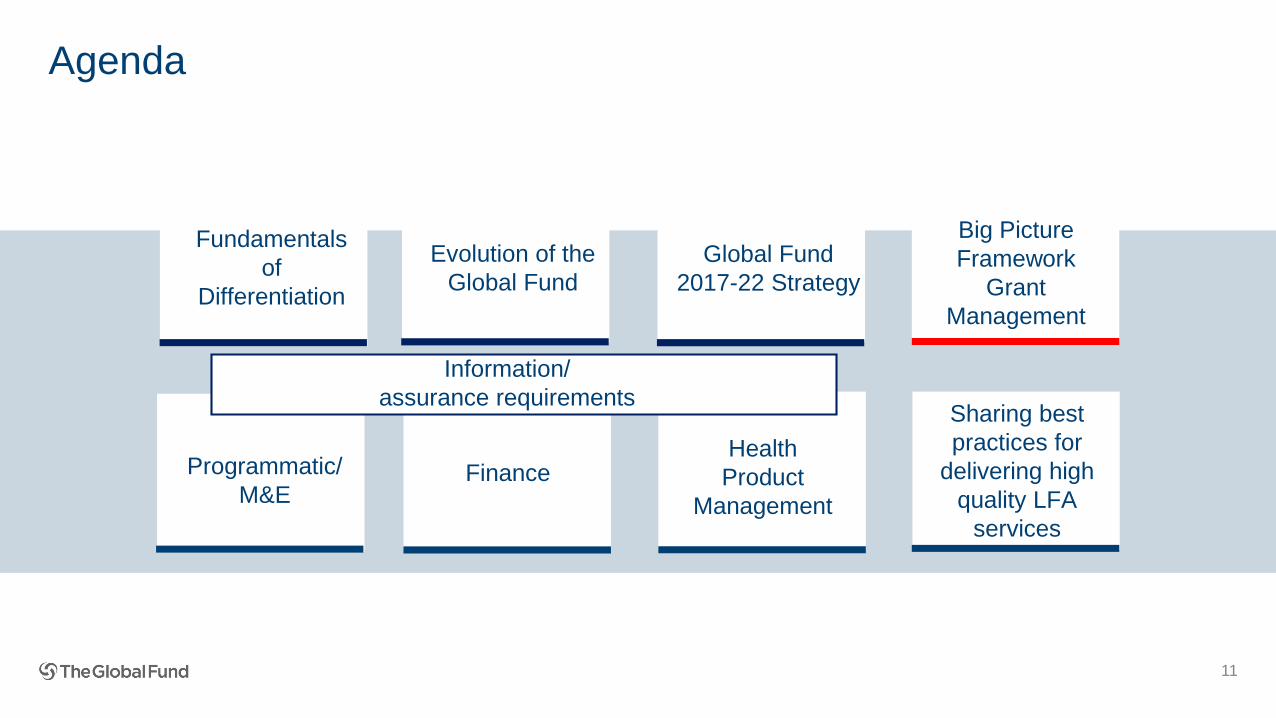
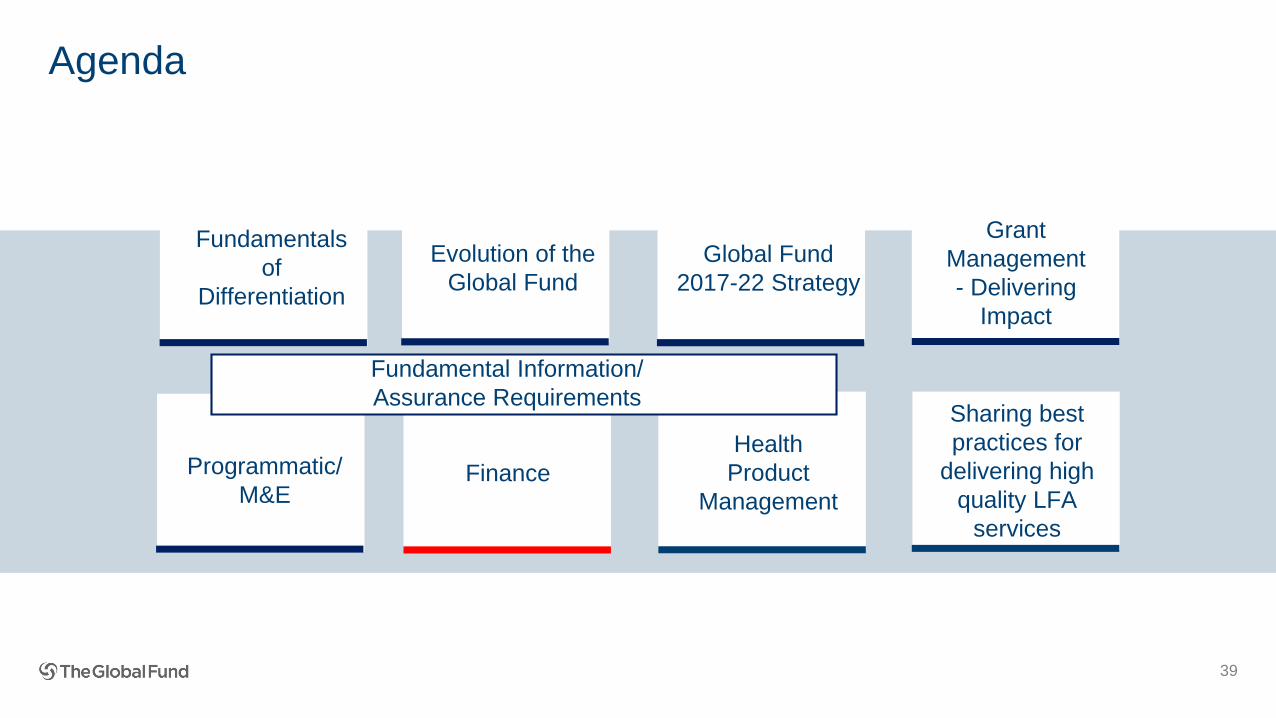
Agenda
Sharing best
practices for
delivering high
quality LFA
services
Evolution of the
Global Fund
Global Fund
2017-22 Strategy
Fundamentals
of
Differentiation
Programmatic/
M&E
Health
Product
Management
Fundamental Information/
Assurance Requirements
Finance
Grant
Management
- Delivering
Impact

Differentiated Portfolio
49
Smaller
portfolios,
lower disease
burden,
lower risk
(< 75M)
Larger
portfolios,
higher disease
burden,
higher risk
Very large
portfolios,
mission critical
disease burden
Challenging Operating Environment
Transitioning Portfolios
FOCUSED
CORE
HIGH
IMPACT
3portfolio categories
Allocation & Impact
2cross-cutting
classifications
(> 75M and < 400M)
(> 400M or High
Impact)
Global Fund portfolio*:
333 active programs
Over 100 countries
$4.0 bn disbursed in 2018

LFA scope of work in focused portfolios
4
Differences to Core/High Impact portfolios
1. Smaller portfolios/lower risks - scope of required LFA assurance = smaller
2. Grant Reporting:
2.1 No PUs
2.2 PUDRs:
• Programmatic verification not required, but if deemed necessary by CT,
then follows standard PUDR verification
• Until now, no verification of expenditures
New: re-introduction of financial verification with next PUDRs!
3. Review of Grant Revisions
• If required, once a year as part of PUDR
• Exceptional material budget revisions any time during the year

5
Agenda
Sharing best
practices for
delivering high
quality LFA
services
Evolution of the
Global Fund
Global Fund
2017-22 Strategy
Fundamentals
of
Differentiation
Programmatic/
M&E
Health
Product
Management
Fundamental Information/
Assurance Requirements
Finance
Grant
Management
- Delivering
Impact
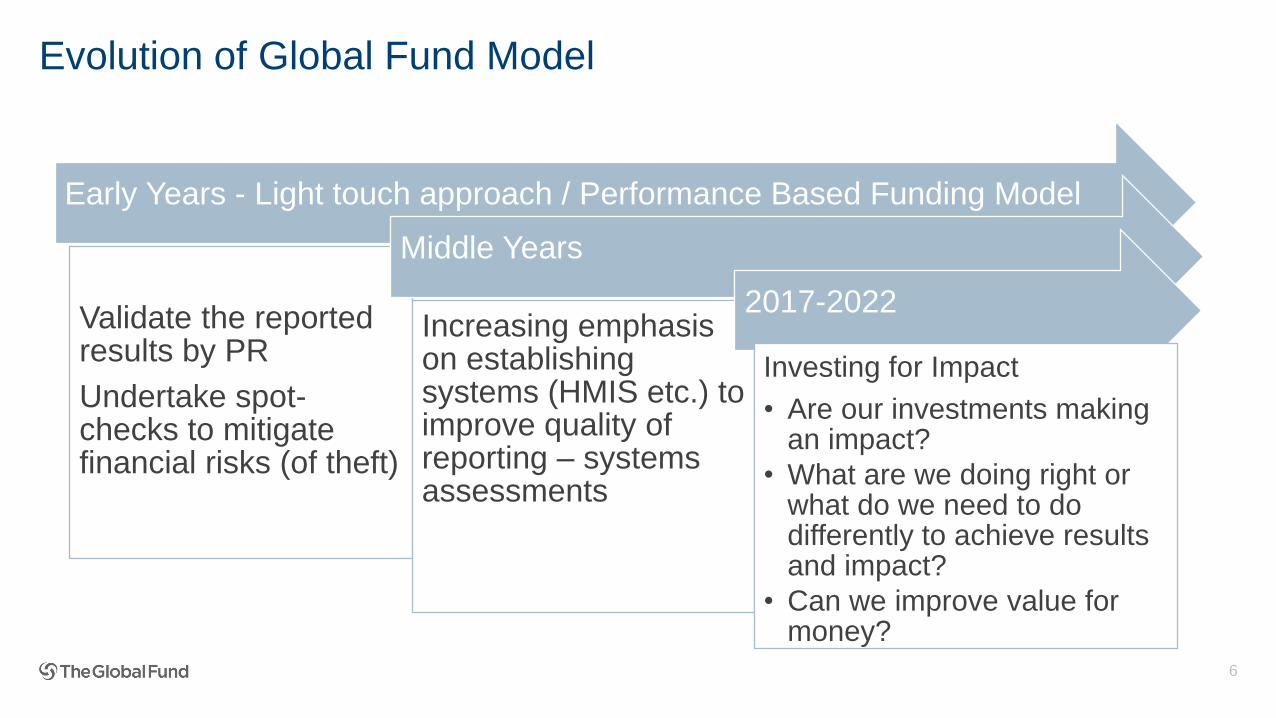
Evolution of Global Fund Model
Early Years - Light touch approach / Performance Based Funding Model
Validate the reported results by PR
Undertake spot-checks to mitigate financial risks (of theft)
Middle Years
Increasing emphasis on establishing systems (HMIS etc.) to improve quality of reporting – systems assessments
2017-2022
Investing for Impact
• Are our investments making an impact?
• What are we doing right or what do we need to do differently to achieve results and impact?
• Can we improve value for money?
6

7
Agenda
Sharing best
practices for
delivering high
quality LFA
services
Evolution of the
Global Fund
Global Fund
2017-22 Strategy
Fundamentals
of
Differentiation
Programmatic/
M&E
Health
Product
Management
Fundamental Information/
Assurance Requirements
Finance
Grant
Management
- Delivering
Impact

8
The why and what of the Global Fund 2017-2022 Strategy

9
MAXIMIZE IMPACT
AGAINST HIV, TB AND
MALARIA
BUILD RESILIENT
AND SUSTAINABLE
SYSTEMS FOR
HEALTH
PROTECT AND
PROMOTE HUMAN
RIGHTS AND
GENDER EQUALITY
MOBILIZE INCREASED
RESOURCES
STRATEGIC ENABLERS: Innovate and differentiate along the development continuum + Support mutually accountable partnerships
A world free of the burden of AIDS, Tuberculosis and malaria with better health for all.
To attract, leverage and invest additional resources to end the epidemics of HIV, tuberculosis and malaria and to support the attainment of the
Sustainable Development Goals.
Vision
Mission
The why and what of the Global Fund 2017-2022 StrategyGlobal Fund Strategy 2017-2022: Investing to End Epidemics

10
Strategic
Targets
Strategic Targets
Performance against impact targets Performance against service delivery targets
Strategic
Objectives
Maximize Impact Against
HIV, TB and malaria
Build resilient &
sustainable systems for
health
Promote and protect
human rights & gender
equality
Mobilize increased
resources
Strategic KPIs
Alignment of investment
& need
Strengthen systems for
health
Gender & age equality Resource mobilization
Investment efficiency Fund utilization Human rights Domestic investments
Service coverage for key
populations
Availability of affordable
health technologies
Implementation
KPIs
Grant level service delivery
performance
Community-based
monitoring
Gender programming Post-replenishment private
sector contributions
Impact modelling coverage Commodity utilization Human rights program
implementation progress
Commodity procurement
under management
Transition preparedness CCM Key Population
engagement
Roll out of innovative
products (triggered KPI)Access to funding
Forecast accuracy: Grant
expense, Commodity
demand, Service delivery
3 6 8 10
4 9 11
5 12
7
1 2
1
10
2
8 116
3
9 127
4
13
5
How will we implement and demonstrate performance?KPI Framework linked to Strategic Framework
LFA Critical Role in achieving efficiency and results along the cycle of grant
implementation: Are we investing in high impact interventions?
11
Agenda
Sharing best
practices for
delivering high
quality LFA
services
Evolution of the
Global Fund
Global Fund
2017-22 Strategy
Fundamentals
of
Differentiation
Programmatic/
M&E
Health
Product
Management
Information/
assurance requirements
Finance
Big Picture
Framework
Grant
Management
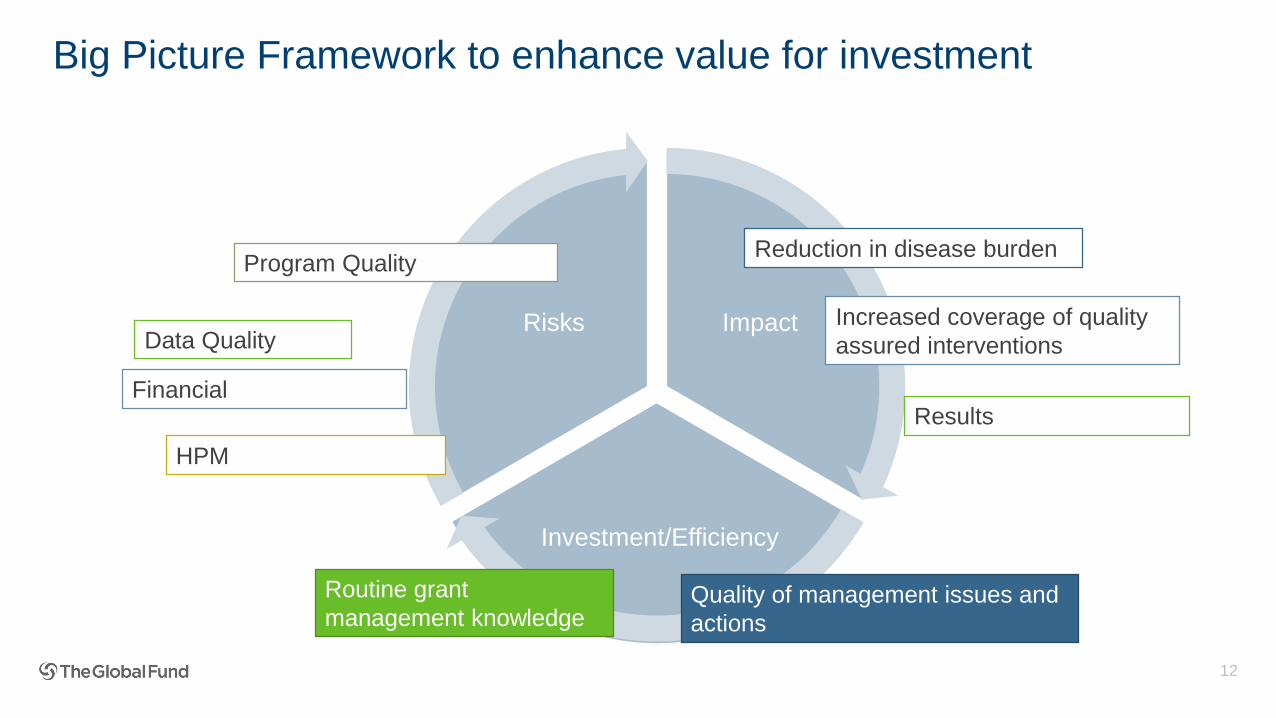
Big Picture Framework to enhance value for investment
Impact
Investment/Efficiency
Risks
12
Program Quality
Data Quality
Reduction in disease burden
Increased coverage of quality
assured interventions
Financial
Quality of management issues and
actions
Routine grant
management knowledge
HPM
Results

13
Fundamental: In-depth & integrated analysis
Integrated
Analysis
Why are targets not being met?
What are the repercussions
for the program?
What can be done about it?

Leveraging Multidisciplinary Teams
Are expectations well understood and defined from
both ends?
What are we jointly trying to address?/Are
we aligned with the strategy?
How can the quality of routine
deliverables be improved?
14

Leveraging Multidisciplinary and partner engagement
• Building the right team of experts to look at specific programmatic domains
• Have a mix of Public Health Specialists, Finance and HPM to review implementation
• Have the right Public Health Expert – each disease requires a specific expertise – if we wish to make the best of
resources being spent
• Have the best HPM expert that turns program figures into adequate product quantities to meet the demand and
cost all the components (using all the relevant parameters) so the finance knows the budget needs
• Capitalize on local expertise
• LFA panel of Public Health experts and or PSM experts is limited/restrictive
• Not enough effort being undertaken to identify local expertise or liaise with local institutions (a lot of in-country
capacity has been built over the years!)
• Engage with partners
• Very few LFA teams engage with partners to inform their reviews/spot checks
• Alignment of assurance plans with work by partners e.g. vector control reviews feeding into PMI work & vice versa
15
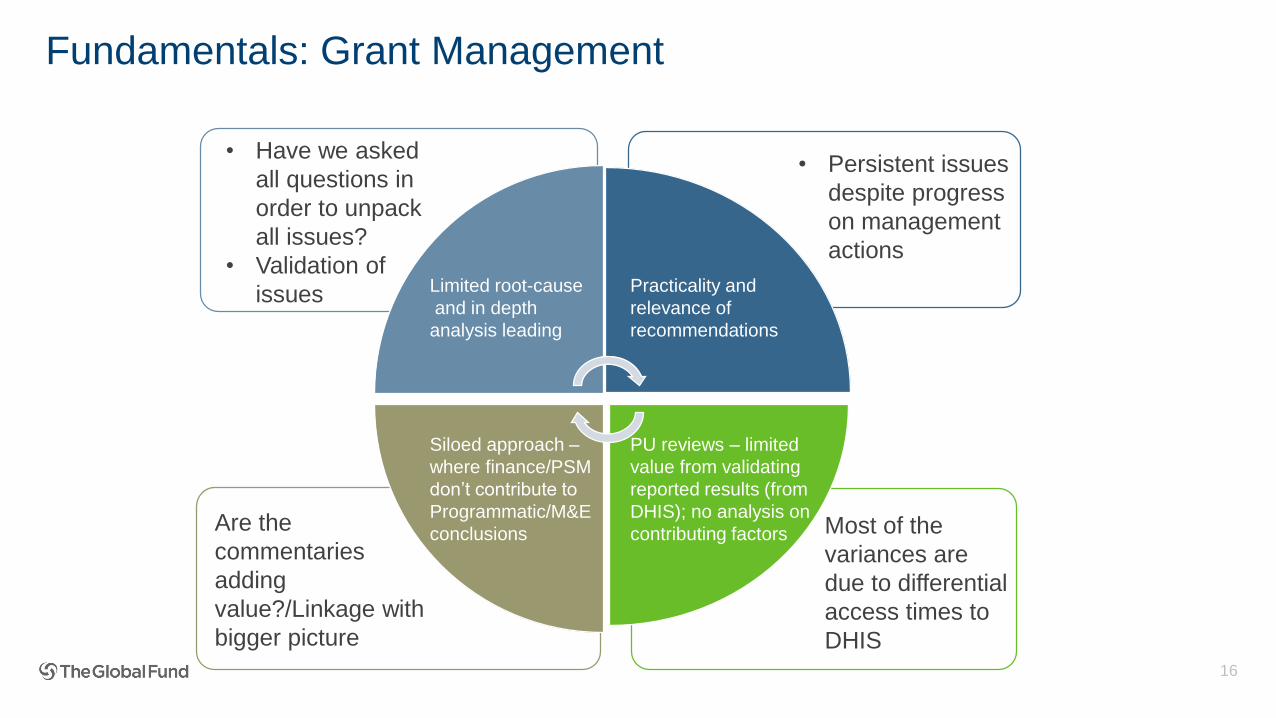
Fundamentals: Grant Management
16
PU reviews – limited
value from validating
reported results (from
DHIS); no analysis on
contributing factors
Siloed approach –
where finance/PSM
don’t contribute to
Programmatic/M&E
conclusions
Limited root-cause
and in depth
analysis leading
Practicality and
relevance of
recommendations
Are the
commentaries
adding
value?/Linkage with
bigger picture
• Have we asked
all questions in
order to unpack
all issues?
• Validation of
issues
• Persistent issues
despite progress
on management
actions
Most of the
variances are
due to differential
access times to
DHIS

Some examples of how things can be done differently
• Joint reviews by LFA specialists – lead to improved review of operational
challenges/bottlenecks• End to End review of LLIN campaign / /Comprehensive IRS reviews undertaken in enabled by assembling of right local
expertise with right skill sets (catch was issue of conflict of interest)
• Review of Xpert roll-out and utilization
• Review of HRH strategy, including training of community health workers
• Cost-efficiency reviews
• Procurement execution (projected/actuals/savings/space for re-investing or gaps)
• Joint reviews with partners
• Jointly LLIN distribution/case management review with PMI
• Joint ARV utilization/supply chain review with PEPFAR/USAID
• Engaging institutions/experts
• Exploring innovative ways of tapping into technical/universities expertise
17

18
Agenda
Sharing best
practices for
delivering high
quality LFA
services
Evolution of the
Global Fund
Global Fund
2017-22 Strategy
Fundamentals
of
Differentiation
Programmatic/
M&E
Health
Product
Management
Fundamental Information/
Assurance Requirements
Finance
Grant
Management
- Delivering
Impact
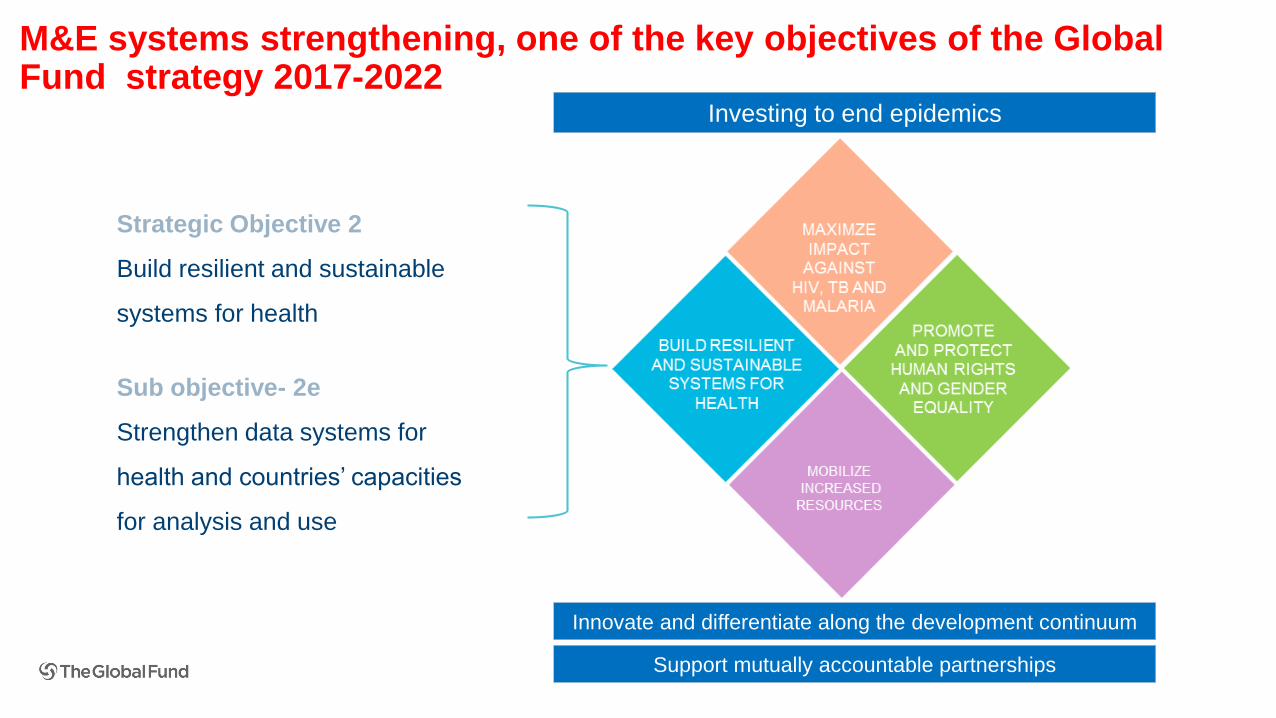
M&E systems strengthening, one of the key objectives of the Global Fund strategy 2017-2022
Strategic Objective 2
Build resilient and sustainable
systems for health
Sub objective- 2e
Strengthen data systems for
health and countries’ capacities
for analysis and use
Innovate and differentiate along the development continuum
Support mutually accountable partnerships
Investing to end epidemics

20
Data Use for Action and Improvement framework at country level
Vision: To strengthen data availability, quality and use of data in order to drive Global Fund supported
programs towards program improvement and maximized impact.
Mission: To strengthen capacity and build systems to collect, analyze and use data across all levels of
program implementation
Comprises of five interrelated components often taking place simultaneously in countries

Key outcomes of interest
Improved data availability and quality, data disaggregation and analytical capacity at different levels,
sustained for long term
Sources of funding
▪ M&E investments through grants to countries: Approximately USD 400 million over 2018-2020
▪ Strategic Initiative for M&E (2017-2019): USD 20 million
▪ Key areas of investments
▪ Routine reporting- e.g. HMIS/DHIS, system interoperability (including LMIS), data disaggregation, case-
based reporting, surveillance (including GIS mapping & mobile technology), hospital/ community reporting
▪ Program and data quality
▪ Surveys
▪ Program reviews and evaluations
▪ Administrative and financial data sources
▪ Civil Registration and Vital Statistics (CRVS) 21
Investments in Country Data Systems and Analytical Capacity
Investment
4
3
2
5
1
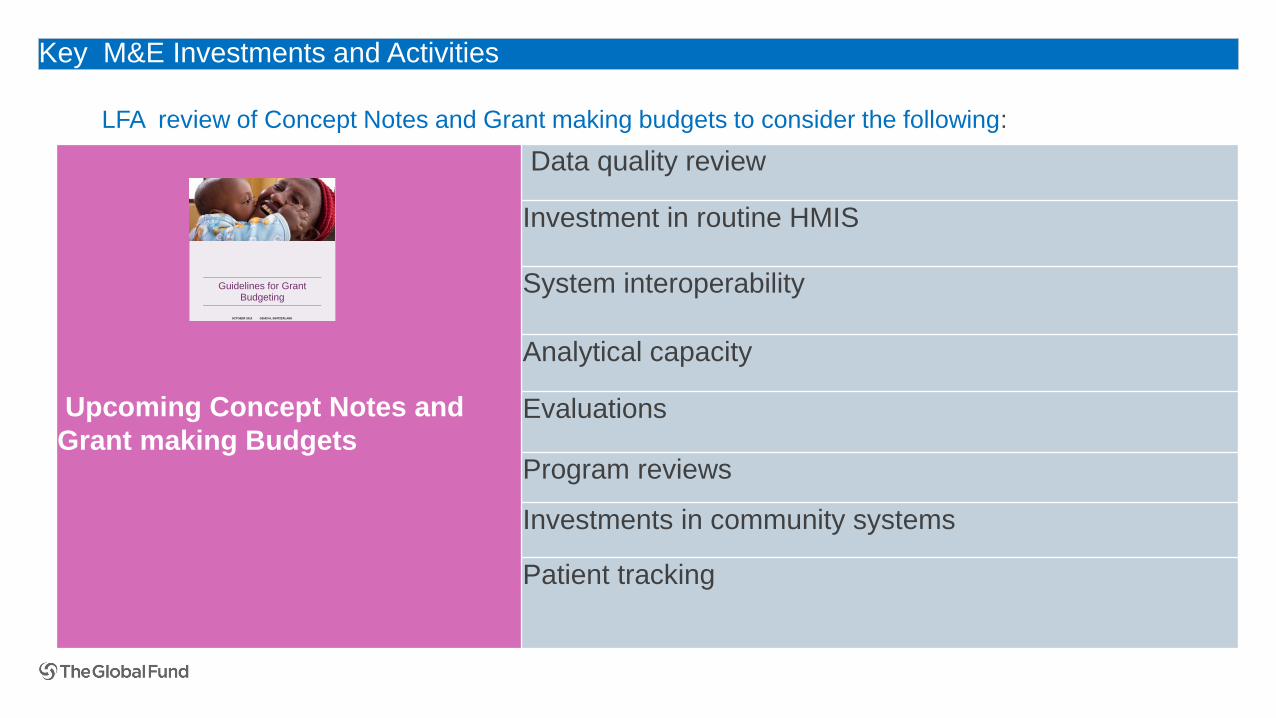
Key M&E Investments and Activities
Upcoming Concept Notes and
Grant making Budgets
Data quality review
Investment in routine HMIS
System interoperability
Analytical capacity
Evaluations
Program reviews
Investments in community systems
Patient tracking
Geneva Switzerland
OCTOBER 2019 GENEVA, SWITZERLAND
Guidelines for Grant
Budgeting
LFA review of Concept Notes and Grant making budgets to consider the following:

23
2. Program Monitoring
Key outcomes of interest
Key areas of focus
• Coverage, outcome and impact indicators, aligned with global norms and recommendations
• Disaggregated data- by age, sex, key populations
Key principles
• Align with country reporting cycles
• Harmonized indicators with partners
• Unified data collection and reporting
• Progress reporting and funding decisions based on sound, fit for purpose M&E frameworks
• Generate learning during program implementation and identify and address bottlenecks
• Assess progress, reprogram where necessary
• Scale up innovative approaches
2
1
4
3Program
Monitoring
5

24
2. Program Monitoring – program and data quality2
1
4
3Program
Monitoring
5
▪ Support planning and implementation of national program and data quality monitoring
activities in countries using available assessment tools/review mechanisms
▪ Quality assurance of in-country processes in selected cases using external
service providers or LFAs
▪ Mobilize and fund technical assistance where necessary
▪ Review the findings and recommendations, identify areas for improvement and
action plans to strengthen national HMIS and data and program quality
▪ Work with partners to support and fund data & program quality improvement activities-
– domestic financing,
– partner funding/technical support,
– new Global fund grants
– reprogramming of on-going grants

25
2. Program Monitoring – Program Quality2
1. Program quality has many dimensions and is complex to measure.
2. Use of 3-4 tracer indicators for the three diseases
▪ HIV: PLHA known their status, ART coverage, retention and viral suppression
▪ Tuberculosis: Treatment coverage, success rate (drug sensitive and MDR TB), ART or TB/HIV
▪ Malaria: ITN use, diagnostic coverage, IPTp coverage
3. Based on performance a program quality risk level is defined (very high risk, high risk, moderate risk and low risk)
4. Risk levels are used by the CTs to identify and support appropriate program improvement measures
5. In addition, one of the following methods is used to get further insight into quality of programs supported by the
Global Fund:
▪ In-country review and dialogue including national program reviews, evaluations, special studies, regular national and sub-
national data analysis, partner reviews
▪ Country Portfolio Reviews at the Global Fund secretariat assessing what is working well and not working well
▪ Health facility assessments and/or data quality reviews
▪ Periodic assessment of laboratory systems
▪ Program and/or data quality spot checks
▪ Thematic reviews and Prospective Country Evaluations (PCE) led by TERG
1
4
3Program
Monitoring
5

26
2. Systematic data analysis and synthesis3
▪ In order to monitor the progress of overall national response to diseases including the progress of
its grants in-country, Global Fund supports regular review of available data from various sources
▪ Health sector & national disease programs ideally work on an aligned 5 year planning cycle, with annual
reviews, mid-term review and final review. Some countries also have an effective process for more
regular data analysis at national and sub-national level.
▪ Global Fund engages with countries in periodic reviews (six monthly/annually/every 2-3 years) and data
driven dialogue with key stakeholders including technical partners throughout the grant life cycle to
help drive program improvements
▪ The data analysis process should support, strengthen, build on and align with existing in-country
review processes
1
4Systematic data
analysis & Synthesis
2
5
Objective: Strengthen regular in-country assessment of what is and is not working well, identify bottlenecks to be
addressed and opportunities to increase grant and program performance, quality of service delivery and efficiency
to maximize impact.

27
Critical areas to consider
2. Systematic data analysis and synthesis3
1. Epidemiological trends and program performance- intervention scale-up, access to
and uptake of services
2. Health systems and program management- in particular:
▪ Surveillance and M&E systems, including data availability, quality and use
▪ Supply chain, health products management and lab
▪ Human resources constraints
3. Quality and efficiency of service delivery
4. In-depth reviews of specific issues as needed- for example:
▪ Missing cases
▪ Adolescent & Girls and Young Women
▪ Mobile populations, etc.
5. Financing
▪ Domestic financing, Global Fund grant information, other partner investments
▪ Absorption, financial gaps, unit costs, allocative efficiency
1
4Systematic data
analysis & Synthesis
2
5
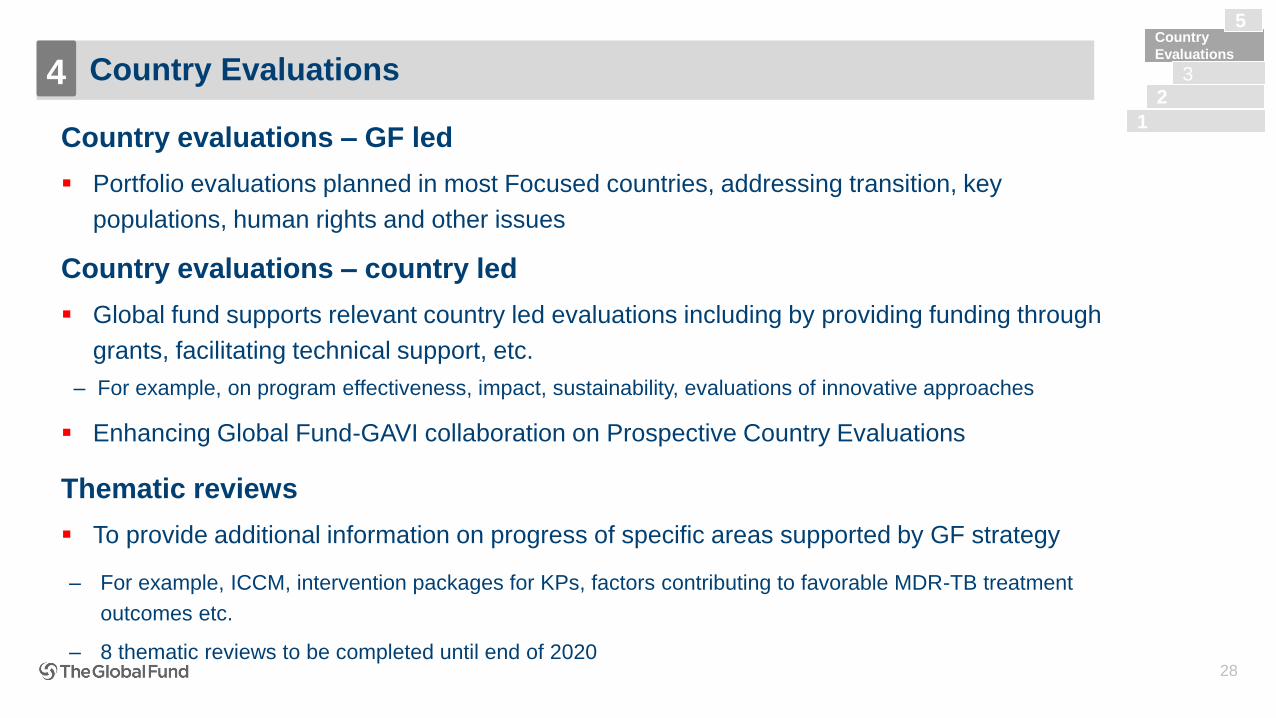
4. Country Evaluations
Country evaluations – GF led
▪ Portfolio evaluations planned in most Focused countries, addressing transition, key
populations, human rights and other issues
Country evaluations – country led
▪ Global fund supports relevant country led evaluations including by providing funding through
grants, facilitating technical support, etc.
‒ For example, on program effectiveness, impact, sustainability, evaluations of innovative approaches
▪ Enhancing Global Fund-GAVI collaboration on Prospective Country Evaluations
Thematic reviews
▪ To provide additional information on progress of specific areas supported by GF strategy
‒ For example, ICCM, intervention packages for KPs, factors contributing to favorable MDR-TB treatment
outcomes etc.
‒ 8 thematic reviews to be completed until end of 202028
4
1
Country
Evaluations
3
2
5

29
Examples of data use at country level include the following:
▪ Development or revision of national strategic plans
▪ Program design, planning and implementation
▪ Prioritization and resource allocation
▪ Targeting risk groups and geographic areas
▪ Learning and course correction/reprogramming
▪ Risk identification, management and assurance
▪ Preparing funding requests to the Global Fund and other donor
Use all available data at national and sub-national level to increase access to
services and to attain improved health outcomes
1
4
3
2
Data Use
4. Data use for improved health outcomes, efficiency and impact5
v

Current Programmatic and M&E Assurance and role of LFA
30

Programmatic and M&E assurance planning - approach
31
• Country Teams to consider the full range of data and program quality
assurance options and service providers
• Diversified pool of service providers to ensure appropriate expertise for the
quality assurance country needs
• Approach is based on “Who is best suited to provide specific quality
assurance” and can vary a lot in different countries
• Objective is to ensure a sustainable approach, aiming for cost-effectiveness
and value for money
• Consistent increase in budget for programmatic spot-checks
• HFA remains an assurance option, however is no more a ‘must do’ for HI/Core
countries

Key Programmatic and M&E risks (see details in Annex)
Risks as defined in IRT Programmatic Assurance
1. Inadequate program design and
relevance
2. Inadequate design and operational
capacity of M&E systems
3. Inadequate program quality and
efficiency
4. Limited data availability and
inadequate data quality
5. Limited use of data
1. Review of data systems (community/ facility)
2. Program quality/ data quality spot checks
3. Health facility assessment (national or targeted)
4. Data quality reviews (national or targeted)
5. Review of Laboratory systems
6. Routine programmatic analysis
7. Program reviews
8. Partner reviews
9. Country evaluations
10.Thematic reviews
11.Prospective Country Evaluations
12.Population-based surveys
13.Community-based monitoring32

LFA Service categories and programmatic assurance services will vary across portfolios and be based on CT requests
33
Strategic AdvisoryReview of Implementers’ Systems,
Controls and CapacitiesVerification of Implementation
• Grant making (Review of
performance Framework
and M&E plan)
• Ensure key and needed
M&E investments included
in budget
• Implementer capacity
assessment
• Review of medical lab
systems/services, including lab-
related supply chain
(Programmatic/M&E & PSM/SC
service)
• PU/PUDR (Verification of
programmatic performance –
sections 1A,1B,1C).
• Program and/or Data Quality
spot checks
• Targeted data quality checks
and program quality checks at
health facility
• Specific (or joint with finance)
programmatic implementation
verifications and spot checks
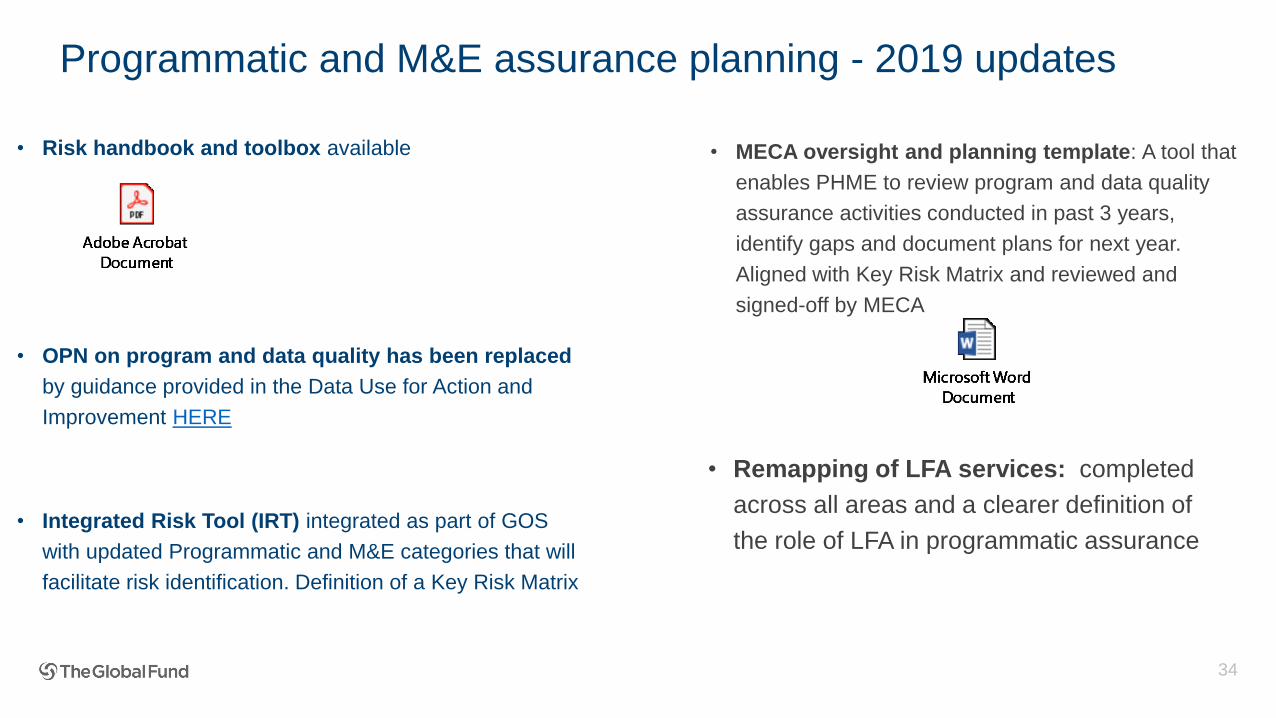
Programmatic and M&E assurance planning - 2019 updates
• Risk handbook and toolbox available
• OPN on program and data quality has been replaced
by guidance provided in the Data Use for Action and
Improvement HERE
• Integrated Risk Tool (IRT) integrated as part of GOS
with updated Programmatic and M&E categories that will
facilitate risk identification. Definition of a Key Risk Matrix
34
• MECA oversight and planning template: A tool that
enables PHME to review program and data quality
assurance activities conducted in past 3 years,
identify gaps and document plans for next year.
Aligned with Key Risk Matrix and reviewed and
signed-off by MECA
• Remapping of LFA services: completed
across all areas and a clearer definition of
the role of LFA in programmatic assurance

35
Assurance Main service provider Assurance Main service provider
Review of data systems (community/ facility)
Country led (TA as needed)
QA by identified service provider/ LFAProgram reviews
Country led (TA as needed)
QA by identified service provider
Program quality/ data
quality spot checks
Country led/ LFA/ identified service
provider Partner reviews Partner led
Health facility
assessment
(national or targeted)
Country led (TA as needed)/
Targeted HFA by LFA
QA of national HFA by identified
service provider
Country evaluations
GF-led with identified service provider
(e.g. evaluations in focused countries,
or evaluation of specific areas
Country led with TA if needed
Data quality reviews
(national or targeted)
Country led (TA as needed)/
Targeted DQR by LFA
QA of national DQR by identified
service provider
Thematic reviewsSecretariat-led with service providers
(one RFP per thematic review)
Review of Laboratory
systems
Country led (TA as needed)
QA by identified service provider/ LFA
Prospective Country
Evaluations
Secretariat (TERG-led) with service
provider
Routine programmatic
analysis
Country led (TA as needed)
QA by identified service provider
Population-based
surveys
Country led (TA as needed) or partner
contracted service provider
QA by identified service provider
Community-based
monitoringCountry-led (TA as needed)
Programmatic and M&E Assurance options and main service providers
The LFA and/or the service providers identified should
have technical skills and competencies (as defined in the
SoW)

Additional M&Eslides
36

37
Measure End-2018 Result Key takeaways
Percent of high impact &
core countries with fully
deployed and functional
HMIS
26% (13) of countries with
fully deployed and
functional HMIS
• Strengthened coordination between
GF and GAVI on central investments
and country level TA in country data
systems
• 28% (14) countries have achieved 3
of 4 sub-indicators; need to focus on
remaining countries and appropriate
investments in country data systems.
• Good achievement on HMIS
coverage, Now the focus is on
integration/ interoperability of aggregate
disease reporting into national HMIS,
and improving quality of data in the
HMIS
Target
70% (38 countries) by 2022
Interim target: 25% (12) by end
2018 and 50% (27) by end 2019Overall Progress Against Target Achievement Rate by Sub-Indicator
HMIS coverage: % of countries with > 80 % of facilities/reporting units submitting monthly/quarterly reports to the electronic HMIS
Disease data in the national HMIS: % of countries where HIV, TB and malaria aggregate data integrated or interoperable with the national HMIS
Completeness of facility reporting: % of countries where > 80 % of expected facility monthly reports were actually received
Timeliness of facility reporting: % of countries where > 80% of submitted facility monthly reports were received on time
0%
10%
20%
30%
40%
50%
60%
70%
80%
2016 2017 2018 2019 2020 2021 2022
Results Target
90%
46%
78%
48%
0%
10%
20%
30%
40%
50%
60%
70%
80%
90%
100%
HMIS Coverage Disease dataintegrated in national
HMIS
Reportingcompleteness
Reporting timeliness
Investments in Country Data Systems and Analytical Capacity1
Investment
43
2
5

A pool of “certified
consultants” created that can
be selected based on country needs
and request
2018-2020
1. Country M&E frameworks, M&E plans, tools and guidance
2. Health Information Systems, including community reporting, surveillance
3. Program and data quality monitoring
4. Evaluations, program reviews and impact assessments
5. HIV service delivery cascade and treatment outcome analysis
6. Civil Registration and Vital Statistics
7. Measurement and analysis of data on Adolescent Girls & Young Women
8. Measurement and analysis of key population programs
9. Program quality monitoring
10. Technology solutions for strengthening health information systems
38
➢ Facilitating technical assistance to strengthen M&E systems
Investments in Country Data Systems and Analytical Capacity1
Investment
43
2
5
39
Agenda
Sharing best
practices for
delivering high
quality LFA
services
Evolution of the
Global Fund
Global Fund
2017-22 Strategy
Fundamentals
of
Differentiation
Programmatic/
M&E
Health
Product
Management
Fundamental Information/
Assurance Requirements
Finance
Grant
Management
- Delivering
Impact

Key Findings and Recommendations_Overview of the new vs. old processes
How risks will be managed differently with the integration of IRM, PR Reporting and AFD modules
40
AFD
PR-Related F&Rs*
PR-Related MAs**
Grant Requirements
Overall Grant Rating
PU/DR AFD
PR-Related F&Rs
PR-Related MAs
Grant Requirements
Overall Grant Rating
IRM
PU/DR
IRM
All Risks
& MAs
PR
EV
IOU
S P
RO
CE
SS
CU
RR
EN
T
PR
OC
ES
S
* Findings & Recommendations ** Management Actions
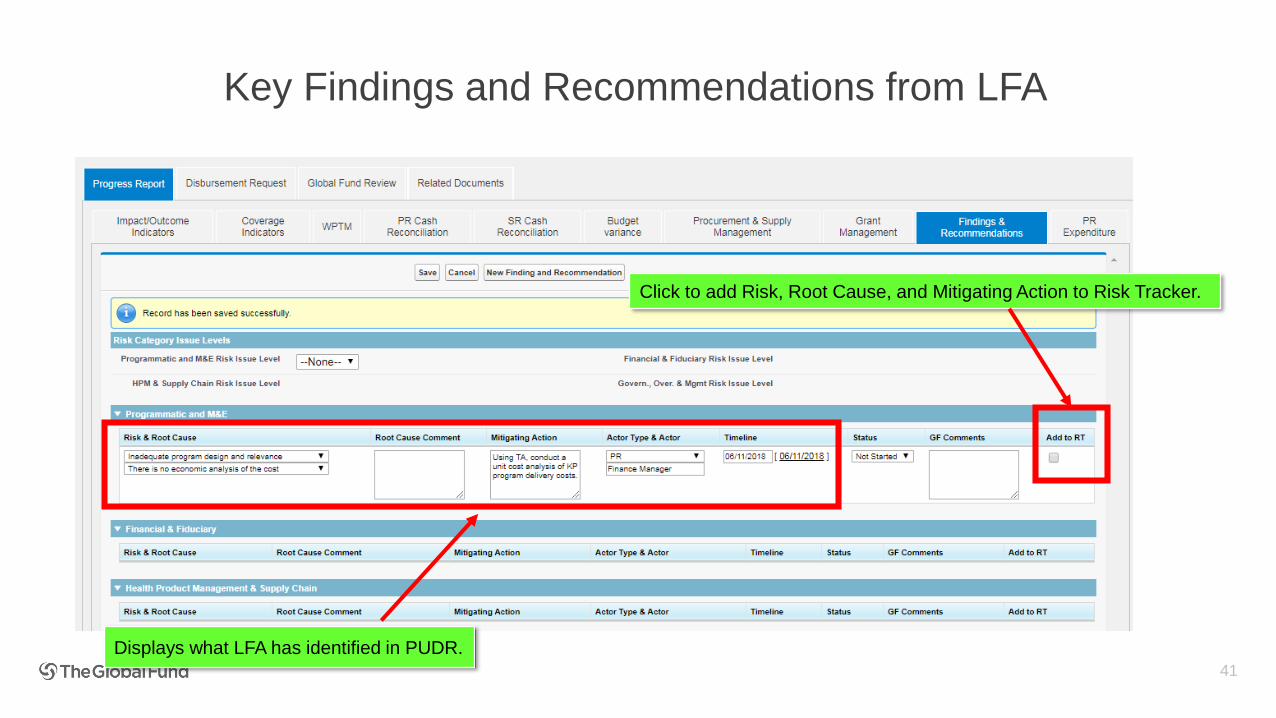
Key Findings and Recommendations from LFA
41
Click to add Risk, Root Cause, and Mitigating Action to Risk Tracker.
Displays what LFA has identified in PUDR.

Feedback to LFAs
• Consolidate small issues that fall under the same Risk and Root Cause into one list
of mitigating actions.
• Retain key issues as separate rows with unique mitigating actions
42
Feedback from LFAs
• What has your experience been using the new defined Root Causes?
• What guidance or reference materials would help you to complete this section moving forward?

Presentation of Facilitators and Module Objectives I
Evolution of Global Fund Assurance requirementsII
Overview of Global Fund Strategy to Financial Assurance III
Fundamentals of Grant Financial ManagementIV
Agenda

Presentation of Facilitators and Module Objectives I
Evolution of Global Fund Assurance requirementsII
Overview of Global Fund Strategy to Financial Assurance III
Fundamentals of Grant Financial ManagementIV
Agenda

Objective of this module
• Provide an overview of the evolving financial assurance needs from Global Fund grants
• Provide an overview of the Global Fund Strategy (& KPIs) and Financial Risk Assurance framework
• Discuss the fundamentals of grant financial management and assurance: including linkage of financial and programmatic information for decision making
• Create a forum for feedback on improving GF/LFA collaboration and delivering on the Global Fund Strategy
45

Rules during this session
46
Interactive session
Be present, participate, comment, ask, speak up,
challenge and be ready to be challenged.
Mutual respect
No work, no phones, no laptops, no emails
Quick Quiz
Small quizzes will pop up to reinforce or clarify
objectives.

Presentation of Facilitators and Module Objectives I
Evolution of Global Fund Assurance requirementsII
Overview of Global Fund Strategy to Financial Assurance III
Fundamentals of Grant Financial ManagementIV
Agenda
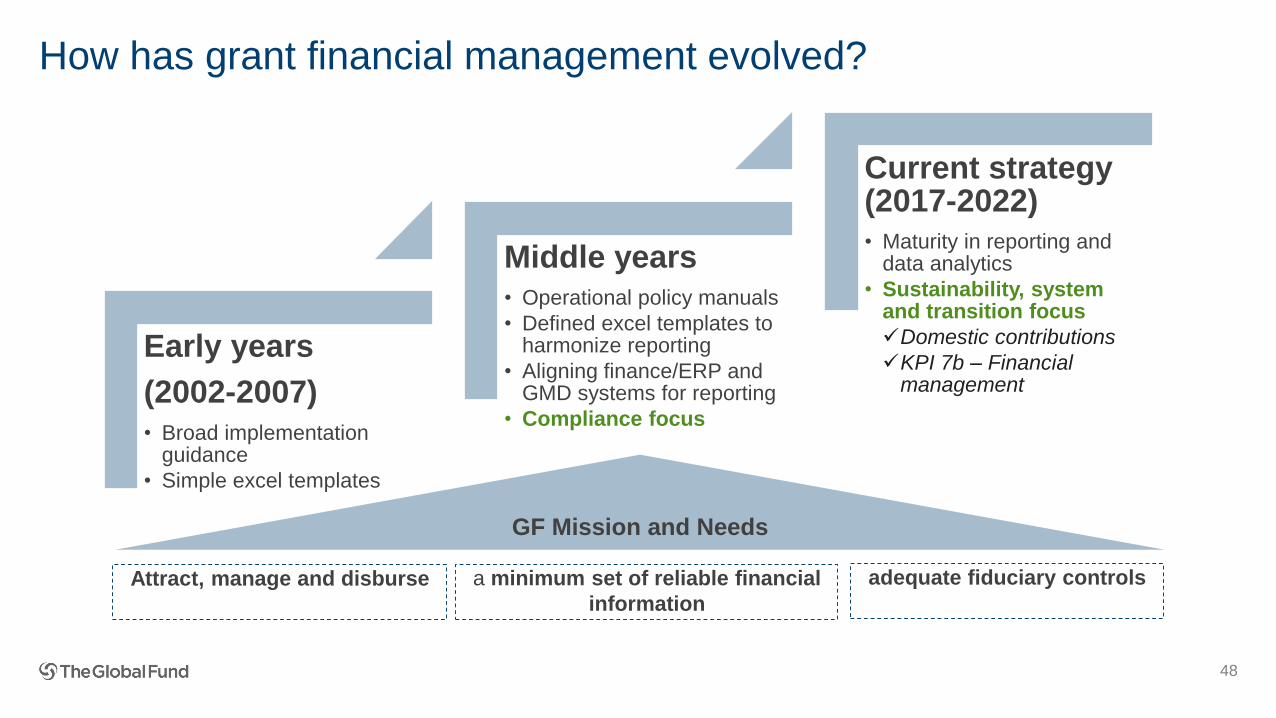
How has grant financial management evolved?
48
a minimum set of reliable financial
information
Early years
(2002-2007)• Broad implementation
guidance
• Simple excel templates
Middle years• Operational policy manuals
• Defined excel templates to harmonize reporting
• Aligning finance/ERP and GMD systems for reporting
• Compliance focus
Current strategy (2017-2022)• Maturity in reporting and
data analytics
• Sustainability, system and transition focus
✓Domestic contributions
✓KPI 7b – Financial management
adequate fiduciary controlsAttract, manage and disburse
GF Mission and Needs
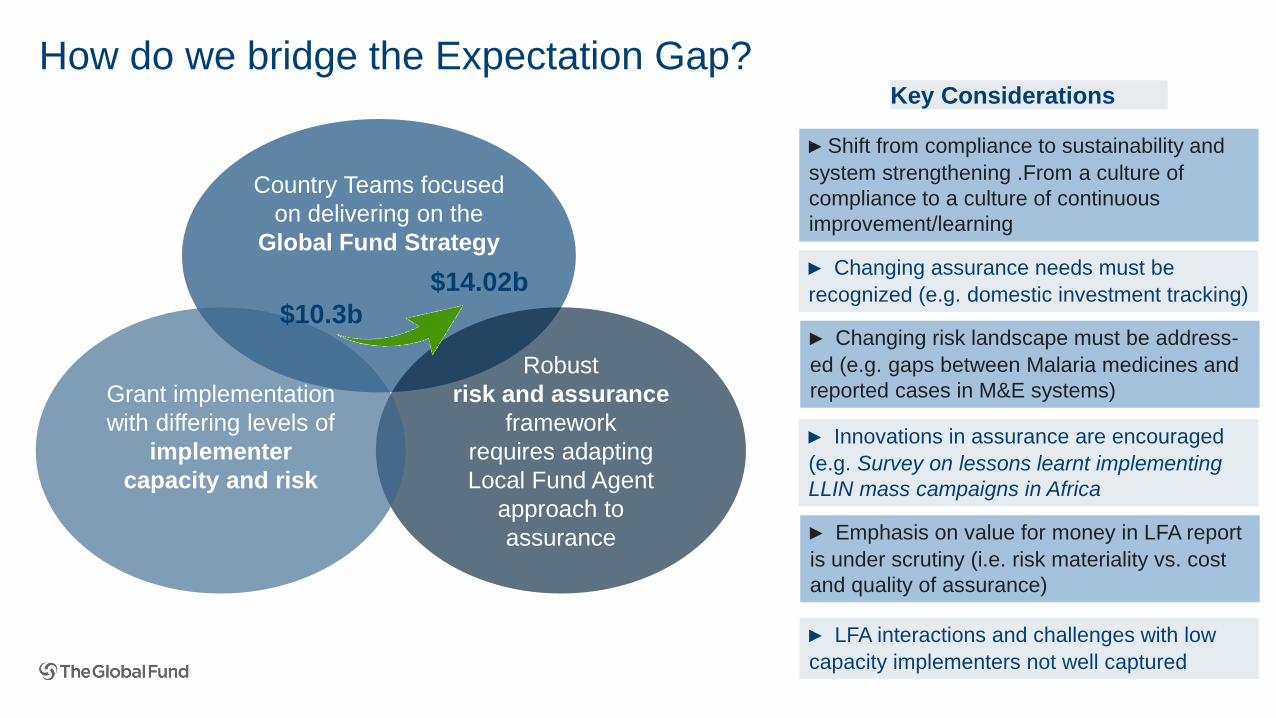
How do we bridge the Expectation Gap?
Country Teams focused
on delivering on the
Global Fund Strategy
Robust
risk and assurance
framework
requires adapting
Local Fund Agent
approach to
assurance
Grant implementation
with differing levels of
implementer
capacity and risk
► Shift from compliance to sustainability and
system strengthening .From a culture of
compliance to a culture of continuous
improvement/learning
► Emphasis on value for money in LFA report
is under scrutiny (i.e. risk materiality vs. cost
and quality of assurance)
► Innovations in assurance are encouraged
(e.g. Survey on lessons learnt implementing
LLIN mass campaigns in Africa
► Changing risk landscape must be address-
ed (e.g. gaps between Malaria medicines and
reported cases in M&E systems)
► Changing assurance needs must be
recognized (e.g. domestic investment tracking)$10.3b
$14.02b
Key Considerations
► LFA interactions and challenges with low
capacity implementers not well captured
III. Linking Strategic KPI Framework to LFA Assurance
50
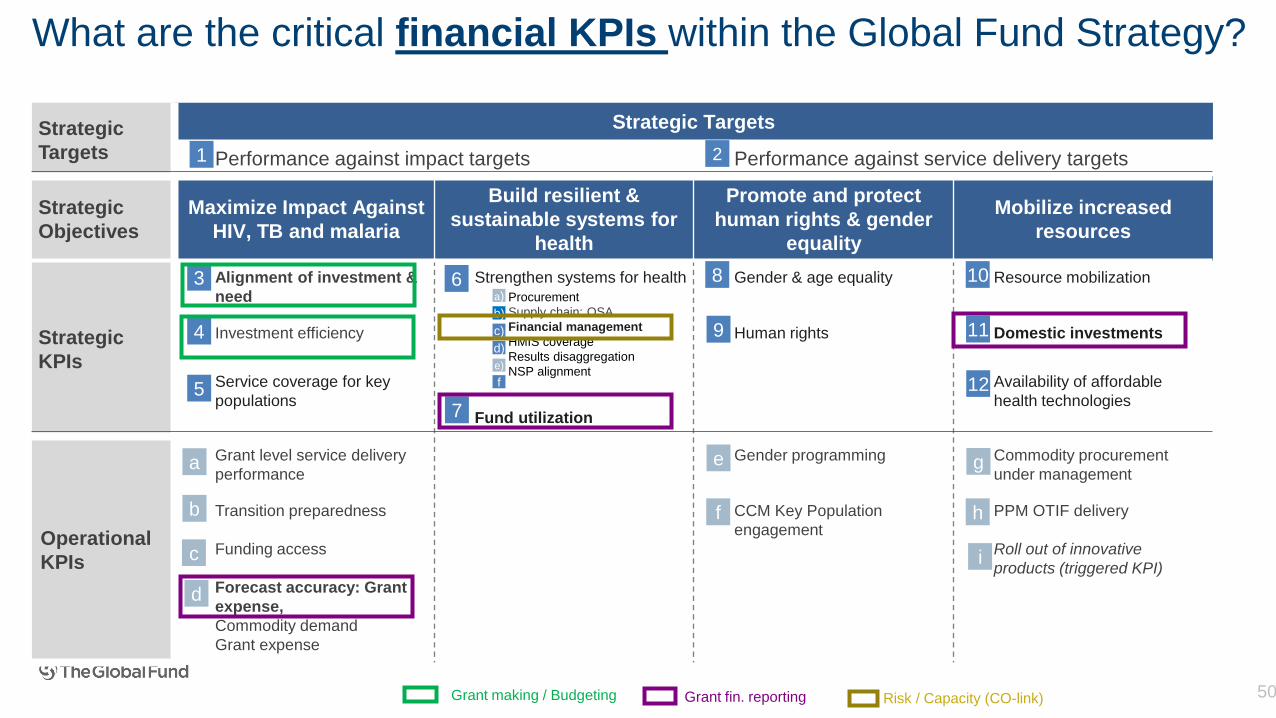
Strategic
Targets
Strategic Targets
Performance against impact targets Performance against service delivery targets
Strategic
Objectives
Maximize Impact Against
HIV, TB and malaria
Build resilient &
sustainable systems for
health
Promote and protect
human rights & gender
equality
Mobilize increased
resources
Strategic
KPIs
Alignment of investment &
need
Strengthen systems for health Gender & age equality Resource mobilization
Investment efficiency Human rights Domestic investments
Service coverage for key
populations
Availability of affordable
health technologiesFund utilization
Operational
KPIs
Grant level service delivery
performance
Gender programming Commodity procurement
under management
Transition preparedness CCM Key Population
engagement
PPM OTIF delivery
Funding access Roll out of innovative
products (triggered KPI)
Forecast accuracy: Grant
expense,
Commodity demand
Grant expense
3 6 8 10
4 9 11
5 12
7
Procurement
Supply chain: OSA
Financial management
HMIS coverage
Results disaggregation
NSP alignment
a)
b)
c)
d)
e)
f
1 2
a
b
c
e
f
g
h
i
d
What are the critical financial KPIs within the Global Fund Strategy?
Grant making / Budgeting Grant fin. reporting Risk / Capacity (CO-link)
51
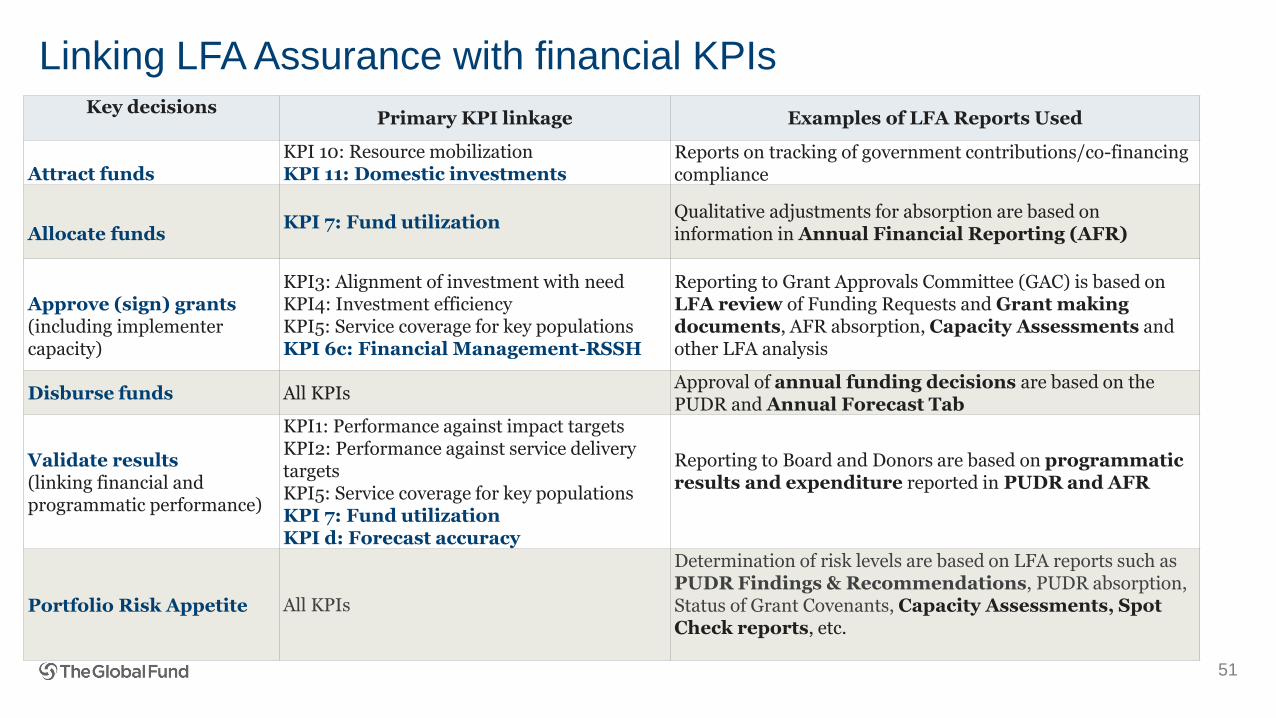
Key decisionsPrimary KPI linkage Examples of LFA Reports Used
Attract fundsKPI 10: Resource mobilizationKPI 11: Domestic investments
Reports on tracking of government contributions/co-financing compliance
Allocate fundsKPI 7: Fund utilization
Qualitative adjustments for absorption are based on information in Annual Financial Reporting (AFR)
Approve (sign) grants(including implementer capacity)
KPI3: Alignment of investment with needKPI4: Investment efficiencyKPI5: Service coverage for key populationsKPI 6c: Financial Management-RSSH
Reporting to Grant Approvals Committee (GAC) is based on LFA review of Funding Requests and Grant making documents, AFR absorption, Capacity Assessments and other LFA analysis
Disburse funds All KPIsApproval of annual funding decisions are based on the PUDR and Annual Forecast Tab
Validate results(linking financial and programmatic performance)
KPI1: Performance against impact targetsKPI2: Performance against service delivery targetsKPI5: Service coverage for key populationsKPI 7: Fund utilizationKPI d: Forecast accuracy
Reporting to Board and Donors are based on programmatic results and expenditure reported in PUDR and AFR
Portfolio Risk Appetite All KPIs
Determination of risk levels are based on LFA reports such as PUDR Findings & Recommendations, PUDR absorption, Status of Grant Covenants, Capacity Assessments, Spot Check reports, etc.
Linking LFA Assurance with financial KPIs

Presentation of Facilitators and Module Objectives I
Evolution of Global Fund Assurance requirementsII
Overview of Global Fund Strategy to Financial Assurance III
Fundamentals of Grant Financial ManagementIV
Agenda

Importance of LFA to Global Fund Risk and Assurance Framework
• The Global Fund manages risk across its portfolio of grants, focusing especially
on high impact countries. It employs a robust risk and assurance system to
identify, mitigate, monitor and manage risk across four areas (see next slide).
• Bringing assurance, risk management, and grant management experts together,
the Global Fund Secretariat develops portfolio level assurance plans to gauge
the effectiveness and efficiency of its investments in the fight against the three
diseases.
• There are a number of assurance mechanisms which the Global Fund adopts as
a means by which it gauges the effectiveness of portfolio-related controls and
mitigants. These include: implementers themselves; surveys; international and in-
country partners, including major donor agencies, their implementers and UN
technical agencies; community-based watchdog or advocacy groups; national
audit authorities; and Local Fund Agents.
• The Global Fund Model continues to be underpinned by Local Fund Agents as
our ‘eyes and ears’ in country. LFA assurance supports evidence based decision
making. As risks evolve, so must we all.

Global Fund defined Risk Categories for Finance
Risk
elements
Governance, Oversight
and Management Risks
Financial
and Fiduciary Risks2
Health Product
Management and Supply
Chain Risks
3 4Programmatic
and M&E Risks1
Risk
thematic
areas
Inadequate information
(LMIS) management
systems
1.5 2.5
3.6
Limited value for moneyLimited use of data
1.4 2.4 3.4 Inadequate warehouse
and distribution systems
Inadequate accounting
and financial reporting
Limited data availability
and inadequate data quality
1.3 2.3 3.3 4.3 Inadequate program
coordination and SR
oversight
Inefficient procurement
processes and outcomes
Financial fraud, corruption
and theft
Inadequate program
quality and efficiency
1.2 2.2 3.2 4.2 Ineffective
program management
Unreliable forecasting,
quantification and
supply planning
Inadequate internal
controls
Inadequate design and
operational capacity of
M&E systems
1.6 2.6
3.5
Inadequate auditing
arrangements
Limited quality monitoring
and inadequate product use
Inadequate Promotion
of Human Rights and
Gender Equality
Inadequate selection of
health products and
equipment
2.1 3.1 4.1 Inadequate national
program governance
Inadequate flow of
funds and arrangements1.1 Inadequate program
design and relevance
Several LFA reports contribute to identification of risks and mitigating actions including PUDR, capacity assessment,
meetings with external auditors, spot checks and follow up investigations requested by OIG

Presentation of Risk Findings and RecommendationsIceberg effect
55
Fin
ancia
l &
Fid
ucia
ry
Govern
ance,
Ove
rsig
ht
&
Manag
em
ent
PR Reporting
(poor quality & delayed)
People (Qualified and
Experienced HR in Financial
Management)
Systems(Automated / Computerized
system for budget,
accounting & financial reporting
Processes(Robust policy
and procedures)
Symptoms are
seen
Root cause is
deeper
Pro
gra
mm
atic a
nd
M&
E
Health P
roduct
Manag
em
ent
&
Supp
ly C
hain
Findings should address root causes with recommendations that address Country Systems and
align with strategic priorities for RSSH

Overall Approach
Strengthening Public Financial Management (PFM) systems - KPI6c

Eight (8) components of the Public Financial Management System (PFM
As part of RSSH, the Global Fund would like to prepare countries for sustainability and transition which will rely
on use of country systems. Below are the 8 pillars of PFM assessed by World Bank that LFA should consider in
engagement.

Presentation of Facilitators and Module Objectives I
Evolution of Global Fund Assurance requirementsII
Overview of Global Fund Strategy to Financial Assurance III
Fundamentals of Grant Financial ManagementIV
Agenda

What is not working?
59
LFA X: This is new! I
am not clear on GF
closure template … CT X: The figures
in FCR do not
reconcile from
start of grant to
close!
LFA Y + CT Y: Another
iteration on the same
deliverable? What will
PET look like?
LFA Z: I am not sure
I understand what
the CT requirements
are on this task…
how different is this
from previous
reports we have
completed?
ALL: We need to
get on the same
page to get to
the same
objective!
LFA: PR weak
capacity is impacting
timely submission and
evidencing of
numbers
ALL: We need to
document final
amount validated
for consistency of
subsequent
reporting

Global Fund
Strategy
Grant Making
(Budgeting)
Financial Reporting
Risk & Assurance
Fundamentals of Grant Financial Management
♦ Emphasize alignment of investment and need
(linking budget to programmatic targets and RSSH)
♦ Apply principles of value for money in
procurement, PMC costs, TRC costs
♦ Early identification of risks based on material cost
categories, implementation maps, funds flow, etc.
♦ Emphasis on capacity building and adoption of
PFM, for grant and domestic finance reporting
♦ Delivering impact requires accurate and timely
data to monitor in-country absorption and influence
re-investments (portfolio optimization)
.
♦ Increasingly risk based and alignment of various
assurance providers (LFA, external audit, internal
audit, fiscal agents, development partners)
♦ Assurance reports need to align with new strategy,
providing succinct information/recommendations on
fund utilization, VfM, accuracy of financial reporting,
internal control environment, fraud risk, etc.
Maximize impact against HIV, TB
Deep dive on Day 3 & 4
♦ Maximize impact against HIV, TB and malaria.
♦ Build resilient and sustainable systems for health
♦ Promote and protect human rights and gender
equality
♦ Mobilize increased
resources

Fundamentals of Grant Making/Budgeting
61
Assumptions on Salary
scales & HR policy, per
diem rates
Needs assessments for
vehicles, IT equipment
Document funds flow and
ERP system in use
Document risks
associated with cash
based schemes (mass
campaign, IRS spray
allowances, AGYW cash
transfers)
Link programmatic gap to
budget (ART patient
targets, LLINs, etc.)
Define sub-recipients,
implementation map and likely
impact on implementation
cost/absorption

Test our Grant Making skills
• Q1: Does the programmatic gap table have some relevance to the grant budget for ART targets?
• Q2: Where does LFA document risks identified during grant making?
62
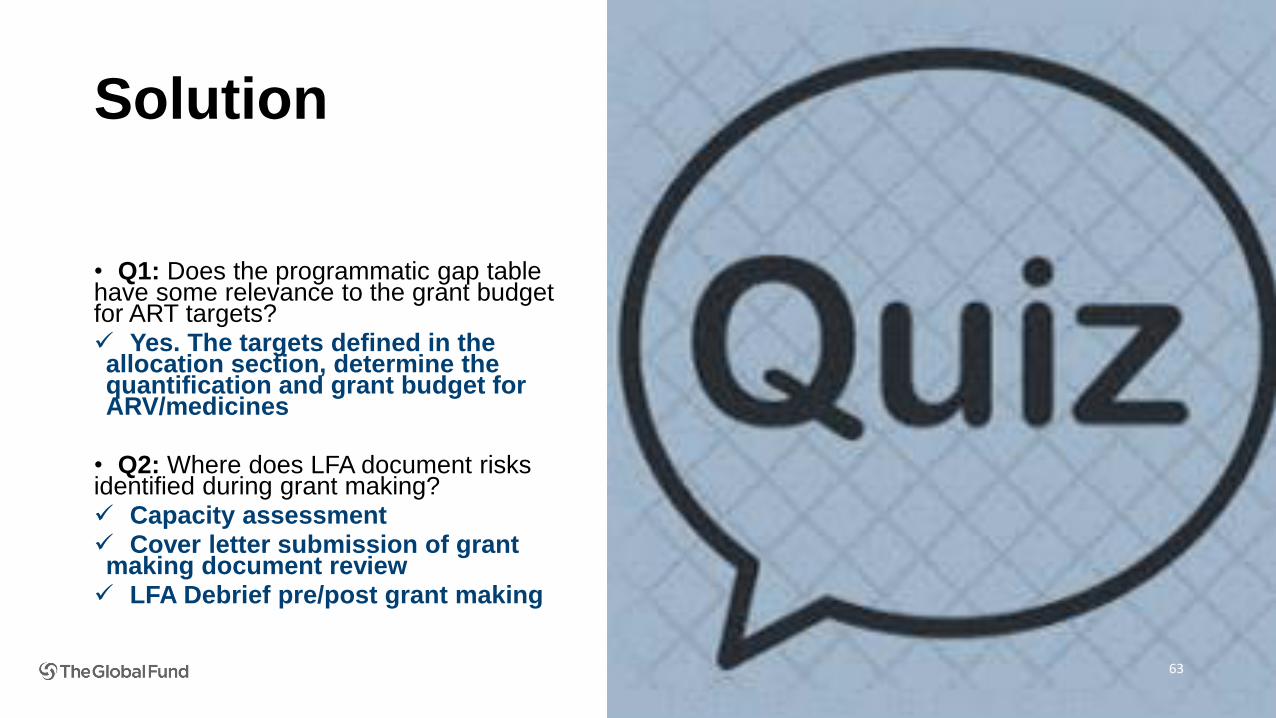
Solution
• Q1: Does the programmatic gap table have some relevance to the grant budget for ART targets? ✓ Yes. The targets defined in the allocation section, determine the quantification and grant budget for ARV/medicines
• Q2: Where does LFA document risks identified during grant making?✓ Capacity assessment✓ Cover letter submission of grant making document review✓ LFA Debrief pre/post grant making
63

Fundamentals of Grant Financial Reporting
64
There are 4 key financial reports required by implementers
for decision making and tracking of KPIs
Required for accountability on use of funds, validating expenditure, internal
controls and non-compliant expenditure (recoveries)
External Audit
Report
Required for reporting to donor on funds subject to taxation and track PR ability
to recoup VAT and other taxes paid from grant fundsTax Report
Required to validate final expenditure, allocation cut off, grant absorption level,
establishing final closing cash balance for refund or transfer to next IP as
well as final recoverable non-compliant expenditure
Financial
Closure
(FCR)
Required to report on grant performance, use of grant funds, absorption,
reporting on KPIs, cash balances and forecast to inform annual funding
decision, and non-compliant expenditure (recoveries)
Progress
Update
(PUDR)
NOTE: Quarterly cash balance and expenditure reporting has been discontinued

Key ratios (KPIs) derived from Financial Reporting
65
Ratios Basis of calculation What does it tell you? Ideal Range KPI/MTI
Allocation Utilization(Disbursement Forecast
/ Allocation)
Total amount of funds t forecasted to be
disbursed to a country against its
allocation amount. This indicator is
monitoring financial performance by the
AFC and opportunities for portfolio
optimization
At least 90% Key performance Indicator
In-Country Absorption(In-Country Expenditure
/ Budget)
Indicative of the amount expensed against
the grant budget within the reported
timeframe
At least 75% Key Performance Indicator
Budget Utilization
(Disbursement incl.
starting cash balance* /
Budget)
This provides visibility on the actual
disbursement against the latest approved
budget and implementation period.
At least 85%Management Tracking
Indicators
Disbursement
Utilization
(Expenditure /
Disbursement)
This is measured at grant level and is
indicative of funds disbursed within the
implementation period. It is the first
assessment of absorptive capacity.
At least 90%Management Tracking
Indicators
Other Considerations from financial report-► What is the potential to fill emerging gaps / UQD in context of portfolio optimization? Savings?► What does the budget variance analysis indicate for health products and PSM costs (i.e. status in implementing the list of health products)? ► How much was annual spend (expenditure) for the previous year to inform the next annual funding decision
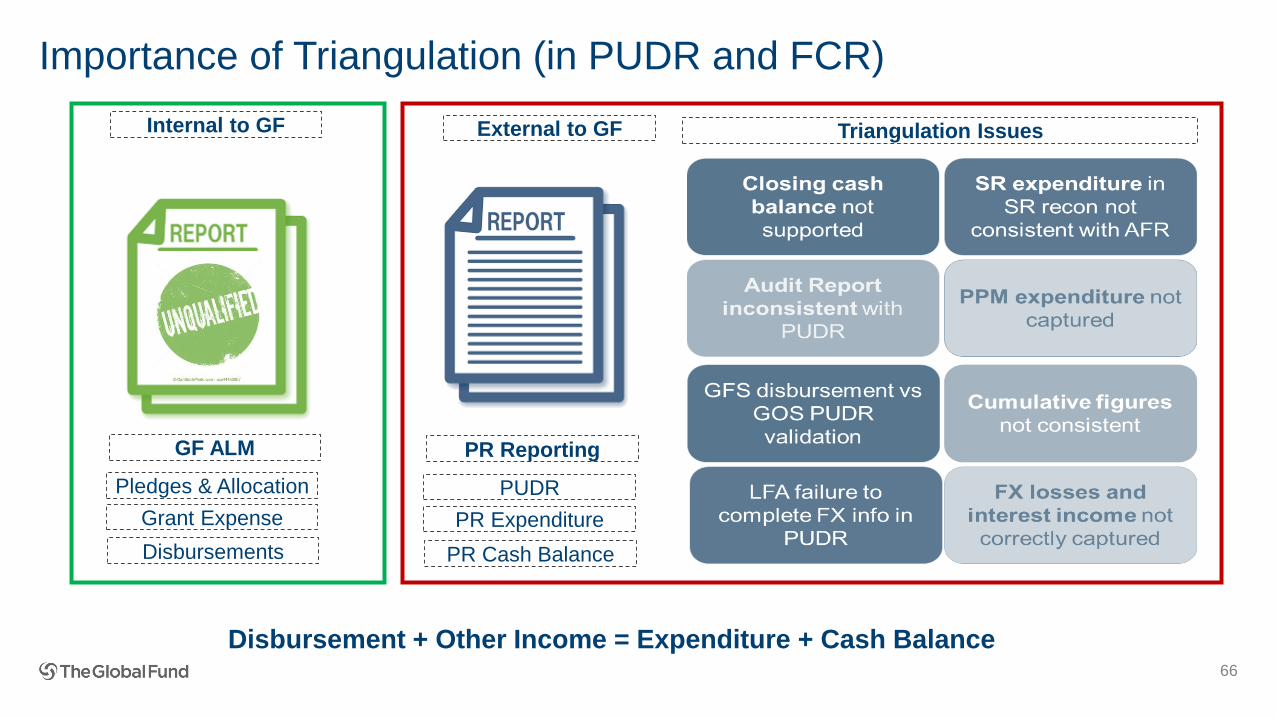
Importance of Triangulation (in PUDR and FCR)
66
Internal to GF
GF ALM
Pledges & Allocation
Grant Expense
Disbursements
External to GF
PR Reporting
PUDR
PR Expenditure
PR Cash Balance
Triangulation Issues
Disbursement + Other Income = Expenditure + Cash Balance
Test your expertise on risk & assurance• Q1: How many finance risk categories are monitored by GF?
• Q2: How many risk categories are monitored by GF across all functional areas?
• Q3: Who should test for internal control (LFA or external audit)?
67
Solution: Test your expertise on risk & assurance• Q1: How many finance risk categories are monitored by GF? 6
• Q2: How many risk categories are monitored by GF across all functional areas? 21
• Q3: Who should test for internal control (LFA or external audit)?
• External auditor.• However, LFA may observe weaknesses during capacity assessment or spot checks and should report to GF
68

69
Agenda
Sharing best
practices for
delivering high
quality LFA
services
Evolution of the
Global Fund
Global Fund
2017-22 Strategy
Fundamentals
of
Differentiation
Programmatic/
M&E
Health
Product
Management
Fundamental Information/
Assurance Requirements
Finance
Grant
Management
- Delivering
Impact

Overall objectives of this training
To add value to the CT in managing the Portfolio, we expect the LFA (PSM Specialist) to have:
• A full understanding of the end-to-end HPM system, including stakeholders and partners;
• The ability to diligently assess the Global Fund investments within the country context;
• A long-term HPM system strengthening mindset;
• The ability to work with other LFA Team Members to analyze and link PSM information with financial and programmatic data; and
• The insight to identify the root cause of a problem and propose practical solutions or risk-mitigation measures.
70

Available Resources
Tools• LoHP template/ HPMT
• PPM/wambo.org
• GDF/order tracking system
• PUDR - procurement tab
• Procurement Review Tool
• Risk & Assurance Toolbox
• PPM reference prices
• Partner tools e.g. GeneXpert
• LFA draft ToRs
• PQR
Guidance• PSM Policy
• QA Approved Lists
• Spot-check ToRs
• PUDR Guidelines (March 2017)
• Budgeting Guidelines
71

• Health Product Management Fundamentals
• Where are we at the Global Fund? at the country level?
• How do we balance between
demand/supply/governance/infrastructure/partners/politics…
• RSSH mindset
• LFA PSM Services – current opportunities and how can we improve further
72
Health Product Management

DefinitionsDefinitions
Health Products

74
Definitions
• Procurement
• Supply Chain (SC)
• Sourcing and Supply Chain (SSC)
• Procurement and Supply Management (PSM)
• Health Product Management (HPM)
Where does it start? Where does it end?
Are we all having the same understanding? here?
…and in countries?
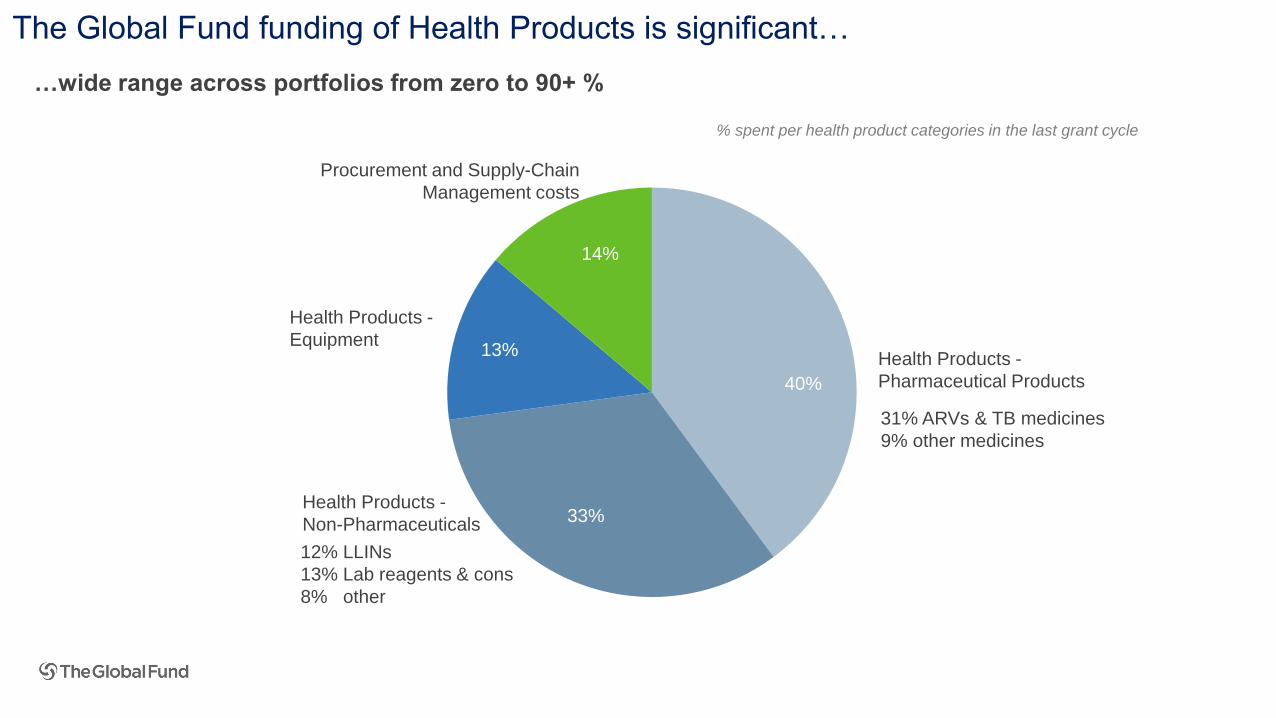
The Global Fund funding of Health Products is significant…
14%
Procurement and Supply-Chain
Management costs
Health Products -
Non-Pharmaceuticals
13%
Health Products -
Equipment
40%
33%
Health Products -
Pharmaceutical Products
31% ARVs & TB medicines
9% other medicines
12% LLINs
13% Lab reagents & cons
8% other
…wide range across portfolios from zero to 90+ %
40%
33%
14%
% spent per health product categories in the last grant cycle

Strategic KPI12b. Significant return on investment and savings delivered over the past 5 years
53 59
149
205
178
0
50
100
150
200
250
2014
mUSD
201820162015 2017
Numbers for 2018 are preliminary
Implementation KPI h. On-time-in-full
delivery – performance above target
0
20
40
60
80
100
0
1,000
2,000
3,000
4,000
5,000
20172016
84%
52%
20152014
65%76%
83%
2018
Implementation KPI g. Commodity
procurement under management
60%
PPM out of total GF
procurement
OTIF,% Number of shipments
75% target 33%Carton-less
With carton
33%Carton-less
With carton
$1.6m freight
and product
cost savings
Switching to carton-less packaging
reduces product, freight and storage
costs
Number of Core products procured in
2018
ARVs: 57m packs
ANTMs: 110m treatments
LLINs: 108m nets
Products procured for 63 PPM countries in
2018
63PPM countries
Sourcing 2018 Results

Risk Management - Global Risk Owner Procurement related riskFocus of this section
Risk
elements
Governance, Oversight
and Management Risks
Financial
and Fiduciary Risks2
Health Product
Management and Supply
Chain Risks
3 4Programmatic
and M&E Risks1
Risk
thematic
areas
Inadequate information
(LMIS) management
systems
1.5 2.5
3.6
Limited value for moneyLimited use of data
1.4 2.4 3.4 Inadequate warehouse
and distribution systems
Inadequate accounting
and financial reporting
Limited data availability
and inadequate data quality
1.3 2.3 3.3 4.3 Inadequate program
coordination and SR
oversight
Inefficient procurement
processes and outcomes
Financial fraud, corruption
and theft
Inadequate program
quality and efficiency
1.2 2.2 3.2 4.2 Ineffective
program management
Unreliable forecasting,
quantification and
supply planning
Inadequate internal
controls
Inadequate design and
operational capacity of
M&E systems
1.6 2.6
3.5
Inadequate auditing
arrangements
Limited quality monitoring
and inadequate product use
Inadequate Promotion
of Human Rights and
Gender Equality
Inadequate selection of
health products and
equipment
2.1 3.1 4.1 Inadequate national
program governance
Inadequate flow of
funds and arrangements1.1 Inadequate program
design and relevance
Risk and assurance overview

Product wastage
Product turn over
Supply Chain cost78
Strategic
Targets
Strategic Targets
Performance against impact targets Performance against service delivery targets
Strategic
Objectives
Maximize Impact Against
HIV, TB and malaria
Build resilient &
sustainable systems for
health
Promote and protect
human rights & gender
equality
Mobilize increased
resources
Strategic
KPIs
Alignment of investment &
need
Strengthen systems for health Gender & age equality Resource mobilization
Investment efficiency Human rights Domestic investments
Service coverage for key
populations
Availability of affordable
health technologiesFund utilization
Implementati
on KPIs
Grant level service delivery
performance
Gender programming Commodity procurement
under management
Transition preparedness CCM Key Population
engagement
PPM OTIF delivery
Funding access Roll out of innovative
products (triggered KPI)
Forecast accuracy:
Commodity demand
Grant expense
3 6 8 10
4 9 11
5 12
For MEC review12
Board approved34
7
Procurement
Supply chain: OSA
Financial management
HMIS coverage
Results disaggregation
NSP alignment
a)
b)
c)
d)
e)
f
Target
Status
1 2
a
b
c
e
f
g
h
i
d
Supply Chain
KPI
i)
ii)
iii)
ii For SC SteerCo reviewSupply Chain KPI for the 2017-2022 Strategic KPI Framework
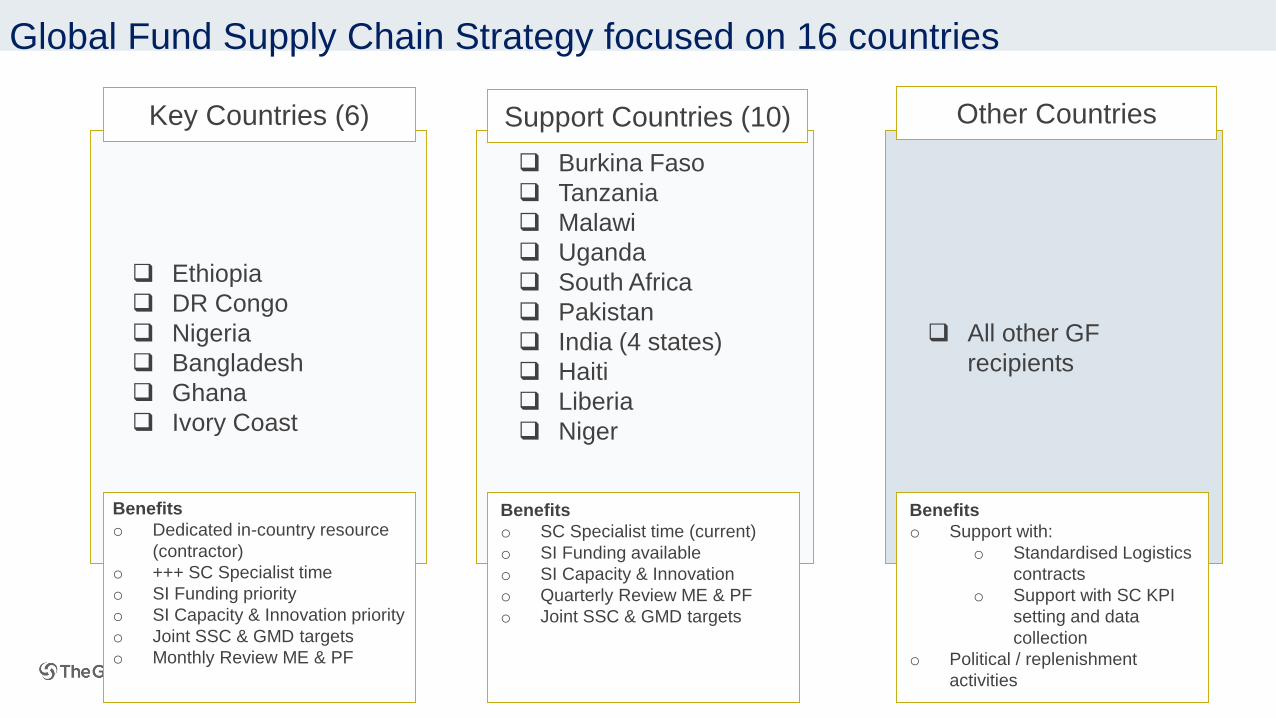
Ethiopia
DR Congo
Nigeria
Bangladesh
Ghana
Ivory Coast
Key Countries (6)
Burkina Faso
Tanzania
Malawi
Uganda
South Africa
Pakistan
India (4 states)
Haiti
Liberia
Niger
Support Countries (10)
Benefits
o Dedicated in-country resource
(contractor)
o +++ SC Specialist time
o SI Funding priority
o SI Capacity & Innovation priority
o Joint SSC & GMD targets
o Monthly Review ME & PF
Benefits
o SC Specialist time (current)
o SI Funding available
o SI Capacity & Innovation
o Quarterly Review ME & PF
o Joint SSC & GMD targets
All other GF
recipients
Other Countries
Benefits
o Support with:
o Standardised Logistics
contracts
o Support with SC KPI
setting and data
collection
o Political / replenishment
activities
Global Fund Supply Chain Strategy focused on 16 countries

80
The new structure – HPM (GMD) and Sourcing and Supply Chain (PPM, Wambo, QA, Supply Chain)

https://www.theglobalfund.org/media/5873/psm_procurementsupplymanagement_guidelines_en.pdf?u=636571539560000000 or Google search Global Fund Guide Procurement and Supply Management
HPM guiding principlesGuiding principles

• Provides clarification on the language regarding TRIPS flexibilities, the definition of a Stringent Regulatory Authority (SRA), and on the price and quality reporting (PQR) requirements
• Reflects changes related to vector control (VC) transitioning from the WHO
• Pesticide Evaluation Scheme (WHOPES) to the WHO Prequalification Mechanism
• Improved guidance on reporting mechanism for adverse drug reaction to NDRA and the Secretariat
• Requires that Principal Recipients designate a Quality Assurance focal point
• Adoption of GS1 Global Data standards for product identification, location identification, and product master data
82
The PSM Guide (Oct. 2018)

Service delivery
International, regional &
national:
Manufacturers
Wholesalers
Intermediaries
Human Resources
NRA
Registration / HTA
Pharmacovigilance
Quality control
Product recall
Health Programs
Pharmacy Services/Department
Policy, STG & EML committees /
Rational Use
Central Medical Stores
Laboratory Services
SDG & product selection
committees
Procurement Department
Regional departments of health
Budget allocation
Procurement legal environment
Central Procurement Agency
Customs & excise Intellectual property
Economic decisions
Service delivery
Advocacy
“Watch-dog”
Financing
Technical support
HPM Regulatory
bodies & other stakeholders
Agriculture; Environment
Science & technology
Economic development
Private Sector
NGOs & FBOs
Partners
Civil society
Professional associations
& trade unions
Ministry of Health
Ministry of Finance
PesticidesIn-country HPM sector complexity

Where is the entry point for the HPM and the LFA?
- Who are the key stakeholders (current/prospective)
- Is there a national vision/strategy/plan on Pharmaceutical Policy, National Supply Chain
Integration, CMS business plan, National Strategy for Lab System Strengthening…
- How integrated are HIV, TB, Malaria medicines and laboratory products in the national
system
- Who quantifies? National F&Q? Global Fund specific/ LoHP owners
- LMIS, HMIS, LIMS integration, digital health strategy
Understanding HPM/PSM in-country governance architecture

Where is the entry point for the HPM and the LFA?
- Procurement rules - who procures and what is the capacity (central/decentralized; contract
management)
- Supply chain management – the flow from the port of entry to the end user; 3PL, contracting,
storage conditions, Last Mile
- Is there local manufacturing capacity and a policy in place to favor it? What are the risks?
- Legal framework (regulation requirements, enforcement capacity)
- Budget for pharmaceuticals and other health products (laboratory often different channels)
- Incentives influencing the demand (RDF, co-payment)
Understanding HPM/PSM in-country governance architecture

Tools• LoHP template/ HPMT
• PPM/wambo.org
• GDF/order tracking system
• PUDR - procurement tab
• Procurement Review Tool
• Risk & Assurance Toolbox
• PPM reference prices
• Partner tools e.g. GeneXpert
• LFA draft ToRs
• PQR
Guidance• PSM Policy
• QA Approved Lists
• Spot-check ToRs
• PUDR Guidelines (March 2017)
• Budgeting Guidelines
86
A word on tools and guidance….
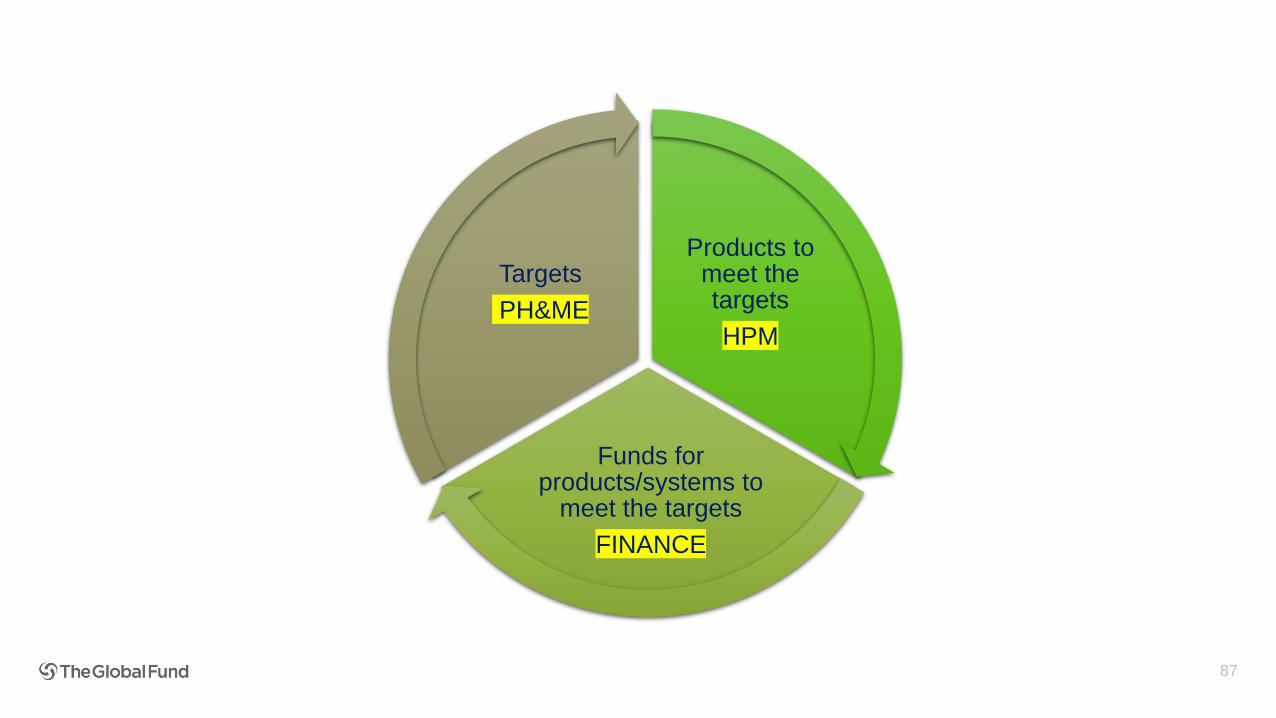
87
Products to meet the targets
HPM
Funds for products/systems to
meet the targets
FINANCE
Targets
PH&ME

• We expect the LFA to have a full understanding of the end-to-end HPM system
• We expect the LFA team to mirror CT team (PH&ME – HPM – Finance)
• Have the ability to diligently “zoom-in and zoom-out” the Global Fund investments
within the country context
Have a long-term HPM system strengthening mindset
Assuming funding for only diagnostics and treatment is available
“If Global Fund funding stops, will the HPM system resist or collapse?”
88
As we enter the new grant making year…
Case Study

90
Case study conclusions
Additional funding up to $40 million was recommended, by the CT to the GAC, for approval.
This was based on:
1. the increased “funding need” for the country to achieve 85% coverage by 2020 as a
consequence of the increased “estimated people living with HIV” arising from the 2017 census
data;
2. the outputs of the national quantification exercise which was supported by in-country partners
and which considered a downward adjustment to account for the consumption data;
3. a complete view of the ARV supply pipeline up to 31 December 2020, taking into account all
funding sources;
4. a comprehensive review of implementation and expenditure to-date, identification of savings and
reprioritization of interventions; and
5. the programmatic achievements over the past 36 months related to monthly enrollment and
retention rate as well as what the programme has put in-place to achieve the ambitious targets.
Please refer to your handouts for information on the factors the LFA should have considered in this
scenario

91
Agenda
Sharing best
practices for
delivering high
quality LFA
services
Evolution of the
Global Fund
Global Fund
2017-22 Strategy
Fundamentals
of
Differentiation
Programmatic/
M&E
Health
Product
Management
Fundamental Information/
Assurance Requirements
Finance
Grant
Management
- Delivering
Impact
92
• Discuss the following questions as a group on your tables.
• As much as possible, please discuss each question from the perspective
of being an LFA in a Focused and a Core/High Impact portfolio.
• You have 20 minutes.
Group Work

93
Group 1 (3-4 tables)
• Building on what we discussed this morning, what are the key GF expectations and quality criteria for GF
LFA deliverables? Do you believe you consistently meet them?
• What steps does the LFA team undertake to ensure the quality criteria of the GF are met, i.e. how do you
fact-check and quality assure the report before submitting it to the GF?
• What challenges do you face and how could they be addressed?
Group 2 (3-4 tables)
• What steps do you take when reviewing a PUDR?
• Who in the LFA team is involved in each step and how does the team prepare for the work?
• How do you manage priorities and conflicting schedules?
• What are the challenges the LFA team faces and how could they be addressed?
Group 3 (3-4 tables)
• How does the LFA team manage/integrate the findings and knowledge emerging from the review of the
different parts of the PUDR?
• How do you ensure that contextual and program-level knowledge is embedded in the review and reflected in
the analysis?
• How do you determine and prioritize recommendations and how do you ensure they link to the results
reported and findings from your review?
Group Work