fundamentals of electrical engineering...
TRANSCRIPT

Fundamentals of Electrical Engineering I
By:Don Johnson


Fundamentals of Electrical Engineering I
By:Don Johnson
Online:<http://cnx.org/content/col10040/1.9/ >
C O N N E X I O N S
Rice University, Houston, Texas

©2008 Don Johnson
This selection and arrangement of content is licensed under the Creative Commons Attribution License:
http://creativecommons.org/licenses/by/1.0

Table of Contents
1 Introduction
1.1 Themes . . . . . . . . . . . . . . . . . . . . . . . . . . . . . . . . . . . . . . . . . . . . . . . . . . . . . . . . . . . . . . . . . . . . . . . . . . . . . . . . . . . . . .11.2 Signals Represent Information . . . . . . . . . . . . . . . . . . . . . . . . . . . . . . . . . . . . . . . . . . . . . . . . . . . . . . . . . . . . . . . 21.3 Structure of Communication Systems . . . . . . . . . . . . . . . . . . . . . . . . . . . . . . . . . . . . . . . . . . . . . . . . . . . . . . . . 61.4 The Fundamental Signal . . . . . . . . . . . . . . . . . . . . . . . . . . . . . . . . . . . . . . . . . . . . . . . . . . . . . . . . . . . . . . . . . . . . . 71.5 Introduction Problems . . . . . . . . . . . . . . . . . . . . . . . . . . . . . . . . . . . . . . . . . . . . . . . . . . . . . . . . . . . . . . . . . . . . . . . 8Solutions . . . . . . . . . . . . . . . . . . . . . . . . . . . . . . . . . . . . . . . . . . . . . . . . . . . . . . . . . . . . . . . . . . . . . . . . . . . . . . . . . . . . . . . . 11
2 Signals and Systems
2.1 Complex Numbers . . . . . . . . . . . . . . . . . . . . . . . . . . . . . . . . . . . . . . . . . . . . . . . . . . . . . . . . . . . . . . . . . . . . . . . . . . 132.2 Elemental Signals . . . . . . . . . . . . . . . . . . . . . . . . . . . . . . . . . . . . . . . . . . . . . . . . . . . . . . . . . . . . . . . . . . . . . . . . . . .172.3 Signal Decomposition . . . . . . . . . . . . . . . . . . . . . . . . . . . . . . . . . . . . . . . . . . . . . . . . . . . . . . . . . . . . . . . . . . . . . . . 202.4 Discrete-Time Signals . . . . . . . . . . . . . . . . . . . . . . . . . . . . . . . . . . . . . . . . . . . . . . . . . . . . . . . . . . . . . . . . . . . . . . .212.5 Introduction to Systems . . . . . . . . . . . . . . . . . . . . . . . . . . . . . . . . . . . . . . . . . . . . . . . . . . . . . . . . . . . . . . . . . . . . 242.6 Simple Systems . . . . . . . . . . . . . . . . . . . . . . . . . . . . . . . . . . . . . . . . . . . . . . . . . . . . . . . . . . . . . . . . . . . . . . . . . . . . . 262.7 Signals and Systems Problems . . . . . . . . . . . . . . . . . . . . . . . . . . . . . . . . . . . . . . . . . . . . . . . . . . . . . . . . . . . . . . 29Solutions . . . . . . . . . . . . . . . . . . . . . . . . . . . . . . . . . . . . . . . . . . . . . . . . . . . . . . . . . . . . . . . . . . . . . . . . . . . . . . . . . . . . . . . . 34
3 Analog Signal Processing
3.1 Voltage, Current, and Generic Circuit Elements . . . . . . . . . . . . . . . . . . . . . . . . . . . . . . . . . . . . . . . . . . . . . 353.2 Ideal Circuit Elements . . . . . . . . . . . . . . . . . . . . . . . . . . . . . . . . . . . . . . . . . . . . . . . . . . . . . . . . . . . . . . . . . . . . . . 363.3 Ideal and Real-World Circuit Elements . . . . . . . . . . . . . . . . . . . . . . . . . . . . . . . . . . . . . . . . . . . . . . . . . . . . . 393.4 Electric Circuits and Interconnection Laws . . . . . . . . . . . . . . . . . . . . . . . . . . . . . . . . . . . . . . . . . . . . . . . . . .393.5 Power Dissipation in Resistor Circuits . . . . . . . . . . . . . . . . . . . . . . . . . . . . . . . . . . . . . . . . . . . . . . . . . . . . . . 433.6 Series and Parallel Circuits . . . . . . . . . . . . . . . . . . . . . . . . . . . . . . . . . . . . . . . . . . . . . . . . . . . . . . . . . . . . . . . . . 443.7 Equivalent Circuits: Resistors and Sources . . . . . . . . . . . . . . . . . . . . . . . . . . . . . . . . . . . . . . . . . . . . . . . . . . 493.8 Circuits with Capacitors and Inductors . . . . . . . . . . . . . . . . . . . . . . . . . . . . . . . . . . . . . . . . . . . . . . . . . . . . . 543.9 The Impedance Concept . . . . . . . . . . . . . . . . . . . . . . . . . . . . . . . . . . . . . . . . . . . . . . . . . . . . . . . . . . . . . . . . . . . . 543.10 Time and Frequency Domains . . . . . . . . . . . . . . . . . . . . . . . . . . . . . . . . . . . . . . . . . . . . . . . . . . . . . . . . . . . . . 563.11 Power in the Frequency Domain . . . . . . . . . . . . . . . . . . . . . . . . . . . . . . . . . . . . . . . . . . . . . . . . . . . . . . . . . . . 583.12 Equivalent Circuits: Impedances and Sources . . . . . . . . . . . . . . . . . . . . . . . . . . . . . . . . . . . . . . . . . . . . . . 593.13 Transfer Functions . . . . . . . . . . . . . . . . . . . . . . . . . . . . . . . . . . . . . . . . . . . . . . . . . . . . . . . . . . . . . . . . . . . . . . . . 603.14 Designing Transfer Functions . . . . . . . . . . . . . . . . . . . . . . . . . . . . . . . . . . . . . . . . . . . . . . . . . . . . . . . . . . . . . . 653.15 Formal Circuit Methods: Node Method . . . . . . . . . . . . . . . . . . . . . . . . . . . . . . . . . . . . . . . . . . . . . . . . . . . .663.16 Power Conservation in Circuits . . . . . . . . . . . . . . . . . . . . . . . . . . . . . . . . . . . . . . . . . . . . . . . . . . . . . . . . . . . . 713.17 Electronics . . . . . . . . . . . . . . . . . . . . . . . . . . . . . . . . . . . . . . . . . . . . . . . . . . . . . . . . . . . . . . . . . . . . . . . . . . . . . . . . 733.18 Dependent Sources . . . . . . . . . . . . . . . . . . . . . . . . . . . . . . . . . . . . . . . . . . . . . . . . . . . . . . . . . . . . . . . . . . . . . . . . 733.19 Operational Ampliers . . . . . . . . . . . . . . . . . . . . . . . . . . . . . . . . . . . . . . . . . . . . . . . . . . . . . . . . . . . . . . . . . . . . 763.20 The Diode . . . . . . . . . . . . . . . . . . . . . . . . . . . . . . . . . . . . . . . . . . . . . . . . . . . . . . . . . . . . . . . . . . . . . . . . . . . . . . . . 813.21 Analog Signal Processing Problems . . . . . . . . . . . . . . . . . . . . . . . . . . . . . . . . . . . . . . . . . . . . . . . . . . . . . . . . 84Solutions . . . . . . . . . . . . . . . . . . . . . . . . . . . . . . . . . . . . . . . . . . . . . . . . . . . . . . . . . . . . . . . . . . . . . . . . . . . . . . . . . . . . . . . 106
4 Frequency Domain
4.1 Introduction to the Frequency Domain . . . . . . . . . . . . . . . . . . . . . . . . . . . . . . . . . . . . . . . . . . . . . . . . . . . . .1094.2 Complex Fourier Series . . . . . . . . . . . . . . . . . . . . . . . . . . . . . . . . . . . . . . . . . . . . . . . . . . . . . . . . . . . . . . . . . . . . 1094.3 Classic Fourier Series . . . . . . . . . . . . . . . . . . . . . . . . . . . . . . . . . . . . . . . . . . . . . . . . . . . . . . . . . . . . . . . . . . . . . . 1144.4 A Signal's Spectrum . . . . . . . . . . . . . . . . . . . . . . . . . . . . . . . . . . . . . . . . . . . . . . . . . . . . . . . . . . . . . . . . . . . . . . . 1164.5 Fourier Series Approximation of Signals . . . . . . . . . . . . . . . . . . . . . . . . . . . . . . . . . . . . . . . . . . . . . . . . . . . 1174.6 Encoding Information in the Frequency Domain . . . . . . . . . . . . . . . . . . . . . . . . . . . . . . . . . . . . . . . . . . . 1224.7 Filtering Periodic Signals . . . . . . . . . . . . . . . . . . . . . . . . . . . . . . . . . . . . . . . . . . . . . . . . . . . . . . . . . . . . . . . . . . 124

iv
4.8 Derivation of the Fourier Transform . . . . . . . . . . . . . . . . . . . . . . . . . . . . . . . . . . . . . . . . . . . . . . . . . . . . . . . 1264.9 Linear Time Invariant Systems . . . . . . . . . . . . . . . . . . . . . . . . . . . . . . . . . . . . . . . . . . . . . . . . . . . . . . . . . . . . 1314.10 Modeling the Speech Signal . . . . . . . . . . . . . . . . . . . . . . . . . . . . . . . . . . . . . . . . . . . . . . . . . . . . . . . . . . . . . . 1344.11 Frequency Domain Problems . . . . . . . . . . . . . . . . . . . . . . . . . . . . . . . . . . . . . . . . . . . . . . . . . . . . . . . . . . . . . 140Solutions . . . . . . . . . . . . . . . . . . . . . . . . . . . . . . . . . . . . . . . . . . . . . . . . . . . . . . . . . . . . . . . . . . . . . . . . . . . . . . . . . . . . . . . 152
5 Digital Signal Processing
5.1 Introduction to Digital Signal Processing . . . . . . . . . . . . . . . . . . . . . . . . . . . . . . . . . . . . . . . . . . . . . . . . . . 1555.2 Introduction to Computer Organization . . . . . . . . . . . . . . . . . . . . . . . . . . . . . . . . . . . . . . . . . . . . . . . . . . . 1555.3 The Sampling Theorem . . . . . . . . . . . . . . . . . . . . . . . . . . . . . . . . . . . . . . . . . . . . . . . . . . . . . . . . . . . . . . . . . . . .1595.4 Amplitude Quantization . . . . . . . . . . . . . . . . . . . . . . . . . . . . . . . . . . . . . . . . . . . . . . . . . . . . . . . . . . . . . . . . . . . 1625.5 Discrete-Time Signals and Systems . . . . . . . . . . . . . . . . . . . . . . . . . . . . . . . . . . . . . . . . . . . . . . . . . . . . . . . . 1655.6 Discrete-Time Fourier Transform (DTFT) . . . . . . . . . . . . . . . . . . . . . . . . . . . . . . . . . . . . . . . . . . . . . . . . . 1675.7 Discrete Fourier Transforms (DFT) . . . . . . . . . . . . . . . . . . . . . . . . . . . . . . . . . . . . . . . . . . . . . . . . . . . . . . . . 1725.8 DFT: Computational Complexity . . . . . . . . . . . . . . . . . . . . . . . . . . . . . . . . . . . . . . . . . . . . . . . . . . . . . . . . . . 1745.9 Fast Fourier Transform (FFT) . . . . . . . . . . . . . . . . . . . . . . . . . . . . . . . . . . . . . . . . . . . . . . . . . . . . . . . . . . . . . 1745.10 Spectrograms . . . . . . . . . . . . . . . . . . . . . . . . . . . . . . . . . . . . . . . . . . . . . . . . . . . . . . . . . . . . . . . . . . . . . . . . . . . . 1775.11 Discrete-Time Systems . . . . . . . . . . . . . . . . . . . . . . . . . . . . . . . . . . . . . . . . . . . . . . . . . . . . . . . . . . . . . . . . . . . 1805.12 Discrete-Time Systems in the Time-Domain . . . . . . . . . . . . . . . . . . . . . . . . . . . . . . . . . . . . . . . . . . . . . . 1815.13 Discrete-Time Systems in the Frequency Domain . . . . . . . . . . . . . . . . . . . . . . . . . . . . . . . . . . . . . . . . . 1855.14 Filtering in the Frequency Domain . . . . . . . . . . . . . . . . . . . . . . . . . . . . . . . . . . . . . . . . . . . . . . . . . . . . . . . 1865.15 Eciency of Frequency-Domain Filtering . . . . . . . . . . . . . . . . . . . . . . . . . . . . . . . . . . . . . . . . . . . . . . . . . 1895.16 Discrete-Time Filtering of Analog Signals . . . . . . . . . . . . . . . . . . . . . . . . . . . . . . . . . . . . . . . . . . . . . . . . 1925.17 Digital Signal Processing Problems . . . . . . . . . . . . . . . . . . . . . . . . . . . . . . . . . . . . . . . . . . . . . . . . . . . . . . . 193Solutions . . . . . . . . . . . . . . . . . . . . . . . . . . . . . . . . . . . . . . . . . . . . . . . . . . . . . . . . . . . . . . . . . . . . . . . . . . . . . . . . . . . . . . . 204
6 Information Communication
6.1 Information Communication . . . . . . . . . . . . . . . . . . . . . . . . . . . . . . . . . . . . . . . . . . . . . . . . . . . . . . . . . . . . . . . 2096.2 Types of Communication Channels . . . . . . . . . . . . . . . . . . . . . . . . . . . . . . . . . . . . . . . . . . . . . . . . . . . . . . . . 2106.3 Wireline Channels . . . . . . . . . . . . . . . . . . . . . . . . . . . . . . . . . . . . . . . . . . . . . . . . . . . . . . . . . . . . . . . . . . . . . . . . . 2106.4 Wireless Channels . . . . . . . . . . . . . . . . . . . . . . . . . . . . . . . . . . . . . . . . . . . . . . . . . . . . . . . . . . . . . . . . . . . . . . . . . 2156.5 Line-of-Sight Transmission . . . . . . . . . . . . . . . . . . . . . . . . . . . . . . . . . . . . . . . . . . . . . . . . . . . . . . . . . . . . . . . . .2166.6 The Ionosphere and Communications . . . . . . . . . . . . . . . . . . . . . . . . . . . . . . . . . . . . . . . . . . . . . . . . . . . . . . 2176.7 Communication with Satellites . . . . . . . . . . . . . . . . . . . . . . . . . . . . . . . . . . . . . . . . . . . . . . . . . . . . . . . . . . . . 2176.8 Noise and Interference . . . . . . . . . . . . . . . . . . . . . . . . . . . . . . . . . . . . . . . . . . . . . . . . . . . . . . . . . . . . . . . . . . . . . 2186.9 Channel Models . . . . . . . . . . . . . . . . . . . . . . . . . . . . . . . . . . . . . . . . . . . . . . . . . . . . . . . . . . . . . . . . . . . . . . . . . . . 2196.10 Baseband Communication . . . . . . . . . . . . . . . . . . . . . . . . . . . . . . . . . . . . . . . . . . . . . . . . . . . . . . . . . . . . . . . . 2206.11 Modulated Communication . . . . . . . . . . . . . . . . . . . . . . . . . . . . . . . . . . . . . . . . . . . . . . . . . . . . . . . . . . . . . . .2216.12 Signal-to-Noise Ratio of an Amplitude-Modulated Signal . . . . . . . . . . . . . . . . . . . . . . . . . . . . . . . . . 2226.13 Digital Communication . . . . . . . . . . . . . . . . . . . . . . . . . . . . . . . . . . . . . . . . . . . . . . . . . . . . . . . . . . . . . . . . . . .2246.14 Binary Phase Shift Keying . . . . . . . . . . . . . . . . . . . . . . . . . . . . . . . . . . . . . . . . . . . . . . . . . . . . . . . . . . . . . . . 2246.15 Frequency Shift Keying . . . . . . . . . . . . . . . . . . . . . . . . . . . . . . . . . . . . . . . . . . . . . . . . . . . . . . . . . . . . . . . . . . 2276.16 Digital Communication Receivers . . . . . . . . . . . . . . . . . . . . . . . . . . . . . . . . . . . . . . . . . . . . . . . . . . . . . . . . 2286.17 Digital Communication in the Presence of Noise . . . . . . . . . . . . . . . . . . . . . . . . . . . . . . . . . . . . . . . . . . 2306.18 Digital Communication System Properties . . . . . . . . . . . . . . . . . . . . . . . . . . . . . . . . . . . . . . . . . . . . . . . .2316.19 Digital Channels . . . . . . . . . . . . . . . . . . . . . . . . . . . . . . . . . . . . . . . . . . . . . . . . . . . . . . . . . . . . . . . . . . . . . . . . . 2336.20 Entropy . . . . . . . . . . . . . . . . . . . . . . . . . . . . . . . . . . . . . . . . . . . . . . . . . . . . . . . . . . . . . . . . . . . . . . . . . . . . . . . . . . 2346.21 Source Coding Theorem . . . . . . . . . . . . . . . . . . . . . . . . . . . . . . . . . . . . . . . . . . . . . . . . . . . . . . . . . . . . . . . . . . 2356.22 Compression and the Human Code . . . . . . . . . . . . . . . . . . . . . . . . . . . . . . . . . . . . . . . . . . . . . . . . . . . . . .2366.23 Subtlies of Coding . . . . . . . . . . . . . . . . . . . . . . . . . . . . . . . . . . . . . . . . . . . . . . . . . . . . . . . . . . . . . . . . . . . . . . . 2376.24 Channel Coding . . . . . . . . . . . . . . . . . . . . . . . . . . . . . . . . . . . . . . . . . . . . . . . . . . . . . . . . . . . . . . . . . . . . . . . . . . 2386.25 Repetition Codes . . . . . . . . . . . . . . . . . . . . . . . . . . . . . . . . . . . . . . . . . . . . . . . . . . . . . . . . . . . . . . . . . . . . . . . . .240

v
6.26 Block Channel Coding . . . . . . . . . . . . . . . . . . . . . . . . . . . . . . . . . . . . . . . . . . . . . . . . . . . . . . . . . . . . . . . . . . . 2416.27 Error-Correcting Codes: Hamming Distance . . . . . . . . . . . . . . . . . . . . . . . . . . . . . . . . . . . . . . . . . . . . . . 2426.28 Error-Correcting Codes: Channel Decoding . . . . . . . . . . . . . . . . . . . . . . . . . . . . . . . . . . . . . . . . . . . . . . .2456.29 Error-Correcting Codes: Hamming Codes . . . . . . . . . . . . . . . . . . . . . . . . . . . . . . . . . . . . . . . . . . . . . . . . 2466.30 Noisy Channel Coding Theorem . . . . . . . . . . . . . . . . . . . . . . . . . . . . . . . . . . . . . . . . . . . . . . . . . . . . . . . . . . 2486.31 Capacity of a Channel . . . . . . . . . . . . . . . . . . . . . . . . . . . . . . . . . . . . . . . . . . . . . . . . . . . . . . . . . . . . . . . . . . . 2496.32 Comparison of Analog and Digital Communication . . . . . . . . . . . . . . . . . . . . . . . . . . . . . . . . . . . . . . . 2506.33 Communication Networks . . . . . . . . . . . . . . . . . . . . . . . . . . . . . . . . . . . . . . . . . . . . . . . . . . . . . . . . . . . . . . . . 2516.34 Message Routing . . . . . . . . . . . . . . . . . . . . . . . . . . . . . . . . . . . . . . . . . . . . . . . . . . . . . . . . . . . . . . . . . . . . . . . . . 2526.35 Network architectures and interconnection . . . . . . . . . . . . . . . . . . . . . . . . . . . . . . . . . . . . . . . . . . . . . . . .2536.36 Ethernet . . . . . . . . . . . . . . . . . . . . . . . . . . . . . . . . . . . . . . . . . . . . . . . . . . . . . . . . . . . . . . . . . . . . . . . . . . . . . . . . . 2546.37 Communication Protocols . . . . . . . . . . . . . . . . . . . . . . . . . . . . . . . . . . . . . . . . . . . . . . . . . . . . . . . . . . . . . . . . 2566.38 Information Communication Problems . . . . . . . . . . . . . . . . . . . . . . . . . . . . . . . . . . . . . . . . . . . . . . . . . . . .258Solutions . . . . . . . . . . . . . . . . . . . . . . . . . . . . . . . . . . . . . . . . . . . . . . . . . . . . . . . . . . . . . . . . . . . . . . . . . . . . . . . . . . . . . . . 272
7 Appendix
7.1 Decibels . . . . . . . . . . . . . . . . . . . . . . . . . . . . . . . . . . . . . . . . . . . . . . . . . . . . . . . . . . . . . . . . . . . . . . . . . . . . . . . . . . . 2797.2 Permutations and Combinations . . . . . . . . . . . . . . . . . . . . . . . . . . . . . . . . . . . . . . . . . . . . . . . . . . . . . . . . . . . 2807.3 Frequency Allocations . . . . . . . . . . . . . . . . . . . . . . . . . . . . . . . . . . . . . . . . . . . . . . . . . . . . . . . . . . . . . . . . . . . . . 281Solutions . . . . . . . . . . . . . . . . . . . . . . . . . . . . . . . . . . . . . . . . . . . . . . . . . . . . . . . . . . . . . . . . . . . . . . . . . . . . . . . . . . . . . . . 283
Index . . . . . . . . . . . . . . . . . . . . . . . . . . . . . . . . . . . . . . . . . . . . . . . . . . . . . . . . . . . . . . . . . . . . . . . . . . . . . . . . . . . . . . . . . . . . . . . 284Attributions . . . . . . . . . . . . . . . . . . . . . . . . . . . . . . . . . . . . . . . . . . . . . . . . . . . . . . . . . . . . . . . . . . . . . . . . . . . . . . . . . . . . . . . .290

vi

Chapter 1
Introduction
1.1 Themes1
From its beginnings in the late nineteenth century, electrical engineering has blossomed from focusing onelectrical circuits for power, telegraphy and telephony to focusing on a much broader range of disciplines.However, the underlying themes are relevant today: Power creation and transmission and information havebeen the underlying themes of electrical engineering for a century and a half. This course concentrates onthe latter theme: the representation, manipulation, transmission, and reception of information by electricalmeans. This course describes what information is, how engineers quantify information, and how electricalsignals represent information.
Information can take a variety of forms. When you speak to a friend, your thoughts are translated byyour brain into motor commands that cause various vocal tract componentsthe jaw, the tongue, the lipstomove in a coordinated fashion. Information arises in your thoughts and is represented by speech, which musthave a well dened, broadly known structure so that someone else can understand what you say. Utterancesconvey information in sound pressure waves, which propagate to your friend's ear. There, sound energy isconverted back to neural activity, and, if what you say makes sense, she understands what you say. Yourwords could have been recorded on a compact disc (CD), mailed to your friend and listened to by her onher stereo. Information can take the form of a text le you type into your word processor. You might sendthe le via e-mail to a friend, who reads it and understands it. From an information theoretic viewpoint, allof these scenarios are equivalent, although the forms of the information representationsound waves, plasticand computer lesare very dierent.
Engineers, who don't care about information content, categorize information into two dierent forms:analog and digital. Analog information is continuous valued; examples are audio and video. Digitalinformation is discrete valued; examples are text (like what you are reading now) and DNA sequences.
The conversion of information-bearing signals from one energy form into another is known as energyconversion or transduction. All conversion systems are inecient since some input energy is lost as heat, butthis loss does not necessarily mean that the conveyed information is lost. Conceptually we could use any formof energy to represent information, but electric signals are uniquely well-suited for information representation,transmission (signals can be broadcast from antennas or sent through wires), and manipulation (circuits canbe built to reduce noise and computers can be used to modify information). Thus, we will be concerned withhow to
• represent all forms of information with electrical signals,• encode information as voltages, currents, and electromagnetic waves,• manipulate information-bearing electric signals with circuits and computers, and• receive electric signals and convert the information expressed by electric signals back into a useful form.
1This content is available online at <http://cnx.org/content/m0000/2.18/>.
1

2 CHAPTER 1. INTRODUCTION
Telegraphy represents the earliest electrical information system, and it dates from 1837. At that time,electrical science was largely empirical, and only those with experience and intuition could develop telegraphsystems. Electrical science came of age when James Clerk Maxwell2 proclaimed in 1864 a set of equationsthat he claimed governed all electrical phenomena. These equations predicted that light was an electro-magnetic wave, and that energy could propagate. Because of the complexity of Maxwell's presentation, thedevelopment of the telephone in 1876 was due largely to empirical work. Once Heinrich Hertz conrmedMaxwell's prediction of what we now call radio waves in about 1882, Maxwell's equations were simpliedby Oliver Heaviside and others, and were widely read. This understanding of fundamentals led to a quicksuccession of inventionsthe wireless telegraph (1899), the vacuum tube (1905), and radio broadcastingthatmarked the true emergence of the communications age.
During the rst part of the twentieth century, circuit theory and electromagnetic theory were all anelectrical engineer needed to know to be qualied and produce rst-rate designs. Consequently, circuit theoryserved as the foundation and the framework of all of electrical engineering education. At mid-century, three"inventions" changed the ground rules. These were the rst public demonstration of the rst electroniccomputer (1946), the invention of the transistor (1947), and the publication of A Mathematical Theory ofCommunication by Claude Shannon3 (1948). Although conceived separately, these creations gave birth tothe information age, in which digital and analog communication systems interact and compete for designpreferences. About twenty years later, the laser was invented, which opened even more design possibilities.Thus, the primary focus shifted from how to build communication systems (the circuit theory era) to whatcommunications systems were intended to accomplish. Only once the intended system is specied can animplementation be selected. Today's electrical engineer must be mindful of the system's ultimate goal,and understand the tradeos between digital and analog alternatives, and between hardware and softwarecongurations in designing information systems.
Vision Impaired Access: Thanks to the translation eorts of Rice University's Disability Sup-port Services4 , this collection is now available in a Braille-printable version. Please click here5 todownload a .zip le containing all the necessary .dxb and image les.
1.2 Signals Represent Information6
Whether analog or digital, information is represented by the fundamental quantity in electrical engineering:the signal. Stated in mathematical terms, a signal is merely a function. Analog signals are continuous-valued; digital signals are discrete-valued. The independent variable of the signal could be time (speech, forexample), space (images), or the integers (denoting the sequencing of letters and numbers in the footballscore).
1.2.1 Analog Signals
Analog signals are usually signals dened over continuous independent variable(s). Speech (Section 4.10) isproduced by your vocal cords exciting acoustic resonances in your vocal tract. The result is pressure wavespropagating in the air, and the speech signal thus corresponds to a function having independent variables ofspace and time and a value corresponding to air pressure: s (x, t) (Here we use vector notation x to denotespatial coordinates). When you record someone talking, you are evaluating the speech signal at a particularspatial location, x0 say. An example of the resulting waveform s (x0, t) is shown in this gure (Figure 1.1:Speech Example).
2http://www-groups.dcs.st-andrews.ac.uk/∼history/Mathematicians/Maxwell.html3http://www.lucent.com/minds/infotheory/4http://www.dss.rice.edu/5http://cnx.org/content/m0000/latest/FundElecEngBraille.zip6This content is available online at <http://cnx.org/content/m0001/2.26/>.

3
Speech Example
-0.5
-0.4
-0.3
-0.2
-0.1
0
0.1
0.2
0.3
0.4
0.5
Am
plitu
de
Figure 1.1: A speech signal's amplitude relates to tiny air pressure variations. Shown is a recordingof the vowel "e" (as in "speech").
Photographs are static, and are continuous-valued signals dened over space. Black-and-white imageshave only one value at each point in space, which amounts to its optical reection properties. In Fig-ure 1.2 (Lena), an image is shown, demonstrating that it (and all other images as well) are functions of twoindependent spatial variables.

4 CHAPTER 1. INTRODUCTION
Lena
(a) (b)
Figure 1.2: On the left is the classic Lena image, which is used ubiquitously as a test image. Itcontains straight and curved lines, complicated texture, and a face. On the right is a perspective displayof the Lena image as a signal: a function of two spatial variables. The colors merely help show whatsignal values are about the same size. In this image, signal values range between 0 and 255; why is that?
Color images have values that express how reectivity depends on the optical spectrum. Painters long agofound that mixing together combinations of the so-called primary colorsred, yellow and bluecan producevery realistic color images. Thus, images today are usually thought of as having three values at every pointin space, but a dierent set of colors is used: How much of red, green and blue is present. Mathematically,color pictures are multivaluedvector-valuedsignals: s (x) = (r (x) , g (x) , b (x))T .
Interesting cases abound where the analog signal depends not on a continuous variable, such as time, buton a discrete variable. For example, temperature readings taken every hour have continuousanalogvalues,but the signal's independent variable is (essentially) the integers.
1.2.2 Digital Signals
The word "digital" means discrete-valued and implies the signal has an integer-valued independent variable.Digital information includes numbers and symbols (characters typed on the keyboard, for example). Com-puters rely on the digital representation of information to manipulate and transform information. Symbolsdo not have a numeric value, and each is represented by a unique number. The ASCII character code has theupper- and lowercase characters, the numbers, punctuation marks, and various other symbols representedby a seven-bit integer. For example, the ASCII code represents the letter a as the number 97 and the letterA as 65. Figure 1.3 shows the international convention on associating characters with integers.

5
ASCII Table
00 nul 01 soh 02 stx 03 etx 04 eot 05 enq 06 ack 07 bel
08 bs 09 ht 0A nl 0B vt 0C np 0D cr 0E so 0F si
10 dle 11 dc1 12 dc2 13 dc3 14 dc4 15 nak 16 syn 17 etb
18 car 19 em 1A sub 1B esc 1C fs 1D gs 1E rs 1F us
20 sp 21 ! 22 " 23 # 24 $ 25 % 26 & 27 '
28 ( 29 ) 2A * 2B + 2C , 2D - 2E . 2F /
30 0 31 1 32 2 33 3 34 4 35 5 36 6 37 7
38 8 39 9 3A : 3B ; 3C < 3D = 3E > 3F ?
40 @ 41 A 42 B 43 C 44 D 45 E 46 F 47 G
48 H 49 I 4A J 4B K 4C L 4D M 4E N 4F 0
50 P 51 Q 52 R 53 S 54 T 55 U 56 V 57 W
58 X 59 Y 5A Z 5B [ 5C \ 5D ] 5E 5F _
60 ' 61 a 62 b 63 c 64 d 65 e 66 f 67 g
68 h 69 i 6A j 6B k 6C l 6D m 6E n 6F o
70 p 71 q 72 r 73 s 74 t 75 u 76 v 77 w
78 x 79 y 7A z 7B 7C | 7D 7E ∼ 7F del
Figure 1.3: The ASCII translation table shows how standard keyboard characters are representedby integers. In pairs of columns, this table displays rst the so-called 7-bit code (how many charactersin a seven-bit code?), then the character the number represents. The numeric codes are represented inhexadecimal (base-16) notation. Mnemonic characters correspond to control characters, some of whichmay be familiar (like cr for carriage return) and some not (bel means a "bell").

6 CHAPTER 1. INTRODUCTION
1.3 Structure of Communication Systems7
Fundamental model of communication
Source Transmitter Channel Receiver Sink
message modulatedmessage
corruptedmodulatedmessage
demodulatedmessage
s(t) x(t) r(t) s(t)
Figure 1.4: The Fundamental Model of Communication.
Denition of a system
Systemx(t) y(t)
Figure 1.5: A system operates on its input signal x (t) to produce an output y (t).
The fundamental model of communications is portrayed in Figure 1.4 (Fundamental model of communi-cation). In this fundamental model, each message-bearing signal, exemplied by s (t), is analog and is afunction of time. A system operates on zero, one, or several signals to produce more signals or to simplyabsorb them (Figure 1.5 (Denition of a system)). In electrical engineering, we represent a system as a box,receiving input signals (usually coming from the left) and producing from them new output signals. Thisgraphical representation is known as a block diagram. We denote input signals by lines having arrowspointing into the box, output signals by arrows pointing away. As typied by the communications model,how information ows, how it is corrupted and manipulated, and how it is ultimately received is summarizedby interconnecting block diagrams: The outputs of one or more systems serve as the inputs to others.
In the communications model, the source produces a signal that will be absorbed by the sink. Examplesof time-domain signals produced by a source are music, speech, and characters typed on a keyboard. Signalscan also be functions of two variablesan image is a signal that depends on two spatial variablesor moretelevision pictures (video signals) are functions of two spatial variables and time. Thus, information sourcesproduce signals. In physical systems, each signal corresponds to an electrical voltage or current. To beable to design systems, we must understand electrical science and technology. However, we rst need tounderstand the big picture to appreciate the context in which the electrical engineer works.
In communication systems, messagessignals produced by sourcesmust be recast for transmission.The block diagram has the message s (t) passing through a block labeled transmitter that produces thesignal x (t). In the case of a radio transmitter, it accepts an input audio signal and produces a signal that
7This content is available online at <http://cnx.org/content/m0002/2.16/>.

7
physically is an electromagnetic wave radiated by an antenna and propagating as Maxwell's equations predict.In the case of a computer network, typed characters are encapsulated in packets, attached with a destinationaddress, and launched into the Internet. From the communication systems big picture perspective, thesame block diagram applies although the systems can be very dierent. In any case, the transmitter shouldnot operate in such a way that the message s (t) cannot be recovered from x (t). In the mathematical sense,the inverse system must exist, else the communication system cannot be considered reliable. (It is ridiculousto transmit a signal in such a way that no one can recover the original. However, clever systems exist thattransmit signals so that only the in crowd can recover them. Such crytographic systems underlie secretcommunications.)
Transmitted signals next pass through the next stage, the evil channel. Nothing good happens to asignal in a channel: It can become corrupted by noise, distorted, and attenuated among many possibilities.The channel cannot be escaped (the real world is cruel), and transmitter design and receiver design focuson how best to jointly fend o the channel's eects on signals. The channel is another system in our blockdiagram, and produces r (t), the signal received by the receiver. If the channel were benign (good lucknding such a channel in the real world), the receiver would serve as the inverse system to the transmitter,and yield the message with no distortion. However, because of the channel, the receiver must do its bestto produce a received message s (t) that resembles s (t) as much as possible. Shannon8 showed in his 1948paper that reliablefor the moment, take this word to mean error-freedigital communication was possibleover arbitrarily noisy channels. It is this result that modern communications systems exploit, and why manycommunications systems are going digital. The module on Information Communication (Section 6.1) detailsShannon's theory of information, and there we learn of Shannon's result and how to use it.
Finally, the received message is passed to the information sink that somehow makes use of the message.In the communications model, the source is a system having no input but producing an output; a sink hasan input and no output.
Understanding signal generation and how systems work amounts to understanding signals, the natureof the information they represent, how information is transformed between analog and digital forms, andhow information can be processed by systems operating on information-bearing signals. This understandingdemands two dierent elds of knowledge. One is electrical science: How are signals represented and ma-nipulated electrically? The second is signal science: What is the structure of signals, no matter what theirsource, what is their information content, and what capabilities does this structure force upon communicationsystems?
1.4 The Fundamental Signal9
1.4.1 The Sinusoid
The most ubiquitous and important signal in electrical engineering is the sinusoid.
Sine Denitions (t) = A cos (2πft + φ) or A cos (ωt + φ) (1.1)
A is known as the sinusoid's amplitude, and determines the sinusoid's size. The amplitude conveys thesinusoid's physical units (volts, lumens, etc). The frequency f has units of Hz (Hertz) or s−1, and determineshow rapidly the sinusoid oscillates per unit time. The temporal variable t always has units of seconds, andthus the frequency determines how many oscillations/second the sinusoid has. AM radio stations have carrierfrequencies of about 1 MHz (one mega-hertz or 106 Hz), while FM stations have carrier frequencies of about100 MHz. Frequency can also be expressed by the symbol ω, which has units of radians/second. Clearly,ω = 2πf . In communications, we most often express frequency in Hertz. Finally, φ is the phase, anddetermines the sine wave's behavior at the origin (t = 0). It has units of radians, but we can express it in
8http://www.lucent.com/minds/infotheory/9This content is available online at <http://cnx.org/content/m0003/2.15/>.

8 CHAPTER 1. INTRODUCTION
degrees, realizing that in computations we must convert from degrees to radians. Note that if φ = −(
π2
),
the sinusoid corresponds to a sine function, having a zero value at the origin.
A sin (2πft + φ) = A cos(2πft + φ− π
2
)(1.2)
Thus, the only dierence between a sine and cosine signal is the phase; we term either a sinusoid.We can also dene a discrete-time variant of the sinusoid: A cos (2πfn + φ). Here, the independent
variable is n and represents the integers. Frequency now has no dimensions, and takes on values between 0and 1.
Exercise 1.1 (Solution on p. 11.)
Show that cos (2πfn) = cos (2π (f + 1) n), which means that a sinusoid having a frequency largerthan one corresponds to a sinusoid having a frequency less than one.
Analog or digital?: Notice that we shall call either sinusoid an analog signal. Only when thediscrete-time signal takes on a nite set of values can it be considered a digital signal.
Exercise 1.2 (Solution on p. 11.)
Can you think of a simple signal that has a nite number of values but is dened in continuoustime? Such a signal is also an analog signal.
1.4.2 Communicating Information with Signals
The basic idea of communication engineering is to use a signal's parameters to represent either real numbers orother signals. The technical term is to modulate the carrier signal's parameters to transmit informationfrom one place to another. To explore the notion of modulation, we can send a real number (today'stemperature, for example) by changing a sinusoid's amplitude accordingly. If we wanted to send the dailytemperature, we would keep the frequency constant (so the receiver would know what to expect) and changethe amplitude at midnight. We could relate temperature to amplitude by the formula A = A0 (1 + kT ),where A0 and k are constants that the transmitter and receiver must both know.
If we had two numbers we wanted to send at the same time, we could modulate the sinusoid's frequencyas well as its amplitude. This modulation scheme assumes we can estimate the sinusoid's amplitude andfrequency; we shall learn that this is indeed possible.
Now suppose we have a sequence of parameters to send. We have exploited all of the sinusoid's twoparameters. What we can do is modulate them for a limited time (say T seconds), and send two parametersevery T . This simple notion corresponds to how a modem works. Here, typed characters are encoded intoeight bits, and the individual bits are encoded into a sinusoid's amplitude and frequency. We'll learn howthis is done in subsequent modules, and more importantly, we'll learn what the limits are on such digitalcommunication schemes.
1.5 Introduction Problems10
Problem 1.1: RMS ValuesThe rms (root-mean-square) value of a periodic signal is dened to be
s =
√1T
∫ T
0
s2 (t) dt
where T is dened to be the signal's period: the smallest positive number such that s (t) = s (t + T ).10This content is available online at <http://cnx.org/content/m10353/2.16/>.

9
a) What is the period of s (t) = A sin (2πf0t + φ)?b) What is the rms value of this signal? How is it related to the peak value?c) What is the period and rms value of the depicted (Figure 1.6) square wave, generically denoted by
sq (t)?d) By inspecting any device you plug into a wall socket, you'll see that it is labeled "110 volts AC". What
is the expression for the voltage provided by a wall socket? What is its rms value?
–A
A
t
sq(t)
2–2
• • • • • •
Figure 1.6
Problem 1.2: ModemsThe word "modem" is short for "modulator-demodulator." Modems are used not only for connecting com-puters to telephone lines, but also for connecting digital (discrete-valued) sources to generic channels. Inthis problem, we explore a simple kind of modem, in which binary information is represented by the pres-ence or absence of a sinusoid (presence representing a "1" and absence a "0"). Consequently, the modem'stransmitted signal that represents a single bit has the form
x (t) = A sin (2πf0t) ,0 ≤ t ≤ T
Within each bit interval T , the amplitude is either A or zero.
a) What is the smallest transmission interval that makes sense with the frequency f0?b) Assuming that ten cycles of the sinusoid comprise a single bit's transmission interval, what is the
datarate of this transmission scheme?c) Now suppose instead of using "on-o" signaling, we allow one of several dierent values for the ampli-
tude during any transmission interval. If N amplitude values are used, what is the resulting datarate?d) The classic communications block diagram applies to the modem. Discuss how the transmitter must
interface with the message source since the source is producing letters of the alphabet, not bits.
Problem 1.3: Advanced ModemsTo transmit symbols, such as letters of the alphabet, RU computer modems use two frequencies (1600and 1800 Hz) and several amplitude levels. A transmission is sent for a period of time T (known as thetransmission or baud interval) and equals the sum of two amplitude-weighted carriers.
x (t) = A1 sin (2πf1t) + A2 sin (2πf2t) ,0 ≤ t ≤ T
We send successive symbols by choosing an appropriate frequency and amplitude combination, and sendingthem one after another.
a) What is the smallest transmission interval that makes sense to use with the frequencies given above?In other words, what should T be so that an integer number of cycles of the carrier occurs?

10 CHAPTER 1. INTRODUCTION
b) Sketch (using Matlab) the signal that modem produces over several transmission intervals. Make sureyou axes are labeled.
c) Using your signal transmission interval, how many amplitude levels are needed to transmit ASCIIcharacters at a datarate of 3,200 bits/s? Assume use of the extended (8-bit) ASCII code.
Note: We use a discrete set of values for A1 and A2. If we have N1 values for amplitude A1, andN2 values for A2, we have N1N2 possible symbols that can be sent during each T second interval.To convert this number into bits (the fundamental unit of information engineers use to qualifythings), compute log2 (N1N2).

11
Solutions to Exercises in Chapter 1
Solution to Exercise 1.1 (p. 8)As cos (α + β) = cos (α) cos (β) − sin (α) sin (β), cos (2π (f + 1) n) = cos (2πfn) cos (2πn) −
sin (2πfn) sin (2πn) = cos (2πfn).
Solution to Exercise 1.2 (p. 8)A square wave takes on the values 1 and −1 alternately. See the plot in the module Elemental Signals(Section 2.2.6: Square Wave).

12 CHAPTER 1. INTRODUCTION

Chapter 2
Signals and Systems
2.1 Complex Numbers1
While the fundamental signal usd in electrical engineering is the sinusoid, it can be expressed mathematicallyin terms of an even more fundamental signal: the complex exponential. Representing sinusoids in termsof complex exponentials is not a mathematical oddity. Fluency with complex numbers and rational functionsof complex variables is a critical skill all engineers master. Understanding information and power systemdesigns and developing new systems all hinge on using complex numbers. In short, they are critical tomodern electrical engineering, a realization made over a century ago.
2.1.1 Denitions
The notion of the square root of −1 originated with the quadratic formula: the solution of certain quadraticequations mathematically exists only if the so-called imaginary quantity
√−1 could be dened. Euler2 rst
used i for the imaginary unit but that notation did not take hold until roughly Ampère's time. Ampère3
used the symbol i to denote current (intensité de current). It wasn't until the twentieth century that theimportance of complex numbers to circuit theory became evident. By then, using i for current was entrenchedand electrical engineers chose j for writing complex numbers.
An imaginary number has the form jb =√− (b2). A complex number, z, consists of the ordered pair
(a,b), a is the real component and b is the imaginary component (the j is suppressed because the imaginarycomponent of the pair is always in the second position). The imaginary number jb equals (0,b). Note thata and b are real-valued numbers.
Figure 2.1 (The Complex Plane) shows that we can locate a complex number in what we call the complexplane. Here, a, the real part, is the x-coordinate and b, the imaginary part, is the y-coordinate. Fromanalytic geometry, we know that locations in the plane can be expressed as the sum of vectors, with thevectors corresponding to the x and y directions. Consequently, a complex number z can be expressed as the(vector) sum z = a + jb where j indicates the y-coordinate. This representation is known as the Cartesianform of z. An imaginary number can't be numerically added to a real number; rather, this notationfor a complex number represents vector addition, but it provides a convenient notation when we performarithmetic manipulations.
Some obvious terminology. The real part of the complex number z = a + jb, written as Re (z), equalsa. We consider the real part as a function that works by selecting that component of a complex numbernot multiplied by j. The imaginary part of z, Im (z), equals b: that part of a complex number that ismultiplied by j. Again, both the real and imaginary parts of a complex number are real-valued.
1This content is available online at <http://cnx.org/content/m0081/2.27/>.2http://www-groups.dcs.st-and.ac.uk/∼history/Mathematicians/Euler.html3http://www-groups.dcs.st-and.ac.uk/∼history/Mathematicians/Ampere.html
13

14 CHAPTER 2. SIGNALS AND SYSTEMS
The Complex Plane
Figure 2.1: A complex number is an ordered pair (a,b) that can be regarded as coordinates in theplane. Complex numbers can also be expressed in polar coordinates as r∠θ.
The complex conjugate of z, written as z∗, has the same real part as z but an imaginary part of theopposite sign.
z = Re (z) + jIm (z)
z∗ = Re (z)− jIm (z)(2.1)
Using Cartesian notation, the following properties easily follow.
• If we add two complex numbers, the real part of the result equals the sum of the real parts and theimaginary part equals the sum of the imaginary parts. This property follows from the laws of vectoraddition.
a1 + jb1 + a2 + jb2 = a1 + a2 + j (b1 + b2)
In this way, the real and imaginary parts remain separate.• The product of j and a real number is an imaginary number: ja. The product of j and an imaginary
number is a real number: j (jb) = −b because j2 = −1. Consequently, multiplying a complex numberby j rotates the number's position by 90 degrees.
Exercise 2.1 (Solution on p. 34.)
Use the denition of addition to show that the real and imaginary parts can be expressed as asum/dierence of a complex number and its conjugate. Re (z) = z+z∗
2 and Im (z) = z−z∗
2j .
Complex numbers can also be expressed in an alternate form, polar form, which we will nd quite useful.Polar form arises arises from the geometric interpretation of complex numbers. The Cartesian form of acomplex number can be re-written as
a + jb =√
a2 + b2
(a√
a2 + b2+ j
b√a2 + b2
)By forming a right triangle having sides a and b, we see that the real and imaginary parts correspond to thecosine and sine of the triangle's base angle. We thus obtain the polar form for complex numbers.
z = a + jb = r∠θ
r = |z| =√
a2 + b2
a = r cos (θ)
b = r sin (θ)
θ = arctan(
ba
)

15
The quantity r is known as the magnitude of the complex number z, and is frequently written as |z|. Thequantity θ is the complex number's angle. In using the arc-tangent formula to nd the angle, we must takeinto account the quadrant in which the complex number lies.
Exercise 2.2 (Solution on p. 34.)
Convert 3− 2j to polar form.
2.1.2 Euler's Formula
Surprisingly, the polar form of a complex number z can be expressed mathematically as
z = rejθ (2.2)
To show this result, we use Euler's relations that express exponentials with imaginary arguments in termsof trigonometric functions.
ejθ = cos (θ) + j sin (θ) (2.3)
cos (θ) =ejθ + e−(jθ)
2(2.4)
sin (θ) =ejθ − e−(jθ)
2j
The rst of these is easily derived from the Taylor's series for the exponential.
ex = 1 +x
1!+
x2
2!+
x3
3!+ . . .
Substituting jθ for x, we nd that
ejθ = 1 + jθ
1!− θ2
2!− j
θ3
3!+ . . .
because j2 = −1, j3 = −j, and j4 = 1. Grouping separately the real-valued terms and the imaginary-valuedones,
ejθ = 1− θ2
2!+ · · ·+ j
(θ
1!− θ3
3!+ . . .
)The real-valued terms correspond to the Taylor's series for cos (θ), the imaginary ones to sin (θ), and Euler'srst relation results. The remaining relations are easily derived from the rst. Because of , we see thatmultiplying the exponential in (2.3) by a real constant corresponds to setting the radius of the complexnumber by the constant.
2.1.3 Calculating with Complex Numbers
Adding and subtracting complex numbers expressed in Cartesian form is quite easy: You add (subtract) thereal parts and imaginary parts separately.
(z1 ± z2) = (a1 ± a2) + j (b1 ± b2) (2.5)
To multiply two complex numbers in Cartesian form is not quite as easy, but follows directly from followingthe usual rules of arithmetic.
z1z2 = (a1 + jb1) (a2 + jb2)
= a1a2 − b1b2 + j (a1b2 + a2b1)(2.6)

16 CHAPTER 2. SIGNALS AND SYSTEMS
Note that we are, in a sense, multiplying two vectors to obtain another vector. Complex arithmetic providesa unique way of dening vector multiplication.
Exercise 2.3 (Solution on p. 34.)
What is the product of a complex number and its conjugate?
Division requires mathematical manipulation. We convert the division problem into a multiplication problemby multiplying both the numerator and denominator by the conjugate of the denominator.
z1
z2=
a1 + jb1
a2 + jb2
=a1 + jb1
a2 + jb2
a2 − jb2
a2 − jb2
=(a1 + jb1) (a2 − jb2)
a22 + b2
2
=a1a2 + b1b2 + j (a2b1 − a1b2)
a22 + b2
2
(2.7)
Because the nal result is so complicated, it's best to remember how to perform divisionmultiplyingnumerator and denominator by the complex conjugate of the denominatorthan trying to remember thenal result.
The properties of the exponential make calculating the product and ratio of two complex numbers muchsimpler when the numbers are expressed in polar form.
z1z2 = r1ejθ1r2e
jθ2
= r1r2ej(θ1+θ2)
(2.8)
z1
z2=
r1ejθ1
r2ejθ2=
r1
r2ej(θ1−θ2)
To multiply, the radius equals the product of the radii and the angle the sum of the angles. To divide,the radius equals the ratio of the radii and the angle the dierence of the angles. When the originalcomplex numbers are in Cartesian form, it's usually worth translating into polar form, then performing themultiplication or division (especially in the case of the latter). Addition and subtraction of polar formsamounts to converting to Cartesian form, performing the arithmetic operation, and converting back to polarform.
Example 2.1When we solve circuit problems, the crucial quantity, known as a transfer function, will always beexpressed as the ratio of polynomials in the variable s = j2πf . What we'll need to understand thecircuit's eect is the transfer function in polar form. For instance, suppose the transfer functionequals
s + 2s2 + s + 1
(2.9)
s = j2πf (2.10)
Performing the required division is most easily accomplished by rst expressing the numerator and

17
denominator each in polar form, then calculating the ratio. Thus,
s + 2s2 + s + 1
=j2πf + 2
−4π2f2 + j2πf + 1(2.11)
=
√4 + 4π2f2ej arctan(πf)√
(1− 4π2f2)2 + 4π2f2ej arctan
“2πf
1−4π2f2
” (2.12)
=
√4 + 4π2f2
1− 4π2f2 + 16π4f4ej
“arctan(πf)−arctan
“2πf
1−4π2f2
””(2.13)
2.2 Elemental Signals4
Elemental signals are the building blocks with which we build complicated signals. By denition, elementalsignals have a simple structure. Exactly what we mean by the "structure of a signal" will unfold in thissection of the course. Signals are nothing more than functions dened with respect to some independentvariable, which we take to be time for the most part. Very interesting signals are not functions solely oftime; one great example of which is an image. For it, the independent variables are x and y (two-dimensionalspace). Video signals are functions of three variables: two spatial dimensions and time. Fortunately, mostof the ideas underlying modern signal theory can be exemplied with one-dimensional signals.
2.2.1 Sinusoids
Perhaps the most common real-valued signal is the sinusoid.
s (t) = A cos (2πf0t + φ) (2.14)
For this signal, A is its amplitude, f0 its frequency, and φ its phase.
2.2.2 Complex Exponentials
The most important signal is complex-valued, the complex exponential.
s (t) = Aej(2πf0t+φ)
= Aejφej2πf0t(2.15)
Here, j denotes√−1. Aejφ is known as the signal's complex amplitude. Considering the complex ampli-
tude as a complex number in polar form, its magnitude is the amplitude A and its angle the signal phase.The complex amplitude is also known as a phasor. The complex exponential cannot be further decomposedinto more elemental signals, and is the most important signal in electrical engineering ! Mathematical manip-ulations at rst appear to be more dicult because complex-valued numbers are introduced. In fact, earlyin the twentieth century, mathematicians thought engineers would not be suciently sophisticated to handlecomplex exponentials even though they greatly simplied solving circuit problems. Steinmetz 5 introducedcomplex exponentials to electrical engineering, and demonstrated that "mere" engineers could use them togood eect and even obtain right answers! See Complex Numbers (Section 2.1) for a review of complexnumbers and complex arithmetic.
The complex exponential denes the notion of frequency: it is the only signal that contains only onefrequency component. The sinusoid consists of two frequency components: one at the frequency +f0 andthe other at −f0.
4This content is available online at <http://cnx.org/content/m0004/2.26/>.5http://www.invent.org/hall_of_fame/139.html

18 CHAPTER 2. SIGNALS AND SYSTEMS
Euler relation: This decomposition of the sinusoid can be traced to Euler's relation.
cos (2πft) =ej2πft + e−(j2πft)
2(2.16)
sin (2πft) =ej2πft − e−(j2πft)
2j(2.17)
ej2πft = cos (2πft) + j sin (2πft) (2.18)
Decomposition: The complex exponential signal can thus be written in terms of its real andimaginary parts using Euler's relation. Thus, sinusoidal signals can be expressed as either the realor the imaginary part of a complex exponential signal, the choice depending on whether cosine orsine phase is needed, or as the sum of two complex exponentials. These two decompositions aremathematically equivalent to each other.
A cos (2πft + φ) = Re(Aejφej2πft
)(2.19)
A sin (2πft + φ) = Im(Aejφej2πft
)(2.20)
Using the complex plane, we can envision the complex exponential's temporal variations as seen in theabove gure (Figure 2.2). The magnitude of the complex exponential is A, and the initial value of thecomplex exponential at t = 0 has an angle of φ. As time increases, the locus of points traced by the complexexponential is a circle (it has constant magnitude of A). The number of times per second we go around thecircle equals the frequency f . The time taken for the complex exponential to go around the circle once isknown as its period T , and equals 1
f . The projections onto the real and imaginary axes of the rotatingvector representing the complex exponential signal are the cosine and sine signal of Euler's relation ((2.16)).
2.2.3 Real Exponentials
As opposed to complex exponentials which oscillate, real exponentials (Figure 2.3) decay.
s (t) = e−( tτ ) (2.21)
The quantity τ is known as the exponential's time constant, and corresponds to the time requiredfor the exponential to decrease by a factor of 1
e , which approximately equals 0.368. A decaying complexexponential is the product of a real and a complex exponential.
s (t) = Aejφe−( tτ )ej2πft
= Aejφe(−( 1τ )+j2πf)t
(2.22)
In the complex plane, this signal corresponds to an exponential spiral. For such signals, we can denecomplex frequency as the quantity multiplying t.
2.2.4 Unit Step
The unit step function (Figure 2.4) is denoted by u (t), and is dened to be
u (t) =
0 if t < 0
1 if t > 0(2.23)

19
t = 0, T,
tRe
Im
A cos(2πft+φ)
A sin(2πft+φ)
φ
t = T/2, 3T/2,
T/2
t = T/4, 5T/4,
3T/2
T
T/2 3T/2T
Aejφ ej2πftA
A
t
Figure 2.2: Graphically, the complex exponential scribes a circle in the complex plane as time evolves.Its real and imaginary parts are sinusoids. The rate at which the signal goes around the circle is thefrequency f and the time taken to go around is the period T . A fundamental relationship is T = 1
f.
Exponential
tτ
e–11
Figure 2.3: The real exponential.

20 CHAPTER 2. SIGNALS AND SYSTEMS
t
Step1
Figure 2.4: The unit step.
origin warning: This signal is discontinuous at the origin. Its value at the origin need not bedened, and doesn't matter in signal theory.
This kind of signal is used to describe signals that "turn on" suddenly. For example, to mathematically repre-sent turning on an oscillator, we can write it as the product of a sinusoid and a step: s (t) = A sin (2πft) u (t).
2.2.5 Pulse
The unit pulse (Figure 2.5) describes turning a unit-amplitude signal on for a duration of ∆ seconds, thenturning it o.
p∆ (t) =
0 if t < 0
1 if 0 < t < ∆
0 if t > ∆
(2.24)
1
Tt
Pulse
Figure 2.5: The pulse.
We will nd that this is the second most important signal in communications.
2.2.6 Square Wave
The square wave (Figure 2.6) sq (t) is a periodic signal like the sinusoid. It too has an amplitude and aperiod, which must be specied to characterize the signal. We nd subsequently that the sine wave is asimpler signal than the square wave.
2.3 Signal Decomposition6
A signal's complexity is not related to how wiggly it is. Rather, a signal expert looks for ways of decomposinga given signal into a sum of simpler signals, which we term the signal decomposition. Though we will
6This content is available online at <http://cnx.org/content/m0008/2.12/>.

21
t
Square Wave
A
T
Figure 2.6: The square wave.
never compute a signal's complexity, it essentially equals the number of terms in its decomposition. Inwriting a signal as a sum of component signals, we can change the component signal's gain by multiplyingit by a constant and by delaying it. More complicated decompositions could contain derivatives or integralsof simple signals.
Example 2.2As an example of signal complexity, we can express the pulse p∆ (t) as a sum of delayed unit steps.
p∆ (t) = u (t)− u (t−∆) (2.25)
Thus, the pulse is a more complex signal than the step. Be that as it may, the pulse is very usefulto us.
Exercise 2.4 (Solution on p. 34.)
Express a square wave having period T and amplitude A as a superposition of delayed andamplitude-scaled pulses.
Because the sinusoid is a superposition of two complex exponentials, the sinusoid is more complex. We couldnot prevent ourselves from the pun in this statement. Clearly, the word "complex" is used in two dierentways here. The complex exponential can also be written (using Euler's relation (2.16)) as a sum of a sine anda cosine. We will discover that virtually every signal can be decomposed into a sum of complex exponentials,and that this decomposition is very useful. Thus, the complex exponential is more fundamental, and Euler'srelation does not adequately reveal its complexity.
2.4 Discrete-Time Signals7
So far, we have treated what are known as analog signals and systems. Mathematically, analog signals arefunctions having continuous quantities as their independent variables, such as space and time. Discrete-timesignals (Section 5.5) are functions dened on the integers; they are sequences. One of the fundamental resultsof signal theory (Section 5.3) will detail conditions under which an analog signal can be converted into adiscrete-time one and retrieved without error. This result is important because discrete-time signals can bemanipulated by systems instantiated as computer programs. Subsequent modules describe how virtually allanalog signal processing can be performed with software.
As important as such results are, discrete-time signals are more general, encompassing signals derivedfrom analog ones and signals that aren't. For example, the characters forming a text le form a sequence,which is also a discrete-time signal. We must deal with such symbolic valued (p. 167) signals and systemsas well.
7This content is available online at <http://cnx.org/content/m0009/2.23/>.

22 CHAPTER 2. SIGNALS AND SYSTEMS
As with analog signals, we seek ways of decomposing real-valued discrete-time signals into simpler com-ponents. With this approach leading to a better understanding of signal structure, we can exploit thatstructure to represent information (create ways of representing information with signals) and to extract in-formation (retrieve the information thus represented). For symbolic-valued signals, the approach is dierent:We develop a common representation of all symbolic-valued signals so that we can embody the informationthey contain in a unied way. From an information representation perspective, the most important issuebecomes, for both real-valued and symbolic-valued signals, eciency; What is the most parsimonious andcompact way to represent information so that it can be extracted later.
2.4.1 Real- and Complex-valued Signals
A discrete-time signal is represented symbolically as s (n), where n = . . . ,−1, 0, 1, . . . . We usually drawdiscrete-time signals as stem plots to emphasize the fact they are functions dened only on the integers.We can delay a discrete-time signal by an integer just as with analog ones. A delayed unit sample has theexpression δ (n−m), and equals one when n = m.
Discrete-Time Cosine Signal
n
sn
1…
…
Figure 2.7: The discrete-time cosine signal is plotted as a stem plot. Can you nd the formula for thissignal?
2.4.2 Complex Exponentials
The most important signal is, of course, the complex exponential sequence.
s (n) = ej2πfn (2.26)
2.4.3 Sinusoids
Discrete-time sinusoids have the obvious form s (n) = A cos (2πfn + φ). As opposed to analog complexexponentials and sinusoids that can have their frequencies be any real value, frequencies of their discrete-time counterparts yield unique waveforms only when f lies in the interval
(−(
12
), 1
2
]. This property can be
easily understood by noting that adding an integer to the frequency of the discrete-time complex exponentialhas no eect on the signal's value.
ej2π(f+m)n = ej2πfnej2πmn
= ej2πfn(2.27)
This derivation follows because the complex exponential evaluated at an integer multiple of 2π equals one.

23
2.4.4 Unit Sample
The second-most important discrete-time signal is the unit sample, which is dened to be
δ (n) =
1 if n = 0
0 otherwise(2.28)
Unit Sample
1
n
δn
Figure 2.8: The unit sample.
Examination of a discrete-time signal's plot, like that of the cosine signal shown in Figure 2.7 (Discrete-Time Cosine Signal), reveals that all signals consist of a sequence of delayed and scaled unit samples. Becausethe value of a sequence at each integer m is denoted by s (m) and the unit sample delayed to occur at m iswritten δ (n−m), we can decompose any signal as a sum of unit samples delayed to the appropriate locationand scaled by the signal value.
s (n) =∞∑
m=−∞(s (m) δ (n−m)) (2.29)
This kind of decomposition is unique to discrete-time signals, and will prove useful subsequently.Discrete-time systems can act on discrete-time signals in ways similar to those found in analog signals
and systems. Because of the role of software in discrete-time systems, many more dierent systems canbe envisioned and constructed with programs than can be with analog signals. In fact, a special class ofanalog signals can be converted into discrete-time signals, processed with software, and converted back intoan analog signal, all without the incursion of error. For such signals, systems can be easily produced insoftware, with equivalent analog realizations dicult, if not impossible, to design.
2.4.5 Symbolic-valued Signals
Another interesting aspect of discrete-time signals is that their values do not need to be real numbers. Wedo have real-valued discrete-time signals like the sinusoid, but we also have signals that denote the sequenceof characters typed on the keyboard. Such characters certainly aren't real numbers, and as a collection ofpossible signal values, they have little mathematical structure other than that they are members of a set.More formally, each element of the symbolic-valued signal s (n) takes on one of the values a1, . . . , aK whichcomprise the alphabet A. This technical terminology does not mean we restrict symbols to being mem-bers of the English or Greek alphabet. They could represent keyboard characters, bytes (8-bit quantities),integers that convey daily temperature. Whether controlled by software or not, discrete-time systems areultimately constructed from digital circuits, which consist entirely of analog circuit elements. Furthermore,the transmission and reception of discrete-time signals, like e-mail, is accomplished with analog signals andsystems. Understanding how discrete-time and analog signals and systems intertwine is perhaps the maingoal of this course.

24 CHAPTER 2. SIGNALS AND SYSTEMS
2.5 Introduction to Systems8
Signals are manipulated by systems. Mathematically, we represent what a system does by the notationy (t) = S (x (t)), with x representing the input signal and y the output signal.
Denition of a system
Systemx(t) y(t)
Figure 2.9: The system depicted has input x (t) and output y (t). Mathematically, systems operateon function(s) to produce other function(s). In many ways, systems are like functions, rules that yield avalue for the dependent variable (our output signal) for each value of its independent variable (its inputsignal). The notation y (t) = S (x (t)) corresponds to this block diagram. We term S (·) the input-outputrelation for the system.
This notation mimics the mathematical symbology of a function: A system's input is analogous to anindependent variable and its output the dependent variable. For the mathematically inclined, a system is afunctional: a function of a function (signals are functions).
Simple systems can be connected togetherone system's output becomes another's inputto accomplishsome overall design. Interconnection topologies can be quite complicated, but usually consist of weaves ofthree basic interconnection forms.
2.5.1 Cascade Interconnection
cascade
S1[•] S2[•]x(t) y(t)w(t)
Figure 2.10: The most rudimentary ways of interconnecting systems are shown in the gures in thissection. This is the cascade conguration.
The simplest form is when one system's output is connected only to another's input. Mathematically,w (t) = S1 (x (t)), and y (t) = S2 (w (t)), with the information contained in x (t) processed by the rst, thenthe second system. In some cases, the ordering of the systems matter, in others it does not. For example, inthe fundamental model of communication (Figure 1.4: Fundamental model of communication) the orderingmost certainly matters.
8This content is available online at <http://cnx.org/content/m0005/2.18/>.

25
2.5.2 Parallel Interconnection
parallel
x(t)
x(t)
x(t)
+y(t)
S1[•]
S2[•]
Figure 2.11: The parallel conguration.
A signal x (t) is routed to two (or more) systems, with this signal appearing as the input to all systemssimultaneously and with equal strength. Block diagrams have the convention that signals going to morethan one system are not split into pieces along the way. Two or more systems operate on x (t) and theiroutputs are added together to create the output y (t). Thus, y (t) = S1 (x (t))+S2 (x (t)), and the informationin x (t) is processed separately by both systems.
2.5.3 Feedback Interconnection
feedback
S1[•]x(t) e(t) y(t)
S2[•]
–+
Figure 2.12: The feedback conguration.
The subtlest interconnection conguration has a system's output also contributing to its input. Engineerswould say the output is "fed back" to the input through system 2, hence the terminology. The mathematicalstatement of the feedback interconnection (Figure 2.12: feedback) is that the feed-forward system producesthe output: y (t) = S1 (e (t)). The input e (t) equals the input signal minus the output of some other system'soutput to y (t): e (t) = x (t) − S2 (y (t)). Feedback systems are omnipresent in control problems, with theerror signal used to adjust the output to achieve some condition dened by the input (controlling) signal.For example, in a car's cruise control system, x (t) is a constant representing what speed you want, and y (t)

26 CHAPTER 2. SIGNALS AND SYSTEMS
is the car's speed as measured by a speedometer. In this application, system 2 is the identity system (outputequals input).
2.6 Simple Systems9
Systems manipulate signals, creating output signals derived from their inputs. Why the following are cate-gorized as "simple" will only become evident towards the end of the course.
2.6.1 Sources
Sources produce signals without having input. We like to think of these as having controllable parameters,like amplitude and frequency. Examples would be oscillators that produce periodic signals like sinusoids andsquare waves and noise generators that yield signals with erratic waveforms (more about noise subsequently).Simply writing an expression for the signals they produce species sources. A sine wave generator mightbe specied by y (t) = A sin (2πf0t) u (t), which says that the source was turned on at t = 0 to produce asinusoid of amplitude A and frequency f0.
2.6.2 Ampliers
An amplier (Figure 2.13: amplier) multiplies its input by a constant known as the amplier gain.
y (t) = Gx (t) (2.30)
amplier
AmplifierG
1G
Figure 2.13: An amplier.
The gain can be positive or negative (if negative, we would say that the amplier inverts its input) andcan be greater than one or less than one. If less than one, the amplier actually attenuates. A real-worldexample of an amplier is your home stereo. You control the gain by turning the volume control.
2.6.3 Delay
A system serves as a time delay (Figure 2.14: delay) when the output signal equals the input signal at anearlier time.
y (t) = x (t− τ) (2.31)
9This content is available online at <http://cnx.org/content/m0006/2.23/>.

27
delay
Delayτ
τ
Figure 2.14: A delay.
Here, τ is the delay. The way to understand this system is to focus on the time origin: The output attime t = τ equals the input at time t = 0. Thus, if the delay is positive, the output emerges later than theinput, and plotting the output amounts to shifting the input plot to the right. The delay can be negative,in which case we say the system advances its input. Such systems are dicult to build (they would have toproduce signal values derived from what the input will be), but we will have occasion to advance signals intime.
2.6.4 Time Reversal
Here, the output signal equals the input signal ipped about the time origin.
y (t) = x (−t) (2.32)
time reversal
TimeReverse
Figure 2.15: A time reversal system.
Again, such systems are dicult to build, but the notion of time reversal occurs frequently in communi-cations systems.
Exercise 2.5 (Solution on p. 34.)
Mentioned earlier was the issue of whether the ordering of systems mattered. In other words, ifwe have two systems in cascade, does the output depend on which comes rst? Determine if theordering matters for the cascade of an amplier and a delay and for the cascade of a time-reversalsystem and a delay.
2.6.5 Derivative Systems and Integrators
Systems that perform calculus-like operations on their inputs can produce waveforms signicantly dierentthan present in the input. Derivative systems operate in a straightforward way: A rst-derivative system

28 CHAPTER 2. SIGNALS AND SYSTEMS
would have the input-output relationship y (t) = ddtx (t). Integral systems have the complication that the
integral's limits must be dened. It is a signal theory convention that the elementary integral operation havea lower limit of −∞, and that the value of all signals at t = −∞ equals zero. A simple integrator wouldhave input-output relation
y (t) =∫ t
−∞x (α) dα (2.33)
2.6.6 Linear Systems
Linear systems are a class of systems rather than having a specic input-output relation. Linear systemsform the foundation of system theory, and are the most important class of systems in communications. Theyhave the property that when the input is expressed as a weighted sum of component signals, the outputequals the same weighted sum of the outputs produced by each component. When S (·) is linear,
S (G1x1 (t) + G2x2 (t)) = G1S (x1 (t)) + G2S (x2 (t)) (2.34)
for all choices of signals and gains.This general input-output relation property can be manipulated to indicate specic properties shared by
all linear systems.
• S (Gx (t)) = GS (x (t)) The colloquialism summarizing this property is "Double the input, you doublethe output." Note that this property is consistent with alternate ways of expressing gain changes: Since2x (t) also equals x (t) + x (t), the linear system denition provides the same output no matter whichof these is used to express a given signal.
• S (0) = 0 If the input is identically zero for all time, the output of a linear system must be zero. Thisproperty follows from the simple derivation S (0) = S (x (t)− x (t)) = S (x (t))− S (x (t)) = 0.
Just why linear systems are so important is related not only to their properties, which are divulged throughoutthis course, but also because they lend themselves to relatively simple mathematical analysis. Said anotherway, "They're the only systems we thoroughly understand!"
We can nd the output of any linear system to a complicated input by decomposing the input into simplesignals. The equation above (2.34) says that when a system is linear, its output to a decomposed input isthe sum of outputs to each input. For example, if
x (t) = e−t + sin (2πf0t)
the output S (x (t)) of any linear system equals
y (t) = S(e−t)
+ S (sin (2πf0t))
2.6.7 Time-Invariant Systems
Systems that don't change their input-output relation with time are said to be time-invariant. The mathemat-ical way of stating this property is to use the signal delay concept described in Simple Systems (Section 2.6.3:Delay).
y (t) = S (x (t)) ⇒ y (t− τ) = S (x (t− τ)) (2.35)
If you delay (or advance) the input, the output is similarly delayed (advanced). Thus, a time-invariantsystem responds to an input you may supply tomorrow the same way it responds to the same input appliedtoday; today's output is merely delayed to occur tomorrow.
The collection of linear, time-invariant systems are the most thoroughly understood systems. Much ofthe signal processing and system theory discussed here concentrates on such systems. For example, electric

29
circuits are, for the most part, linear and time-invariant. Nonlinear ones abound, but characterizing themso that you can predict their behavior for any input remains an unsolved problem.
Linear, Time-Invariant Table
Input-Output Relation Linear Time-Invariant
y (t) = ddt (x) yes yes
y (t) = d2
dt2 (x) yes yes
y (t) =(
ddt (x)
)2no yes
y (t) = ddt (x) + x yes yes
y (t) = x1 + x2 yes yes
y (t) = x (t− τ) yes yes
y (t) = cos (2πft) x (t) yes no
y (t) = x (−t) yes no
y (t) = x2 (t) no yes
y (t) = |x (t) | no yes
y (t) = mx (t) + b no yes
Figure 2.16
2.7 Signals and Systems Problems10
Problem 2.1: Complex Number ArithmeticFind the real part, imaginary part, the magnitude and angle of the complex numbers given by the followingexpressions.
a) −1b) 1+
√3j
2c) 1 + j + ej π
2
d) ej π3 + ejπ + e−(j π
3 )
Problem 2.2: Discovering RootsComplex numbers expose all the roots of real (and complex) numbers. For example, there should be twosquare-roots, three cube-roots, etc. of any number. Find the following roots.
a) What are the cube-roots of 27? In other words, what is 2713 ?
b) What are the fth roots of 3 (315 )?
c) What are the fourth roots of one?
10This content is available online at <http://cnx.org/content/m10348/2.24/>.

30 CHAPTER 2. SIGNALS AND SYSTEMS
Problem 2.3: Cool ExponentialsSimplify the following (cool) expressions.
a) jj
b) j2j
c) jjj
Problem 2.4: Complex-valued SignalsComplex numbers and phasors play a very important role in electrical engineering. Solving systems forcomplex exponentials is much easier than for sinusoids, and linear systems analysis is particularly easy.
a) Find the phasor representation for each, and re-express each as the real and imaginary parts of acomplex exponential. What is the frequency (in Hz) of each? In general, are your answers unique? Ifso, prove it; if not, nd an alternative answer for the complex exponential representation.
i) 3 sin (24t)ii)√
2 cos(2π60t + π
4
)iii) 2 cos
(t + π
6
)+ 4 sin
(t− π
3
)b) Show that for linear systems having real-valued outputs for real inputs, that when the input is the
real part of a complex exponential, the output is the real part of the system's output to the complexexponential (see Figure 2.17).
S(Re(Aej2πft
))= Re
(S(Aej2πft
))
Re[•] S[•]
Re[•]S[•]
Aej2πft
Aej2πft
S[Re[Aej2πft]]
Re[S[Aej2πft]]
Figure 2.17
Problem 2.5:For each of the indicated voltages, write it as the real part of a complex exponential (v (t) = Re (V est)).Explicitly indicate the value of the complex amplitude V and the complex frequency s. Represent eachcomplex amplitude as a vector in the V -plane, and indicate the location of the frequencies in the complexs-plane.
a) v (t) = cos (5t)b) v (t) = sin
(8t + π
4
)c) v (t) = e−t
d) v (t) = e−(3t) sin(4t + 3π
4
)e) v (t) = 5e(2t) sin (8t + 2π)f) v (t) = −2g) v (t) = 4 sin (2t) + 3 cos (2t)h) v (t) = 2 cos
(100πt + π
6
)−√
3 sin(100πt + π
2
)

31
Problem 2.6:Express each of the following signals (Figure 2.18) as a linear combination of delayed and weighted stepfunctions and ramps (the integral of a step).
10
t1
s(t)
(a)
10
t1
s(t)
2
(b)
10
t1
s(t)
2
(c)
t1
s(t)
–1–1
2
(d)
t1
s(t)
-1
1
2 3 4 …
(e)
Figure 2.18
Problem 2.7: Linear, Time-Invariant SystemsWhen the input to a linear, time-invariant system is the signal x (t), the output is the signal y (t) (Fig-ure 2.19).
a) Find and sketch this system's output when the input is the depicted signal (Figure 2.20).b) Find and sketch this system's output when the input is a unit step.

32 CHAPTER 2. SIGNALS AND SYSTEMS
t1
1
x(t)
2 3
1
–1
1 2 3t
y(t)
Figure 2.19
t1
1
x(t)
2 3
0.5
Figure 2.20
Problem 2.8: Linear SystemsThe depicted input (Figure 2.21) x (t) to a linear, time-invariant system yields the output y (t).
x(t)
t1
y(t)
t1
1/2
–1/2
1
12
Figure 2.21
a) What is the system's output to a unit step input u (t)?b) What will the output be when the input is the depicted square wave (Figure 2.22)?

33
x(t)
t1
2
2 3 4
•••
–2
Figure 2.22
Problem 2.9: Communication ChannelA particularly interesting communication channel can be modeled as a linear, time-invariant system. Whenthe transmitted signal x (t) is a pulse, the received signal r (t) is as shown (Figure 2.23).
x(t)
t1
1r(t)
t1
1
2
Figure 2.23
a) What will be the received signal when the transmitter sends the pulse sequence (Figure 2.24) x1 (t)?b) What will be the received signal when the transmitter sends the pulse signal (Figure 2.24) x2 (t) that
has half the duration as the original?
x1(t)
t1
1
2 3
t1
1
1/2
x2(t)
Figure 2.24

34 CHAPTER 2. SIGNALS AND SYSTEMS
Solutions to Exercises in Chapter 2
Solution to Exercise 2.1 (p. 14)z + z∗ = a + jb + a− jb = 2a = 2Re (z). Similarly, z − z∗ = a + jb− (a− jb) = 2jb = 2jIm (z)
Solution to Exercise 2.2 (p. 15)To convert 3−2j to polar form, we rst locate the number in the complex plane in the fourth quadrant. The
distance from the origin to the complex number is the magnitude r, which equals√
13 =√
32 + (−2)2. Theangle equals −
(arctan
(23
))or −0.588 radians (−33.7 degrees). The nal answer is
√13∠ (−33.7) degrees.
Solution to Exercise 2.3 (p. 16)
zz∗ = (a + jb) (a− jb) = a2 + b2. Thus, zz∗ = r2 = (|z|)2.Solution to Exercise 2.4 (p. 21)sq (t) =
∑∞n=−∞
((−1)n
ApT/2
(t− nT
2
))Solution to Exercise 2.5 (p. 27)In the rst case, order does not matter; in the second it does. "Delay" means t → t − τ . "Time-reverse"means t → −t
Case 1 y (t) = Gx (t− τ), and the way we apply the gain and delay the signal gives the same result.Case 2 Time-reverse then delay: y (t) = x (− (t− τ)) = x (−t + τ). Delay then time-reverse: y (t) =
x (−t− τ).

Chapter 3
Analog Signal Processing
3.1 Voltage, Current, and Generic Circuit Elements1
We know that information can be represented by signals; now we need to understand how signals arephysically realized. Over the years, electric signals have been found to be the easiest to use. Voltage andcurrents comprise the electric instantiations of signals. Thus, we need to delve into the world of electricityand electromagnetism. The systems used to manipulate electric signals directly are called circuits, and theyrene the information representation or extract information from the voltage or current. In many cases, theymake nice examples of linear systems.
A generic circuit element places a constraint between the classic variables of a circuit: voltage and current.Voltage is electric potential and represents the "push" that drives electric charge from one place to another.What causes charge to move is a physical separation between positive and negative charge. A batterygenerates, through electrochemical means, excess positive charge at one terminal and negative charge at theother, creating an electric eld. Voltage is dened across a circuit element, with the positive sign denoting apositive voltage drop across the element. When a conductor connects the positive and negative potentials,current ows, with positive current indicating that positive charge ows from the positive terminal to thenegative. Electrons comprise current ow in many cases. Because electrons have a negative charge, electronsmove in the opposite direction of positive current ow: Negative charge owing to the right is equivalent topositive charge moving to the left.
It is important to understand the physics of current ow in conductors to appreciate the innovation ofnew electronic devices. Electric charge can arise from many sources, the simplest being the electron. Whenwe say that "electrons ow through a conductor," what we mean is that the conductor's constituent atomsfreely give up electrons from their outer shells. "Flow" thus means that electrons hop from atom to atomdriven along by the applied electric potential. A missing electron, however, is a virtual positive charge.Electrical engineers call these holes, and in some materials, particularly certain semiconductors, currentow is actually due to holes. Current ow also occurs in nerve cells found in your brain. Here, neurons"communicate" using propagating voltage pulses that rely on the ow of positive ions (potassium and sodiumprimarily, and to some degree calcium) across the neuron's outer wall. Thus, current can come from manysources, and circuit theory can be used to understand how current ows in reaction to electric elds.
1This content is available online at <http://cnx.org/content/m0011/2.12/>.
35

36 CHAPTER 3. ANALOG SIGNAL PROCESSING
Generic Circuit Element
+
–v
i
Figure 3.1: The generic circuit element.
Current ows through circuit elements, such as that depicted in Figure 3.1 (Generic Circuit Element),and through conductors, which we indicate by lines in circuit diagrams. For every circuit element we denea voltage and a current. The element has a v-i relation dened by the element's physical properties. Indening the v-i relation, we have the convention that positive current ows from positive to negative voltagedrop. Voltage has units of volts, and both the unit and the quantity are named for Volta2 . Current hasunits of amperes, and is named for the French physicist Ampère3 .
Voltages and currents also carry power. Again using the convention shown in Figure 3.1 (Generic CircuitElement) for circuit elements, the instantaneous power at each moment of time consumed by the elementis given by the product of the voltage and current.
p (t) = v (t) i (t)
A positive value for power indicates that at time t the circuit element is consuming power; a negative valuemeans it is producing power. With voltage expressed in volts and current in amperes, power dened thisway has units of watts. Just as in all areas of physics and chemistry, power is the rate at which energy isconsumed or produced. Consequently, energy is the integral of power.
E (t) =∫ t
−∞p (α) dα
Again, positive energy corresponds to consumed energy and negative energy corresponds to energy produc-tion. Note that a circuit element having a power prole that is both positive and negative over some timeinterval could consume or produce energy according to the sign of the integral of power. The units of energyare joules since a watt equals joules/second.
Exercise 3.1 (Solution on p. 106.)
Residential energy bills typically state a home's energy usage in kilowatt-hours. Is this really aunit of energy? If so, how many joules equals one kilowatt-hour?
3.2 Ideal Circuit Elements4
The elementary circuit elementsthe resistor, capacitor, and inductor impose linear relationships betweenvoltage and current.
2http://www.bioanalytical.com/info/calendar/97/volta.htm3http://www-groups.dcs.st-and.ac.uk/∼history/Mathematicians/Ampere.html4This content is available online at <http://cnx.org/content/m0012/2.19/>.

37
3.2.1 Resistor
Resistor
R+
–v
i
Figure 3.2: Resistor. v = Ri
The resistor is far and away the simplest circuit element. In a resistor, the voltage is proportional to thecurrent, with the constant of proportionality R, known as the resistance.
v (t) = Ri (t)
Resistance has units of ohms, denoted by Ω, named for the German electrical scientist Georg Ohm5 .Sometimes, the v-i relation for the resistor is written i = Gv, with G, the conductance, equal to 1
R .Conductance has units of Siemens (S), and is named for the German electronics industrialist Werner vonSiemens6 .
When resistance is positive, as it is in most cases, a resistor consumes power. A resistor's instantaneouspower consumption can be written one of two ways.
p (t) = Ri2 (t) =1R
v2 (t)
As the resistance approaches innity, we have what is known as an open circuit: No current ows but anon-zero voltage can appear across the open circuit. As the resistance becomes zero, the voltage goes to zerofor a non-zero current ow. This situation corresponds to a short circuit. A superconductor physicallyrealizes a short circuit.
3.2.2 Capacitor
Capacitor
C+
–v
i
Figure 3.3: Capacitor. i = C ddt
v (t)
5http://www-groups.dcs.st-and.ac.uk/∼history/Mathematicians/Ohm.html6http://w4.siemens.de/archiv/en/persoenlichkeiten/werner_von_siemens.html

38 CHAPTER 3. ANALOG SIGNAL PROCESSING
The capacitor stores charge and the relationship between the charge stored and the resultant voltage isq = Cv. The constant of proportionality, the capacitance, has units of farads (F), and is named for theEnglish experimental physicist Michael Faraday7 . As current is the rate of change of charge, the v-i relationcan be expressed in dierential or integral form.
i (t) = Cd
dtv (t) orv (t) =
1C
∫ t
−∞i (α) dα (3.1)
If the voltage across a capacitor is constant, then the current owing into it equals zero. In this situation,the capacitor is equivalent to an open circuit. The power consumed/produced by a voltage applied to acapacitor depends on the product of the voltage and its derivative.
p (t) = Cv (t)d
dtv (t)
This result means that a capacitor's total energy expenditure up to time t is concisely given by
E (t) =12Cv2 (t)
This expression presumes the fundamental assumption of circuit theory: all voltages and currents in anycircuit were zero in the far distant past (t = −∞).
3.2.3 Inductor
Inductor
L+
–v
i
Figure 3.4: Inductor. v = L ddt
i (t)
The inductor stores magnetic ux, with larger valued inductors capable of storing more ux. Inductance hasunits of henries (H), and is named for the American physicist Joseph Henry8 . The dierential and integralforms of the inductor's v-i relation are
v (t) = Ld
dti (t) or i (t) =
1L
∫ t
−∞v (α) dα (3.2)
The power consumed/produced by an inductor depends on the product of the inductor current and itsderivative
p (t) = Li (t)d
dti (t)
and its total energy expenditure up to time t is given by
E (t) =12Li2 (t)
7http://www.iee.org.uk/publish/faraday/faraday1.html8http://www.si.edu/archives//ihd/jhp/

39
3.2.4 Sources
Sources
+
–v
i
vs+
–
(a)
+
–v
i
is
(b)
Figure 3.5: The voltage source on the left and current source on the right are like all circuit elementsin that they have a particular relationship between the voltage and current dened for them. For thevoltage source, v = vs for any current i; for the current source, i = −is for any voltage v.
Sources of voltage and current are also circuit elements, but they are not linear in the strict sense of linearsystems. For example, the voltage source's v-i relation is v = vs regardless of what the current might be. Asfor the current source, i = −is regardless of the voltage. Another name for a constant-valued voltage sourceis a battery, and can be purchased in any supermarket. Current sources, on the other hand, are much harderto acquire; we'll learn why later.
3.3 Ideal and Real-World Circuit Elements9
Source and linear circuit elements are ideal circuit elements. One central notion of circuit theory is combiningthe ideal elements to describe how physical elements operate in the real world. For example, the 1 kΩresistor you can hold in your hand is not exactly an ideal 1 kΩ resistor. First of all, physical devicesare manufactured to close tolerances (the tighter the tolerance, the more money you pay), but never haveexactly their advertised values. The fourth band on resistors species their tolerance; 10% is common. Morepertinent to the current discussion is another deviation from the ideal: If a sinusoidal voltage is placed acrossa physical resistor, the current will not be exactly proportional to it as frequency becomes high, say above1 MHz. At very high frequencies, the way the resistor is constructed introduces inductance and capacitanceeects. Thus, the smart engineer must be aware of the frequency ranges over which his ideal models matchreality well.
On the other hand, physical circuit elements can be readily found that well approximate the ideal, butthey will always deviate from the ideal in some way. For example, a ashlight battery, like a C-cell, roughlycorresponds to a 1.5 V voltage source. However, it ceases to be modeled by a voltage source capable ofsupplying any current (that's what ideal ones can do!) when the resistance of the light bulb is too small.
3.4 Electric Circuits and Interconnection Laws10
A circuit connects circuit elements together in a specic conguration designed to transform the sourcesignal (originating from a voltage or current source) into another signalthe outputthat corresponds tothe current or voltage dened for a particular circuit element. A simple resistive circuit is shown in Figure 3.6.
9This content is available online at <http://cnx.org/content/m0013/2.9/>.10This content is available online at <http://cnx.org/content/m0014/2.26/>.

40 CHAPTER 3. ANALOG SIGNAL PROCESSING
This circuit is the electrical embodiment of a system having its input provided by a source system producingvin (t).
vin+
–
R1
R2
+
–
vout
(a)
vin+
–
R1
R2
+
–
vout
iout
+ –v1i1
+
–v
i
(b)
Systemvin(t) vout(t)
Source
(c)
Figure 3.6: The circuit shown in the top two gures is perhaps the simplest circuit that performs asignal processing function. On the bottom is the block diagram that corresponds to the circuit. Theinput is provided by the voltage source vin and the output is the voltage vout across the resistor label R2.As shown in the middle, we analyze the circuitunderstand what it accomplishesby dening currentsand voltages for all circuit elements, and then solving the circuit and element equations.
To understand what this circuit accomplishes, we want to determine the voltage across the resistorlabeled by its value R2. Recasting this problem mathematically, we need to solve some set of equations sothat we relate the output voltage vout to the source voltage. It would be simplea little too simple at thispointif we could instantly write down the one equation that relates these two voltages. Until we have moreknowledge about how circuits work, we must write a set of equations that allow us to nd all the voltagesand currents that can be dened for every circuit element. Because we have a three-element circuit, we havea total of six voltages and currents that must be either specied or determined. You can dene the directionsfor current ow and positive voltage drop any way you like. When two people solve a circuit their own ways,the signs of their variables may not agree, but current ow and voltage drop values for each element willagree. Do recall in dening your voltage and current variables (Section 3.2) that the v-i relations for theelements presume that positive current ow is in the same direction as positive voltage drop. Once youdene voltages and currents, we need six nonredundant equations to solve for the six unknown voltages andcurrents. By specifying the source, we have one; this amounts to providing the source's v-i relation. Thev-i relations for the resistors give us two more. We are only halfway there; where do we get the other three

41
equations we need?What we need to solve every circuit problem are mathematical statements that express how the circuit
elements are interconnected. Said another way, we need the laws that govern the electrical connection ofcircuit elements. First of all, the places where circuit elements attach to each other are called nodes.Two nodes are explicitly indicated in Figure 3.6; a third is at the bottom where the voltage source andresistor R2 are connected. Electrical engineers tend to draw circuit diagramsschematics in a rectilinearfashion. Thus the long line connecting the bottom of the voltage source with the bottom of the resistoris intended to make the diagram look pretty. This line simply means that the two elements are connectedtogether. Kircho's Laws, one for voltage (Section 3.4.2: Kircho's Voltage Law (KVL)) and one forcurrent (Section 3.4.1: Kircho's Current Law), determine what a connection among circuit elements means.These laws can help us analyze this circuit.
3.4.1 Kircho's Current Law
At every node, the sum of all currents entering a node must equal zero. What this law means physically isthat charge cannot accumulate in a node; what goes in must come out. In the example, Figure 3.6, belowwe have a three-node circuit and thus have three KCL equations.
−i− i1 = 0
i1 − i2 = 0
i + i2 = 0
Note that the current entering a node is the negative of the current leaving the node.Given any two of these KCL equations, we can nd the other by adding or subtracting them. Thus, one
of them is redundant and, in mathematical terms, we can discard any one of them. The convention is todiscard the equation for the (unlabeled) node at the bottom of the circuit.
vin+
–
R1
R2
+
–
vout
(a)
vin+
–
R1
R2
+
–
vout
iout
+ –v1i1
+
–v
i
(b)
Figure 3.7: The circuit shown is perhaps the simplest circuit that performs a signal processing function.The input is provided by the voltage source vin and the output is the voltage vout across the resistorlabelled R2.
Exercise 3.2 (Solution on p. 106.)
In writing KCL equations, you will nd that in an n-node circuit, exactly one of them is alwaysredundant. Can you sketch a proof of why this might be true? Hint: It has to do with the factthat charge won't accumulate in one place on its own.

42 CHAPTER 3. ANALOG SIGNAL PROCESSING
3.4.2 Kircho's Voltage Law (KVL)
The voltage law says that the sum of voltages around every closed loop in the circuit must equal zero. Aclosed loop has the obvious denition: Starting at a node, trace a path through the circuit that returns youto the origin node. KVL expresses the fact that electric elds are conservative: The total work performedin moving a test charge around a closed path is zero. The KVL equation for our circuit is
v1 + v2 − v = 0
In writing KVL equations, we follow the convention that an element's voltage enters with a plus sign whentraversing the closed path, we go from the positive to the negative of the voltage's denition.
vin+
–
R1
R2
+
–
vout
(a)
vin+
–
R1
R2
+
–
vout
iout
+ –v1i1
+
–v
i
(b)
Figure 3.8: The circuit shown is perhaps the simplest circuit that performs a signal processing function.The input is provided by the voltage source vin and the output is the voltage vout across the resistorlabelled R2.
For the example circuit (Figure 3.8), we have three v-i relations, two KCL equations, and one KVLequation for solving for the circuit's six voltages and currents.
v-i: v = vin
v1 = R1i1
vout = R2iout
KCL: −i− i1 = 0
i1 − iout = 0
KVL: −v + v1 + vout = 0
We have exactly the right number of equations! Eventually, we will discover shortcuts for solving circuitproblems; for now, we want to eliminate all the variables but vout and determine how it depends on vin andon resistor values. The KVL equation can be rewritten as vin = v1 + vout. Substituting into it the resistor'sv-i relation, we have vin = R1i1 + R2iout. Yes, we temporarily eliminate the quantity we seek. Thoughnot obvious, it is the simplest way to solve the equations. One of the KCL equations says i1 = iout, whichmeans that vin = R1iout + R2iout = (R1 + R2) iout. Solving for the current in the output resistor, we haveiout = vin
R1+R2. We have now solved the circuit: We have expressed one voltage or current in terms of sources
and circuit-element values. To nd any other circuit quantities, we can back substitute this answer into ouroriginal equations or ones we developed along the way. Using the v-i relation for the output resistor, weobtain the quantity we seek.
vout =R2
R1 + R2vin

43
Exercise 3.3 (Solution on p. 106.)
Referring back to Figure 3.6, a circuit should serve some useful purpose. What kind of systemdoes our circuit realize and, in terms of element values, what are the system's parameter(s)?
3.5 Power Dissipation in Resistor Circuits11
We can nd voltages and currents in simple circuits containing resistors and voltage or current sources. Weshould examine whether these circuits variables obey the Conservation of Power principle: since a circuit isa closed system, it should not dissipate or create energy. For the moment, our approach is to investigaterst a resistor circuit's power consumption/creation. Later, we will prove that because of KVL and KCLall circuits conserve power.
As dened on p. 36, the instantaneous power consumed/created by every circuit element equals theproduct of its voltage and current. The total power consumed/created by a circuit equals the sum of eachelement's power.
P =∑
k
(vkik)
Recall that each element's current and voltage must obey the convention that positive current is dened toenter the positive-voltage terminal. With this convention, a positive value of vkik corresponds to consumedpower, a negative value to created power. Because the total power in a circuit must be zero (P = 0), somecircuit elements must create power while others consume it.
Consider the simple series circuit should in Section 3.4. In performing our calculations, we dened thecurrent iout to ow through the positive-voltage terminals of both resistors and found it to equal iout =
vinR1+R2
. The voltage across the resistor R2 is the output voltage and we found it to equal vout = R2R1+R2
vin.Consequently, calculating the power for this resistor yields
P2 =R2
(R1 + R2)2 vin
2
Consequently, this resistor dissipates power because P2 is positive. This result should not be surprising sincewe showed (p. 37) that the power consumed by any resistor equals either of the following.
v2
Ror i2R (3.3)
Since resistors are positive-valued, resistors always dissipate power. But where does a resistor's power go?By Conversation of Power, the dissipated power must be absorbed somewhere. The answer is not directlypredicted by circuit theory, but is by physics. Current owing through a resistor makes it hot; its power isdissipated by heat.
Note: A physical wire has a resistance and hence dissipates power (it gets warm just like aresistor in a circuit). In fact, the resistance of a wire of length L and cross-sectional area A is givenby
R =ρL
AThe quantity ρ is known as the resistivity and presents the resistance of a unit-length of materialconstituting the wire. Most materials have a positive value for ρ, which means the longer thewire, the greater the resistance and thus the power dissipated. The thicker the wire, the smallerthe resistance. Superconductors have no resistance and hence do not dissipate power. If a room-temperature superconductor could be found, electric power could be sent through power lineswithout loss!
11This content is available online at <http://cnx.org/content/m17305/1.5/>.

44 CHAPTER 3. ANALOG SIGNAL PROCESSING
Exercise 3.4 (Solution on p. 106.)
Calculate the power consumed/created by the resistor R1 in our simple circuit example.
We conclude that both resistors in our example circuit consume power, which points to the voltage sourceas the producer of power. The current owing into the source's positive terminal is −iout. Consequently,the power calculation for the source yields
− (viniout) = −(
1R1 + R2
vin2
)We conclude that the source provides the power consumed by the resistors, no more, no less.
Exercise 3.5 (Solution on p. 106.)
Conrm that the source produces exactly the total power consumed by both resistors.
This result is quite general: sources produce power and the circuit elements, especially resistors, consumeit. But where do sources get their power? Again, circuit theory does not model how sources are constructed,but the theory decrees that all sources must be provided energy to work.
3.6 Series and Parallel Circuits12
vin+
–
R1
R2
+
–
vout
(a)
vin+
–
R1
R2
+
–
vout
iout
+ –v1i1
+
–v
i
(b)
Figure 3.9: The circuit shown is perhaps the simplest circuit that performs a signal processing function.The input is provided by the voltage source vin and the output is the voltage vout across the resistorlabelled R2.
The results shown in other modules (circuit elements (Section 3.4), KVL and KCL (Section 3.4), intercon-nection laws (Section 3.4)) with regard to this circuit (Figure 3.9), and the values of other currents andvoltages in this circuit as well, have profound implications.
Resistors connected in such a way that current from one must ow only into anothercurrents in allresistors connected this way have the same magnitudeare said to be connected in series. For the twoseries-connected resistors in the example, the voltage across one resistor equals the ratio of that resistor'svalue and the sum of resistances times the voltage across the series combination. This concept is so pervasiveit has a name: voltage divider.
The input-output relationship for this system, found in this particular case by voltage divider, takesthe form of a ratio of the output voltage to the input voltage.
vout
vin=
R2
R1 + R2
12This content is available online at <http://cnx.org/content/m10674/2.7/>.

45
In this way, we express how the components used to build the system aect the input-output relationship.Because this analysis was made with ideal circuit elements, we might expect this relation to break down ifthe input amplitude is too high (Will the circuit survive if the input changes from 1 volt to one million volts?)or if the source's frequency becomes too high. In any case, this important way of expressing input-outputrelationshipsas a ratio of output to inputpervades circuit and system theory.
The current i1 is the current owing out of the voltage source. Because it equals i2, we have thatvin
i1= R1 + R2:
Resistors in series: The series combination of two resistors acts, as far as the voltage source isconcerned, as a single resistor having a value equal to the sum of the two resistances.
This result is the rst of several equivalent circuit ideas: In many cases, a complicated circuit when viewedfrom its terminals (the two places to which you might attach a source) appears to be a single circuit element(at best) or a simple combination of elements at worst. Thus, the equivalent circuit for a series combinationof resistors is a single resistor having a resistance equal to the sum of its component resistances.
vin+
–
R1
R2 vin+
–R1+R2
Figure 3.10: The resistor (on the right) is equivalent to the two resistors (on the left) and has aresistance equal to the sum of the resistances of the other two resistors.
Thus, the circuit the voltage source "feels" (through the current drawn from it) is a single resistor havingresistance R1 +R2. Note that in making this equivalent circuit, the output voltage can no longer be dened:The output resistor labeled R2 no longer appears. Thus, this equivalence is made strictly from the voltagesource's viewpoint.
R1 R2
iout
iin R1 R2
iouti1+v1
+v2
iin+v
Figure 3.11: A simple parallel circuit.
One interesting simple circuit (Figure 3.11) has two resistors connected side-by-side, what we will terma parallel connection, rather than in series. Here, applying KVL reveals that all the voltages are identical:

46 CHAPTER 3. ANALOG SIGNAL PROCESSING
v1 = v and v2 = v. This result typies parallel connections. To write the KCL equation, note that the topnode consists of the entire upper interconnection section. The KCL equation is iin − i1 − i2 = 0. Using thev-i relations, we nd that
iout =R1
R1 + R2iin
Exercise 3.6 (Solution on p. 106.)
Suppose that you replaced the current source in Figure 3.11 by a voltage source. How would iout
be related to the source voltage? Based on this result, what purpose does this revised circuit have?
This circuit highlights some important properties of parallel circuits. You can easily show that the par-
allel combination of R1 and R2 has the v-i relation of a resistor having resistance(
1R1
+ 1R2
)−1
= R1R2R1+R2
.
A shorthand notation for this quantity is (R1 ‖ R2). As the reciprocal of resistance is conductance (Sec-tion 3.2.1: Resistor), we can say that for a parallel combination of resistors, the equivalent conductance isthe sum of the conductances .
R1 R2R1R2
R1+R2
Figure 3.12
Similar to voltage divider (p. 44) for series resistances, we have current divider for parallel resistances.The current through a resistor in parallel with another is the ratio of the conductance of the rst to the sumof the conductances. Thus, for the depicted circuit, i2 = G2
G1+G2i. Expressed in terms of resistances, current
divider takes the form of the resistance of the other resistor divided by the sum of resistances: i2 = R1R1+R2
i.
R1 R2
i
i2
Figure 3.13

47
vin+
–
R1
R2
+
–
vout RL
source system sink
Figure 3.14: The simple attenuator circuit (Figure 3.9) is attached to an oscilloscope's input. Theinput-output relation for the above circuit without a load is: vout = R2
R1+R2vin.
Suppose we want to pass the output signal into a voltage measurement device, such as an oscilloscope ora voltmeter. In system-theory terms, we want to pass our circuit's output to a sink. For most applications,we can represent these measurement devices as a resistor, with the current passing through it driving themeasurement device through some type of display. In circuits, a sink is called a load; thus, we describe asystem-theoretic sink as a load resistance RL. Thus, we have a complete system built from a cascade ofthree systems: a source, a signal processing system (simple as it is), and a sink.
We must analyze afresh how this revised circuit, shown in Figure 3.14, works. Rather than dening eightvariables and solving for the current in the load resistor, let's take a hint from other analysis (series rules(p. 44), parallel rules (p. 46)). Resistors R2 and RL are in a parallel conguration: The voltages acrosseach resistor are the same while the currents are not. Because the voltages are the same, we can nd thecurrent through each from their v-i relations: i2 = vout
R2and iL = vout
RL. Considering the node where all three
resistors join, KCL says that the sum of the three currents must equal zero. Said another way, the currententering the node through R1 must equal the sum of the other two currents leaving the node. Therefore,
i1 = i2 + iL, which means that i1 = vout
(1
R2+ 1
R1
).
Let Req denote the equivalent resistance of the parallel combination of R2 and RL. Using R1's v-i relation,the voltage across it is v1 = R1vout
Req. The KVL equation written around the leftmost loop has vin = v1 +vout;
substituting for v1, we nd
vin = vout
(R1
Req+ 1)
orvout
vin=
Req
R1 + Req
Thus, we have the input-output relationship for our entire system having the form of voltage divider,but it does not equal the input-output relation of the circuit without the voltage measurement device. Wecan not measure voltages reliably unless the measurement device has little eect on what we are trying tomeasure. We should look more carefully to determine if any values for the load resistance would lessen itsimpact on the circuit. Comparing the input-output relations before and after, what we need is Req ≈ R2. As
Req =(
1R2
+ 1RL
)−1
, the approximation would apply if(
1R2 1
RL
)or (R2 RL). This is the condition
we seek:
Voltage measurement: Voltage measurement devices must have large resistances comparedwith that of the resistor across which the voltage is to be measured.
Exercise 3.7 (Solution on p. 106.)
Let's be more precise: How much larger would a load resistance need to be to aect the input-outputrelation by less than 10%? by less than 1%?

48 CHAPTER 3. ANALOG SIGNAL PROCESSING
Example 3.1
R1
R2 R3
R4
Figure 3.15
We want to nd the total resistance of the example circuit. To apply the series and parallelcombination rules, it is best to rst determine the circuit's structure: What is in series with whatand what is in parallel with what at both small- and large-scale views. We have R2 in parallelwith R3; this combination is in series with R4. This series combination is in parallel with R1. Notethat in determining this structure, we started away from the terminals, and worked toward them.In most cases, this approach works well; try it rst. The total resistance expression mimics thestructure:
RT = R1 ‖ (R2 ‖ R3 + R4)
RT =R1R2R3 + R1R2R4 + R1R3R4
R1R2 + R1R3 + R2R3 + R2R4 + R3R4
Such complicated expressions typify circuit "simplications." A simple check for accuracy is theunits: Each component of the numerator should have the same units (here Ω3) as well as in thedenominator (Ω2). The entire expression is to have units of resistance; thus, the ratio of thenumerator's and denominator's units should be ohms. Checking units does not guarantee accuracy,but can catch many errors.
Another valuable lesson emerges from this example concerning the dierence between cascading systems andcascading circuits. In system theory, systems can be cascaded without changing the input-output relationof intermediate systems. In cascading circuits, this ideal is rarely true unless the circuits are so designed.Design is in the hands of the engineer; he or she must recognize what have come to be known as loadingeects. In our simple circuit, you might think that making the resistance RL large enough would do thetrick. Because the resistors R1 and R2 can have virtually any value, you can never make the resistance ofyour voltage measurement device big enough. Said another way, a circuit cannot be designed in isolationthat will work in cascade with all other circuits. Electrical engineers deal with this situation through thenotion of specications: Under what conditions will the circuit perform as designed? Thus, you will ndthat oscilloscopes and voltmeters have their internal resistances clearly stated, enabling you to determinewhether the voltage you measure closely equals what was present before they were attached to your circuit.Furthermore, since our resistor circuit functions as an attenuator, with the attenuation (a fancy word for
gains less than one) depending only on the ratio of the two resistor values R2R1+R2
=(1 + R1
R2
)−1
, we can
select any values for the two resistances we want to achieve the desired attenuation. The designer of thiscircuit must thus specify not only what the attenuation is, but also the resistance values employed so thatintegratorspeople who put systems together from component systemscan combine systems together andhave a chance of the combination working.
Figure 3.16 (series and parallel combination rules) summarizes the series and parallel combination results.These results are easy to remember and very useful. Keep in mind that for series combinations, voltage and

49
resistance are the key quantities, while for parallel combinations current and conductance are more important.In series combinations, the currents through each element are the same; in parallel ones, the voltages are thesame.
series and parallel combination rules
…
R1
R2
RN
+
–
v2
+
–
vRT
(a) series combination rule
G1 G2 … GNGT
i2
i
(b) parallel combination rule
Figure 3.16: Series and parallel combination rules. (a) RT =PN
n=1 (Rn) vn = RnRT
v (b) GT =PN
n=1 Gn
in = GnGT
i
Exercise 3.8 (Solution on p. 106.)
Contrast a series combination of resistors with a parallel one. Which variable (voltage or current)is the same for each and which diers? What are the equivalent resistances? When resistors areplaced in series, is the equivalent resistance bigger, in between, or smaller than the componentresistances? What is this relationship for a parallel combination?
3.7 Equivalent Circuits: Resistors and Sources13
We have found that the way to think about circuits is to locate and group parallel and series resistorcombinations. Those resistors not involved with variables of interest can be collapsed into a single resistance.This result is known as an equivalent circuit: from the viewpoint of a pair of terminals, a group of resistorsfunctions as a single resistor, the resistance of which can usually be found by applying the parallel and seriesrules.
This result generalizes to include sources in a very interesting and useful way. Let's consider our simpleattenuator circuit (shown in the gure (Figure 3.17)) from the viewpoint of the output terminals. We wantto nd the v-i relation for the output terminal pair, and then nd the equivalent circuit for the boxed circuit.To perform this calculation, use the circuit laws and element relations, but do not attach anything to theoutput terminals. We seek the relation between v and i that describes the kind of element that lurks withinthe dashed box. The result is
v = (R1 ‖ R2) i +R2
R1 + R2vin (3.4)
13This content is available online at <http://cnx.org/content/m0020/2.22/>.

50 CHAPTER 3. ANALOG SIGNAL PROCESSING
vin+
–
R1
R2
+
–
v
i
Figure 3.17
If the source were zero, it could be replaced by a short circuit, which would conrm that the circuit doesindeed function as a parallel combination of resistors. However, the source's presence means that the circuitis not well modeled as a resistor.
veq+
–
Req+
–
v
i
Figure 3.18: The Thévenin equivalent circuit.
If we consider the simple circuit of Figure 3.18, we nd it has the v-i relation at its terminals of
v = Reqi + veq (3.5)
Comparing the two v-i relations, we nd that they have the same form. In this case the Thévenin equivalentresistance is Req = (R1 ‖ R2) and the Thévenin equivalent source has voltage veq = R2
R1+R2vin. Thus, from
viewpoint of the terminals, you cannot distinguish the two circuits. Because the equivalent circuit has fewerelements, it is easier to analyze and understand than any other alternative.
For any circuit containing resistors and sources, the v-i relation will be of the form
v = Reqi + veq (3.6)
and the Thévenin equivalent circuit for any such circuit is that of Figure 3.18. This equivalence applies nomatter how many sources or resistors may be present in the circuit. In the example (Example 3.2) below, weknow the circuit's construction and element values, and derive the equivalent source and resistance. BecauseThévenin's theorem applies in general, we should be able to make measurements or calculations only fromthe terminals to determine the equivalent circuit.

51
To be more specic, consider the equivalent circuit of this gure (Figure 3.18). Let the terminals be open-circuited, which has the eect of setting the current i to zero. Because no current ows through the resistor,the voltage across it is zero (remember, Ohm's Law says that v = Ri). Consequently, by applying KVLwe have that the so-called open-circuit voltage voc equals the Thévenin equivalent voltage. Now considerthe situation when we set the terminal voltage to zero (short-circuit it) and measure the resulting current.Referring to the equivalent circuit, the source voltage now appears entirely across the resistor, leaving the
short-circuit current to be isc = −(
veq
Req
). From this property, we can determine the equivalent resistance.
veq = voc (3.7)
Req = −(
voc
isc
)(3.8)
Exercise 3.9 (Solution on p. 106.)
Use the open/short-circuit approach to derive the Thévenin equivalent of the circuit shown inFigure 3.19.
vin+
–
R1
R2
+
–
v
i
Figure 3.19
Example 3.2
R1
R2R3iin
Figure 3.20
For the circuit depicted in Figure 3.20, let's derive its Thévenin equivalent two dierent ways.Starting with the open/short-circuit approach, let's rst nd the open-circuit voltage voc. We havea current divider relationship as R1 is in parallel with the series combination of R2 and R3. Thus,voc = iinR3R1
R1+R2+R3. When we short-circuit the terminals, no voltage appears across R3, and thus
no current ows through it. In short, R3 does not aect the short-circuit current, and can be
eliminated. We again have a current divider relationship: isc = −(
iinR1R1+R2
). Thus, the Thévenin
equivalent resistance is R3(R1+R2)R1+R2+R3
.

52 CHAPTER 3. ANALOG SIGNAL PROCESSING
To verify, let's nd the equivalent resistance by reaching inside the circuit and setting the currentsource to zero. Because the current is now zero, we can replace the current source by an open circuit.From the viewpoint of the terminals, resistor R3 is now in parallel with the series combination ofR1 and R2. Thus, Req = (R3 ‖ R1 + R2), and we obtain the same result.
veq+
–
Req+
–
v
i
Sourcesand
Resistors
+
–
v
i
+
–
v
i
Reqieq
Thévenin Equivalent Mayer-Norton Equivalent
Figure 3.21: All circuits containing sources and resistors can be described by simpler equivalentcircuits. Choosing the one to use depends on the application, not on what is actually inside the circuit.
As you might expect, equivalent circuits come in two forms: the voltage-source oriented Thévenin equiv-alent14 and the current-source oriented Mayer-Norton equivalent (Figure 3.21). To derive the latter, thev-i relation for the Thévenin equivalent can be written as
v = Reqi + veq (3.9)
ori =
v
Req− ieq (3.10)
where ieq = veq
Reqis the Mayer-Norton equivalent source. The Mayer-Norton equivalent shown in Figure 3.21
be easily shown to have this v-i relation. Note that both variations have the same equivalent resistance. Theshort-circuit current equals the negative of the Mayer-Norton equivalent source.
Exercise 3.10 (Solution on p. 106.)
Find the Mayer-Norton equivalent circuit for the circuit below.
14"Finding Thévenin Equivalent Circuits" <http://cnx.org/content/m0021/latest/>

53
R1
R2R3iin
Figure 3.22
Equivalent circuits can be used in two basic ways. The rst is to simplify the analysis of a complicatedcircuit by realizing the any portion of a circuit can be described by either a Thévenin or Mayer-Nortonequivalent. Which one is used depends on whether what is attached to the terminals is a series conguration(making the Thévenin equivalent the best) or a parallel one (making Mayer-Norton the best).
Another application is modeling. When we buy a ashlight battery, either equivalent circuit can accu-rately describe it. These models help us understand the limitations of a battery. Since batteries are labeledwith a voltage specication, they should serve as voltage sources and the Thévenin equivalent serves asthe natural choice. If a load resistance RL is placed across its terminals, the voltage output can be foundusing voltage divider: v = veqRL
RL+Req. If we have a load resistance much larger than the battery's equivalent
resistance, then, to a good approximation, the battery does serve as a voltage source. If the load resistanceis much smaller, we certainly don't have a voltage source (the output voltage depends directly on the loadresistance). Consider now the Mayer-Norton equivalent; the current through the load resistance is given by
current divider, and equals i = −(
ieqReq
RL+Req
). For a current that does not vary with the load resistance,
this resistance should be much smaller than the equivalent resistance. If the load resistance is comparableto the equivalent resistance, the battery serves neither as a voltage source or a current course. Thus, whenyou buy a battery, you get a voltage source if its equivalent resistance is much smaller than the equivalentresistance of the circuit to which you attach it. On the other hand, if you attach it to a circuit having asmall equivalent resistance, you bought a current source.
Léon Charles Thévenin: He was an engineer with France's Postes, Télégraphe et Téléphone. In1883, he published (twice!) a proof of what is now called the Thévenin equivalent while developingways of teaching electrical engineering concepts at the École Polytechnique. He did not realize thatthe same result had been published by Hermann Helmholtz15 , the renowned nineteenth centuryphysicist, thiry years earlier.
Hans Ferdinand Mayer: After earning his doctorate in physics in 1920, he turned to com-munications engineering when he joined Siemens & Halske in 1922. In 1926, he published in aGerman technical journal the Mayer-Norton equivalent. During his interesting career, he rose tolead Siemen's Central Laboratory in 1936, surruptiously leaked to the British all he knew of Germanwarfare capabilities a month after the Nazis invaded Poland, was arrested by the Gestapo in 1943for listening to BBC radio broadcasts, spent two years in Nazi concentration camps, and went tothe United States for four years working for the Air Force and Cornell University before returningto Siemens in 1950. He rose to a position on Siemen's Board of Directors before retiring.
Edward L. Norton: Edward Norton16 was an electrical engineer who worked at Bell Laboratoryfrom its inception in 1922. In the same month when Mayer's paper appeared, Norton wrote in aninternal technical memorandum a paragraph describing the current-source equivalent. No evidencesuggests Norton knew of Mayer's publication.
15http://www-gap.dcs.st-and.ac.uk/∼history/Mathematicians/Helmholtz.html16http://www.ece.rice.edu/∼dhj/norton

54 CHAPTER 3. ANALOG SIGNAL PROCESSING
3.8 Circuits with Capacitors and Inductors17
vin+
–
R
C vout+
–
Figure 3.23: A simple RC circuit.
Let's consider a circuit having something other than resistors and sources. Because of KVL, we know thatvin = vR + vout. The current through the capacitor is given by i = C d
dt (vout), and this current equals thatpassing through the resistor. Substituting vR = Ri into the KVL equation and using the v-i relation for thecapacitor, we arrive at
RCd
dt(vout) + vout = vin (3.11)
The input-output relation for circuits involving energy storage elements takes the form of an ordinary dier-ential equation, which we must solve to determine what the output voltage is for a given input. In contrastto resistive circuits, where we obtain an explicit input-output relation, we now have an implicit relation thatrequires more work to obtain answers.
At this point, we could learn how to solve dierential equations. Note rst that even nding the dierentialequation relating an output variable to a source is often very tedious. The parallel and series combinationrules that apply to resistors don't directly apply when capacitors and inductors occur. We would have to slogour way through the circuit equations, simplifying them until we nally found the equation that related thesource(s) to the output. At the turn of the twentieth century, a method was discovered that not only madending the dierential equation easy, but also simplied the solution process in the most common situation.Although not original with him, Charles Steinmetz18 presented the key paper describing the impedanceapproach in 1893. It allows circuits containing capacitors and inductors to be solved with the same methodswe have learned to solved resistor circuits. To use impedances, we must master complex numbers. Thoughthe arithmetic of complex numbers is mathematically more complicated than with real numbers, the increasedinsight into circuit behavior and the ease with which circuits are solved with impedances is well worth thediversion. But more importantly, the impedance concept is central to engineering and physics, having areach far beyond just circuits.
3.9 The Impedance Concept19
Rather than solving the dierential equation that arises in circuits containing capacitors and inductors, let'spretend that all sources in the circuit are complex exponentials having the same frequency. Although thispretense can only be mathematically true, this ction will greatly ease solving the circuit no matter whatthe source really is.
17This content is available online at <http://cnx.org/content/m0023/2.11/>.18http://www.invent.org/hall_of_fame/139.html19This content is available online at <http://cnx.org/content/m0024/2.22/>.

55
Simple Circuit
vin+
–
R
C vout+
–
Figure 3.24: A simple RC circuit.
Impedance
R+
–v
i
(a)
C+
–v
i
(b)
L+
–v
i
(c)
Figure 3.25: (a) Resistor: ZR = R (b) Capacitor: ZC = 1j2πfC
(c) Inductor: ZL = j2πfL
For the above example RC circuit (Figure 3.24 (Simple Circuit)), let vin = Vinej2πft. The complexamplitude Vin determines the size of the source and its phase. The critical consequence of assuming thatsources have this form is that all voltages and currents in the circuit are also complex exponentials, havingamplitudes governed by KVL, KCL, and the v-i relations and the same frequency as the source. To appreciatewhy this should be true, let's investigate how each circuit element behaves when either the voltage or currentis a complex exponential. For the resistor, v = Ri. When v = V ej2πft; then i = V
R ej2πft. Thus, if theresistor's voltage is a complex exponential, so is the current, with an amplitude I = V
R (determined by theresistor's v-i relation) and a frequency the same as the voltage. Clearly, if the current were assumed to be acomplex exponential, so would the voltage. For a capacitor, i = C d
dt (v). Letting the voltage be a complexexponential, we have i = CV j2πfej2πft. The amplitude of this complex exponential is I = CV j2πf . Finally,for the inductor, where v = L d
dt (i), assuming the current to be a complex exponential results in the voltagehaving the form v = LIj2πfej2πft, making its complex amplitude V = LIj2πf .
The major consequence of assuming complex exponential voltage and currents is that the ratio Z = VI
for each element does not depend on time, but does depend on source frequency. This quantity is known asthe element's impedance.
The impedance is, in general, a complex-valued, frequency-dependent quantity. For example, the magni-tude of the capacitor's impedance is inversely related to frequency, and has a phase of −
(π2
). This observation
means that if the current is a complex exponential and has constant amplitude, the amplitude of the voltagedecreases with frequency.
Let's consider Kircho's circuit laws. When voltages around a loop are all complex exponentials of the

56 CHAPTER 3. ANALOG SIGNAL PROCESSING
same frequency, we have ∑n (vn) =
∑n
(Vnej2πft
)= 0
(3.12)
which means ∑n
(Vn) = 0 (3.13)
the complex amplitudes of the voltages obey KVL. We can easily imagine that the complex amplitudes ofthe currents obey KCL.
What we have discovered is that source(s) equaling a complex exponential of the same frequency forcesall circuit variables to be complex exponentials of the same frequency. Consequently, the ratio of voltage tocurrent for each element equals the ratio of their complex amplitudes, which depends only on the source'sfrequency and element values.
This situation occurs because the circuit elements are linear and time-invariant. For example, suppose wehad a circuit element where the voltage equaled the square of the current: v (t) = Ki2 (t). If i (t) = Iej2πft,v (t) = KI2ej2π2ft, meaning that voltage and current no longer had the same frequency and that their ratiowas time-dependent.
Because for linear circuit elements the complex amplitude of voltage is proportional to the complexamplitude of current V = ZI assuming complex exponential sources means circuit elements behaveas if they were resistors, where instead of resistance, we use impedance. Because complex amplitudes forvoltage and current also obey Kircho's laws, we can solve circuits using voltage and current divider andthe series and parallel combination rules by considering the elements to be impedances.
3.10 Time and Frequency Domains20
When we nd the dierential equation relating the source and the output, we are faced with solving thecircuit in what is known as the time domain. What we emphasize here is that it is often easier to ndthe output if we use impedances. Because impedances depend only on frequency, we nd ourselves in thefrequency domain. A common error in using impedances is keeping the time-dependent part, the complexexponential, in the fray. The entire point of using impedances is to get rid of time and concentrate onfrequency. Only after we nd the result in the frequency domain do we go back to the time domain and putthings back together again.
To illustrate how the time domain, the frequency domain and impedances t together, consider the timedomain and frequency domain to be two work rooms. Since you can't be two places at the same time, youare faced with solving your circuit problem in one of the two rooms at any point in time. Impedances andcomplex exponentials are the way you get between the two rooms. Security guards make sure you don't tryto sneak time domain variables into the frequency domain room and vice versa. Figure 3.26 (Two Rooms)shows how this works.
As we unfold the impedance story, we'll see that the powerful use of impedances suggested by Steinmetz21
greatly simplies solving circuits, alleviates us from solving dierential equations, and suggests a general wayof thinking about circuits. Because of the importance of this approach, let's go over how it works.
1. Even though it's not, pretend the source is a complex exponential. We do this because the impedanceapproach simplies nding how input and output are related. If it were a voltage source having voltagevin = p (t) (a pulse), still let vin = Vinej2πft. We'll learn how to "get the pulse back" later.
2. With a source equaling a complex exponential, all variables in a linear circuit will also be complexexponentials having the same frequency. The circuit's only remaining "mystery" is what each variable'scomplex amplitude might be. To nd these, we consider the source to be a complex number (Vin here)and the elements to be impedances.
20This content is available online at <http://cnx.org/content/m10708/2.6/>.21http://www.invent.org/hall_of_fame/139.html

57
Two Rooms
time-domainroom
fOnly signals
differential equationsKVL, KCLsuperposition
frequency-domainroom
Only complex amplitudes
impedancestransfer functionsvoltage & current dividerKVL, KCLsuperposition
t
vin+
–
R
C vout+
–
vout(t) = … Vout = Vin•H(f)
v(t) = Ve j2πft
i(t) = Ie j2πft
Figure 3.26: The time and frequency domains are linked by assuming signals are complex exponentials.In the time domain, signals can have any form. Passing into the frequency domain 'work room", signalsare represented entirely by complex amplitudes.
3. We can now solve using series and parallel combination rules how the complex amplitude of any variablerelates to the sources complex amplitude.
Example 3.3To illustrate the impedance approach, we refer to the RC circuit (Figure 3.27 (Simple Circuits))below, and we assume that vin = Vinej2πft.
Using impedances, the complex amplitude of the output voltage Vout can be found using voltagedivider:
Vout =ZC
ZC + ZRVin
Vout =1
j2πfC1
j2πfC + RVin
Vout =1
j2πfRC + 1Vin
If we refer to the dierential equation for this circuit (shown in Circuits with Capacitors and Inductors(Section 3.8) to be RC d
dt (vout)+vout = vin), letting the output and input voltages be complex exponentials,we obtain the same relationship between their complex amplitudes. Thus, using impedances is equivalent tousing the dierential equation and solving it when the source is a complex exponential.

58 CHAPTER 3. ANALOG SIGNAL PROCESSING
Simple Circuits
vin+
–
R
C vout+
–
(a)
vin+
–vout
+
–ZC
ZR
(b)
Figure 3.27: (a) A simple RC circuit. (b) The impedance counterpart for the RC circuit. Note thatthe source and output voltage are now complex amplitudes.
In fact, we can nd the dierential equation directly using impedances. If we cross-multiply the relationbetween input and output amplitudes,
Vout (j2πfRC + 1) = Vin
and then put the complex exponentials back in, we have
RCj2πfVoutej2πft + Voute
j2πft = Vinej2πft
In the process of dening impedances, note that the factor j2πf arises from the derivative of a complexexponential. We can reverse the impedance process, and revert back to the dierential equation.
RCd
dt(vout) + vout = vin
This is the same equation that was derived much more tediously in Circuits with Capacitors and Inductors(Section 3.8). Finding the dierential equation relating output to input is far simpler when we use impedancesthan with any other technique.
Exercise 3.11 (Solution on p. 106.)
Suppose you had an expression where a complex amplitude was divided by j2πf . What time-domain operation corresponds to this division?
3.11 Power in the Frequency Domain22
Recalling that the instantaneous power consumed by a circuit element or an equivalent circuit that representsa collection of elements equals the voltage times the current entering the positive-voltage terminal, p (t) =v (t) i (t), what is the equivalent expression using impedances? The resulting calculation reveals more aboutpower consumption in circuits and the introduction of the concept of average power.
When all sources produce sinusoids of frequency f , the voltage and current for any circuit element orcollection of elements are sinusoids of the same frequency.
v (t) = |V | cos (2πft + φ)
i (t) = |I| cos (2πft + θ)
22This content is available online at <http://cnx.org/content/m17308/1.2/>.

59
Here, the complex amplitude of the voltage V equals |V |ejφ and that of the current is |I|ejθ. We can alsowrite the voltage and current in terms of their complex amplitudes using Euler's formula (Section 2.1.2:Euler's Formula).
v (t) = 12
(V ej2πft + V ∗e−(j2πft)
)i (t) = 1
2
(Iej2πft + I∗e−(j2πft)
)Multiplying these two expressions and simplifying gives
p (t) = 14
(V I∗ + V ∗I + V Iej4πft + V ∗I∗e−(j4πft)
)= 1
2Re (V I∗) + 12Re
(V Iej4πft
)= 1
2Re (V I∗) + 12 |V ||I| cos (4πft + φ + θ)
We dene 12V I∗ to be complex power. The real-part of complex power is the rst term and since it does
not change with time, it represents the power consistently consumed/produced by the circuit. The secondterm varies with time at a frequency twice that of the source. Conceptually, this term details how power"sloshes" back and forth in the circuit because of the sinusoidal source.
From another viewpoint, the real-part of complex power represents long-term energy consump-tion/production. Energy is the integral of power and, as the integration interval increases, the rst termappreciates while the time-varying term "sloshes." Consequently, the most convenient denition of the av-erage power consumed/produced by any circuit is in terms of complex amplitudes.
Pave =12Re (V I∗) (3.14)
Exercise 3.12 (Solution on p. 107.)
Suppose the complex amplitudes of the voltage and current have xed magnitudes. What phaserelationship between voltage and current maximizes the average power? In other words, how are φand θ related for maximum power dissipation?
Because the complex amplitudes of the voltage and current are related by the equivalent impedance, averagepower can also be written as
Pave =12Re (Z) (|I|)2 =
12Re(
1Z
)(|V |)2
These expressions generalize the results (3.3) we obtained for resistor circuits. We have derived a fundamentalresult: Only the real part of impedance contributes to long-term power dissipation. Of the circuit elements,only the resistor dissipates power. Capacitors and inductors dissipate no power in the long term. It isimportant to realize that these statements apply only for sinusoidal sources. If you turn on a constantvoltage source in an RC-circuit, charging the capacitor does consume power.
Exercise 3.13 (Solution on p. 107.)
In an earlier problem (Section 1.5.1: RMS Values), we found that the rms value of a sinusoid wasits amplitude divided by
√2. What is average power expressed in terms of the rms values of the
voltage and current (Vrms and Irms respectively)?
3.12 Equivalent Circuits: Impedances and Sources23
When we have circuits with capacitors and/or inductors as well as resistors and sources, Thévenin and Mayer-Norton equivalent circuits can still be dened by using impedances and complex amplitudes for voltage and
23This content is available online at <http://cnx.org/content/m0030/2.19/>.

60 CHAPTER 3. ANALOG SIGNAL PROCESSING
currents. For any circuit containing sources, resistors, capacitors, and inductors, the input-output relationfor the complex amplitudes of the terminal voltage and current is
V = ZeqI + Veq
I =V
Zeq− Ieq
with Veq = ZeqIeq. Thus, we have Thévenin and Mayer-Norton equivalent circuits as shown in Figure 3.28(Equivalent Circuits).
Example 3.4Let's nd the Thévenin and Mayer-Norton equivalent circuits for Figure 3.29 (Simple RC Circuit).
The open-circuit voltage and short-circuit current techniques still work, except we use impedancesand complex amplitudes. The open-circuit voltage corresponds to the transfer function we havealready found. When we short the terminals, the capacitor no longer has any eect on the circuit,and the short-circuit current Isc equals Vout
R . The equivalent impedance can be found by settingthe source to zero, and nding the impedance using series and parallel combination rules. In ourcase, the resistor and capacitor are in parallel once the voltage source is removed (setting it to zero
amounts to replacing it with a short-circuit). Thus, Zeq =(R ‖ 1
j2πfC
)= R
1+j2πfRC . Consequently,
we have
Veq =1
1 + j2πfRCVin
Ieq =1R
Vin
Zeq =R
1 + j2πfRC
Again, we should check the units of our answer. Note in particular that j2πfRC must be dimen-sionless. Is it?
3.13 Transfer Functions24
The ratio of the output and input amplitudes for Figure 3.30 (Simple Circuit), known as the transferfunction or the frequency response, is given by
Vout
Vin= H (f)
= 1j2πfRC+1
(3.15)
Implicit in using the transfer function is that the input is a complex exponential, and the output is also acomplex exponential having the same frequency. The transfer function reveals how the circuit modies theinput amplitude in creating the output amplitude. Thus, the transfer function completely describes how thecircuit processes the input complex exponential to produce the output complex exponential. The circuit'sfunction is thus summarized by the transfer function. In fact, circuits are often designed to meet transferfunction specications. Because transfer functions are complex-valued, frequency-dependent quantities, wecan better appreciate a circuit's function by examining the magnitude and phase of its transfer function(Figure 3.31 (Magnitude and phase of the transfer function)).
24This content is available online at <http://cnx.org/content/m0028/2.18/>.

61
Equivalent Circuits
veq+
–
Req+
–
v
i
Sourcesand
Resistors
+
–
v
i
+
–
v
i
Reqieq
Thévenin Equivalent Mayer-Norton Equivalent
(a) Equivalent circuits with resistors.
+
–
V
I
ZeqIeq
Mayer-Norton Equivalent
Veq+
–
Zeq+
–
V
I
Thévenin Equivalent
Sources,Resistors,
Capacitors,Inductors
+
–
V
I
(b) Equivalent circuits with impedances.
Figure 3.28: Comparing the rst, simpler, gure with the slightly more complicated second gure, wesee two dierences. First of all, more circuits (all those containing linear elements in fact) have equivalentcircuits that contain equivalents. Secondly, the terminal and source variables are now complex amplitudes,which carries the implicit assumption that the voltages and currents are single complex exponentials, allhaving the same frequency.

62 CHAPTER 3. ANALOG SIGNAL PROCESSING
Simple RC Circuit
Vin+
–
R
C
+
–
V
I
Figure 3.29
Simple Circuit
vin+
–
R
C vout+
–
Figure 3.30: A simple RC circuit.

63
Magnitude and phase of the transfer function
-1 0 1
1
1 / √ 2
|H(f)|
12πRC
12πRC
f
(a)
-1 1
π/ 4
–π/ 4
–π/ 2
π/ 2
∠H(f)
f0 1
2πRC1
2πRC
(b)
Figure 3.31: Magnitude and phase of the transfer function of the RC circuit shown in Figure 3.30(Simple Circuit) when RC = 1. (a) |H (f) | = 1√
(2πfRC)2+1(b) ∠ (H (f)) = − (arctan (2πfRC))
This transfer function has many important properties and provides all the insights needed to determinehow the circuit functions. First of all, note that we can compute the frequency response for both positive andnegative frequencies. Recall that sinusoids consist of the sum of two complex exponentials, one having thenegative frequency of the other. We will consider how the circuit acts on a sinusoid soon. Do note that themagnitude has even symmetry : The negative frequency portion is a mirror image of the positive frequencyportion: |H (−f) | = |H (f) |. The phase has odd symmetry : ∠ (H (−f)) = − (∠ (H (f))). These propertiesof this specic example apply for all transfer functions associated with circuits. Consequently, we don't needto plot the negative frequency component; we know what it is from the positive frequency part.
The magnitude equals 1√2of its maximum gain (1 at f = 0) when 2πfRC = 1 (the two terms in the

64 CHAPTER 3. ANALOG SIGNAL PROCESSING
denominator of the magnitude are equal). The frequency fc = 12πRC denes the boundary between two
operating ranges.
• For frequencies below this frequency, the circuit does not much alter the amplitude of the complexexponential source.
• For frequencies greater than fc, the circuit strongly attenuates the amplitude. Thus, when the sourcefrequency is in this range, the circuit's output has a much smaller amplitude than that of the source.
For these reasons, this frequency is known as the cuto frequency. In this circuit the cuto frequencydepends only on the product of the resistance and the capacitance. Thus, a cuto frequency of 1 kHz occurswhen 1
2πRC = 103 or RC = 10−3
2π = 1.59 × 10⁻⁴. Thus resistance-capacitance combinations of 1.59 kΩ and100 nF or 10 Ω and 1.59 µF result in the same cuto frequency.
The phase shift caused by the circuit at the cuto frequency precisely equals −(
π4
). Thus, below the
cuto frequency, phase is little aected, but at higher frequencies, the phase shift caused by the circuitbecomes −
(π2
). This phase shift corresponds to the dierence between a cosine and a sine.
We can use the transfer function to nd the output when the input voltage is a sinusoid for two reasons.First of all, a sinusoid is the sum of two complex exponentials, each having a frequency equal to the negativeof the other. Secondly, because the circuit is linear, superposition applies. If the source is a sine wave, weknow that
vin (t) = A sin (2πft)
= A2j
(ej2πft − e−(j2πft)
) (3.16)
Since the input is the sum of two complex exponentials, we know that the output is also a sum of two similarcomplex exponentials, the only dierence being that the complex amplitude of each is multiplied by thetransfer function evaluated at each exponential's frequency.
vout (t) =A
2jH (f) ej2πft − A
2jH (−f) e−(j2πft) (3.17)
As noted earlier, the transfer function is most conveniently expressed in polar form: H (f) = |H (f) |ej∠(H(f)).Furthermore, |H (−f) | = |H (f) | (even symmetry of the magnitude) and ∠ (H (−f)) = − (∠ (H (f))) (oddsymmetry of the phase). The output voltage expression simplies to
vout (t) = A2j |H (f) |ej2πft+∠(H(f)) − A
2j |H (f) |e−(j2πft)−∠(H(f))
= A|H (f) | sin (2πft + ∠ (H (f)))(3.18)
The circuit's output to a sinusoidal input is also a sinusoid, having a gain equal to the magnitude of thecircuit's transfer function evaluated at the source frequency and a phase equal to the phase of the transferfunction at the source frequency. It will turn out that this input-output relation description applies to anylinear circuit having a sinusoidal source.
Exercise 3.14 (Solution on p. 107.)
This input-output property is a special case of a more general result. Show that if the source canbe written as the imaginary part of a complex exponential vin (t) = Im
(V ej2πft
) the output
is given by vout (t) = Im(V H (f) ej2πft
). Show that a similar result also holds for the real part.
The notion of impedance arises when we assume the sources are complex exponentials. This assumptionmay seem restrictive; what would we do if the source were a unit step? When we use impedances to nd thetransfer function between the source and the output variable, we can derive from it the dierential equationthat relates input and output. The dierential equation applies no matter what the source may be. Aswe have argued, it is far simpler to use impedances to nd the dierential equation (because we can useseries and parallel combination rules) than any other method. In this sense, we have not lost anything bytemporarily pretending the source is a complex exponential.
In fact we can also solve the dierential equation using impedances! Thus, despite the apparent restric-tiveness of impedances, assuming complex exponential sources is actually quite general.

65
RL circuit
vin+
–
R+
–
v
i
L
iout
Figure 3.32
3.14 Designing Transfer Functions25
If the source consists of two (or more) signals, we know from linear system theory that the output voltageequals the sum of the outputs produced by each signal alone. In short, linear circuits are a special caseof linear systems, and therefore superposition applies. In particular, suppose these component signals arecomplex exponentials, each of which has a frequency dierent from the others. The transfer function portrayshow the circuit aects the amplitude and phase of each component, allowing us to understand how the circuitworks on a complicated signal. Those components having a frequency less than the cuto frequency passthrough the circuit with little modication while those having higher frequencies are suppressed. The circuitis said to act as a lter, ltering the source signal based on the frequency of each component complexexponential. Because low frequencies pass through the lter, we call it a lowpass lter to express moreprecisely its function.
We have also found the ease of calculating the output for sinusoidal inputs through the use of the transferfunction. Once we nd the transfer function, we can write the output directly as indicated by the output ofa circuit for a sinusoidal input (3.18).
Example 3.5Let's apply these results to a nal example, in which the input is a voltage source and the output
is the inductor current. The source voltage equals Vin = 2 cos (2π60t) + 3. We want the circuit topass constant (oset) voltage essentially unaltered (save for the fact that the output is a currentrather than a voltage) and remove the 60 Hz term. Because the input is the sum of two sinusoidsaconstant is a zero-frequency cosineour approach is
1. nd the transfer function using impedances;2. use it to nd the output due to each input component;3. add the results;4. nd element values that accomplish our design criteria.
Because the circuit is a series combination of elements, let's use voltage divider to nd the transferfunction between Vin and V , then use the v-i relation of the inductor to nd its current.
Iout
Vin=
j2πfL
R + j2πfL
1j2πfL
=1
j2πfL + R
= H (f)
(3.19)
25This content is available online at <http://cnx.org/content/m0031/2.20/>.

66 CHAPTER 3. ANALOG SIGNAL PROCESSING
where
voltage divider =j2πfL
R + j2πfL
and
inductor admittance =1
j2πfL
[Do the units check?] The form of this transfer function should be familiar; it is a lowpass lter,and it will perform our desired function once we choose element values properly.
The constant term is easiest to handle. The output is given by 3|H (0) | = 3R . Thus, the value we
choose for the resistance will determine the scaling factor of how voltage is converted into current.For the 60 Hz component signal, the output current is 2|H (60) | cos (2π60t + ∠ (H (60))). The totaloutput due to our source is
iout = 2|H (60) | cos (2π60t + ∠ (H (60))) + 3H (0) (3.20)
The cuto frequency for this lter occurs when the real and imaginary parts of the transfer function'sdenominator equal each other. Thus, 2πfcL = R, which gives fc = R
2πL . We want this cutofrequency to be much less than 60 Hz. Suppose we place it at, say, 10 Hz. This specication wouldrequire the component values to be related by R
L = 20π = 62.8. The transfer function at 60 Hzwould be ∣∣∣∣ 1
j2π60L + R
∣∣∣∣ = 1R
∣∣∣∣ 16j + 1
∣∣∣∣ = 1R
1√37≈ 0.16
1R
(3.21)
which yields an attenuation (relative to the gain at zero frequency) of about 1/6, and result in anoutput amplitude of 0.3
R relative to the constant term's amplitude of 3R . A factor of 10 relative
size between the two components seems reasonable. Having a 100 mH inductor would require a6.28 Ω resistor. An easily available resistor value is 6.8 Ω; thus, this choice results in cheaplyand easily purchased parts. To make the resistance bigger would require a proportionally largerinductor. Unfortunately, even a 1 H inductor is physically large; consequently low cuto frequenciesrequire small-valued resistors and large-valued inductors. The choice made here represents only onecompromise.
The phase of the 60 Hz component will very nearly be −(
π2
), leaving it to be
0.3R cos
(2π60t− π
2
)= 0.3
R sin (2π60t). The waveforms for the input and output are shown in Fig-ure 3.33 (Waveforms).
Note that the sinusoid's phase has indeed shifted; the lowpass lter not only reduced the 60 Hz signal'samplitude, but also shifted its phase by 90 .
3.15 Formal Circuit Methods: Node Method26
In some (complicated) cases, we cannot use the simplication techniquessuch as parallel or series com-bination rulesto solve for a circuit's input-output relation. In other modules, we wrote v-i relations andKircho's laws haphazardly, solving them more on intuition than procedure. We need a formal method thatproduces a small, easy set of equations that lead directly to the input-output relation we seek. One suchtechnique is the node method.
26This content is available online at <http://cnx.org/content/m0032/2.18/>.

67
Waveforms
0 0.10
1
2
3
4
5
Time (s)
Vol
tage
(v)
or
Cur
rent
(A
)inputvoltage
outputcurrent
Figure 3.33: Input and output waveforms for the example RL circuit when the element values areR = 6.28Ω and L = 100mH.
Node Voltage
vin+
–
R1
R2 R3
e1 e2
Figure 3.34
The node method begins by nding all nodesplaces where circuit elements attach to each otherin thecircuit. We call one of the nodes the reference node; the choice of reference node is arbitrary, but it isusually chosen to be a point of symmetry or the "bottom" node. For the remaining nodes, we dene nodevoltages en that represent the voltage between the node and the reference. These node voltages constitute

68 CHAPTER 3. ANALOG SIGNAL PROCESSING
the only unknowns; all we need is a sucient number of equations to solve for them. In our example, wehave two node voltages. The very act of dening node voltages is equivalent to using all the KVL equationsat your disposal. The reason for this simple, but astounding, fact is that a node voltage is uniquely denedregardless of what path is traced between the node and the reference. Because two paths between a nodeand reference have the same voltage, the sum of voltages around the loop equals zero.
In some cases, a node voltage corresponds exactly to the voltage across a voltage source. In such cases,the node voltage is specied by the source and is not an unknown. For example, in our circuit, e1 = vin;thus, we need only to nd one node voltage.
The equations governing the node voltages are obtained by writing KCL equations at each node havingan unknown node voltage, using the v-i relations for each element. In our example, the only circuit equationis
e2 − vin
R1+
e2
R2+
e2
R3= 0 (3.22)
A little reection reveals that when writing the KCL equations for the sum of currents leaving a node, thatnode's voltage will always appear with a plus sign, and all other node voltages with a minus sign. Systematicapplication of this procedure makes it easy to write node equations and to check them before solving them.Also remember to check units at this point: Every term should have units of current. In our example, solvingfor the unknown node voltage is easy:
e2 =R2R3
R1R2 + R1R2 + R2R3vin (3.23)
Have we really solved the circuit with the node method? Along the way, we have used KVL, KCL, andthe v-i relations. Previously, we indicated that the set of equations resulting from applying these laws isnecessary and sucient. This result guarantees that the node method can be used to "solve" any circuit.One fallout of this result is that we must be able to nd any circuit variable given the node voltages andsources. All circuit variables can be found using the v-i relations and voltage divider. For example, thecurrent through R3 equals e2
R3.
R1
R2
R3
e1 e2
iin
i
Figure 3.35
The presence of a current source in the circuit does not aect the node method greatly; just include itin writing KCL equations as a current leaving the node. The circuit has three nodes, requiring us to denetwo node voltages. The node equations are
e1
R1+
e1 − e2
R2− iin = 0 (Node 1)
e2 − e1
R2+
e2
R3= 0 (Node 2)

69
Note that the node voltage corresponding to the node that we are writing KCL for enters with a positivesign, the others with a negative sign, and that the units of each term is given in amperes. Rewrite theseequations in the standard set-of-linear-equations form.
e1
(1
R1+
1R2
)− e2
1R2
= iin
(−e1)1
R2+ e2
(1
R2+
1R3
)= 0
Solving these equations gives
e1 =R2 + R3
R3e2
e2 =R1R3
R1 + R2 + R3iin
To nd the indicated current, we simply use i = e2R3
.
Example 3.6: Node Method Example
e1 e2
i
vin+
–
1 1
1 1
2
Figure 3.36
In this circuit (Figure 3.36), we cannot use the series/parallel combination rules: The verticalresistor at node 1 keeps the two horizontal 1 Ω resistors from being in series, and the 2 Ω resistorprevents the two 1 Ω resistors at node 2 from being in series. We really do need the node methodto solve this circuit! Despite having six elements, we need only dene two node voltages. The nodeequations are
e1 − vin
1+
e1
1+
e1 − e2
1= 0 (Node 1)
e2 − vin
2+
e2
1+
e2 − e1
1= 0 (Node 2)
Solving these equations yields e1 = 25vin and e2 = 5
13vin. The output current equals e21 = 5
13vin.One unfortunate consequence of using the element's numeric values from the outset is that itbecomes impossible to check units while setting up and solving equations.
Exercise 3.15 (Solution on p. 107.)
What is the equivalent resistance seen by the voltage source?

70 CHAPTER 3. ANALOG SIGNAL PROCESSING
Node Method and Impedances
+
– C
R1
Vin R2
+
–
Vout
E
Figure 3.37: Modication of the circuit shown on the left to illustrate the node method and the eectof adding the resistor R2.
The node method applies to RLC circuits, without signicant modication from the methods used onsimple resistive circuits, if we use complex amplitudes. We rely on the fact that complex amplitudes satisfyKVL, KCL, and impedance-based v-i relations. In the example circuit, we dene complex amplitudes forthe input and output variables and for the node voltages. We need only one node voltage here, and its KCLequation is
E − Vin
R1+ Ej2πfC +
E
R2= 0
with the result
E =R2
R1 + R2 + j2πfR1R2CVin
To nd the transfer function between input and output voltages, we compute the ratio EVin
. The transferfunction's magnitude and angle are
|H (f) | = R2√(R1 + R2)
2 + (2πfR1R2C)2
∠ (H (f)) = −(
arctan(
2πfR1R2C
R1 + R2
))This circuit diers from the one shown previously (Figure 3.30: Simple Circuit) in that the resistor R2 hasbeen added across the output. What eect has it had on the transfer function, which in the original circuitwas a lowpass lter having cuto frequency fc = 1
2πR1C ? As shown in Figure 3.38 (Transfer Function),adding the second resistor has two eects: it lowers the gain in the passband (the range of frequencies forwhich the lter has little eect on the input) and increases the cuto frequency.

71
Transfer Function
0 10
1
f
|H(f)|
No R2
R1=1, R2=1
12πRC
12πR1C•
R1+R2R2
Figure 3.38: Transfer functions of the circuits shown in Figure 3.37 (Node Method and Impedances).Here, R1 = 1, R2 = 1, and C = 1.
When R2 = R1, as shown on the plot, the passband gain becomes half of the original, and the cutofrequency increases by the same factor. Thus, adding R2 provides a 'knob' by which we can trade passbandgain for cuto frequency.
Exercise 3.16 (Solution on p. 107.)
We can change the cuto frequency without aecting passband gain by changing the resistance inthe original circuit. Does the addition of the R2 resistor help in circuit design?
3.16 Power Conservation in Circuits27
Now that we have a formal methodthe node methodfor solving circuits, we can use it to prove a powerfulresult: KVL and KCL are all that are required to show that all circuits conserve power, regardless of whatelements are used to build the circuit.
27This content is available online at <http://cnx.org/content/m17317/1.1/>.

72 CHAPTER 3. ANALOG SIGNAL PROCESSING
Part of a general circuit to prove Conservation of Power
a
b c
1 2
3i3
i2i1
Figure 3.39
First of all, dene node voltages for all nodes in a given circuit. Any node chosen as the reference will do.For example, in the portion of a large circuit (Figure 3.39: Part of a general circuit to prove Conservationof Power) depicted here, we dene node voltages for nodes a, b and c. With these node voltages, we canexpress the voltage across any element in terms of them. For example, the voltage across element 1 is givenby v1 = eb − ea. The instantaneous power for element 1 becomes
v1i1 = (eb − ea) i1 = ebi1 − eai1
Writing the power for the other elements, we have
v2i2 = eci2 − eai2
v3i3 = eci3 − ebi3
When we add together the element power terms, we discover that once we collect terms involving a particularnode voltage, it is multiplied by the sum of currents leaving the node minus the sum of currents entering.For example, for node b, we have eb (i3 − i1). We see that the currents will obey KCL that multiply eachnode voltage. Consequently, we conclude that the sum of element powers must equal zero in any circuitregardless of the elements used to construct the circuit.∑
k
(vkik) = 0
The simplicity and generality with which we proved this results generalizes to other situations as well.In particular, note that the complex amplitudes of voltages and currents obey KVL and KCL, respectively.Consequently, we have that
∑k (VkIk) = 0. Furthermore, the complex-conjugate of currents also satises
KCL, which means we also have∑
k (VkIk∗) = 0. And nally, we know that evaluating the real-part of anexpression is linear. Finding the real-part of this power conservation gives the result that average power isalso conserved in any circuit. ∑
k
(12Re (VkIk∗)
)= 0
Note: This proof of power conservation can be generalized in another very interesting way. Allwe need is a set of voltages that obey KVL and a set of currents that obey KCL. Thus, for a givencircuit topology (the specic way elements are interconnected), the voltages and currents can bemeasured at dierent times and the sum of v-i products is zero.∑
k
(vk (t1) ik (t2)) = 0

73
Even more interesting is the fact that the elements don't matter. We can take a circuit and measureall the voltages. We can then make element-for-element replacements and, if the topology has notchanged, we can measure a set of currents. The sum of the product of element voltages and currentswill also be zero!
3.17 Electronics28
So far we have analyzed electrical circuits: The source signal has more power than the output variable,be it a voltage or a current. Power has not been explicitly dened, but no matter. Resistors, inductors,and capacitors as individual elements certainly provide no power gain, and circuits built of them will notmagically do so either. Such circuits are termed electrical in distinction to those that do provide powergain: electronic circuits. Providing power gain, such as your stereo reading a CD and producing sound, isaccomplished by semiconductor circuits that contain transistors. The basic idea of the transistor is to let theweak input signal modulate a strong current provided by a source of electrical powerthe power supplytoproduce a more powerful signal. A physical analogy is a water faucet: By turning the faucet back andforth, the water ow varies accordingly, and has much more power than expended in turning the handle.The waterpower results from the static pressure of the water in your plumbing created by the water utilitypumping the water up to your local water tower. The power supply is like the water tower, and the faucetis the transistor, with the turning achieved by the input signal. Just as in this analogy, a power supply is asource of constant voltage as the water tower is supposed to provide a constant water pressure.
A device that is much more convenient for providing gain (and other useful features as well) than thetransistor is the operational amplier, also known as the op-amp. An op-amp is an integrated circuit (acomplicated circuit involving several transistors constructed on a chip) that provides a large voltage gain ifyou attach the power supply. We can model the op-amp with a new circuit element: the dependent source.
3.18 Dependent Sources29
A dependent source is either a voltage or current source whose value is proportional to some other voltageor current in the circuit. Thus, there are four dierent kinds of dependent sources; to describe an op-amp, weneed a voltage-dependent voltage source. However, the standard circuit-theoretical model for a transistor30
contains a current-dependent current source. Dependent sources do not serve as inputs to a circuit likeindependent sources. They are used to model active circuits: those containing electronic elements. TheRLC circuits we have been considering so far are known as passive circuits.
28This content is available online at <http://cnx.org/content/m0035/2.8/>.29This content is available online at <http://cnx.org/content/m0053/2.13/>.30"Small Signal Model for Bipolar Transistor" <http://cnx.org/content/m1019/latest/>

74 CHAPTER 3. ANALOG SIGNAL PROCESSING
dependent sources
–
++
–
v kv
…
……
…
Figure 3.40: Of the four possible dependent sources, depicted is a voltage-dependent voltage sourcein the context of a generic circuit.
Figure 3.41 (op-amp) shows the circuit symbol for the op-amp and its equivalent circuit in terms of avoltage-dependent voltage source.
op-amp
–
+a
b
c–
+Rin G(ea–eb)
a
b
cRout
Figure 3.41: The op-amp has four terminals to which connections can be made. Inputs attach tonodes a and b, and the output is node c. As the circuit model on the right shows, the op-amp serves asan amplier for the dierence of the input node voltages.
Here, the output voltage equals an amplied version of the dierence of node voltages appearing acrossits inputs. The dependent source model portrays how the op-amp works quite well. As in most active circuitschematics, the power supply is not shown, but must be present for the circuit model to be accurate. Mostoperational ampliers require both positive and negative supply voltages for proper operation.
Because dependent sources cannot be described as impedances, and because the dependent variablecannot "disappear" when you apply parallel/series combining rules, circuit simplications such as currentand voltage divider should not be applied in most cases. Analysis of circuits containing dependent sourcesessentially requires use of formal methods, like the node method (Section 3.15). Using the node method forsuch circuits is not dicult, with node voltages dened across the source treated as if they were known (aswith independent sources). Consider the circuit shown on the top in Figure 3.42 (feedback op-amp).

75
feedback op-amp
–
+vin
+
– RL
RFR
vout
+
–
+
–RL
RFR
–
+Rin –Gv
Rout
vout
+
–
v
+
–
Figure 3.42: The top circuit depicts an op-amp in a feedback amplier conguration. On the bottomis the equivalent circuit, and integrates the op-amp circuit model into the circuit.
Note that the op-amp is placed in the circuit "upside-down," with its inverting input at the top andserving as the only input. As we explore op-amps in more detail in the next section, this conguration willappear again and again and its usefulness demonstrated. To determine how the output voltage is related tothe input voltage, we apply the node method. Only two node voltages v and voutneed be dened; theremaining nodes are across sources or serve as the reference. The node equations are
v − vin
R+
v
Rin+
v − vout
RF= 0 (3.24)
vout − (−G) v
Rout+
vout − v
RF+
vout
RL= 0 (3.25)
Note that no special considerations were used in applying the node method to this dependent-source circuit.Solving these to learn how vout relates to vin yields(
RF Rout
Rout −GRF
(1
Rout+
1Rin
+1
RL
)(1R
+1
Rin+
1RF
)− 1
RF
)vout =
1R
vin (3.26)
This expression represents the general input-output relation for this circuit, known as the standard feed-back conguration. Once we learn more about op-amps (Section 3.19), in particular what its typicalelement values are, the expression will simplify greatly. Do note that the units check, and that the parame-ter G of the dependent source is a dimensionless gain.

76 CHAPTER 3. ANALOG SIGNAL PROCESSING
3.19 Operational Ampliers31
Op-Amp
–
+a
b
c–
+Rin G(ea–eb)
a
b
cRout
Figure 3.43: The op-amp has four terminals to which connections can be made. Inputs attach tonodes a and b, and the output is node c. As the circuit model on the right shows, the op-amp serves asan amplier for the dierence of the input node voltages.
Op-amps not only have the circuit model shown in Figure 3.43 (Op-Amp), but their element values are veryspecial.
• The input resistance, Rin, is typically large, on the order of 1 MΩ.• The output resistance, Rout, is small, usually less than 100 Ω.• The voltage gain, G, is large, exceeding 105.
The large gain catches the eye; it suggests that an op-amp could turn a 1 mV input signal into a 100 V one.If you were to build such a circuitattaching a voltage source to node a, attaching node b to the reference,and looking at the outputyou would be disappointed. In dealing with electronic components, you cannotforget the unrepresented but needed power supply.
Unmodeled limitations imposed by power supplies: It is impossible for electronic compo-nents to yield voltages that exceed those provided by the power supply or for them to yield currentsthat exceed the power supply's rating.
Typical power supply voltages required for op-amp circuits are ± (15V ). Attaching the 1 mv signal notonly would fail to produce a 100 V signal, the resulting waveform would be severely distorted. While adesirable outcome if you are a rock & roll acionado, high-quality stereos should not distort signals. Anotherconsideration in designing circuits with op-amps is that these element values are typical: Careful control ofthe gain can only be obtained by choosing a circuit so that its element values dictate the resulting gain,which must be smaller than that provided by the op-amp.
31This content is available online at <http://cnx.org/content/m0036/2.28/>.

77
opamp
–
+vin
+
– RL
RFR
vout
+
–
+
–RL
RFR
–
+Rin –Gv
Rout
vout
+
–
v
+
–
Figure 3.44: The top circuit depicts an op-amp in a feedback amplier conguration. On the bottomis the equivalent circuit, and integrates the op-amp circuit model into the circuit.
3.19.1 Inverting Amplier
The feedback conguration shown in Figure 3.44 (opamp) is the most common op-amp circuit for obtainingwhat is known as an inverting amplier.(
RF Rout
Rout −GRF
(1
Rout+
1Rin
+1
RL
)(1R
+1
Rin+
1RF
)− 1
RF
)vout =
1R
vin (3.27)
provides the exact input-output relationship. In choosing element values with respect to op-amp character-istics, we can simplify the expression dramatically.
• Make the load resistance, RL, much larger than Rout. This situation drops the term 1RL
from thesecond factor of (3.27).
• Make the resistor, R, smaller than Rin, which means that the 1Rin
term in the third factor is negligible.
With these two design criteria, the expression ((3.27)) becomes(RF
Rout −GRF
(1R
+1
RF
)− 1
RF
)vout =
1R
vout (3.28)
Because the gain is large and the resistance Rout is small, the rst term becomes −(
1G
), leaving us with((
−(
1G
))(1R
+1
RF
)− 1
RF
)vout =
1R
vin (3.29)

78 CHAPTER 3. ANALOG SIGNAL PROCESSING
• If we select the values of RF and R so that (GR RF ), this factor will no longer depend on the
op-amp's inherent gain, and it will equal −(
1RF
).
Under these conditions, we obtain the classic input-output relationship for the op-amp-based inverting am-plier.
vout = −(
RF
Rvin
)(3.30)
Consequently, the gain provided by our circuit is entirely determined by our choice of the feedback resistorRF and the input resistor R. It is always negative, and can be less than one or greater than one inmagnitude. It cannot exceed the op-amp's inherent gain and should not produce such large outputs thatdistortion results (remember the power supply!). Interestingly, note that this relationship does not dependon the load resistance. This eect occurs because we use load resistances large compared to the op-amp'soutput resistance. Thus observation means that, if careful, we can place op-amp circuits in cascade, withoutincurring the eect of succeeding circuits changing the behavior (transfer function) of previous ones; see thisproblem (Problem 3.37).
3.19.2 Active Filters
As long as design requirements are met, the input-output relation for the inverting amplier also applieswhen the feedback and input circuit elements are impedances (resistors, capacitors, and inductors).
opamp
ZFZ
VinVout
+–
+
–+
–
Figure 3.45: VoutVin
= −“
ZFZ
”
Example 3.7Let's design an op-amp circuit that functions as a lowpass lter. We want the transfer functionbetween the output and input voltage to be
H (f) =K
1 + jffc
where K equals the passband gain and fc is the cuto frequency. Let's assume that the inversion(negative gain) does not matter. With the transfer function of the above op-amp circuit in mind,let's consider some choices.
• ZF = K, Z = 1 + jffc. This choice means the feedback impedance is a resistor and that the
input impedance is a series combination of an inductor and a resistor. In circuit design, wetry to avoid inductors because they are physically bulkier than capacitors.

79
• ZF = 11+ jf
fc
, Z = 1K . Consider the reciprocal of the feedback impedance (its admittance):
ZF−1 = 1 + jf
fc. Since this admittance is a sum of admittances, this expression suggests
the parallel combination of a resistor (value = 1 Ω) and a capacitor (value = 1fc
F ). Wehave the right idea, but the values (like 1 Ω) are not right. Consider the general RC parallelcombination; its admittance is 1
RF+j2πfC. Letting the input resistance equal R, the transfer
function of the op-amp inverting amplier now is H (f) = −(
RFR
1+j2πfRF C
)Thus, we have the gain equal to RF
R and the cuto frequency 1RF C .
Creating a specic transfer function with op-amps does not have a unique answer. As opposed to designwith passive circuits, electronics is more exible (a cascade of circuits can be built so that each has littleeect on the others; see Problem 3.37) and gain (increase in power and amplitude) can result. To completeour example, let's assume we want a lowpass lter that emulates what the telephone companies do. Signalstransmitted over the telephone have an upper frequency limit of about 3 kHz. For the second design choice,we require RF C = 3.3×10⁻⁴. Thus, many choices for resistance and capacitance values are possible. A 1 µFcapacitor and a 330 Ω resistor, 10 nF and 33 kΩ, and 10 pF and 33 MΩ would all theoretically work. Let'salso desire a voltage gain of ten: RF
R = 10, which means R = RF
10 . Recall that we must have R < Rin. As theop-amp's input impedance is about 1 MΩ, we don't want R too large, and this requirement means that thelast choice for resistor/capacitor values won't work. We also need to ask for less gain than the op-amp canprovide itself. Because the feedback "element" is an impedance (a parallel resistor capacitor combination),we need to examine the gain requirement more carefully. We must have |ZF |
R < 105 for all frequencies of
interest. Thus,RF
|1+j2πfRF C|R < 105. As this impedance decreases with frequency, the design specication of
RF
R = 10 means that this criterion is easily met. Thus, the rst two choices for the resistor and capacitorvalues (as well as many others in this range) will work well. Additional considerations like parts cost mightenter into the picture. Unless you have a high-power application (this isn't one) or ask for high-precisioncomponents, costs don't depend heavily on component values as long as you stay close to standard values.For resistors, having values r10d, easily obtained values of r are 1, 1.4, 3.3, 4.7, and 6.8, and the decadesspan 0-8.
Exercise 3.17 (Solution on p. 107.)
What is special about the resistor values; why these rather odd-appearing values for r?
3.19.3 Intuitive Way of Solving Op-Amp Circuits
When we meet op-amp design specications, we can simplify our circuit calculations greatly, so much so thatwe don't need the op-amp's circuit model to determine the transfer function. Here is our inverting amplier.
When we take advantage of the op-amp's characteristicslarge input impedance, large gain, and smalloutput impedancewe note the two following important facts.
• The current iin must be very small. The voltage produced by the dependent source is 105 times thevoltage v. Thus, the voltage v must be small, which means that iin = v
Rinmust be tiny. For example,
if the output is about 1 v, the voltage v = 10−5V , making the current iin = 10−11A. Consequently,we can ignore iin in our calculations and assume it to be zero.
• Because of this assumptionessentially no current ow through Rinthe voltage v must also beessentially zero. This means that in op-amp circuits, the voltage across the op-amp's input is basicallyzero.
Armed with these approximations, let's return to our original circuit as shown in Figure 3.47 (opamp).The node voltage e is essentially zero, meaning that it is essentially tied to the reference node. Thus, thecurrent through the resistor R equals vin
R . Furthermore, the feedback resistor appears in parallel with the

80 CHAPTER 3. ANALOG SIGNAL PROCESSING
opamp
vin+
–RL
RFR
–
+Rin –Gv
Routiin
iiF
vout
+
–
+
–
v
Figure 3.46
opamp
–
++
– RL
RFR
eiin=0
+
–
vout
+ –v
Figure 3.47
load resistor. Because the current going into the op-amp is zero, all of the current owing through R owsthrough the feedback resistor (iF = i)! The voltage across the feedback resistor v equals vinRF
R . Because theleft end of the feedback resistor is essentially attached to the reference node, the voltage across it equals thenegative of that across the output resistor: vout = −v = −
(vinRF
R
). Using this approach makes analyzing
new op-amp circuits much easier. When using this technique, check to make sure the results you obtainare consistent with the assumptions of essentially zero current entering the op-amp and nearly zero voltageacross the op-amp's inputs.
Example 3.8Let's try this analysis technique on a simple extension of the inverting amplier conguration
shown in Figure 3.48 (Two Source Circuit). If either of the source-resistor combinations were notpresent, the inverting amplier remains, and we know that transfer function. By superposition, weknow that the input-output relation is
vout = −(
RF
R1v(1)in
)− RF
R2v(2)in (3.31)

81
Two Source Circuit
–
++
– RL
RFR1
R2+
–vin(2)
vout
+
–
ei
+ –v
vin(1)
Figure 3.48: Two-source, single-output op-amp circuit example.
Diode
0.5 v (V)
i (µa)
1020304050
–0.5–1.0
+
–v
i
Figure 3.49: v-i relation and schematic symbol for the diode. Here, the diode parameters were roomtemperature and I0 = 1 µA.
When we start from scratch, the node joining the three resistors is at the same potential as thereference, e ≈ 0, and the sum of currents owing into that node is zero. Thus, the current i owing
in the resistor RF equals v(1)in
R1+ v
(2)in
R2. Because the feedback resistor is essentially in parallel with the
load resistor, the voltages must satisfy v = −vout. In this way, we obtain the input-output relationgiven above.
What utility does this circuit have? Can the basic notion of the circuit be extended withoutbound?
3.20 The Diode32
The resistor, capacitor, and inductor are linear circuit elements in that their v-i relations are linear in themathematical sense. Voltage and current sources are (technically) nonlinear devices: stated simply, doublingthe current through a voltage source does not double the voltage. A more blatant, and very useful, nonlinear
32This content is available online at <http://cnx.org/content/m0037/2.14/>.

82 CHAPTER 3. ANALOG SIGNAL PROCESSING
circuit element is the diode (learn more33). Its input-output relation has an exponential form.
i (t) = I0
(e
qkT v(t) − 1
)(3.32)
Here, the quantity q represents the charge of a single electron in coulombs, k is Boltzmann's constant, andT is the diode's temperature in K. At room temperature, the ratio kT
q = 25mv. The constant I0 is theleakage current, and is usually very small. Viewing this v-i relation in Figure 3.49 (Diode), the nonlinearitybecomes obvious. When the voltage is positive, current ows easily through the diode. This situation isknown as forward biasing. When we apply a negative voltage, the current is quite small, and equals I0,known as the leakage or reverse-bias current. A less detailed model for the diode has any positive currentowing through the diode when it is forward biased, and no current when negative biased. Note that thediode's schematic symbol looks like an arrowhead; the direction of current ow corresponds to the directionthe arrowhead points.
diode circuit
vin+
–R
+
–
vout
Figure 3.50
Because of the diode's nonlinear nature, we cannot use impedances nor series/parallel combination rulesanalyze circuits containing them. The reliable node method can always be used; it only relies on KVL forits application, and KVL is a statement about voltage drops around a closed path regardless of whether theelements are linear or not. Thus, for this simple circuit we have
vout
R= I0
(e
qkT (vin−vout) − 1
)(3.33)
This equation cannot be solved in closed form. We must understand what is going on from basic principles,using computational and graphical aids. As an approximation, when vin is positive, current ows throughthe diode so long as the voltage vout is smaller than vin (so the diode is forward biased). If the source isnegative or vout "tries" to be bigger than vin, the diode is reverse-biased, and the reverse-bias current owsthrough the diode. Thus, at this level of analysis, positive input voltages result in positive output voltageswith negative ones resulting in vout = − (RI0).
33"P-N Junction: Part II" <http://cnx.org/content/m1004/latest/>

83
diode circuit
voutR
vin' vin"vout
idiode
vout'
vout"
vout
vin
t
Figure 3.51
We need to detail the exponential nonlinearity to determine how the circuit distorts the input voltagewaveform. We can of course numerically solve Figure 3.50 (diode circuit) to determine the output voltagewhen the input is a sinusoid. To learn more, let's express this equation graphically. We plot each term as afunction of vout for various values of the input voltage vin; where they intersect gives us the output voltage.The left side, the current through the output resistor, does not vary itself with vin, and thus we have a xedstraight line. As for the right side, which expresses the diode's v-i relation, the point at which the curvecrosses the vout axis gives us the value of vin. Clearly, the two curves will always intersect just once for anyvalue of vin, and for positive vin the intersection occurs at a value for vout smaller than vin. This reductionis smaller if the straight line has a shallower slope, which corresponds to using a bigger output resistor. Fornegative vin, the diode is reverse-biased and the output voltage equals − (RI0).
What utility might this simple circuit have? The diode's nonlinearity cannot be escaped here, and theclearly evident distortion must have some practical application if the circuit were to be useful. This circuit,known as a half-wave rectier, is present in virtually every AM radio twice and each serves very dierentfunctions! We'll learn what functions later.
diode circuit
–
+vin+
–
R
+
–
vout
Figure 3.52
Here is a circuit involving a diode that is actually simpler to analyze than the previous one. We know that

84 CHAPTER 3. ANALOG SIGNAL PROCESSING
the current through the resistor must equal that through the diode. Thus, the diode's current is proportionalto the input voltage. As the voltage across the diode is related to the logarithm of its current, we see thatthe input-output relation is
vout = −(
kT
qln(
vin
RI0+ 1))
(3.34)
Clearly, the name logarithmic amplier is justied for this circuit.
3.21 Analog Signal Processing Problems34
Problem 3.1: Solving Simple Circuits
a) Write the set of equations that govern Circuit A's (Figure 3.53) behavior.b) Solve these equations for i1: In other words, express this current in terms of element and source values
by eliminating non-source voltages and currents.c) For Circuit B, nd the value for RL that results in a current of 5 A passing through it.d) What is the power dissipated by the load resistor RL in this case?
vin
R2
R1
i1+
–iin
(a) Circuit A
RL20Ω15 A
(b) Circuit B
Figure 3.53
Problem 3.2: Equivalent ResistanceFor each of the following circuits (Figure 3.54), nd the equivalent resistance using series and parallelcombination rules.
Calculate the conductance seen at the terminals for circuit (c) in terms of each element's conductance.Compare this equivalent conductance formula with the equivalent resistance formula you found for circuit(b). How is the circuit (c) derived from circuit (b)?
Problem 3.3: Superposition PrincipleOne of the most important consequences of circuit laws is the Superposition Principle: The currentor voltage dened for any element equals the sum of the currents or voltages produced in the element bythe independent sources. This Principle has important consequences in simplifying the calculation of ciruitvariables in multiple source circuits.
a) For the depicted circuit (Figure 3.55), nd the indicated current using any technique you like (youshould use the simplest).
34This content is available online at <http://cnx.org/content/m10349/2.37/>.

85
R1
R2
R3 R4
R5
(a) circuit a
R1
R2 R3
R4
(b) circuit b
R1R2
R3
R4
(c) circuit c
1
1
1
11 1 1
(d) circuit d
Figure 3.54
vin+
–iin
1/2
1
1/2
1/2
i
Figure 3.55
b) You should have found that the current i is a linear combination of the two source values: i =C1vin+C2iin. This result means that we can think of the current as a superposition of two components,each of which is due to a source. We can nd each component by setting the other sources to zero.Thus, to nd the voltage source component, you can set the current source to zero (an open circuit) anduse the usual tricks. To nd the current source component, you would set the voltage source to zero(a short circuit) and nd the resulting current. Calculate the total current i using the SuperpositionPrinciple. Is applying the Superposition Principle easier than the technique you used in part (1)?
Problem 3.4: Current and Voltage DividerUse current of voltage divider rules to calculate the indicated circuit variables in Figure 3.56.

86 CHAPTER 3. ANALOG SIGNAL PROCESSING
7sin 5t+
–
3 6
1
4
+
–
vout
(a) circuit a
6 6
2
1 i
(b) circuit c
120+
–
6
180
12
5
i
4820
(c) circuit b
Figure 3.56
Problem 3.5: Thévenin and Mayer-Norton EquivalentsFind the Thévenin and Mayer-Norton equivalent circuits for the following circuits (Figure 3.57).
3 1 2
2π
(a) circuit a
+
–+ –
1
1 1
1
1.5 v
(b) circuit b
10
3
6
20
2
+
–+
–
20 sin 5t
(c) circuit c
Figure 3.57
Problem 3.6: Detective WorkIn the depicted circuit (Figure 3.58), the circuit N1 has the v-i relation v1 = 3i1 + 7 when is = 2.
a) Find the Thévenin equivalent circuit for circuit N2.

87
b) With is = 2, determine R such that i1 = −1.
N25+
–is
R
1
+
–
v1
i1N1
Figure 3.58
Problem 3.7: Cartesian to Polar ConversionConvert the following expressions into polar form. Plot their location in the complex plane35.
a)(1 +
√−3)2
b) 3 + j4
c)2−j 6√
3
2+j 6√3
d)(4− j3
) (1 + j 1
2
)e) 3ejπ + 4ej π
2
f)(√
3 + j)2√
2e−(j π4 )
g) 31+j3π
Problem 3.8: The Complex PlaneThe complex variable z is related to the real variable u according to
z = 1 + eju
• Sketch the contour of values z takes on in the complex plane.• What are the maximum and minimum values attainable by |z|?• Sketch the contour the rational function z−1
z+1 traces in the complex plane.
Problem 3.9: Cool CurvesIn the following expressions, the variable x runs from zero to innity. What geometric shapes do thefollowing trace in the complex plane?
a) ejx
b) 1 + ejx
c) e−xejx
d) ejx + ej(x+ π4 )
Problem 3.10: Trigonometric Identities and Complex ExponentialsShow the following trigonometric identities using complex exponentials. In many cases, they were derivedusing this approach.
35"The Complex Plane" <http://cnx.org/content/m10596/latest/>

88 CHAPTER 3. ANALOG SIGNAL PROCESSING
a) sin (2u) = 2 sin (u) cos (u)b) cos2 (u) = 1+cos(2u)
2
c) cos2 (u) + sin2 (u) = 1d) d
du (sin (u)) = cos (u)
Problem 3.11: Transfer FunctionsFind the transfer function relating the complex amplitudes of the indicated variable and the source shownin Figure 3.59. Plot the magnitude and phase of the transfer function.
vin+
–
1
1 2
+
–
v
(a) circuit a
vin+
–
1
2
+
–
v
(b) circuit b
ioutvin+
–
11
4
(c) circuit c
ioutvin+
–
11
1
(d) circuit d
Figure 3.59
Problem 3.12: Using ImpedancesFind the dierential equation relating the indicated variable to the source(s) using impedances for eachcircuit shown in Figure 3.60.
Problem 3.13: Transfer FunctionsIn the following circuit (Figure 3.61), the voltage source equals vin (t) = 10 sin
(t2
).
a) Find the transfer function between the source and the indicated output voltage.b) For the given source, nd the output voltage.
Problem 3.14: A Simple CircuitYou are given this simple circuit (Figure 3.62).
a) What is the transfer function between the source and the indicated output current?b) If the output current is measured to be cos (2t), what was the source?
Problem 3.15: Circuit Design

89
iout
vin+
R1
L
C
R2
(a) circuit a
vin+
–
R1
Liout
iinC
R2
(b) circuit b
+
–
v
L1
iin CR L2
(c) circuit c
iin 21 1
1
1
i
(d) circuit d
Figure 3.60
+
–
+
–
vout
1
2 4vin
Figure 3.61
1
iout
iin
12
12
12
Figure 3.62

90 CHAPTER 3. ANALOG SIGNAL PROCESSING
L
R
Cvin+
–
+
–
vout
Figure 3.63
a) Find the transfer function between the input and the output voltages for the circuits shown in Fig-ure 3.63.
b) At what frequency does the transfer function have a phase shift of zero? What is the circuit's gain atthis frequency?
c) Specications demand that this circuit have an output impedance (its equivalent impedance) less than8Ω for frequencies above 1 kHz, the frequency at which the transfer function is maximum. Find elementvalues that satisfy this criterion.
Problem 3.16: Power TransmissionThe network shown in Figure 3.64(a) represents a simple power transmission system. The generator produces60 Hz and is modeled by a simple Thévenin equivalent. The transmission line consists of a long length ofcopper wire and can be accurately described as a 50Ω resistor.
a) Determine the load current RL and the average power the generator must produce so that the loadreceives 1,000 watts of average power. Why does the generator need to generate more than 1,000 wattsof average power to meet this requirement?
b) Suppose the load is changed to that shown in Figure 3.64(b). Now how much power must the generatorproduce to meet the same power requirement? Why is it more than it had to produce to meet therequirement for the resistive load?
c) The load can be compensated to have a unity power factor (see exercise (Exercise 3.13)) so thatthe voltage and current are in phase for maximum power eciency. The compensation technique is toplace a circuit in parallel to the load circuit. What element works and what is its value?
d) With this compensated circuit, how much power must the generator produce to deliver 1,000 averagepower to the load?

91
IL
Vg
+Rs RT
100
power generator lossy power transmission line
load
(a) Simple power transmission system
1001
(b) Modied load cir-cuit
Figure 3.64
Problem 3.17: Optimal Power TransmissionThe following gure (Figure 3.65) shows a general model for power transmission. The power generator isrepresented by a Thévinin equivalent and the load by a simple impedance. In most applications, the sourcecomponents are xed while there is some latitude in choosing the load.
a) Suppose we wanted the maximize "voltage transmission:" make the voltage across the load as large aspossible. What choice of load impedance creates the largest load voltage? What is the largest loadvoltage?
b) If we wanted the maximum current to pass through the load, what would we choose the load impedanceto be? What is this largest current?
c) What choice for the load impedance maximizes the average power dissipated in the load? What ismost power the generator can deliver?
Note: One way to maximize a function of a complex variable is to write the expression interms of the variable's real and imaginary parts, evaluate derivatives with respect to each, set bothderivatives to zero and solve the two equations simultaneously.
Vg+
Zg
ZL
Figure 3.65
Problem 3.18: Sharing a ChannelTwo transmitter-receiver pairs want to share the same digital communications channel. The transmittersignals will be added together by the channel. Receiver design is greatly simplied if rst we remove theunwanted transmission (as much as possible). Each transmitter signal has the form
xi (t) = A sin (2πfit) , 0 ≤ t ≤ T

92 CHAPTER 3. ANALOG SIGNAL PROCESSING
where the amplitude is either zero or A and each transmitter uses its own frequency fi. Each frequency isharmonically related to the bit interval duration T , where the transmitter 1 uses the the frequency 1
T . Thedatarate is 10Mbps.
a) Draw a block diagram that expresses this communication scenario.b) Find circuits that the receivers could employ to separate unwanted transmissions. Assume the received
signal is a voltage and the output is to be a voltage as well.c) Find the second transmitter's frequency so that the receivers can suppress the unwanted transmission
by at least a factor of ten.
Problem 3.19: Circuit Detective WorkIn the lab, the open-circuit voltage measured across an unknown circuit's terminals equals sin (t). When a1 Ω resistor is place across the terminals, a voltage of 1√
2sin(t + π
4
)appears.
a) What is the Thévenin equivalent circuit?b) What voltage will appear if we place a 1 F capacitor across the terminals?
Problem 3.20: More Circuit Detective WorkThe left terminal pair of a two terminal-pair circuit is attached to a testing circuit. The test source vin (t)equals sin (t) (Figure 3.66).
Circuit
+
–
v
i
+
–
1
vin
Figure 3.66
We make the following measurements.
• With nothing attached to the terminals on the right, the voltage v (t) equals 1√2
cos(t + π
4
).
• When a wire is placed across the terminals on the right, the current i (t) was − (sin (t)).
a) What is the impedance seen from the terminals on the right?b) Find the voltage v (t) if a current source is attached to the terminals on the right so that i (t) = sin (t).
Problem 3.21: Linear, Time-Invariant SystemsFor a system to be completely characterized by a transfer function, it needs not only be linear, but alsoto be time-invariant. A system is said to be time-invariant if delaying the input delays the output by thesame amount. Mathematically, if S (x (t)) = y (t), meaning y (t) is the output of a system S (•) when x (t)is the input, S (•) is the time-invariant if S (x (t− τ)) = y (t− τ) for all delays τ and all inputs x (t). Notethat both linear and nonlinear systems have this property. For example, a system that squares its input istime-invariant.
a) Show that if a circuit has xed circuit elements (their values don't change over time), its input-outputrelationship is time-invariant. Hint: Consider the dierential equation that describes a circuit's input-output relationship. What is its general form? Examine the derivative(s) of delayed signals.
b) Show that impedances cannot characterize time-varying circuit elements (R, L, and C). Consequently,show that linear, time-varying systems do not have a transfer function.

93
c) Determine the linearity and time-invariance of the following. Find the transfer function of the linear,time-invariant (LTI) one(s).
i) diodeii) y (t) = x (t) sin (2πf0t)iii) y (t) = x (t− τ0)iv) y (t) = x (t) + N (t)
Problem 3.22: Long and Sleepless NightsSammy went to lab after a long, sleepless night, and constructed the circuit shown in Figure 3.67.
He cannot remember what the circuit, represented by the impedance Z, was. Clearly, this forgottencircuit is important as the output is the current passing through it.
a) What is the Thévenin equivalent circuit seen by the impedance?b) In searching his notes, Sammy nds that the circuit is to realize the transfer function
H (f) =1
j10πf + 2
Find the impedance Z as well as values for the other circuit elements.
+
– C
R
v in
iout
Z
Figure 3.67
Problem 3.23: A Testing CircuitThe simple circuit here (Figure 3.68) was given on a test.
1vin+
–
+
–
vout
Zi(t)
Figure 3.68
When the votlage source is√
5 sin (t), the current i (t) =√
2 cos(t− arctan (2)− π
4
).
a) What is voltage vout (t)?

94 CHAPTER 3. ANALOG SIGNAL PROCESSING
b) What is the impedance Z at the frequency of the source?
Problem 3.24: Mystery CircuitYou are given a circuit (Figure 3.69) that has two terminals for attaching circuit elements.
Circuit
+
–
v(t)
i(t)
Figure 3.69
When you attach a voltage source equaling sin (t) to the terminals, the current through the source equals4 sin
(t + π
4
)− 2 sin (4t). When no source is attached (open-circuited terminals), the voltage across the
terminals has the form A sin (4t + φ).
a) What will the terminal current be when you replace the source by a short circuit?b) If you were to build a circuit that was identical (from the viewpoint of the terminals) to the given one,
what would your circuit be?c) For your circuit, what are A and φ?
Problem 3.25: Mystery CircuitSammy must determine as much as he can about a mystery circuit by attaching elements to the terminaland measuring the resulting voltage. When he attaches a 1 Ω resistor to the circuit's terminals, he measuresthe voltage across the terminals to be 3 sin (t). When he attaches a 1 F capacitor across the terminals, thevoltage is now 3
√2 sin
(t− π
4
).
a) What voltage should he measure when he attaches nothing to the mystery circuit?b) What voltage should Sammy measure if he doubled the size of the capacitor to 2 F and attached it to
the circuit?
Problem 3.26: Find the Load ImpedanceThe depicted circuit (Figure 3.70) has a transfer function between the output voltage and the source equalto
H (f) =−8π2f2
−8π2f2 + 4 + j6πf.

95
1/2
4vin+
–
+
–
voutZL
Figure 3.70
a) Sketch the magnitude and phase of the transfer function.b) At what frequency does the phase equal π
2 ?c) Find a circuit that corresponds to this load impedance. Is your answer unique? If so, show it to be so;
if not, give another example.
Problem 3.27: Analog Hum RejectionHum refers to corruption from wall socket power that frequently sneaks into circuits. Hum gets its namebecause it sounds like a persistent humming sound. We want to nd a circuit that will remove hum fromany signal. A Rice engineer suggests using a simple voltage divider circuit (Figure 3.71) consisting of twoseries impedances.
Vin+
– Z2
Z1
Vout
+
–
Figure 3.71
a) The impedance Z1 is a resistor. The Rice engineer must decide between two circuits (Figure 3.72) forthe impedance Z2. Which of these will work?
b) Picking one circuit that works, choose circuit element values that will remove hum.c) Sketch the magnitude of the resulting frequency response.

96 CHAPTER 3. ANALOG SIGNAL PROCESSING
CC
L
L
Figure 3.72
Problem 3.28: An Interesting Circuit
6
iin
+ –vout
2
3
1
Figure 3.73
a) For the circuit shown in Figure 3.73, nd the transfer function.b) What is the output voltage when the input has the form iin = 5 sin (2000πt)?
Problem 3.29: A CircuitYou are given the depicted circuit (Figure 3.74).
1
iin
+ –vout
1
1
11
Figure 3.74

97
a) What is the transfer function between the source and the output voltage?b) What will the voltage be when the source equals sin (t)?c) Many function generators produce a constant oset in addition to a sinusoid. If the source equals
1 + sin (t), what is the output voltage?
Problem 3.30: An Interesting and Useful CircuitThe depicted circuit (Figure 3.75) has interesting properties, which are exploited in high-performanceoscilloscopes.
R1
C1
probe
C2R2
+
–
vin
oscilloscope+
–
vout
Figure 3.75
The portion of the circuit labeled "Oscilloscope" represents the scope's input impedance. R2 = 1MΩand C2 = 30pF (note the label under the channel 1 input in the lab's oscilloscopes). A probe is a device toattach an oscilloscope to a circuit, and it has the indicated circuit inside it.
a) Suppose for a moment that the probe is merely a wire and that the oscilloscope is attached to a circuitthat has a resistive Thévenin equivalent impedance. What would be the eect of the oscilloscope'sinput impedance on measured voltages?
b) Using the node method, nd the transfer function relating the indicated voltage to the source whenthe probe is used.
c) Plot the magnitude and phase of this transfer function when R1 = 9MΩ and C1 = 2pF .d) For a particular relationship among the element values, the transfer function is quite simple. Find that
relationship and describe what is so special about it.e) The arrow through C1 indicates that its value can be varied. Select the value for this capacitor to
make the special relationship valid. What is the impedance seen by the circuit being measured for thisspecial value?
Problem 3.31: A Circuit ProblemYou are given the depicted circuit (Figure 3.76).
a) Find the dierential equation relating the output voltage to the source.b) What is the impedance seen by the capacitor?
Problem 3.32: Analog ComputersBecause the dierential equations arising in circuits resemble those that describe mechanical motion, wecan use circuit models to describe mechanical systems. An ELEC 241 student wants to understand thesuspension system on his car. Without a suspension, the car's body moves in concert with the bumps in theraod. A well-designed suspension system will smooth out bumpy roads, reducing the car's vertical motion.

98 CHAPTER 3. ANALOG SIGNAL PROCESSING
1/3
2
1/6
+ –v
vin 4+
–
Figure 3.76
+
–
+
vcar
1
vroad 1 1
–
+
–
+
vcar
1
vroad 1 1
–
Figure 3.77
If the bumps are very gradual (think of a hill as a large but very gradual bump), the car's vertical motionshould follow that of the road. The student wants to nd a simple circuit that will model the car's motion.He is trying to decide between two circuit models (Figure 3.77).
Here, road and car displacements are represented by the voltages vroad (t) and vcar (t), respectively.
a) Which circuit would you pick? Why?b) For the circuit you picked, what will be the amplitude of the car's motion if the road has a displacement
given by vroad (t) = 1 + sin (2t)?
Problem 3.33: Dependent SourcesFind the voltage vout in each of the depicted circuits (Figure 3.78).Problem 3.34: Transfer Functions and CircuitsYou are given the depicted network (Figure 3.79).

99
iin R1 R2 RL
+
–
voutβib
ib
(a) circuit a
–
++
––61
1/3 3+
–
vout 3i
i
(b) circuit b
Figure 3.78
+
–
+
–
vout
1/4
2vin 3/4
Figure 3.79
a) Find the transfer function between Vin and Vout.b) Sketch the magnitude and phase of your transfer function. Label important frequency, amplitude and
phase values.c) Find vout (t) when vin (t) = sin
(t2 + π
4
).
Problem 3.35: Fun in the LabYou are given an unopenable box that has two terminals sticking out. You assume the box contains acircuit. You measure the voltage sin
(t + π
4
)across the terminals when nothing is connected to them and
the current√
2 cos (t) when you place a wire across the terminals.
a) Find a circuit that has these characteristics.b) You attach a 1 H inductor across the terminals. What voltage do you measure?
Problem 3.36: Operational AmpliersFind the transfer function between the source voltage(s) and the indicated output voltage for the circuitsshown in Figure 3.80.

100 CHAPTER 3. ANALOG SIGNAL PROCESSING
—
+
R1R2
+
–
vin
+
–
vout
(a) op-amp a
+
–
V(1)in
–
+
R1R2
R3
R4Vout
+
– +
– V(2)in
(b) op-amp b
–
+
+– 10
5
5Vin Vout
+
–
(c) op-amp c
–
+
vin+
–
+
–
vout44
12
2
1
12
(d) op-amp d
Figure 3.80
Problem 3.37: Why Op-Amps are UsefulThe circuit (Figure 3.81) of a cascade of op-amp circuits illustrate the reason why op-amp realizations oftransfer functions are so useful.
a) Find the transfer function relating the complex amplitude of the voltage vout (t) to the source. Showthat this transfer function equals the product of each stage's transfer function.
b) What is the load impedance appearing across the rst op-amp's output?c) Figure 3.82 illustrates that sometimes designs can go wrong. Find the transfer function for this
op-amp circuit (Figure 3.82), and then show that it can't work! Why can't it?

101
Z2
Z1Z3
Z4
VinVout
+–
+
–
+
–+
–
Figure 3.81
–
+
vin
+
–
vout4.7 kΩ
1 kΩ 10 nF
1 µF
+–
Figure 3.82
Problem 3.38: Operational AmpliersConsider the depicted circuit (Figure 3.83).
a) Find the transfer function relating the voltage vout (t) to the source.b) In particular, R1 = 530Ω, C1 = 1µF , R2 = 5.3kΩ, C2 = 0.01µF , and R3 = R4 = 5.3kΩ. Characterize
the resulting transfer function and determine what use this circuit might have.
Problem 3.39: Designing a Bandpass FilterWe want to design a bandpass lter that has transfer the function
H (f) = 10j2πf(
j ffl
+ 1)(
j ffh
+ 1)
Here, fl is the cuto frequency of the low-frequency edge of the passband and fh is the cuto frequency ofthe high-frequency edge. We want fl = 1kHz and fh = 10kHz.
a) Plot the magnitude and phase of this frequency response. Label important amplitude and phase valuesand the frequencies at which they occur.

102 CHAPTER 3. ANALOG SIGNAL PROCESSING
–
++–
–
+
R1
R2
Vout
Vin
C1
R3
R4 C2
+
–
Figure 3.83
b) Design a bandpass lter that meets these specications. Specify component values.
Problem 3.40: Pre-emphasis or De-emphasis?In audio applications, prior to analog-to-digital conversion signals are passed through what is known asa pre-emphasis circuit that leaves the low frequencies alone but provides increasing gain at increasinglyhigher frequencies beyond some frequency f0. De-emphasis circuits do the opposite and are applied afterdigital-to-analog conversion. After pre-emphasis, digitization, conversion back to analog and de-emphasis,the signal's spectrum should be what it was.
The op-amp circuit here (Figure 3.84) has been designed for pre-emphasis or de-emphasis (Samanthacan't recall which).
C
R
+
–
–
+Vin Vout
+
–
RF
R = 1 kΩRF = 1 kΩC = 80 nF
Figure 3.84
a) Is this a pre-emphasis or de-emphasis circuit? Find the frequency f0 that denes the transition fromlow to high frequencies.
b) What is the circuit's output when the input voltage is sin (2πft), with f = 4kHz?c) What circuit could perform the opposite function to your answer for the rst part?

103
Problem 3.41: Active FilterFind the transfer function of the depicted active lter (Figure 3.85).
–
+
R2 C2Vin+
–
R1
C1
R
R
–
+
R1
R2
–
+
Rf
Vout
Figure 3.85
Problem 3.42: This is a lter?You are given a circuit (Figure 3.86).
–
+
R1R2
+
–
Vin
+
–
Vout
C
Rin
Figure 3.86
a) What is this circuit's transfer function? Plot the magnitude and phase.b) If the input signal is the sinusoid sin (2πf0t), what will the output be when f0 is larger than the lter's
cuto frequency?
Problem 3.43: Optical ReceiversIn your optical telephone, the receiver circuit had the form shown (Figure 3.87).

104 CHAPTER 3. ANALOG SIGNAL PROCESSING
–
+
Zf
Vout
Figure 3.87
This circuit served as a transducer, converting light energy into a voltage vout. The photodiode acts as acurrent source, producing a current proportional to the light intesity falling upon it. As is often the case inthis crucial stage, the signals are small and noise can be a problem. Thus, the op-amp stage serves to boostthe signal and to lter out-of-band noise.
a) Find the transfer function relating light intensity to vout.b) What should the circuit realizing the feedback impedance Zf be so that the transducer acts as a 5 kHz
lowpass lter?c) A clever engineer suggests an alternative circuit (Figure 3.88) to accomplish the same task. Determine
whether the idea works or not. If it does, nd the impedance Zin that accomplishes the lowpass lteringtask. If not, show why it does not work.
–
+
1Zin
Vout
Figure 3.88
Problem 3.44: Reverse EngineeringThe depicted circuit (Figure 3.89) has been developed by the TBBG Electronics design group. They aretrying to keep its use secret; we, representing RU Electronics, have discovered the schematic and want togure out the intended application. Assume the diode is ideal.

105
+
–
–
+
R2
Vout
R1 C
+
–
Vin
R1= 1 kΩR2= 1 kΩC = 31.8 nF
Figure 3.89
a) Assuming the diode is a short-circuit (it has been removed from the circuit), what is the circuit'stransfer function?
b) With the diode in place, what is the circuit's output when the input voltage is sin (2πf0t)?c) What function might this circuit have?

106 CHAPTER 3. ANALOG SIGNAL PROCESSING
Solutions to Exercises in Chapter 3
Solution to Exercise 3.1 (p. 36)One kilowatt-hour equals 360,000 watt-seconds, which indeed directly corresponds to 360,000 joules.
Solution to Exercise 3.2 (p. 41)KCL says that the sum of currents entering or leaving a node must be zero. If we consider two nodestogether as a "supernode", KCL applies as well to currents entering the combination. Since no currentsenter an entire circuit, the sum of currents must be zero. If we had a two-node circuit, the KCL equation ofone must be the negative of the other, We can combine all but one node in a circuit into a supernode; KCLfor the supernode must be the negative of the remaining node's KCL equation. Consequently, specifyingn− 1 KCL equations always species the remaining one.
Solution to Exercise 3.3 (p. 43)The circuit serves as an amplier having a gain of R2
R1+R2.
Solution to Exercise 3.4 (p. 44)The power consumed by the resistor R1 can be expressed as
(vin − vout) iout =R1
(R1 + R2)2 vin
2
Solution to Exercise 3.5 (p. 44)
1R1 + R2
vin2 =
R1
(R1 + R2)2 vin
2 + +R2
(R1 + R2)2 vin
2
Solution to Exercise 3.6 (p. 46)Replacing the current source by a voltage source does not change the fact that the voltages are identical.Consequently, vin = R2iout or iout = vin
R2. This result does not depend on the resistor R1, which means that
we simply have a resistor (R2) across a voltage source. The two-resistor circuit has no apparent use.
Solution to Exercise 3.7 (p. 47)Req = R2
1+R2RL
. Thus, a 10% change means that the ratio R2RL
must be less than 0.1. A 1% change means that
R2RL
< 0.01.
Solution to Exercise 3.8 (p. 49)In a series combination of resistors, the current is the same in each; in a parallel combination, the voltageis the same. For a series combination, the equivalent resistance is the sum of the resistances, which will belarger than any component resistor's value; for a parallel combination, the equivalent conductance is the sumof the component conductances, which is larger than any component conductance. The equivalent resistanceis therefore smaller than any component resistance.
Solution to Exercise 3.9 (p. 51)
voc = R2R1+R2
vin and isc = −(
vin
R1
)(resistor R2 is shorted out in this case). Thus, veq = R2
R1+R2vin and
Req = R1R2R1+R2
.
Solution to Exercise 3.10 (p. 52)ieq = R1
R1+R2iin and Req = (R3 ‖ R1 + R2).
Solution to Exercise 3.11 (p. 58)Division by j2πf arises from integrating a complex exponential. Consequently,(
1j2πf
V ⇔∫
V ej2πftdt
)

107
Solution to Exercise 3.12 (p. 59)For maximum power dissipation, the imaginary part of complex power should be zero. As the complex poweris given by V I∗ = |V ||I|ej(φ−θ), zero imaginary part occurs when the phases of the voltage and currentsagree.
Solution to Exercise 3.13 (p. 59)Pave = VrmsIrms cos (φ− θ). The cosine term is known as the power factor.
Solution to Exercise 3.14 (p. 64)The key notion is writing the imaginary part as the dierence between a complex exponential and itscomplex conjugate:
Im(V ej2πft
)=
V ej2πft − V ∗e−(j2πft)
2j(3.35)
The response to V ej2πft is V H (f) ej2πft, which means the response to V ∗e−(j2πft) is V ∗H (−f) e−(j2πft).As H (−f) =
(H (f)∗
), the Superposition Principle says that the output to the imaginary part is
Im(V H (f) ej2πft
). The same argument holds for the real part: Re
(V ej2πft
)→ Re
(V H (f) ej2πft
).
Solution to Exercise 3.15 (p. 69)To nd the equivalent resistance, we need to nd the current owing through the voltage source. This currentequals the current we have just found plus the current owing through the other vertical 1 Ω resistor. Thiscurrent equals e1
1 = 613vin, making the total current through the voltage source (owing out of it) 11
13vin.Thus, the equivalent resistance is 13
11Ω.
Solution to Exercise 3.16 (p. 71)Not necessarily, especially if we desire individual knobs for adjusting the gain and the cuto frequency.
Solution to Exercise 3.17 (p. 79)The ratio between adjacent values is about
√2.

108 CHAPTER 3. ANALOG SIGNAL PROCESSING

Chapter 4
Frequency Domain
4.1 Introduction to the Frequency Domain1
In developing ways of analyzing linear circuits, we invented the impedance method because it made solvingcircuits easier. Along the way, we developed the notion of a circuit's frequency response or transfer function.This notion, which also applies to all linear, time-invariant systems, describes how the circuit responds to asinusoidal input when we express it in terms of a complex exponential. We also learned the SuperpositionPrinciple for linear systems: The system's output to an input consisting of a sum of two signals is the sumof the system's outputs to each individual component.
The study of the frequency domain combines these two notionsa system's sinusoidal response is easy tond and a linear system's output to a sum of inputs is the sum of the individual outputsto develop thecrucial idea of a signal's spectrum. We begin by nding that those signals that can be represented as asum of sinusoids is very large. In fact, all signals can be expressed as a superposition of sinusoids.
As this story unfolds, we'll see that information systems rely heavily on spectral ideas. For example,radio, television, and cellular telephones transmit over dierent portions of the spectrum. In fact, spectrumis so important that communications systems are regulated as to which portions of the spectrum they canuse by the Federal Communications Commission in the United States and by International Treaty for theworld (see Frequency Allocations (Section 7.3)). Calculating the spectrum is easy: The Fourier transformdenes how we can nd a signal's spectrum.
4.2 Complex Fourier Series2
In an earlier module (Exercise 2.4), we showed that a square wave could be expressed as a superposition ofpulses. As useful as this decomposition was in this example, it does not generalize well to other periodicsignals: How can a superposition of pulses equal a smooth signal like a sinusoid? Because of the importanceof sinusoids to linear systems, you might wonder whether they could be added together to represent a largenumber of periodic signals. You would be right and in good company as well. Euler3 and Gauss4 in particularworried about this problem, and Jean Baptiste Fourier5 got the credit even though tough mathematical issueswere not settled until later. They worked on what is now known as the Fourier series: representing anyperiodic signal as a superposition of sinusoids.
But the Fourier series goes well beyond being another signal decomposition method. Rather, the Fourierseries begins our journey to appreciate how a signal can be described in either the time-domain or the
1This content is available online at <http://cnx.org/content/m0038/2.10/>.2This content is available online at <http://cnx.org/content/m0042/2.24/>.3http://www-groups.dcs.st-and.ac.uk/∼history/Mathematicians/Euler.html4http://www-groups.dcs.st-and.ac.uk/∼history/Mathematicians/Guass.html5http://www-groups.dcs.st-and.ac.uk/∼history/Mathematicians/Fourier.html
109

110 CHAPTER 4. FREQUENCY DOMAIN
frequency-domain with no compromise. Let s (t) be a periodic signal with period T . We want to showthat periodic signals, even those that have constant-valued segments like a square wave, can be expressedas sum of harmonically related sine waves: sinusoids having frequencies that are integer multiples ofthe fundamental frequency. Because the signal has period T , the fundamental frequency is 1
T . Thecomplex Fourier series expresses the signal as a superposition of complex exponentials having frequencies k
T ,k = . . .,−1, 0, 1, . . ..
s (t) =∞∑
k=−∞
(ckej 2πkt
T
)(4.1)
with ck = 12 (ak + (− (jbk))). The real and imaginary parts of the Fourier coecients ck are written in this
unusual way for convenience in dening the classic Fourier series. The zeroth coecient equals the signal's
average value and is real-valued for real-valued signals: c0 = a0. The family of functions
ej 2πktT
are called
basis functions and form the foundation of the Fourier series. No matter what the periodic signal mightbe, these functions are always present and form the representation's building blocks. They depend on thesignal period T , and are indexed by k.
Key point: Assuming we know the period, knowing the Fourier coecients is equivalent toknowing the signal. Thus, it makes not dierence if we have a time-domain or a frequency-domaincharacterization of the signal.
Exercise 4.1 (Solution on p. 152.)
What is the complex Fourier series for a sinusoid?
To nd the Fourier coecients, we note the orthogonality property∫ T
0
ej 2πktT e(−j) 2πlt
T dt =
T if k = l
0 if k 6= l(4.2)
Assuming for the moment that the complex Fourier series "works," we can nd a signal's complex Fouriercoecients, its spectrum, by exploiting the orthogonality properties of harmonically related complex expo-nentials. Simply multiply each side of (4.1) by e−(j2πlt) and integrate over the interval [0, T ].
ck = 1T
∫ T
0s (t) e−(j 2πkt
T )dt
c0 = 1T
∫ T
0s (t) dt
(4.3)
Example 4.1Finding the Fourier series coecients for the square wave is very simple. sqT (t). Mathematically,this signal can be expressed as
sqT (t) =
1 if 0 ≤ t < T2
−1 if T2 ≤ t < T
The expression for the Fourier coecients has the form
ck =1T
∫ T2
0
e−(j 2πktT )dt− 1
T
∫ T
T2
e−(j 2πktT )dt (4.4)
Note: When integrating an expression containing j, treat it just like any other constant.
The two integrals are very similar, one equaling the negative of the other. The nal expressionbecomes
bk = 2(−(
1j2πk
((−1)k − 1
)))=
2jπk if k odd
0 if k even
(4.5)

111
Thus, the complex Fourier series for the square wave is
sq (t) =∑
k∈...,−3,−1,1,3,...
(2
jπke(+j) 2πkt
T
)(4.6)
Consequently, the square wave equals a sum of complex exponentials, but only those having fre-quencies equal to odd multiples of the fundamental frequency 1
T . The coecients decay slowly asthe frequency index k increases. This index corresponds to the k-th harmonic of the signal's period.
A signal's Fourier series spectrum ck has interesting properties.
Property 4.1:If s (t) is real, c−k = ck
∗ (real-valued periodic signals have conjugate-symmetric spectra).
This result follows from the integral that calculates the ck from the signal. Furthermore, this result meansthat Re (ck) = Re (c−k): The real part of the Fourier coecients for real-valued signals is even. Similarly,Im (ck) = − (Im (c−k)): The imaginary parts of the Fourier coecients have odd symmetry. Consequently,if you are given the Fourier coecients for positive indices and zero and are told the signal is real-valued,you can nd the negative-indexed coecients, hence the entire spectrum. This kind of symmetry, ck = ck
∗,is known as conjugate symmetry.
Property 4.2:If s (−t) = s (t), which says the signal has even symmetry about the origin, c−k = ck.
Given the previous property for real-valued signals, the Fourier coecients of even signals are real-valued.A real-valued Fourier expansion amounts to an expansion in terms of only cosines, which is the simplestexample of an even signal.
Property 4.3:If s (−t) = − (s (t)), which says the signal has odd symmetry, c−k = −ck.
Therefore, the Fourier coecients are purely imaginary. The square wave is a great example of anodd-symmetric signal.
Property 4.4:
The spectral coecients for a periodic signal delayed by τ s (t− τ) are cke−( j2πkτT ), where ck
denotes the spectrum of s (t). Delaying a signal by τ seconds results in a spectrum having a linearphase shift of −
(2πkτ
T
)in comparison to the spectrum of the undelayed signal. Note that the
spectral magnitude is unaected. Showing this property is easy.Proof:
1T
∫ T
0
s (t− τ) e(−j) 2πktT dt =
1T
∫ T−τ
−τ
s (t) e(−j)2πk(t+τ)
T dt
=1T
e(−j) 2πkτT
∫ T−τ
−τ
s (t) e(−j) 2πktT dt
(4.7)
Note that the range of integration extends over a period of the integrand. Consequently, it shouldnot matter how we integrate over a period, which means that
∫ T−τ
−τ(·) dt =
∫ T
0(·) dt, and we have
our result.
The complex Fourier series obeys Parseval's Theorem, one of the most important results in signalanalysis. This general mathematical result says you can calculate a signal's power in either the time domainor the frequency domain.
Theorem 4.1: Parseval's TheoremAverage power calculated in the time domain equals the power calculated in the frequency domain.
1T
∫ T
0
s2 (t) dt =∞∑
k=−∞
((|ck|)2
)(4.8)

112 CHAPTER 4. FREQUENCY DOMAIN
This result is a (simpler) re-expression of how to calculate a signal's power than with the real-valuedFourier series expression for power (4.22).
Let's calculate the Fourier coecients of the periodic pulse signal shown here (Figure 4.1).
∆
T
∆
t
p(t)A
……
Figure 4.1: Periodic pulse signal.
The pulse width is ∆, the period T , and the amplitude A. The complex Fourier spectrum of this signalis given by
ck =1T
∫ ∆
0
Ae−( j2πk∆T )dt =
(−(
A
j2πk
))(e−( j2πk∆
T ) − 1)
At this point, simplifying this expression requires knowing an interesting property.
1− e−(jθ) = e−( jθ2 )(e+ jθ
2 − e−( jθ2 ))
= e−( jθ2 )2j sin
(θ
2
)Armed with this result, we can simply express the Fourier series coecients for our pulse sequence.
ck = Ae−( jπk∆T ) sin
(πk∆
T
)πk
(4.9)
Because this signal is real-valued, we nd that the coecients do indeed have conjugate symmetry: ck = c−k∗.
The periodic pulse signal has neither even nor odd symmetry; consequently, no additional symmetry existsin the spectrum. Because the spectrum is complex valued, to plot it we need to calculate its magnitude andphase.
|ck| = A|sin(
πk∆T
)πk
| (4.10)
∠ (ck) = −(
πk∆T
)+ πneg
(sin(
πk∆T
)πk
)sign (k)
The function neg (·) equals −1 if its argument is negative and zero otherwise. The somewhat complicatedexpression for the phase results because the sine term can be negative; magnitudes must be positive, leavingthe occasional negative values to be accounted for as a phase shift of π.

113
Periodic Pulse Sequence
Figure 4.2: The magnitude and phase of the periodic pulse sequence's spectrum is shown for positive-frequency indices. Here ∆
T= 0.2 and A = 1.
Also note the presence of a linear phase term (the rst term in ∠ (ck) is proportional to frequency kT ).
Comparing this term with that predicted from delaying a signal, a delay of ∆2 is present in our signal.
Advancing the signal by this amount centers the pulse about the origin, leaving an even signal, which inturn means that its spectrum is real-valued. Thus, our calculated spectrum is consistent with the propertiesof the Fourier spectrum.
Exercise 4.2 (Solution on p. 152.)
What is the value of c0? Recalling that this spectral coecient corresponds to the signal's averagevalue, does your answer make sense?
The phase plot shown in Figure 4.2 (Periodic Pulse Sequence) requires some explanation as it does not seemto agree with what (4.10) suggests. There, the phase has a linear component, with a jump of π every timethe sinusoidal term changes sign. We must realize that any integer multiple of 2π can be added to a phaseat each frequency without aecting the value of the complex spectrum. We see that at frequency index 4the phase is nearly −π. The phase at index 5 is undened because the magnitude is zero in this example. Atindex 6, the formula suggests that the phase of the linear term should be less than (more negative) than −π.In addition, we expect a shift of −π in the phase between indices 4 and 6. Thus, the phase value predicted bythe formula is a little less than − (2π). Because we can add 2π without aecting the value of the spectrumat index 6, the result is a slightly negative number as shown. Thus, the formula and the plot do agree. Inphase calculations like those made in MATLAB, values are usually conned to the range [−π, π) by addingsome (possibly negative) multiple of 2π to each phase value.

114 CHAPTER 4. FREQUENCY DOMAIN
4.3 Classic Fourier Series6
The classic Fourier series as derived originally expressed a periodic signal (period T ) in terms of harmonicallyrelated sines and cosines.
s (t) = a0 +∞∑
k=1
(ak cos
(2πkt
T
))+
∞∑k=1
(bk sin
(2πkt
T
))(4.11)
The complex Fourier series and the sine-cosine series are identical, each representing a signal's spectrum. TheFourier coecients, ak and bk, express the real and imaginary parts respectively of the spectrum while thecoecients ck of the complex Fourier series express the spectrum as a magnitude and phase. Equating theclassic Fourier series (4.11) to the complex Fourier series (4.1), an extra factor of two and complex conjugatebecome necessary to relate the Fourier coecients in each.
ck =12
(ak − jbk)
Exercise 4.3 (Solution on p. 152.)
Derive this relationship between the coecients of the two Fourier series.
Just as with the complex Fourier series, we can nd the Fourier coecients using the orthogonalityproperties of sinusoids. Note that the cosine and sine of harmonically related frequencies, even the samefrequency, are orthogonal. ∫ T
0
sin(
2πkt
T
)cos(
2πlt
T
)dt = 0 , k ∈ Z l ∈ Z (4.12)
∫ T
0
sin(
2πkt
T
)sin(
2πlt
T
)dt =
T2 if k = l and k 6= 0 and l 6= 0
0 if k 6= l or k = 0 = l
∫ T
0
cos(
2πkt
T
)cos(
2πlt
T
)dt =
T2 if k = l and k 6= 0 and l 6= 0
T if k = 0 = l
0 if k 6= l
These orthogonality relations follow from the following important trigonometric identities.
sin (α) sin (β) = 12 (cos (α− β)− cos (α + β))
cos (α) cos (β) = 12 (cos (α + β) + cos (α− β))
sin (α) cos (β) = 12 (sin (α + β) + sin (α− β))
(4.13)
These identities allow you to substitute a sum of sines and/or cosines for a product of them. Each term inthe sum can be integrating by noticing one of two important properties of sinusoids.
• The integral of a sinusoid over an integer number of periods equals zero.• The integral of the square of a unit-amplitude sinusoid over a period T equals T
2 .
6This content is available online at <http://cnx.org/content/m0039/2.22/>.

115
To use these, let's, for example, multiply the Fourier series for a signal by the cosine of the lth harmoniccos(
2πltT
)and integrate. The idea is that, because integration is linear, the integration will sift out all but
the term involving al.∫ T
0s (t) cos
(2πltT
)dt =
∫ T
0a0 cos
(2πltT
)dt +
∑∞k=1
(ak
∫ T
0cos(
2πktT
)cos(
2πltT
)dt)
+∑∞k=1
(bk
∫ T
0sin(
2πktT
)cos(
2πltT
)dt) (4.14)
The rst and third terms are zero; in the second, the only non-zero term in the sum results when theindices k and l are equal (but not zero), in which case we obtain alT
2 . If k = 0 = l, we obtain a0T .Consequently,
al =2T
∫ T
0
s (t) cos(
2πlt
T
)dt , l 6= 0
All of the Fourier coecients can be found similarly.
a0 =1T
∫ T
0
s (t) dt
ak =2T
∫ T
0
s (t) cos(
2πkt
T
)dt , k 6= 0
bk =2T
∫ T
0
s (t) sin(
2πkt
T
)dt
(4.15)
Exercise 4.4 (Solution on p. 152.)
The expression for a0 is referred to as the average value of s (t). Why?
Exercise 4.5 (Solution on p. 152.)
What is the Fourier series for a unit-amplitude square wave?
Example 4.2Let's nd the Fourier series representation for the half-wave rectied sinusoid.
s (t) =
sin(
2πtT
)if 0 ≤ t < T
2
0 if T2 ≤ t < T
(4.16)
Begin with the sine terms in the series; to nd bk we must calculate the integral
bk =2T
∫ T2
0
sin(
2πt
T
)sin(
2πkt
T
)dt (4.17)
Using our trigonometric identities turns our integral of a product of sinusoids into a sum of integralsof individual sinusoids, which are much easier to evaluate.∫ T
20
sin(
2πtT
)sin(
2πktT
)dt = 1
2
∫ T2
0cos(
2π(k−1)tT
)− cos
(2π(k+1)t
T
)dt
=
12 if k = 1
0 otherwise
(4.18)
Thus,
b1 =12
b2 = b3 = · · · = 0

116 CHAPTER 4. FREQUENCY DOMAIN
On to the cosine terms. The average value, which corresponds to a0, equals 1π . The remainder
of the cosine coecients are easy to nd, but yield the complicated result
ak =
−(
2π
1k2−1
)if k ∈ 2, 4, . . .
0 if k odd(4.19)
Thus, the Fourier series for the half-wave rectied sinusoid has non-zero terms for the average,the fundamental, and the even harmonics.
4.4 A Signal's Spectrum7
A periodic signal, such as the half-wave rectied sinusoid, consists of a sum of elemental sinusoids. A plotof the Fourier coecients as a function of the frequency index, such as shown in Figure 4.3 (Fourier Seriesspectrum of a half-wave rectied sine wave), displays the signal's spectrum. The word "spectrum" impliesthat the independent variable, here k, corresponds somehow to frequency. Each coecient is directly relatedto a sinusoid having a frequency of k
T . Thus, if we half-wave rectied a 1 kHz sinusoid, k = 1 correspondsto 1 kHz, k = 2 to 2 kHz, etc.
Fourier Series spectrum of a half-wave rectied sine wave
k
ak
-0.5
0
0.5
bk
0 2 4 6 8 100
0.5
k
Figure 4.3: The Fourier series spectrum of a half-wave rectied sinusoid is shown. The index indicatesthe multiple of the fundamental frequency at which the signal has energy.
A subtle, but very important, aspect of the Fourier spectrum is its uniqueness: You can unambiguouslynd the spectrum from the signal (decomposition (4.15)) and the signal from the spectrum (composition).Thus, any aspect of the signal can be found from the spectrum and vice versa. A signal's frequency domainexpression is its spectrum. A periodic signal can be dened either in the time domain (as a function) or inthe frequency domain (as a spectrum).
7This content is available online at <http://cnx.org/content/m0040/2.19/>.

117
A fundamental aspect of solving electrical engineering problems is whether the time or frequency domainprovides the most understanding of a signal's properties and the simplest way of manipulating it. Theuniqueness property says that either domain can provide the right answer. As a simple example, supposewe want to know the (periodic) signal's maximum value. Clearly the time domain provides the answerdirectly. To use a frequency domain approach would require us to nd the spectrum, form the signal fromthe spectrum and calculate the maximum; we're back in the time domain!
Another feature of a signal is its average power. A signal's instantaneous power is dened to be itssquare. The average power is the average of the instantaneous power over some time interval. For a periodicsignal, the natural time interval is clearly its period; for nonperiodic signals, a better choice would be entiretime or time from onset. For a periodic signal, the average power is the square of its root-mean-squared(rms) value. We dene the rms value of a periodic signal to be
rms (s) =
√1T
∫ T
0
s2 (t) dt (4.20)
and thus its average power is
power (s) = rms2 (s)
= 1T
∫ T
0s2 (t) dt
(4.21)
Exercise 4.6 (Solution on p. 152.)
What is the rms value of the half-wave rectied sinusoid?
To nd the average power in the frequency domain, we need to substitute the spectral representation of thesignal into this expression.
power (s) =1T
∫ T
0
(a0 +
∞∑k=1
(ak cos
(2πkt
T
))+
∞∑k=1
(bk sin
(2πkt
T
)))2
dt
The square inside the integral will contain all possible pairwise products. However, the orthogonality proper-ties (4.12) say that most of these crossterms integrate to zero. The survivors leave a rather simple expressionfor the power we seek.
power (s) = a02 +
12
∞∑k=1
(ak
2 + bk2)
(4.22)
It could well be that computing this sum is easier than integrating the signal's square. Furthermore,the contribution of each term in the Fourier series toward representing the signal can be measured by itscontribution to the signal's average power. Thus, the power contained in a signal at its kth harmonic isak
2+bk2
2 . The power spectrum, Ps (k), such as shown in Figure 4.4 (Power Spectrum of a Half-WaveRectied Sinusoid), plots each harmonic's contribution to the total power.
Exercise 4.7 (Solution on p. 152.)
In high-end audio, deviation of a sine wave from the ideal is measured by the total harmonicdistortion, which equals the total power in the harmonics higher than the rst compared to powerin the fundamental. Find an expression for the total harmonic distortion for any periodic signal.Is this calculation most easily performed in the time or frequency domain?
4.5 Fourier Series Approximation of Signals8
It is interesting to consider the sequence of signals that we obtain as we incorporate more terms into theFourier series approximation of the half-wave rectied sine wave (Example 4.2). Dene sK (t) to be the
8This content is available online at <http://cnx.org/content/m10687/2.8/>.

118 CHAPTER 4. FREQUENCY DOMAIN
Power Spectrum of a Half-Wave Rectied Sinusoid
0 2 4 6 8 10
Ps(k)
0
0.1
0.2
k
Figure 4.4: Power spectrum of a half-wave rectied sinusoid.
signal containing K + 1 Fourier terms.
sK (t) = a0 +K∑
k=1
(ak cos
(2πkt
T
))+
K∑k=1
(bk sin
(2πkt
T
))(4.23)
Figure 4.5 (Fourier Series spectrum of a half-wave rectied sine wave) shows how this sequence of signalsportrays the signal more accurately as more terms are added.
We need to assess quantitatively the accuracy of the Fourier series approximation so that we can judgehow rapidly the series approaches the signal. When we use a K + 1-term series, the errorthe dierencebetween the signal and the K + 1-term seriescorresponds to the unused terms from the series.
εK (t) =∞∑
k=K+1
(ak cos
(2πkt
T
))+
∞∑k=K+1
(bk sin
(2πkt
T
))(4.24)
To nd the rms error, we must square this expression and integrate it over a period. Again, the integral ofmost cross-terms is zero, leaving
rms (εK) =
√√√√12
∞∑k=K+1
(ak
2 + bk2)
(4.25)
Figure 4.6 (Approximation error for a half-wave rectied sinusoid) shows how the error in the Fourier seriesfor the half-wave rectied sinusoid decreases as more terms are incorporated. In particular, the use of fourterms, as shown in the bottom plot of Figure 4.5 (Fourier Series spectrum of a half-wave rectied sine wave),has a rms error (relative to the rms value of the signal) of about 3%. The Fourier series in this case convergesquickly to the signal.

119
Fourier Series spectrum of a half-wave rectied sine wave
k
ak
-0.5
0
0.5
bk
0 2 4 6 8 100
0.5
k
(a)
0
0.5
1K=0
t
0
1K=1
t
0.5
0
0.5
1K=2
t
0 0.5 1 1.5 20
0.5
1K=4
t
(b)
Figure 4.5: The Fourier series spectrum of a half-wave rectied sinusoid is shown in the upper portion.The index indicates the multiple of the fundamental frequency at which the signal has energy. Thecumulative eect of adding terms to the Fourier series for the half-wave rectied sine wave is shown inthe bottom portion. The dashed line is the actual signal, with the solid line showing the nite seriesapproximation to the indicated number of terms, K + 1.

120 CHAPTER 4. FREQUENCY DOMAIN
Approximation error for a half-wave rectied sinusoid
0 2 4 6 8 100
0.2
0.4
0.6
0.8
1
Rel
ativ
e rm
s er
ror
K
Figure 4.6: The rms error calculated according to (4.25) is shown as a function of the number of termsin the series for the half-wave rectied sinusoid. The error has been normalized by the rms value of thesignal.
We can look at Figure 4.7 (Power spectrum and approximation error for a square wave) to see the powerspectrum and the rms approximation error for the square wave. Because the Fourier coecients decay moreslowly here than for the half-wave rectied sinusoid, the rms error is not decreasing quickly. Said anotherway, the square-wave's spectrum contains more power at higher frequencies than does the half-wave-rectiedsinusoid. This dierence between the two Fourier series results because the half-wave rectied sinusoid'sFourier coecients are proportional to 1
k2 while those of the square wave are proportional to 1k . If fact, after
99 terms of the square wave's approximation, the error is bigger than 10 terms of the approximation for thehalf-wave rectied sinusoid. Mathematicians have shown that no signal has an rms approximation error thatdecays more slowly than it does for the square wave.
Exercise 4.8 (Solution on p. 153.)
Calculate the harmonic distortion for the square wave.
More than just decaying slowly, Fourier series approximation shown in Figure 4.8 (Fourier series approxi-mation of a square wave) exhibits interesting behavior. Although the square wave's Fourier series requiresmore terms for a given representation accuracy, when comparing plots it is not clear that the two are equal.Does the Fourier series really equal the square wave at all values of t? In particular, at each step-change inthe square wave, the Fourier series exhibits a peak followed by rapid oscillations. As more terms are addedto the series, the oscillations seem to become more rapid and smaller, but the peaks are not decreasing. Forthe Fourier series approximation for the half-wave rectied sinusoid (Figure 4.5: Fourier Series spectrum ofa half-wave rectied sine wave), no such behavior occurs. What is happening?
Consider this mathematical question intuitively: Can a discontinuous function, like the square wave, beexpressed as a sum, even an innite one, of continuous signals? One should at least be suspicious, and infact, it can't be thus expressed. This issue brought Fourier9 much criticism from the French Academy ofScience (Laplace, Lagrange, Monge and LaCroix comprised the review committee) for several years after itspresentation on 1807. It was not resolved for also a century, and its resolution is interesting and importantto understand from a practical viewpoint.
The extraneous peaks in the square wave's Fourier series never disappear; they are termed Gibb's
9http://www-groups.dcs.st-and.ac.uk/∼history/Mathematicians/Fourier.html

121
Power spectrum and approximation error for a square wave
0 2 4 6 8 100
0.5
1Ps(k)
k
Rel
ativ
e rm
s er
ror
0 2 4 6 8 100
0.5
1
K
Figure 4.7: The upper plot shows the power spectrum of the square wave, and the lower plot the rmserror of the nite-length Fourier series approximation to the square wave. The asterisk denotes the rmserror when the number of terms K in the Fourier series equals 99.
phenomenon after the American physicist Josiah Willard Gibbs. They occur whenever the signal is dis-continuous, and will always be present whenever the signal has jumps.
Let's return to the question of equality; how can the equal sign in the denition of the Fourier seriesbe justied? The partial answer is that pointwiseeach and every value of tequality is not guaranteed.However, mathematicians later in the nineteenth century showed that the rms error of the Fourier series wasalways zero.
limK→∞
rms (εK) = 0
What this means is that the error between a signal and its Fourier series approximation may not be zero, butthat its rms value will be zero! It is through the eyes of the rms value that we redene equality: The usualdenition of equality is called pointwise equality: Two signals s1 (t), s2 (t) are said to be equal pointwiseif s1 (t) = s2 (t) for all values of t. A new denition of equality is mean-square equality: Two signals aresaid to be equal in the mean square if rms (s1 − s2) = 0. For Fourier series, Gibb's phenomenon peaks havenite height and zero width. The error diers from zero only at isolated pointswhenever the periodic signalcontains discontinuitiesand equals about 9% of the size of the discontinuity. The value of a function at anite set of points does not aect its integral. This eect underlies the reason why dening the value of adiscontinuous function, like we refrained from doing in dening the step function (Section 2.2.4: Unit Step),at its discontinuity is meaningless. Whatever you pick for a value has no practical relevance for either thesignal's spectrum or for how a system responds to the signal. The Fourier series value "at" the discontinuityis the average of the values on either side of the jump.

122 CHAPTER 4. FREQUENCY DOMAIN
Fourier series approximation of a square wave
0
1K=49
-1
t
-1
0
1K=1
t
-1
0
1K=5
t
-1
0
1K=11
t
Figure 4.8: Fourier series approximation to sq (t). The number of terms in the Fourier sum is indicatedin each plot, and the square wave is shown as a dashed line over two periods.
4.6 Encoding Information in the Frequency Domain10
To emphasize the fact that every periodic signal has both a time and frequency domain representation, wecan exploit both to encode information into a signal. Refer to the Fundamental Model of Communication(Figure 1.4: Fundamental model of communication). We have an information source, and want to constructa transmitter that produces a signal x (t). For the source, let's assume we have information to encode everyT seconds. For example, we want to represent typed letters produced by an extremely good typist (a key isstruck every T seconds). Let's consider the complex Fourier series formula in the light of trying to encodeinformation.
x (t) =K∑
k=−K
(ckej 2πkt
T
)(4.26)
We use a nite sum here merely for simplicity (fewer parameters to determine). An important aspect ofthe spectrum is that each frequency component ck can be manipulated separately: Instead of nding the
10This content is available online at <http://cnx.org/content/m0043/2.15/>.

123
Fourier spectrum from a time-domain specication, let's construct it in the frequency domain by selectingthe ck according to some rule that relates coecient values to the alphabet. In dening this rule, we want toalways create a real-valued signal x (t). Because of the Fourier spectrum's properties (Property 4.1, p. 111),the spectrum must have conjugate symmetry. This requirement means that we can only assign positive-indexed coecients (positive frequencies), with negative-indexed ones equaling the complex conjugate of thecorresponding positive-indexed ones.
Assume we have N letters to encode: a1, . . . , aN. One simple encoding rule could be to make a singleFourier coecient be non-zero and all others zero for each letter. For example, if an occurs, we make cn = 1and ck = 0, k 6= n. In this way, the nth harmonic of the frequency 1
T is used to represent a letter. Notethat the bandwidththe range of frequencies required for the encodingequals N
T . Another possibility isto consider the binary representation of the letter's index. For example, if the letter a13 occurs, converting13 to its base 2 representation, we have 13 = 11012. We can use the pattern of zeros and ones to representdirectly which Fourier coecients we "turn on" (set equal to one) and which we "turn o."
Exercise 4.9 (Solution on p. 153.)
Compare the bandwidth required for the direct encoding scheme (one nonzero Fourier coecientfor each letter) to the binary number scheme. Compare the bandwidths for a 128-letter alphabet.Since both schemes represent information without loss we can determine the typed letter uniquelyfrom the signal's spectrum both are viable. Which makes more ecient use of bandwidth andthus might be preferred?
Exercise 4.10 (Solution on p. 153.)
Can you think of an information-encoding scheme that makes even more ecient use of the spec-trum? In particular, can we use only one Fourier coecient to represent N letters uniquely?
We can create an encoding scheme in the frequency domain (p. 123) to represent an alphabet of letters. But,as this information-encoding scheme stands, we can represent one letter for all time. However, we note thatthe Fourier coecients depend only on the signal's characteristics over a single period. We could changethe signal's spectrum every T as each letter is typed. In this way, we turn spectral coecients on and o asletters are typed, thereby encoding the entire typed document. For the receiver (see the Fundamental Modelof Communication (Figure 1.4: Fundamental model of communication)) to retrieve the typed letter, it wouldsimply use the Fourier formula for the complex Fourier spectrum11 for each T -second interval to determinewhat each typed letter was. Figure 4.9 (Encoding Signals) shows such a signal in the time-domain.
11"Complex Fourier Series and Their Properties", (2) <http://cnx.org/content/m0065/latest/#complex>

124 CHAPTER 4. FREQUENCY DOMAIN
Encoding Signals
0 T 2T 3T
-2
-1
0
1
2
t
x(t)
Figure 4.9: The encoding of signals via the Fourier spectrum is shown over three "periods." In this ex-ample, only the third and fourth harmonics are used, as shown by the spectral magnitudes correspondingto each T -second interval plotted below the waveforms. Can you determine the phase of the harmonicsfrom the waveform?
In this Fourier-series encoding scheme, we have used the fact that spectral coecients can be indepen-dently specied and that they can be uniquely recovered from the time-domain signal over one "period." Donote that the signal representing the entire document is no longer periodic. By understanding the Fourier se-ries' properties (in particular that coecients are determined only over a T -second interval, we can constructa communications system. This approach represents a simplication of how modern modems represent textthat they transmit over telephone lines.
4.7 Filtering Periodic Signals12
The Fourier series representation of a periodic signal makes it easy to determine how a linear, time-invariantlter reshapes such signals in general. The fundamental property of a linear system is that its input-outputrelation obeys superposition: L (a1s1 (t) + a2s2 (t)) = a1L (s1 (t)) + a2L (s2 (t)). Because the Fourier seriesrepresents a periodic signal as a linear combination of complex exponentials, we can exploit the superpositionproperty. Furthermore, we found for linear circuits that their output to a complex exponential input is just thefrequency response evaluated at the signal's frequency times the complex exponential. Said mathematically,if x (t) = ej 2πkt
T , then the output y (t) = H(
kT
)ej 2πkt
T because f = kT . Thus, if x (t) is periodic thereby
having a Fourier series, a linear circuit's output to this signal will be the superposition of the output to eachcomponent.
y (t) =∞∑
k=−∞
(ckH
(k
T
)ej 2πkt
T
)(4.27)
12This content is available online at <http://cnx.org/content/m0044/2.9/>.

125
Thus, the output has a Fourier series, which means that it too is periodic. Its Fourier coecients equalckH
(kT
). To obtain the spectrum of the output, we simply multiply the input spectrum by the frequency
response . The circuit modies the magnitude and phase of each Fourier coecient. Note especially thatwhile the Fourier coecients do not depend on the signal's period, the circuit's transfer function does dependon frequency, which means that the circuit's output will dier as the period varies.
Filtering a period signal
∆
T
∆
t
p(t)A
……
(a)
00
0.2
0 1 20
1
00
0.2
0 1 20
1
0 1 20
1
0 10 200
0.2
Spe
ctra
l Mag
nitu
de fc: 100 Hz fc: 1 kHz fc: 10 kHz
Frequency (kHz) Frequency (kHz) Frequency (kHz)
Time (ms) Time (ms) Time (ms)
Am
plitu
de
10 2010 20
(b)
Figure 4.10: A periodic pulse signal, such as shown on the left part (∆T
= 0.2), serves as the input toan RC lowpass lter. The input's period was 1 ms (millisecond). The lter's cuto frequency was set tothe various values indicated in the top row, which display the output signal's spectrum and the lter'stransfer function. The bottom row shows the output signal derived from the Fourier series coecientsshown in the top row. (a) Periodic pulse signal (b) Top plots show the pulse signal's spectrum for variouscuto frequencies. Bottom plots show the lter's output signals.

126 CHAPTER 4. FREQUENCY DOMAIN
Example 4.3The periodic pulse signal shown on the left above serves as the input to a RC-circuit that has thetransfer function (calculated elsewhere (Figure 3.31: Magnitude and phase of the transfer function))
H (f) =1
1 + j2πfRC(4.28)
Figure 4.10 (Filtering a period signal) shows the output changes as we vary the lter's cutofrequency. Note how the signal's spectrum extends well above its fundamental frequency. Havinga cuto frequency ten times higher than the fundamental does perceptibly change the outputwaveform, rounding the leading and trailing edges. As the cuto frequency decreases (center, thenleft), the rounding becomes more prominent, with the leftmost waveform showing a small ripple.
Exercise 4.11 (Solution on p. 153.)
What is the average value of each output waveform? The correct answer may surprise you.
This example also illustrates the impact a lowpass lter can have on a waveform. The simple RC lter usedhere has a rather gradual frequency response, which means that higher harmonics are smoothly suppressed.Later, we will describe lters that have much more rapidly varying frequency responses, allowing a muchmore dramatic selection of the input's Fourier coecients.
More importantly, we have calculated the output of a circuit to a periodic input without writing, much lesssolving, the dierential equation governing the circuit's behavior. Furthermore, we made these calculationsentirely in the frequency domain. Using Fourier series, we can calculate how any linear circuit will respondto a periodic input.
4.8 Derivation of the Fourier Transform13
Fourier series clearly open the frequency domain as an interesting and useful way of determining how circuitsand systems respond to periodic input signals. Can we use similar techniques for nonperiodic signals? Whatis the response of the lter to a single pulse? Addressing these issues requires us to nd the Fourier spectrumof all signals, both periodic and nonperiodic ones. We need a denition for the Fourier spectrum of a signal,periodic or not. This spectrum is calculated by what is known as the Fourier transform.
Let sT (t) be a periodic signal having period T . We want to consider what happens to this signal'sspectrum as we let the period become longer and longer. We denote the spectrum for any assumed value ofthe period by ck (T ). We calculate the spectrum according to the familiar formula
ck (T ) =1T
∫ T2
−(T2 )
sT (t) e−( j2πktT )dt (4.29)
where we have used a symmetric placement of the integration interval about the origin for subsequentderivational convenience. Let f be a xed frequency equaling k
T ; we vary the frequency index k proportionallyas we increase the period. Dene
ST (f) ≡ Tck (T ) =∫ T
2
−(T2 )
sT (t) e−(j2πft)dt (4.30)
making the corresponding Fourier series
sT (t) =∞∑
k=−∞
(ST (f) ej2πft 1
T
)(4.31)
13This content is available online at <http://cnx.org/content/m0046/2.19/>.

127
As the period increases, the spectral lines become closer together, becoming a continuum. Therefore,
limT→∞
sT (t) ≡ s (t) =∫ ∞
−∞S (f) ej2πftdf (4.32)
with
S (f) =∫ ∞
−∞s (t) e−(j2πft)dt (4.33)
S (f) is the Fourier transform of s (t) (the Fourier transform is symbolically denoted by the uppercase versionof the signal's symbol) and is dened for any signal for which the integral ((4.33)) converges.
Example 4.4Let's calculate the Fourier transform of the pulse signal (Section 2.2.5: Pulse), p (t).
P (f) =∫ ∞
−∞p (t) e−(j2πft)dt =
∫ ∆
0
e−(j2πft)dt =1
− (j2πf)
(e−(j2πf∆) − 1
)
P (f) = e−(j2πf∆) sin (πf∆)πf
Note how closely this result resembles the expression for Fourier series coecients of the periodicpulse signal (4.10).
Spectrum
-20 -10 0 10 200
0.2T=5
Frequency (Hz)
Spe
ctra
l Mag
nitu
de
0
0.2T=1
Spe
ctra
l Mag
nitu
de
Figure 4.11: The upper plot shows the magnitude of the Fourier series spectrum for the case of T = 1with the Fourier transform of p (t) shown as a dashed line. For the bottom panel, we expanded the periodto T = 5, keeping the pulse's duration xed at 0.2, and computed its Fourier series coecients.
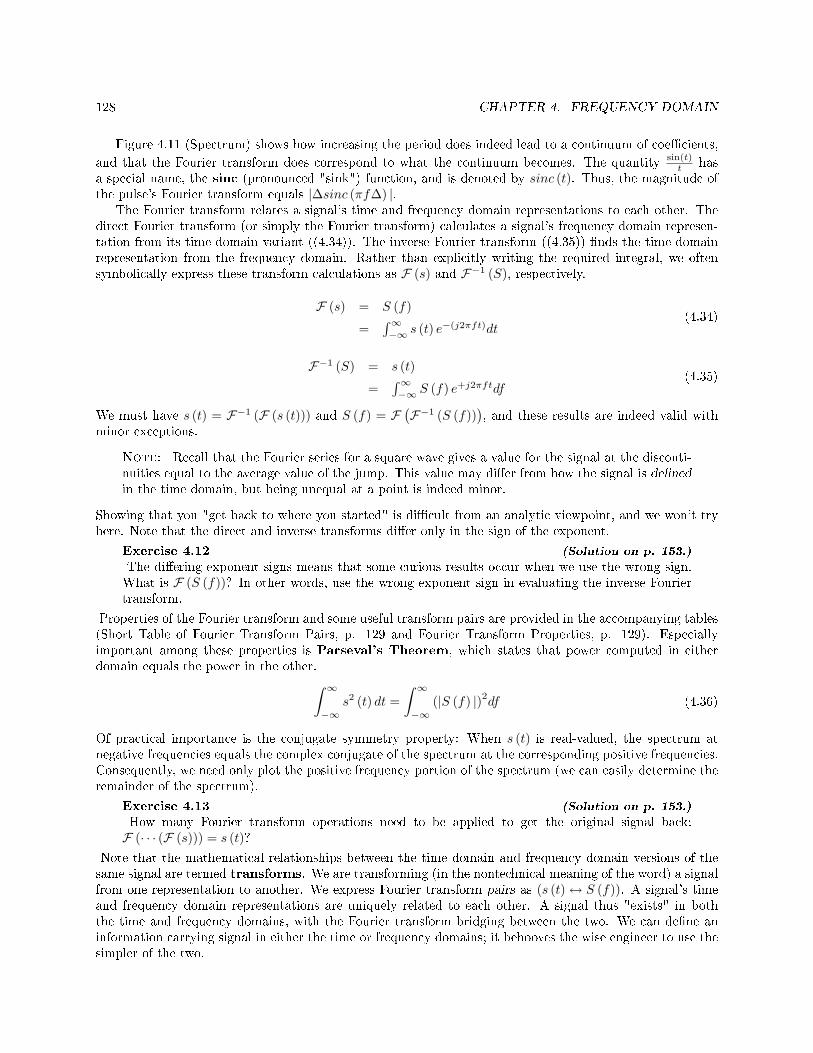
128 CHAPTER 4. FREQUENCY DOMAIN
Figure 4.11 (Spectrum) shows how increasing the period does indeed lead to a continuum of coecients,and that the Fourier transform does correspond to what the continuum becomes. The quantity sin(t)
t hasa special name, the sinc (pronounced "sink") function, and is denoted by sinc (t). Thus, the magnitude ofthe pulse's Fourier transform equals |∆sinc (πf∆) |.
The Fourier transform relates a signal's time and frequency domain representations to each other. Thedirect Fourier transform (or simply the Fourier transform) calculates a signal's frequency domain represen-tation from its time-domain variant ((4.34)). The inverse Fourier transform ((4.35)) nds the time-domainrepresentation from the frequency domain. Rather than explicitly writing the required integral, we oftensymbolically express these transform calculations as F (s) and F−1 (S), respectively.
F (s) = S (f)
=∫∞−∞ s (t) e−(j2πft)dt
(4.34)
F−1 (S) = s (t)
=∫∞−∞ S (f) e+j2πftdf
(4.35)
We must have s (t) = F−1 (F (s (t))) and S (f) = F(F−1 (S (f))
), and these results are indeed valid with
minor exceptions.
Note: Recall that the Fourier series for a square wave gives a value for the signal at the disconti-nuities equal to the average value of the jump. This value may dier from how the signal is denedin the time domain, but being unequal at a point is indeed minor.
Showing that you "get back to where you started" is dicult from an analytic viewpoint, and we won't tryhere. Note that the direct and inverse transforms dier only in the sign of the exponent.
Exercise 4.12 (Solution on p. 153.)
The diering exponent signs means that some curious results occur when we use the wrong sign.What is F (S (f))? In other words, use the wrong exponent sign in evaluating the inverse Fouriertransform.
Properties of the Fourier transform and some useful transform pairs are provided in the accompanying tables(Short Table of Fourier Transform Pairs, p. 129 and Fourier Transform Properties, p. 129). Especiallyimportant among these properties is Parseval's Theorem, which states that power computed in eitherdomain equals the power in the other.∫ ∞
−∞s2 (t) dt =
∫ ∞
−∞(|S (f) |)2df (4.36)
Of practical importance is the conjugate symmetry property: When s (t) is real-valued, the spectrum atnegative frequencies equals the complex conjugate of the spectrum at the corresponding positive frequencies.Consequently, we need only plot the positive frequency portion of the spectrum (we can easily determine theremainder of the spectrum).
Exercise 4.13 (Solution on p. 153.)
How many Fourier transform operations need to be applied to get the original signal back:F (· · · (F (s))) = s (t)?
Note that the mathematical relationships between the time domain and frequency domain versions of thesame signal are termed transforms. We are transforming (in the nontechnical meaning of the word) a signalfrom one representation to another. We express Fourier transform pairs as (s (t) ↔ S (f)). A signal's timeand frequency domain representations are uniquely related to each other. A signal thus "exists" in boththe time and frequency domains, with the Fourier transform bridging between the two. We can dene aninformation carrying signal in either the time or frequency domains; it behooves the wise engineer to use thesimpler of the two.

129
A common misunderstanding is that while a signal exists in both the time and frequency domains, a singleformula expressing a signal must contain only time or frequency: Both cannot be present simultaneously.This situation mirrors what happens with complex amplitudes in circuits: As we reveal how communicationssystems work and are designed, we will dene signals entirely in the frequency domain without explicitlynding their time domain variants. This idea is shown in another module (Section 4.6) where we deneFourier series coecients according to letter to be transmitted. Thus, a signal, though most familiarlydened in the time-domain, really can be dened equally as well (and sometimes more easily) in the frequencydomain. For example, impedances depend on frequency and the time variable cannot appear.
We will learn (Section 4.9) that nding a linear, time-invariant system's output in the time domain canbe most easily calculated by determining the input signal's spectrum, performing a simple calculation in thefrequency domain, and inverse transforming the result. Furthermore, understanding communications andinformation processing systems requires a thorough understanding of signal structure and of how systemswork in both the time and frequency domains.
The only diculty in calculating the Fourier transform of any signal occurs when we have periodic signals(in either domain). Realizing that the Fourier series is a special case of the Fourier transform, we simplycalculate the Fourier series coecients instead, and plot them along with the spectra of nonperiodic signalson the same frequency axis.
Short Table of Fourier Transform Pairs
s (t) S (f)
e−(at)u (t) 1j2πf+a
e(−a)|t| 2a4π2f2+a2
p (t) =
1 if |t| < ∆2
0 if |t| > ∆2
sin(πf∆)πf
sin(2πWt)πt S (f) =
1 if |f | < W
0 if |f | > W

130 CHAPTER 4. FREQUENCY DOMAIN
Fourier Transform Properties
Time-Domain Frequency Domain
Linearity a1s1 (t) + a2s2 (t) a1S1 (f) + a2S2 (f)
Conjugate Symmetry s (t) ∈ R S (f) = S (−f)∗
Even Symmetry s (t) = s (−t) S (f) = S (−f)
Odd Symmetry s (t) = − (s (−t)) S (f) = − (S (−f))
Scale Change s (at) 1|a|S
(fa
)Time Delay s (t− τ) e−(j2πfτ)S (f)
Complex Modulation ej2πf0ts (t) S (f − f0)
Amplitude Modulation by Cosine s (t) cos (2πf0t)S(f−f0)+S(f+f0)
2
Amplitude Modulation by Sine s (t) sin (2πf0t)S(f−f0)−S(f+f0)
2j
Dierentiation ddts (t) j2πfS (f)
Integration∫ t
−∞ s (α) dα 1j2πf S (f) if S (0) = 0
Multiplication by t ts (t) 1−(j2π)
ddf S (f)
Area∫∞−∞ s (t) dt S (0)
Value at Origin s (0)∫∞−∞ S (f) df
Parseval's Theorem∫∞−∞ (|s (t) |)2dt
∫∞−∞ (|S (f) |)2df
Example 4.5In communications, a very important operation on a signal s (t) is to amplitude modulate it.Using this operation more as an example rather than elaborating the communications aspects here,we want to compute the Fourier transform the spectrum of
(1 + s (t)) cos (2πfct)
Thus,(1 + s (t)) cos (2πfct) = cos (2πfct) + s (t) cos (2πfct)
For the spectrum of cos (2πfct), we use the Fourier series. Its period is 1fc, and its only nonzero
Fourier coecients are c±1 = 12 . The second term is not periodic unless s (t) has the same period
as the sinusoid. Using Euler's relation, the spectrum of the second term can be derived as
s (t) cos (2πfct) =∫ ∞
−∞S (f) ej2πftdf cos (2πfct)
Using Euler's relation for the cosine,
(s (t) cos (2πfct)) =12
∫ ∞
−∞S (f) ej2π(f+fc)tdf +
12
∫ ∞
−∞S (f) ej2π(f−fc)tdf
(s (t) cos (2πfct)) =12
∫ ∞
−∞S (f − fc) ej2πftdf +
12
∫ ∞
−∞S (f + fc) ej2πftdf
(s (t) cos (2πfct)) =∫ ∞
−∞
S (f − fc) + S (f + fc)2
ej2πftdf

131
Exploiting the uniqueness property of the Fourier transform, we have
F (s (t) cos (2πfct)) =S (f − fc) + S (f + fc)
2(4.37)
This component of the spectrum consists of the original signal's spectrum delayed and advanced infrequency. The spectrum of the amplitude modulated signal is shown in Figure 4.12.
S(f)
fW–W
X(f)
f–fc+W–fc–W fc+Wfc–W–fc fc
S(f–fc)S(f+fc)
Figure 4.12: A signal which has a triangular shaped spectrum is shown in the top plot. Its highestfrequency the largest frequency containing power is W Hz. Once amplitude modulated, the resultingspectrum has "lines" corresponding to the Fourier series components at ±fc and the original triangularspectrum shifted to components at ±fc and scaled by 1
2.
Note how in this gure the signal s (t) is dened in the frequency domain. To nd its timedomain representation, we simply use the inverse Fourier transform.
Exercise 4.14 (Solution on p. 153.)
What is the signal s (t) that corresponds to the spectrum shown in the upper panel of Figure 4.12?
Exercise 4.15 (Solution on p. 153.)
What is the power in x (t), the amplitude-modulated signal? Try the calculation in both the timeand frequency domains.
In this example, we call the signal s (t) a baseband signal because its power is contained at low frequencies.Signals such as speech and the Dow Jones averages are baseband signals. The baseband signal's bandwidthequals W , the highest frequency at which it has power. Since x (t)'s spectrum is conned to a frequency bandnot close to the origin (we assume (fc W )), we have a bandpass signal. The bandwidth of a bandpasssignal is not its highest frequency, but the range of positive frequencies where the signal has power. Thus,in this example, the bandwidth is 2WHz. Why a signal's bandwidth should depend on its spectral shapewill become clear once we develop communications systems.
4.9 Linear Time Invariant Systems14
When we apply a periodic input to a linear, time-invariant system, the output is periodic and has Fourierseries coecients equal to the product of the system's frequency response and the input's Fourier coecients(Filtering Periodic Signals (4.27)). The way we derived the spectrum of non-periodic signal from periodicones makes it clear that the same kind of result works when the input is not periodic: If x (t) serves as
14This content is available online at <http://cnx.org/content/m0048/2.18/>.

132 CHAPTER 4. FREQUENCY DOMAIN
the input to a linear, time-invariant system having frequency response H (f), the spectrum of the output isX (f) H (f).
Example 4.6Let's use this frequency-domain input-output relationship for linear, time-invariant systems tond a formula for the RC-circuit's response to a pulse input. We have expressions for the input'sspectrum and the system's frequency response.
P (f) = e−(jπf∆) sin (πf∆)πf
(4.38)
H (f) =1
1 + j2πfRC(4.39)
Thus, the output's Fourier transform equals
Y (f) = e−(jπf∆) sin (πf∆)πf
11 + j2πfRC
(4.40)
You won't nd this Fourier transform in our table, and the required integral is dicult to evaluateas the expression stands. This situation requires cleverness and an understanding of the Fouriertransform's properties. In particular, recall Euler's relation for the sinusoidal term and note thefact that multiplication by a complex exponential in the frequency domain amounts to a time delay.Let's momentarily make the expression for Y (f) more complicated.
e−(jπf∆) sin(πf∆)πf = e−(jπf∆) ejπf∆−e−(jπf∆)
j2πf
= 1j2πf
(1− e−(j2πf∆)
) (4.41)
Consequently,
Y (f) =1
j2πf
(1− e−(jπf∆)
) 11 + j2πfRC
(4.42)
The table of Fourier transform properties (Fourier Transform Properties, p. 129) suggests thinkingabout this expression as a product of terms.
• Multiplication by 1j2πf means integration.
• Multiplication by the complex exponential e−(j2πf∆) means delay by ∆ seconds in the timedomain.
• The term 1− e−(j2πf∆) means, in the time domain, subtract the time-delayed signal from itsoriginal.
• The inverse transform of the frequency response is 1RC e−( t
RC )u (t).
We can translate each of these frequency-domain products into time-domain operations in any orderwe like because the order in which multiplications occur doesn't aect the result. Let's start withthe product of 1
j2πf (integration in the time domain) and the transfer function:
1j2πf
11 + j2πfRC
↔(1− e−( t
RC ))
u (t) (4.43)
The middle term in the expression for Y (f) consists of the dierence of two terms: the constant1 and the complex exponential e−(j2πf∆). Because of the Fourier transform's linearity, we simplysubtract the results.
Y (f) ↔(1− e−( t
RC ))
u (t)−(1− e−( t−∆
RC ))
u (t−∆) (4.44)

133
Note that in delaying the signal how we carefully included the unit step. The second term in thisresult does not begin until t = ∆. Thus, the waveforms shown in the Filtering Periodic Signals(Figure 4.10: Filtering a period signal) example mentioned above are exponentials. We say thatthe time constant of an exponentially decaying signal equals the time it takes to decrease by 1
eof its original value. Thus, the time-constant of the rising and falling portions of the output equalthe product of the circuit's resistance and capacitance.
Exercise 4.16 (Solution on p. 153.)
Derive the lter's output by considering the terms in (4.41) in the order given. Integrate last ratherthan rst. You should get the same answer.
In this example, we used the table extensively to nd the inverse Fourier transform, relying mostly on whatmultiplication by certain factors, like 1
j2πf and e−(j2πf∆), meant. We essentially treated multiplication
by these factors as if they were transfer functions of some ctitious circuit. The transfer function 1j2πf
corresponded to a circuit that integrated, and e−(j2πf∆) to one that delayed. We even implicitly interpretedthe circuit's transfer function as the input's spectrum! This approach to nding inverse transforms breakingdown a complicated expression into products and sums of simple components is the engineer's way ofbreaking down the problem into several subproblems that are much easier to solve and then gluing the resultstogether. Along the way we may make the system serve as the input, but in the rule Y (f) = X (f) H (f),which term is the input and which is the transfer function is merely a notational matter (we labeled onefactor with an X and the other with an H).
4.9.1 Transfer Functions
The notion of a transfer function applies well beyond linear circuits. Although we don't have all we needto demonstrate the result as yet, all linear, time-invariant systems have a frequency-domain input-outputrelation given by the product of the input's Fourier transform and the system's transfer function. Thus,linear circuits are a special case of linear, time-invariant systems. As we tackle more sophisticated problemsin transmitting, manipulating, and receiving information, we will assume linear systems having certainproperties (transfer functions) without worrying about what circuit has the desired property. At this point,you may be concerned that this approach is glib, and rightly so. Later we'll show that by involving softwarethat we really don't need to be concerned about constructing a transfer function from circuit elements andop-amps.
4.9.2 Commutative Transfer Functions
Another interesting notion arises from the commutative property of multiplication (exploited in an exampleabove (Example 4.6)): We can rather arbitrarily chose an order in which to apply each product. Consider acascade of two linear, time-invariant systems. Because the Fourier transform of the rst system's output isX (f) H1 (f) and it serves as the second system's input, the cascade's output spectrum is X (f) H1 (f) H2 (f).Because this product also equals X (f) H2 (f) H1 (f), the cascade having the linear systems in the oppositeorder yields the same result. Furthermore, the cascade acts like a single linear system, having transferfunction H1 (f) H2 (f). This result applies to other congurations of linear, time-invariant systems as well;see this Frequency Domain Problem (Problem 4.12). Engineers exploit this property by determining whattransfer function they want, then breaking it down into components arranged according to standard congu-rations. Using the fact that op-amp circuits can be connected in cascade with the transfer function equalingthe product of its component's transfer function (see this analog signal processing problem (Problem 3.37)),we nd a ready way of realizing designs. We now understand why op-amp implementations of transferfunctions are so important.

134 CHAPTER 4. FREQUENCY DOMAIN
4.10 Modeling the Speech Signal15
Vocal Tract
Nasal Cavity
Lungs
Vocal Cords
Tongue
Teeth
Lips
Oral Cavity
Air Flow
Figure 4.13: The vocal tract is shown in cross-section. Air pressure produced by the lungs forcesair through the vocal cords that, when under tension, produce pus of air that excite resonances in thevocal and nasal cavities. What are not shown are the brain and the musculature that control the entirespeech production process.
15This content is available online at <http://cnx.org/content/m0049/2.25/>.

135
Model of the Vocal Tract
VocalTract
pT(t) s(t)VocalCordsLungs
l(t)
neuralcontrol
neuralcontrol
Figure 4.14: The systems model for the vocal tract. The signals l (t), pT (t), and s (t) are the airpressure provided by the lungs, the periodic pulse output provided by the vocal cords, and the speechoutput respectively. Control signals from the brain are shown as entering the systems from the top.Clearly, these come from the same source, but for modeling purposes we describe them separately sincethey control dierent aspects of the speech signal.
The information contained in the spoken word is conveyed by the speech signal. Because we shall analyzeseveral speech transmission and processing schemes, we need to understand the speech signal's structure what's special about the speech signal and how we can describe and model speech production. Thismodeling eort consists of nding a system's description of how relatively unstructured signals, arising fromsimple sources, are given structure by passing them through an interconnection of systems to yield speech.For speech and for many other situations, system choice is governed by the physics underlying the actualproduction process. Because the fundamental equation of acoustics the wave equation applies here andis linear, we can use linear systems in our model with a fair amount of accuracy. The naturalness of linearsystem models for speech does not extend to other situations. In many cases, the underlying mathematicsgoverned by the physics, biology, and/or chemistry of the problem are nonlinear, leaving linear systemsmodels as approximations. Nonlinear models are far more dicult at the current state of knowledge tounderstand, and information engineers frequently prefer linear models because they provide a greater levelof comfort, but not necessarily a sucient level of accuracy.
Figure 4.13 (Vocal Tract) shows the actual speech production system and Figure 4.14 (Model of the VocalTract) shows the model speech production system. The characteristics of the model depends on whetheryou are saying a vowel or a consonant. We concentrate rst on the vowel production mechanism. Whenthe vocal cords are placed under tension by the surrounding musculature, air pressure from the lungs causesthe vocal cords to vibrate. To visualize this eect, take a rubber band and hold it in front of your lips. Ifheld open when you blow through it, the air passes through more or less freely; this situation correspondsto "breathing mode". If held tautly and close together, blowing through the opening causes the sides of therubber band to vibrate. This eect works best with a wide rubber band. You can imagine what the airowis like on the opposite side of the rubber band or the vocal cords. Your lung power is the simple sourcereferred to earlier; it can be modeled as a constant supply of air pressure. The vocal cords respond to thisinput by vibrating, which means the output of this system is some periodic function.
Exercise 4.17 (Solution on p. 153.)
Note that the vocal cord system takes a constant input and produces a periodic airow thatcorresponds to its output signal. Is this system linear or nonlinear? Justify your answer.
Singers modify vocal cord tension to change the pitch to produce the desired musical note. Vocal cordtension is governed by a control input to the musculature; in system's models we represent control inputs assignals coming into the top or bottom of the system. Certainly in the case of speech and in many other casesas well, it is the control input that carries information, impressing it on the system's output. The change ofsignal structure resulting from varying the control input enables information to be conveyed by the signal,a process generically known as modulation. In singing, musicality is largely conveyed by pitch; in westernspeech, pitch is much less important. A sentence can be read in a monotone fashion without completely

136 CHAPTER 4. FREQUENCY DOMAIN
destroying the information expressed by the sentence. However, the dierence between a statement and aquestion is frequently expressed by pitch changes. For example, note the sound dierences between "Let'sgo to the park." and "Let's go to the park?";
For some consonants, the vocal cords vibrate just as in vowels. For example, the so-called nasal sounds"n" and "m" have this property. For others, the vocal cords do not produce a periodic output. Going back tomechanism, when consonants such as "f" are produced, the vocal cords are placed under much less tension,which results in turbulent ow. The resulting output airow is quite erratic, so much so that we describe itas being noise. We dene noise carefully later when we delve into communication problems.
The vocal cords' periodic output can be well described by the periodic pulse train pT (t) as shown in theperiodic pulse signal (Figure 4.1), with T denoting the pitch period. The spectrum of this signal (4.9) containsharmonics of the frequency 1
T , what is known as the pitch frequency or the fundamental frequencyF0. The primary dierence between adult male and female/prepubescent speech is pitch. Before puberty,pitch frequency for normal speech ranges between 150-400 Hz for both males and females. After puberty,the vocal cords of males undergo a physical change, which has the eect of lowering their pitch frequencyto the range 80-160 Hz. If we could examine the vocal cord output, we could probably discern whether thespeaker was male or female. This dierence is also readily apparent in the speech signal itself.
To simplify our speech modeling eort, we shall assume that the pitch period is constant. With thissimplication, we collapse the vocal-cord-lung system as a simple source that produces the periodic pulsesignal (Figure 4.14 (Model of the Vocal Tract)). The sound pressure signal thus produced enters the mouthbehind the tongue, creates acoustic disturbances, and exits primarily through the lips and to some extentthrough the nose. Speech specialists tend to name the mouth, tongue, teeth, lips, and nasal cavity the vocaltract. The physics governing the sound disturbances produced in the vocal tract and those of an organpipe are quite similar. Whereas the organ pipe has the simple physical structure of a straight tube, thecross-section of the vocal tract "tube" varies along its length because of the positions of the tongue, teeth,and lips. It is these positions that are controlled by the brain to produce the vowel sounds. Spreading thelips, bringing the teeth together, and bringing the tongue toward the front portion of the roof of the mouthproduces the sound "ee." Rounding the lips, spreading the teeth, and positioning the tongue toward theback of the oral cavity produces the sound "oh." These variations result in a linear, time-invariant systemthat has a frequency response typied by several peaks, as shown in Figure 4.15 (Speech Spectrum).
These peaks are known as formants. Thus, speech signal processors would say that the sound "oh" hasa higher rst formant frequency than the sound "ee," with F2 being much higher during "ee." F2 and F3(the second and third formants) have more energy in "ee" than in "oh." Rather than serving as a lter,rejecting high or low frequencies, the vocal tract serves to shape the spectrum of the vocal cords. In thetime domain, we have a periodic signal, the pitch, serving as the input to a linear system. We know thatthe outputthe speech signal we utter and that is heard by others and ourselveswill also be periodic.Example time-domain speech signals are shown in Figure 4.15 (Speech Spectrum), where the periodicity isquite apparent.
Exercise 4.18 (Solution on p. 153.)
From the waveform plots shown in Figure 4.15 (Speech Spectrum), determine the pitch period andthe pitch frequency.
Since speech signals are periodic, speech has a Fourier series representation given by a linear circuit's responseto a periodic signal (4.27). Because the acoustics of the vocal tract are linear, we know that the spectrum ofthe output equals the product of the pitch signal's spectrum and the vocal tract's frequency response. Wethus obtain the fundamental model of speech production.
S (f) = PT (f) HV (f) (4.45)
Here, HV (f) is the transfer function of the vocal tract system. The Fourier series for the vocal cords' output,derived in this equation (p. 112), is
ck = Ae−( jπk∆T ) sin
(πk∆
T
)πk
(4.46)

137
Speech Spectrum
0 5000-20
-10
0
10
20
30
F1
Spe
ctra
l Mag
nitu
de (
dB)
Frequency (Hz)F2 F3 F4 F5
“oh”
0 5000-20
-10
0
10
20
30
F1Frequency (Hz)
F2 F3 F4F5
“ee”
0 0.005 0.01 0.015 0.02-0.5
0
0.5
Time (s)
“oh”
Am
plitu
de
0 0.005 0.01 0.015 0.02-0.5
0
0.5
Time (s)
“ee”
Figure 4.15: The ideal frequency response of the vocal tract as it produces the sounds "oh" and"ee" are shown on the top left and top right, respectively. The spectral peaks are known as formants,and are numbered consecutively from low to high frequency. The bottom plots show speech waveformscorresponding to these sounds.
and is plotted on the top in Figure 4.16 (voice spectrum). If we had, for example, a male speaker with abouta 110 Hz pitch (T ≈ 9.1ms) saying the vowel "oh", the spectrum of his speech predicted by our model isshown in Figure 4.16(b) (voice spectrum).
The model spectrum idealizes the measured spectrum, and captures all the important features. Themeasured spectrum certainly demonstrates what are known as pitch lines, and we realize from our modelthat they are due to the vocal cord's periodic excitation of the vocal tract. The vocal tract's shaping of theline spectrum is clearly evident, but dicult to discern exactly, especially at the higher frequencies. Themodel transfer function for the vocal tract makes the formants much more readily evident.
Exercise 4.19 (Solution on p. 153.)
The Fourier series coecients for speech are related to the vocal tract's transfer function only atthe frequencies k
T , k ∈ 1, 2, . . . ; see previous result (4.9). Would male or female speech tend tohave a more clearly identiable formant structure when its spectrum is computed? Consider, forexample, how the spectrum shown on the right in Figure 4.16 (voice spectrum) would change if thepitch were twice as high (≈ 300Hz).

138 CHAPTER 4. FREQUENCY DOMAIN
voice spectrum
(a) pulse
(b) voice spectrum
Figure 4.16: The vocal tract's transfer function, shown as the thin, smooth line, is superimposed onthe spectrum of actual male speech corresponding to the sound "oh." The pitch lines corresponding toharmonics of the pitch frequency are indicated. (a) The vocal cords' output spectrum PT (f). (b) Thevocal tract's transfer function, HV (f) and the speech spectrum.

139
spectrogram
Time (s)
Fre
quen
cy (
Hz)
0 0.2 0.4 0.6 0.8 1 1.20
1000
2000
3000
4000
5000
Ri ce Uni ver si ty
Figure 4.17: Displayed is the spectrogram of the author saying "Rice University." Blue indicates lowenergy portion of the spectrum, with red indicating the most energetic portions. Below the spectrogramis the time-domain speech signal, where the periodicities can be seen.
When we speak, pitch and the vocal tract's transfer function are not static; they change according totheir control signals to produce speech. Engineers typically display how the speech spectrum changes overtime with what is known as a spectrogram (Section 5.10) Figure 4.17 (spectrogram). Note how the linespectrum, which indicates how the pitch changes, is visible during the vowels, but not during the consonants(like the ce in "Rice").
The fundamental model for speech indicates how engineers use the physics underlying the signal gen-eration process and exploit its structure to produce a systems model that suppresses the physics whileemphasizing how the signal is "constructed." From everyday life, we know that speech contains a wealth ofinformation. We want to determine how to transmit and receive it. Ecient and eective speech transmis-sion requires us to know the signal's properties and its structure (as expressed by the fundamental model ofspeech production). We see from Figure 4.17 (spectrogram), for example, that speech contains signicantenergy from zero frequency up to around 5 kHz.
Eective speech transmission systems must be able to cope with signals having this bandwidth. Itis interesting that one system that does not support this 5 kHz bandwidth is the telephone: Telephonesystems act like a bandpass lter passing energy between about 200 Hz and 3.2 kHz. The most important

140 CHAPTER 4. FREQUENCY DOMAIN
consequence of this ltering is the removal of high frequency energy. In our sample utterance, the "ce" soundin "Rice"" contains most of its energy above 3.2 kHz; this ltering eect is why it is extremely dicult todistinguish the sounds "s" and "f" over the telephone. Try this yourself: Call a friend and determine if theycan distinguish between the words "six" and "x". If you say these words in isolation so that no contextprovides a hint about which word you are saying, your friend will not be able to tell them apart. Radio doessupport this bandwidth (see more about AM and FM radio systems (Section 6.11)).
Ecient speech transmission systems exploit the speech signal's special structure: What makes speechspeech? You can conjure many signals that span the same frequencies as speechcar engine sounds, violinmusic, dog barksbut don't sound at all like speech. We shall learn later that transmission of any 5 kHzbandwidth signal requires about 80 kbps (thousands of bits per second) to transmit digitally. Speech signalscan be transmitted using less than 1 kbps because of its special structure. To reduce the "digital bandwidth"so drastically means that engineers spent many years to develop signal processing and coding methods thatcould capture the special characteristics of speech without destroying how it sounds. If you used a speechtransmission system to send a violin sound, it would arrive horribly distorted; speech transmitted the sameway would sound ne.
Exploiting the special structure of speech requires going beyond the capabilities of analog signal processingsystems. Many speech transmission systems work by nding the speaker's pitch and the formant frequencies.Fundamentally, we need to do more than ltering to determine the speech signal's structure; we need tomanipulate signals in more ways than are possible with analog systems. Such exibility is achievable (butnot without some loss) with programmable digital systems.
4.11 Frequency Domain Problems16
Problem 4.1: Simple Fourier SeriesFind the complex Fourier series representations of the following signals without explicitly calculating Fourierintegrals. What is the signal's period in each case?
a) s (t) = sin (t)b) s (t) = sin2 (t)c) s (t) = cos (t) + 2 cos (2t)d) s (t) = cos (2t) cos (t)e) s (t) = cos
(10πt + π
6
)(1 + cos (2πt))
f) s (t) given by the depicted waveform (Figure 4.18).
t
s(t)1
18
14 13
8
Figure 4.18
Problem 4.2: Fourier SeriesFind the Fourier series representation for the following periodic signals (Figure 4.19). For the third signal,
16This content is available online at <http://cnx.org/content/m10350/2.32/>.

141
t
s(t)
1 2 3
1
(a)
t
s(t)
1 2 3
1
(b)
t
s(t)
1 2 3
1
4
(c)
Figure 4.19
+ –1
1
+–
1
1
vin(t)vout(t)
Figure 4.20
nd the complex Fourier series for the triangle wave without performing the usual Fourier integrals. Hint:How is this signal related to one for which you already have the series?Problem 4.3: Phase DistortionWe can learn about phase distortion by returning to circuits and investigate the following circuit (Fig-ure 4.20).
a) Find this lter's transfer function.b) Find the magnitude and phase of this transfer function. How would you characterize this circuit?c) Let vin (t) be a square-wave of period T . What is the Fourier series for the output voltage?d) Use Matlab to nd the output's waveform for the cases T = 0.01 and T = 2. What value of T delineates
the two kinds of results you found? The software in fourier2.m might be useful.e) Instead of the depicted circuit, the square wave is passed through a system that delays its input, which

142 CHAPTER 4. FREQUENCY DOMAIN
applies a linear phase shift to the signal's spectrum. Let the delay τ be T4 . Use the transfer function
of a delay to compute using Matlab the Fourier series of the output. Show that the square wave isindeed delayed.
Problem 4.4: Approximating Periodic SignalsOften, we want to approximate a reference signal by a somewhat simpler signal. To assess the quality ofan approximation, the most frequently used error measure is the mean-squared error. For a periodic signals (t),
ε2 =1T
∫ T
0
(s (t)− s (t))2dt
where s (t) is the reference signal and s (t) its approximation. One convenient way of nding approximationsfor periodic signals is to truncate their Fourier series.
s (t) =K∑
k=−K
(ckej 2πk
T t)
The point of this problem is to analyze whether this approach is the best (i.e., always minimizes the mean-squared error).
a) Find a frequency-domain expression for the approximation error when we use the truncated Fourierseries as the approximation.
b) Instead of truncating the series, let's generalize the nature of the approximation to including any set of2K + 1 terms: We'll always include the c0 and the negative indexed term corresponding to ck. Whatselection of terms minimizes the mean-squared error? Find an expression for the mean-squared errorresulting from your choice.
c) Find the Fourier series for the depicted signal (Figure 4.21). Use Matlab to nd the truncated approx-imation and best approximation involving two terms. Plot the mean-squared error as a function of Kfor both approximations.
1 2
1s(t)
t
Figure 4.21
Problem 4.5: Long, Hot DaysThe daily temperature is a consequence of several eects, one of them being the sun's heating. If this werethe dominant eect, then daily temperatures would be proportional to the number of daylight hours. Theplot (Figure 4.22) shows that the average daily high temperature does not behave that way.

143
0 50 100 150 200 250 300 35050
55
60
65
70
75
80
85
90
95
Day
Ave
rage
Hig
h T
empe
ratu
re
10
11
12
13
14
Daylight H
ours
Temperature
Daylight
Figure 4.22
In this problem, we want to understand the temperature component of our environment using Fourierseries and linear system theory. The le temperature.mat contains these data (daylight hours in the rstrow, corresponding average daily highs in the second) for Houston, Texas.
a) Let the length of day serve as the sole input to a system having an output equal to the average dailytemperature. Examining the plots of input and output, would you say that the system is linear or not?How did you reach you conclusion?
b) Find the rst ve terms (c0, ... , c4) of the complex Fourier series for each signal.c) What is the harmonic distortion in the two signals? Exclude c0 from this calculation.d) Because the harmonic distortion is small, let's concentrate only on the rst harmonic. What is the
phase shift between input and output signals?e) Find the transfer function of the simplest possible linear model that would describe the data. Char-
acterize and interpret the structure of this model. In particular, give a physical explanation for thephase shift.
f) Predict what the output would be if the model had no phase shift. Would days be hotter? If so, byhow much?
Problem 4.6: Fourier Transform PairsFind the Fourier or inverse Fourier transform of the following.
a) x (t) = e−(a|t|) ,b) x (t) = te−(at)u (t)
c) X (f) =
1 if |f | < W
0 if |f | > W
d) x (t) = e−(at) cos (2πf0t) u (t)
Problem 4.7: Duality in Fourier Transforms"Duality" means that the Fourier transform and the inverse Fourier transform are very similar. Conse-quently, the waveform s (t) in the time domain and the spectrum s (f) have a Fourier transform and aninverse Fourier transform, respectively, that are very similar.
a) Calculate the Fourier transform of the signal shown below (Figure 4.23(a)).b) Calculate the inverse Fourier transform of the spectrum shown below (Figure 4.23(b)).c) How are these answers related? What is the general relationship between the Fourier transform of s (t)
and the inverse transform of s (f)?

144 CHAPTER 4. FREQUENCY DOMAIN
t
s(t)1
1(a)
f
S(f)1
1(b)
Figure 4.23
Problem 4.8: Spectra of Pulse SequencesPulse sequences occur often in digital communication and in other elds as well. What are their spectralproperties?
a) Calculate the Fourier transform of the single pulse shown below (Figure 4.24(a)).b) Calculate the Fourier transform of the two-pulse sequence shown below (Figure 4.24(b)).c) Calculate the Fourier transform for the ten-pulse sequence shown in below (Figure 4.24(c)). You should
look for a general expression that holds for sequences of any length.d) Using Matlab, plot the magnitudes of the three spectra. Describe how the spectra change as the
number of repeated pulses increases.
t
1
1 2
12
(a)
t
1
1 2
12
(b)
t
1
1 2
12
3 4 5 6 7 8 9
(c)
Figure 4.24
Problem 4.9: Lowpass Filtering a Square WaveLet a square wave (period T ) serve as the input to a rst-order lowpass system constructed as a RC lter.We want to derive an expression for the time-domain response of the lter to this input.
a) First, consider the response of the lter to a simple pulse, having unit amplitude and width T2 . Derive
an expression for the lter's output to this pulse.b) Noting that the square wave is a superposition of a sequence of these pulses, what is the lter's response
to the square wave?c) The nature of this response should change as the relation between the square wave's period and the
lter's cuto frequency change. How long must the period be so that the response does not achieve arelatively constant value between transitions in the square wave? What is the relation of the lter'scuto frequency to the square wave's spectrum in this case?
Problem 4.10: Mathematics with CircuitsSimple circuits can implement simple mathematical operations, such as integration and dierentiation. Wewant to develop an active circuit (it contains an op-amp) having an output that is proportional to the

145
integral of its input. For example, you could use an integrator in a car to determine distance traveled fromthe speedometer.
a) What is the transfer function of an integrator?b) Find an op-amp circuit so that its voltage output is proportional to the integral of its input for all
signals.
Problem 4.11: Where is that sound coming from?We determine where sound is coming from because we have two ears and a brain. Sound travels at arelatively slow speed and our brain uses the fact that sound will arrive at one ear before the other. As shownhere (Figure 4.25), a sound coming from the right arrives at the left ear τ seconds after it arrives at the rightear.
τ
Soundwave
s(t)s(t-τ)
Figure 4.25
Once the brain nds this propagation delay, it can determine the sound direction. In an attempt tomodel what the brain might do, RU signal processors want to design an optimal system that delays eachear's signal by some amount then adds them together. ∆l and ∆r are the delays applied to the left and rightsignals respectively. The idea is to determine the delay values according to some criterion that is based onwhat is measured by the two ears.
a) What is the transfer function between the sound signal s (t) and the processor output y (t)?b) One way of determining the delay τ is to choose ∆l and ∆r to maximize the power in y (t). How are
these maximum-power processing delays related to τ?
Problem 4.12: Arrangements of SystemsArchitecting a system of modular components means arranging them in various congurations to achievesome overall input-output relation. For each of the following (Figure 4.26), determine the overall transferfunction between x (t) and y (t).
The overall transfer function for the cascade (rst depicted system) is particularly interesting. Whatdoes it say about the eect of the ordering of linear, time-invariant systems in a cascade?
Problem 4.13: FilteringLet the signal s (t) = sin(πt)
πt be the input to a linear, time-invariant lter having the transfer function shownbelow (Figure 4.27). Find the expression for y (t), the lter's output.

146 CHAPTER 4. FREQUENCY DOMAIN
x(t) y(t)H1(f) H2(f)
(a) system a
H1(f)
H2(f)
x(t)
x(t)
x(t)
y(t)
(b) system b
H1(f)x(t) e(t) y(t)
H2(f)
–
(c) system c
Figure 4.26
Problem 4.14: Circuits Filter!A unit-amplitude pulse with duration of one second serves as the input to an RC-circuit having transferfunction
H (f) =j2πf
4 + j2πf
a) How would you categorize this transfer function: lowpass, highpass, bandpass, other?b) Find a circuit that corresponds to this transfer function.c) Find an expression for the lter's output.
Problem 4.15: ReverberationReverberation corresponds to adding to a signal its delayed version.
a) Assuming τ represents the delay, what is the input-output relation for a reverberation system? Isthe system linear and time-invariant? If so, nd the transfer function; if not, what linearity or time-invariance criterion does reverberation violate.
b) A music group known as the ROwls is having trouble selling its recordings. The record company'sengineer gets the idea of applying dierent delay to the low and high frequencies and adding the resultto create a new musical eect. Thus, the ROwls' audio would be separated into two parts (one less

147
f
H(f)
14
14
1
Figure 4.27
than the frequency f0, the other greater than f0), these would be delayed by τl and τh respectively,and the resulting signals added. Draw a block diagram for this new audio processing system, showingits various components.
c) How does the magnitude of the system's transfer function depend on the two delays?
Problem 4.16: Echoes in Telephone SystemsA frequently encountered problem in telephones is echo. Here, because of acoustic coupling between the earpiece and microphone in the handset, what you hear is also sent to the person talking. That person thusnot only hears you, but also hears her own speech delayed (because of propagation delay over the telephonenetwork) and attenuated (the acoustic coupling gain is less than one). Furthermore, the same problemapplies to you as well: The acoustic coupling occurs in her handset as well as yours.
a) Develop a block diagram that describes this situation.b) Find the transfer function between your voice and what the listener hears.c) Each telephone contains a system for reducing echoes using electrical means. What simple system
could null the echoes?
Problem 4.17: Demodulating an AM SignalLet m (t) denote the signal that has been amplitude modulated.
x (t) = A (1 + m (t)) sin (2πfct)
Radio stations try to restrict the amplitude of the signal m (t) so that it is less than one in magnitude. Thefrequency fc is very large compared to the frequency content of the signal. What we are concerned abouthere is not transmission, but reception.
a) The so-called coherent demodulator simply multiplies the signal x (t) by a sinusoid having the samefrequency as the carrier and lowpass lters the result. Analyze this receiver and show that it works.Assume the lowpass lter is ideal.
b) One issue in coherent reception is the phase of the sinusoid used by the receiver relative to that usedby the transmitter. Assuming that the sinusoid of the receiver has a phase φ, how does the outputdepend on φ? What is the worst possible value for this phase?
c) The incoherent receiver is more commonly used because of the phase sensitivity problem inherent incoherent reception. Here, the receiver full-wave recties the received signal and lowpass lters theresult (again ideally). Analyze this receiver. Does its output dier from that of the coherent receiverin a signicant way?
Problem 4.18: Unusual Amplitude ModulationWe want to send a band-limited signal having the depicted spectrum (Figure 4.28(a)) with amplitude mod-ulation in the usual way. I.B. Dierent suggests using the square-wave carrier shown below (Figure 4.28(b)).Well, it is dierent, but his friends wonder if any technique can demodulate it.
a) Find an expression for X (f), the Fourier transform of the modulated signal.b) Sketch the magnitude of X (f), being careful to label important magnitudes and frequencies.

148 CHAPTER 4. FREQUENCY DOMAIN
1/4
S(f)
f
1
/4
(a)
t
1
1 3
(b)
Figure 4.28
r(t)
cos 2πfct
sin 2πfct
LPFW Hz
LPFW Hz
?
?
xc(t)
xs(t)?
Figure 4.29
c) What demodulation technique obviously works?d) I.B. challenges three of his friends to demodulate x (t) some other way. One friend suggests modulating
x (t) with cos(
πt2
), another wants to try modulating with cos (πt) and the third thinks cos
(3πt2
)will
work. Sketch the magnitude of the Fourier transform of the signal each student's approach produces.Which student comes closest to recovering the original signal? Why?
Problem 4.19: Sammy Falls Asleep...While sitting in ELEC 241 class, he falls asleep during a critical time when an AM receiver is being described.The received signal has the form r (t) = A (1 + m (t)) cos (2πfct + φ) where the phase φ is unknown. Themessage signal is m (t); it has a bandwidth of W Hz and a magnitude less than 1 (|m (t) | < 1). The phase φis unknown. The instructor drew a diagram (Figure 4.29) for a receiver on the board; Sammy slept throughthe description of what the unknown systems where.
a) What are the signals xc (t) and xs (t)?b) What would you put in for the unknown systems that would guarantee that the nal output contained
the message regardless of the phase?
hint: Think of a trigonometric identity that would prove useful.

149
… …
t
jam(t)
T 2T–T
A
Figure 4.30
–W W
L(f)
f–W W
R(f)
f
Figure 4.31
c) Sammy may have been asleep, but he can think of a far simpler receiver. What is it?
Problem 4.20: JammingSid Richardson college decides to set up its own AM radio station KSRR. The resident electrical engineerdecides that she can choose any carrier frequency and message bandwidth for the station. A rival collegedecides to jam its transmissions by transmitting a high-power signal that interferes with radios that try toreceive KSRR. The jamming signal jam (t) is what is known as a sawtooth wave (depicted in the followinggure (Figure 4.30)) having a period known to KSRR's engineer.
a) Find the spectrum of the jamming signal.b) Can KSRR entirely circumvent the attempt to jam it by carefully choosing its carrier frequency and
transmission bandwidth? If so, nd the station's carrier frequency and transmission bandwidth interms of T , the period of the jamming signal; if not, show why not.
Problem 4.21: AM StereoA stereophonic signal consists of a "left" signal l (t) and a "right" signal r (t) that conveys sounds comingfrom an orchestra's left and right sides, respectively. To transmit these two signals simultaneously, thetransmitter rst forms the sum signal s+ (t) = l (t) + r (t) and the dierence signal s− (t) = l (t) − r (t).Then, the transmitter amplitude-modulates the dierence signal with a sinusoid having frequency 2W , whereW is the bandwidth of the left and right signals. The sum signal and the modulated dierence signal areadded, the sum amplitude-modulated to the radio station's carrier frequency fc, and transmitted. Assumethe spectra of the left and right signals are as shown (Figure 4.31).
a) What is the expression for the transmitted signal? Sketch its spectrum.b) Show the block diagram of a stereo AM receiver that can yield the left and right signals as separate
outputs.c) What signal would be produced by a conventional coherent AM receiver that expects to receive a
standard AM signal conveying a message signal having bandwidth W?

150 CHAPTER 4. FREQUENCY DOMAIN
0 1 2 3 4 5 6 7 8 9 10-1.5
-1
-0.5
0
0.5
1
1.5
Time
Am
plitu
de
Example Transmitter Waveform
Figure 4.32
Problem 4.22: Novel AM Stereo MethodA clever engineer has submitted a patent for a new method for transmitting two signals simultaneouslyin the same transmission bandwidth as commercial AM radio. As shown (Figure 4.32), her approach is tomodulate the positive portion of the carrier with one signal and the negative portion with a second. Indetail the two message signals m1 (t) and m2 (t) are bandlimited to W Hz and have maximal amplitudesequal to 1. The carrier has a frequency fc much greater than W . The transmitted signal x (t) is given by
x (t) =
A (1 + am1 (t)) sin (2πfct) if sin (2πfct) ≥ 0
A (1 + am2 (t)) sin (2πfct) if sin (2πfct) < 0
In all cases, 0 < a < 1. The plot shows the transmitted signal when the messages are sinusoids: m1 (t) =sin (2πfmt) and m2 (t) = sin (2π2fmt) where 2fm < W . You, as the patent examiner, must determinewhether the scheme meets its claims and is useful.
a) Provide a more concise expression for the transmitted signal x (t) than given above.b) What is the receiver for this scheme? It would yield both m1 (t) and m2 (t) from x (t).c) Find the spectrum of the positive portion of the transmitted signal.d) Determine whether this scheme satises the design criteria, allowing you to grant the patent. Explain
your reasoning.
Problem 4.23: A Radical Radio IdeaAn ELEC 241 student has the bright idea of using a square wave instead of a sinusoid as an AM carrier.The transmitted signal would have the form
x (t) = A (1 + m (t)) sqT (t)
where the message signal m (t) would be amplitude-limited: |m (t) | < 1
a) Assuming the message signal is lowpass and has a bandwidth of W Hz, what values for the squarewave's period T are feasible. In other words, do some combinations of W and T prevent reception?
b) Assuming reception is possible, can standard radios receive this innovative AM transmission? If so,show how a coherent receiver could demodulate it; if not, show how the coherent receiver's outputwould be corrupted. Assume that the message bandwidth W = 5kHz.
Problem 4.24: Secret CommunicationAn amplitude-modulated secret message m (t) has the following form.
r (t) = A (1 + m (t)) cos (2π (fc + f0) t)
The message signal has a bandwidth of W Hz and a magnitude less than 1 (|m (t) | < 1). The idea is tooset the carrier frequency by f0 Hz from standard radio carrier frequencies. Thus, "o-the-shelf" coherentdemodulators would assume the carrier frequency has fc Hz. Here, f0 < W .

151
s(t)
tT
1
2T
4T
Figure 4.33
a) Sketch the spectrum of the demodulated signal produced by a coherent demodulator tuned to fc Hz.b) Will this demodulated signal be a scrambled version of the original? If so, how so; if not, why not?c) Can you develop a receiver that can demodulate the message without knowing the oset frequency fc?
Problem 4.25: Signal ScramblingAn excited inventor announces the discovery of a way of using analog technology to render music unlistenablewithout knowing the secret recovery method. The idea is to modulate the bandlimited message m (t) by aspecial periodic signal s (t) that is zero during half of its period, which renders the message unlistenable andsupercially, at least, unrecoverable (Figure 4.33).
a) What is the Fourier series for the periodic signal?b) What are the restrictions on the period T so that the message signal can be recovered from m (t) s (t)?c) ELEC 241 students think they have "broken" the inventor's scheme and are going to announce it to
the world. How would they recover the original message without having detailed knowledge of themodulating signal?

152 CHAPTER 4. FREQUENCY DOMAIN
Solutions to Exercises in Chapter 4
Solution to Exercise 4.1 (p. 110)Because of Euler's relation,
sin (2πft) =12j
e+j2πft − 12j
e−(j2πft) (4.47)
Thus, c1 = 12j , c−1 = −
(12j
), and the other coecients are zero.
Solution to Exercise 4.2 (p. 113)c0 = A∆
T . This quantity clearly corresponds to the periodic pulse signal's average value.
Solution to Exercise 4.3 (p. 114)Write the coecients of the complex Fourier series in Cartesian form as ck = Ak + jBk and substitute intothe expression for the complex Fourier series.
∞∑k=−∞
(ckej 2πkt
T
)=
∞∑k=−∞
((Ak + jBk) ej 2πkt
T
)Simplifying each term in the sum using Euler's formula,
(Ak + jBk) ej 2πktT = (Ak + jBk)
(cos(
2πktT
)+ j sin
(2πkt
T
))= Ak cos
(2πkt
T
)−Bk sin
(2πkt
T
)+ j
(Ak sin
(2πkt
T
)+ Bk cos
(2πkt
T
))We now combine terms that have the same frequency index in magnitude. Because the signal is real-valued,the coecients of the complex Fourier series have conjugate symmetry: c−k = ck
∗ or A−k = Ak andB−k = −Bk. After we add the positive-indexed and negative-indexed terms, each term in the Fourier seriesbecomes 2Ak cos
(2πkt
T
)− 2Bk sin
(2πkt
T
). To obtain the classic Fourier series (4.11), we must have 2Ak = ak
and 2Bk = −bk.
Solution to Exercise 4.4 (p. 115)The average of a set of numbers is the sum divided by the number of terms. Viewing signal integration asthe limit of a Riemann sum, the integral corresponds to the average.
Solution to Exercise 4.5 (p. 115)We found that the complex Fourier series coecients are given by ck = 2
jπk . The coecients are pureimaginary, which means ak = 0. The coecients of the sine terms are given by bk = − (2Im (ck)) so that
bk =
4πk if k odd
0 if k even
Thus, the Fourier series for the square wave is
sq (t) =∑
k∈1,3,...
(4πk
sin(
2πkt
T
))(4.48)
Solution to Exercise 4.6 (p. 117)The rms value of a sinusoid equals its amplitude divided by
√2. As a half-wave rectied sine wave is zero
during half of the period, its rms value is A2√
2.
Solution to Exercise 4.7 (p. 117)
Total harmonic distortion equalsP∞
k=2(ak2+bk
2)a12+b12 . Clearly, this quantity is most easily computed in the
frequency domain. However, the numerator equals the square of the signal's rms value minus the power inthe average and the power in the rst harmonic.

153
Solution to Exercise 4.8 (p. 120)
Total harmonic distortion in the square wave is 1− 12
(4π
)2 = 20%.
Solution to Exercise 4.9 (p. 123)
N signals directly encoded require a bandwidth of NT . Using a binary representation, we need log2 N
T . ForN = 128, the binary-encoding scheme has a factor of 7
128 = 0.05 smaller bandwidth. Clearly, binary encodingis superior.
Solution to Exercise 4.10 (p. 123)We can use N dierent amplitude values at only one frequency to represent the various letters.
Solution to Exercise 4.11 (p. 126)Because the lter's gain at zero frequency equals one, the average output values equal the respective averageinput values.
Solution to Exercise 4.12 (p. 128)
F (S (f)) =∫ ∞
−∞S (f) e−(j2πft)df =
∫ ∞
−∞S (f) e+j2πf(−t)df = s (−t)
Solution to Exercise 4.13 (p. 128)F (F (F (F (s (t))))) = s (t). We know that F (S (f)) =
∫∞−∞ S (f) e−(j2πft)df =
∫∞−∞ S (f) e+j2πf(−t)df =
s (−t). Therefore, two Fourier transforms applied to s (t) yields s (−t). We need two more to get us backwhere we started.
Solution to Exercise 4.14 (p. 131)The signal is the inverse Fourier transform of the triangularly shaped spectrum, and equals s (t) =
W(
sin(πWt)πWt
)2
Solution to Exercise 4.15 (p. 131)The result is most easily found in the spectrum's formula: the power in the signal-related part of x (t) ishalf the power of the signal s (t).
Solution to Exercise 4.16 (p. 133)
The inverse transform of the frequency response is 1RC e−( t
RC )u (t). Multiplying the frequency responseby 1 − e−(j2πf∆) means subtract from the original signal its time-delayed version. Delaying the frequencyresponse's time-domain version by ∆ results in 1
RC e−(t−∆)
RC u (t−∆). Subtracting from the undelayed signal
yields 1RC e
−tRC u (t)− 1
RC e−(t−∆)
RC u (t−∆). Now we integrate this sum. Because the integral of a sum equals thesum of the component integrals (integration is linear), we can consider each separately. Because integrationand signal-delay are linear, the integral of a delayed signal equals the delayed version of the integral. Theintegral is provided in the example (4.44).
Solution to Exercise 4.17 (p. 135)If the glottis were linear, a constant input (a zero-frequency sinusoid) should yield a constant output. Theperiodic output indicates nonlinear behavior.
Solution to Exercise 4.18 (p. 136)In the bottom-left panel, the period is about 0.009 s, which equals a frequency of 111 Hz. The bottom-rightpanel has a period of about 0.0065 s, a frequency of 154 Hz.
Solution to Exercise 4.19 (p. 137)Because males have a lower pitch frequency, the spacing between spectral lines is smaller. This closer spacingmore accurately reveals the formant structure. Doubling the pitch frequency to 300 Hz for Figure 4.16 (voicespectrum) would amount to removing every other spectral line.

154 CHAPTER 4. FREQUENCY DOMAIN

Chapter 5
Digital Signal Processing
5.1 Introduction to Digital Signal Processing1
Not only do we have analog signals signals that are real- or complex-valued functions of a continuousvariable such as time or space we can dene digital ones as well. Digital signals are sequences, functionsdened only for the integers. We thus use the notation s (n) to denote a discrete-time one-dimensional signalsuch as a digital music recording and s (m,n) for a discrete-"time" two-dimensional signal like a photo takenwith a digital camera. Sequences are fundamentally dierent than continuous-time signals. For example,continuity has no meaning for sequences.
Despite such fundamental dierences, the theory underlying digital signal processing mirrors that for ana-log signals: Fourier transforms, linear ltering, and linear systems parallel what previous chapters described.These similarities make it easy to understand the denitions and why we need them, but the similaritiesshould not be construed as "analog wannabes." We will discover that digital signal processing is not anapproximation to analog processing. We must explicitly worry about the delity of converting analog signalsinto digital ones. The music stored on CDs, the speech sent over digital cellular telephones, and the videocarried by digital television all evidence that analog signals can be accurately converted to digital ones andback again.
The key reason why digital signal processing systems have a technological advantage today is the com-puter: computations, like the Fourier transform, can be performed quickly enough to be calculated as thesignal is produced, 2 and programmability means that the signal processing system can be easily changed.This exibility has obvious appeal, and has been widely accepted in the marketplace. Programmabilitymeans that we can perform signal processing operations impossible with analog systems (circuits). We willalso discover that digital systems enjoy an algorithmic advantage that contributes to rapid processing speeds:Computations can be restructured in non-obvious ways to speed the processing. This exibility comes at aprice, a consequence of how computers work. How do computers perform signal processing?
5.2 Introduction to Computer Organization3
5.2.1 Computer Architecture
To understand digital signal processing systems, we must understand a little about how computers compute.The modern denition of a computer is an electronic device that performs calculations on data, presenting
1This content is available online at <http://cnx.org/content/m10781/2.3/>.2Taking a systems viewpoint for the moment, a system that produces its output as rapidly as the input arises is said to
be a real-time system. All analog systems operate in real time; digital ones that depend on a computer to perform systemcomputations may or may not work in real time. Clearly, we need real-time signal processing systems. Only recently havecomputers become fast enough to meet real-time requirements while performing non-trivial signal processing.
3This content is available online at <http://cnx.org/content/m10263/2.27/>.
155

156 CHAPTER 5. DIGITAL SIGNAL PROCESSING
the results to humans or other computers in a variety of (hopefully useful) ways.
Organization of a Simple Computer
CPU
Memory
I/OInterface
Keyboard DisksCRT Network
Figure 5.1: Generic computer hardware organization.
The generic computer contains input devices (keyboard, mouse, A/D (analog-to-digital) converter, etc.), acomputational unit, and output devices (monitors, printers, D/A converters). The computational unit is thecomputer's heart, and usually consists of a central processing unit (CPU), a memory, and an input/output(I/O) interface. What I/O devices might be present on a given computer vary greatly.
• A simple computer operates fundamentally in discrete time. Computers are clocked devices, in whichcomputational steps occur periodically according to ticks of a clock. This description belies clock speed:When you say "I have a 1 GHz computer," you mean that your computer takes 1 nanosecond to performeach step. That is incredibly fast! A "step" does not, unfortunately, necessarily mean a computationlike an addition; computers break such computations down into several stages, which means that theclock speed need not express the computational speed. Computational speed is expressed in units ofmillions of instructions/second (Mips). Your 1 GHz computer (clock speed) may have a computationalspeed of 200 Mips.
• Computers perform integer (discrete-valued) computations. Computer calculations can be numeric(obeying the laws of arithmetic), logical (obeying the laws of an algebra), or symbolic (obeying anylaw you like).4 Each computer instruction that performs an elementary numeric calculation anaddition, a multiplication, or a division does so only for integers. The sum or product of twointegers is also an integer, but the quotient of two integers is likely to not be an integer. How doesa computer deal with numbers that have digits to the right of the decimal point? This problem isaddressed by using the so-called oating-point representation of real numbers. At its heart, however,this representation relies on integer-valued computations.
5.2.2 Representing Numbers
Focusing on numbers, all numbers can represented by the positional notation system. 5 The b-ary positionalrepresentation system uses the position of digits ranging from 0 to b-1 to denote a number. The quantity b is
4An example of a symbolic computation is sorting a list of names.5Alternative number representation systems exist. For example, we could use stick gure counting or Roman numerals.
These were useful in ancient times, but very limiting when it comes to arithmetic calculations: ever tried to divide two Romannumerals?

157
known as the base of the number system. Mathematically, positional systems represent the positive integern as
n =∞∑
k=0
(dkbk
), dk ∈ 0, . . . , b− 1 (5.1)
and we succinctly express n in base-b as nb = dNdN−1 . . . d0. The number 25 in base 10 equals 2×101+5×100,so that the digits representing this number are d0 = 5, d1 = 2, and all other dk equal zero. This same numberin binary (base 2) equals 11001 (1× 24 + 1× 23 + 0× 22 + 0× 21 + 1× 20) and 19 in hexadecimal (base 16).Fractions between zero and one are represented the same way.
f =−1∑
k=−∞
(dkbk
), dk ∈ 0, . . . , b− 1 (5.2)
All numbers can be represented by their sign, integer and fractional parts. Complex numbers (Section 2.1)can be thought of as two real numbers that obey special rules to manipulate them.
Humans use base 10, commonly assumed to be due to us having ten ngers. Digital computers use thebase 2 or binary number representation, each digit of which is known as a bit (binary digit).
Number representations on computers
d7 d6 d5 d4 d3 d2 d1 d0unsigned 8-bit integer
s d6 d5 d4 d3 d2 d1 d0signed 8-bit integer
s s
exponent mantissafloating point
Figure 5.2: The various ways numbers are represented in binary are illustrated. The number of bytesfor the exponent and mantissa components of oating point numbers varies.
Here, each bit is represented as a voltage that is either "high" or "low," thereby representing "1" or "0,"respectively. To represent signed values, we tack on a special bitthe sign bitto express the sign. Thecomputer's memory consists of an ordered sequence of bytes, a collection of eight bits. A byte can thereforerepresent an unsigned number ranging from 0 to 255. If we take one of the bits and make it the sign bit, wecan make the same byte to represent numbers ranging from −128 to 127. But a computer cannot representall possible real numbers. The fault is not with the binary number system; rather having only a nite numberof bytes is the problem. While a gigabyte of memory may seem to be a lot, it takes an innite number of bitsto represent π. Since we want to store many numbers in a computer's memory, we are restricted to thosethat have a nite binary representation. Large integers can be represented by an ordered sequence of bytes.Common lengths, usually expressed in terms of the number of bits, are 16, 32, and 64. Thus, an unsigned32-bit number can represent integers ranging between 0 and 232 − 1 (4,294,967,295), a number almost bigenough to enumerate every human in the world!6
Exercise 5.1 (Solution on p. 204.)
For both 32-bit and 64-bit integer representations, what are the largest numbers that can berepresented if a sign bit must also be included.
6You need one more bit to do that.

158 CHAPTER 5. DIGITAL SIGNAL PROCESSING
While this system represents integers well, how about numbers having nonzero digits to the right of thedecimal point? In other words, how are numbers that have fractional parts represented? For such numbers,the binary representation system is used, but with a little more complexity. The oating-point system usesa number of bytes - typically 4 or 8 - to represent the number, but with one byte (sometimes two bytes)reserved to represent the exponent e of a power-of-two multiplier for the number - the mantissa m - expressedby the remaining bytes.
x = m2e (5.3)
The mantissa is usually taken to be a binary fraction having a magnitude in the range[12 , 1), which means
that the binary representation is such that d−1 = 1. 7 The number zero is an exception to this rule, and itis the only oating point number having a zero fraction. The sign of the mantissa represents the sign of thenumber and the exponent can be a signed integer.
A computer's representation of integers is either perfect or only approximate, the latter situation occurringwhen the integer exceeds the range of numbers that a limited set of bytes can represent. Floating pointrepresentations have similar representation problems: if the number x can be multiplied/divided by enoughpowers of two to yield a fraction lying between 1/2 and 1 that has a nite binary-fraction representation, thenumber is represented exactly in oating point. Otherwise, we can only represent the number approximately,not catastrophically in error as with integers. For example, the number 2.5 equals 0.625× 22, the fractionalpart of which has an exact binary representation. 8 However, the number 2.6 does not have an exact binaryrepresentation, and only be represented approximately in oating point. In single precision oating pointnumbers, which require 32 bits (one byte for the exponent and the remaining 24 bits for the mantissa), thenumber 2.6 will be represented as 2.600000079.... Note that this approximation has a much longer decimalexpansion. This level of accuracy may not suce in numerical calculations. Double precision oating pointnumbers consume 8 bytes, and quadruple precision 16 bytes. The more bits used in the mantissa, the greaterthe accuracy. This increasing accuracy means that more numbers can be represented exactly, but there arealways some that cannot. Such inexact numbers have an innite binary representation.9 Realizing that realnumbers can be only represented approximately is quite important, and underlies the entire eld of numericalanalysis, which seeks to predict the numerical accuracy of any computation.
Exercise 5.2 (Solution on p. 204.)
What are the largest and smallest numbers that can be represented in 32-bit oating point? in64-bit oating point that has sixteen bits allocated to the exponent? Note that both exponent andmantissa require a sign bit.
So long as the integers aren't too large, they can be represented exactly in a computer using the binarypositional notation. Electronic circuits that make up the physical computer can add and subtract integerswithout error. (This statement isn't quite true; when does addition cause problems?)
7In some computers, this normalization is taken to an extreme: the leading binary digit is not explicitly expressed, providingan extra bit to represent the mantissa a little more accurately. This convention is known as the hidden-ones notation.
8See if you can nd this representation.9Note that there will always be numbers that have an innite representation in any chosen positional system. The choice
of base denes which do and which don't. If you were thinking that base 10 numbers would solve this inaccuracy, note that1/3 = 0.333333.... has an innite representation in decimal (and binary for that matter), but has nite representation in base 3.

159
5.2.3 Computer Arithmetic and Logic
The binary addition and multiplication tables are
0 + 0 = 0
0 + 1 = 1
1 + 1 = 10
1 + 0 = 1
0× 0 = 0
0× 1 = 0
1× 1 = 1
1× 0 = 0
(5.4)
Note that if carries are ignored,10 subtraction of two single-digit binary numbers yields the same bit asaddition. Computers use high and low voltage values to express a bit, and an array of such voltages expressnumbers akin to positional notation. Logic circuits perform arithmetic operations.
Exercise 5.3 (Solution on p. 204.)
Add twenty-ve and seven in base 2. Note the carries that might occur. Why is the result "nice"?
Also note that the logical operations of AND and OR are equivalent to binary addition (again if carriesare ignored). The variables of logic indicate truth or falsehood. A
⋂B, the AND of A and B, represents a
statement that both A and B must be true for the statement to be true. You use this kind of statementto tell search engines that you want to restrict hits to cases where both of the events A and B occur.A⋃
B, the OR of A and B, yields a value of truth if either is true. Note that if we represent truth by a"1" and falsehood by a "0," binary multiplication corresponds to AND and addition (ignoring carries) toOR. The Irish mathematician George Boole discovered this equivalence in the mid-nineteenth century. Itlaid the foundation for what we now call Boolean algebra, which expresses as equations logical statements.More importantly, any computer using base-2 representations and arithmetic can also easily evaluate logicalstatements. This fact makes an integer-based computational device much more powerful than might beapparent.
5.3 The Sampling Theorem11
5.3.1 Analog-to-Digital Conversion
Because of the way computers are organized, signal must be represented by a nite number of bytes. Thisrestriction means that both the time axis and the amplitude axis must be quantized: They must each bea multiple of the integers. 12 Quite surprisingly, the Sampling Theorem allows us to quantize the time axiswithout error for some signals. The signals that can be sampled without introducing error are interesting,and as described in the next section, we can make a signal "samplable" by ltering. In contrast, no onehas found a way of performing the amplitude quantization step without introducing an unrecoverable error.Thus, a signal's value can no longer be any real number. Signals processed by digital computers mustbe discrete-valued: their values must be proportional to the integers. Consequently, analog-to-digitalconversion introduces error.
10A carry means that a computation performed at a given position aects other positions as well. Here, 1 + 1 = 10 is anexample of a computation that involves a carry.
11This content is available online at <http://cnx.org/content/m0050/2.18/>.12We assume that we do not use oating-point A/D converters.

160 CHAPTER 5. DIGITAL SIGNAL PROCESSING
5.3.2 The Sampling Theorem
Digital transmission of information and digital signal processing all require signals to rst be "acquired"by a computer. One of the most amazing and useful results in electrical engineering is that signals can beconverted from a function of time into a sequence of numbers without error: We can convert the numbersback into the signal with (theoretically) no error. Harold Nyquist, a Bell Laboratories engineer, rst derivedthis result, known as the Sampling Theorem, in the 1920s. It found no real application back then. ClaudeShannon13 , also at Bell Laboratories, revived the result once computers were made public after World WarII.
The sampled version of the analog signal s (t) is s (nTs), with Ts known as the sampling interval.Clearly, the value of the original signal at the sampling times is preserved; the issue is how the signal valuesbetween the samples can be reconstructed since they are lost in the sampling process. To characterizesampling, we approximate it as the product x (t) = s (t) PTs (t), with PTs (t) being the periodic pulse signal.The resulting signal, as shown in Figure 5.3 (Sampled Signal), has nonzero values only during the timeintervals
(nTs − ∆
2 , nTs + ∆2
), n ∈ . . . ,−1, 0, 1, . . . .
Sampled Signal
s(t)
s(t)pTs(t)
Ts∆
t
t
Figure 5.3: The waveform of an example signal is shown in the top plot and its sampled version inthe bottom.
For our purposes here, we center the periodic pulse signal about the origin so that its Fourier seriescoecients are real (the signal is even).
PTs (t) =∞∑
k=−∞
(cke
j2πktTs
)(5.5)
where
ck =sin(
πk∆Ts
)πk
(5.6)
If the properties of s (t) and the periodic pulse signal are chosen properly, we can recover s (t) from x (t) byltering.
13http://www.lucent.com/minds/infotheory/

161
To understand how signal values between the samples can be "lled" in, we need to calculate the sampledsignal's spectrum. Using the Fourier series representation of the periodic sampling signal,
x (t) =∞∑
k=−∞
(cke
j2πktTs s (t)
)(5.7)
Considering each term in the sum separately, we need to know the spectrum of the product of the complexexponential and the signal. Evaluating this transform directly is quite easy.∫ ∞
−∞s (t) e
j2πktTs e−(j2πft)dt =
∫ ∞
−∞s (t) e−(j2π(f− k
Ts)t)dt = S
(f − k
Ts
)(5.8)
Thus, the spectrum of the sampled signal consists of weighted (by the coecients ck) and delayed versionsof the signal's spectrum (Figure 5.4 (aliasing)).
X (f) =∞∑
k=−∞
(ckS
(f − k
Ts
))(5.9)
In general, the terms in this sum overlap each other in the frequency domain, rendering recovery of theoriginal signal impossible. This unpleasant phenomenon is known as aliasing.
aliasing
W–W
S(f)
f
W–W
X(f)
f
c0 c1c2
c-1c-2
1Ts
W–W
X(f)
f
c0 c1c-1c-2
Ts>1
2W
Ts<1
2W
Aliasing
c2
2Ts
2Ts
1Ts
1Ts
–2Ts
–
1Ts
–2Ts
–
Figure 5.4: The spectrum of some bandlimited (to W Hz) signal is shown in the top plot. If thesampling interval Ts is chosen too large relative to the bandwidth W , aliasing will occur. In the bottomplot, the sampling interval is chosen suciently small to avoid aliasing. Note that if the signal were notbandlimited, the component spectra would always overlap.
If, however, we satisfy two conditions:
• The signal s (t) is bandlimitedhas power in a restricted frequency rangeto W Hz, and• the sampling interval Ts is small enough so that the individual components in the sum do not overlap
Ts < 1/2W ,

162 CHAPTER 5. DIGITAL SIGNAL PROCESSING
aliasing will not occur. In this delightful case, we can recover the original signal by lowpass ltering x (t)with a lter having a cuto frequency equal to W Hz. These two conditions ensure the ability to recover abandlimited signal from its sampled version: We thus have the Sampling Theorem.
Exercise 5.4 (Solution on p. 204.)
The Sampling Theorem (as stated) does not mention the pulse width ∆. What is the eect of thisparameter on our ability to recover a signal from its samples (assuming the Sampling Theorem'stwo conditions are met)?
The frequency 12Ts
, known today as the Nyquist frequency and the Shannon sampling frequency,corresponds to the highest frequency at which a signal can contain energy and remain compatible withthe Sampling Theorem. High-quality sampling systems ensure that no aliasing occurs by unceremoniouslylowpass ltering the signal (cuto frequency being slightly lower than the Nyquist frequency) before sampling.Such systems therefore vary the anti-aliasing lter's cuto frequency as the sampling rate varies. Becausesuch quality features cost money, many sound cards do not have anti-aliasing lters or, for that matter,post-sampling lters. They sample at high frequencies, 44.1 kHz for example, and hope the signal containsno frequencies above the Nyquist frequency (22.05 kHz in our example). If, however, the signal containsfrequencies beyond the sound card's Nyquist frequency, the resulting aliasing can be impossible to remove.
Exercise 5.5 (Solution on p. 204.)
To gain a better appreciation of aliasing, sketch the spectrum of a sampled square wave. For
simplicity consider only the spectral repetitions centered at −(
1Ts
), 0, 1
Ts. Let the sampling
interval Ts be 1; consider two values for the square wave's period: 3.5 and 4. Note in particularwhere the spectral lines go as the period decreases; some will move to the left and some to theright. What property characterizes the ones going the same direction?
If we satisfy the Sampling Theorem's conditions, the signal will change only slightly during each pulse. Aswe narrow the pulse, making ∆ smaller and smaller, the nonzero values of the signal s (t) pTs (t) will simplybe s (nTs), the signal's samples. If indeed the Nyquist frequency equals the signal's highest frequency, atleast two samples will occur within the period of the signal's highest frequency sinusoid. In these ways, thesampling signal captures the sampled signal's temporal variations in a way that leaves all the original signal'sstructure intact.
Exercise 5.6 (Solution on p. 204.)
What is the simplest bandlimited signal? Using this signal, convince yourself that less than twosamples/period will not suce to specify it. If the sampling rate 1
Tsis not high enough, what signal
would your resulting undersampled signal become?
5.4 Amplitude Quantization14
The Sampling Theorem says that if we sample a bandlimited signal s (t) fast enough, it can be recoveredwithout error from its samples s (nTs), n ∈ . . . ,−1, 0, 1, . . . . Sampling is only the rst phase of acquiringdata into a computer: Computational processing further requires that the samples be quantized: analogvalues are converted into digital (Section 1.2.2: Digital Signals) form. In short, we will have performedanalog-to-digital (A/D) conversion.
14This content is available online at <http://cnx.org/content/m0051/2.21/>.

163
s(nTs)
Q[s(nTs)]
0
1
2
3
1–1
45
7
–0.5 0.5
6∆
(a)
1
0
–1 -1
-0.75
-0.5
-0.25
0
0.25
0.5
0.75
1sampled signal
0
1
2
3
4
5
6
7
amplitude-quantizedand sampled signal
signal
(b)
Figure 5.5: A three-bit A/D converter assigns voltage in the range [−1, 1] to one of eight integersbetween 0 and 7. For example, all inputs having values lying between 0.5 and 0.75 are assigned the integervalue six and, upon conversion back to an analog value, they all become 0.625. The width of a singlequantization interval ∆ equals 2
2B . The bottom panel shows a signal going through the analog-to-digital,where B is the number of bits used in the A/D conversion process (3 in the case depicted here). Firstit is sampled, then amplitude-quantized to three bits. Note how the sampled signal waveform becomesdistorted after amplitude quantization. For example the two signal values between 0.5 and 0.75 become0.625. This distortion is irreversible; it can be reduced (but not eliminated) by using more bits in theA/D converter.
A phenomenon reminiscent of the errors incurred in representing numbers on a computer prevents signalamplitudes from being converted with no error into a binary number representation. In analog-to-digitalconversion, the signal is assumed to lie within a predened range. Assuming we can scale the signal withoutaecting the information it expresses, we'll dene this range to be [−1, 1]. Furthermore, the A/D converterassigns amplitude values in this range to a set of integers. A B-bit converter produces one of the integers0, 1, . . . , 2B − 1
for each sampled input. Figure 5.5 shows how a three-bit A/D converter assigns input
values to the integers. We dene a quantization interval to be the range of values assigned to the sameinteger. Thus, for our example three-bit A/D converter, the quantization interval ∆ is 0.25; in general, it is2
2B .

164 CHAPTER 5. DIGITAL SIGNAL PROCESSING
Exercise 5.7 (Solution on p. 204.)
Recalling the plot of average daily highs in this frequency domain problem (Problem 4.5), why isthis plot so jagged? Interpret this eect in terms of analog-to-digital conversion.
Because values lying anywhere within a quantization interval are assigned the same value for computerprocessing, the original amplitude value cannot be recovered without error. Typically, the D/A converter,the device that converts integers to amplitudes, assigns an amplitude equal to the value lying halfway in thequantization interval. The integer 6 would be assigned to the amplitude 0.625 in this scheme. The errorintroduced by converting a signal from analog to digital form by sampling and amplitude quantization thenback again would be half the quantization interval for each amplitude value. Thus, the so-called A/D errorequals half the width of a quantization interval: 1
2B . As we have xed the input-amplitude range, the morebits available in the A/D converter, the smaller the quantization error.
To analyze the amplitude quantization error more deeply, we need to compute the signal-to-noise ratio,which equals the ratio of the signal power and the quantization error power. Assuming the signal is a
sinusoid, the signal power is the square of the rms amplitude: power (s) =(
1√2
)2
= 12 . The illustration
(Figure 5.6) details a single quantization interval.
∆
Q[s(nTs)]s(nTs)
ε
Figure 5.6: A single quantization interval is shown, along with a typical signal's value before amplitudequantization s (nTs) and after Q (s (nTs)). ε denotes the error thus incurred.
Its width is ∆ and the quantization error is denoted by ε. To nd the power in the quantization error,we note that no matter into which quantization interval the signal's value falls, the error will have the samecharacteristics. To calculate the rms value, we must square the error and average it over the interval.
rms (ε) =√
1∆
∫ ∆2
−(∆2 ) ε2dε
=(
∆2
12
) 12
(5.10)
Since the quantization interval width for a B-bit converter equals 22B = 2−(B−1), we nd that the signal-to-
noise ratio for the analog-to-digital conversion process equals
SNR =12
2−(2(B−1))
12
=3222B = 6B + 10 log10 1.5dB (5.11)
Thus, every bit increase in the A/D converter yields a 6 dB increase in the signal-to-noise ratio.
Exercise 5.8 (Solution on p. 205.)
This derivation assumed the signal's amplitude lay in the range [−1, 1]. What would the amplitudequantization signal-to-noise ratio be if it lay in the range [−A,A]?Exercise 5.9 (Solution on p. 205.)
How many bits would be required in the A/D converter to ensure that the maximum amplitudequantization error was less than 60 db smaller than the signal's peak value?
Exercise 5.10 (Solution on p. 205.)
Music on a CD is stored to 16-bit accuracy. To what signal-to-noise ratio does this correspond?

165
Once we have acquired signals with an A/D converter, we can process them using digital hardware orsoftware. It can be shown that if the computer processing is linear, the result of sampling, computerprocessing, and unsampling is equivalent to some analog linear system. Why go to all the bother if the samefunction can be accomplished using analog techniques? Knowing when digital processing excels and when itdoes not is an important issue.
5.5 Discrete-Time Signals and Systems15
Mathematically, analog signals are functions having as their independent variables continuous quantities,such as space and time. Discrete-time signals are functions dened on the integers; they are sequences. Aswith analog signals, we seek ways of decomposing discrete-time signals into simpler components. Becausethis approach leading to a better understanding of signal structure, we can exploit that structure to representinformation (create ways of representing information with signals) and to extract information (retrieve theinformation thus represented). For symbolic-valued signals, the approach is dierent: We develop a commonrepresentation of all symbolic-valued signals so that we can embody the information they contain in aunied way. From an information representation perspective, the most important issue becomes, for bothreal-valued and symbolic-valued signals, eciency: what is the most parsimonious and compact way torepresent information so that it can be extracted later.
5.5.1 Real- and Complex-valued Signals
A discrete-time signal is represented symbolically as s (n), where n = . . . ,−1, 0, 1, . . . .
Cosine
n
sn
1…
…
Figure 5.7: The discrete-time cosine signal is plotted as a stem plot. Can you nd the formula for thissignal?
We usually draw discrete-time signals as stem plots to emphasize the fact they are functions dened onlyon the integers. We can delay a discrete-time signal by an integer just as with analog ones. A signal delayedby m samples has the expression s (n−m).
5.5.2 Complex Exponentials
The most important signal is, of course, the complex exponential sequence.
s (n) = ej2πfn (5.12)
15This content is available online at <http://cnx.org/content/m10342/2.13/>.

166 CHAPTER 5. DIGITAL SIGNAL PROCESSING
Note that the frequency variable f is dimensionless and that adding an integer to the frequency of thediscrete-time complex exponential has no eect on the signal's value.
ej2π(f+m)n = ej2πfnej2πmn
= ej2πfn(5.13)
This derivation follows because the complex exponential evaluated at an integer multiple of 2π equals one.Thus, the period of a discrete-time complex exponential equals one.
5.5.3 Sinusoids
Discrete-time sinusoids have the obvious form s (n) = A cos (2πfn + φ). As opposed to analog complexexponentials and sinusoids that can have their frequencies be any real value, frequencies of their discrete-time counterparts yield unique waveforms only when f lies in the interval
(−(
12
), 1
2
]. From the properties
of the complex exponential, the sinusoid's period is always one; this choice of frequency interval will becomeevident later.
5.5.4 Unit Sample
The second-most important discrete-time signal is the unit sample, which is dened to be
δ (n) =
1 if n = 0
0 otherwise(5.14)
Unit sample
1
n
δn
Figure 5.8: The unit sample.
Examination of a discrete-time signal's plot, like that of the cosine signal shown in Figure 5.7 (Cosine),reveals that all signals consist of a sequence of delayed and scaled unit samples. Because the value ofa sequence at each integer m is denoted by s (m) and the unit sample delayed to occur at m is writtenδ (n−m), we can decompose any signal as a sum of unit samples delayed to the appropriate location andscaled by the signal value.
s (n) =∞∑
m=−∞(s (m) δ (n−m)) (5.15)
This kind of decomposition is unique to discrete-time signals, and will prove useful subsequently.
5.5.5 Unit Step
The unit sample in discrete-time is well-dened at the origin, as opposed to the situation with analogsignals.
u (n) =
1 if n ≥ 0
0 if n < 0(5.16)

167
5.5.6 Symbolic Signals
An interesting aspect of discrete-time signals is that their values do not need to be real numbers. We dohave real-valued discrete-time signals like the sinusoid, but we also have signals that denote the sequenceof characters typed on the keyboard. Such characters certainly aren't real numbers, and as a collection ofpossible signal values, they have little mathematical structure other than that they are members of a set.More formally, each element of the symbolic-valued signal s (n) takes on one of the values a1, . . . , aK whichcomprise the alphabet A. This technical terminology does not mean we restrict symbols to being mem-bers of the English or Greek alphabet. They could represent keyboard characters, bytes (8-bit quantities),integers that convey daily temperature. Whether controlled by software or not, discrete-time systems areultimately constructed from digital circuits, which consist entirely of analog circuit elements. Furthermore,the transmission and reception of discrete-time signals, like e-mail, is accomplished with analog signals andsystems. Understanding how discrete-time and analog signals and systems intertwine is perhaps the maingoal of this course.
5.5.7 Discrete-Time Systems
Discrete-time systems can act on discrete-time signals in ways similar to those found in analog signals andsystems. Because of the role of software in discrete-time systems, many more dierent systems can beenvisioned and "constructed" with programs than can be with analog signals. In fact, a special class ofanalog signals can be converted into discrete-time signals, processed with software, and converted back intoan analog signal, all without the incursion of error. For such signals, systems can be easily produced insoftware, with equivalent analog realizations dicult, if not impossible, to design.
5.6 Discrete-Time Fourier Transform (DTFT)16
The Fourier transform of the discrete-time signal s (n) is dened to be
S(ej2πf
)=
∞∑n=−∞
(s (n) e−(j2πfn)
)(5.17)
Frequency here has no units. As should be expected, this denition is linear, with the transform of asum of signals equaling the sum of their transforms. Real-valued signals have conjugate-symmetric spectra:S(e−(j2πf)
)= S
(ej2πf
)∗.
Exercise 5.11 (Solution on p. 205.)
A special property of the discrete-time Fourier transform is that it is periodic with period one:S(ej2π(f+1)
)= S
(ej2πf
). Derive this property from the denition of the DTFT.
Because of this periodicity, we need only plot the spectrum over one period to understand completely thespectrum's structure; typically, we plot the spectrum over the frequency range
[−(
12
), 1
2
]. When the signal
is real-valued, we can further simplify our plotting chores by showing the spectrum only over[0, 1
2
]; the
spectrum at negative frequencies can be derived from positive-frequency spectral values.When we obtain the discrete-time signal via sampling an analog signal, the Nyquist frequency (p. 162)
corresponds to the discrete-time frequency 12 . To show this, note that a sinusoid having a frequency equal
to the Nyquist frequency 12Ts
has a sampled waveform that equals
cos(
2π1
2TsnTs
)= cos (πn) = (−1)n
16This content is available online at <http://cnx.org/content/m10247/2.28/>.

168 CHAPTER 5. DIGITAL SIGNAL PROCESSING
The exponential in the DTFT at frequency 12 equals e−( j2πn
2 ) = e−(jπn) = (−1)n, meaning that discrete-timefrequency equals analog frequency multiplied by the sampling interval
fD = fATs (5.18)
fD and fA represent discrete-time and analog frequency variables, respectively. The aliasing gure (Fig-ure 5.4: aliasing) provides another way of deriving this result. As the duration of each pulse in the periodicsampling signal pTs
(t) narrows, the amplitudes of the signal's spectral repetitions, which are governed bythe Fourier series coecients (4.10) of pTs (t), become increasingly equal. Examination of the periodic pulsesignal (Figure 4.1) reveals that as ∆ decreases, the value of c0, the largest Fourier coecient, decreases tozero: |c0| = A∆
Ts. Thus, to maintain a mathematically viable Sampling Theorem, the amplitude A must
increase as 1∆ , becoming innitely large as the pulse duration decreases. Practical systems use a small value
of ∆, say 0.1 · Ts and use ampliers to rescale the signal. Thus, the sampled signal's spectrum becomesperiodic with period 1
Ts. Thus, the Nyquist frequency 1
2Tscorresponds to the frequency 1
2 .
Example 5.1Let's compute the discrete-time Fourier transform of the exponentially decaying sequence s (n) =
anu (n), where u (n) is the unit-step sequence. Simply plugging the signal's expression into theFourier transform formula,
S(ej2πf
)=
∞∑n=−∞
(anu (n) e−(j2πfn)
)=
∞∑n=0
((ae−(j2πf)
)n) (5.19)
This sum is a special case of the geometric series.
∞∑n=0
(αn) =1
1− α, |α| < 1 (5.20)
Thus, as long as |a| < 1, we have our Fourier transform.
S(ej2πf
)=
11− ae−(j2πf)
(5.21)
Using Euler's relation, we can express the magnitude and phase of this spectrum.
|S(ej2πf
)| = 1√
(1− a cos (2πf))2 + a2sin2 (2πf)(5.22)
∠(S(ej2πf
))= −
(tan−1
(a sin (2πf)
1− a cos (2πf)
))(5.23)
No matter what value of a we choose, the above formulae clearly demonstrate the periodic natureof the spectra of discrete-time signals. Figure 5.9 (Spectrum of exponential signal) shows indeedthat the spectrum is a periodic function. We need only consider the spectrum between −
(12
)and
12 to unambiguously dene it. When a > 0, we have a lowpass spectrumthe spectrum diminishesas frequency increases from 0 to 1
2with increasing a leading to a greater low frequency content;for a < 0, we have a highpass spectrum (Figure 5.10 (Spectra of exponential signals)).

169
Spectrum of exponential signal
-2 -1 0 1 2
1
2
f
|S(ej2πf)|
-2 -1 1 2
-45
45
f
∠S(ej2πf)
Figure 5.9: The spectrum of the exponential signal (a = 0.5) is shown over the frequency range [-2,2], clearly demonstrating the periodicity of all discrete-time spectra. The angle has units of degrees.
Spectra of exponential signals
f
a = 0.9
a = 0.5
a = –0.5
Spe
ctra
l Mag
nitu
de (
dB)
-10
0
10
20
0.5
a = 0.9
a = 0.5
a = –0.5
Ang
le (
degr
ees)
f
-90
-45
0
45
90
0.5
Figure 5.10: The spectra of several exponential signals are shown. What is the apparent relationshipbetween the spectra for a = 0.5 and a = −0.5?

170 CHAPTER 5. DIGITAL SIGNAL PROCESSING
Example 5.2Analogous to the analog pulse signal, let's nd the spectrum of the length-N pulse sequence.
s (n) =
1 if 0 ≤ n ≤ N − 1
0 otherwise(5.24)
The Fourier transform of this sequence has the form of a truncated geometric series.
S(ej2πf
)=
N−1∑n=0
(e−(j2πfn)
)(5.25)
For the so-called nite geometric series, we know that
N+n0−1∑n=n0
(αn) = αn01− αN
1− α(5.26)
for all values of α.
Exercise 5.12 (Solution on p. 205.)
Derive this formula for the nite geometric series sum. The "trick" is to consider the dierencebetween the series' sum and the sum of the series multiplied by α.
Applying this result yields (Figure 5.11 (Spectrum of length-ten pulse).)
S(ej2πf
)=
1− e−(j2πfN)
1− e−(j2πf)
= e−(jπf(N−1)) sin (πfN)sin (πf)
(5.27)
The ratio of sine functions has the generic form of sin(Nx)sin(x) , which is known as the discrete-time sinc
function dsinc (x). Thus, our transform can be concisely expressed as S(ej2πf
)= e−(jπf(N−1))dsinc (πf).
The discrete-time pulse's spectrum contains many ripples, the number of which increase with N , the pulse'sduration.
The inverse discrete-time Fourier transform is easily derived from the following relationship:
∫ 12
−( 12 )
e−(j2πfm)ej2πfndf =
1 if m = n
0 if m 6= n(5.28)
Therefore, we nd that∫ 12
−( 12 )
S(ej2πf
)ej2πfndf =
∫ 12
−( 12 )
∑m
(s (m) e−(j2πfm)ej2πfn
)df
=∑m
(s (m)
∫ 12
−( 12 )
e(−(j2πf))(m−n)df
)= s (n)
(5.29)
The Fourier transform pairs in discrete-time are
S(ej2πf
)=
∞∑n=−∞
(s (n) e−(j2πfn)
)(5.30)

171
Spectrum of length-ten pulse
Figure 5.11: The spectrum of a length-ten pulse is shown. Can you explain the rather complicatedappearance of the phase?
s (n) =∫ 1
2
−( 12 )
S(ej2πf
)ej2πfndf (5.31)
The properties of the discrete-time Fourier transform mirror those of the analog Fourier transform. TheDTFT properties table 17 shows similarities and dierences. One important common property is Parseval'sTheorem.
∞∑n=−∞
((|s (n) |)2
)=∫ 1
2
−( 12 )
(|S(ej2πf
)|)2
df (5.32)
To show this important property, we simply substitute the Fourier transform expression into the frequency-domain expression for power.∫ 1
2
−( 12 )
(|S(ej2πf
)|)2
df =∫ 1
2
−( 12 )
(∑n
(s (n) e−(j2πfn)
))∑m
(s (n)∗ej2πfm
)df
=∑
(n,m)
(s (n) s (n)∗
∫ 12
−( 12 )
ej2πf(m−n)df
) (5.33)
Using the orthogonality relation (5.28), the integral equals δ (m− n), where δ (n) is the unit sample (Fig-ure 5.8: Unit sample). Thus, the double sum collapses into a single sum because nonzero values occur onlywhen n = m, giving Parseval's Theorem as a result. We term
∑n
(s2 (n)
)the energy in the discrete-time
signal s (n) in spite of the fact that discrete-time signals don't consume (or produce for that matter) energy.This terminology is a carry-over from the analog world.
17"Discrete-Time Fourier Transform Properties" <http://cnx.org/content/m0506/latest/>

172 CHAPTER 5. DIGITAL SIGNAL PROCESSING
Exercise 5.13 (Solution on p. 205.)
Suppose we obtained our discrete-time signal from values of the product s (t) pTs (t), where theduration of the component pulses in pTs (t) is ∆. How is the discrete-time signal energy related tothe total energy contained in s (t)? Assume the signal is bandlimited and that the sampling ratewas chosen appropriate to the Sampling Theorem's conditions.
5.7 Discrete Fourier Transforms (DFT)18
The discrete-time Fourier transform (and the continuous-time transform as well) can be evaluated when wehave an analytic expression for the signal. Suppose we just have a signal, such as the speech signal usedin the previous chapter, for which there is no formula. How then would you compute the spectrum? Forexample, how did we compute a spectrogram such as the one shown in the speech signal example (Figure 4.17:spectrogram)? The Discrete Fourier Transform (DFT) allows the computation of spectra from discrete-timedata. While in discrete-time we can exactly calculate spectra, for analog signals no similar exact spectrumcomputation exists. For analog-signal spectra, use must build special devices, which turn out in most casesto consist of A/D converters and discrete-time computations. Certainly discrete-time spectral analysis ismore exible than continuous-time spectral analysis.
The formula for the DTFT (5.17) is a sum, which conceptually can be easily computed save for twoissues.
• Signal duration. The sum extends over the signal's duration, which must be nite to compute thesignal's spectrum. It is exceedingly dicult to store an innite-length signal in any case, so we'llassume that the signal extends over [0, N − 1].
• Continuous frequency. Subtler than the signal duration issue is the fact that the frequency variable iscontinuous: It may only need to span one period, like
[−(
12
), 1
2
]or [0, 1], but the DTFT formula as it
stands requires evaluating the spectra at all frequencies within a period. Let's compute the spectrumat a few frequencies; the most obvious ones are the equally spaced ones f = k
K , k ∈ 0, . . . ,K − 1.
We thus dene the discrete Fourier transform (DFT) to be
S (k) =N−1∑n=0
(s (n) e−( j2πnk
K ))
, k ∈ 0, . . . ,K − 1 (5.34)
Here, S (k) is shorthand for S(ej2π k
K
).
We can compute the spectrum at as many equally spaced frequencies as we like. Note that you can thinkabout this computationally motivated choice as sampling the spectrum; more about this interpretation later.The issue now is how many frequencies are enough to capture how the spectrum changes with frequency.One way of answering this question is determining an inverse discrete Fourier transform formula: given S (k),k = 0, . . . ,K − 1 how do we nd s (n), n = 0, . . . , N − 1? Presumably, the formula will be of the form
s (n) =∑K−1
k=0
(S (k) e
j2πnkK
). Substituting the DFT formula in this prototype inverse transform yields
s (n) =K−1∑k=0
(N−1∑m=0
(s (m) e−(j 2πmk
K )ej 2πnkK
))(5.35)
Note that the orthogonality relation we use so often has a dierent character now.
K−1∑k=0
(e−(j 2πkm
K )ej 2πknK
)=
K if m = n, (n±K) , (n± 2K) , . . . 0 otherwise
(5.36)
18This content is available online at <http://cnx.org/content/m10249/2.26/>.

173
We obtain nonzero value whenever the two indices dier by multiples of K. We can express this result asK∑
l (δ (m− n− lK)). Thus, our formula becomes
s (n) =N−1∑m=0
(s (m) K
∞∑l=−∞
(δ (m− n− lK))
)(5.37)
The integers n and m both range over 0, . . . , N − 1. To have an inverse transform, we need the sum to be asingle unit sample for m, n in this range. If it did not, then s (n) would equal a sum of values, and we wouldnot have a valid transform: Once going into the frequency domain, we could not get back unambiguously!Clearly, the term l = 0 always provides a unit sample (we'll take care of the factor of K soon). If we evaluatethe spectrum at fewer frequencies than the signal's duration, the term corresponding to m = n+K will alsoappear for some values of m, n = 0, . . . , N − 1. This situation means that our prototype transform equalss (n) + s (n + K) for some values of n. The only way to eliminate this problem is to require K ≥ N : Wemust have at least as many frequency samples as the signal's duration. In this way, we can return from thefrequency domain we entered via the DFT.
Exercise 5.14 (Solution on p. 205.)
When we have fewer frequency samples than the signal's duration, some discrete-time signal valuesequal the sum of the original signal values. Given the sampling interpretation of the spectrum,characterize this eect a dierent way.
Another way to understand this requirement is to use the theory of linear equations. If we write out theexpression for the DFT as a set of linear equations,
s (0) + s (1) + · · ·+ s (N − 1) = S (0) (5.38)
s (0) + s (1) e(−j) 2πK + · · ·+ s (N − 1) e(−j)
2π(N−1)K = S (1)
...
s (0) + s (1) e(−j)2π(K−1)
K + · · ·+ s (N − 1) e(−j)2π(N−1)(K−1)
K = S (K − 1)
we have K equations in N unknowns if we want to nd the signal from its sampled spectrum. This require-ment is impossible to fulll if K < N ; we must have K ≥ N . Our orthogonality relation essentially says thatif we have a sucient number of equations (frequency samples), the resulting set of equations can indeed besolved.
By convention, the number of DFT frequency values K is chosen to equal the signal's duration N . Thediscrete Fourier transform pair consists of
Discrete Fourier Transform Pair
S (k) =N−1∑n=0
(s (n) e−(j 2πnk
N ))
(5.39)
s (n) =1N
N−1∑k=0
(S (k) ej 2πnk
N
)(5.40)
Example 5.3Use this demonstration to perform DFT analysis of a signal.
This is an unsupported media type. To view, please seehttp://cnx.org/content/m10249/latest/DFTanalysis.llb

174 CHAPTER 5. DIGITAL SIGNAL PROCESSING
Example 5.4Use this demonstration to synthesize a signal from a DFT sequence.
This is an unsupported media type. To view, please seehttp://cnx.org/content/m10249/latest/DFT_Component_Manipulation.llb
5.8 DFT: Computational Complexity19
We now have a way of computing the spectrum for an arbitrary signal: The Discrete Fourier Transform(DFT) (5.34) computes the spectrum at N equally spaced frequencies from a length- N sequence. An issuethat never arises in analog "computation," like that performed by a circuit, is how much work it takes toperform the signal processing operation such as ltering. In computation, this consideration translates tothe number of basic computational steps required to perform the needed processing. The number of steps,known as the complexity, becomes equivalent to how long the computation takes (how long must we waitfor an answer). Complexity is not so much tied to specic computers or programming languages but to howmany steps are required on any computer. Thus, a procedure's stated complexity says that the time takenwill be proportional to some function of the amount of data used in the computation and the amountdemanded.
For example, consider the formula for the discrete Fourier transform. For each frequency we chose, wemust multiply each signal value by a complex number and add together the results. For a real-valued signal,each real-times-complex multiplication requires two real multiplications, meaning we have 2N multiplicationsto perform. To add the results together, we must keep the real and imaginary parts separate. Adding Nnumbers requires N − 1 additions. Consequently, each frequency requires 2N + 2 (N − 1) = 4N − 2 basiccomputational steps. As we have N frequencies, the total number of computations is N (4N − 2).
In complexity calculations, we only worry about what happens as the data lengths increase, and take thedominant termhere the 4N2 termas reecting how much work is involved in making the computation.As multiplicative constants don't matter since we are making a "proportional to" evaluation, we nd theDFT is an O
(N2)computational procedure. This notation is read "order N -squared". Thus, if we double
the length of the data, we would expect that the computation time to approximately quadruple.
Exercise 5.15 (Solution on p. 205.)
In making the complexity evaluation for the DFT, we assumed the data to be real. Three questionsemerge. First of all, the spectra of such signals have conjugate symmetry, meaning that negativefrequency components (k =
N2 + 1, . . . , N + 1
in the DFT (5.34)) can be computed from the
corresponding positive frequency components. Does this symmetry change the DFT's complexity?Secondly, suppose the data are complex-valued; what is the DFT's complexity now? Finally, a lessimportant but interesting question is suppose we want K frequency values instead of N ; now whatis the complexity?
5.9 Fast Fourier Transform (FFT)20
One wonders if the DFT can be computed faster: Does another computational procedure an algorithm exist that can compute the same quantity, but more eciently. We could seek methods that reduce the
19This content is available online at <http://cnx.org/content/m0503/2.11/>.20This content is available online at <http://cnx.org/content/m10250/2.15/>.

175
constant of proportionality, but do not change the DFT's complexity O(N2). Here, we have something more
dramatic in mind: Can the computations be restructured so that a smaller complexity results?In 1965, IBM researcher Jim Cooley and Princeton faculty member John Tukey developed what is now
known as the Fast Fourier Transform (FFT). It is an algorithm for computing that DFT that has orderO (NlogN) for certain length inputs. Now when the length of data doubles, the spectral computational timewill not quadruple as with the DFT algorithm; instead, it approximately doubles. Later research showedthat no algorithm for computing the DFT could have a smaller complexity than the FFT. Surprisingly,historical work has shown that Gauss21 in the early nineteenth century developed the same algorithm, butdid not publish it! After the FFT's rediscovery, not only was the computation of a signal's spectrum greatlyspeeded, but also the added feature of algorithm meant that computations had exibility not available toanalog implementations.
Exercise 5.16 (Solution on p. 205.)
Before developing the FFT, let's try to appreciate the algorithm's impact. Suppose a short-lengthtransform takes 1 ms. We want to calculate a transform of a signal that is 10 times longer. Comparehow much longer a straightforward implementation of the DFT would take in comparison to anFFT, both of which compute exactly the same quantity.
To derive the FFT, we assume that the signal's duration is a power of two: N = 2L. Consider what happensto the even-numbered and odd-numbered elements of the sequence in the DFT calculation.
S (k) = s (0) + s (2) e(−j) 2π2kN + · · ·+ s (N − 2) e(−j)
2π(N−2)kN
+ s (1) e(−j) 2πkN + s (3) e(−j)
2π(2+1)kN + · · ·+ s (N − 1) e(−j)
2π(N−(2−1))kN
=
s (0) + s (2) e(−j) 2πk
N2 + · · ·+ s (N − 2) e
(−j)2π(N
2 −1)k
N2
+
s (1) + s (3) e(−j) 2π + · · ·+ s (N − 1) e
(−j)2π(N
2 −1)k
N2
e−(j2πk)
N
(5.41)
Each term in square brackets has the form of a N2 -length DFT. The rst one is a DFT of the even-numbered
elements, and the second of the odd-numbered elements. The rst DFT is combined with the second
multiplied by the complex exponential e−( j2πkN ). The half-length transforms are each evaluated at frequency
indices k = 0, . . ., N−1. Normally, the number of frequency indices in a DFT calculation range between zeroand the transform length minus one. The computational advantage of the FFT comes from recognizingthe periodic nature of the discrete Fourier transform. The FFT simply reuses the computations made in the
half-length transforms and combines them through additions and the multiplication by e−( j2πkN ), which is not
periodic over N2 , to rewrite the length-N DFT. Figure 5.12 (Length-8 DFT decomposition) illustrates this
decomposition. As it stands, we now compute two length-N2 transforms (complexity 2O
(N2
4
)), multiply one
of them by the complex exponential (complexity O (N)), and add the results (complexity O (N)). At thispoint, the total complexity is still dominated by the half-length DFT calculations, but the proportionalitycoecient has been reduced.
Now for the fun. Because N = 2L, each of the half-length transforms can be reduced to two quarter-lengthtransforms, each of these to two eighth-length ones, etc. This decomposition continues until we are left withlength-2 transforms. This transform is quite simple, involving only additions. Thus, the rst stage of theFFT has N
2 length-2 transforms (see the bottom part of Figure 5.12 (Length-8 DFT decomposition)). Pairsof these transforms are combined by adding one to the other multiplied by a complex exponential. Each pairrequires 4 additions and 4 multiplications, giving a total number of computations equaling 8 · N
4 = N2 . This
number of computations does not change from stage to stage. Because the number of stages, the number oftimes the length can be divided by two, equals log2 N , the complexity of the FFT is O (N log2 N).
21http://www-groups.dcs.st-and.ac.uk/∼history/Mathematicians/Gauss.html

176 CHAPTER 5. DIGITAL SIGNAL PROCESSING
Length-8 DFT decomposition
s0s2s4s6
s1s3s5s7
S0S1S2S3
S4S5S6S7
e–j0
e–j2π/8
e–j2π2/8
e–j2π3/8
e–j2π4/8
e–j2π5/8
e–j2π6/8
e–j2π7/8
Length-4DFT
Length-4DFT
(a)
e–j0 –1
e–jπ/2 –1
e–jπ –1
e–j3π/2 –1
e–j0 –1
e–jπ/2 –1
e–j0 –1
e–jπ/2 –1
+1 –1
+1 –1
+1 –1
+1 –1
s0
s4s2
s6
s1
s5
s3
s7
S0
S1
S2
S3
S4
S5
S6
S7
4 length-2 DFTs
2 length-4 DFTs(b)
Figure 5.12: The initial decomposition of a length-8 DFT into the terms using even- and odd-indexedinputs marks the rst phase of developing the FFT algorithm. When these half-length transforms aresuccessively decomposed, we are left with the diagram shown in the bottom panel that depicts thelength-8 FFT computation.
Doing an example will make computational savings more obvious. Let's look at the details of a length-8DFT. As shown on Figure 5.13 (Buttery), we rst decompose the DFT into two length-4 DFTs, with theoutputs added and subtracted together in pairs. Considering Figure 5.13 (Buttery) as the frequency indexgoes from 0 through 7, we recycle values from the length-4 DFTs into the nal calculation because of theperiodicity of the DFT output. Examining how pairs of outputs are collected together, we create the basiccomputational element known as a buttery (Figure 5.13 (Buttery)).

177
Buttery
e–j2πk/N
e–j2π(k+N/2)/N
a
b
a+be–j2πk/N
a–be–j2πk/N
a
be–j2πk/N –1
a+be–j2πk/N
a–be–j2πk/N
Figure 5.13: The basic computational element of the fast Fourier transform is the buttery. It takestwo complex numbers, represented by a and b, and forms the quantities shown. Each buttery requiresone complex multiplication and two complex additions.
By considering together the computations involving common output frequencies from the two half-lengthDFTs, we see that the two complex multiplies are related to each other, and we can reduce our computationalwork even further. By further decomposing the length-4 DFTs into two length-2 DFTs and combining theiroutputs, we arrive at the diagram summarizing the length-8 fast Fourier transform (Figure 5.12 (Length-8DFT decomposition)). Although most of the complex multiplies are quite simple (multiplying by e−(jπ)
means negating real and imaginary parts), let's count those for purposes of evaluating the complexity as fullcomplex multiplies. We have N
2 = 4 complex multiplies and 2N = 16 additions for each stage and log2 N = 3stages, making the number of basic computations 3N
2 log2 N as predicted.
Exercise 5.17 (Solution on p. 205.)
Note that the ordering of the input sequence in the two parts of Figure 5.12 (Length-8 DFTdecomposition) aren't quite the same. Why not? How is the ordering determined?
Other "fast" algorithms were discovered, all of which make use of how many common factors the transformlength N has. In number theory, the number of prime factors a given integer has measures how composite itis. The numbers 16 and 81 are highly composite (equaling 24 and 34 respectively), the number 18 is less so(21 · 32), and 17 not at all (it's prime). In over thirty years of Fourier transform algorithm development, theoriginal Cooley-Tukey algorithm is far and away the most frequently used. It is so computationally ecientthat power-of-two transform lengths are frequently used regardless of what the actual length of the data.
Exercise 5.18 (Solution on p. 205.)
Suppose the length of the signal were 500? How would you compute the spectrum of this signalusing the Cooley-Tukey algorithm? What would the length N of the transform be?
5.10 Spectrograms22
We know how to acquire analog signals for digital processing (pre-ltering (Section 5.3), sampling (Sec-tion 5.3), and A/D conversion (Section 5.4)) and to compute spectra of discrete-time signals (using the FFTalgorithm (Section 5.9)), let's put these various components together to learn how the spectrogram shown inFigure 5.14 (speech spectrogram), which is used to analyze speech (Section 4.10), is calculated. The speechwas sampled at a rate of 11.025 kHz and passed through a 16-bit A/D converter.
point of interest: Music compact discs (CDs) encode their signals at a sampling rate of 44.1kHz. We'll learn the rationale for this number later. The 11.025 kHz sampling rate for the speechis 1/4 of the CD sampling rate, and was the lowest available sampling rate commensurate withspeech signal bandwidths available on my computer.
22This content is available online at <http://cnx.org/content/m0505/2.18/>.

178 CHAPTER 5. DIGITAL SIGNAL PROCESSING
Exercise 5.19 (Solution on p. 205.)
Looking at Figure 5.14 (speech spectrogram) the signal lasted a little over 1.2 seconds. How longwas the sampled signal (in terms of samples)? What was the datarate during the sampling processin bps (bits per second)? Assuming the computer storage is organized in terms of bytes (8-bitquantities), how many bytes of computer memory does the speech consume?
speech spectrogram
Time (s)
Fre
quen
cy (
Hz)
0 0.2 0.4 0.6 0.8 1 1.20
1000
2000
3000
4000
5000
Ri ce Uni ver si ty
Figure 5.14
The resulting discrete-time signal, shown in the bottom of Figure 5.14 (speech spectrogram), clearlychanges its character with time. To display these spectral changes, the long signal was sectioned intoframes: comparatively short, contiguous groups of samples. Conceptually, a Fourier transform of eachframe is calculated using the FFT. Each frame is not so long that signicant signal variations are retainedwithin a frame, but not so short that we lose the signal's spectral character. Roughly speaking, the speechsignal's spectrum is evaluated over successive time segments and stacked side by side so that the x-axiscorresponds to time and the y-axis frequency, with color indicating the spectral amplitude.

179
An important detail emerges when we examine each framed signal (Figure 5.15 (Spectrogram Hanningvs. Rectangular)).
Spectrogram Hanning vs. Rectangular
256
FFT (512)
RectangularWindow
f
HanningWindow
FFT (512)
n
f
Figure 5.15: The top waveform is a segment 1024 samples long taken from the beginning of the"Rice University" phrase. Computing Figure 5.14 (speech spectrogram) involved creating frames, heredemarked by the vertical lines, that were 256 samples long and nding the spectrum of each. If arectangular window is applied (corresponding to extracting a frame from the signal), oscillations appearin the spectrum (middle of bottom row). Applying a Hanning window gracefully tapers the signal towardframe edges, thereby yielding a more accurate computation of the signal's spectrum at that moment oftime.
At the frame's edges, the signal may change very abruptly, a feature not present in the original signal.A transform of such a segment reveals a curious oscillation in the spectrum, an artifact directly related tothis sharp amplitude change. A better way to frame signals for spectrograms is to apply a window: Shapethe signal values within a frame so that the signal decays gracefully as it nears the edges. This shaping isaccomplished by multiplying the framed signal by the sequence w (n). In sectioning the signal, we essentiallyapplied a rectangular window: w (n) = 1, 0 ≤ n ≤ N − 1. A much more graceful window is the Hanningwindow; it has the cosine shape w (n) = 1
2
(1− cos
(2πnN
)). As shown in Figure 5.15 (Spectrogram Hanning
vs. Rectangular), this shaping greatly reduces spurious oscillations in each frame's spectrum. Consideringthe spectrum of the Hanning windowed frame, we nd that the oscillations resulting from applying therectangular window obscured a formant (the one located at a little more than half the Nyquist frequency).
Exercise 5.20 (Solution on p. 206.)
What might be the source of these oscillations? To gain some insight, what is the length- 2Ndiscrete Fourier transform of a length-N pulse? The pulse emulates the rectangular window, andcertainly has edges. Compare your answer with the length- 2N transform of a length- N Hanningwindow.

180 CHAPTER 5. DIGITAL SIGNAL PROCESSING
Hanning speech
n
n
Figure 5.16: In comparison with the original speech segment shown in the upper plot, the non-overlapped Hanning windowed version shown below it is very ragged. Clearly, spectral informationextracted from the bottom plot could well miss important features present in the original.
If you examine the windowed signal sections in sequence to examine windowing's aect on signal ampli-tude, we see that we have managed to amplitude-modulate the signal with the periodically repeated window(Figure 5.16 (Hanning speech)). To alleviate this problem, frames are overlapped (typically by half a frameduration). This solution requires more Fourier transform calculations than needed by rectangular windowing,but the spectra are much better behaved and spectral changes are much better captured.
The speech signal, such as shown in the speech spectrogram (Figure 5.14: speech spectrogram), is sec-tioned into overlapping, equal-length frames, with a Hanning window applied to each frame. The spectraof each of these is calculated, and displayed in spectrograms with frequency extending vertically, windowtime location running horizontally, and spectral magnitude color-coded. Figure 5.17 (Hanning windows)illustrates these computations.
Exercise 5.21 (Solution on p. 206.)
Why the specic values of 256 for N and 512 for K? Another issue is how was the length-512transform of each length-256 windowed frame computed?
5.11 Discrete-Time Systems23
When we developed analog systems, interconnecting the circuit elements provided a natural starting place forconstructing useful devices. In discrete-time signal processing, we are not limited by hardware considerationsbut by what can be constructed in software.
Exercise 5.22 (Solution on p. 206.)
One of the rst analog systems we described was the amplier (Section 2.6.2: Ampliers). Wefound that implementing an amplier was dicult in analog systems, requiring an op-amp at least.What is the discrete-time implementation of an amplier? Is this especially hard or easy?
In fact, we will discover that frequency-domain implementation of systems, wherein we multiply the inputsignal's Fourier transform by a frequency response, is not only a viable alternative, but also a computationallyecient one. We begin with discussing the underlying mathematical structure of linear, shift-invariantsystems, and devise how software lters can be constructed.
23This content is available online at <http://cnx.org/content/m0507/2.5/>.

181
Hanning windowsLo
g S
pect
ral M
agni
tude
f
n
FFT FFT FFT FFT FFT FFT FFT
Figure 5.17: The original speech segment and the sequence of overlapping Hanning windows appliedto it are shown in the upper portion. Frames were 256 samples long and a Hanning window was appliedwith a half-frame overlap. A length-512 FFT of each frame was computed, with the magnitude of therst 257 FFT values displayed vertically, with spectral amplitude values color-coded.
5.12 Discrete-Time Systems in the Time-Domain24
A discrete-time signal s (n) is delayed by n0 samples when we write s (n− n0), with n0 > 0. Choosing n0
to be negative advances the signal along the integers. As opposed to analog delays (Section 2.6.3: Delay),discrete-time delays can only be integer valued. In the frequency domain, delaying a signal corresponds toa linear phase shift of the signal's discrete-time Fourier transform:
(s (n− n0) ↔ e−(j2πfn0)S
(ej2πf
)).
Linear discrete-time systems have the superposition property.
S (a1x1 (n) + a2x2 (n)) = a1S (x1 (n)) + a2S (x2 (n)) (5.42)
A discrete-time system is called shift-invariant (analogous to time-invariant analog systems (p. 28)) ifdelaying the input delays the corresponding output. If S (x (n)) = y (n), then a shift-invariant system hasthe property
S (x (n− n0)) = y (n− n0) (5.43)
We use the term shift-invariant to emphasize that delays can only have integer values in discrete-time, whilein analog signals, delays can be arbitrarily valued.
We want to concentrate on systems that are both linear and shift-invariant. It will be these that allow usthe full power of frequency-domain analysis and implementations. Because we have no physical constraintsin "constructing" such systems, we need only a mathematical specication. In analog systems, the dier-ential equation species the input-output relationship in the time-domain. The corresponding discrete-time
24This content is available online at <http://cnx.org/content/m10251/2.22/>.

182 CHAPTER 5. DIGITAL SIGNAL PROCESSING
specication is the dierence equation.
y (n) = a1y (n− 1) + · · ·+ apy (n− p) + b0x (n) + b1x (n− 1) + · · ·+ bqx (n− q) (5.44)
Here, the output signal y (n) is related to its past values y (n− l), l = 1, . . . , p, and to the current and pastvalues of the input signal x (n). The system's characteristics are determined by the choices for the numberof coecients p and q and the coecients' values a1, . . . , ap and b0, b1, . . . , bq.
aside: There is an asymmetry in the coecients: where is a0? This coecient would multiplythe y (n) term in (5.44). We have essentially divided the equation by it, which does not change theinput-output relationship. We have thus created the convention that a0 is always one.
As opposed to dierential equations, which only provide an implicit description of a system (we mustsomehow solve the dierential equation), dierence equations provide an explicit way of computing theoutput for any input. We simply express the dierence equation by a program that calculates each outputfrom the previous output values, and the current and previous inputs.
Dierence equations are usually expressed in software with for loops. A MATLAB program that wouldcompute the rst 1000 values of the output has the form
for n=1:1000
y(n) = sum(a.*y(n-1:-1:n-p)) + sum(b.*x(n:-1:n-q));
end
An important detail emerges when we consider making this program work; in fact, as written it has (at least)two bugs. What input and output values enter into the computation of y (1)? We need values for y (0),y (−1), ..., values we have not yet computed. To compute them, we would need more previous values of theoutput, which we have not yet computed. To compute these values, we would need even earlier values, adinnitum. The way out of this predicament is to specify the system's initial conditions: we must providethe p output values that occurred before the input started. These values can be arbitrary, but the choicedoes impact how the system responds to a given input. One choice gives rise to a linear system: Make theinitial conditions zero. The reason lies in the denition of a linear system (Section 2.6.6: Linear Systems):The only way that the output to a sum of signals can be the sum of the individual outputs occurs when theinitial conditions in each case are zero.
Exercise 5.23 (Solution on p. 206.)
The initial condition issue resolves making sense of the dierence equation for inputs that start atsome index. However, the program will not work because of a programming, not conceptual, error.What is it? How can it be "xed?"
Example 5.5Let's consider the simple system having p = 1 and q = 0.
y (n) = ay (n− 1) + bx (n) (5.45)
To compute the output at some index, this dierence equation says we need to know what theprevious output y (n− 1) and what the input signal is at that moment of time. In more detail, let'scompute this system's output to a unit-sample input: x (n) = δ (n). Because the input is zero fornegative indices, we start by trying to compute the output at n = 0.
y (0) = ay (−1) + b (5.46)
What is the value of y (−1)? Because we have used an input that is zero for all negative indices, itis reasonable to assume that the output is also zero. Certainly, the dierence equation would notdescribe a linear system (Section 2.6.6: Linear Systems) if the input that is zero for all time did not

183
produce a zero output. With this assumption, y (−1) = 0, leaving y (0) = b. For n > 0, the inputunit-sample is zero, which leaves us with the dierence equation y (n) = ay (n− 1) , n > 0 . Wecan envision how the lter responds to this input by making a table.
y (n) = ay (n− 1) + bδ (n) (5.47)
n x (n) y (n)
−1 0 0
0 1 b
1 0 ba
2 0 ba2
: 0 :
n 0 ban
Figure 5.18
Coecient values determine how the output behaves. The parameter b can be any value, andserves as a gain. The eect of the parameter a is more complicated (Figure 5.18). If it equalszero, the output simply equals the input times the gain b. For all non-zero values of a, the outputlasts forever; such systems are said to be IIR (Innite Impulse Response). The reason for thisterminology is that the unit sample also known as the impulse (especially in analog situations), andthe system's response to the "impulse" lasts forever. If a is positive and less than one, the outputis a decaying exponential. When a = 1, the output is a unit step. If a is negative and greaterthan −1, the output oscillates while decaying exponentially. When a = −1, the output changessign forever, alternating between b and −b. More dramatic eects when |a| > 1; whether positiveor negative, the output signal becomes larger and larger, growing exponentially.
1
n
y(n)a = 0.5, b = 1
n
-1
1y(n)a = –0.5, b = 1
n0
2
4y(n)a = 1.1, b = 1
x(n)
n
n
Figure 5.19: The input to the simple example system, a unit sample, is shown at the top, with theoutputs for several system parameter values shown below.

184 CHAPTER 5. DIGITAL SIGNAL PROCESSING
Positive values of a are used in population models to describe how population size increasesover time. Here, n might correspond to generation. The dierence equation says that the numberin the next generation is some multiple of the previous one. If this multiple is less than one, thepopulation becomes extinct; if greater than one, the population ourishes. The same dierenceequation also describes the eect of compound interest on deposits. Here, n indexes the times atwhich compounding occurs (daily, monthly, etc.), a equals the compound interest rate plusone, andb = 1 (the bank provides no gain). In signal processing applications, we typically require that theoutput remain bounded for any input. For our example, that means that we restrict |a| = 1 andchose values for it and the gain according to the application.
Exercise 5.24 (Solution on p. 206.)
Note that the dierence equation (5.44),
y (n) = a1y (n− 1) + · · ·+ apy (n− p) + b0x (n) + b1x (n− 1) + · · ·+ bqx (n− q)
does not involve terms like y (n + 1) or x (n + 1) on the equation's right side. Can such terms alsobe included? Why or why not?
y(n)
n
15
Figure 5.20: The plot shows the unit-sample response of a length-5 boxcar lter.
Example 5.6A somewhat dierent system has no "a" coecients. Consider the dierence equation
y (n) =1q
(x (n) + · · ·+ x (n− q + 1)) (5.48)
Because this system's output depends only on current and previous input values, we need notbe concerned with initial conditions. When the input is a unit-sample, the output equals 1
q forn = 0, . . . , q − 1, then equals zero thereafter. Such systems are said to be FIR (Finite ImpulseResponse) because their unit sample responses have nite duration. Plotting this response (Fig-ure 5.20) shows that the unit-sample response is a pulse of width q and height 1
q . This waveformis also known as a boxcar, hence the name boxcar lter given to this system. We'll derive itsfrequency response and develop its ltering interpretation in the next section. For now, note thatthe dierence equation says that each output value equals the average of the input's current andprevious values. Thus, the output equals the running average of input's previous q values. Such asystem could be used to produce the average weekly temperature (q = 7) that could be updateddaily.
This is an unsupported media type. To view, please seehttp://cnx.org/content/m10251/latest/DiscreteTimeSys.llb

185
5.13 Discrete-Time Systems in the Frequency Domain25
As with analog linear systems, we need to nd the frequency response of discrete-time systems. We usedimpedances to derive directly from the circuit's structure the frequency response. The only structure we haveso far for a discrete-time system is the dierence equation. We proceed as when we used impedances: let theinput be a complex exponential signal. When we have a linear, shift-invariant system, the output should alsobe a complex exponential of the same frequency, changed in amplitude and phase. These amplitude and phasechanges comprise the frequency response we seek. The complex exponential input signal is x (n) = Xej2πfn.Note that this input occurs for all values of n. No need to worry about initial conditions here. Assume theoutput has a similar form: y (n) = Y ej2πfn. Plugging these signals into the fundamental dierence equation(5.44), we have
Y ej2πfn = a1Y ej2πf(n−1) + · · ·+ apY ej2πf(n−p) + b0Xej2πfn + b1Xej2πf(n−1) + · · ·+ bqXej2πf(n−q) (5.49)
The assumed output does indeed satisfy the dierence equation if the output complex amplitude is relatedto the input amplitude by
Y =b0 + b1e
−(j2πf) + · · ·+ bqe−(j2πqf)
1− a1e−(j2πf) − · · · − ape−(j2πpf)X
This relationship corresponds to the system's frequency response or, by another name, its transfer function.We nd that any discrete-time system dened by a dierence equation has a transfer function given by
H(ej2πf
)=
b0 + b1e−(j2πf) + · · ·+ bqe
−(j2πqf)
1− a1e−(j2πf) − · · · − ape−(j2πpf)(5.50)
Furthermore, because any discrete-time signal can be expressed as a superposition of complex exponentialsignals and because linear discrete-time systems obey the Superposition Principle, the transfer functionrelates the discrete-time Fourier transform of the system's output to the input's Fourier transform.
Y(ej2πf
)= X
(ej2πf
)H(ej2πf
)(5.51)
Example 5.7The frequency response of the simple IIR system (dierence equation given in a previous example(Example 5.5)) is given by
H(ej2πf
)=
b
1− ae−(j2πf)(5.52)
This Fourier transform occurred in a previous example; the exponential signal spectrum (Fig-ure 5.10: Spectra of exponential signals) portrays the magnitude and phase of this transfer function.When the lter coecient a is positive, we have a lowpass lter; negative a results in a highpasslter. The larger the coecient in magnitude, the more pronounced the lowpass or highpass lter-ing.
Example 5.8The length-q boxcar lter (dierence equation found in a previous example (Example 5.6)) has thefrequency response
H(ej2πf
)=
1q
q−1∑m=0
(e−(j2πfm)
)(5.53)
This expression amounts to the Fourier transform of the boxcar signal (Figure 5.20). There wefound that this frequency response has a magnitude equal to the absolute value of dsinc (πf); seethe length-10 lter's frequency response (Figure 5.11: Spectrum of length-ten pulse). We see thatboxcar lterslength-q signal averagershave a lowpass behavior, having a cuto frequency of 1
q .
25This content is available online at <http://cnx.org/content/m0510/2.14/>.

186 CHAPTER 5. DIGITAL SIGNAL PROCESSING
Exercise 5.25 (Solution on p. 206.)
Suppose we multiply the boxcar lter's coecients by a sinusoid: bm = 1q cos (2πf0m) Use Fourier
transform properties to determine the transfer function. How would you characterize this system:Does it act like a lter? If so, what kind of lter and how do you control its characteristics withthe lter's coecients?
These examples illustrate the point that systems described (and implemented) by dierence equations serveas lters for discrete-time signals. The lter's order is given by the number p of denominator coecientsin the transfer function (if the system is IIR) or by the number q of numerator coecients if the lter isFIR. When a system's transfer function has both terms, the system is usually IIR, and its order equals pregardless of q. By selecting the coecients and lter type, lters having virtually any frequency responsedesired can be designed. This design exibility can't be found in analog systems. In the next section, wedetail how analog signals can be ltered by computers, oering a much greater range of ltering possibilitiesthan is possible with circuits.
5.14 Filtering in the Frequency Domain26
Because we are interested in actual computations rather than analytic calculations, we must consider thedetails of the discrete Fourier transform. To compute the length-N DFT, we assume that the signal has aduration less than or equal to N . Because frequency responses have an explicit frequency-domain specication(5.49) in terms of lter coecients, we don't have a direct handle on which signal has a Fourier transformequaling a given frequency response. Finding this signal is quite easy. First of all, note that the discrete-timeFourier transform of a unit sample equals one for all frequencies. Because of the input and output of linear,shift-invariant systems are related to each other by Y
(ej2πf
)= H
(ej2πf
)X(ej2πf
), a unit-sample input,
which has X(ej2πf
)= 1, results in the output's Fourier transform equaling the system's transfer function.
Exercise 5.26 (Solution on p. 206.)
This statement is a very important result. Derive it yourself.
In the time-domain, the output for a unit-sample input is known as the system's unit-sample response,and is denoted by h (n). Combining the frequency-domain and time-domain interpretations of a linear, shift-invariant system's unit-sample response, we have that h (n) and the transfer function are Fourier transformpairs in terms of the discrete-time Fourier transform.(
h (n) ↔ H(ej2πf
))(5.54)
Returning to the issue of how to use the DFT to perform ltering, we can analytically specify the frequencyresponse, and derive the corresponding length-N DFT by sampling the frequency response.
H (k) = H(e
j2πkN
), k = 0, . . . , N − 1 (5.55)
Computing the inverse DFT yields a length-N signal no matter what the actual duration of the unit-sampleresponse might be. If the unit-sample response has a duration less than or equal to N (it's a FIR lter),computing the inverse DFT of the sampled frequency response indeed yields the unit-sample response. If,however, the duration exceeds N , errors are encountered. The nature of these errors is easily explainedby appealing to the Sampling Theorem. By sampling in the frequency domain, we have the potential foraliasing in the time domain (sampling in one domain, be it time or frequency, can result in aliasing in theother) unless we sample fast enough. Here, the duration of the unit-sample response determines the minimalsampling rate that prevents aliasing. For FIR systems they by denition have nite-duration unit sampleresponses the number of required DFT samples equals the unit-sample response's duration: N ≥ q.
26This content is available online at <http://cnx.org/content/m10257/2.16/>.

187
Exercise 5.27 (Solution on p. 206.)
Derive the minimal DFT length for a length-q unit-sample response using the Sampling Theorem.Because sampling in the frequency domain causes repetitions of the unit-sample response in thetime domain, sketch the time-domain result for various choices of the DFT length N .
Exercise 5.28 (Solution on p. 206.)
Express the unit-sample response of a FIR lter in terms of dierence equation coecients. Notethat the corresponding question for IIR lters is far more dicult to answer: Consider the example(Example 5.5).
For IIR systems, we cannot use the DFT to nd the system's unit-sample response: aliasing of the unit-sample response will always occur. Consequently, we can only implement an IIR lter accurately in thetime domain with the system's dierence equation. Frequency-domain implementations are restricted toFIR lters.
Another issue arises in frequency-domain ltering that is related to time-domain aliasing, this time whenwe consider the output. Assume we have an input signal having duration Nx that we pass through a FIRlter having a length-q + 1 unit-sample response. What is the duration of the output signal? The dierenceequation for this lter is
y (n) = b0x (n) + · · ·+ bqx (n− q) (5.56)
This equation says that the output depends on current and past input values, with the input value q samplesprevious dening the extent of the lter's memory of past input values. For example, the output at indexNx depends on x (Nx) (which equals zero), x (Nx − 1), through x (Nx − q). Thus, the output returns to zeroonly after the last input value passes through the lter's memory. As the input signal's last value occurs atindex Nx−1, the last nonzero output value occurs when n− q = Nx−1 or n = q +Nx−1. Thus, the outputsignal's duration equals q + Nx.
Exercise 5.29 (Solution on p. 206.)
In words, we express this result as "The output's duration equals the input's duration plus thelter's duration minus one.". Demonstrate the accuracy of this statement.
The main theme of this result is that a lter's output extends longer than either its input or its unit-sampleresponse. Thus, to avoid aliasing when we use DFTs, the dominant factor is not the duration of input orof the unit-sample response, but of the output. Thus, the number of values at which we must evaluate thefrequency response's DFT must be at least q +Nx and we must compute the same length DFT of the input.To accommodate a shorter signal than DFT length, we simply zero-pad the input: Ensure that for indicesextending beyond the signal's duration that the signal is zero. Frequency-domain ltering, diagrammed inFigure 5.21, is accomplished by storing the lter's frequency response as the DFT H (k), computing theinput's DFT X (k), multiplying them to create the output's DFT Y (k) = H (k) X (k), and computing theinverse DFT of the result to yield y (n).
DFTx(n)
H(k)
IDFTX(k) Y(k) y(n)
Figure 5.21: To lter a signal in the frequency domain, rst compute the DFT of the input, multiplythe result by the sampled frequency response, and nally compute the inverse DFT of the product. TheDFT's length must be at least the sum of the input's and unit-sample response's duration minus one.We calculate these discrete Fourier transforms using the fast Fourier transform algorithm, of course.

188 CHAPTER 5. DIGITAL SIGNAL PROCESSING
Before detailing this procedure, let's clarify why so many new issues arose in trying to develop a frequency-domain implementation of linear ltering. The frequency-domain relationship between a lter's input andoutput is always true: Y
(ej2πf
)= H
(ej2πf
)X(ej2πf
). This Fourier transforms in this result are discrete-
time Fourier transforms; for example, X(ej2πf
)=∑
n
(x (n) e−(j2πfn)
). Unfortunately, using this relation-
ship to perform ltering is restricted to the situation when we have analytic formulas for the frequencyresponse and the input signal. The reason why we had to "invent" the discrete Fourier transform (DFT) hasthe same origin: The spectrum resulting from the discrete-time Fourier transform depends on the continuousfrequency variable f . That's ne for analytic calculation, but computationally we would have to make anuncountably innite number of computations.
note: Did you know that two kinds of innities can be meaningfully dened? A countablyinnite quantity means that it can be associated with a limiting process associated with integers.An uncountably innite quantity cannot be so associated. The number of rational numbers iscountably innite (the numerator and denominator correspond to locating the rational by row andcolumn; the total number so-located can be counted, voila!); the number of irrational numbers isuncountably innite. Guess which is "bigger?"
The DFT computes the Fourier transform at a nite set of frequencies samples the true spectrum which can lead to aliasing in the time-domain unless we sample suciently fast. The sampling interval hereis 1
K for a length-K DFT: faster sampling to avoid aliasing thus requires a longer transform calculation.Since the longest signal among the input, unit-sample response and output is the output, it is that signal'sduration that determines the transform length. We simply extend the other two signals with zeros (zero-pad)to compute their DFTs.
Example 5.9Suppose we want to average daily stock prices taken over last year to yield a running weeklyaverage (average over ve trading sessions). The lter we want is a length-5 averager (as shown inthe unit-sample response (Figure 5.20)), and the input's duration is 253 (365 calendar days minusweekend days and holidays). The output duration will be 253+5−1 = 257, and this determines thetransform length we need to use. Because we want to use the FFT, we are restricted to power-of-twotransform lengths. We need to choose any FFT length that exceeds the required DFT length. Asit turns out, 256 is a power of two (28 = 256), and this length just undershoots our required length.To use frequency domain techniques, we must use length-512 fast Fourier transforms.
Figure 5.22 shows the input and the ltered output. The MATLAB programs that compute theltered output in the time and frequency domains are
Time Domain
h = [1 1 1 1 1]/5;
y = filter(h,1,[djia zeros(1,4)]);
Frequency Domain
h = [1 1 1 1 1]/5;
DJIA = fft(djia, 512);
H = fft(h, 512);
Y = H.*X;
y = ifft(Y);
note: The filter program has the feature that the length of its output equals the length of itsinput. To force it to produce a signal having the proper length, the program zero-pads the inputappropriately.

189
Trading Day (1997)
Dow
-Jon
es In
dust
rial A
vera
ge
0 50 100 150 200 2500
1000
2000
3000
4000
5000
6000
7000
8000
Daily AverageWeekly Average
Figure 5.22: The blue line shows the Dow Jones Industrial Average from 1997, and the red one thelength-5 boxcar-ltered result that provides a running weekly of this market index. Note the "edge"eects in the ltered output.
MATLAB's fft function automatically zero-pads its input if the specied transform length (itssecond argument) exceeds the signal's length. The frequency domain result will have a smallimaginary component largest value is 2.2 × 10⁻¹¹ because of the inherent nite precisionnature of computer arithmetic. Because of the unfortunate mist between signal lengths andfavored FFT lengths, the number of arithmetic operations in the time-domain implementation isfar less than those required by the frequency domain version: 514 versus 62,271. If the input signalhad been one sample shorter, the frequency-domain computations would have been more than afactor of two less (28,696), but far more than in the time-domain implementation.
An interesting signal processing aspect of this example is demonstrated at the beginning andend of the output. The ramping up and down that occurs can be traced to assuming the input iszero before it begins and after it ends. The lter "sees" these initial and nal values as the dierenceequation passes over the input. These artifacts can be handled in two ways: we can just ignore theedge eects or the data from previous and succeeding years' last and rst week, respectively, canbe placed at the ends.
5.15 Eciency of Frequency-Domain Filtering27
To determine for what signal and lter durations a time- or frequency-domain implementation would bethe most ecient, we need only count the computations required by each. For the time-domain, dierence-equation approach, we need Nx (2q + 1). The frequency-domain approach requires three Fourier transforms,each requiring
(K2
)(log2 K) computations for a length-K FFT, and the multiplication of two spectra (6K
computations). The output-signal-duration-determined length must be at least Nx + q. Thus, we mustcompare (
Nx (2q + 1) ↔ 6 (Nx + q) +32
(Nx + q) log2 (Nx + q))
27This content is available online at <http://cnx.org/content/m10279/2.14/>.

190 CHAPTER 5. DIGITAL SIGNAL PROCESSING
Exact analytic evaluation of this comparison is quite dicult (we have a transcendental equation to solve).Insight into this comparison is best obtained by dividing by Nx.(
2q + 1 ↔ 6(
1 +q
Nx
)+
32
(1 +
q
Nx
)log2 (Nx + q)
)With this manipulation, we are evaluating the number of computations per sample. For any given value ofthe lter's order q, the right side, the number of frequency-domain computations, will exceed the left if thesignal's duration is long enough. However, for lter durations greater than about 10, as long as the input isat least 10 samples, the frequency-domain approach is faster so long as the FFT's power-of-two constraintis advantageous.
The frequency-domain approach is not yet viable; what will we do when the input signal is innitely long?The dierence equation scenario ts perfectly with the envisioned digital ltering structure (Figure 5.25), butso far we have required the input to have limited duration (so that we could calculate its Fourier transform).The solution to this problem is quite simple: Section the input into frames, lter each, and add the resultstogether. To section a signal means expressing it as a linear combination of length-Nx non-overlapping"chunks." Because the lter is linear, ltering a sum of terms is equivalent to summing the results of lteringeach term.
x (n) =∞∑
m=−∞(x (n−mNx)) ⇒ y (n) =
∞∑m=−∞
(y (n−mNx)) (5.57)
As illustrated in Figure 5.23, note that each ltered section has a duration longer than the input. Conse-quently, we must literally add the ltered sections together, not just butt them together.
Computational considerations reveal a substantial advantage for a frequency-domain implementationover a time-domain one. The number of computations for a time-domain implementation essentially remainsconstant whether we section the input or not. Thus, the number of computations for each output is 2q + 1.In the frequency-domain approach, computation counting changes because we need only compute the lter'sfrequency response H (k) once, which amounts to a xed overhead. We need only compute two DFTs andmultiply them to lter a section. Letting Nx denote a section's length, the number of computations fora section amounts to (Nx + q) log2 (Nx + q) + 6 (Nx + q). In addition, we must add the ltered outputstogether; the number of terms to add corresponds to the excess duration of the output compared with the
input (q). The frequency-domain approach thus requires(1 + q
Nx
)log2 (Nx + q) + 7 q
Nx+ 6 computations
per output value. For even modest lter orders, the frequency-domain approach is much faster.
Exercise 5.30 (Solution on p. 206.)
Show that as the section length increases, the frequency domain approach becomes increasinglymore ecient.
Note that the choice of section duration is arbitrary. Once the lter is chosen, we should section so that therequired FFT length is precisely a power of two: Choose Nx so that Nx + q = 2L.
Implementing the digital lter shown in the A/D block diagram (Figure 5.25) with a frequency-domainimplementation requires some additional signal management not required by time-domain implementations.Conceptually, a real-time, time-domain lter could accept each sample as it becomes available, calculate thedierence equation, and produce the output value, all in less that the sampling interval Ts. Frequency-domainapproaches don't operate on a sample-by-sample basis; instead, they operate on sections. They lter in realtime by producing Nx outputs for the same number of inputs faster than NxTs. Because they generally takelonger to produce an output section than the sampling interval duration, we must lter one section whileaccepting into memory the next section to be ltered. In programming, the operation of building up sectionswhile computing on previous ones is known as buering. Buering can also be used in time-domain ltersas well but isn't required.
Example 5.10We want to lowpass lter a signal that contains a sinusoid and a signicant amount of noise. Theexample shown in Figure 5.23 shows a portion of the noisy signal's waveform. If it weren't for the

191
n
n
Filter Filter
Sectioned Input
Filtered, Overlapped Sections
Output (Sum of Filtered Sections)
Figure 5.23: The noisy input signal is sectioned into length-48 frames, each of which is ltered usingfrequency-domain techniques. Each ltered section is added to other outputs that overlap to create thesignal equivalent to having ltered the entire input. The sinusoidal component of the signal is shown asthe red dashed line.
overlaid sinusoid, discerning the sine wave in the signal is virtually impossible. One of the primaryapplications of linear lters is noise removal: preserve the signal by matching lter's passbandwith the signal's spectrum and greatly reduce all other frequency components that may be presentin the noisy signal.
A smart Rice engineer has selected a FIR lter having a unit-sample response corresponding aperiod-17 sinusoid: h (n) = 1
17
(1− cos
(2πn17
)), n = 0, . . . , 16, which makes q = 16. Its frequency
response (determined by computing the discrete Fourier transform) is shown in Figure 5.24. Toapply, we can select the length of each section so that the frequency-domain ltering approachis maximally ecient: Choose the section length Nx so that Nx + q is a power of two. To usea length-64 FFT, each section must be 48 samples long. Filtering with the dierence equationwould require 33 computations per output while the frequency domain requires a little over 16; thisfrequency-domain implementation is over twice as fast! Figure 5.23 shows how frequency-domainltering works.

192 CHAPTER 5. DIGITAL SIGNAL PROCESSING
0
0.1
h(n)
Indexn
Spe
ctra
l Mag
nitu
de
0 0.50
1|H(ej2πf)|
Frequency
Figure 5.24: The gure shows the unit-sample response of a length-17 Hanning lter on the left andthe frequency response on the right. This lter functions as a lowpass lter having a cuto frequency ofabout 0.1.
We note that the noise has been dramatically reduced, with a sinusoid now clearly visible in theltered output. Some residual noise remains because noise components within the lter's passbandappear in the output as well as the signal.
Exercise 5.31 (Solution on p. 207.)
Note that when compared to the input signal's sinusoidal component, the output's sinusoidalcomponent seems to be delayed. What is the source of this delay? Can it be removed?
5.16 Discrete-Time Filtering of Analog Signals28
Because of the Sampling Theorem (Section 5.3.2: The Sampling Theorem), we can process, in particularlter, analog signals "with a computer" by constructing the system shown in Figure 5.25. To use this system,we are assuming that the input signal has a lowpass spectrum and can be bandlimited without aectingimportant signal aspects. Bandpass signals can also be ltered digitally, but require a more complicatedsystem. Highpass signals cannot be ltered digitally. Note that the input and output lters must be analoglters; trying to operate without them can lead to potentially very inaccurate digitization.
Another implicit assumption is that the digital lter can operate in real time: The computer and theltering algorithm must be suciently fast so that outputs are computed faster than input values arrive.The sampling interval, which is determined by the analog signal's bandwidth, thus determines how long ourprogram has to compute each output y (n). The computational complexity for calculating each output witha dierence equation (5.44) is O (p + q). Frequency domain implementation of the lter is also possible.The idea begins by computing the Fourier transform of a length-N portion of the input x (n), multiplyingit by the lter's transfer function, and computing the inverse transform of the result. This approach seemsoverly complex and potentially inecient. Detailing the complexity, however, we have O (NlogN) for the twotransforms (computed using the FFT algorithm) and O (N) for the multiplication by the transfer function,which makes the total complexity O (NlogN) for N input values. A frequency domain implementation thusrequires O (logN) computational complexity for each output value. The complexities of time-domain andfrequency-domain implementations depend on dierent aspects of the ltering: The time-domain implemen-tation depends on the combined orders of the lter while the frequency-domain implementation depends onthe logarithm of the Fourier transform's length.
28This content is available online at <http://cnx.org/content/m0511/2.20/>.

193
LPFW Q[•] Digital
FilterD/A
LPFW
x(t)
t = nTs
Ts <1
2W
x(n) =Q[x(nTs)] y(n) y(t)x(nTs)
A/D
Figure 5.25: To process an analog signal digitally, the signal x (t) must be ltered with an anti-aliasing lter (to ensure a bandlimited signal) before A/D conversion. This lowpass lter (LPF) has acuto frequency of W Hz, which determines allowable sampling intervals Ts . The greater the numberof bits in the amplitude quantization portion Q [·] of the A/D converter, the greater the accuracy of theentire system. The resulting digital signal x (n) can now be ltered in the time-domain with a dierenceequation or in the frequency domain with Fourier transforms. The resulting output y (n) then drives aD/A converter and a second anti-aliasing lter (having the same bandwidth as the rst one).
It could well be that in some problems the time-domain version is more ecient (more easily satises thereal time requirement), while in others the frequency domain approach is faster. In the latter situations, it isthe FFT algorithm for computing the Fourier transforms that enables the superiority of frequency-domainimplementations. Because complexity considerations only express how algorithm running-time increases withsystem parameter choices, we need to detail both implementations to determine which will be more suitablefor any given ltering problem. Filtering with a dierence equation is straightforward, and the number ofcomputations that must be made for each output value is 2 (p + q).
Exercise 5.32 (Solution on p. 207.)
Derive this value for the number of computations for the general dierence equation (5.44).
5.17 Digital Signal Processing Problems29
Problem 5.1: Sampling and FilteringThe signal s (t) is bandlimited to 4 kHz. We want to sample it, but it has been subjected to various signalprocessing manipulations.
a) What sampling frequency (if any works) can be used to sample the result of passing s (t) through anRC highpass lter with R = 10kΩ and C = 8nF?
b) What sampling frequency (if any works) can be used to sample the derivative of s (t)?c) The signal s (t) has been modulated by an 8 kHz sinusoid having an unknown phase: the resulting
signal is s (t) sin (2πf0t + φ), with f0 = 8kHz and φ =? Can the modulated signal be sampled so thatthe original signal can be recovered from the modulated signal regardless of the phase value φ? If so,show how and nd the smallest sampling rate that can be used; if not, show why not.
Problem 5.2: Non-Standard SamplingUsing the properties of the Fourier series can ease nding a signal's spectrum.
a) Suppose a signal s (t) is periodic with period T . If ck represents the signal's Fourier series coecients,what are the Fourier series coecients of s
(t− T
2
)?
b) Find the Fourier series of the signal p (t) shown in Figure 5.26 (Pulse Signal).
29This content is available online at <http://cnx.org/content/m10351/2.33/>.

194 CHAPTER 5. DIGITAL SIGNAL PROCESSING
c) Suppose this signal is used to sample a signal bandlimited to 1T Hz. Find an expression for and sketch
the spectrum of the sampled signal.d) Does aliasing occur? If so, can a change in sampling rate prevent aliasing; if not, show how the signal
can be recovered from these samples.
Pulse Signal
Tt
p(t)A
……
–A
T/2
∆
∆
∆
3T/2
∆
2T
∆
Figure 5.26
Problem 5.3: A Dierent Sampling SchemeA signal processing engineer from Texas A&M claims to have developed an improved sampling scheme. Hemultiplies the bandlimited signal by the depicted periodic pulse signal to perform sampling (Figure 5.27).
Ts4
Tst
p(t)A
……∆
5Ts4
∆ ∆∆
Figure 5.27
a) Find the Fourier spectrum of this signal.b) Will this scheme work? If so, how should TS be related to the signal's bandwidth? If not, why not?

195
Problem 5.4: Bandpass SamplingThe signal s (t) has the indicated spectrum.
W 2W–W–2W
S(f)
f
Figure 5.28
a) What is the minimum sampling rate for this signal suggested by the Sampling Theorem?b) Because of the particular structure of this spectrum, one wonders whether a lower sampling rate could
be used. Show that this is indeed the case, and nd the system that reconstructs s (t) from its samples.
Problem 5.5: Sampling SignalsIf a signal is bandlimited to W Hz, we can sample it at any rate 1
Ts> 2W and recover the waveform
exactly. This statement of the Sampling Theorem can be taken to mean that all information about theoriginal signal can be extracted from the samples. While true in principle, you do have to be careful howyou do so. In addition to the rms value of a signal, an important aspect of a signal is its peak value, whichequals max |s (t) | .
a) Let s (t) be a sinusoid having frequency W Hz. If we sample it at precisely the Nyquist rate, howaccurately do the samples convey the sinusoid's amplitude? In other words, nd the worst case example.
b) How fast would you need to sample for the amplitude estimate to be within 5% of the true value?c) Another issue in sampling is the inherent amplitude quantization produced by A/D converters. Assume
the maximum voltage allowed by the converter is Vmax volts and that it quantizes amplitudes tob bits. We can express the quantized sample Q (s (nTs)) as s (nTs) + ε (t), where ε (t) representsthe quantization error at the nth sample. Assuming the converter rounds, how large is maximumquantization error?
d) We can describe the quantization error as noise, with a power proportional to the square of themaximum error. What is the signal-to-noise ratio of the quantization error for a full-range sinusoid?Express your result in decibels.
Problem 5.6: Hardware ErrorAn A/D converter has a curious hardware problem: Every other sampling pulse is half its normal amplitude(Figure 5.29).
a) Find the Fourier series for this signal.b) Can this signal be used to sample a bandlimited signal having highest frequency W = 1
2T ?
Problem 5.7: Simple D/A ConverterCommercial digital-to-analog converters don't work this way, but a simple circuit illustrates how they work.Let's assume we have a B-bit converter. Thus, we want to convert numbers having a B-bit representation

196 CHAPTER 5. DIGITAL SIGNAL PROCESSING
∆ ∆
2Tt
p(t)
……
T
∆ ∆ ∆
4T
A
A2
3T
Figure 5.29
∆
T 2T 3T0t
A
1101
4T
Figure 5.30
into a voltage proportional to that number. The rst step taken by our simple converter is to representthe number by a sequence of B pulses occurring at multiples of a time interval T . The presence of a pulseindicates a 1 in the corresponding bit position, and pulse absence means a 0 occurred. For a 4-bitconverter, the number 13 has the binary representation 1101 (1310 = 1× 23 + 1× 22 + 0× 21 + 1× 20) andwould be represented by the depicted pulse sequence. Note that the pulse sequence is backwards from thebinary representation. We'll see why that is.
This signal (Figure 5.30) serves as the input to a rst-order RC lowpass lter. We want to design the lterand the parameters ∆ and T so that the output voltage at time 4T (for a 4-bit converter) is proportionalto the number. This combination of pulse creation and ltering constitutes our simple D/A converter. Therequirements are
• The voltage at time t = 4T should diminish by a factor of 2 the further the pulse occurs from thistime. In other words, the voltage due to a pulse at 3T should be twice that of a pulse produced at 2T ,which in turn is twice that of a pulse at T , etc.
• The 4-bit D/A converter must support a 10 kHz sampling rate.
Show the circuit that works. How do the converter's parameters change with sampling rate and number ofbits in the converter?
Problem 5.8: Discrete-Time Fourier TransformsFind the Fourier transforms of the following sequences, where s (n) is some sequence having Fourier transformS(ej2πf
).

197
a) (−1)ns (n)
b) s (n) cos (2πf0n)
c) x (n) =
s(
n2
)if n (even)
0 if n (odd)d) ns (n)
Problem 5.9: Spectra of Finite-Duration SignalsFind the indicated spectra for the following signals.
a) The discrete-time Fourier transform of s (n) =
cos2(
π4 n)if n = −1, 0, 1
0 if otherwise
b) The discrete-time Fourier transform of s (n) =
n if n = −2,−1, 0, 1,−20 if otherwise
c) The discrete-time Fourier transform of s (n) =
sin(
π4 n)if n = 0, . . . , 7
0 if otherwise
d) The length-8 DFT of the previous signal.
Problem 5.10: Just Whistlin'Sammy loves to whistle and decides to record and analyze his whistling in lab. He is a very good whistler; hiswhistle is a pure sinusoid that can be described by sa (t) = sin (4000t). To analyze the spectrum, he sampleshis recorded whistle with a sampling interval of TS = 2.5× 10⁻⁴ to obtain s (n) = sa (nTS). Sammy (wisely)decides to analyze a few samples at a time, so he grabs 30 consecutive, but arbitrarily chosen, samples. Hecalls this sequence x (n) and realizes he can write it as
x (n) = sin (4000nTS + θ) , n = 0, . . . , 29
a) Did Sammy under- or over-sample his whistle?b) What is the discrete-time Fourier transform of x (n) and how does it depend on θ?c) How does the 32-point DFT of x (n) depend on θ?
Problem 5.11: Discrete-Time FilteringWe can nd the input-output relation for a discrete-time lter much more easily than for analog lters. Thekey idea is that a sequence can be written as a weighted linear combination of unit samples.
a) Show that x (n) =∑
i (x (i) δ (n− i)) where δ (n) is the unit-sample.
δ (n) =
1 if n = 0
0 otherwise
b) If h (n) denotes the unit-sample responsethe output of a discrete-time linear, shift-invariant lter toa unit-sample inputnd an expression for the output.
c) In particular, assume our lter is FIR, with the unit-sample response having duration q + 1. If theinput has duration N , what is the duration of the lter's output to this signal?
d) Let the lter be a boxcar averager: h (n) =(
1q+1
)for n = 0, . . . , q and zero otherwise. Let the input
be a pulse of unit height and duration N . Find the lter's output when N = q+12 , q an odd integer.

198 CHAPTER 5. DIGITAL SIGNAL PROCESSING
Problem 5.12: A Digital FilterA digital lter has the depicted (Figure 5.31) unit-sample reponse.
n
h(n)
1
2
10–1 2 3 4
Figure 5.31
a) What is the dierence equation that denes this lter's input-output relationship?b) What is this lter's transfer function?c) What is the lter's output when the input is sin
(πn4
)?
Problem 5.13: A Special Discrete-Time FilterConsider a FIR lter governed by the dierence equation
y (n) =13x (n + 2) +
23x (n + 1) + x (n) +
23x (n− 1) +
13x (n− 2)
a) Find this lter's unit-sample response.b) Find this lter's transfer function. Characterize this transfer function (i.e., what classic lter category
does it fall into).c) Suppose we take a sequence and stretch it out by a factor of three.
x (n) =
s(
n3
)if n = 3m , m = . . . ,−1, 0, 1, . . .
0 otherwise
Sketch the sequence x (n) for some example s (n). What is the lter's output to this input? Inparticular, what is the output at the indices where the input x (n) is intentionally zero? Now howwould you characterize this system?
Problem 5.14: Simulating the Real WorldMuch of physics is governed by dierntial equations, and we want to use signal processing methods tosimulate physical problems. The idea is to replace the derivative with a discrete-time approximation andsolve the resulting dierential equation. For example, suppose we have the dierential equation
d
dty (t) + ay (t) = x (t)
and we approximate the derivative by
d
dty (t) |t=nT ≈
y (nT )− y ((n− 1) T )T
where T essentially amounts to a sampling interval.

199
a) What is the dierence equation that must be solved to approximate the dierential equation?b) When x (t) = u (t), the unit step, what will be the simulated output?c) Assuming x (t) is a sinusoid, how should the sampling interval T be chosen so that the approximation
works well?
Problem 5.15: The DFTLet's explore the DFT and its properties.
a) What is the length-K DFT of length-N boxcar sequence, where N < K?b) Consider the special case where K = 4. Find the inverse DFT of the product of the DFTs of two
length-3 boxcars.c) If we could use DFTs to perform linear ltering, it should be true that the product of the input's DFT
and the unit-sample response's DFT equals the output's DFT. So that you can use what you justcalculated, let the input be a boxcar signal and the unit-sample response also be a boxcar. The resultof part (b) would then be the lter's output if we could implement the lter with length-4 DFTs. Doesthe actual output of the boxcar-lter equal the result found in the previous part (list, item 2, p. 199)?
d) What would you need to change so that the product of the DFTs of the input and unit-sample responsein this case equaled the DFT of the ltered output?
Problem 5.16: The Fast Fourier TransformJust to determine how fast the FFT algorithm really is, we can take advantage of MATLAB's fft function.If x is a length-N vector, fft(x) computes the length-N transform using the most ecient algorithm itcan. In other words, it does not automatically zero-pad the sequence and it will use the FFT algorithm ifthe length is a power of two. Let's count the number of arithmetic operations the fft program requires forlengths ranging from 2 to 1024.
a) For each length to be tested, generate a vector of random numbers, calculate the vector's transform,and determine how long it took. The program (Figure 5.32: Program) illustrates the computations.
b) Plot the vector of computation times. What lengths consume the most computations? What complex-ity do they seem to have? What lengths have the fewest computations?
Program
for n=2:1024,
x = randn(1,n);
t_start = cputime;
fft(x);
time(n) = cputime - t_start;
end
Figure 5.32
Problem 5.17: DSP TricksSammy is faced with computing lots of discrete Fourier transforms. He will, or course, use the FFTalgorithm, but he is behind schedule and needs to get his results as quickly as possible. He gets the idea of

200 CHAPTER 5. DIGITAL SIGNAL PROCESSING
computing two transforms at one time by computing the transform of s (n) = s1 (n) + js2 (n), where s1 (n)and s2 (n) are two real-valued signals of which he needs to compute the spectra. The issue is whether he canretrieve the individual DFTs from the result or not.
a) What will be the DFT S (k) of this complex-valued signal in terms of S1 (k) and S2 (k), the DFTs ofthe original signals?
b) Sammy's friend, an Aggie who knows some signal processing, says that retrieving the wanted DFTs iseasy: Just nd the real and imaginary parts of S (k). Show that this approach is too simplistic.
c) While his friend's idea is not correct, it does give him an idea. What approach will work? Hint: Usethe symmetry properties of the DFT.
d) How does the number of computations change with this approach? Will Sammy's idea ultimately leadto a faster computation of the required DFTs?
Problem 5.18: Discrete Cosine Transform (DCT)The discrete cosine transform of a length-N sequence is dened to be
Sc (k) =N−1∑n=0
(s (n) cos
(2πnk
2N
))Note that the number of frequency terms is 2N − 1: k = 0, . . . , 2N − 1.
a) Find the inverse DCT.b) Does a Parseval's Theorem hold for the DCT?c) You choose to transmit information about the signal s (n) according to the DCT coecients. You
could only send one, which one would you send?
Problem 5.19: A Digital FilterA digital lter is described by the following dierence equation:
y (n) = ay (n− 1) + ax (n)− x (n− 1) ,a =1√2
a) What is this lter's unit sample response?b) What is this lter's transfer function?c) What is this lter's output when the input is sin
(πn4
)?
Problem 5.20: Another Digital FilterA digital lter is determined by the following dierence equation.
y (n) = y (n− 1) + x (n)− x (n− 4)
a) Find this lter's unit sample response.b) What is the lter's transfer function?c) Find the lter's output when the input is the sinusoid sin
(πn2
).
Problem 5.21: Yet Another Digital FilterA lter has an input-output relationship given by the dierence equation
y (n) =14x (n) +
12x (n− 1) +
14x (n− 2)
.

201
a) What is the lter's transfer function? How would you characterize it?b) What is the lter's output when the input equals cos
(πn2
)?
c) What is the lter's output when the input is the depicted discrete-time square-wave (Figure 5.33)?
n
x(n)
……1
–1
Figure 5.33
Problem 5.22: A Digital Filter in the Frequency DomainWe have a lter with the transfer function
H(ej2πf
)= e−(j2πf) cos (2πf)
operating on the input signal x (n) = δ (n)− δ (n− 2) that yields the output y (n).
• What is the lter's unit-sample response?• What is the discrete-Fourier transform of the output?• What is the time-domain expression for the output?
Problem 5.23: Digital FiltersA discrete-time system is governed by the dierence equation
y (n) = y (n− 1) +x (n) + x (n− 1)
2
a) Find the transfer function for this system.b) What is this system's output when the input is sin
(πn2
)?
c) If the output is observed to be y (n) = δ (n) + δ (n− 1), then what is the input?
Problem 5.24: Digital FilteringA digital lter has an input-output relationship expressed by the dierence equation
y (n) =x (n) + x (n− 1) + x (n− 2) + x (n− 3)
4.
a) Plot the magnitude and phase of this lter's transfer function.b) What is this lter's output when x (n) = cos
(πn2
)+ 2 sin
(2πn3
)?
Problem 5.25: Detective WorkThe signal x (n) equals δ (n)− δ (n− 1).

202 CHAPTER 5. DIGITAL SIGNAL PROCESSING
a) Find the length-8 DFT (discrete Fourier transform) of this signal.b) You are told that when x (n) served as the input to a linear FIR (nite impulse response) lter, the
output was y (n) = δ (n)− δ (n− 1) + 2δ (n− 2). Is this statement true? If so, indicate why and ndthe system's unit sample response; if not, show why not.
Problem 5.26:A discrete-time, shift invariant, linear system produces an output y (n) = 1,−1, 0, 0, . . . when its input
x (n) equals a unit sample.
a) Find the dierence equation governing the system.b) Find the output when x (n) = cos (2πf0n).c) How would you describe this system's function?
Problem 5.27: Time Reversal has UsesA discrete-time system has transfer function H
(ej2πf
). A signal x (n) is passed through this system to
yield the signal w (n). The time-reversed signal w (−n) is then passed through the system to yield thetime-reversed output y (−n). What is the transfer function between x (n) and y (n)?Problem 5.28: Removing HumThe slang word hum represents power line waveforms that creep into signals because of poor circuitconstruction. Usually, the 60 Hz signal (and its harmonics) are added to the desired signal. What we seekare lters that can remove hum. In this problem, the signal and the accompanying hum have been sampled;we want to design a digital lter for hum removal.
a) Find lter coecients for the length-3 FIR lter that can remove a sinusoid having digital frequencyf0 from its input.
b) Assuming the sampling rate is fs to what analog frequency does f0 correspond?c) A more general approach is to design a lter having a frequency response magnitude proportional to
the absolute value of a cosine: |H(ej2πf
)| ∝ | cos (πfN) |. In this way, not only can the fundamental
but also its rst few harmonics be removed. Select the parameter N and the sampling rate so that thefrequencies at which the cosine equals zero correspond to 60 Hz and its odd harmonics through thefth.
d) Find the dierence equation that denes this lter.
Problem 5.29: Digital AM ReceiverThinking that digital implementations are always better, our clever engineer wants to design a digital AMreceiver. The receiver would bandpass the received signal, pass the result through an A/D converter, performall the demodulation with digital signal processing systems, and end with a D/A converter to produce theanalog message signal. Assume in this problem that the carrier frequency is always a large even multiple ofthe message signal's bandwidth W .
a) What is the smallest sampling rate that would be needed?b) Show the block diagram of the least complex digital AM receiver.c) Assuming the channel adds white noise and that a b-bit A/D converter is used, what is the output's
signal-to-noise ratio?
Problem 5.30: DFTsA problem on Samantha's homework asks for the 8-point DFT of the discrete-time signal δ (n− 1)+δ (n− 7).
a) What answer should Samantha obtain?b) As a check, her group partner Sammy says that he computed the inverse DFT of her answer and got
δ (n + 1) + δ (n− 1). Does Sammy's result mean that Samantha's answer is wrong?c) The homework problem says to lowpass-lter the sequence by multiplying its DFT by
H (k) =
1 if k = 0, 1, 70 otherwise

203
and then computing the inverse DFT. Will this ltering algorithm work? If so, nd the ltered output;if not, why not?
Problem 5.31: Stock Market Data ProcessingBecause a trading week lasts ve days, stock markets frequently compute running averages each day over theprevious ve trading days to smooth price uctuations. The technical stock analyst at the Buy-LoSell-Hibrokerage rm has heard that FFT ltering techniques work better than any others (in terms of producingmore accurate averages).
a) What is the dierence equation governing the ve-day averager for daily stock prices?b) Design an ecient FFT-based ltering algorithm for the broker. How much data should be processed
at once to produce an ecient algorithm? What length transform should be used?c) Is the analyst's information correct that FFT techniques produce more accurate averages than any
others? Why or why not?
Problem 5.32: Digital Filtering of Analog SignalsRU Electronics wants to develop a lter that would be used in analog applications, but that is implementeddigitally. The lter is to operate on signals that have a 10 kHz bandwidth, and will serve as a lowpass lter.
a) What is the block diagram for your lter implementation? Explicitly denote which components areanalog, which are digital (a computer performs the task), and which interface between analog anddigital worlds.
b) What sampling rate must be used and how many bits must be used in the A/D converter for theacquired signal's signal-to-noise ratio to be at least 60 dB? For this calculation, assume the signal is asinusoid.
c) If the lter is a length-128 FIR lter (the duration of the lter's unit-sample response equals 128),should it be implemented in the time or frequency domain?
d) Assuming H(ej2πf
)is the transfer function of the digital lter, what is the transfer function of your
system?
Problem 5.33: Signal CompressionBecause of the slowness of the Internet, lossy signal compression becomes important if you want signalsto be received quickly. An enterprising 241 student has proposed a scheme based on frequency-domainprocessing. First of all, he would section the signal into length-N blocks, and compute its N -point DFT. Hethen would discard (zero the spectrum) at half of the frequencies, quantize them to b-bits, and send theseover the network. The receiver would assemble the transmitted spectrum and compute the inverse DFT,thus reconstituting an N -point block.
a) At what frequencies should the spectrum be zeroed to minimize the error in this lossy compressionscheme?
b) The nominal way to represent a signal digitally is to use simple b-bit quantization of the time-domainwaveform. How long should a section be in the proposed scheme so that the required number ofbits/sample is smaller than that nominally required?
c) Assuming that eective compression can be achieved, would the proposed scheme yield satisfactoryresults?

204 CHAPTER 5. DIGITAL SIGNAL PROCESSING
Solutions to Exercises in Chapter 5
Solution to Exercise 5.1 (p. 157)For b-bit signed integers, the largest number is 2b−1 − 1. For b = 32, we have 2,147,483,647 and for b = 64,we have 9,223,372,036,854,775,807 or about 9.2× 10¹⁸.
Solution to Exercise 5.2 (p. 158)In oating point, the number of bits in the exponent determines the largest and smallest representablenumbers. For 32-bit oating point, the largest (smallest) numbers are 2±127 = 1.7× 1038 (5.9× 10−39). For64-bit oating point, the largest number is about 109863.
Solution to Exercise 5.3 (p. 159)25 = 110112 and 7 = 1112. We nd that 110012 + 1112 = 1000002 = 32.
Solution to Exercise 5.4 (p. 162)The only eect of pulse duration is to unequally weight the spectral repetitions. Because we are onlyconcerned with the repetition centered about the origin, the pulse duration has no signicant eect onrecovering a signal from its samples.
Solution to Exercise 5.5 (p. 162)
T = 4
T = 3.5
f
f
f = 1f = –1
Figure 5.34
The square wave's spectrum is shown by the bolder set of lines centered about the origin. The dashedlines correspond to the frequencies about which the spectral repetitions (due to sampling with Ts = 1)occur. As the square wave's period decreases, the negative frequency lines move to the left and the positivefrequency ones to the right.
Solution to Exercise 5.6 (p. 162)The simplest bandlimited signal is the sine wave. At the Nyquist frequency, exactly two samples/periodwould occur. Reducing the sampling rate would result in fewer samples/period, and these samples wouldappear to have arisen from a lower frequency sinusoid.
Solution to Exercise 5.7 (p. 164)The plotted temperatures were quantized to the nearest degree. Thus, the high temperature's amplitudewas quantized as a form of A/D conversion.

205
Solution to Exercise 5.8 (p. 164)The signal-to-noise ratio does not depend on the signal amplitude. With an A/D range of [−A,A], thequantization interval ∆ = 2A
2B and the signal's rms value (again assuming it is a sinusoid) is A√2.
Solution to Exercise 5.9 (p. 164)Solving 2−B = .001 results in B = 10 bits.
Solution to Exercise 5.10 (p. 164)A 16-bit A/D converter yields a SNR of 6× 16 + 10 log10 1.5 = 97.8 dB.
Solution to Exercise 5.11 (p. 167)
S(ej2π(f+1)
)=
∑∞n=−∞
(s (n) e−(j2π(f+1)n)
)=
∑∞n=−∞
(e−(j2πn)s (n) e−(j2πfn)
)=
∑∞n=−∞
(s (n) e−(j2πfn)
)= S
(ej2πf
) (5.58)
Solution to Exercise 5.12 (p. 170)
α
N+n0−1∑n=n0
(αn)−N+n0−1∑
n=n0
(αn) = αN+n0 − αn0
which, after manipulation, yields the geometric sum formula.
Solution to Exercise 5.13 (p. 171)If the sampling frequency exceeds the Nyquist frequency, the spectrum of the samples equals the analogspectrum, but over the normalized analog frequency fT . Thus, the energy in the sampled signal equals theoriginal signal's energy multiplied by T .
Solution to Exercise 5.14 (p. 173)This situation amounts to aliasing in the time-domain.
Solution to Exercise 5.15 (p. 174)When the signal is real-valued, we may only need half the spectral values, but the complexity remainsunchanged. If the data are complex-valued, which demands retaining all frequency values, the complexity isagain the same. When only K frequencies are needed, the complexity is O (KN).
Solution to Exercise 5.16 (p. 175)If a DFT required 1ms to compute, and signal having ten times the duration would require 100ms tocompute. Using the FFT, a 1ms computing time would increase by a factor of about log2 10 = 3.3, a factorof 30 less than the DFT would have needed.
Solution to Exercise 5.17 (p. 177)The upper panel has not used the FFT algorithm to compute the length-4 DFTs while the lower one has.The ordering is determined by the algorithm.
Solution to Exercise 5.18 (p. 177)The transform can have any greater than or equal to the actual duration of the signal. We simply pad thesignal with zero-valued samples until a computationally advantageous signal length results. Recall that theFFT is an algorithm to compute the DFT (Section 5.7). Extending the length of the signal this way merelymeans we are sampling the frequency axis more nely than required. To use the Cooley-Tukey algorithm,the length of the resulting zero-padded signal can be 512, 1024, etc. samples long.
Solution to Exercise 5.19 (p. 178)Number of samples equals 1.2 × 11025 = 13230. The datarate is 11025 × 16 = 176.4 kbps. The storagerequired would be 26460 bytes.

206 CHAPTER 5. DIGITAL SIGNAL PROCESSING
Solution to Exercise 5.20 (p. 179)The oscillations are due to the boxcar window's Fourier transform, which equals the sinc function.
Solution to Exercise 5.21 (p. 180)These numbers are powers-of-two, and the FFT algorithm can be exploited with these lengths. To computea longer transform than the input signal's duration, we simply zero-pad the signal.
Solution to Exercise 5.22 (p. 180)In discrete-time signal processing, an amplier amounts to a multiplication, a very easy operation to perform.
Solution to Exercise 5.23 (p. 182)The indices can be negative, and this condition is not allowed in MATLAB. To x it, we must start thesignals later in the array.
Solution to Exercise 5.24 (p. 184)Such terms would require the system to know what future input or output values would be before thecurrent value was computed. Thus, such terms can cause diculties.
Solution to Exercise 5.25 (p. 186)It now acts like a bandpass lter with a center frequency of f0 and a bandwidth equal to twice of the originallowpass lter.
Solution to Exercise 5.26 (p. 186)The DTFT of the unit sample equals a constant (equaling 1). Thus, the Fourier transform of the outputequals the transfer function.
Solution to Exercise 5.27 (p. 186)In sampling a discrete-time signal's Fourier transform L times equally over [0, 2π) to form the DFT, thecorresponding signal equals the periodic repetition of the original signal.(
S (k) ↔∞∑
i=−∞(s (n− iL))
)(5.59)
To avoid aliasing (in the time domain), the transform length must equal or exceed the signal's duration.
Solution to Exercise 5.28 (p. 187)The dierence equation for an FIR lter has the form
y (n) =q∑
m=0
(bmx (n−m)) (5.60)
The unit-sample response equals
h (n) =q∑
m=0
(bmδ (n−m)) (5.61)
which corresponds to the representation described in a problem (Example 5.6) of a length-q boxcar lter.
Solution to Exercise 5.29 (p. 187)The unit-sample response's duration is q + 1 and the signal's Nx. Thus the statement is correct.
Solution to Exercise 5.30 (p. 190)Let N denote the input's total duration. The time-domain implementation requires a total of N (2q + 1)computations, or 2q + 1 computations per input value. In the frequency domain, we split the input intoNNx
sections, each of which requires(1 + q
Nx
)log2 (Nx + q) + 7 q
Nx+ 6 per input in the section. Because we
divide again by Nx to nd the number of computations per input value in the entire input, this quantitydecreases as Nx increases. For the time-domain implementation, it stays constant.

207
Solution to Exercise 5.31 (p. 192)The delay is not computational delay herethe plot shows the rst output value is aligned with the lter's rstinputalthough in real systems this is an important consideration. Rather, the delay is due to the lter's phase
shift: A phase-shifted sinusoid is equivalent to a time-delayed one: cos (2πfn− φ) = cos(2πf
(n− φ
2πf
)).
All lters have phase shifts. This delay could be removed if the lter introduced no phase shift. Such ltersdo not exist in analog form, but digital ones can be programmed, but not in real time. Doing so wouldrequire the output to emerge before the input arrives!
Solution to Exercise 5.32 (p. 193)We have p + q + 1 multiplications and p + q− 1 additions. Thus, the total number of arithmetic operationsequals 2 (p + q).

208 CHAPTER 5. DIGITAL SIGNAL PROCESSING

Chapter 6
Information Communication
6.1 Information Communication1
As far as a communications engineer is concerned, signals express information. Because systems manipulatesignals, they also aect the information content. Information comes neatly packaged in both analog anddigital forms. Speech, for example, is clearly an analog signal, and computer les consist of a sequence ofbytes, a form of "discrete-time" signal despite the fact that the index sequences byte position, not timesample. Communication systems endeavor not to manipulate information, but to transmit it from oneplace to another, so-called point-to-point communication, from one place to many others, broadcastcommunication, or from many to many, like a telephone conference call or a chat room. Communicationsystems can be fundamentally analog, like radio, or digital, like computer networks.
This chapter develops a common theory that underlies how such systems work. We describe and analyzeseveral such systems, some old like AM radio, some new like computer networks. The question as to whichis better, analog or digital communication, has been answered, because of Claude Shannon's2 fundamentalwork on a theory of information published in 1948, the development of cheap, high-performance computers,and the creation of high-bandwidth communication systems. The answer is to use a digital communicationstrategy. In most cases, you should convert all information-bearing signals into discrete-time, amplitude-quantized signals. Fundamentally digital signals, like computer les (which are a special case of symbolicsignals), are in the proper form. Because of the Sampling Theorem, we know how to convert analog signalsinto digital ones. Shannon showed that once in this form, a properly engineered system can communicatedigital information with no error despite the fact that the communication channel thrusts noise onto alltransmissions. This startling result has no counterpart in analog systems; AM radio will remain noisy.The convergence of these theoretical and engineering results on communications systems has had importantconsequences in other arenas. The audio compact disc (CD) and the digital videodisk (DVD) are nowconsidered digital communications systems, with communication design considerations used throughout.
Go back to the fundamental model of communication (Figure 1.4: Fundamental model of communication).Communications design begins with two fundamental considerations.
1. What is the nature of the information source, and to what extent can the receiver tolerate errors inthe received information?
2. What are the channel's characteristics and how do they aect the transmitted signal?
In short, what are we going to send and how are we going to send it? Interestingly, digital as well asanalog transmission are accomplished using analog signals, like voltages in Ethernet (an example of wirelinecommunications) and electromagnetic radiation (wireless) in cellular telephone.
1This content is available online at <http://cnx.org/content/m0513/2.8/>.2http://www.lucent.com/minds/infotheory/
209

210 CHAPTER 6. INFORMATION COMMUNICATION
6.2 Types of Communication Channels3
Electrical communications channels are either wireline or wireless channels. Wireline channels physicallyconnect transmitter to receiver with a "wire" which could be a twisted pair, coaxial cable or optic ber.Consequently, wireline channels are more private and much less prone to interference. Simple wirelinechannels connect a single transmitter to a single receiver: a point-to-point connection as with the telephone.Listening in on a conversation requires that the wire be tapped and the voltage measured. Some wirelinechannels operate in broadcast modes: one or more transmitter is connected to several receivers. One simpleexample of this situation is cable television. Computer networks can be found that operate in point-to-pointor in broadcast modes. Wireless channels are much more public, with a transmitter's antenna radiatinga signal that can be received by any antenna suciently close enough. In contrast to wireline channelswhere the receiver takes in only the transmitter's signal, the receiver's antenna will react to electromagneticradiation coming from any source. This feature has two faces: The smiley face says that a receiver can takein transmissions from any source, letting receiver electronics select wanted signals and disregarding others,thereby allowing portable transmission and reception, while the frowny face says that interference and noiseare much more prevalent than in wireline situations. A noisier channel subject to interference compromisesthe exibility of wireless communication.
Point of Interest: You will hear the term tetherless networking applied to completelywireless computer networks.
Maxwell's equations neatly summarize the physics of all electromagnetic phenomena, including cir-cuits, radio, and optic ber transmission.
∇×E = −(
∂
∂t(µH)
)div (εE) = ρ
∇×H = σE +∂
∂t(εE)
div (µH) = 0
(6.1)
where E is the electric eld, H the magnetic eld, ε dielectric permittivity, µ magnetic permeability, σelectrical conductivity, and ρ is the charge density. Kircho's Laws represent special cases of these equationsfor circuits. We are not going to solve Maxwell's equations here; do bear in mind that a fundamentalunderstanding of communications channels ultimately depends on uency with Maxwell's equations. Perhapsthe most important aspect of them is that they are linear with respect to the electrical and magnetic elds.Thus, the elds (and therefore the voltages and currents) resulting from two or more sources will add.
Point of Interest: Nonlinear electromagnetic media do exist. The equations as written hereare simpler versions that apply to free-space propagation and conduction in metals. Nonlinearmedia are becoming increasingly important in optic ber communications, which are also governedby Maxwell's equations.
6.3 Wireline Channels4
Wireline channels were the rst used for electrical communications in the mid-nineteenth century for thetelegraph. Here, the channel is one of several wires connecting transmitter to receiver. The transmittersimply creates a voltage related to the message signal and applies it to the wire(s). We must have a circuita closed paththat supports current ow. In the case of single-wire communications, the earth is used as the
3This content is available online at <http://cnx.org/content/m0099/2.13/>.4This content is available online at <http://cnx.org/content/m0100/2.27/>.

211
current's return path. In fact, the term ground for the reference node in circuits originated in single-wiretelegraphs. You can imagine that the earth's electrical characteristics are highly variable, and they are.Single-wire metallic channels cannot support high-quality signal transmission having a bandwidth beyond afew hundred Hertz over any appreciable distance.
Coaxial Cable Cross-section
centralconductor
dielectric
outerconductor
insulation
ri
rdσ
σd,εd,µd
σ
Figure 6.1: Coaxial cable consists of one conductor wrapped around the central conductor. Thistype of cable supports broader bandwidth signals than twisted pair, and nds use in cable television andEthernet.
Consequently, most wireline channels today essentially consist of pairs of conducting wires Figure 6.1(Coaxial Cable Cross-section), and the transmitter applies a message-related voltage across the pair. Howthese pairs of wires are physically congured greatly aects their transmission characteristics. One exampleis twisted pair, wherein the wires are wrapped about each other. Telephone cables are one example of atwisted pair channel. Another is coaxial cable, where a concentric conductor surrounds a central wire witha dielectric material in between. Coaxial cable, fondly called "co-ax" by engineers, is what Ethernet uses asits channel. In either case, wireline channels form a dedicated circuit between transmitter and receiver. Aswe shall nd subsequently, several transmissions can share the circuit by amplitude modulation techniques;commercial cable TV is an example. These information-carrying circuits are designed so that interferencefrom nearby electromagnetic sources is minimized. Thus, by the time signals arrive at the receiver, they arerelatively interference- and noise-free.
Both twisted pair and co-ax are examples of transmission lines, which all have the circuit model shownin Figure 6.2 (Circuit Model for a Transmission Line) for an innitesimally small length. This circuit modelarises from solving Maxwell's equations for the particular transmission line geometry.
Circuit Model for a Transmission Line
R∆x L∆xG∆x C∆x
+
–
V(x)
I(x)
+
–
V(x+∆x)
I(x+∆x)
+
–
V(x–∆x)
I(x–∆x)
……R∆x L∆x
G∆x C∆x
Figure 6.2: The so-called distributed parameter model for two-wire cables has the depicted circuitmodel structure. Element values depend on geometry and the properties of materials used to constructthe transmission line.

212 CHAPTER 6. INFORMATION COMMUNICATION
The series resistance comes from the conductor used in the wires and from the conductor's geometry. Theinductance and the capacitance derive from transmission line geometry, and the parallel conductance fromthe medium between the wire pair. Note that all the circuit elements have values expressed by the productof a constant times a length; this notation represents that element values here have per-unit-length units.
For example, the series resistance∼R has units of ohms/meter. For coaxial cable, the element values depend
on the inner conductor's radius ri, the outer radius of the dielectric rd, the conductivity of the conductorsσ, and the conductivity σd, dielectric constant εd, and magnetic permittivity µd of the dielectric as
∼R=
12πδσ
(1rd
+1ri
)(6.2)
∼C=
2πεd
ln(
rd
ri
)∼G=
2πσd
ln(
rd
ri
)∼L=
µd
2πln(
rd
ri
)For twisted pair, having a separation d between the conductors that have conductivity σ and common radiusr and that are immersed in a medium having dielectric and magnetic properties, the element values are then
∼R=
1πrδσ
(6.3)
∼C=
πε
arccosh(
d2r
)∼G=
πσ
arccosh(
d2r
)∼L=
µ
π
(δ
2r+ arccosh
(d
2r
))The voltage between the two conductors and the current owing through them will depend on distance x
along the transmission line as well as time. We express this dependence as v (x, t) and i (x, t). When we placea sinusoidal source at one end of the transmission line, these voltages and currents will also be sinusoidalbecause the transmission line model consists of linear circuit elements. As is customary in analyzing linearcircuits, we express voltages and currents as the real part of complex exponential signals, and write circuitvariables as a complex amplitudehere dependent on distancetimes a complex exponential: v (x, t) =Re(V (x) ej2πft
)and i (x, t) = Re
(I (x) ej2πft
). Using the transmission line circuit model, we nd from
KCL, KVL, and v-i relations the equations governing the complex amplitudes.
KCL at Center NodeI (x) = I (x−∆x)− V (x)
(∼G +j2πf
∼C)
∆x (6.4)
V-I relation for RL series
V (x)− V (x + ∆x) = I (x)(∼R +j2πf
∼L)
∆x (6.5)
Rearranging and taking the limit ∆x → 0 yields the so-called transmission line equations.
d
dxI (x) =
(−(∼G +j2πf
∼C))
V (x) (6.6)

213
d
dxV (x) =
(−(∼R +j2πf
∼L))
I (x)
By combining these equations, we can obtain a single equation that governs how the voltage's or thecurrent's complex amplitude changes with position along the transmission line. Taking the derivative of thesecond equation and plugging the rst equation into the result yields the equation governing the voltage.
d2
dx2V (x) =
(∼G +j2πf
∼C)(∼
R +j2πf∼L)
V (x) (6.7)
This equation's solution isV (x) = V+e−(γx) + V−eγx (6.8)
Calculating its second derivative and comparing the result with our equation for the voltage can check thissolution.
d2
dx2 V (x) = γ2(V+e−(γx) + V−eγx
)= γ2V (x)
(6.9)
Our solution works so long as the quantity γ satises
γ = ±√(∼
G +j2πf∼C)(∼
R +j2πf∼L)
= ± (a (f) + jb (f))(6.10)
Thus, γ depends on frequency, and we express it in terms of real and imaginary parts as indicated. Thequantities V+ and V− are constants determined by the source and physical considerations. For example, letthe spatial origin be the middle of the transmission line model Figure 6.2 (Circuit Model for a TransmissionLine). Because the circuit model contains simple circuit elements, physically possible solutions for voltageamplitude cannot increase with distance along the transmission line. Expressing γ in terms of its realand imaginary parts in our solution shows that such increases are a (mathematical) possibility. V (x) =V+e(−(a+jb))x + V−e(a+jb)x The voltage cannot increase without limit; because a (f) is always positive, wemust segregate the solution for negative and positive x. The rst term will increase exponentially for x < 0unless V+ = 0 in this region; a similar result applies to V− for x > 0. These physical constraints give us acleaner solution.
V (x) =
V+e(−(a+jb))x if x > 0
V−e(a+jb)x if x < 0(6.11)
This solution suggests that voltages (and currents too) will decrease exponentially along a transmission line.The space constant, also known as the attenuation constant, is the distance over which the voltagedecreases by a factor of 1
e . It equals the reciprocal of a (f), which depends on frequency, and is expressed bymanufacturers in units of dB/m.
The presence of the imaginary part of γ, b (f), also provides insight into how transmission lines work.Because the solution for x > 0 is proportional to e−(jbx), we know that the voltage's complex amplitude willvary sinusoidally in space. The complete solution for the voltage has the form
v (x, t) = Re(V+e−(ax)ej(2πft−bx)
)(6.12)
The complex exponential portion has the form of a propagating wave. If we could take a snapshot of thevoltage (take its picture at t = t1), we would see a sinusoidally varying waveform along the transmissionline. One period of this variation, known as the wavelength, equals λ = 2π
b . If we were to take a secondpicture at some later time t = t2, we would also see a sinusoidal voltage. Because
2πft2 − bx = 2πf (t1 + t2 − t1)− bx = 2πft1 − b
(x− 2πf
b(t2 − t1)
)

214 CHAPTER 6. INFORMATION COMMUNICATION
the second waveform appears to be the rst one, but delayedshifted to the rightin space. Thus, the volt-age appeared to move to the right with a speed equal to 2πf
b (assuming b > 0). We denote this propagationspeed by c, and it equals
c =
∣∣∣∣∣∣∣∣2πf
Im(√(∼
G +j2πf∼C)(∼
R +j2πf∼L))∣∣∣∣∣∣∣∣ (6.13)
In the high-frequency region where(j2πf
∼L
∼R)and
(j2πf
∼C
∼G), the quantity under the radical simplies
to −4π2f2∼L∼C, and we nd the propagation speed to be
limf→∞
c =1√∼L∼C
(6.14)
For typical coaxial cable, this propagation speed is a fraction (one-third to two-thirds) of the speed of light.
Exercise 6.1 (Solution on p. 272.)
Find the propagation speed in terms of physical parameters for both the coaxial cable and twistedpair examples.
By using the second of the transmission line equation (6.6), we can solve for the current's complex amplitude.Considering the spatial region x > 0, for example, we nd that
d
dxV (x) = − (γV (x)) =
(−(∼R +j2πf
∼L))
I (x)
which means that the ratio of voltage and current complex amplitudes does not depend on distance.
V (x)I (x)
=
√√√√ ∼R +j2πf
∼L
∼G +j2πf
∼C
= Z0
(6.15)
The quantity Z0 is known as the transmission line's characteristic impedance. Note that when the signalfrequency is suciently high, the characteristic impedance is real, which means the transmission line appearsresistive in this high-frequency regime.
limf→∞
Z0 =
√√√√ ∼L∼C
(6.16)
Typical values for characteristic impedance are 50 and 75 Ω.A related transmission line is the optic ber. Here, the electromagnetic eld is light, and it propagates
down a cylinder of glass. In this situation, we don't have two conductorsin fact we have noneand theenergy is propagating in what corresponds to the dielectric material of the coaxial cable. Optic ber com-munication has exactly the same properties as other transmission lines: Signal strength decays exponentiallyaccording to the ber's space constant and propagates at some speed less than light would in free space.From the encompassing view of Maxwell's equations, the only dierence is the electromagnetic signal's fre-quency. Because no electric conductors are present and the ber is protected by an opaque insulator, opticber transmission is interference-free.
Exercise 6.2 (Solution on p. 272.)
From tables of physical constants, nd the frequency of a sinusoid in the middle of the visible lightrange. Compare this frequency with that of a mid-frequency cable television signal.
To summarize, we use transmission lines for high-frequency wireline signal communication. In wirelinecommunication, we have a direct, physical connectiona circuitbetween transmitter and receiver. When

215
we select the transmission line characteristics and the transmission frequency so that we operate in the high-frequency regime, signals are not ltered as they propagate along the transmission line: The characteristicimpedance is real-valuedthe tranmission line's equivalent impedance is a resistorand all the signal'scomponents at various frequencies propagate at the same speed. Transmitted signal amplitude does decayexponentially along the transmission line. Note that in the high-frequency regime that the space constant isapproximately zero, which means the attenuation is quite small.
Exercise 6.3 (Solution on p. 272.)
What is the limiting value of the space constant in the high frequency regime?
6.4 Wireless Channels5
Wireless channels exploit the prediction made by Maxwell's equation that electromagnetic elds propagatein free space like light. When a voltage is applied to an antenna, it creates an electromagnetic eld thatpropagates in all directions (although antenna geometry aects how much power ows in any given direction)that induces electric currents in the receiver's antenna. Antenna geometry determines how energetic a elda voltage of a given frequency creates. In general terms, the dominant factor is the relation of the antenna'ssize to the eld's wavelength. The fundamental equation relating frequency and wavelength for a propagatingwave is
λf = c
Thus, wavelength and frequency are inversely related: High frequency corresponds to small wavelengths.For example, a 1 MHz electromagnetic eld has a wavelength of 300 m. Antennas having a size or distancefrom the ground comparable to the wavelength radiate elds most eciently. Consequently, the lower thefrequency the bigger the antenna must be. Because most information signals are baseband signals, havingspectral energy at low frequencies, they must be modulated to higher frequencies to be transmitted overwireless channels.
For most antenna-based wireless systems, how the signal diminishes as the receiver moves further fromthe transmitter derives by considering how radiated power changes with distance from the transmittingantenna. An antenna radiates a given amount of power into free space, and ideally this power propagateswithout loss in all directions. Considering a sphere centered at the transmitter, the total power, which isfound by integrating the radiated power over the surface of the sphere, must be constant regardless of thesphere's radius. This requirement results from the conservation of energy. Thus, if p (d) represents the powerintegrated with respect to direction at a distance d from the antenna, the total power will be p (d) 4πd2. Forthis quantity to be a constant, we must have (
p (d) ∝ 1d2
)which means that the received signal amplitude AR must be proportional to the transmitter's amplitude AT
and inversely related to distance from the transmitter.
AR =kAT
d(6.17)
for some value of the constant k. Thus, the further from the transmitter the receiver is located, the weakerthe received signal. Whereas the attenuation found in wireline channels can be controlled by physicalparameters and choice of transmission frequency, the inverse-distance attenuation found in wireless channelspersists across all frequencies.
5This content is available online at <http://cnx.org/content/m0101/2.14/>.

216 CHAPTER 6. INFORMATION COMMUNICATION
Exercise 6.4 (Solution on p. 272.)
Why don't signals attenuate according to the inverse-square law in a conductor? What is thedierence between the wireline and wireless cases?
The speed of propagation is governed by the dielectric constant µ0 and magnetic permeability ε0 of freespace.
c =1
√µ0ε0
= 3× 10⁸m/s(6.18)
Known familiarly as the speed of light, it sets an upper limit on how fast signals can propagate from oneplace to another. Because signals travel at a nite speed, a receiver senses a transmitted signal only after atime delay directly related to the propagation speed:
∆t =d
c
At the speed of light, a signal travels across the United States in 16 ms, a reasonably small time delay. If alossless (zero space constant) coaxial cable connected the East and West coasts, this delay would be two tothree times longer because of the slower propagation speed.
6.5 Line-of-Sight Transmission6
Long-distance transmission over either kind of channel encounters attenuation problems. Losses in wirelinechannels are explored in the Circuit Models module (Section 6.3), where repeaters can extend the distancebetween transmitter and receiver beyond what passive losses the wireline channel imposes. In wirelesschannels, not only does radiation loss occur (p. 215), but also one antenna may not "see" another becauseof the earth's curvature.
hdLOS
earth
R
Figure 6.3: Two antennae are shown each having the same height. Line-of-sight transmission meansthe transmitting and receiving antennae can "see" each other as shown. The maximum distance at whichthey can see each other, dLOS , occurs when the sighting line just grazes the earth's surface.
At the usual radio frequencies, propagating electromagnetic energy does not follow the earth's surface.Line-of-sight communication has the transmitter and receiver antennas in visual contact with each other.
6This content is available online at <http://cnx.org/content/m0538/2.13/>.

217
Assuming both antennas have height h above the earth's surface, maximum line-of-sight distance is
dLOS = 2√
2hR + h2 ≈ 2√
2Rh (6.19)
where R is the earth's radius ( 6.38× 10⁶m).
Exercise 6.5 (Solution on p. 272.)
Derive the expression of line-of-sight distance using only the Pythagorean Theorem. Generalizeit to the case where the antennas have dierent heights (as is the case with commercial radioand cellular telephone). What is the range of cellular telephone where the handset antenna hasessentially zero height?
Exercise 6.6 (Solution on p. 273.)
Can you imagine a situation wherein global wireless communication is possible with only onetransmitting antenna? In particular, what happens to wavelength when carrier frequency decreases?
Using a 100 m antenna would provide line-of-sight transmission over a distance of 71.4 km. Using such verytall antennas would provide wireless communication within a town or between closely spaced populationcenters. Consequently, networks of antennas sprinkle the countryside (each located on the highest hillpossible) to provide long-distance wireless communications: Each antenna receives energy from one antennaand retransmits to another. This kind of network is known as a relay network.
6.6 The Ionosphere and Communications7
If we were limited to line-of-sight communications, long distance wireless communication, like ship-to-shorecommunication, would be impossible. At the turn of the century, Marconi, the inventor of wireless telegraphy,boldly tried such long distance communication without any evidence either empirical or theoretical that it was possible. When the experiment worked, but only at night, physicists scrambled to determinewhy (using Maxwell's equations, of course). It was Oliver Heaviside, a mathematical physicist with strongengineering interests, who hypothesized that an invisible electromagnetic "mirror" surrounded the earth.What he meant was that at optical frequencies (and others as it turned out), the mirror was transparent,but at the frequencies Marconi used, it reected electromagnetic radiation back to earth. He had predictedthe existence of the ionosphere, a plasma that encompasses the earth at altitudes hi between 80 and 180 kmthat reacts to solar radiation: It becomes transparent at Marconi's frequencies during the day, but becomesa mirror at night when solar radiation diminishes. The maximum distance along the earth's surface that can
be reached by a single ionospheric reection is 2R arccos(
RR+hi
), which ranges between 2,010 and 3,000 km
when we substitute minimum and maximum ionospheric altitudes. This distance does not span the UnitedStates or cross the Atlantic; for transatlantic communication, at least two reections would be required.
The communication delay encountered with a single reection in this channel is 2√
2Rhi+hi2
c , which rangesbetween 6.8 and 10 ms, again a small time interval.
6.7 Communication with Satellites8
Global wireless communication relies on satellites. Here, ground stations transmit to orbiting satellites thatamplify the signal and retransmit it back to earth. Satellites will move across the sky unless they are ingeosynchronous orbits, where the time for one revolution about the equator exactly matches the earth'srotation time of one day. TV satellites would require the homeowner to continually adjust his or her antennaif the satellite weren't in geosynchronous orbit. Newton's equations applied to orbiting bodies predict that
7This content is available online at <http://cnx.org/content/m0539/2.10/>.8This content is available online at <http://cnx.org/content/m0540/2.10/>.

218 CHAPTER 6. INFORMATION COMMUNICATION
the time T for one orbit is related to distance from the earth's center R as
R = 3
√GMT 2
4π2(6.20)
where G is the gravitational constant and M the earth's mass. Calculations yield R = 42200km, whichcorresponds to an altitude of 35700km. This altitude greatly exceeds that of the ionosphere, requiringsatellite transmitters to use frequencies that pass through it. Of great importance in satellite communicationsis the transmission delay. The time for electromagnetic elds to propagate to a geosynchronous satellite andreturn is 0.24 s, a signicant delay.
Exercise 6.7 (Solution on p. 273.)
In addition to delay, the propagation attenuation encountered in satellite communication far ex-ceeds what occurs in ionospheric-mirror based communication. Calculate the attenuation incurredby radiation going to the satellite (one-way loss) with that encountered by Marconi (total going upand down). Note that the attenuation calculation in the ionospheric case, assuming the ionosphereacts like a perfect mirror, is not a straightforward application of the propagation loss formula (p.215).
6.8 Noise and Interference9
We have mentioned that communications are, to varying degrees, subject to interference and noise. It's timeto be more precise about what these quantities are and how they dier.
Interference represents man-made signals. Telephone lines are subject to power-line interference (inthe United States a distorted 60 Hz sinusoid). Cellular telephone channels are subject to adjacent-cell phoneconversations using the same signal frequency. The problem with such interference is that it occupies thesame frequency band as the desired communication signal, and has a similar structure.
Exercise 6.8 (Solution on p. 273.)
Suppose interference occupied a dierent frequency band; how would the receiver remove it?
We use the notation i (t) to represent interference. Because interference has man-made structure, we canwrite an explicit expression for it that may contain some unknown aspects (how large it is, for example).
Noise signals have little structure and arise from both human and natural sources. Satellite channels aresubject to deep space noise arising from electromagnetic radiation pervasive in the galaxy. Thermal noiseplagues all electronic circuits that contain resistors. Thus, in receiving small amplitude signals, receiverampliers will most certainly add noise as they boost the signal's amplitude. All channels are subject tonoise, and we need a way of describing such signals despite the fact we can't write a formula for the noisesignal like we can for interference. The most widely used noise model is white noise. It is dened entirelyby its frequency-domain characteristics.
• White noise has constant power at all frequencies.• At each frequency, the phase of the noise spectrum is totally uncertain: It can be any value in between
0 and 2π, and its value at any frequency is unrelated to the phase at any other frequency.• When noise signals arising from two dierent sources add, the resultant noise signal has a power equal
to the sum of the component powers.
Because of the emphasis here on frequency-domain power, we are lead to dene the power spectrum.Because of Parseval's Theorem10, we dene the power spectrum Ps (f) of a non-noise signal s (t) to be themagnitude-squared of its Fourier transform.
Ps (f) ≡ (|S (f) |)2 (6.21)
9This content is available online at <http://cnx.org/content/m0515/2.17/>.10"Parseval's Theorem", (1) <http://cnx.org/content/m0047/latest/#parseval>

219
Integrating the power spectrum over any range of frequencies equals the power the signal contains in thatband. Because signals must have negative frequency components that mirror positive frequency ones, weroutinely calculate the power in a spectral band as the integral over positive frequencies multiplied by two.
Power in [f1, f2] = 2∫ f2
f1
Ps (f) df (6.22)
Using the notation n (t) to represent a noise signal's waveform, we dene noise in terms of its power spectrum.For white noise, the power spectrum equals the constant N0
2 . With this denition, the power in a frequencyband equals N0 (f2 − f1).
When we pass a signal through a linear, time-invariant system, the output's spectrum equals the product(p. 131) of the system's frequency response and the input's spectrum. Thus, the power spectrum of thesystem's output is given by
Py (f) = (|H (f) |)2Px (f) (6.23)
This result applies to noise signals as well. When we pass white noise through a lter, the output is also anoise signal but with power spectrum (|H (f) |)2 N0
2 .
6.9 Channel Models11
Both wireline and wireless channels share characteristics, allowing us to use a common model for how thechannel aects transmitted signals.
• The transmitted signal is usually not ltered by the channel.• The signal can be attenuated.• The signal propagates through the channel at a speed equal to or less than the speed of light, which
means that the channel delays the transmission.• The channel may introduce additive interference and/or noise.
Letting α represent the attenuation introduced by the channel, the receiver's input signal is related to thetransmitted one by
r (t) = αx (t− τ) + i (t) + n (t) (6.24)
This expression corresponds to the system model for the channel shown in Figure 6.4. In this book, we shallassume that the noise is white.
Channelx(t) r(t) x(t)
+Attenuationα +
Interferencei(t)
Noisen(t)
r(t)Delayτ
Figure 6.4: The channel component of the fundamental model of communication (Figure 1.4: Fun-damental model of communication) has the depicted form. The attenuation is due to propagation loss.Adding the interference and noise is justied by the linearity property of Maxwell's equations.
11This content is available online at <http://cnx.org/content/m0516/2.10/>.

220 CHAPTER 6. INFORMATION COMMUNICATION
Exercise 6.9 (Solution on p. 273.)
Is this model for the channel linear?
As expected, the signal that emerges from the channel is corrupted, but does contain the transmitted signal.Communication system design begins with detailing the channel model, then developing the transmitter andreceiver that best compensate for the channel's corrupting behavior. We characterize the channel's quality bythe signal-to-interference ratio (SIR) and the signal-to-noise ratio (SNR). The ratios are computed accordingto the relative power of each within the transmitted signal's bandwidth. Assuming the signal x (t)'s spectrumspans the frequency interval [fl, fu], these ratios can be expressed in terms of power spectra.
SIR =2α2
∫∞0
Px (f) df
2∫ fu
flPi (f) df
(6.25)
SNR =2α2
∫∞0
Px (f) df
N0 (fu − fl)(6.26)
In most cases, the interference and noise powers do not vary for a given receiver. Variations in signal-to-interference and signal-to-noise ratios arise from the attenuation because of transmitter-to-receiver distancevariations.
6.10 Baseband Communication12
We use analog communication techniques for analog message signals, like music, speech, and television.Transmission and reception of analog signals using analog results in an inherently noisy received signal(assuming the channel adds noise, which it almost certainly does).
The simplest form of analog communication is baseband communication.
Point of Interest: We use analog communication techniques for analog message signals, likemusic, speech, and television. Transmission and reception of analog signals using analog resultsin an inherently noisy received signal (assuming the channel adds noise, which it almost certainlydoes).
Here, the transmitted signal equals the message times a transmitter gain.
x (t) = Gm (t) (6.27)
An example, which is somewhat out of date, is the wireline telephone system. You don't use basebandcommunication in wireless systems simply because low-frequency signals do not radiate well. The receiver ina baseband system can't do much more than lter the received signal to remove out-of-band noise (interferenceis small in wireline channels). Assuming the signal occupies a bandwidth of W Hz (the signal's spectrumextends from zero to W ), the receiver applies a lowpass lter having the same bandwidth, as shown inFigure 6.5.
Figure 6.5: The receiver for baseband communication systems is quite simple: a lowpass lter havingthe same bandwidth as the signal.
12This content is available online at <http://cnx.org/content/m0517/2.17/>.

221
We use the signal-to-noise ratio of the receiver's output m (t) to evaluate any analog-message commu-nication system. Assume that the channel introduces an attenuation α and white noise of spectral heightN02 . The lter does not aect the signal componentwe assume its gain is unitybut does lter thenoise, removing frequency components above W Hz. In the lter's output, the received signal power equalsα2G2power (m) and the noise power N0W , which gives a signal-to-noise ratio of
SNRbaseband =α2G2power (m)
N0W(6.28)
The signal power power (m) will be proportional to the bandwidth W ; thus, in baseband communicationthe signal-to-noise ratio varies only with transmitter gain and channel attenuation and noise level.
6.11 Modulated Communication13
Especially for wireless channels, like commercial radio and television, but also for wireline systems like cabletelevision, an analog message signal must bemodulated: The transmitted signal's spectrum occurs at muchhigher frequencies than those occupied by the signal.
Point of Interest: We use analog communication techniques for analog message signals, likemusic, speech, and television. Transmission and reception of analog signals using analog resultsin an inherently noisy received signal (assuming the channel adds noise, which it almost certainlydoes).
The key idea of modulation is to aect the amplitude, frequency or phase of what is known as the carriersinusoid. Frequency modulation (FM) and less frequently used phase modulation (PM) are not discussedhere; we focus on amplitude modulation (AM). The amplitude modulated message signal has the form
x (t) = Ac (1 + m (t)) cos (2πfct) (6.29)
where fc is the carrier frequency and Ac the carrier amplitude. Also, the signal's amplitude is assumedto be less than one: |m (t) | < 1. From our previous exposure to amplitude modulation (see the FourierTransform example (Example 4.5)), we know that the transmitted signal's spectrum occupies the frequencyrange [fc −W, fc + W ], assuming the signal's bandwidth is W Hz (see the gure (Figure 6.6)). The carrierfrequency is usually much larger than the signal's highest frequency: (fc W ), which means that thetransmitter antenna and carrier frequency are chosen jointly during the design process.
Figure 6.6: The AM coherent receiver along with the spectra of key signals is shown for the case of atriangular-shaped signal spectrum. The dashed line indicates the white noise level. Note that the lters'characteristics cuto frequency and center frequency for the bandpass lter must be match to themodulation and message parameters.
13This content is available online at <http://cnx.org/content/m0518/2.24/>.

222 CHAPTER 6. INFORMATION COMMUNICATION
Ignoring the attenuation and noise introduced by the channel for the moment, reception of an amplitudemodulated signal is quite easy (see Problem 4.17). The so-called coherent receiver multiplies the inputsignal by a sinusoid and lowpass-lters the result (Figure 6.6).
m (t) = LPF (x (t) cos (2πfct))
= LPF(Ac (1 + m (t)) cos2 (2πfct)
) (6.30)
Because of our trigonometric identities, we know that
cos2 (2πfct) =12
(1 + cos (2π2fct)) (6.31)
At this point, the message signal is multiplied by a constant and a sinusoid at twice the carrier frequency.Multiplication by the constant term returns the message signal to baseband (where we want it to be!) whilemultiplication by the double-frequency term yields a very high frequency signal. The lowpass lter removesthis high-frequency signal, leaving only the baseband signal. Thus, the received signal is
m (t) =Ac
2(1 + m (t)) (6.32)
Exercise 6.10 (Solution on p. 273.)
This derivation relies solely on the time domain; derive the same result in the frequency domain.You won't need the trigonometric identity with this approach.
Because it is so easy to remove the constant term by electrical meanswe insert a capacitor in series withthe receiver's outputwe typically ignore it and concentrate on the signal portion of the receiver's outputwhen calculating signal-to-noise ratio.
6.12 Signal-to-Noise Ratio of an Amplitude-Modulated Signal14
When we consider the much more realistic situation when we have a channel that introduces attenuationand noise, we can make use of the just-described receiver's linear nature to directly derive the receiver'soutput. The attenuation aects the output in the same way as the transmitted signal: It scales the outputsignal by the same amount. The white noise, on the other hand, should be ltered from the received signalbefore demodulation. We must thus insert a bandpass lter having bandwidth 2W and center frequency fc:This lter has no eect on the received signal-related component, but does remove out-of-band noise power.As shown in the triangular-shaped signal spectrum (Figure 6.6), we apply coherent receiver to this lteredsignal, with the result that the demodulated output contains noise that cannot be removed: It lies in thesame spectral band as the signal.
As we derive the signal-to-noise ratio in the demodulated signal, let's also calculate the signal-to-noiseratio of the bandpass lter's output r (t). The signal component of r (t) equals αAcm (t) cos (2πfct). Thissignal's Fourier transform equals
αAc
2(M (f + fc) + M (f − fc)) (6.33)
making the power spectrum,
α2Ac2
4
((|M (f + fc) |)2 + (|M (f − fc) |)2
)(6.34)
Exercise 6.11 (Solution on p. 273.)
If you calculate the magnitude-squared of the rst equation, you don't obtain the second unlessyou make an assumption. What is it?
14This content is available online at <http://cnx.org/content/m0541/2.16/>.

223
Thus, the total signal-related power in r (t) is α2Ac2
2 power (m). The noise power equals the integral of thenoise power spectrum; because the power spectrum is constant over the transmission band, this integralequals the noise amplitude N0 times the lter's bandwidth 2W . The so-called received signal-to-noise ratio the signal-to-noise ratio after the de rigeur front-end bandpass lter and before demodulation equals
SNRr =α2Ac
2power (m)4N0W
(6.35)
The demodulated signal m (t) = αAcm(t)2 + nout (t). Clearly, the signal power equals α2Ac
2power(m)4 .
To determine the noise power, we must understand how the coherent demodulator aects the bandpassnoise found in r (t). Because we are concerned with noise, we must deal with the power spectrum since wedon't have the Fourier transform available to us. Letting P (f) denote the power spectrum of r (t)'s noisecomponent, the power spectrum after multiplication by the carrier has the form
P (f + fc) + P (f − fc)4
(6.36)
The delay and advance in frequency indicated here results in two spectral noise bands falling in the low-frequency region of lowpass lter's passband. Thus, the total noise power in this lter's output equals(2 · N0
2 ·W · 2 · 14
)= N0W
2 . The signal-to-noise ratio of the receiver's output thus equals
SNRm = α2Ac2power(m)2N0W
= 2SNRr
(6.37)
Let's break down the components of this signal-to-noise ratio to better appreciate how the channel andthe transmitter parameters aect communications performance. Better performance, as measured by theSNR, occurs as it increases.
• More transmitter power increasing Ac increases the signal-to-noise ratio proportionally.• The carrier frequency fc has no eect on SNR, but we have assumed that (fc W ).• The signal bandwidth W enters the signal-to-noise expression in two places: implicitly through the
signal power and explicitly in the expression's denominator. If the signal spectrum had a constantamplitude as we increased the bandwidth, signal power would increase proportionally. On the otherhand, our transmitter enforced the criterion that signal amplitude was constant (Section 6.7). Signalamplitude essentially equals the integral of the magnitude of the signal's spectrum.
Note: This result isn't exact, but we do know that m (0) =∫∞−∞ M (f) df .
Enforcing the signal amplitude specication means that as the signal's bandwidth increases we must de-crease the spectral amplitude, with the result that the signal power remains constant. Thus, increasingsignal bandwidth does indeed decrease the signal-to-noise ratio of the receiver's output.
• Increasing channel attenuation moving the receiver farther from the transmitter decreases thesignal-to-noise ratio as the square. Thus, signal-to-noise ratio decreases as distance-squared betweentransmitter and receiver.
• Noise added by the channel adversely aects the signal-to-noise ratio.
In summary, amplitude modulation provides an eective means for sending a bandlimited signal from oneplace to another. For wireline channels, using baseband or amplitude modulation makes little dierence interms of signal-to-noise ratio. For wireless channels, amplitude modulation is the only alternative. The oneAM parameter that does not aect signal-to-noise ratio is the carrier frequency fc: We can choose any valuewe want so long as the transmitter and receiver use the same value. However, suppose someone else wants touse AM and chooses the same carrier frequency. The two resulting transmissions will add, and both receiverswill produce the sum of the two signals. What we clearly need to do is talk to the other party, and agree touse separate carrier frequencies. As more and more users wish to use radio, we need a forum for agreeing on

224 CHAPTER 6. INFORMATION COMMUNICATION
carrier frequencies and on signal bandwidth. On earth, this forum is the government. In the United States,the Federal Communications Commission (FCC) strictly controls the use of the electromagnetic spectrumfor communications. Separate frequency bands are allocated for commercial AM, FM, cellular telephone(the analog version of which is AM), short wave (also AM), and satellite communications.
Exercise 6.12 (Solution on p. 273.)
Suppose all users agree to use the same signal bandwidth. How closely can the carrier frequenciesbe while avoiding communications crosstalk? What is the signal bandwidth for commercial AM?How does this bandwidth compare to the speech bandwidth?
6.13 Digital Communication15
Eective, error-free transmission of a sequence of bitsa bit stream b (0) , b (1) , . . . is the goal here. Wefound that analog schemes, as represented by amplitude modulation, always yield a received signal containingnoise as well as the message signal when the channel adds noise. Digital communication schemes are verydierent. Once we decide how to represent bits by analog signals that can be transmitted over wireline(like a computer network) or wireless (like digital cellular telephone) channels, we will then develop a wayof tacking on communication bits to the message bits that will reduce channel-induced errors greatly. Intheory, digital communication errors can be zero, even though the channel adds noise!
We represent a bit by associating one of two specic analog signals with the bit's value. Thus, if b (n) = 0,we transmit the signal s0 (t); if b (n) = 1, send s1 (t). These two signals comprise the signal set for digitalcommunication and are designed with the channel and bit stream in mind. In virtually every case, thesesignals have a nite duration T common to both signals; this duration is known as the bit interval.Exactly what signals we use ultimately aects how well the bits can be received. Interestingly, basebandand modulated signal sets can yield the same performance. Other considerations determine how signal setchoice aects digital communication performance.
Exercise 6.13 (Solution on p. 273.)
What is the expression for the signal arising from a digital transmitter sending the bit stream b (n),n = . . . ,−1, 0, 1, . . . using the signal set s0 (t), s1 (t), each signal of which has duration T?
6.14 Binary Phase Shift Keying16
A commonly used example of a signal set consists of pulses that are negatives of each other (Figure 6.7).
s0 (t) = ApT (t)s1 (t) = − (ApT (t))
(6.38)
A
Tt
s0(t)
–A
t
s1(t)
T
Figure 6.7
15This content is available online at <http://cnx.org/content/m0519/2.10/>.16This content is available online at <http://cnx.org/content/m10280/2.13/>.

225
Here, we have a baseband signal set suitable for wireline transmission. The entire bit stream b (n) isrepresented by a sequence of these signals. Mathematically, the transmitted signal has the form
x (t) =∑
n
((−1)b(n)
ApT (t− nT ))
(6.39)
and graphically Figure 6.8 shows what a typical transmitted signal might be.
A
Tt
2T 3T 4T–A
x(t)
“0” “1” “1” “0”
(a)
A
T
t
2T 3T 4T
x(t)“0” “1” “1” “0”
(b)
Figure 6.8: The upper plot shows how a baseband signal set for transmitting the bit sequence 0110.The lower one shows an amplitude-modulated variant suitable for wireless channels.
This way of representing a bit streamchanging the bit changes the sign of the transmitted signalisknown as binary phase shift keying and abbreviated BPSK. The name comes from concisely expressingthis popular way of communicating digital information. The word "binary" is clear enough (one binary-valuedquantity is transmitted during a bit interval). Changing the sign of sinusoid amounts to changingshiftingthe phase by π (although we don't have a sinusoid yet). The word "keying" reects back to the rst electricalcommunication system, which happened to be digital as well: the telegraph.
The datarate R of a digital communication system is how frequently an information bit is transmitted.In this example it equals the reciprocal of the bit interval: R = 1
T . Thus, for a 1 Mbps (megabit per second)transmission, we must have T = 1µs.
The choice of signals to represent bit values is arbitrary to some degree. Clearly, we do not want tochoose signal set members to be the same; we couldn't distinguish bits if we did so. We could also havemade the negative-amplitude pulse represent a 0 and the positive one a 1. This choice is indeed arbitraryand will have no eect on performance assuming the receiver knows which signal represents which bit. Asin all communication systems, we design transmitter and receiver together.
A simple signal set for both wireless and wireline channels amounts to amplitude modulating a basebandsignal set (more appropriate for a wireline channel) by a carrier having a frequency harmonic with the bitinterval.
s0 (t) = ApT (t) sin(
2πkt
T
)s1 (t) = −
(ApT (t) sin
(2πkt
T
)) (6.40)

226 CHAPTER 6. INFORMATION COMMUNICATION
A
Tt
s0(t)
t
s1(t)
TA
Figure 6.9
Exercise 6.14 (Solution on p. 273.)
What is the value of k in this example?
This signal set is also known as a BPSK signal set. We'll show later that indeed both signal sets provideidentical performance levels when the signal-to-noise ratios are equal.
Exercise 6.15 (Solution on p. 273.)
Write a formula, in the style of the baseband signal set, for the transmitted signal as shown in theplot of the baseband signal set17 that emerges when we use this modulated signal.
What is the transmission bandwidth of these signal sets? We need only consider the baseband versionas the second is an amplitude-modulated version of the rst. The bandwidth is determined by the bitsequence. If the bit sequence is constantalways 0 or always 1the transmitted signal is a constant, whichhas zero bandwidth. The worst-casebandwidth consumingbit sequence is the alternating one shown inFigure 6.10. In this case, the transmitted signal is a square wave having a period of 2T .
A
Tt
2T 3T 4T–A
x(t)
“0” “1” “1”“0”
Figure 6.10: Here we show the transmitted waveform corresponding to an alternating bit sequence.
From our work in Fourier series, we know that this signal's spectrum contains odd-harmonics of thefundamental, which here equals 1
2T . Thus, strictly speaking, the signal's bandwidth is innite. In practicalterms, we use the 90%-power bandwidth to assess the eective range of frequencies consumed by the signal.The rst and third harmonics contain that fraction of the total power, meaning that the eective bandwidthof our baseband signal is 3
2T or, expressing this quantity in terms of the datarate, 3R2 . Thus, a digital
communications signal requires more bandwidth than the datarate: a 1 Mbps baseband system requires abandwidth of at least 1.5 MHz. Listen carefully when someone describes the transmission bandwidth ofdigital communication systems: Did they say "megabits" or "megahertz"?
Exercise 6.16 (Solution on p. 274.)
Show that indeed the rst and third harmonics contain 90% of the transmitted power. If the receiveruses a front-end lter of bandwidth 3
2T , what is the total harmonic distortion of the received signal?
Exercise 6.17 (Solution on p. 274.)
What is the 90% transmission bandwidth of the modulated signal set?
17"Signal Sets", Figure 2 <http://cnx.org/content/m0542/latest/#g1001>

227
6.15 Frequency Shift Keying18
In frequency-shift keying (FSK), the bit aects the frequency of a carrier sinusoid.
s0 (t) = ApT (t) sin (2πf0t)s1 (t) = ApT (t) sin (2πf1t)
(6.41)
A
Tt
s0(t)
t
s1(t)
T
A
Figure 6.11
The frequencies f0, f1 are usually harmonically related to the bit interval. In the depicted example,f0 = 3
T and f1 = 4T . As can be seen from the transmitted signal for our example bit stream (Figure 6.12),
the transitions at bit interval boundaries are smoother than those of BPSK.
T
A
t
“0” “1” “1” “0”x(t)
2T 3T 4T
Figure 6.12: This plot shows the FSK waveform for same bitstream used in the BPSK example(Figure 6.8).
To determine the bandwidth required by this signal set, we again consider the alternating bit stream.Think of it as two signals added together: The rst comprised of the signal s0 (t), the zero signal, s0 (t),zero, etc., and the second having the same structure but interleaved with the rst and containing s1 (t)(Figure 6.13).
Each component can be thought of as a xed-frequency sinusoid multiplied by a square wave of period2T that alternates between one and zero. This baseband square wave has the same Fourier spectrum asour BPSK example, but with the addition of the constant term c0. This quantity's presence changes thenumber of Fourier series terms required for the 90% bandwidth: Now we need only include the zero andrst harmonics to achieve it. The bandwidth thus equals, with f0 < f1, f1 + 1
2T −(f0 − 1
2T
)= f1 − f0 + 1
T .If the two frequencies are harmonics of the bit-interval duration, f0 = k0
T and f1 = k1T with k1 > k0, the
bandwidth equals k1+(−k0)+1T . If the dierence between harmonic numbers is 1, then the FSK bandwidth is
18This content is available online at <http://cnx.org/content/m0545/2.11/>.

228 CHAPTER 6. INFORMATION COMMUNICATION
T
A
t
“0” “1” “1”“0”x(t)
2T 3T 4T
A
t
“0” “0”
T
A
t
“1” “1”
2T 3T 4T
+=
Figure 6.13: The depicted decomposition of the FSK-modulated alternating bit stream into itsfrequency components simplies the calculation of its bandwidth.
smaller than the BPSK bandwidth. If the dierence is 2, the bandwidths are equal and larger dierencesproduce a transmission bandwidth larger than that resulting from using a BPSK signal set.
6.16 Digital Communication Receivers19
The receiver interested in the transmitted bit stream must perform two tasks when received waveform r (t)begins.
• It must determine when bit boundaries occur: The receiver needs to synchronize with the transmittedsignal. Because transmitter and receiver are designed in concert, both use the same value for the bitinterval T . Synchronization can occur because the transmitter begins sending with a reference bitsequence, known as the preamble. This reference bit sequence is usually the alternating sequenceas shown in the square wave example 20 and in the FSK example (Figure 6.13). The receiver knowswhat the preamble bit sequence is and uses it to determine when bit boundaries occur. This procedureamounts to what in digital hardware as self-clocking signaling: The receiver of a bit stream mustderive the clock when bit boundaries occur from its input signal. Because the receiver usuallydoes not determine which bit was sent until synchronization occurs, it does not know when during thepreamble it obtained synchronization. The transmitter signals the end of the preamble by switchingto a second bit sequence. The second preamble phase informs the receiver that data bits are about tocome and that the preamble is almost over.
• Once synchronized and data bits are transmitted, the receiver must then determine every T secondswhat bit was transmitted during the previous bit interval. We focus on this aspect of the digitalreceiver because this strategy is also used in synchronization.
The receiver for digital communication is known as a matched lter.
19This content is available online at <http://cnx.org/content/m0520/2.17/>.20"Transmission Bandwidth", Figure 1 <http://cnx.org/content/m0544/latest/#g1003>

229
Optimal receiver structure
s1(t-nT)
(⋅)nT
(n+1)T
∫
r(t)
s0(t-nT)
(⋅)nT
(n+1)T
∫ChooseLargest
Figure 6.14: The optimal receiver structure for digital communication faced with additive white noisechannels is the depicted matched lter.
This receiver, shown in Figure 6.14 (Optimal receiver structure), multiplies the received signal by each ofthe possible members of the transmitter signal set, integrates the product over the bit interval, and comparesthe results. Whichever path through the receiver yields the largest value corresponds to the receiver's decisionas to what bit was sent during the previous bit interval. For the next bit interval, the multiplication andintegration begins again, with the next bit decision made at the end of the bit interval. Mathematically, thereceived value of b (n), which we label b (n), is given by
b (n) = arg maxi
∫ (n+1)T
nT
r (t) si (t) dt (6.42)
You may not have seen the arg maxi
notation before. maxi · yields the maximum value of its argument
with respect to the index i. arg maxi
equals the value of the index that yields the maximum. Note that the
precise numerical value of the integrator's output does not matter; what does matter is its value relative tothe other integrator's output.
Let's assume a perfect channel for the moment: The received signal equals the transmitted one. If bit 0were sent using the baseband BPSK signal set, the integrator outputs would be∫ (n+1)T
nT
r (t) s0 (t) dt = A2T (6.43)
∫ (n+1)T
nT
r (t) s1 (t) dt = −(A2T
)If bit 1 were sent, ∫ (n+1)T
nT
r (t) s0 (t) dt = −(A2T
)(6.44)
∫ (n+1)T
nT
r (t) s1 (t) dt = A2T
Exercise 6.18 (Solution on p. 274.)
Can you develop a receiver for BPSK signal sets that requires only one multiplier-integratorcombination?
Exercise 6.19 (Solution on p. 274.)
What is the corresponding result when the amplitude-modulated BPSK signal set is used?
Clearly, this receiver would always choose the bit correctly. Channel attenuation would not aect thiscorrectness; it would only make the values smaller, but all that matters is which is largest.

230 CHAPTER 6. INFORMATION COMMUNICATION
6.17 Digital Communication in the Presence of Noise21
When we incorporate additive noise into our channel model, so that r (t) = αsi (t)+n (t), errors can creep in.If the transmitter sent bit 0 using a BPSK signal set (Section 6.14), the integrators' outputs in the matchedlter receiver (Figure 6.14: Optimal receiver structure) would be:∫ (n+1)T
nT
r (t) s0 (t) dt = αA2T +∫ (n+1)T
nT
n (t) s0 (t) dt (6.45)
∫ (n+1)T
nT
r (t) s1 (t) dt = (−α) A2T +∫ (n+1)T
nT
n (t) s1 (t) dt
It is the quantities containing the noise terms that cause errors in the receiver's decision-making process.Because they involve noise, the values of these integrals are random quantities drawn from some probabilitydistribution that vary erratically from bit interval to bit interval. Because the noise has zero average valueand has an equal amount of power in all frequency bands, the values of the integrals will hover about zero.What is important is how much they vary. If the noise is such that its integral term is more negative thanαA2T , then the receiver will make an error, deciding that the transmitted zero-valued bit was indeed a one.The probability that this situation occurs depends on three factors:
• Signal Set Choice The dierence between the signal-dependent terms in the integrators' outputs(equations (6.45)) denes how large the noise term must be for an incorrect receiver decision to result.What aects the probability of such errors occurring is the square of this dierence in comparison tothe noise term's variability. For our BPSK baseband signal set, the signal-related value is 4α2A4T 2.
• Variability of the Noise Term We quantify variability by the average value of its square, which isessentially the noise term's power. This calculation is best performed in the frequency domain andequals
power
(∫ (n+1)T
nT
n (t) s0 (t) dt
)=∫ ∞
−∞
N0
2(|S0 (f) |)2df
Because of Parseval's Theorem, we know that∫∞−∞ (|S0 (f) |)2df =
∫∞−∞ s0
2 (t) dt, which for the base-
band signal set equals A2T . Thus, the noise term's power is N0A2T2 .
• Probability Distribution of the Noise Term The value of the noise terms relative to the signal termsand the probability of their occurrence directly aect the likelihood that a receiver error will occur. Forthe white noise we have been considering, the underlying distributions are Gaussian. The probabilitythe receiver makes an error on any bit transmission equals:
pe = Q
(12
√square of signal dierence
noise term power
)(6.46)
pe = Q
√2α2A2T
N0
Here Q (·) is the integral Q (x) = 1√
2π
∫∞x
e−
“α22
”dα. This integral has no closed form expression, but
it can be accurately computed. As Figure 6.15 illustrates, Q (·) is a decreasing, very nonlinear function.21This content is available online at <http://cnx.org/content/m0546/2.12/>.

231
0 1 2 3 4 5 610
10
10
10-2
100
-4
-6
-8
Q(x)
Figure 6.15: The function Q (x) is plotted in semilogarithmic coordinates. Note that it decreases veryrapidly for small increases in its arguments. For example, when x increases from 4 to 5, Q (x) decreasesby a factor of 100.
The term A2T equals the energy expended by the transmitter in sending the bit; we label this term Eb. Wearrive at a concise expression for the probability the matched lter receiver makes a bit-reception error.
pe = Q
√2α2Eb
N0
(6.47)
Figure 6.16 shows how the receiver's error rate varies with the signal-to-noise ratio α2Eb
N0.
Exercise 6.20 (Solution on p. 274.)
Derive the probability of error expression for the modulated BPSK signal set, and show that itsperformance identically equals that of the baseband BPSK signal set.
6.18 Digital Communication System Properties22
Results from the Receiver Error module (Section 6.17) reveals several properties about digital communicationsystems.
• As the received signal becomes increasingly noisy, whether due to increased distance from the transmit-ter (smaller α) or to increased noise in the channel (larger N0), the probability the receiver makes anerror approaches 1/2. In such situations, the receiver performs only slightly better than the "receiver"that ignores what was transmitted and merely guesses what bit was transmitted. Consequently, itbecomes almost impossible to communicate information when digital channels become noisy.
22This content is available online at <http://cnx.org/content/m10282/2.9/>.

232 CHAPTER 6. INFORMATION COMMUNICATION
10-8
10-6
10-4
10-2
100
Signal-to-Noise Ratio (dB)
Pro
babi
lity
of B
it E
rror
-5 0 5 10
BPSK
FSK
Figure 6.16: The probability that the matched-lter receiver makes an error on any bit transmissionis plotted against the signal-to-noise ratio of the received signal. The upper curve shows the performanceof the FSK signal set, the lower (and therefore better) one the BPSK signal set.
• As the signal-to-noise ratio increases, performance gainssmaller probability of error pe can be easilyobtained. At a signal-to-noise ratio of 12 dB, the probability the receiver makes an error equals 10−8.In words, one out of one hundred million bits will, on the average, be in error.
• Once the signal-to-noise ratio exceeds about 5 dB, the error probability decreases dramatically. Adding1 dB improvement in signal-to-noise ratio can result in a factor of 10 smaller pe.
• Signal set choice can make a signicant dierence in performance. All BPSK signal sets, baseband ormodulated, yield the same performance for the same bit energy. The BPSK signal set does performmuch better than the FSK signal set once the signal-to-noise ratio exceeds about 5 dB.
Exercise 6.21 (Solution on p. 274.)
Derive the expression for the probability of error that would result if the FSK signal set were used.
The matched-lter receiver provides impressive performance once adequate signal-to-noise ratios occur. Youmight wonder whether another receiver might be better. The answer is that the matched-lter receiver isoptimal: No other receiver can provide a smaller probability of error than the matched lter regardless ofthe SNR. Furthermore, no signal set can provide better performance than the BPSK signal set, where thesignal representing a bit is the negative of the signal representing the other bit. The reason for this resultrests in the dependence of probability of error pe on the dierence between the noise-free integrator outputs:For a given Eb, no other signal set provides a greater dierence.
How small should the error probability be? Out of N transmitted bits, on the average Npe bits will bereceived in error. Do note the phrase "on the average" here: Errors occur randomly because of the noiseintroduced by the channel, and we can only predict the probability of occurrence. Since bits are transmittedat a rate R, errors occur at an average frequency of Rpe. Suppose the error probability is an impressivelysmall number like 10−6. Data on a computer network like Ethernet is transmitted at a rate R = 100Mbps,which means that errors would occur roughly 100 per second. This error rate is very high, requiring a muchsmaller pe to achieve a more acceptable average occurrence rate for errors occurring. Because Ethernet is awireline channel, which means the channel noise is small and the attenuation low, obtaining very small errorprobabilities is not dicult. We do have some tricks up our sleeves, however, that can essentially reduce the

233
error rate to zero without resorting to expending a large amount of energy at the transmitter. We need tounderstand digital channels (Section 6.19) and Shannon's Noisy Channel Coding Theorem (Section 6.30).
6.19 Digital Channels23
Let's review how digital communication systems work within the Fundamental Model of Communication(Figure 1.4: Fundamental model of communication). As shown in Figure 6.17 (DigMC), the message is asingle bit. The entire analog transmission/reception system, which is discussed in Digital Communication(Section 6.13), Signal Sets24, BPSK Signal Set25, Transmission Bandwidth26, Frequency Shift Keying (Sec-tion 6.15), Digital Communication Receivers (Section 6.16), Factors in Receiver Error (Section 6.17), DigitalCommunication System Properties27, and Error Probability28, can be lumped into a single system known asthe digital channel.
DigMC
0
1
pe1–pe 0
1
b(n)
SinkSourceDecoder
s(m)b(n)
Source SourceCoder
Digital Channel
s(m)
pe1–pe
Transmitterb(n)r(t)b(n) x(t)
ReceiverSource SourceCoder
s(m)Source
DecoderChannel Sink
s(m)
Figure 6.17: The steps in transmitting digital information are shown in the upper system, theFundamental Model of Communication. The symbolic-valued signal s (m) forms the message, and it isencoded into a bit sequence b (n). The indices dier because more than one bit/symbol is usually requiredto represent the message by a bitstream. Each bit is represented by an analog signal, transmitted throughthe (unfriendly) channel, and received by a matched-lter receiver. From the received bitstream b (n) thereceived symbolic-valued signal s (m) is derived. The lower block diagram shows an equivalent systemwherein the analog portions are combined and modeled by a transition diagram, which shows how eachtransmitted bit could be received. For example, transmitting a 0 results in the reception of a 1 withprobability pe (an error) or a 0 with probability 1− pe (no error).
Digital channels are described by transition diagrams, which indicate the output alphabet symbolsthat result for each possible transmitted symbol and the probabilities of the various reception possibilities.The probabilities on transitions coming from the same symbol must sum to one. For the matched-lterreceiver and the signal sets we have seen, the depicted transition diagram, known as a binary symmetricchannel, captures how transmitted bits are received. The probability of error pe is the sole parameter ofthe digital channel, and it encapsulates signal set choice, channel properties, and the matched-lter receiver.With this simple but entirely accurate model, we can concentrate on how bits are received.
23This content is available online at <http://cnx.org/content/m0102/2.13/>.24"Signal Sets" <http://cnx.org/content/m0542/latest/>25"BPSK signal set" <http://cnx.org/content/m0543/latest/>26"Transmission Bandwidth" <http://cnx.org/content/m0544/latest/>27"Digital Communcation System Properties" <http://cnx.org/content/m0547/latest/>28"Error Probability" <http://cnx.org/content/m0548/latest/>

234 CHAPTER 6. INFORMATION COMMUNICATION
6.20 Entropy29
Communication theory has been formulated best for symbolic-valued signals. Claude Shannon30 published in1948 The Mathematical Theory of Communication, which became the cornerstone of digital communication.He showed the power of probabilistic models for symbolic-valued signals, which allowed him to quantifythe information present in a signal. In the simplest signal model, each symbol can occur at index n with aprobability Pr [ak], k = 0, . . . ,K − 1. What this model says is that for each signal value a K-sided coinis ipped (note that the coin need not be fair). For this model to make sense, the probabilities must benumbers between zero and one and must sum to one.
0 ≤ Pr [ak] ≤ 1 (6.48)
K∑k=1
(Pr [ak]) = 1 (6.49)
This coin-ipping model assumes that symbols occur without regard to what preceding or succeeding symbolswere, a false assumption for typed text. Despite this probabilistic model's over-simplicity, the ideas wedevelop here also work when more accurate, but still probabilistic, models are used. The key quantity thatcharacterizes a symbolic-valued signal is the entropy of its alphabet.
H (A) = −
(∑k
(Pr [ak] log2 (Pr [ak]))
)(6.50)
Because we use the base-2 logarithm, entropy has units of bits. For this denition to make sense, we musttake special note of symbols having probability zero of occurring. A zero-probability symbol never occurs;thus, we dene 0 log2 0 = 0 so that such symbols do not aect the entropy. The maximum value attainableby an alphabet's entropy occurs when the symbols are equally likely (Pr [ak] = Pr [al]). In this case, theentropy equals log2 K. The minimum value occurs when only one symbol occurs; it has probability one ofoccurring and the rest have probability zero.
Exercise 6.22 (Solution on p. 274.)
Derive the maximum-entropy results, both the numeric aspect (entropy equals log2 K) and thetheoretical one (equally likely symbols maximize entropy). Derive the value of the minimum entropyalphabet.
Example 6.1A four-symbol alphabet has the following probabilities.
Pr [a0] =12
Pr [a1] =14
Pr [a2] =18
Pr [a3] =18
Note that these probabilities sum to one as they should. As 12 = 2−1, log2
(12
)= −1. The entropy
of this alphabet equals
H (A) = −(
12 log2
(12
)+ 1
4 log2
(14
)+ 1
8 log2
(18
)+ 1
8 log2
(18
))= −
(12 (−1) + 1
4 (−2) + 18 (−3) + 1
8 (−3))
= 1.75 bits
(6.51)
29This content is available online at <http://cnx.org/content/m0070/2.13/>.30http://www.lucent.com/minds/infotheory/

235
6.21 Source Coding Theorem31
The signicance of an alphabet's entropy rests in how we can represent it with a sequence of bits. Bitsequences form the "coin of the realm" in digital communications: they are the universal way of representingsymbolic-valued signals. We convert back and forth between symbols to bit-sequences with what is knownas a codebook: a table that associates symbols to bit sequences. In creating this table, we must be able toassign a unique bit sequence to each symbol so that we can go between symbol and bit sequences withouterror.
Point of Interest: You may be conjuring the notion of hiding information from others whenwe use the name codebook for the symbol-to-bit-sequence table. There is no relation to cryptol-ogy, which comprises mathematically provable methods of securing information. The codebookterminology was developed during the beginnings of information theory just after World War II.
As we shall explore in some detail elsewhere, digital communication (Section 6.13) is the transmission ofsymbolic-valued signals from one place to another. When faced with the problem, for example, of sending ale across the Internet, we must rst represent each character by a bit sequence. Because we want to sendthe le quickly, we want to use as few bits as possible. However, we don't want to use so few bits that thereceiver cannot determine what each character was from the bit sequence. For example, we could use onebit for every character: File transmission would be fast but useless because the codebook creates errors.Shannon32 proved in his monumental work what we call today the Source Coding Theorem. Let B (ak)denote the number of bits used to represent the symbol ak. The average number of bits B (A) requiredto represent the entire alphabet equals
∑Kk=1 (B (ak) Pr [ak]). The Source Coding Theorem states that the
average number of bits needed to accurately represent the alphabet need only to satisfy
H (A) ≤ B (A) < H (A) + 1 (6.52)
Thus, the alphabet's entropy species to within one bit how many bits on the average need to be used tosend the alphabet. The smaller an alphabet's entropy, the fewer bits required for digital transmission of lesexpressed in that alphabet.
Example 6.2A four-symbol alphabet has the following probabilities.
Pr [a0] =12
Pr [a1] =14
Pr [a2] =18
Pr [a3] =18
and an entropy of 1.75 bits (Example 6.1). Let's see if we can nd a codebook for this four-letteralphabet that satises the Source Coding Theorem. The simplest code to try is known as thesimple binary code: convert the symbol's index into a binary number and use the same numberof bits for each symbol by including leading zeros where necessary.
(a0 ↔ 00) (a1 ↔ 01) (a2 ↔ 10) (a3 ↔ 11) (6.53)
Whenever the number of symbols in the alphabet is a power of two (as in this case), the averagenumber of bits B (A) equals log2 K, which equals 2 in this case. Because the entropy equals 1.75bits,the simple binary code indeed satises the Source Coding Theoremwe are within one bit of theentropy limitbut you might wonder if you can do better. If we chose a codebook with dieringnumber of bits for the symbols, a smaller average number of bits can indeed be obtained. The ideais to use shorter bit sequences for the symbols that occur more often. One codebook like this is
(a0 ↔ 0) (a1 ↔ 10) (a2 ↔ 110) (a3 ↔ 111) (6.54)
31This content is available online at <http://cnx.org/content/m0091/2.13/>.32http://www.lucent.com/minds/infotheory/

236 CHAPTER 6. INFORMATION COMMUNICATION
Now B (A) = 1 12 +2 1
4 +3 18 +3 1
8 = 1.75. We can reach the entropy limit! The simple binary code is,in this case, less ecient than the unequal-length code. Using the ecient code, we can transmitthe symbolic-valued signal having this alphabet 12.5% faster. Furthermore, we know that no moreecient codebook can be found because of Shannon's Theorem.
6.22 Compression and the Human Code33
Shannon's Source Coding Theorem (6.52) has additional applications in data compression. Here, we havea symbolic-valued signal source, like a computer le or an image, that we want to represent with as fewbits as possible. Compression schemes that assign symbols to bit sequences are known as lossless if theyobey the Source Coding Theorem; they are lossy if they use fewer bits than the alphabet's entropy. Usinga lossy compression scheme means that you cannot recover a symbolic-valued signal from its compressedversion without incurring some error. You might be wondering why anyone would want to intentionallycreate errors, but lossy compression schemes are frequently used where the eciency gained in representingthe signal outweighs the signicance of the errors.
Shannon's Source Coding Theorem states that symbolic-valued signals require on the average at leastH (A) number of bits to represent each of its values, which are symbols drawn from the alphabet A. In themodule on the Source Coding Theorem (Section 6.21) we nd that using a so-called xed rate source coder,one that produces a xed number of bits/symbol, may not be the most ecient way of encoding symbolsinto bits. What is not discussed there is a procedure for designing an ecient source coder: one guaranteedto produce the fewest bits/symbol on the average. That source coder is not unique, and one approach thatdoes achieve that limit is the Human source coding algorithm.
Point of Interest: In the early years of information theory, the race was on to be the rstto nd a provably maximally ecient source coding algorithm. The race was won by then MITgraduate student David Human in 1954, who worked on the problem as a project in his informationtheory course. We're pretty sure he received an A.
• Create a vertical table for the symbols, the best ordering being in decreasing order of probability.• Form a binary tree to the right of the table. A binary tree always has two branches at each node.
Build the tree by merging the two lowest probability symbols at each level, making the probability ofthe node equal to the sum of the merged nodes' probabilities. If more than two nodes/symbols sharethe lowest probability at a given level, pick any two; your choice won't aect B (A).
• At each node, label each of the emanating branches with a binary number. The bit sequence obtainedfrom passing from the tree's root to the symbol is its Human code.
Example 6.3The simple four-symbol alphabet used in the Entropy (Example 6.1) and Source Coding (Exam-ple 6.2) modules has a four-symbol alphabet with the following probabilities,
Pr [a0] =12
Pr [a1] =14
Pr [a2] =18
Pr [a3] =18
and an entropy of 1.75 bits (Example 6.1). This alphabet has the Human coding tree shown inFigure 6.18 (Human Coding Tree).
33This content is available online at <http://cnx.org/content/m0092/2.17/>.

237
Human Coding Tree
a1
a2
a3
a4
Symbol Probability12141818
14
12
0
10
10
1
0
10
110
111
Source Code
Figure 6.18: We form a Human code for a four-letter alphabet having the indicated probabilities ofoccurrence. The binary tree created by the algorithm extends to the right, with the root node (the oneat which the tree begins) dening the codewords. The bit sequence obtained by traversing the tree fromthe root to the symbol denes that symbol's binary code.
The code thus obtained is not unique as we could have labeled the branches coming out ofeach node dierently. The average number of bits required to represent this alphabet equals1.75 bits, which is the Shannon entropy limit for this source alphabet. If we had the symbolic-valued signal s (m) = a2, a3, a1, a4, a1, a2, . . . , our Human code would produce the bitstreamb (n) = 101100111010 . . ..
If the alphabet probabilities were dierent, clearly a dierent tree, and therefore dierent code,could well result. Furthermore, we may not be able to achieve the entropy limit. If our symbolshad the probabilities Pr [a1] = 1
2 , Pr [a2] = 14 , Pr [a3] = 1
5 , and Pr [a4] = 120 , the average number
of bits/symbol resulting from the Human coding algorithm would equal 1.75 bits. However, theentropy limit is 1.68 bits. The Human code does satisfy the Source Coding Theoremits averagelength is within one bit of the alphabet's entropybut you might wonder if a better code existed.David Human showed mathematically that no other code could achieve a shorter average codethan his. We can't do better.
Exercise 6.23 (Solution on p. 274.)
Derive the Human code for this second set of probabilities, and verify the claimed average codelength and alphabet entropy.
6.23 Subtlies of Coding34
In the Human code, the bit sequences that represent individual symbols can have diering lengths so thebitstream index m does not increase in lock step with the symbol-valued signal's index n. To capture howoften bits must be transmitted to keep up with the source's production of symbols, we can only computeaverages. If our source code averages B (A) bits/symbol and symbols are produced at a rate R, the averagebit rate equals B (A)R, and this quantity determines the bit interval duration T .
Exercise 6.24 (Solution on p. 274.)
Calculate what the relation between T and the average bit rate B (A)R is.
A subtlety of source coding is whether we need "commas" in the bitstream. When we use an unequalnumber of bits to represent symbols, how does the receiver determine when symbols begin and end? If youcreated a source code that required a separation marker in the bitstream between symbols, it would be veryinecient since you are essentially requiring an extra symbol in the transmission stream.
34This content is available online at <http://cnx.org/content/m0093/2.16/>.
238 CHAPTER 6. INFORMATION COMMUNICATION
point of interest: A good example of this need is the Morse Code: Between each letter, thetelegrapher needs to insert a pause to inform the receiver when letter boundaries occur.
As shown in this example (Example 6.3), no commas are placed in the bitstream, but you can unambiguouslydecode the sequence of symbols from the bitstream. Human showed that his (maximally ecient) code hadthe prex property: No code for a symbol began another symbol's code. Once you have the prex property,the bitstream is partially self-synchronizing: Once the receiver knows where the bitstream starts, we canassign a unique and correct symbol sequence to the bitstream.
Exercise 6.25 (Solution on p. 274.)
Sketch an argument that prex coding, whether derived from a Human code or not, will provideunique decoding when an unequal number of bits/symbol are used in the code.
However, having a prex code does not guarantee total synchronization: After hopping into the middle of abitstream, can we always nd the correct symbol boundaries? The self-synchronization issue does mitigatethe use of ecient source coding algorithms.
Exercise 6.26 (Solution on p. 274.)
Show by example that a bitstream produced by a Human code is not necessarily self-synchronizing.Are xed-length codes self synchronizing?
Another issue is bit errors induced by the digital channel; if they occur (and they will), synchronizationcan easily be lost even if the receiver started "in synch" with the source. Despite the small probabilities oferror oered by good signal set design and the matched lter, an infrequent error can devastate the ability totranslate a bitstream into a symbolic signal. We need ways of reducing reception errors without demandingthat pe be smaller.
Example 6.4The rst electrical communications systemthe telegraphwas digital. When rst deployed in1844, it communicated text over wireline connections using a binary codethe Morse codetorepresent individual letters. To send a message from one place to another, telegraph operatorswould tap the message using a telegraph key to another operator, who would relay the messageon to the next operator, presumably getting the message closer to its destination. In short, thetelegraph relied on a network not unlike the basics of modern computer networks. To say itpresaged modern communications would be an understatement. It was also far ahead of someneeded technologies, namely the Source Coding Theorem. The Morse code, shown in Figure 6.19,was not a prex code. To separate codes for each letter, Morse code required that a spaceapausebe inserted between each letter. In information theory, that space counts as another codeletter, which means that the Morse code encoded text with a three-letter source code: dots, dashesand space. The resulting source code is not within a bit of entropy, and is grossly inecient (about25%). Figure 6.19 shows a Human code for English text, which as we know is ecient.
6.24 Channel Coding35
We can, to some extent, correct errors made by the receiver with only the error-lled bit stream emerging fromthe digital channel available to us. The idea is for the transmitter to send not only the symbol-derived bitsemerging from the source coder but also additional bits derived from the coder's bit stream. These additionalbits, the error correcting bits, help the receiver determine if an error has occurred in the data bits (theimportant bits) or in the error-correction bits. Instead of the communication model (Figure 6.17: DigMC)shown previously, the transmitter inserts a channel coder before analog modulation, and the receiver thecorresponding channel decoder (Figure 6.20). This block diagram shown there forms the FundamentalModel of Digital Communication.
35This content is available online at <http://cnx.org/content/m10782/2.4/>.

239
Morse and Human Code Table
% Morse Code Human Code
A 6.22 .- 1011
B 1.32 -... 010100
C 3.11 -.-. 10101
D 2.97 -.. 01011
E 10.53 . 001
F 1.68 ..-. 110001
G 1.65 . 110000
H 3.63 .... 11001
I 6.14 .. 1001
J 0.06 . 01010111011
K 0.31 -.- 01010110
L 3.07 .-.. 10100
M 2.48 00011
N 5.73 -. 0100
O 6.06 1000
P 1.87 .. 00000
Q 0.10 .- 0101011100
R 5.87 .-. 0111
S 5.81 ... 0110
T 7.68 - 1101
U 2.27 ..- 00010
V 0.70 ...- 0101010
W 1.13 . 000011
X 0.25 -..- 010101111
Y 1.07 -. 000010
Z 0.06 .. 0101011101011
Figure 6.19: Morse and Human Codes for American-Roman Alphabet. The % column indicates theaverage probability (expressed in percent) of the letter occurring in English. The entropy H (A) of thethis source is 4.14 bits. The average Morse codeword length is 2.5 symbols. Adding one more symbol forthe letter separator and converting to bits yields an average codeword length of 5.56 bits. The averageHuman codeword length is 4.35 bits.

240 CHAPTER 6. INFORMATION COMMUNICATION
b(n)
SinkSourceDecoder
s(m)b(n)
Source SourceCoder
s(m)ChannelCoder
DigitalChannel
ChannelDecoder
c(l) c(l)
Figure 6.20: To correct errors that occur in the digital channel, a channel coder and decoder are addedto the communication system. Properly designed channel coding can greatly reduce the probability (fromthe uncoded value of pe) that a data bit b (n) is received incorrectly even when the probability of c (l)be received in error remains pe or becomes larger. This system forms the Fundamental Model of DigitalCommunication.
Shannon's Noisy Channel Coding Theorem (Section 6.30) says that if the data aren't transmitted tooquickly, that error correction codes exist that can correct all the bit errors introduced by the channel.Unfortunately, Shannon did not demonstrate an error correcting code that would achieve this remarkablefeat; in fact, no one has found such a code. Shannon's result proves it exists; seems like there is always morework to do. In any case, that should not prevent us from studying commonly used error correcting codesthat not only nd their way into all digital communication systems, but also into CDs and bar codes usedon merchandise.
6.25 Repetition Codes36
Perhaps the simplest error correcting code is the repetition code.
Repetition Code
1
n
bn
01/R’ 2/R’
DigitalTransmitter
T 2T
x(t)
t
T 3T
x(t)
t6T
1
l
cl
01/R’ 2/R’
DigitalTransmitter
ChannelCoder
Figure 6.21: The upper portion depicts the result of directly modulating the bit stream b (n) into atransmitted signal x (t) using a baseband BPSK signal set. R' is the datarate produced by the sourcecoder. If that bit stream passes through a (3,1) channel coder to yield the bit stream c (l), the resultingtransmitted signal requires a bit interval T three times smaller than the uncoded version. This reductionin the bit interval means that the transmitted energy/bit decreases by a factor of three, which results inan increased error probability in the receiver.
Here, the transmitter sends the data bit several times, an odd number of times in fact. Because the36This content is available online at <http://cnx.org/content/m0071/2.21/>.

241
error probability pe is always less than 12 , we know that more of the bits should be correct rather than in
error. Simple majority voting of the received bits (hence the reason for the odd number) determines thetransmitted bit more accurately than sending it alone. For example, let's consider the three-fold repetitioncode: for every bit b (n) emerging from the source coder, the channel coder produces three. Thus, the bitstream emerging from the channel coder c (l) has a data rate three times higher than that of the originalbit stream b (n). The coding table illustrates when errors can be corrected and when they can't by themajority-vote decoder.
Coding Table
Code Probability Bit
000 (1− pe)3 0
001 pe(1− pe)2 0
010 pe(1− pe)2 0
011 pe2 (1− pe) 1
100 pe(1− pe)2 0
101 pe2 (1− pe) 1
110 pe2 (1− pe) 1
111 pe3 1
Figure 6.22: In this example, the transmitter encodes 0 as 000. The channel creates an error (changinga 0 into a 1) that with probability pe. The rst column lists all possible received datawords and the secondthe probability of each dataword being received. The last column shows the results of the majority-votedecoder. When the decoder produces 0, it successfully corrected the errors introduced by the channel (ifthere were any; the top row corresponds to the case in which no errors occurred). The error probabilityof the decoders is the sum of the probabilities when the decoder produces 1.
Thus, if one bit of the three bits is received in error, the receiver can correct the error; if more thanone error occurs, the channel decoder announces the bit is 1 instead of transmitted value of 0. Using thisrepetition code, the probability of b (n) 6= 0 equals 3pe
2 (1− pe) + pe3. This probability of a decoding error
is always less than pe, the uncoded value, so long as pe < 12 .
Exercise 6.27 (Solution on p. 275.)
Demonstrate mathematically that this claim is indeed true. Is 3pe2 (1− pe) + pe
3 ≤ pe?
6.26 Block Channel Coding37
Because of the higher datarate imposed by the channel coder, the probability of bit error occurring in thedigital channel increases relative to the value obtained when no channel coding is used. The bit intervalduration must be reduced by K
N in comparison to the no-channel-coding situation, which means the energy
37This content is available online at <http://cnx.org/content/m0094/2.14/>.

242 CHAPTER 6. INFORMATION COMMUNICATION
per bit Eb goes down by the same amount. The bit interval must decrease by a factor of three if thetransmitter is to keep up with the data stream, as illustrated here (Figure 6.21: Repetition Code).
Point of Interest: It is unlikely that the transmitter's power could be increased to compensate.Such is the sometimes-unfriendly nature of the real world.
Because of this reduction, the error probability pe of the digital channel goes up. The question thus becomesdoes channel coding really help: Is the eective error probability lower with channel coding even though theerror probability for each transmitted bit is larger? The answer is no: Using a repetition code for channelcoding cannot ultimately reduce the probability that a data bit is received in error. The ultimate reason isthe repetition code's ineciency: transmitting one data bit for every three transmitted is too inecient forthe amount of error correction provided.
Exercise 6.28 (Solution on p. 275.)
Using MATLAB, calculate the probability a bit is received incorrectly with a three-fold repetitioncode. Show that when the energy per bit Eb is reduced by 1/3 that this probability is larger thanthe no-coding probability of error.
The repetition code (p. 240) represents a special case of what is known as block channel coding. Forevery K bits that enter the block channel coder, it inserts an additional N − K error-correction bits toproduce a block of N bits for transmission. We use the notation (N,K) to represent a given block code'sparameters. In the three-fold repetition code (p. 240), K = 1 and N = 3 . A block code's coding eciencyE equals the ratio K
N , and quanties the overhead introduced by channel coding. The rate at which bitsmust be transmitted again changes: So-called data bits b (n) emerge from the source coder at an averagerate B (A) and exit the channel at a rate 1
E higher. We represent the fact that the bits sent through thedigital channel operate at a dierent rate by using the index l for the channel-coded bit stream c (l). Notethat the blocking (framing) imposed by the channel coder does not correspond to symbol boundaries in thebit stream b (n), especially when we employ variable-length source codes.
Does any error-correcting code reduce communication errors when real-world constraints are taken intoaccount? The answer now is yes. To understand channel coding, we need to develop rst a general frameworkfor channel coding, and discover what it takes for a code to be maximally ecient: Correct as many errorsas possible using the fewest error correction bits as possible (making the eciency K
N as large as possible).
6.27 Error-Correcting Codes: Hamming Distance38
So-called linear codes create error-correction bits by combining the data bits linearly. The phrase "linearcombination" means here single-bit binary arithmetic.
(0⊕ 0) = 0 (1⊕ 1) = 0 (0⊕ 1) = 1 (1⊕ 0) = 1
(0 · 0) = 0 (1 · 1) = 1 (0 · 1) = 0 (1 · 0) = 0
Figure 6.23
For example, let's consider the specic (3, 1) error correction code described by the following coding tableand, more concisely, by the succeeding matrix expression.
c (1) = b (1)
c (2) = b (1)
c (3) = b (1)
38This content is available online at <http://cnx.org/content/m10283/2.28/>.

243
orc = Gb
where
G =
1
1
1
c =
c (1)
c (2)
c (3)
b =
(b (1)
)The length-K (in this simple example K = 1) block of data bits is represented by the vector b, and the
length-N output block of the channel coder, known as a codeword, by c. The generator matrix G denesall block-oriented linear channel coders.
As we consider other block codes, the simple idea of the decoder taking a majority vote of the receivedbits won't generalize easily. We need a broader view that takes into account the distance between codewords.A length-N codeword means that the receiver must decide among the 2N possible datawords to select whichof the 2K codewords was actually transmitted. As shown in Figure 6.24, we can think of the datawordsgeometrically. We dene the Hamming distance between binary datawords c1 and c2, denoted by d (c1, c2)to be the minimum number of bits that must be "ipped" to go from one word to the other. For example, thedistance between codewords is 3 bits. In our table of binary arithmetic, we see that adding a 1 corresponds toipping a bit. Furthermore, subtraction and addition are equivalent. We can express the Hamming distanceas
d (c1, c2) = sum ((c1 ⊕ c2)) (6.55)
Exercise 6.29 (Solution on p. 275.)
Show that adding the error vector col[1,0,...,0] to a codeword ips the codeword's leading bit andleaves the rest unaected.
The probability of one bit being ipped anywhere in a codeword is Npe(1− pe)N−1. The number of errors
the channel introduces equals the number of ones in e; the probability of any particular error vector decreaseswith the number of errors.
To perform decoding when errors occur, we want to nd the codeword (one of the lled circles in Fig-ure 6.24) that has the highest probability of occurring: the one closest to the one received. Note that if adataword lies a distance of 1 from two codewords, it is impossible to determine which codeword was actuallysent. This criterion means that if any two codewords are two bits apart, then the code cannot correct thechannel-induced error. Thus, to have a code that can correct all single-bit errors, codewords must have aminimum separation of three. Our repetition code has this property.
Introducing code bits increases the probability that any bit arrives in error (because bit interval durationsdecrease). However, using a well-designed error-correcting code corrects bit reception errors. Do we win orlose by using an error-correcting code? The answer is that we can win if the code is well-designed. The (3,1)repetition code demonstrates that we can lose (Exercise 6.28). To develop good channel coding, we need todevelop rst a general framework for channel codes and discover what it takes for a code to be maximallyecient: Correct as many errors as possible using the fewest error correction bits as possible (making theeciency K
N as large as possible.) We also need a systematic way of nding the codeword closest to any

244 CHAPTER 6. INFORMATION COMMUNICATION
0
1
11 0
1
11
0
1
11
Figure 6.24: In a (3,1) repetition code, only 2 of the possible 8 three-bit data blocks are codewords.We can represent these bit patterns geometrically with the axes being bit positions in the data block. Inthe left plot, the lled circles represent the codewords [0 0 0] and [1 1 1], the only possible codewords. Theunlled ones correspond to the transmission. The center plot shows that the distance between codewordsis 3. Because distance corresponds to ipping a bit, calculating the Hamming distance geometricallymeans following the axes rather than going "as the crow ies". The right plot shows the datawordsthat result when one error occurs as the codeword goes through the channel. The three datawords areunit distance from the original codeword. Note that the received dataword groups do not overlap, whichmeans the code can correct all single-bit errors.
received dataword. A much better code than our (3,1) repetition code is the following (7,4) code.
c (1) = b (1)
c (2) = b (2)
c (3) = b (3)
c (4) = b (4)
c (5) = (b (1)⊕ b (2)⊕ b (3))
c (6) = (b (2)⊕ b (3)⊕ b (4))
c (7) = (b (1)⊕ b (2)⊕ b (4))
where the generator matrix is
G =
1 0 0 0
0 1 0 0
0 0 1 0
0 0 0 1
1 1 1 0
0 1 1 1
1 1 0 1
In this (7,4) code, 24 = 16 of the 27 = 128 possible blocks at the channel decoder correspond to error-freetransmission and reception.
Error correction amounts to searching for the codeword c closest to the received block c in terms of theHamming distance between the two. The error correction capability of a channel code is limited by how closetogether any two error-free blocks are. Bad codes would produce blocks close together, which would resultin ambiguity when assigning a block of data bits to a received block. The quantity to examine, therefore, in

245
designing code error correction codes is the minimum distance between codewords.
dmin = min (d (ci, cj)) , ci 6= cj (6.56)
To have a channel code that can correct all single-bit errors, dmin ≥ 3.Exercise 6.30 (Solution on p. 276.)
Suppose we want a channel code to have an error-correction capability of n bits. What must theminimum Hamming distance between codewords dmin be?
How do we calculate the minimum distance between codewords? Because we have 2K codewords, the numberof possible unique pairs equals 2K−1
(2K − 1
), which can be a large number. Recall that our channel coding
procedure is linear, with c = Gb. Therefore (ci ⊕ cj) = G ((bi ⊕ bj)). Because bi ⊕ bj always yields anotherblock of data bits, we nd that the dierence between any two codewords is another codeword! Thus, tond dmin we need only compute the number of ones that comprise all non-zero codewords. Finding thesecodewords is easy once we examine the coder's generator matrix. Note that the columns of G are codewords(why is this?), and that all codewords can be found by all possible pairwise sums of the columns. To nddmin , we need only count the number of bits in each column and sums of columns. For our example (7,4), G's rst column has three ones, the next one four, and the last two three. Considering sums of columnpairs next, note that because the upper portion of G is an identity matrix, the corresponding upper portionof all column sums must have exactly two bits. Because the bottom portion of each column diers from theother columns in at least one place, the bottom portion of a sum of columns must have at least one bit.Triple sums will have at least three bits because the upper portion of G is an identity matrix. Thus, no sumof columns has fewer than three bits, which means that dmin = 3, and we have a channel coder that cancorrect all occurrences of one error within a received 7-bit block.
6.28 Error-Correcting Codes: Channel Decoding39
Because the idea of channel coding has merit (so long as the code is ecient), let's develop a systematicprocedure for performing channel decoding. One way of checking for errors is to try recreating the errorcorrection bits from the data portion of the received block c. Using matrix notation, we make this calculationby multiplying the received block c by the matrix H known as the parity check matrix. It is formed fromthe generator matrix G by taking the bottom, error-correction portion of G and attaching to it an identitymatrix. For our (7,4) code,
H =
1 1 1 0
0 1 1 1
1 1 0 1︸ ︷︷ ︸Lower portion of G
1 0 0
0 1 0
0 0 1︸ ︷︷ ︸Identity
(6.57)
The parity check matrix thus has size (N −K)×N , and the result of multiplying this matrix with a receivedword is a length- (N −K) binary vector. If no digital channel errors occurwe receive a codeword so thatc = c then Hc = 0. For example, the rst column of G, (1, 0, 0, 0, 1, 0, 1)T , is a codeword. Simplecalculations show that multiplying this vector by H results in a length-(N −K) zero-valued vector.
Exercise 6.31 (Solution on p. 276.)
Show that Hc = 0 for all the columns of G. In other words, show that HG = 0 an (N −K)×Kmatrix of zeroes. Does this property guarantee that all codewords also satisfy Hc = 0?
When the received bits c do not form a codeword, Hc does not equal zero, indicating the presence of one ormore errors induced by the digital channel. Because the presence of an error can be mathematically writtenas c = (c⊕ e) , with e a vector of binary values having a 1 in those positions where a bit error occurred.
39This content is available online at <http://cnx.org/content/m0072/2.20/>.

246 CHAPTER 6. INFORMATION COMMUNICATION
Exercise 6.32 (Solution on p. 276.)
Show that adding the error vector (1, 0, . . . , 0)T to a codeword ips the codeword's leading bit andleaves the rest unaected.
Consequently, Hc = H (c⊕ e) = He. Because the result of the product is a length- (N −K) vector ofbinary values, we can have 2N−K − 1 non-zero values that correspond to non-zero error patterns e. Toperform our channel decoding,
1. compute (conceptually at least) Hc;2. if this result is zero, no detectable or correctable error occurred;3. if non-zero, consult a table of length-(N −K) binary vectors to associate them with the minimal error
pattern that could have resulted in the non-zero result; then4. add the error vector thus obtained to the received vector c to correct the error (because (c⊕ e⊕ e) = c).5. Select the data bits from the corrected word to produce the received bit sequence b (n).
The phraseminimal in the third item raises the point that a double (or triple or quadruple . . .) error occurringduring the transmission/reception of one codeword can create the same received word as a single-bit erroror no error in another codeword. For example, (1, 0, 0, 0, 1, 0, 1)T and (0, 1, 0, 0, 1, 1, 1)T are both codewordsin the example (7,4) code. The second results when the rst one experiences three bit errors (rst, second,and sixth bits). Such an error pattern cannot be detected by our coding strategy, but such multiple errorpatterns are very unlikely to occur. Our receiver uses the principle of maximum probability: An error-freetransmission is much more likely than one with three errors if the bit-error probability pe is small enough.
Exercise 6.33 (Solution on p. 276.)
How small must pe be so that a single-bit error is more likely to occur than a triple-bit error?
6.29 Error-Correcting Codes: Hamming Codes40
For the (7,4) example, we have 2N−K − 1 = 7 error patterns that can be corrected. We start with single-biterror patterns, and multiply them by the parity check matrix. If we obtain unique answers, we are done; iftwo or more error patterns yield the same result, we can try double-bit error patterns. In our case, single-biterror patterns give a unique result.
Parity Check Matrix
e He
1000000 101
0100000 111
0010000 110
0001000 011
0000100 100
0000010 010
0000001 001
This corresponds to our decoding table: We associate the parity check matrix multiplication result withthe error pattern and add this to the received word. If more than one error occurs (unlikely though it maybe), this "error correction" strategy usually makes the error worse in the sense that more bits are changedfrom what was transmitted.
40This content is available online at <http://cnx.org/content/m0097/2.24/>.

247
As with the repetition code, we must question whether our (7,4) code's error correction capability com-pensates for the increased error probability due to the necessitated reduction in bit energy. Figure 6.25(Probability of error occurring) shows that if the signal-to-noise ratio is large enough channel coding yieldsa smaller error probability. Because the bit stream emerging from the source decoder is segmented intofour-bit blocks, the fair way of comparing coded and uncoded transmission is to compute the probability ofblock error: the probability that any bit in a block remains in error despite error correction and regardlessof whether the error occurs in the data or in coding buts. Clearly, our (7,4) channel code does yield smallererror rates, and is worth the additional systems required to make it work.
Probability of error occurring
-5 0 5 10
10-8
10-6
10-4
10-2
100
Signal-to-Noise Ratio (dB)
Pro
babi
lity
of B
lock
Err
or Uncoded (K=4)
(7,4) Code
Figure 6.25: The probability of an error occurring in transmitted K = 4 data bits equals 1− (1− pe)4
as (1− pe)4 equals the probability that the four bits are received without error. The upper curve displays
how this probability of an error anywhere in the four-bit block varies with the signal-to-noise ratio. Whena (7,4) single-bit error correcting code is used, the transmitter reduced the energy it expends during asingle-bit transmission by 4/7, appending three extra bits for error correction. Now the probability ofany bit in the seven-bit block being in error after error correction equals 1− (1− pe)
7 − (7p′e) (1− p′
e)6,
where p′e is the probability of a bit error occurring in the channel when channel coding occurs. Here
(7p′e) (1− p′
e)6equals the probability of exactly on in seven bits emerging from the channel in error; The
channel decoder corrects this type of error, and all data bits in the block are received correctly.
Note that our (7,4) code has the length and number of data bits that perfectly ts correcting single biterrors. This pleasant property arises because the number of error patterns that can be corrected, 2N−K − 1,equals the codeword length N . Codes that have 2N−K − 1 = N are known as Hamming codes, andthe following table (Hamming Codes, p. 247) provides the parameters of these codes. Hamming codes arethe simplest single-bit error correction codes, and the generator/parity check matrix formalism for channelcoding and decoding works for them.

248 CHAPTER 6. INFORMATION COMMUNICATION
Hamming Codes
N K E (eciency)
3 1 0.33
7 4 0.57
15 11 0.73
31 26 0.84
63 57 0.90
127 120 0.94
Unfortunately, for such large blocks, the probability of multiple-bit errors can exceed the number ofsingle-bit errors unless the channel single-bit error probability pe is very small. Consequently, we need toenhance the code's error correcting capability by adding double as well as single-bit error correction.
Exercise 6.34 (Solution on p. 276.)
What must the relation between N and K be for a code to correct all single- and double-bit errorswith a "perfect t"?
6.30 Noisy Channel Coding Theorem41
As the block length becomes larger, more error correction will be needed. Do codes exist that can correctall errors? Perhaps the crowning achievement of Claude Shannon's42 creation of information theory answersthis question. His result comes in two complementary forms: the Noisy Channel Coding Theorem and itsconverse.
6.30.1 Noisy Channel Coding Theorem
Let E denote the eciency of an error-correcting code: the ratio of the number of data bits to the totalnumber of bits used to represent them. If the eciency is less than the capacity of the digital channel, anerror-correcting code exists that has the property that as the length of the code increases, the probability ofan error occurring in the decoded block approaches zero.
limN→∞
Pr [block error] = 0 , E < C (6.58)
6.30.2 Converse to the Noisy Channel Coding Theorem
If E > C, the probability of an error in a decoded block must approach one regardless of the code that mightbe chosen.
limN→∞
Pr [block error] = 1 (6.59)
These results mean that it is possible to transmit digital information over a noisy channel (one that in-troduces errors) and receive the information without error if the code is suciently inecient comparedto the channel's characteristics. Generally, a channel's capacity changes with the signal-to-noise ratio: Asone increases or decreases, so does the other. The capacity measures the overall error characteristics of a
41This content is available online at <http://cnx.org/content/m0073/2.11/>.42http://www.lucent.com/minds/infotheory/

249
channelthe smaller the capacity the more frequently errors occurand an overly ecient error-correctingcode will not build in enough error correction capability to counteract channel errors.
This result astounded communication engineers when Shannon published it in 1948. Analog communi-cation always yields a noisy version of the transmitted signal; in digital communication, error correction canbe powerful enough to correct all errors as the block length increases. The key for this capability to exist isthat the code's eciency be less than the channel's capacity. For a binary symmetric channel, the capacityis given by
C = 1 + pe log2 pe + (1− pe) log2 (1− pe) bits/transmission (6.60)
Figure 6.26 (capacity of a channel) shows how capacity varies with error probability. For example, our (7,4)Hamming code has an eciency of 0.57, and codes having the same eciency but longer block sizes can beused on additive noise channels where the signal-to-noise ratio exceeds 0dB.
capacity of a channel
Signal-to-Noise Ratio (dB)
Cap
acity
(bi
ts)
-10 -5 0 5 100
0.5
1Error Probability (Pe)
Cap
acity
(bi
ts)
0 0.1 0.2 0.3 0.4 0.50
0.5
1
Figure 6.26: The capacity per transmission through a binary symmetric channel is plotted as afunction of the digital channel's error probability (upper) and as a function of the signal-to-noise ratiofor a BPSK signal set (lower).
6.31 Capacity of a Channel43
In addition to the Noisy Channel Coding Theorem and its converse (Section 6.30), Shannon also derivedthe capacity for a bandlimited (to W Hz) additive white noise channel. For this case, the signal set isunrestricted, even to the point that more than one bit can be transmitted each "bit interval." Instead ofconstraining channel code eciency, the revised Noisy Channel Coding Theorem states that some error-correcting code exists such that as the block length increases, error-free transmission is possible if the sourcecoder's datarate, B (A)R, is less than capacity.
C = W log2 (1 + SNR) bits/s (6.61)
43This content is available online at <http://cnx.org/content/m0098/2.13/>.

250 CHAPTER 6. INFORMATION COMMUNICATION
This result sets the maximum datarate of the source coder's output that can be transmitted through thebandlimited channel with no error. 44 Shannon's proof of his theorem was very clever, and did not indicatewhat this code might be; it has never been found. Codes such as the Hamming code work quite well inpractice to keep error rates low, but they remain greater than zero. Until the "magic" code is found, moreimportant in communication system design is the converse. It states that if your data rate exceeds capacity,errors will overwhelm you no matter what channel coding you use. For this reason, capacity calculations aremade to understand the fundamental limits on transmission rates.
Exercise 6.35 (Solution on p. 276.)
The rst denition of capacity applies only for binary symmetric channels, and represents thenumber of bits/transmission. The second result states capacity more generally, having units ofbits/second. How would you convert the rst denition's result into units of bits/second?
Example 6.5The telephone channel has a bandwidth of 3 kHz and a signal-to-noise ratio exceeding 30 dB (atleast they promise this much). The maximum data rate a modem can produce for this wirelinechannel and hope that errors will not become rampant is the capacity.
C = 3× 10³ log2
(1 + 103
)= 29.901 kbps
(6.62)
Thus, the so-called 33 kbps modems operate right at the capacity limit.
Note that the data rate allowed by the capacity can exceed the bandwidth when the signal-to-noise ratioexceeds 0 dB. Our results for BPSK and FSK indicated the bandwidth they require exceeds 1
T . What kindof signal sets might be used to achieve capacity? Modem signal sets send more than one bit/transmissionusing a number, one of the most popular of which is multi-level signaling. Here, we can transmit severalbits during one transmission interval by representing bit by some signal's amplitude. For example, two bitscan be sent with a signal set comprised of a sinusoid with amplitudes of ±A and ±
(A2
).
6.32 Comparison of Analog and Digital Communication45
Analog communication systems, amplitude modulation (AM) radio being a typifying example, can inexpen-sively communicate a bandlimited analog signal from one location to another (point-to-point communication)or from one point to many (broadcast). Although it is not shown here, the coherent receiver (Figure 6.6)provides the largest possible signal-to-noise ratio for the demodulated message. An analysis (Section 6.12)of this receiver thus indicates that some residual error will always be present in an analog system's output.
Although analog systems are less expensive in many cases than digital ones for the same application,digital systems oer much more eciency, better performance, and much greater exibility.
• Eciency: The Source Coding Theorem allows quantication of just how complex a given messagesource is and allows us to exploit that complexity by source coding (compression). In analog commu-nication, the only parameters of interest are message bandwidth and amplitude. We cannot exploitsignal structure to achieve a more ecient communication system.
• Performance: Because of the Noisy Channel Coding Theorem, we have a specic criterion by whichto formulate error-correcting codes that can bring us as close to error-free transmission as we mightwant. Even though we may send information by way of a noisy channel, digital schemes are capableof error-free transmission while analog ones cannot overcome channel disturbances; see this problem(Problem 6.15) for a comparison.
44The bandwidth restriction arises not so much from channel properties, but from spectral regulation, especially for wirelesschannels.
45This content is available online at <http://cnx.org/content/m0074/2.11/>.

251
• Flexibility: Digital communication systems can transmit real-valued discrete-time signals, whichcould be analog ones obtained by analog-to-digital conversion, and symbolic-valued ones (computerdata, for example). Any signal that can be transmitted by analog means can be sent by digital means,with the only issue being the number of bits used in A/D conversion (how accurately do we needto represent signal amplitude). Images can be sent by analog means (commercial television), butbetter communication performance occurs when we use digital systems (HDTV). In addition to digitalcommunication's ability to transmit a wider variety of signals than analog systems, point-to-pointdigital systems can be organized into global (and beyond as well) systems that provide ecient andexible information transmission. Computer networks, explored in the next section, are what wecall such systems today. Even analog-based networks, such as the telephone system, employ moderncomputer networking ideas rather than the purely analog systems of the past.
Consequently, with the increased speed of digital computers, the development of increasingly ecient algo-rithms, and the ability to interconnect computers to form a communications infrastructure, digital commu-nication is now the best choice for many situations.
6.33 Communication Networks46
Communication networks elaborate the Fundamental Model of Communications (Figure 1.4: Fundamentalmodel of communication). The model shown in Figure 6.27 describes point-to-point communications well,wherein the link between transmitter and receiver is straightforward, and they have the channel to themselves.One modern example of this communications mode is the modem that connects a personal computer withan information server via a telephone line. The key aspect, some would say aw, of this model is that thechannel is dedicated: Only one communications link through the channel is allowed for all time. Regardlesswhether we have a wireline or wireless channel, communication bandwidth is precious, and if it could beshared without signicant degradation in communications performance (measured by signal-to-noise ratiofor analog signal transmission and by bit-error probability for digital transmission) so much the better.
Source
Sink
Communication Network
Figure 6.27: The prototypical communications networkwhether it be the postal service, cellulartelephone, or the Internetconsists of nodes interconnected by links. Messages formed by the source aretransmitted within the network by dynamic routing. Two routes are shown. The longer one would beused if the direct link were disabled or congested.
The idea of a network rst emerged with perhaps the oldest form of organized communication: the postalservice. Most communication networks, even modern ones, share many of its aspects.
• A user writes a letter, serving in the communications context as the message source.• This message is sent to the network by delivery to one of the network's public entry points. Entry
points in the postal case are mailboxes, post oces, or your friendly mailman or mailwoman pickingup the letter.
46This content is available online at <http://cnx.org/content/m0075/2.10/>.

252 CHAPTER 6. INFORMATION COMMUNICATION
• The communications network delivers the message in the most ecient (timely) way possible, tryingnot to corrupt the message while doing so.
• The message arrives at one of the network's exit points, and is delivered to the recipient (what we havetermed the message sink).
Exercise 6.36 (Solution on p. 276.)
Develop the network model for the telephone system, making it as analogous as possible with thepostal service-communications network metaphor.
What is most interesting about the network system is the ambivalence of the message source and sink abouthow the communications link is made. What they do care about is message integrity and communicationseciency. Furthermore, today's networks use heterogeneous links. Communication paths that form theInternet use wireline, optical ber, and satellite communication links.
The rst electrical communications network was the telegraph. Here the network consisted of telegraphoperators who transmitted the message eciently using Morse code and routed the message so that it tookthe shortest possible path to its destination while taking into account internal network failures (downed lines,drunken operators). From today's perspective, the fact that this nineteenth century system handled digitalcommunications is astounding. Morse code, which assigned a sequence of dots and dashes to each letter ofthe alphabet, served as the source coding algorithm. The signal set consisted of a short and a long pulse.Rather than a matched lter, the receiver was the operator's ear, and he wrote the message (translatingfrom received bits to symbols).
Note: Because of the need for a comma between dot-dash sequences to dene letter (symbol)boundaries, the average number of bits/symbol, as described in Subtleties of Coding (Example 6.4),exceeded the Source Coding Theorem's upper bound.
Internally, communication networks do have point-to-point communication links between network nodeswell described by the Fundamental Model of Communications. However, many messages share the com-munications channel between nodes using what we call time-domain multiplexing: Rather than thecontinuous communications mode implied in the Model as presented, message sequences are sent, sharingin time the channel's capacity. At a grander viewpoint, the network must route messagesdecide whatnodes and links to usebased on destination informationthe addressthat is usually separate from themessage information. Routing in networks is necessarily dynamic: The complete route taken by messages isformed as the network handles the message, with nodes relaying the message having some notion of the bestpossible path at the time of transmission. Note that no omnipotent router views the network as a whole andpre-determines every message's route. Certainly in the case of the postal system dynamic routing occurs,and can consider issues like inoperative and overly busy links. In the telephone system, routing takes placewhen you place the call; the route is xed once the phone starts ringing. Modern communication networksstrive to achieve the most ecient (timely) and most reliable information delivery system possible.
6.34 Message Routing47
Focusing on electrical networks, most analog ones make inecient use of communication links because trulydynamic routing is dicult, if not impossible, to obtain. In radio networks, such as commercial television,each station has a dedicated portion of the electromagnetic spectrum, and this spectrum cannot be sharedwith other stations or used in any other than the regulated way. The telephone network is more dynamic,but once it establishes a call the path through the network is xed. The users of that path control itsuse, and may not make ecient use of it (long pauses while one person thinks, for example). Telephonenetwork customers would be quite upset if the telephone company momentarily disconnected the path sothat someone else could use it. This kind of connection through a networkxed for the duration of thecommunication sessionis known as a circuit-switched connection.
47This content is available online at <http://cnx.org/content/m0076/2.8/>.

253
During the 1960s, it was becoming clear that not only was digital communication technically superior,but also that the wide variety of communication modescomputer login, le transfer, and electronic mailneeded a dierent approach than point-to-point. The notion of computer networks was born then, andwhat was then called the ARPANET, now called the Internet, was born. Computer networks elaboratethe basic network model by subdividing messages into smaller chunks called packets (Figure 6.28). Therationale for the network enforcing smaller transmissions was that large le transfers would consume networkresources all along the route, and, because of the long transmission time, a communication failure mightrequire retransmission of the entire le. By creating packets, each of which has its own address and is routedindependently of others, the network can better manage congestion. The analogy is that the postal service,rather than sending a long letter in the envelope you provide, opens the envelope, places each page in aseparate envelope, and using the address on your envelope, addresses each page's envelope accordingly, andmails them separately. The network does need to make sure packet sequence (page numbering) is maintained,and the network exit point must reassemble the original message accordingly.
Receiver Address
Transmitter Address
Data Length (bytes)
Error Check
Data
Figure 6.28: Long messages, such as les, are broken into separate packets, then transmitted overcomputer networks. A packet, like a letter, contains the destination address, the return address (trans-mitter address), and the data. The data includes the message part and a sequence number identifyingits order in the transmitted message.
Communications networks are now categorized according to whether they use packets or not. A systemlike the telephone network is said to be circuit switched: The network establishes a xed route that laststhe entire duration of the message. Circuit switching has the advantage that once the route is determined,the users can use the capacity provided them however they like. Its main disadvantage is that the usersmay not use their capacity eciently, clogging network links and nodes along the way. Packet-switchednetworks continuously monitor network utilization, and route messages accordingly. Thus, messages can, onthe average, be delivered eciently, but the network cannot guarantee a specic amount of capacity to theusers.
6.35 Network architectures and interconnection48
The network structureits architecture (Figure 6.27)typies what are known as wide area networks(WANs). The nodes, and users for that matter, are spread geographically over long distances. "Long" hasno precise denition, and is intended to suggest that the communication links vary widely. The Internet iscertainly the largest WAN, spanning the entire earth and beyond. Local area networks, LANs, employa single communication link and special routing. Perhaps the best known LAN is Ethernet49. LANs con-
48This content is available online at <http://cnx.org/content/m0077/2.9/>.49"Ethernet" <http://cnx.org/content/m0078/latest/>

254 CHAPTER 6. INFORMATION COMMUNICATION
nect to other LANs and to wide area networks through special nodes known as gateways (Figure 6.29).In the Internet, a computer's address consists of a four byte sequence, which is known as its IP address(Internet Protocol address). An example address is 128.42.4.32: each byte is separated by a period. Therst two bytes specify the computer's domain (here Rice University). Computers are also addressed by amore human-readable form: a sequence of alphabetic abbreviations representing institution, type of insti-tution, and computer name. A given computer has both names (128.42.4.32 is the same as soma.rice.edu).Data transmission on the Internet requires the numerical form. So-called name servers translate betweenalphabetic and numerical forms, and the transmitting computer requests this translation before the messageis sent to the network.
Gateway
Wide-Area Network
Gateway
A B
B
C
DLAN
LAN
LAN
Figure 6.29: The gateway serves as an interface between local area networks and the Internet. The twoshown here translate between LAN and WAN protocols; one of these also interfaces between two LANs,presumably because together the two LANs would be geographically too dispersed.
6.36 Ethernet50
Transceiver
Computer A
Transceiver
Computer B
Z0
Terminator
Z0
Terminator
L
Figure 6.30: The Ethernet architecture consists of a single coaxial cable terminated at either end by aresistor having a value equal to the cable's characteristic impedance. Computers attach to the Ethernetthrough an interface known as a transceiver because it sends as well as receives bit streams representedas analog voltages.
50This content is available online at <http://cnx.org/content/m10284/2.12/>.

255
Ethernet uses as its communication medium a single length of coaxial cable (Figure 6.30). This cable servesas the "ether", through which all digital data travel. Electrically, computers interface to the coaxial cable(Figure 6.30) through a device known as a transceiver. This device is capable of monitoring the voltageappearing between the core conductor and the shield as well as applying a voltage to it. Conceptually itconsists of two op-amps, one applying a voltage corresponding to a bit stream (transmitting data) and anotherserving as an amplier of Ethernet voltage signals (receiving data). The signal set for Ethernet resemblesthat shown in BPSK Signal Sets, with one signal the negative of the other. Computers are attached inparallel, resulting in the circuit model for Ethernet shown in Figure 6.31.
Exercise 6.37 (Solution on p. 276.)
From the viewpoint of a transceiver's sending op-amp, what is the load it sees and what is thetransfer function between this output voltage and some other transceiver's receiving circuit? Whyshould the output resistor Rout be large?
RoutxA(t)
rA(t)Z0
Transceiver Coax
xA(t)+
–
+
–
+
–… Z0
Rout Rout Rout
xB(t) xZ(t)
Figure 6.31: The top circuit expresses a simplied circuit model for a transceiver. The outputresistance Rout must be much larger than Z0 so that the sum of the various transmitter voltages add tocreate the Ethernet conductor-to-shield voltage that serves as the received signal r (t) for all transceivers.In this case, the equivalent circuit shown in the bottom circuit applies.
No one computer has more authority than any other to control when and how messages are sent. With-out scheduling authority, you might well wonder how one computer sends to another without the (large)interference that the other computers would produce if they transmitted at the same time. The innovationof Ethernet is that computers schedule themselves by a random-access method. This method relies onthe fact that all packets transmitted over the coaxial cable can be received by all transceivers, regardless ofwhich computer might actually be the intended recipient. In communications terminology, Ethernet directlysupports broadcast. Each computer goes through the following steps to send a packet.
1. The computer senses the voltage across the cable to determine if some other computer is transmitting.

256 CHAPTER 6. INFORMATION COMMUNICATION
2. If another computer is transmitting, wait until the transmissions nish and go back to the rst step.If the cable has no transmissions, begin transmitting the packet.
3. If the receiver portion of the transceiver determines that no other computer is also sending a packet,continue transmitting the packet until completion.
4. On the other hand, if the receiver senses interference from another computer's transmissions, immedi-ately cease transmission, waiting a random amount of time to attempt the transmission again (go tostep 1) until only one computer transmits and the others defer. The condition wherein two (or more)computers' transmissions interfere with others is known as a collision.
The reason two computers waiting to transmit may not sense the other's transmission immediately arisesbecause of the nite propagation speed of voltage signals through the coaxial cable. The longest time anycomputer must wait to determine if its transmissions do not encounter interference is 2L
c , where L is thecoaxial cable's length. The maximum-length-specication for Ethernet is 1 km. Assuming a propagationspeed of 2/3 the speed of light, this time interval is more than 10 µs. As analyzed in Problem 22 (Prob-lem 6.30), the number of these time intervals required to resolve the collision is, on the average, less thantwo!
Exercise 6.38 (Solution on p. 276.)
Why does the factor of two enter into this equation? (Consider the worst-case situation of twotransmitting computers located at the Ethernet's ends.)
Thus, despite not having separate communication paths among the computers to coordinate their transmis-sions, the Ethernet random access protocol allows computers to communicate without only a slight degra-dation in eciency, as measured by the time taken to resolve collisions relative to the time the Ethernet isused to transmit information.
A subtle consideration in Ethernet is the minimum packet size Pmin. The time required to transmit suchpackets equals Pmin
C , where C is the Ethernet's capacity in bps. Ethernet now comes in two dierent types,each with individual specications, the most distinguishing of which is capacity: 10 Mbps and 100 Mbps. Ifthe minimum transmission time is such that the beginning of the packet has not propagated the full lengthof the Ethernet before the end-of-transmission, it is possible that two computers will begin transmission atthe same time and, by the time their transmissions cease, the other's packet will not have propagated tothe other. In this case, computers in-between the two will sense a collision, which renders both computer'stransmissions senseless to them, without the two transmitting computers knowing a collision has occurred atall! For Ethernet to succeed, we must have the minimum packet transmission time exceed twice the voltagepropagation time: Pmin
C > 2Lc or
Pmin >2LC
c(6.63)
Thus, for the 10 Mbps Ethernet having a 1 km maximum length specication, the minimum packet size is200 bits.
Exercise 6.39 (Solution on p. 277.)
The 100 Mbps Ethernet was designed more recently than the 10 Mbps alternative. To maintainthe same minimum packet size as the earlier, slower version, what should its length specicationbe? Why should the minimum packet size remain the same?
6.37 Communication Protocols51
The complexity of information transmission in a computer networkreliable transmission of bits acrossa channel, routing, and directing information to the correct destination within the destination computersoperating systemdemands an overarching concept of how to organize information delivery. No unique set of
51This content is available online at <http://cnx.org/content/m0080/2.18/>.

257
rules satises the various constraints communication channels and network organization place on informationtransmission. For example, random access issues in Ethernet are not present in wide-area networks such asthe Internet. A protocol is a set of rules that governs how information is delivered. For example, to usethe telephone network, the protocol is to pick up the phone, listen for a dial tone, dial a number having aspecic number of digits, wait for the phone to ring, and say hello. In radio, the station uses amplitude orfrequency modulation with a specic carrier frequency and transmission bandwidth, and you know to turnon the radio and tune in the station. In technical terms, no one protocol or set of protocols can be usedfor any communication situation. Be that as it may, communication engineers have found that a commonthread runs through the organization of the various protocols. This grand design of information transmissionorganization runs through all modern networks today.
What has been dened as a networking standard is a layered, hierarchical protocol organization. Asshown in Figure 6.32 (Protocol Picture), protocols are organized by function and level of detail.
Protocol Picture
detail
Application
Presentation
Session
Transport
Network
Data Link
Physical
ISO Network Protocol Standard
http
telnet
tcp
ip
ecc
signal set
Figure 6.32: Protocols are organized according to the level of detail required for information transmis-sion. Protocols at the lower levels (shown toward the bottom) concern reliable bit transmission. Higherlevel protocols concern how bits are organized to represent information, what kind of information is de-ned by bit sequences, what software needs the information, and how the information is to be interpreted.Bodies such as the IEEE (Institute for Electronics and Electrical Engineers) and the ISO (InternationalStandards Organization) dene standards such as this. Despite being a standard, it does not constrainprotocol implementation so much that innovation and competitive individuality are ruled out.
Segregation of information transmission, manipulation, and interpretation into these categories directlyaects how communication systems are organized, and what role(s) software systems fulll. Although notthought about in this way in earlier times, this organizational structure governs the way communicationengineers think about all communication systems, from radio to the Internet.
Exercise 6.40 (Solution on p. 277.)
How do the various aspects of establishing and maintaining a telephone conversation t into thislayered protocol organization?
We now explicitly state whether we are working in the physical layer (signal set design, for example), thedata link layer (source and channel coding), or any other layer. IP abbreviates Internet protocol, and governsgateways (how information is transmitted between networks having dierent internal organizations). TCP(transmission control protocol) governs how packets are transmitted through a wide-area network such asthe Internet. Telnet is a protocol that concerns how a person at one computer logs on to another computeracross a network. A moderately high level protocol such as telnet, is not concerned with what data links

258 CHAPTER 6. INFORMATION COMMUNICATION
(wireline or wireless) might have been used by the network or how packets are routed. Rather, it establishesconnections between computers and directs each byte (presumed to represent a typed character) to theappropriate operation system component at each end. It is not concerned with what the characters meanor what programs the person is typing to. That aspect of information transmission is left to protocols athigher layers.
Recently, an important set of protocols created the World Wide Web. These protocols exist independentlyof the Internet. The Internet insures that messages are transmitted eciently and intact; the Internet is notconcerned (to date) with what messages contain. HTTP (hypertext transfer protocol) frame what messagescontain and what should be done with the data. The extremely rapid development of the Web on top ofan essentially stagnant Internet is but one example of the power of organizing how information transmissionoccurs without overly constraining the details.
6.38 Information Communication Problems52
Problem 6.1: Signals on Transmission LinesA modulated signal needs to be sent over a transmission line having a characteristic impedance of Z0 = 50Ω.So that the signal does not interfere with signals others may be transmitting, it must be bandpass lteredso that its bandwidth is 1 MHz and centered at 3.5 MHz. The lter's gain should be one in magnitude. Anop-amp lter (Figure 6.33) is proposed.
C2R1
R2
C1
+
–
–
+
Z0Vin
Figure 6.33
a) What is the transfer function between the input voltage and the voltage across the transmission line?b) Find values for the resistors and capacitors so that design goals are met.
Problem 6.2: Noise in AM SystemsThe signal s (t) emerging from an AM communication system consists of two parts: the message signal,
s (t), and additive noise. The plot (Figure 6.34) shows the message spectrum S (f) and noise power spectrumPN (f). The noise power spectrum lies completely within the signal's band, and has a constant value thereof N0
2 .
52This content is available online at <http://cnx.org/content/m10352/2.21/>.

259
fW–W
AS(f)
A/2
fW–W
PN(f)
N0/2
Figure 6.34
a) What is the message signal's power? What is the signal-to-noise ratio?b) Because the power in the message decreases with frequency, the signal-to-noise ratio is not constant
within subbands. What is the signal-to-noise ratio in the upper half of the frequency band?c) A clever 241 student suggests ltering the message before the transmitter modulates it so that the
signal spectrum is balanced (constant) across frequency. Realizing that this ltering aects the messagesignal, the student realizes that the receiver must also compensate for the message to arrive intact.Draw a block diagram of this communication system. How does this system's signal-to-noise ratiocompare with that of the usual AM radio?
Problem 6.3: Complementary FiltersComplementary lters usually have opposite ltering characteristics (like a lowpass and a highpass)and have transfer functions that add to one. Mathematically, H1 (f) and H2 (f) are complementary if
H1 (f) + H2 (f) = 1
We can use complementary lters to separate a signal into two parts by passing it through each lter. Eachoutput can then be transmitted separately and the original signal reconstructed at the receiver. Let's assumethe mesage is bandlimited to WHz and that H1 (f) = a
a+j2πf .
a) What circuits would be used to produce the complementary lters?b) Sketch a block diagram for a communication system (transmitter and receiver) that employs comple-
mentary signal transmission to send a message m (t).c) What is the receiver's signal-to-noise ratio? How does it compare to the standard system that sends
the signal by simple amplitude modulation?
Problem 6.4: Phase ModulationA message signal m (t) phase modulates a carrier if the transmitted signal equals
x (t) = A sin (2πfct + φdm (t))
where φd is known as the phase deviation. In this problem, the phase deviation is small. As with all analogmodulation schemes, assume that |m (t) | < 1, the message is bandlimited to W Hz, and the carrier frequencyfc is much larger than W .
a) What is the transmission bandwidth?b) Find a receiver for this modulation scheme.c) What is the signal-to-noise ratio of the received signal?
hint: Use the facts that cos (x) ≈ 1 and sin (x) ≈ x for small x.

260 CHAPTER 6. INFORMATION COMMUNICATION
Problem 6.5: Digital Amplitude ModulationTwo ELEC 241 students disagree about a homework problem. The issue concerns the discrete-time signal
s (n) cos (2πf0n), where the signal s (n) has no special characteristics and the modulation frequency f0 isknown. Sammy says that he can recover s (n) from its amplitude-modulated version by the same approachused in analog communications. Samantha says that approach won't work.
a) What is the spectrum of the modulated signal?b) Who is correct? Why?c) The teaching assistant does not want to take sides. He tells them that if s (n) cos (2πf0n) and
s (n) sin (2πf0n) were both available, s (n) can be recovered. What does he have in mind?
Problem 6.6: Anti-JammingOne way for someone to keep people from receiving an AM transmission is to transmit noise at the same car-rier frequency. Thus, if the carrier frequency is fc so that the transmitted signal is AT (1 + m (t)) sin (2πfct)the jammer would transmit AJn (t) (sin (2πfct) + φ). The noise n (t) has a constant power density spectrumover the bandwidth of the message m (t). The channel adds white noise of spectral height N0
2 .
a) What would be the output of a traditional AM receiver tuned to the carrier frequency fc?b) RU Electronics proposes to counteract jamming by using a dierent modulation scheme. The scheme's
transmitted signal has the form AT (1 + m (t)) c (t) where c (t) is a periodic carrier signal (period 1fc)
having the indicated waveform (Figure 6.35). What is the spectrum of the transmitted signal withthe proposed scheme? Assume the message bandwidth W is much less than the fundamental carrierfrequency fc.
c) The jammer, unaware of the change, is transmitting with a carrier frequency of fc, while the receivertunes a standard AM receiver to a harmonic of the carrier frequency. What is the signal-to-noise ratioof the receiver tuned to the harmonic having the largest power that does not contain the jammer?
c(t)
t0
1
1/4fc
1/2fc 3/4fc1/fc
–1
Figure 6.35
Problem 6.7: Secret ComunicationsA system for hiding AM transmissions has the transmitter randomly switching between two carrier fre-quencies f1 and f2. "Random switching" means that one carrier frequency is used for some period of time,switches to the other for some other period of time, back to the rst, etc. The receiver knows what thecarrier frequencies are but not when carrier frequency switches occur. Consequently, the receiver must bedesigned to receive the transmissions regardless of which carrier frequency is used. Assume the messagesignal has bandwidth W . The channel adds white noise of spectral height N0
2 .
a) How dierent should the carrier frequencies be so that the message could be received?b) What receiver would you design?c) What signal-to-noise ratio for the demodulated signal does your receiver yield?

261
Problem 6.8: AM StereoStereophonic radio transmits two signals simultaneously that correspond to what comes out of the left andright speakers of the receiving radio. While FM stereo is commonplace, AM stereo is not, but is much simplerto understand and analyze. An amazing aspect of AM stereo is that both signals are transmitted within thesame bandwidth as used to transmit just one. Assume the left and right signals are bandlimited to W Hz.
x (t) = A (1 + ml (t)) cos (2πfct) + Amr (t) sin (2πfct)
a) Find the Fourier transform of x (t). What is the transmission bandwidth and how does it comparewith that of standard AM?
b) Let us use a coherent demodulator as the receiver, shown in Figure 6.36. Show that this receiver indeedworks: It produces the left and right signals separately.
c) Assume the channel adds white noise to the transmitted signal. Find the signal-to-noise ratio of eachsignal.
LPFW Hzx(t)
cos 2πfct
sin 2πfct
×
×BPF
LPFW Hz
Figure 6.36
Problem 6.9: A Novel Communication SystemA clever system designer claims that the depicted transmitter (Figure 6.37) has, despite its complexity,advantages over the usual amplitude modulation system. The message signal m (t) is bandlimited to W Hz,and the carrier frequency (fc W ). The channel attenuates the transmitted signal x (t) and adds whitenoise of spectral height N0
2 .
H(f)
A sin 2πfct
A cos 2πfct
x(t)m(t)×
××
Figure 6.37

262 CHAPTER 6. INFORMATION COMMUNICATION
The transfer function H (f) is given by H (f) =
j if f < 0
−j if f > 0
a) Find an expression for the spectrum of x (t). Sketch your answer.b) Show that the usual coherent receiver demodulates this signal.c) Find the signal-to-noise ratio that results when this receiver is used.d) Find a superior receiver (one that yields a better signal-to-noise ratio), and analyze its performance.
Problem 6.10: Multi-Tone Digital CommunicationIn a so-called multi-tone system, several bits are gathered together and transmitted simultaneously ondierent carrier frequencies during a T second interval. For example, B bits would be transmitted accordingto
x (t) = A
B−1∑k=0
(bk sin (2π (k + 1) f0t)) , 0 ≤ t < T (6.64)
Here, f0 is the frequency oset for each bit and it is harmonically related to the bit interval T . The value ofbk is either −1 or +1.
a) Find a receiver for this transmission scheme.b) An ELEC 241 almuni likes digital systems so much that he decides to produce a discrete-time version.
He samples the received signal (sampling interval Ts = TN ). How should N be related to B, the number
of simultaneously transmitted bits?c) The alumni wants to nd a simple form for the receiver so that his software implementation runs as
eciently as possible. How would you recommend he implement the receiver?
Problem 6.11: City Radio ChannelsIn addition to additive white noise, metropolitan cellular radio channels also contain multipath: the atten-uated signal and a delayed, further attenuated signal are received superimposed. As shown in Figure 6.38,multipath occurs because the buildings reect the signal and the reected path length between transmitterand receiver is longer than the direct path.
Direct Path
ReflectedPath
Transmitter
Figure 6.38
a) Assume that the length of the direct path is d meters and the reected path is 1.5 times as long. Whatis the model for the channel, including the multipath and the additive noise?

263
b) Assume d is 1 km. Find and sketch the magnitude of the transfer function for the multipath componentof the channel. How would you characterize this transfer function?
c) Would the multipath aect AM radio? If not, why not; if so, how so? Would analog cellular telephone,which operates at much higher carrier frequencies (800 MHz vs. 1 MHz for radio), be aected or not?Analog cellular telephone uses amplitude modulation to transmit voice.
d) How would the usual AM receiver be modied to minimize multipath eects? Express your modiedreceiver as a block diagram.
Problem 6.12: Downlink Signal SetsIn digital cellular telephone systems, the base station (transmitter) needs to relay dierent voice signals toseveral telephones at the same time. Rather than send signals at dierent frequencies, a clever Rice engineersuggests using a dierent signal set for each data stream. For example, for two simultaneous data streams,she suggests BPSK signal sets that have the depicted basic signals (Figure 6.39).
T
A
–A
T
A
–A
s1(t) s2(t)
tt
Figure 6.39
Thus, bits are represented in data stream 1 by s1 (t) and − (s1 (t)) and in data stream 2 by s2 (t) and− (s2 (t)), each of which are modulated by 900 MHz carrier. The transmitter sends the two data streams sothat their bit intervals align. Each receiver uses a matched lter for its receiver. The requirement is thateach receiver not receive the other's bit stream.
a) What is the block diagram describing the proposed system?b) What is the transmission bandwidth required by the proposed system?c) Will the proposal work? Does the fact that the two data streams are transmitted in the same bandwidth
at the same time mean that each receiver's performance is aected? Can each bit stream be receivedwithout interference from the other?
Problem 6.13: Mixed Analog and Digital TransmissionA signal m (t) is transmitted using amplitude modulation in the usual way. The signal has bandwidth WHz, and the carrier frequency is fc. In addition to sending this analog signal, the transmitter also wants tosend ASCII text in an auxiliary band that lies slightly above the analog transmission band. Using an 8-bitrepresentation of the characters and a simple baseband BPSK signal set (the constant signal +1 correspondsto a 0, the constant -1 to a 1), the data signal d (t) representing the text is transmitted as the same timeas the analog signal m (t). The transmission signal spectrum is as shown (Figure 6.40), and has a totalbandwidth B.
a) Write an expression for the time-domain version of the transmitted signal in terms of m (t) and thedigital signal d (t).
b) What is the maximum datarate the scheme can provide in terms of the available bandwidth?c) Find a receiver that yields both the analog signal and the bit stream.

264 CHAPTER 6. INFORMATION COMMUNICATION
2W
X(f)
ffc
B
analog digital
Figure 6.40
Problem 6.14: Digital StereoJust as with analog communication, it should be possible to send two signals simultaneously over a digitalchannel. Assume you have two CD-quality signals (each sampled at 44.1 kHz with 16 bits/sample). Onesuggested transmission scheme is to use a quadrature BPSK scheme. If b(1) (n) and b(2) (n) each represent abit stream, the transmitted signal has the form
x (t) = A∑(
b(1) (n) sin (2πfc (t− nT )) p (t− nT ) + b(2) (n) cos (2πfc (t− nT )) p (t− nT ))
where p (t) is a unit-amplitude pulse having duration T and b(1) (n), b(2) (n) equal either +1 or -1 accordingto the bit being transmitted for each signal. The channel adds white noise and attenuates the transmittedsignal.
a) What value would you choose for the carrier frequency fc?b) What is the transmission bandwidth?c) What receiver would you design that would yield both bit streams?
Problem 6.15: Digital and Analog Speech CommunicationSuppose we transmit speech signals over comparable digital and analog channels. We want to compare theresulting quality of the received signals. Assume the transmitters use the same power, and the channelsintroduce the same attenuation and additive white noise. Assume the speech signal has a 4 kHz bandwidthand, in the digital case, is sampled at an 8 kHz rate with eight-bit A/D conversion. Assume simple binarysource coding and a modulated BPSK transmission scheme.
a) What is the transmission bandwidth of the analog (AM) and digital schemes?b) Assume the speech signal's amplitude has a magnitude less than one. What is maximum amplitude
quantization error introduced by the A/D converter?c) In the digital case, each bit in quantized speech sample is received in error with probability pe that
depends on signal-to-noise ratio Eb
N0. However, errors in each bit have a dierent impact on the error in
the reconstructed speech sample. Find the mean-squared error between the transmitted and receivedamplitude.
d) In the digital case, the recovered speech signal can be considered to have two noise sources addedto each sample's true value: One is the A/D amplitude quantization noise and the second is due tochannel errors. Because these are separate, the total noise power equals the sum of these two. Whatis the signal-to-noise ratio of the received speech signal as a function of pe?
e) Compute and plot the received signal's signal-to-noise ratio for the two transmission schemes for a fewvalues of channel signal-to-noise ratios.
f) Compare and evaluate these systems.

265
Problem 6.16: Source CompressionConsider the following 5-letter source.
Letter Probability
a 0.5
b 0.25
c 0.125
d 0.0625
e 0.0625
a) Find this source's entropy.b) Show that the simple binary coding is inecient.c) Find an unequal-length codebook for this sequence that satises the Source Coding Theorem. Does
your code achieve the entropy limit?d) How much more ecient is this code than the simple binary code?
Problem 6.17: Source CompressionConsider the following 5-letter source.
Letter Probability
a 0.4
b 0.2
c 0.15
d 0.15
e 0.1
a) Find this source's entropy.b) Show that the simple binary coding is inecient.c) Find the Human code for this source. What is its average code length?
Problem 6.18: Speech CompressionWhen we sample a signal, such as speech, we quantize the signal's amplitude to a set of integers. For a b-bitconverter, signal amplitudes are represented by 2b integers. Although these integers could be represented bya binary code for digital transmission, we should consider whether a Human coding would be more ecient.
a) Load into Matlab the segment of speech contained in y.mat. Its sampled values lie in the interval(-1, 1). To simulate a 3-bit converter, we use Matlab's round function to create quantized amplitudescorresponding to the integers [0 1 2 3 4 5 6 7].
• y_quant = round(3.5*y + 3.5);
Find the relative frequency of occurrence of quantized amplitude values. The following Matlab programcomputes the number of times each quantized value occurs.
• for n=0:7; count(n+1) = sum(y_quant == n); end;
Find the entropy of this source.

266 CHAPTER 6. INFORMATION COMMUNICATION
b) Find the Human code for this source. How would you characterize this source code in words?c) How many fewer bits would be used in transmitting this speech segment with your Human code in
comparison to simple binary coding?
Problem 6.19: Digital CommunicationIn a digital cellular system, a signal bandlimited to 5 kHz is sampled with a two-bit A/D converter at itsNyquist frequency. The sample values are found to have the shown relative frequencies.
Sample Value Probability
0 0.15
1 0.35
2 0.3
3 0.2
We send the bit stream consisting of Human-coded samples using one of the two depicted signal sets(Figure 6.41).
T
A
t
s0(t)
T
A/2
t
s0(t)
T
A
t
s1(t)
T
A
t
s1(t)
-A/2
Signal Set 1 Signal Set 2
Figure 6.41
a) What is the datarate of the compressed source?b) Which choice of signal set maximizes the communication system's performance?c) With no error-correcting coding, what signal-to-noise ratio would be needed for your chosen signal set
to guarantee that the bit error probability will not exceed 10−3? If the receiver moves twice as farfrom the transmitter (relative to the distance at which the 10−3 error rate was obtained), how doesthe performance change?
Problem 6.20: Signal CompressionLetters drawn from a four-symbol alphabet have the indicated probabilities.
Letter Probability
a 1/3
b 1/3
c 1/4
d 1/12

267
a) What is the average number of bits necessary to represent this alphabet?b) Using a simple binary code for this alphabet, a two-bit block of data bits naturally emerges. Find an
error correcting code for two-bit data blocks that corrects all single-bit errors.c) How would you modify your code so that the probability of the letter a being confused with the letter
d is minimized? If so, what is your new code; if not, demonstrate that this goal cannot be achieved.
Problem 6.21: Universal Product CodeThe Universal Product Code (UPC), often known as a bar code, labels virtually every sold good. Anexample (Figure 6.42) of a portion of the code is shown.
d
……
Figure 6.42
Here a sequence of black and white bars, each having width d, presents an 11-digit number (consisting ofdecimal digits) that uniquely identies the product. In retail stores, laser scanners read this code, and afteraccessing a database of prices, enter the price into the cash register.
a) How many bars must be used to represent a single digit?b) A complication of the laser scanning system is that the bar code must be read either forwards or
backwards. Now how many bars are needed to represent each digit?c) What is the probability that the 11-digit code is read correctly if the probability of reading a single
bit incorrectly is pe?d) How many error correcting bars would need to be present so that any single bar error occurring in the
11-digit code can be corrected?
Problem 6.22: Error Correcting CodesA code maps pairs of information bits into codewords of length 5 as follows.
Data Codeword
00 00000
01 01101
10 10111
11 11010
a) What is this code's eciency?b) Find the generator matrix G and parity-check matrix H for this code.c) Give the decoding table for this code. How many patterns of 1, 2, and 3 errors are correctly decoded?d) What is the block error probability (the probability of any number of errors occurring in the decoded
codeword)?

268 CHAPTER 6. INFORMATION COMMUNICATION
Problem 6.23: Overly Designed Error Correction CodesAn Aggie engineer wants not only to have codewords for his data, but also to hide the information fromRice engineers (no fear of the UT engineers). He decides to represent 3-bit data with 6-bit codewords inwhich none of the data bits appear explicitly.
c1 = (d1 ⊕ d2)c2 = (d2 ⊕ d3)c3 = (d1 ⊕ d3)c4 = (d1 ⊕ d2 ⊕ d3)c5 = (d1 ⊕ d2)c6 = (d1 ⊕ d2 ⊕ d3)
a) Find the generator matrix G and parity-check matrix H for this code.b) Find a 3× 6 matrix that recovers the data bits from the codeword.c) What is the error correcting capability of the code?
Problem 6.24: Error Correction?It is important to realize that when more transmission errors than can be corrected, error correctionalgorithms believe that a smaller number of errors have occurred and correct accordingly. For example,consider a (7,4) Hamming Code having the generator matrix
G =
1 0 0 0
0 1 0 0
0 0 1 0
0 0 0 1
1 1 1 0
0 1 1 1
1 0 1 1
This code corrects all single-bit error, but if a double bit error occurs, it corrects using a single-bit errorcorrection approach.
a) How many double-bit errors can occur in a codeword?b) For each double-bit error pattern, what is the result of channel decoding? Express your result as a
binary error sequence for the data bits.
Problem 6.25: Selective Error CorrectionWe have found that digital transmission errors occur with a probability that remains constant no matterhow "important" the bit may be. For example, in transmitting digitized signals, errors occur as frequentlyfor the most signicant bit as they do for the least signicant bit. Yet, the former errors have a much largerimpact on the overall signal-to-noise ratio than the latter. Rather than applying error correction to eachsample value, why not concentrate the error correction on the most important bits? Assume that we samplean 8 kHz signal with an 8-bit A/D converter. We use single-bit error correction on the most signicant fourbits and none on the least signicant four. Bits are transmitted using a modulated BPSK signal set over anadditive white noise channel.
a) How many error correction bits must be added to provide single-bit error correction on the mostsignicant bits?
b) How large must the signal-to-noise ratio of the received signal be to insure reliable communication?

269
c) Assume that once error correction is applied, only the least signicant 4 bits can be received in error.How much would the output signal-to-noise ratio improve using this error correction scheme?
Problem 6.26: Compact DiskErrors occur in reading audio compact disks. Very few errors are due to noise in the compact disk player;most occur because of dust and scratches on the disk surface. Because scratches span several bits, a single-biterror is rare; several consecutive bits in error are much more common. Assume that scratch and dust-inducederrors are four or fewer consecutive bits long. The audio CD standard requires 16-bit, 44.1 kHz analog-to-digital conversion of each channel of the stereo analog signal.
a) How many error-correction bits are required to correct scratch-induced errors for each 16-bit sample?b) Rather than use a code that can correct several errors in a codeword, a clever 241 engineer proposes
interleaving consecutive coded samples. As the cartoon (Figure 6.43) shows, the bits representingcoded samples are interpersed before they are written on the CD. The CD player de-interleaves thecoded data, then performs error-correction. Now, evaluate this proposed scheme with respect to thenon-interleaved one.
1111
1010
sample n
sample n+1 4-wayinterleaver
1 1010 1001 1001001sample n+2
sample n+3
0000
0101
Figure 6.43
Problem 6.27: Communication System DesignRU Communication Systems has been asked to design a communication system that meets the followingrequirements.
• The baseband message signal has a bandwidth of 10 kHz.• The RUCS engineers nd that the entropy H of the sampled message signal depends on how many
bits b are used in the A/D converter (see table below).• The signal is to be sent through a noisy channel having a bandwidth of 25 kHz channel centered at 2
MHz and a signal-to-noise ration within that band of 10 dB.• Once received, the message signal must have a signal-to-noise ratio of at least 20 dB.
b H
3 2.19
4 3.25
5 4.28
6 5.35
Can these specications be met? Justify your answer.Problem 6.28: HDTVAs HDTV (high-denition television) was being developed, the FCC restricted this digital system to use inthe same bandwidth (6 MHz) as its analog (AM) counterpart. HDTV video is sampled on a 1035 × 1840raster at 30 images per second for each of the three colors. The least-acceptable picture received by televisionsets located at an analog station's broadcast perimeter has a signal-to-noise ratio of about 10 dB.

270 CHAPTER 6. INFORMATION COMMUNICATION
a) Using signal-to-noise ratio as the criterion, how many bits per sample must be used to guarantee thata high-quality picture, which achieves a signal-to-noise ratio of 20 dB, can be received by any HDTVset within the same broadcast region?
b) Assuming the digital television channel has the same characteristics as an analog one, how muchcompression must HDTV systems employ?
Problem 6.29: Digital Cellular TelephonesIn designing a digital version of a wireless telephone, you must rst consider certain fundamentals. Firstof all, the quality of the received signal, as measured by the signal-to-noise ratio, must be at least as goodas that provided by wireline telephones (30 dB) and the message bandwidth must be the same as wirelinetelephone. The signal-to-noise ratio of the allocated wirelss channel, which has a 5 kHz bandwidth, measured100 meters from the tower is 70 dB. The desired range for a cell is 1 km. Can a digital cellphone system bedesigned according to these criteria?Problem 6.30: Optimial Ethernet Random Access ProtocolsAssume a population of N computers want to transmit information on a random access channel. The accessalgorithm works as follows.
• Before transmitting, ip a coin that has probability p of coming up heads• If only one of the N computer's coins comes up heads, its transmission occurs successfully, and the
others must wait until that transmission is complete and then resume the algorithm.• If none or more than one head comes up, the N computers will either remain silent (no heads) or a
collision will occur (more than one head). This unsuccessful transmission situation will be detectedby all computers once the signals have propagated the length of the cable, and the algorithm resumes(return to the beginning).
a) What is the optimal probability to use for ipping the coin? In other words, what should p be tomaximize the probability that exactly one computer transmits?
b) What is the probability of one computer transmitting when this optimal value of p is used as thenumber of computers grows to innity?
c) Using this optimal probability, what is the average number of coin ips that will be necessary to resolvethe access so that one computer successfully transmits?
d) Evaluate this algorithm. Is it realistic? Is it ecient?
Problem 6.31: RepeatersBecause signals attenuate with distance from the transmitter, repeaters are frequently employed for bothanalog and digital communication. For example, let's assume that the transmitter and receiver are D mapart, and a repeater is positioned halfway between them (Figure 6.44). What the repater does is amplifyits received signal to exactly cancel the attenuation encountered along the rst leg and to re-transmit thesignal to the ultimate receiver. However, the signal the repeater receives contains white noise as well as thetransmitted signal. The receiver experiences the same amount of white noise as the repeater.
DD/2 D/2
transmitter repeater receiver
Figure 6.44

271
a) What is the block diagram for this system?b) For an amplitude-modulation communication system, what is the signal-to-noise ratio of the demodu-
lated signal at the receiver? Is this better or worse than the signal-to-noise ratio when no repeater ispresent?
c) For digital communication, we must consider the system's capacity. Is the capacity larger with therepeater system than without it? If so, when; if not, why not?

272 CHAPTER 6. INFORMATION COMMUNICATION
Solutions to Exercises in Chapter 6
Solution to Exercise 6.1 (p. 214)In both cases, the answer depends less on geometry than on material properties. For coaxial cable, c = 1√
µdεd.
For twisted pair, c = 1√µε
√arccosh( d
2r )δ2r +arccosh( d
2r ) .
Solution to Exercise 6.2 (p. 214)You can nd these frequencies from the spectrum allocation chart (Section 7.3). Light in the middle of thevisible band has a wavelength of about 600 nm, which corresponds to a frequency of 5 × 10¹⁴Hz. Cabletelevision transmits within the same frequency band as broadcast television (about 200 MHz or 2× 10⁸Hz).Thus, the visible electromagnetic frequencies are over six orders of magnitude higher!
Solution to Exercise 6.3 (p. 215)
As frequency increases,(2πf
∼C
∼G)and
(2πf
∼L
∼R). In this high-frequency region,
γ = j2πf
√∼L∼C
√√√√(1 +∼G
j2πf∼C
)(1 +
∼R
j2πf∼L
)(6.65)
≈ j2πf
√∼L∼C
(1 +
12
1j2πf
( ∼G∼C
+∼R∼L
))
≈ j2πf
√∼L∼C +
12
∼G
√√√√ ∼L∼C
+∼R
√√√√ ∼C∼L
Thus, the attenuation (space) constant equals the real part of this expression, and equals a (f) =
∼GZ0+
∼R
Z02 .
Solution to Exercise 6.4 (p. 215)As shown previously (6.11), voltages and currents in a wireline channel, which is modeled as a transmissionline having resistance, capacitance and inductance, decay exponentially with distance. The inverse-square lawgoverns free-space propagation because such propagation is lossless, with the inverse-square law a consequenceof the conservation of power. The exponential decay of wireline channels occurs because they have lossesand some ltering.
Solution to Exercise 6.5 (p. 217)
Rh1 h2
RR
d1 d2
Figure 6.45
Use the Pythagorean Theorem, (h + R)2 = R2 +d2, where h is the antenna height, d is the distance fromthe top of the earth to a tangency point with the earth's surface, and R the earth's radius. The line-of-sightdistance between two earth-based antennae equals
dLOS =√
2h1R + h12 +
√2h2R + h2
2 (6.66)

273
As the earth's radius is much larger than the antenna height, we have to a good approximation that dLOS =√2h1R +
√2h2R . If one antenna is at ground elevation, say h2 = 0 , the other antenna's range is
√2h1R.
Solution to Exercise 6.6 (p. 217)As frequency decreases, wavelength increases and can approach the distance between the earth's surface andthe ionosphere. Assuming a distance between the two of 80 km, the relation λf = c gives a correspondingfrequency of 3.75 kHz. Such low carrier frequencies would be limited to low bandwidth analog communicationand to low datarate digital communications. The US Navy did use such a communication scheme to reachall of its submarines at once.
Solution to Exercise 6.7 (p. 218)Transmission to the satellite, known as the uplink, encounters inverse-square law power losses. Reectingo the ionosphere not only encounters the same loss, but twice. Reection is the same as transmittingexactly what arrives, which means that the total loss is the product of the uplink and downlink losses. Thegeosynchronous orbit lies at an altitude of 35700km. The ionosphere begins at an altitude of about 50 km.The amplitude loss in the satellite case is proportional to 2.8 × 10⁻⁸; for Marconi, it was proportional to4.4× 10−10. Marconi was very lucky.
Solution to Exercise 6.8 (p. 218)If the interferer's spectrum does not overlap that of our communications channelthe interferer is out-of-bandwe need only use a bandpass lter that selects our transmission band and removes other portions ofthe spectrum.
Solution to Exercise 6.9 (p. 219)The additive-noise channel is not linear because it does not have the zero-input-zero-output property (eventhough we might transmit nothing, the receiver's input consists of noise).
Solution to Exercise 6.10 (p. 222)The signal-related portion of the transmitted spectrum is given by X (f) = 1
2M (f − fc) + 12M (f + fc).
Multiplying at the receiver by the carrier shifts this spectrum to +fc and to −fc, and scales the result byhalf.
12X (f − fc) + 1
2X (f + fc) = 14 (M (f − 2fc) + M (f)) + 1
4 (M (f + 2fc) + M (f))
= 14M (f − 2fc) + 1
2M (f) + 14M (f + 2fc)
(6.67)
The signal components centered at twice the carrier frequency are removed by the lowpass lter, while thebaseband signal M (f) emerges.
Solution to Exercise 6.11 (p. 222)The key here is that the two spectra M (f − fc), M (f + fc) do not overlap because we have assumedthat the carrier frequency fc is much greater than the signal's highest frequency. Consequently, the termM (f − fc) M (f + fc) normally obtained in computing the magnitude-squared equals zero.
Solution to Exercise 6.12 (p. 224)Separation is 2W . Commercial AM signal bandwidth is 5kHz. Speech is well contained in this bandwidth,much better than in the telephone!
Solution to Exercise 6.13 (p. 224)x (t) =
∑∞n=−∞
(sb(n) (t− nT )
).
Solution to Exercise 6.14 (p. 226)k = 4.
Solution to Exercise 6.15 (p. 226)
x (t) =∑
n
((−1)b(n)
ApT (t− nT ) sin(
2πkt
T
))

274 CHAPTER 6. INFORMATION COMMUNICATION
Solution to Exercise 6.16 (p. 226)The harmonic distortion is 10%.
Solution to Exercise 6.17 (p. 226)Twice the baseband bandwidth because both positive and negative frequencies are shifted to the carrier bythe modulation: 3R.
Solution to Exercise 6.18 (p. 229)In BPSK, the signals are negatives of each other: s1 (t) = − (s0 (t)). Consequently, the output of eachmultiplier-integrator combination is the negative of the other. Choosing the largest therefore amounts tochoosing which one is positive. We only need to calculate one of these. If it is positive, we are done. If it isnegative, we choose the other signal.
Solution to Exercise 6.19 (p. 229)
The matched lter outputs are ±(
A2T2
)because the sinusoid has less power than a pulse having the same
amplitude.
Solution to Exercise 6.20 (p. 231)The noise-free integrator outputs dier by αA2T , the factor of two smaller value than in the baseband casearising because the sinusoidal signals have less energy for the same amplitude. Stated in terms of Eb, thedierence equals 2αEb just as in the baseband case.
Solution to Exercise 6.21 (p. 232)The noise-free integrator output dierence now equals αA2T = αEb
2 . The noise power remains the same as
in the BPSK case, which from the probability of error equation (6.46) yields pe = Q(√
α2Eb
N0
).
Solution to Exercise 6.22 (p. 234)Equally likely symbols each have a probability of 1
K . Thus, H (A) = −(∑
k
(1K log2
(1K
)))=
log2 K. To prove that this is the maximum-entropy probability assignment, we must explic-itly take into account that probabilities sum to one. Focus on a particular symbol, saythe rst. Pr [a0] appears twice in the entropy formula: the terms Pr [a0] log2 (Pr [a0]) and(1− (Pr [a0] + · · ·+ Pr [aK−2])) log2 (1− (Pr [a0] + · · ·+ Pr [aK−2])). The derivative with respect tothis probability (and all the others) must be zero. The derivative equals log2 (Pr [a0]) −log2 (1− (Pr [a0] + · · ·+ Pr [aK−2])), and all other derivatives have the same form (just substitute yourletter's index). Thus, each probability must equal the others, and we are done. For the minimum entropyanswer, one term is 1 log2 1 = 0, and the others are 0 log2 0, which we dene to be zero also. The minimumvalue of entropy is zero.
Solution to Exercise 6.23 (p. 237)The Human coding tree for the second set of probabilities is identical to that for the rst (Figure 6.18(Human Coding Tree)). The average code length is 1
21+ 142+ 1
53+ 1203 = 1.75 bits. The entropy calculation
is straightforward: H (A) = −(
12 log
(12
)+ 1
4 log(
14
)+ 1
5 log(
15
)+ 1
20 log(
120
)), which equals 1.68 bits.
Solution to Exercise 6.24 (p. 237)T = 1
B(A)R.
Solution to Exercise 6.25 (p. 238)Because no codeword begins with another's codeword, the rst codeword encountered in a bit stream mustbe the right one. Note that we must start at the beginning of the bit stream; jumping into the middle doesnot guarantee perfect decoding. The end of one codeword and the beginning of another could be a codeword,and we would get lost.
Solution to Exercise 6.26 (p. 238)Consider the bitstream . . .0110111. . . taken from the bitstream 0|10|110|110|111|. . .. We would decode theinitial part incorrectly, then would synchronize. If we had a xed-length code (say 00,01,10,11), the situationis much worse. Jumping into the middle leads to no synchronization at all!

275
Solution to Exercise 6.27 (p. 241)This question is equivalent to 3pe (1− pe) + pe
2 ≤ 1 or 2pe2 + (−3) pe + 1 ≥ 0. Because this is an upward-
going parabola, we need only check where its roots are. Using the quadratic formula, we nd that they arelocated at 1
2 and 1. Consequently in the range 0 ≤ pe ≤ 12 the error rate produced by coding is smaller.
Solution to Exercise 6.28 (p. 242)With no coding, the average bit-error probability pe is given by the probability of error equation (6.47):
pe = Q(√
2α2Eb
N0
). With a threefold repetition code, the bit-error probability is given by 3p′e
2 (1− p′e)+p′e3,
where p′e = Q(√
2α2Eb
3N0
). Plotting this reveals that the increase in bit-error probability out of the channel
because of the energy reduction is not compensated by the repetition coding.
Figure 6.46
Solution to Exercise 6.29 (p. 243)In binary arithmetic (see Figure 6.23), adding 0 to a binary value results in that binary value while adding1 results in the opposite binary value.

276 CHAPTER 6. INFORMATION COMMUNICATION
Solution to Exercise 6.30 (p. 245)
dmin = 2n + 1
Solution to Exercise 6.31 (p. 245)When we multiply the parity-check matrix times any codeword equal to a column of G, the result consistsof the sum of an entry from the lower portion of G and itself that, by the laws of binary arithmetic, is alwayszero.
Because the code is linearsum of any two codewords is a codewordwe can generate all codewords assums of columns of G. Since multiplying by H is also linear, Hc = 0.
Solution to Exercise 6.32 (p. 246)In binary arithmetic see this table53, adding 0 to a binary value results in that binary value while adding 1results in the opposite binary value.
Solution to Exercise 6.33 (p. 246)
The probability of a single-bit error in a length-N block is Npe(1− pe)N−1 and a triple-bit error has
probability(N3
)pe
3(1− pe)N−3. For the rst to be greater than the second, we must have
pe <1√
(N−1)(N−2)6 + 1
For N = 7, pe < 0.31.
Solution to Exercise 6.34 (p. 248)
In a length-N block, N single-bit and N(N−1)2 double-bit errors can occur. The number of non-zero vectors
resulting from Hc must equal or exceed the sum of these two numbers.
2N−K − 1 ≥ N +N (N − 1)
2or 2N−K ≥ N2 + N + 2
2(6.68)
The rst two solutions that attain equality are (5,1) and (90,78) codes. However, no perfect code exists otherthan the single-bit error correcting Hamming code. (Perfect codes satisfy relations like (6.68) with equality.)
Solution to Exercise 6.35 (p. 250)To convert to bits/second, we divide the capacity stated in bits/transmission by the bit interval duration
T .
Solution to Exercise 6.36 (p. 252)The network entry point is the telephone handset, which connects you to the nearest station. Dialing thetelephone number informs the network of who will be the message recipient. The telephone system forms anelectrical circuit between your handset and your friend's handset. Your friend receives the message via thesame devicethe handsetthat served as the network entry point.
Solution to Exercise 6.37 (p. 255)The transmitting op-amp sees a load or (Rout + Z0 ‖ Rout/N), where N is the number of transceivers otherthan this one attached to the coaxial cable. The transfer function to some other transceiver's receiver circuitis Rout divided by this load.
Solution to Exercise 6.38 (p. 256)The worst-case situation occurs when one computer begins to transmit just before the other's packet arrives.Transmitters must sense a collision before packet transmission ends. The time taken for one computer'spacket to travel the Ethernet's length and for the other computer's transmission to arrive equals the round-trip, not one-way, propagation time.
53"Error Correction" <http://cnx.org/content/m0095/latest/#table1>

277
Solution to Exercise 6.39 (p. 256)The cable must be a factor of ten shorter: It cannot exceed 100 m. Dierent minimum packet sizes meansdierent packet formats, making connecting old and new systems together more complex than need be.
Solution to Exercise 6.40 (p. 257)When you pick up the telephone, you initiate a dialog with your network interface by dialing the number.The network looks up where the destination corresponding to that number is located, and routes the callaccordingly. The route remains xed as long as the call persists. What you say amounts to high-levelprotocol while establishing the connection and maintaining it corresponds to low-level protocol.

278 CHAPTER 6. INFORMATION COMMUNICATION

Chapter 7
Appendix
7.1 Decibels1
The decibel scale expresses amplitudes and power values logarithmically. The denitions for these dier,but are consistent with each other.
power (s, in decibels) = 10 log10
(power (s)power (s0)
)(7.1)
amplitude (s, in decibels) = 20 log10
(amplitude (s)amplitude (s0)
)Here power (s0) and amplitude (s0) represent a reference power and amplitude, respectively. Quantifying
power or amplitude in decibels essentially means that we are comparing quantities to a standard or that wewant to express how they changed. You will hear statements like "The signal went down by 3 dB" and "Thelter's gain in the stopband is −60" (Decibels is abbreviated dB.).
Exercise 7.1 (Solution on p. 283.)
The prex "deci" implies a tenth; a decibel is a tenth of a Bel. Who is this measure named for?
The consistency of these two denitions arises because power is proportional to the square of amplitude:(power (s) ∝ amplitude2 (s)
)(7.2)
Plugging this expression into the denition for decibels, we nd that
10 log10
(power(s)power(s0)
)= 10 log10
(amplitude2(s)amplitude2(s0)
)= 20 log10
(amplitude(s)amplitude(s0)
) (7.3)
Because of this consistency, stating relative change in terms of decibels is unambiguous. A factor of 10increase in amplitude corresponds to a 20 dB increase in both amplitude and power!
The accompanying table provides "nice" decibel values. Converting decibel values back and forth is fun,and tests your ability to think of decibel values as sums and/or dierences of the well-known values and ofratios as products and/or quotients. This conversion rests on the logarithmic nature of the decibel scale.For example, to nd the decibel value for
√2, we halve the decibel value for 2; 26 dB equals 10 + 10 + 6 dB
that corresponds to a ratio of 10× 10× 4 = 400. Decibel quantities add; ratio values multiply.One reason decibels are used so much is the frequency-domain input-output relation for linear systems:
Y (f) = X (f) H (f). Because the transfer function multiplies the input signal's spectrum, to nd the outputamplitude at a given frequency we simply add the lter's gain in decibels (relative to a reference of one) to theinput amplitude at that frequency. This calculation is one reason that we plot transfer function magnitudeon a logarithmic vertical scale expressed in decibels.
1This content is available online at <http://cnx.org/content/m0082/2.16/>.
279

280 CHAPTER 7. APPENDIX
Decibel table
Power Ratio dB
1 0√
2 1.5
2 3√
10 5
4 6
5 7
8 9
10 10
0.1 −10
Figure 7.1: Common values for the decibel. The decibel values for all but the powers of ten areapproximate, but are accurate to a decimal place.
7.2 Permutations and Combinations2
7.2.1 Permutations and Combinations
The lottery "game" consists of picking k numbers from a pool of n. For example, you select 6 numbers outof 60. To win, the order in which you pick the numbers doesn't matter; you only have to choose the right setof 6 numbers. The chances of winning equal the number of dierent length-k sequences that can be chosen.A related, but dierent, problem is selecting the batting lineup for a baseball team. Now the order matters,and many more choices are possible than when order does not matter.
Answering such questions occurs in many applications beyond games. In digital communications, forexample, you might ask how many possible double-bit errors can occur in a codeword. Numbering the bitpositions from 1 to N , the answer is the same as the lottery problem with k = 6. Solving these kind ofproblems amounts to understanding permutations - the number of ways of choosing things when ordermatters as in baseball lineups - and combinations - the number of ways of choosing things when order doesnot matter as in lotteries and bit errors.
Calculating permutations is the easiest. If we are to pick k numbers from a pool of n, we have n choicesfor the rst one. For the second choice, we have n − 1. The number of length-two ordered sequences istherefore be n (n− 1). Continuing to choose until we make k choices means the number of permutationsis n (n− 1) (n− 2) . . . (n− k + 1). This result can be written in terms of factorials as n!
(n−k)! , with n! =n (n− 1) (n− 2) . . . 1. For mathematical convenience, we dene 0! = 1.
When order does not matter, the number of combinations equals the number of permutations divided bythe number of orderings. The number of ways a pool of k things can be ordered equals k!. Thus, once wechoose the nine starters for our baseball game, we have 9! = 362, 880 dierent lineups! The symbol for thecombination of k things drawn from a pool of n is
(nk
)and equals n!
(n−k)!k! .
2This content is available online at <http://cnx.org/content/m10262/2.12/>.

281
Exercise 7.2 (Solution on p. 283.)
What are the chances of winning the lottery? Assume you pick 6 numbers from the numbers 1-60.Combinatorials occur in interesting places. For example, Newton derived that the n-th power of a sumobeyed the formula (x + y)n =
(n0
)xn +
(n1
)xn−1y +
(n2
)xn−2y2 + · · ·+
(nn
)yn.
Exercise 7.3 (Solution on p. 283.)
What does the sum of binomial coecients equal? In other words, what is
n∑k=0
(n
k
)
A related problem is calculating the probability that any two bits are in error in a length-n codeword whenp is the probability of any bit being in error. The probability of any particular two-bit error sequence isp2(1− p)n−2. The probability of a two-bit error occurring anywhere equals this probability times the numberof combinations:
(n2
)p2(1− p)n−2. Note that the probability that zero or one or two, etc. errors occurring
must be one; in other words, something must happen to the codeword! That means that we must have(n0
)(1− p)n +
(n1
)p(1− p)n−1 +
(n2
)p2(1− p)n−2 + · · ·+
(nn
)pn = 1. Can you prove this?
7.3 Frequency Allocations3
To prevent radio stations from transmitting signals "on top of each other,"; the United States and othernational governments in the 1930s began regulating the carrier frequencies and power outputs stations coulduse. With increased use of the radio spectrum for both public and private use, this regulation has becomeincreasingly important. This is the so-called Frequency Allocation Chart, which shows what kinds ofbroadcasting can occur in which frequency bands. Detailed radio carrier frequency assignments are muchtoo detailed to present here.
3This content is available online at <http://cnx.org/content/m0083/2.10/>.

282 CHAPTER 7. APPENDIX
Frequency Allocation Chart
U.S. D
EPA
RTM
EN
T O
F C
OM
M
ER
CE
NATIONAL TELECO
M
M
UN
ICA
TIO
NS &
INFO
RM
ATIO
N ADMINISTRATIO
N
MOBILE(AERONAUTICAL TELEMETERING)
S)
5.685.73
5.95
6.2
6.525
6.6856.765
7.0
7.1
7.3
8.18.195
8.815
8.9659.040
9.5
9.99.99510.00310.00510.110.15
11.17511.27511.4
11.65
12.05
12.23
13.213.2613.3613.4113.6
13.814.0
14.2514.35
14.99015.00515.01015.10
15.6
16.36
17.4117.55
17.917.9718.0318.06818.16818.7818.9
19.6819.8019.99019.99520.00520.010
21.0
21.4521.8521.92422.0
22.85523.023.223.35
24.8924.9925.005
25.0125.0725.2125.3325.5525.6726.126.17526.4826.9526.9627.2327.4127.5428.0
29.729.829.8929.9130.0
UNITED
STATES
THE RADIO SPECTRUM
NO
N-G
OVER
NM
ENT EXC
LUSIVE
GO
VERN
MEN
T/NO
N-G
OVER
NM
ENT SH
ARED
GO
VERN
MEN
T EXCLU
SIVE
RA
DIO
SE
RV
ICE
S C
OL
OR
LE
GE
ND
AC
TIV
ITY
CO
DE
NO
T A
LL
OC
AT
ED
RA
DIO
NA
VIG
AT
ION
FIX
ED
MA
RIT
IME
MO
BIL
EF
IXE
D
MA
RIT
IME
MO
BIL
E
FIX
ED
MA
RIT
IME
MO
BIL
E
Ra
dio
loca
tion
RA
DIO
NAV
IGAT
ION
FIX
ED
MA
RIT
IME
MO
BIL
E
Ra
dio
loca
tion
FIX
ED
MA
RIT
IME
MO
BIL
EF
IXE
D
MA
RIT
IME
MO
BIL
E
AE
RO
NA
UT
ICA
LR
AD
ION
AV
IGA
TIO
N
AERONAUTICALRADIONAVIGATION
AeronauticalMobile
MaritimeRadionavigation(Radio Beacons)
MARITIMERADIONAVIGATION(RADIO BEACONS)
AeronauticalRadionavigation(Radio Beacons)
3
9
14
19.95
20.05
30
30
59
61
70
90
110
130
160
190
200
275
285
300
3 kHz
300 kHz
300 kHz
3 MHz
3 MHz
30 MHz
30 MHz
300 MHz
3 GHz
300 GHz
300 MHz
3 GHz
30 GHz
Aeronautical
Radionavigation
(Radio B
eacons)
MA
RIT
IME
RA
DIO
NAV
IGAT
ION
(RA
DIO
BE
AC
ON
S)
AeronauticalMobile
MaritimeRadionavigation(Radio Beacons)
AERONAUTICALRADIONAVIGATION(RADIO BEACONS)
AE
RO
NA
UT
ICA
LR
AD
ION
AVIG
ATIO
N(R
AD
IO B
EA
CO
NS
)
AeronauticalM
obile
Aeronautical Mobile RADIONAVIGATION
AERONAUTICALRADIONAVIGATION
MARITIMEMOBILE
Aeronautical
Radionavigation
MOBILE (DISTRESS AND CALLING)
MARITIME MOBILE
MARITIMEMOBILE
(SHIPS ONLY)
MOBILE
AERONAUTICALRADIONAVIGATION(RADIO BEACONS)
AERONAUTICALRADIONAVIGATION(RADIO BEACONS)
BR
OA
DC
AS
TIN
G(A
M R
AD
IO)
MARITIME MOBILE (TELEPHONY)
MARITIME MOBILE (TELEPHONY) MOBILE (DISTRESS AND CALLING)
MA
RIT
IME
MO
BILE
LAN
D M
OB
ILE
MO
BILE
FIX
ED
STANDARD FREQ. AND TIME SIGNAL (2500kHz)
STANDARD FREQ. AND TIME SIGNAL
Space Research
MA
RIT
IME
MO
BILE
LAN
D M
OB
ILE
MO
BILE
FIX
ED
AERONAUTICALMOBILE (R)
STANDARD FREQ.
AERONAUTICAL MOBILE (R)
AERONAUTICALMOBILE (OR)
AERONAUTICALMOBILE (R)
FIX
ED
MO
BILE
**
Radio-
location
FIXEDMOBILE*
AM
ATE
UR
FIXED
FIXED
FIXED
FIXED
FIX
ED
FIXED
MARITIME MOBILE
MA
RIT
IME
MO
BILE
MOBILE*
MOBILE*
MOBILE
STANDARD FREQ. AND TIME SIGNAL (5000 KHZ)
AERONAUTICAL MOBILE (R)
AERONAUTICAL MOBILE (OR)
STANDARD FREQ. Space Research
MO
BILE
**
AERONAUTICAL MOBILE (R)
AERONAUTICAL MOBILE (OR)
FIXEDMOBILE*
BROADCASTING
MARITIME MOBILE
AERONAUTICAL MOBILE (R)
AERONAUTICAL MOBILE (OR)
FIXEDMobile
AMATEUR SATELLITEAMATEUR
AMATEUR
FIX
ED
Mobile
FIXEDMARITIME MOBILE
MA
RIT
IME
MO
BILE
AERONAUTICAL MOBILE (R)AERONAUTICAL MOBILE (OR)
FIX
ED
BROADCASTING
FIXEDSTANDARD FREQ. AND TIME SIGNAL (10,000 kHz)STANDARD FREQ. Space Research
AERONAUTICAL MOBILE (R)AMATEUR
FIX
ED
Mobile*
AERONAUTICAL MOBILE (R)AERONAUTICAL MOBILE (OR)
FIXED
FIXED
BROADCASTING
MA
RIT
IME
MO
BILE
AERONAUTICAL MOBILE (R)AERONAUTICAL MOBILE (OR)
RADIO ASTRONOMYFIXED Mobile*
AMATEUR
BROADCASTING
AMATEUR AMATEUR SATELLITE
Mobile*FIXED
BROADCASTING
STANDARD FREQ. AND TIME SIGNAL (15,000 kHz)STANDARD FREQ. Space Research
FIX
ED
AERONAUTICAL MOBILE (OR)
MA
RIT
IME
MO
BILE
AERONAUTICAL MOBILE (OR)AERONAUTICAL MOBILE (R)
FIXED
FIXED
BROADCASTING
STANDARD FREQ. Space Research
FIXED
MARITIME MOBILE
Mobile
FIXED
FIXED
AMATEUR AMATEUR SATELLITE
BROADCASTINGFIXED
AERONAUTICAL MOBILE (R)
MARITIME MOBILE
FIXEDFIXED
FIXED
Mobile*
MOBILE**
FIXED
STANDARD FREQ. AND TIME SIGNAL (25,000 kHz)
STANDARD FREQ. Space Research
LAND MOBILEMARITIME MOBILE
LAND MOBILE MOBILE**
RADIO ASTRONOMYBROADCASTING
MARITIME MOBILE LAND MOBILE
FIXED MOBILE**FIXED
MOBILE**
MOBILE
FIXED
FIXED
FIXEDFIXED
FIXED
LAND MOBILE
MOBILE**
AMATEUR AMATEUR SATELLITE
MOBILE
LAND MOBILE
MOBILE
MOBILE
FIXED
FIXED
MOBILE
MOBILE
FIXED
FIXED
LAN
DM
OB
ILELA
ND
MO
BILE
LAN
DM
OB
ILE
LAND MOBILERadio Astronomy
RADIO ASTRONOMYLAND MOBILE
FIXEDFIXED
MOBILEMOBILE
MO
BILE
LAND MOBILE
FIX
ED
LAN
DM
OB
ILE
FIXED
FIXED
MOBILE
MOBILE
LAN
DM
OB
ILEA
MAT
EU
RB
RO
AD
CA
ST
ING
(TV
CH
AN
NE
LS 2-4)
FIXED MOBILE
FIXED MOBILE
FIXED MOBILEFIXED MOBILE
AERONAUTICAL RADIONAVIGATION
BR
OA
DC
AS
TIN
G(T
V C
HA
NN
ELS
5-6)B
RO
AD
CA
ST
ING
(FM
RA
DIO
)A
ER
ON
AU
TIC
AL
RA
DIO
NA
VIG
ATIO
N
AERONAUTICALMOBILE (R)
AERONAUTICAL MOBILEAERONAUTICAL MOBILE
AERONAUTICALMOBILE (R)
AERONAUTICALMOBILE (R)
AERONAUTICAL MOBILE (R)AERONAUTICAL
MOBILE (R)Space Operations
(S-E)Met. Satellite
(S-E)Space Research
(S-E)
MO
BILE
FIX
ED
FIXED MOBILE
AMATEUR AMATEUR SATELLITE
AMATEUR
BR
OA
DC
AS
TIN
G(T
V C
HA
NN
ELS
7-13)
MO
BILE
FIX
ED
MO
BILE
FIX
ED
MO
BILE
SAT
ELLIT
E
FIX
ED
MO
BILE
SAT
ELLIT
E
MO
BILE
FIX
ED
MO
BILE
SAT
ELLIT
E
MO
BILE
FIXED MOBILE
AERONAUTICAL RADIONAVIGATION
STD. FREQ. & TIME SIGNAL SAT. (400.1 MHz)
MET. AIDS(Radiosonde)
MET. SAT.(S-E)
SPACE RES.(S-E)
SPACE OPN.Space to Earth
Met. Satellite(E-S)
Earth Expl.Satellite (E-S)
MOBILE SATELLITE (E-S)
FIXED MOBILERADIOASTRONOMY
RA
DIO
LOC
AT
ION
Am
ateur
LAND MOBILE
LAND MOBILE MeteorologicalSatellite (S-E)
LAN
D M
OB
ILE
BR
OA
DC
AS
TIN
G(T
V C
HA
NN
ELS
14-20)
BR
OA
DC
AS
TIN
G(T
V C
HA
NN
ELS
21-36)B
RO
AD
CA
ST
ING
(TV
CH
AN
NE
LS 38-69)
RADIO ASTRONOMY
LAN
D M
OB
ILE
RADIOLOCATION
FIXED
Amateur
AE
RO
NA
UT
ICA
LR
AD
ION
AV
IGAT
ION
MOBILE SATELLITE (E-S)
FIX
ED
MOBILE**FIXED
FIXED
Mobile
Radiolocation
AERO
NAU
TICAL
RAD
ION
AVIGATIO
N
METEO
RO
LOG
ICAL
AIDS
Radiolocation
RadiolocationMARITIME
RADIONAVIGATION
MARITIMERADIONAVIGATION
Radiolocation
Radiolocation
Radiolocation
RA
DIO
-LO
CAT
ION
RA
DIO
-LO
CAT
ION
Am
ateur
AERONAUTICALRADIONAVIGATION
(Ground)
RADIO-LOCATION
Radio-location
AERO. RADIO-NAV.(Ground)
FIXED SAT. (S-E)
RADIO-LOCATION
Radio-location
FIX
ED
FIX
ED
SAT
ELLIT
E(S
-E)
FIXED
AERONAUTICAL RADIONAVIGATION
MOBILE
FIXED MOBILE
RADIO ASTRONOMY Space Research (Passive)
AERONAUTICAL RADIONAVIGATION
RADIO-LOCATION
Radio-location
RADIONAVIGATION
Radiolocation
RADIOLOCATION Radiolocation
Radiolocation
Radiolocation
RADIOLOCATIONRADIO-
LOCATION
MARITIMERADIONAVIGATION
MARITIMERADIONAVIGATION
METEOROLOGICALAIDS
Amateur
AmateurFIXEDSATELLITE (E-S)
FIXED
FIXEDSATELLITE
(E-S)
FIXEDSATELLITE (E-S) MOBILE
FIXEDSATELLITE (E-S)
FIXEDSATELLITE (E-S)MOBILE
FIXED
FIXED
FIXED
FIXED
MOBILE
FIXED SPACE RESEARCH (E-S)FIXED
FixedMOBILESATELLITE (S-E)
FIXED SATELLITE (S-E)
FIXED SATELLITE (S-E)
FIXEDSATELLITE (S-E)
FIXEDSATELLITE (S-E)
FIXEDSATELLITE (E-S)
FIXEDSATELLITE (E-S)
FIXEDSATELLITE
(E-S)FIXED
SATELLITE(E-S)
FIXED
FIXED
FIXED
FIXED
FIXED
FIXED
FIXED
MET.SATELLITE (S-E)
MobileSatellite (S-E)Mobile
Satellite (S-E)
MobileSatellite (E-S)(no airborne)
Mobile Satellite(E-S)(no airborne)
Mobile Satellite (S-E)
MobileSatellite (E-S)
MOBILESATELLITE (S-E)
EARTH EXPL.SATELLITE(S-E)
EARTH EXPL.SAT. (S-E)
EARTH EXPL.SATELLITE (S-E)
MET.SATELLITE
(E-S)
FIXED
FIXED
SPACE RESEARCH (S-E)(deep space only)
SPACE RESEARCH (S-E)
AERONAUTICALRADIONAVIGATION
RADIOLOCATION Radiolocation
Radiolocation
Radiolocation
Radiolocation
MARITIMERADIONAVIGATION
MeteorologicalAidsRADIONAVIGATION
RADIOLOCATION Radiolocation
RADIO-LOCATION
RADIO-LOCATION
Radiolocation Amateur
Amateur AmateurSatellite
RADIOLOCATIONFIXED
FIXED
FIXE
D
FIXED
FIXE
DS
ATELLITE
(S-E
)
FIXE
DS
ATELLITE
(S-E
)
Mobile **
SPACE RESEARCH(Passive)
EARTH EXPL.SAT. (Passive)
RADIOASTRONOMY
SPACERESEARCH (Passive)
EARTH EXPL.SATELLITE (Passive)
RADIOASTRONOMY
BROADCASTINGSATELLITE
AERONAUTICAL RADIONAV. Space Research (E-S)
SpaceResearch
Land MobileSatellite (E-S)
Radio-location
RADIO-LOCATION
RADIONAVIGATION
FIXED SATELLITE (E-S) Land Mobile Satellite (E-S)
Land MobileSatellite (E-S)Fixed Mobile FIXED
SAT. (E-S)
Fixed
MobileFIXED
MobileFIXED
MOBILE
SpaceResearch
Space Research
Space Research
SPACE RESEARCH(Passive)RADIO ASTRONOMY EARTH EXPL. SAT.
(Passive)
RADIOLOCATION Radiolocation
RADIO-LOCATION
Radio-location
Radio-location
RADIOLOCATION Radiolocation
Radiolocation
Space Research(E-S) (deep space)
Space Res.(Active)
Earth Expl.Satellite (Active)
FIXED SATELLITE (S-E)
FIXED SATELLITE (E-S)
FIXED SAT. (E-S) (S-E)
FIXEDSAT. (S-E)
FIXEDSATELLITE
(S-E)
FIXEDSATELLITE
(S-E)
EARTH EXPL.SAT. (Passive)
FIXED
FIXED
FIXED
FIXED
FIXE
D
MO
BILE
FIXE
DS
ATELLITE
(S-E
)
MOBILE
MOBILE
MOBILESATELLITE
(S-E)
MOBILESATELLITE (S-E)
StandardFrequency and
Time SignalSatellite (S-E)
MOBILE* *
MOBILE EARTH EXPL.SAT. (Passive)
SPACE RES.(Passive)
MOBILE
FIXED
FIXED MOBILE
FIXED MOBILE**
RADIOASTRONOMY
MOBILE
EARTH EXPL.SAT. (Passive)
SPACERESEARCH
(Passive)
MOBILE* *
RADIOASTRONOMY
AMATEUR
Amateur
INTER-SATELLITEFIXED
EARTH EXPL.SAT. (Passive)
AMATEUR SATELLITE
Radio-location
Earth Expl.Satellite (Active)
RADIO-LOCATION
StandardFrequency and
Time SignalSatellite (E-S)
EarthExploration
Satellite(S-S)
MOBILEFIXED
MOBILEFIXEDEarth
ExplorationSatellite (S-S)
FIXE
D
MO
BILE
FIXE
DS
ATELLITE
(S-E
)
FIXED SATELLITE (E-S) MOBILE SATELLITE (E-S)
FIXEDSATELLITE
(E-S)
MOBILESATELLITE
(E-S)
StandardFrequency and
Time SignalSatellite (S-E)
Stand. Frequencyand Time SignalSatellite (S-E)
FIXED MOBILE
RADIOASTRONOMY
SPACERESEARCH
(Passive)
EARTHEXPLORATIONSAT. (Passive)
RADIONAVIGATION
RADIONAVIGATION INTER-SATELLITE
RADIONAVIGATION
RADIOLOCATION Radiolocation
SPA
CE
RE
SE
AR
CH
(Passive)
EARTHEXPLO
RATIO
NSATELLITE
(Passive)
FIXE
D
MO
BILE
FIXED MOBILE
FIXED
MOBILE
FIXED
FIXED
MOBILE* *
MOBILE
MOBILE
Mobile
Fixed
FIXED
FIXEDSATELLITE (S-E)
FIXE
DS
ATELLITE
(S-E
)
FIXEDSATELLITE
(S-E)
MOBILESATELLITE
(S-E)
MO
BILE
SATE
LLITE(S
-E)
/BR
OA
D-
CA
STIN
G/
BR
OA
D-
CA
STIN
GS
ATELLITE
FIXEDSATELLITE
(E-S)RADIO
ASTRONOMY
MO
BILE
SATE
LLITE(E
-S)
FIXE
DS
ATELLITE
(E-S
)
FIXED
MOBILE
MOBILE
RADIO-NAVIGATION
RADIO-NAVIGATIONSATELLITE
MOBILESATELLITE
(E-S)
FIXE
DS
ATELLITE
(E-S
)
MO
BILE
FIXE
D
SPACERESEARCH
EARTHEXPLORATION
SATELLITEFI XED
SATELLITE (E-S)
Mobile
MOBILESATELLITE (E-S)
MO
BILE
FIXE
D
SPA
CE
RE
SE
AR
CH
(Passive)
RA
DIO
AS
TRO
NO
MY
SPA
CE
RE
SE
AR
CH
(Passive)
EA
RTH
EX
PLO
RATIO
NS
ATELLITE
(Passive)
INTE
R-
SATE
LLITE
EA
RTH
EX
PLO
RATIO
NS
ATELLITE
(Passive)
EARTHEXPLORATIONSAT. (Passive)
RADIOASTRONOMY
SPACERESEARCH
(Passive)M
OB
ILE
FIXE
D
INTE
R-
SATE
LLITE
RA
DIO
-LO
CATIO
N
EARTHEXPLORATIONSAT. (Passive)
RADIOASTRONOMY
SPACERESEARCH
(Passive)
SPACERESEARCH
MOBILE
Fixed
MO
BILE
FIXE
D
MO
BILE
SATE
LLITE(E
-S)
MOBILESATELLITE
MOBILESATELLITE
(E-S)
MOBILESAT. (E-S)
RADIONAVIGATION
RADIO-NAVIGATIONSATELLITE
EARTHEXPLORATION
SATELLITE
FIXE
DS
ATELLITE
(E-S
)
MOBILEFIXED
MOBILEFIXED
MOBILEFIXED RadioAstronomy
FIXED SAT.(E-S)
FIXEDSATELLITE
(E-S)
FIXEDSATELLITE (E-S)
AMATEUR AMATEUR SATELLITE
AMATEUR AMATEUR SATELLITE
Am
ate
ur
Sa
tellite
Am
ate
ur
RA
DIO
-L
OC
AT
ION
MOBILEFIXEDMOBILE
SATELLITE(S-E)
FIXEDSATELLITE
(S-E)
MOBILEFIXEDBROAD-
CASTINGSATELLITE
BROAD-CASTING
SPA
CE
RE
SE
AR
CH
(Passive)
RA
DIO
AS
TRO
NO
MY
EA
RTH
EX
PLO
RATIO
NS
ATELLITE
(Passive)
MO
BILE
FIXE
D
MOBILEFIXED RADIO-LOCATION
FIXEDSATELLITE
(E-S)
MO
BILE
SATE
LLITE
RA
DIO
-N
AVIG
ATION
SATE
LLITE
RA
DIO
-N
AVIG
ATION
Radio-
location
EARTH EXPL.SATELLITE (Passive)
SPACE RESEARCH(Passive)
MOBILEFIXEDFIXED
SATELLITE(S-E)
SPA
CE
RE
SE
AR
CH
(Passive)
RA
DIO
AS
TRO
NO
MY
EA
RTH
EX
PLO
RATIO
NS
ATELLITE
(Passive)
SPA
CE
RE
SE
AR
CH
(Passive)
EA
RTH
EX
PLO
RATIO
NS
ATELLITE
(Passive)
FIXE
D
MO
BILE
MO
BILE
INTE
R-
SATE
LLITE
RA
DIO
-LO
CATIO
N
INTE
R-
SATE
LLITE
Radio-
location
MO
BILE
MO
BILE
SATE
LLITE
RA
DIO
-N
AVIG
ATION
RA
DIO
-N
AVIG
ATION
SATE
LLITE
AMATEUR AMATEUR SATELLITEAmateur Amateur SatelliteRADIO-
LOCATION
MOBILEFIXED FIXEDSATELLITE (S-E)
MOBILEFIXEDFIXED
SATELLITE(S-E)
EARTHEXPLORATION
SATELLITE (Passive)SPACE RES.
(Passive)
SPACE RES.(Passive)
RADIOASTRONOMY
FIXE
DS
ATELLITE
(S-E
)
MO
BILE
FIXE
D
MOBILEFIXED
MOBILEFIXED
MOBILEFIXED
MOBILEFIXED
MOBILEFIXED
SPACE RESEARCH(Passive)
RADIOASTRONOMY
EARTHEXPLORATION
SATELLITE (Passive)
EARTHEXPLORATIONSAT. (Passive)
SPACERESEARCH
(Passive)INTER-
SATELLITE
INTER-SATELLITE
INTER-SATELLITE
INTER-SATELLITE
MO
BILE
MO
BILE
MOBILE
MO
BILE
SATE
LLITE
RA
DIO
-N
AVIG
ATION
RA
DIO
-N
AVIG
ATION
SATE
LLITEFIX
ED
SATE
LLITE(E
-S)
FIXE
D
FIXEDEARTH
EXPLORATION SAT.(Passive)
SPACE RES.(Passive)
SPA
CE
RE
SE
AR
CH
(Passive)
RA
DIO
AS
TRO
NO
MY
EA
RTH
EX
PLO
RATIO
NS
ATELLITE
(Passive)
MOBILEFIXED
MOBILEFIXED
MOBILEFIXED
FIXEDSATELLITE (S-E)
FIXEDSATELLITE(S-E)
FIXEDSATELLITE (S-E)
EARTH EXPL.SAT. (Passive)
SPACE RES.(Passive)
Radio-location
Radio-location
RADIO-LOCATION
AMATEURAMATEUR SATELLITE
AmateurAmateur Satellite
EARTH EXPLORATIONSATELLITE (Passive)SPACE RES. (Passive)
MO
BILE
MO
BILE
SATE
LLITE
RA
DIO
-N
AVIG
ATION
RA
DIO
-N
AVIG
ATION
SATE
LLITE
MO
BILE
MO
BILE
FIXE
D
RADIO-
ASTRONO
MY
FIXE
DS
ATELLITE
(E-S
)
FIXE
D
3.03.025
3.155
3.230
3.4
3.5
4.0
4.063
4.438
4.654.7
4.75
4.85
4.9955.0035.0055.060
5.45
MA
RIT
IME
MO
BILE
AMATEURAMATEUR SATELLITEFIXEDMobile
MARITIME MOBILE
STANDARD FREQUENCY & TIME SIGNAL (20,000 KHZ)Space Research
AERONAUTICAL MOBILE (OR)
AMATEUR SATELLITE AMATEUR
MET. SAT. (S-E)MOB. SAT. (S-E) SPACE RES. (S-E) SPACE OPN. (S-E)MET. SAT. (S-E)Mob. Sat. (S-E) SPACE RES. (S-E) SPACE OPN. (S-E)MET. SAT. (S-E)MOB. SAT. (S-E) SPACE RES. (S-E) SPACE OPN. (S-E)MET. SAT. (S-E)Mob. Sat. (S-E) SPACE RES. (S-E) SPACE OPN. (S-E)
MO
BILE
FIX
ED
FIXED Land Mobile
FIXED MOBILE
LAND MOBILE
LAND MOBILE
MARITIME MOBILE MARITIME MOBILE MARITIME MOBILE
MARITIME MOBILE
MARITIME MOBILE
LAND MOBILE
RADIONAVIGATION SATELLITE
FIXED MOBILEMOBILE SATELLITE (E-S)
MOBILE SATELLITE (E-S)
RadiolocationRadiolocation
LAND MOBILEAMATEUR
MOBILE SATELLITE (E-S) RADIONAVIGATION SATELLITE
MET. AIDS(Radiosonde)
MeteorologicalSatellite (E-S)
METEOROLOGICAL AIDS (RADIOSONDE)
Space Research (S-E)FIXED MOBILE
LAND MOBILEFIXED
LAND MOBILEMOBILEFIXEDFIXED
RADIO ASTRONOMY
RADIO ASTRONOMY METEOROLOGICALAIDS (RADIOSONDE)METEOROLOGICALAIDS (Radiosonde) ††
METEOROLOGICALAIDS (Radiosonde)
METEOROLOGICALSATELLITE (s-E) ††
METEOROLOGICALSATELLITE (s-E)
Fixed
FIX
ED
MET. SAT.(s-E)
FIXED †† (1999/2004)
FIX
ED
#
MOBILEFIXED
AERONAUTICAL MOBILE SATELLITE (R) (E-s)
AERONAUTICAL MOBILE SATELLITE (R) (E-s)
Mobile Satellite (E-s)
MOBILE SATELLITE (R) (E-s)
AERONAUTICAL MOBILE SATELLITE (R) (space to Earth)
AERONAUTICAL RADIONAVIGATION RADIONAV. SATELLITE (Space to Earth)
AERONAUTICAL MOBILE SATELLITE (R)(space to Earth) Mobile Satellite (S- E)
RADIO DET. SAT. (E-S) MOBILE SAT. (S-E)AERO. RADIONAVIGATIONAERO. RADIONAV.AERO. RADIONAV.
RADIO DET. SAT. (E-S)
RADIO DET. SAT. (E-S)MOBILE SAT. (E-S)MOBILE SAT. (E-S) Mobile Sat. (S-E)
RADIO ASTRONOMY
MOBILE SATELLITE (E-s)MARITIME MOBILE SATELLITE (E-s)
RADIO ASTRONOMY AERO. MOBILE SAT. (R) (E-S)
FIXED MOBILE
MOBILEFIXED
FIXED
MOBILEFIXED
FIXED(LOS)
MOBILE(LOS)
SPACERESEARCH
(s-E)(s-s)
SPACEOPERATION
(s-E)(s-s)
EARTHEXPLORATIONSAT. (s-E)(s-s)
AmateurRadio-location Fixed BROADCASTING
SATELLITE
MOBILE FixedRADIOLOCATION
AMATEURAmateur
AmateurAMATEUR
FIXEDBROADCASTINGSATELLITE
BROAD-CASTING
SATELLITEFIXED
SpaceResearch(Passive)
EarthExploration
Sat.(Passive)
RadioAstronomy
RADIOASTRONOMY
SPACE RESEARCH(Passive)
EARTHEXPLORATIONSAT. (Passive)
RADIODETERMINATION SAT. (S-E) MOBILE SATELLITE (S-E)
MOBILE
AERO. RADIO-NAV.(Ground)
RADIO-LOCATION
Radio-location
FIXED SAT. (S-E)
FIXEDMOBILE
FIXEDMOBILE
FIXEDMOBILE
FIXEDSATELLITE (S-E)
FIXEDSATELLITE (S-E)
FIXEDSATELLITE (S-E)
FIXEDMOBILEFIXED
SATELLITE (E-S)
FIXEDSATELLITE
(E-S)MOBILE FIXED
SPACERESEARCH (S-E)
(Deep Space)
AERONAUTICAL RADIONAVIGATION
FIXED MOBILE
MOBILE INTER-SATELLITEFIXED
RADIONAVIGATION
EARTHEXPL. SAT.(Passive)
300
325
335
405
415
435
495
505510
525
535
16051615
1625
1705
1800
1900
2000
2065
2107
21702173.52190.52194
2495
2501
25022505
2850
3000
Radiolocation
BROADCASTINGRadiolocation
RA
DIO
-LO
CAT
ION
BROADCASTING
FIX
ED
MO
BILE
AMATEUR
RADIOLOCATION
MOBILE FIXED MARITIMEMOBILE
MARITIME MOBILE (TELEPHONY)
MARITIMEMOBILE
LANDMOBILEMOBILEFIXED
30.0
30.56
32.0
33.0
34.0
35.0
36.0
37.037.5
38.038.25
39.0
40.0
42.0
46.647.0
49.6
50.0
54.0
72.0
73.0
74.674.875.275.476.0
88.0
108.0
117.975
121.9375123.0875123.5875
128.8125
132.0125
136.0
137.0137.025137.175137.825138.0
144.0
146.0
148.0149.9150.05150.8
156.2475157.0375157.1875157.45161.575161.625161.775162.0125
173.2173.4174.0
216.0
220.0222.0225.0
235.0
300
ISM
– 6.78 ± .015 MH
zIS
M – 13.560 ± .007 M
Hz
ISM
– 27.12 ± .163 MH
z
ISM
– 40.68 ± .02 MH
z1
37
-13
9 S
PA
CE
RE
SE
AR
CH
(SPA
CE
TO
EA
RT
H)
ISM
– 24.125 ± 0.125 GH
z
30 GHz
ISM
– 245.0 ± 1GH
zIS
M – 122.5
± .500 GH
zIS
M – 61.25 ± .250 G
Hz
300.0
322.0
328.6
335.4
399.9
400.05400.15
401.0
402.0
403.0406.0406.1
410.0
420.0
450.0
460.0
470.0
512.0
608.0614.0
806
890902
928929932935940941944960
1215
1240
1300
1350
1390
1990
2110
2150
2160
2200
2290
2300
2310
2360
239024002402
24172450
2483.5
2500
2655
2690
2700
2900
3000
1400
1427
142914321435
1530
1535
1544
1545
1549.5
1558.5155916101610.61613.81626.51645.5
1646.5165116601660.51668.4
1670
1675
1700
1710
1755
1850
MARITIME MOBILE SATELLITE(space to Earth) MOBILE SATELLITE (S-E)
RADIOLOCATIONRADIONAVIGATION
SATELLITE (S-E)
RADIOLOCATION Amateur
RadiolocationAERONAUTICAL
RADIONAVIGATION
SPACERESEARCH
(Passive)
EARTHEXPLORATION
SATELLITE (Passive)RADIO
ASTRONOMY
MOBILE**(1999)
Land Mobile(TLM & TLC)
MOBILE RADIOLOCATION
MOBILE † (1999) RADIOLOCATION † (1999)FIXED † (1999)
FIXED
FixedSPACE
OPERATION(E-S) (1999)
FIXED † (1999) MOBILE † (1999)
FIXED MOBILE
Fixed (TLM) Land Mobile (TLM & TLC)
Fixed (TLM) Land Mobile (TLM & TLC)
MOBILE SAT.(Space to Earth)
MARITIME MOBILE SAT.(Space to Earth)
Mobile(Aero. TLM)
MOBILE SATELLITE (S-E)
MOBILE SATELLITE(Space to Earth)
AERONAUTICAL MOBILE SATELLITE (R)(space to Earth)
3.0
3.1
3.3
3.5
3.6
3.65
3.7
4.2
4.4
4.5
4.66
4.685
4.8
4.99
5.0
5.25
5.35
5.465.47
5.6
5.65
5.85
5.925
6.425
6.525
6.875
7.075
7.125
7.197.2357.25
7.30
7.45
7.55
7.75
7.90
8.025
8.175
8.215
8.4
8.45
8.5
9.0
9.2
9.3
9.5
10.0
10.45
10.510.5510.6
10.68
10.7
11.7
12.2
12.7
12.75
13.2513.4
14.0
14.2
14.4
14.5
14.7145
15.1365
15.35
15.415.7
16.6
17.1
17.2
17.3
17.717.8
18.6
18.8
19.7
20.2
21.2
21.4
22.022.21
22.5
22.55
23.0
23.55
23.6
24.024.05
24.2525.25
27.0
27.5
29.5
30.0
ISM
– 2450.0 ± 50 MH
z
30.0
31.0
31.3
31.8
32.0
33.033.4
36.0
37.0
38.6
39.5
40.0
40.5
42.5
43.5
45.5
47.0
47.2
50.2
50.4
51.4
54.25
58.2
59.0
64.0
65.0
66.0
71.0
72.77
72.91
74.0
75.5
76.0
81.0
84.0
86.0
92.0
95.0
100.0
102.0
105.0
116.0
126.0
134.0
142.0144.0
149.0
150.0
151.0
164.0
168.0
170.0
174.5
176.5
182.0
185.0
190.0
200.0
202.0
217.0
231.0
235.0
238.0
241.0
248.0
250.0
252.0
265.0
275.0
300.0
ISM
– 5.8 ± .075 GH
z
ISM
– 915.0 ±
13 MH
z
INTER-SATELLITE RADIOLOCATIONSATELLITE (E-S)
Radiolocation
AERONAUTICALRADIONAV.
PL
EA
SE
NO
TE
: TH
E S
PA
CIN
G A
LL
OT
ED
TH
E S
ER
VIC
ES
IN T
HE
SP
EC
TR
UM
SE
GM
EN
TS
SH
OW
N IS
NO
T P
RO
PO
RT
ION
AL T
O T
HE
AC
TU
AL A
MO
UN
T O
F S
PE
CT
RU
M O
CC
UP
IED
.
AERO
NAU
TICAL
MO
BILE
AERO
NAU
TICAL
MO
BILE SATELLITE
AERO
NAU
TICAL
RAD
ION
AVIGATIO
N
AM
ATEUR
AMATEU
R SATELLITE
BRO
ADC
ASTING
BRO
ADC
ASTING
SATELLITE
EA
RTH EXPLO
RATIO
NS
ATELLITE
FIXED
FIXED SATELLITE
INTER
-SATELLITE
LAND
MO
BILE
LAND
MO
BILES
ATELLITE
MAR
ITIME M
OBILE
MAR
ITIME M
OBILE
SATELLITE
MAR
ITIME
RAD
ION
AVIGATIO
N
METEO
RO
LOG
ICAL
AIDS
METEO
RO
LOG
ICAL
SATELLITE
MO
BILE
MO
BILE SATELLITE
RAD
IO ASTR
ON
OM
Y
RAD
IOD
ETERM
INATIO
NS
ATELLITE
RAD
IOLO
CATIO
N
RAD
IOLO
CATIO
N SATELLITE
RAD
ION
AVIGATIO
N
RAD
ION
AVIGATIO
NS
ATELLITE
SPACE O
PERATIO
N
SPACE R
ESEARC
H
STAN
DAR
D FR
EQU
ENC
YAN
D TIM
E SIGN
AL
STAN
DAR
D FR
EQU
ENC
YAN
D TIM
E SIGN
AL SATELLITE
RADIO ASTRONOMY
FIX
ED
MA
RIT
IME
MO
BIL
E
FIX
ED
MA
RIT
IME
MO
BIL
EA
ero
na
utica
lM
ob
ile
STANDARD FREQ. AND TIME SIGNAL (60 kHz)FIXED Mobile*
STAND. FREQ. & TIME SIG.
MARITIMEMOBILE
AeronauticalMobile
Radio-location
LandMobileFixed
MET. AIDS(Radiosonde)
Space Opn. (S-E)
MOBILE.SAT. (S-E)
SPACE RESEARCH(s-E) (deep space only)
Fixed
StandardFreq. and
Time SignalSatellite (E-S)
RADIO-LOCATION
FIXEDSPACE
RESEARCH(Passive)
STANDARD FREQ. AND TIME SIGNAL (20 kHz)
Amateur
MOBILE †† (1999/2004)
FIXED SAT. (E-S)
SpaceResearch
SPACE RES.(Passive)
AL
LO
CA
TIO
N U
SA
GE
DE
SIG
NA
TIO
N
SE
RV
ICE
EX
AM
PL
ED
ES
CR
IPT
ION
Prim
aryF
IXE
DC
apital Letters
Secondary
Mobile
1st Capital w
ith lower case letters
Perm
itted/B
RO
AD
CA
ST
ING
/C
apital Letters between oblique strokes
U.S
. DE
PA
RT
ME
NT
OF
CO
MM
ER
CE
Natio
nal T
ele
co
mm
un
icatio
ns a
nd
Info
rmatio
n A
dm
inis
tratio
nO
ffice
of S
pe
ctru
m M
an
ag
em
en
t
Ma
rch
19
96
Earth Expl. Satellite(E-S)
FIXED
MOBILE BROADCASTING
TR
AVE
LER
S IN
FO
RM
ATIO
N S
ER
VIC
E AT 1610 kH
z
59-64 GH
z IS D
ES
IGN
ATE
D F
OR
UN
LICE
NS
ED
DE
VIC
ES
Fixe
d
AERONAUTICALRADIONAVIGATION
SPACE RESEARCH (Passive)
* EX
CE
PT
AE
RO
MO
BILE
(R)
** EX
CE
PT
AE
RO
MO
BILE
‡‡ BA
ND
TO B
E D
ES
IGN
ATE
D F
OR
MIX
ED
US
E
# BA
ND
ALLO
CAT
ED
TO
PE
RS
ON
AL C
OM
MU
NIC
ATIO
NS
SE
RV
ICE
S (P
CS
)
WAVELEN
GTH
BAND
DESIG
NATIO
NS
ACTIVITIES
FREQ
UEN
CY
3 x 10⁷m
3 x 10⁶m
3 x 10⁵m
30,000 m3,000 m
300 m30 m
3 m30 cm
3 cm0.3 cm
0.03 cm3 x 10
5Å3 x 10
4Å3 x 10
3Å3 x 10
2Å3 x 10Å
3Å3 x 10
-1Å3
x
1
0-2Å3
x
10
-3Å3
x
1
0-4Å3
x
10
-5Å3
x
1
0-6Å
3 x 10⁻⁷Å
010 H
z100 H
z1 kH
z10 kH
z100 kH
z1 M
Hz
10 MH
z100 M
Hz
1 GH
z10 G
Hz
100 GH
z1 TH
z10
13Hz
1014H
z10
15Hz
1016H
z10
17Hz
1018H
z10
19Hz
1020H
z10
21Hz
1022H
z10
23Hz
1024H
z10
25Hz
❱
❱
THE R
ADIO
SPECTR
UM
MAG
NIFIED
ABOVE
3 kHz
300 GH
z
VE
RY
LOW
FR
EQ
UE
NC
Y (V
LF)
Audible R
ange
❱
❱
❱
AM
Broadcast
FM B
roadcast R
adarS
ub-Millim
eter Visible
Ultraviolet
Gam
ma-ray
Cosm
ic-ray❱
❱
❱
❱
❱
❱
❱Infra-sonics
❱
❱S
onics❱
❱
❱
Ultra-sonics
Microw
aves
❱
❱Infrared
❱
❱❱
❱
PLS
X❱
❱C
Radar
Bands
1850-1910 AN
D 1930-1990 M
Hz A
RE
ALLO
CA
TE
D TO
P
CS
; 1910-1930 MH
zIS
DE
SIG
NAT
ED
FO
R U
NLIC
EN
SE
D P
CS
DE
VIC
ES
LF M
F H
F V
HF
UH
F S
HF
EH
F IN
FR
AR
ED
VIS
IBLE
ULT
RAV
IOLE
T X
-RAY
GA
MM
A-R
AY C
OS
MIC
-RAY
X-ray
ALLOCATIONS
FREQUENCY
Figure 7.2

283
Solutions to Exercises in Chapter 7
Solution to Exercise 7.1 (p. 279)Alexander Graham Bell. He developed it because we seem to perceive physical quantities like loudnessand brightness logarithmically. In other words, percentage, not absolute dierences, matter to us. We usedecibels today because common values are small integers. If we used Bels, they would be decimal fractions,which aren't as elegant.
Solution to Exercise 7.2 (p. 280)(606
)= 60!
54!6! = 50, 063, 860.
Solution to Exercise 7.3 (p. 281)Because of Newton's binomial theorem, the sum equals (1 + 1)n = 2n.

284 INDEX
Index of Keywords and Terms
Keywords are listed by the section with that keyword (page numbers are in parentheses). Keywordsdo not necessarily appear in the text of the page. They are merely associated with that section. Ex.apples, 1.1 (1) Terms are referenced by the page they appear on. Ex. apples, 1
A active circuits, 73address, 252algorithm, 174, 175aliasing, 161alphabet, 2.4(21), 23, 167AM, 6.11(221)Ampere, 2.2(17), 3.1(35)amplier, 2.6(26)amplitude, 1.4(7), 7, 2.2(17), 7.1(279)amplitude modulate, 130amplitude modulation, 6.11(221), 6.12(222)analog, 1, 21, 3.21(84), 5.6(167), 5.14(186), 5.16(192), 6.32(250)analog communication, 6.10(220), 6.11(221), 6.12(222), 6.32(250)analog problem, 3.21(84)analog signal, 1.2(2), 6.10(220)analog signals, 5.14(186), 5.16(192)analog-to-digital (A/D) conversion, 5.4(162),162angle, 15angle of complex number, 2.1(13)ARPANET, 6.34(252)ASP, 3.21(84)attenuation, 2.6(26), 6.9(219), 6.12(222)attenuation constant, 213auxiliary band, 263average power, 58, 59
B bandlimited, 6.31(249)bandpass lter, 139bandpass signal, 131bandwidth, 4.6(122), 123, 131, 6.9(219), 6.12(222), 6.14(224), 6.15(227)baseband communication, 6.10(220), 220baseband signal, 131, 6.10(220)basis functions, 110binary phase shift keying, 6.14(224), 225binary symmetric channel, 6.19(233), 233bit, 157bit interval, 224, 6.14(224)bit stream, 6.13(224), 224
bit-reception error, 6.17(230)bits, 6.21(235), 235block, 247block channel coding, 6.26(241), 242block diagram, 1.3(6), 6, 2.5(24)boolean arithmetic, 5.2(155)boxcar lter, 184, 5.13(185)BPSK, 6.14(224), 6.19(233)broadcast, 6.1(209), 210, 6.36(254)broadcast communication, 209broadcast mode, 6.2(210)buering, 5.15(189), 190buttery, 5.9(174), 176bytes, 157
C capacitor, 3.2(36), 3.8(54)capacity, 6.30(248), 248, 6.31(249), 6.36(254)carrier, 1.4(7), 8, 221carrier amplitude, 221carrier frequency, 6.11(221), 221Cartesian form, 2.1(13)Cartesian form of z, 13cascade, 2.5(24)channel, 1.3(6), 7, 6.9(219), 6.30(248), 6.31(249)channel coder, 238, 6.25(240)channel coding, 6.25(240), 6.26(241), 6.27(242)channel decoding, 6.28(245)characteristic impedance, 214charge, 3.1(35)circuit, 3.1(35), 3.2(36), 3.4(39), 39, 3.8(54), 3.9(54), 3.20(81)circuit model, 6.2(210)circuit switched, 253circuit-switched, 6.34(252), 252circuits, 35clock speed, 5.2(155)closed circuit, 3.2(36)coaxial cable, 6.3(210), 211codebook, 6.21(235), 235

INDEX 285
codeword, 6.27(242), 243codeword error, 7.2(280)coding, 6.23(237)coding eciency, 6.26(241), 242coherent, 222coherent receiver, 6.11(221)collision, 6.36(254), 256combination, 7.2(280)combinations, 280combinatorial, 7.2(280)communication, 1.3(6), 6.32(250)communication channel, 6.2(210)communication channels, 6.5(216), 6.6(217), 6.7(217), 6.8(218), 6.9(219)communication network, 6.33(251), 6.35(253), 6.37(256)communication networks, 6.34(252), 6.36(254)communication protocol, 6.37(256)communication systems, 6.1(209)communication theory, 6.20(234)Complementary lters, 259complex, 2.3(20), 2.4(21)complex amplitude, 17complex amplitudes, 60complex conjugate, 14complex exponential, 13, 2.2(17)complex exponential sequence, 22, 165complex Fourier series, 4.2(109)complex frequency, 18complex number, 2.1(13), 13complex numbers, 54complex plane, 13complex power, 59complex-valued, 2.4(21)complexity, 2.3(20), 174component, 2.2(17)compression, 6.20(234), 6.21(235), 6.22(236), 6.23(237)computational advantage, 175computational complexity, 5.8(174), 5.9(174), 5.16(192)computer network, 6.37(256)Computer networks, 251computer organization, 5.2(155)conductance, 3.2(36), 37conductor, 3.1(35)conjugate symmetry, 4.2(109), 111Cooley-Tukey algorithm, 5.9(174)cosine, 1.4(7)countably innite, 188
current, 3.1(35), 35, 3.2(36)current divider, 3.6(44), 46cuto frequency, 64
D data compression, 6.22(236), 236datarate, 6.14(224), 225, 6.31(249)De-emphasis circuits, 102decibel, 7.1(279)decode, 6.29(246)decoding, 6.28(245)decompose, 2.4(21)decomposition, 2.3(20)dedicated, 251dependent source, 73device electronic, 3.1(35)DFT, 5.7(172), 5.9(174), 5.10(177), 5.14(186)dierence equation, 5.12(181), 182, 5.14(186)digital, 1, 5.6(167), 6.32(250), 6.33(251)digital communication, 6.1(209), 6.13(224), 6.14(224), 6.15(227), 6.16(228), 6.17(230), 6.18(231), 6.19(233), 6.20(234), 6.21(235), 6.22(236), 6.23(237), 6.25(240), 6.26(241), 6.27(242), 6.28(245), 6.29(246), 6.30(248), 6.31(249), 6.32(250)digital communication receiver, 6.19(233)digital communication receivers, 6.17(230)digital communication systems, 6.19(233)digital lter, 5.14(186), 5.16(192)digital signal, 1.2(2)digital signal processing, 5.6(167), 5.10(177), 5.11(180), 5.12(181), 5.14(186), 5.15(189), 5.16(192)digital sources, 6.20(234), 6.21(235), 6.22(236), 6.23(237)diode, 3.20(81)Discrete Fourier Transform, 5.7(172), 172, 5.8(174), 5.9(174), 5.10(177), 5.14(186)discrete-time, 2.4(21), 5.6(167), 5.14(186), 5.15(189), 5.16(192)discrete-time ltering, 5.14(186), 5.15(189), 5.16(192)discrete-time Fourier transform, 5.6(167)discrete-time sinc function, 170Discrete-Time Systems, 5.11(180), 5.12(181), 5.13(185)discrete-valued, 159domain, 254double precision oating point, 5.2(155)double-bit, 6.29(246)

286 INDEX
DSP, 5.1(155), 5.6(167), 5.10(177), 5.11(180), 5.12(181), 5.14(186), 5.15(189), 5.16(192)
E eciency, 6.30(248), 250elec241 problems, 5.17(193)electrical, 252electrical engineering, 1.1(1)electron, 3.1(35)electronic circuits, 73electronics, 3.17(73), 3.19(76)element, 3.1(35), 3.2(36)elemental signals, 2.2(17)energy, 3.1(35), 36, 3.11(58)entropy, 6.20(234), 234, 6.21(235)equivalent circuit, 49, 3.12(59)Equivalent Circuits, 3.7(49)error, 6.29(246), 6.30(248)error correcting code, 6.29(246), 6.30(248)error correcting codes, 6.25(240), 6.26(241), 6.27(242)error correction, 6.25(240), 6.26(241), 6.27(242), 6.28(245), 6.31(249)error probability, 6.19(233)error-correcting code, 6.31(249)error-correcting codes, 6.28(245)ethernet, 6.36(254)Euler, 2.2(17), 4.3(114)Euler relations, 4.2(109)Euler's relation, 2.2(17)Euler's relations, 15exponential, 2.4(21), 3.9(54)
F farad, 3.2(36)Faraday, 3.2(36)fast Fourier transform, 5.9(174), 5.15(189)feedback, 2.5(24)FFT, 5.9(174), 5.15(189)lter, 65ltering, 4.7(124), 5.14(186), 5.15(189), 5.16(192)FIR, 184xed, 253xed rate, 236Flexibility, 251oating point, 5.2(155)ux, 3.2(36)form, 175formal circuit method, 3.15(66)formants, 136forward bias, 3.20(81)forward biasing, 82
Fourier coecients, 4.2(109), 110, 4.3(114),114Fourier series, 4.2(109), 109, 4.3(114), 4.8(126), 4.9(131)fourier spectrum, 4.6(122)Fourier transform, 4.1(109), 109, 4.8(126),126, 5.6(167), 5.7(172), 5.10(177), 5.14(186)frames, 178frequency, 1.4(7), 7, 2.2(17), 4.3(114), 6.4(215)frequency allocation chart, 7.3(281), 281frequency domain, 3.10(56), 56, 4.1(109), 5.13(185), 5.15(189)frequency response, 60, 5.13(185)frequency shift keying, 6.15(227)frequency-shift keying, 227FSK, 6.15(227), 6.19(233)functional, 24fundamental assumption, 38fundamental frequency, 110, 136fundamental model of communication, 6.19(233), 6.33(251)Fundamental Model of DigitalCommunication, 238, 6.25(240)fundamental model of speech production, 136
G gain, 2.6(26), 26gateway, 6.35(253)gateways, 254Gauss, 4.3(114)generator matrix, 6.27(242), 243, 6.29(246)geometric series, 168geosynchronous orbits, 6.7(217), 217Gibb's phenomenon, 121ground, 211
H half wave rectied sinusoid, 4.4(116)half-wave rectier, 83Hamming, 6.29(246)Hamming code, 6.29(246)Hamming codes, 247Hamming distance, 6.27(242), 243Hanning window, 5.10(177), 179harmonically, 110Heaviside, 6.6(217)Heinrich Hertz, 1.1(1)Henry, 3.2(36)hidden-ones notation, 158history of electrical engineering, 1.1(1)hole, 3.1(35)holes, 35

INDEX 287
Human, 6.22(236), 6.23(237)Human Code, 6.22(236), 6.23(237)Human source coding algorithm, 6.22(236),236
I i, 2.2(17)IIR, 183imaginary, 2.2(17)imaginary number, 2.1(13), 13imaginary part, 2.1(13), 13impedance, 54, 3.9(54), 55, 3.10(56), 3.11(58)inductor, 3.2(36), 3.8(54)information, 1.1(1), 1, 1.2(2)information communication, 6.1(209), 6.5(216), 6.6(217), 6.7(217), 6.8(218), 6.9(219), 6.10(220), 6.11(221), 6.12(222), 6.13(224), 6.14(224), 6.15(227), 6.16(228), 6.17(230), 6.18(231), 6.20(234), 6.21(235), 6.22(236), 6.23(237), 6.25(240), 6.26(241), 6.27(242), 6.28(245), 6.29(246), 6.30(248), 6.31(249), 6.32(250), 6.33(251), 6.34(252), 6.35(253), 6.36(254)information theory, 1.1(1)initial conditions, 182input, 2.5(24)input resistance, 76input-output relationship, 3.6(44), 44instantaneous power, 36integrated circuit, 3.17(73)integrator, 2.6(26)interference, 6.8(218), 218internet, 6.34(252), 6.37(256)internet protocol address, 6.35(253)inverse Fourier transform, 4.8(126)inverting amplier, 77ionosphere, 6.6(217)IP address, 6.35(253), 254
J j, 2.2(17)jam, 149James Maxwell, 1.1(1)joules, 36
K KCL, 43, 3.15(66), 3.16(71)Kircho, 3.4(39), 3.15(66)Kircho's Laws, 41KVL, 43, 3.15(66), 3.16(71)
L LAN, 6.35(253)leakage, 82
leakage current, 3.20(81)line-of-sight, 6.5(216), 216linear, 3.2(36), 36, 5.14(186), 210linear circuit, 4.7(124)linear codes, 6.27(242), 242linear phase shift, 111linear systems, 2.6(26)load, 3.6(44), 47local area network, 6.35(253)Local area networks, 253logarithmic amplier, 84logarithmically, 279long-distance, 6.5(216)long-distance communication, 6.7(217)long-distance transmission, 6.7(217)lossless, 236lossy, 236lottery, 7.2(280)lowpass lter, 65, 4.7(124)
M magnitude, 15magnitude of complex number, 2.1(13)Marconi, 6.6(217)matched lter, 6.16(228), 228Maxwell's equations, 6.2(210), 210Mayer-Norton, 3.7(49)Mayer-Norton equivalent, 52mean-square equality, 121message, 6.34(252)message routing, 6.34(252)model of communication, 1.3(6)models and reality, 3.3(39)modem, 1.5(8)modulate, 8modulated, 221modulated communication, 6.12(222)modulation, 1.4(7), 135, 6.11(221)Morse code, 6.23(237)multi-level signaling, 250
N name server, 6.35(253)name servers, 254negative, 3.1(35)nerve, 3.1(35)network, 238, 6.33(251), 6.36(254)network architecture, 6.35(253), 6.36(254)networks, 217node, 3.4(39)node method, 3.15(66), 66node voltages, 67nodes, 41, 252noise, 136, 6.1(209), 6.8(218), 218,

288 INDEX
6.12(222), 6.17(230), 6.30(248)noise removal, 191noisy channel coding theorem, 6.30(248)nonlinear, 3.20(81)Norton, 3.7(49), 3.12(59)numbers on a computer, 5.2(155)Nyquist frequency, 162, 5.6(167)
O ohm, 3.2(36)Oliver Heaviside, 1.1(1)op-amp, 3.17(73), 73, 3.19(76)open circuit, 3.2(36), 37operational amplier, 3.17(73), 73, 3.19(76)orthogonality, 4.2(109), 4.3(114), 114output, 2.5(24)output resistance, 76output spectrum, 4.9(131)
P packet, 6.34(252), 6.36(254)packet size, 6.36(254)packet-switched, 6.34(252), 253packets, 253parallel, 2.5(24), 3.6(44), 45, 47parity, 6.29(246)parity check, 6.29(246)parity check matrix, 245Parseval's theorem, 4.2(109), 111, 4.8(126),128, 5.6(167)passive circuits, 73Performance, 250period, 18periodic signal, 4.2(109)permutation, 7.2(280)permutations, 280phase, 1.4(7), 7, 2.2(17)phase modulates, 259phasor, 2.2(17), 17physical, 3.1(35)pitch frequency, 136pitch lines, 137point to point, 6.33(251)point to point communication, 6.33(251)point-to-point, 6.2(210), 210, 251, 6.34(252)point-to-point communication, 6.1(209), 209pointwise equality, 121polar form, 2.1(13), 14, 14positional notation, 5.2(155)positive, 3.1(35)postal service, 6.33(251)Power, 1, 3.1(35), 36, 3.5(43), 43, 3.11(58), 3.16(71), 4.2(109), 117,
7.1(279)power factor, 90, 107power spectrum, 117, 6.8(218), 218pre-emphasis circuit, 102preamble, 228prex, 238probabilistic models, 234probability, 7.2(280)probability of error, 6.18(231)problems, 3.21(84)propagating wave, 213propagation speed, 214proportional, 174protocol, 6.36(254), 6.37(256), 257pulse, 2.2(17), 4.2(109), 4.8(126)
Q quadruple precision oating point, 5.2(155)quantization interval, 5.4(162), 163quantized, 159, 5.4(162), 162
R random access, 6.36(254)random-access, 255real, 2.2(17)real part, 13real-valued, 2.4(21)received signal-to-noise-ratio, 6.12(222)receiver, 1.3(6), 6.16(228)rectication, 4.4(116)reference, 279reference node, 67relay network, 217relay networks, 6.5(216)repeaters, 270repetition code, 6.25(240), 240resistance, 3.2(36), 37resistivity, 43resistor, 3.2(36), 3.5(43)reverse bias, 3.20(81)reverse-bias, 82rms, 1.5(8), 117route, 252routing, 6.34(252)
S samples, 162sampling, 172sampling interval, 160Sampling Theorem, 162satellite, 6.7(217)satellite communication, 6.7(217)sawtooth, 149self-clocking signaling, 6.16(228), 228self-synchronization, 6.23(237)

INDEX 289
sequences, 2.4(21)series, 3.6(44), 44Shannon, 1.3(6), 6.1(209), 6.20(234), 6.21(235), 6.30(248), 6.31(249)Shannon sampling frequency, 162shift-invariant, 181, 5.14(186)shift-invariant systems, 5.12(181)short circuit, 37Siemens, 3.2(36)sign bit, 5.2(155), 157signal, 1.2(2), 2, 1.3(6), 2.5(24)signal decomposition, 20signal set, 224, 6.14(224), 6.17(230), 6.19(233)signal spectrum, 4.4(116)signal-to-noise, 5.4(162), 164signal-to-noise ratio, 6.10(220), 221, 6.31(249)signal-to-noise-ratio, 6.12(222)signal-to-noise-ration, 6.18(231), 6.27(242)signals, 1, 2.4(21), 3.21(84)simple binary code, 235sinc, 128sine, 1.4(7), 2.2(17), 2.4(21)single-bit, 6.29(246)sink, 1.3(6), 6, 7sinusoid, 1.4(7), 7, 2.2(17), 2.4(21), 4.1(109), 4.3(114)SIR, 6.9(219)SNR, 6.9(219), 6.10(220), 6.12(222), 6.18(231), 6.27(242), 6.31(249)source, 1.3(6), 6, 2.6(26), 3.2(36)source coding theorem, 6.21(235), 235, 6.22(236)space constant, 213spectrograms, 5.10(177)spectrum, 4.1(109), 109, 4.2(109), 110, 116speech model, 4.10(134)square wave, 2.2(17), 4.2(109), 4.3(114)standard feedback conguration, 75Steinmetz, 2.2(17)superposition, 2.3(20), 4.1(109), 5.12(181)Superposition Principle, 84symbolic-valued signals, 2.4(21)synchronization, 6.16(228)synchronize, 228system, 6system theory, 2.5(24)systems, 2.4(21)
T telegraph, 6.33(251)telephone, 6.33(251)
tetherless networking, 210themes of electrical engineering, 1.1(1)Thevenin, 3.7(49), 3.12(59)Thévenin equivalent circuit, 50time constant, 2.2(17), 18, 133time delay, 2.6(26)time domain, 3.10(56), 56, 5.12(181)time invariant, 4.9(131)time reversal, 2.6(26)time-domain multiplexing, 6.33(251), 252time-invariant, 2.6(26)total harmonic distortion, 117transatlantic communication, 6.6(217)transceiver, 6.36(254), 255transfer function, 3.13(60), 60, 3.14(65), 5.13(185), 5.14(186)transforms, 128transition diagrams, 6.19(233), 233transmission, 6.5(216), 6.6(217)transmission bandwidth, 6.14(224), 6.19(233)transmission error, 6.17(230)transmission line, 6.3(210)transmission line equations, 212transmission lines, 211transmitter, 1.3(6), 6twisted pair, 6.3(210), 211
U uncountably innite, 188unit sample, 2.4(21), 23, 166, 166unit step, 2.2(17)unit-sample response, 186
V vocal tract, 4.10(134), 136Volta, 3.1(35)voltage, 3.1(35), 35, 3.2(36)voltage divider, 3.6(44), 44voltage gain, 76
W WAN, 6.35(253)watts, 36wavelength, 213, 6.4(215)white noise, 6.8(218), 218, 6.31(249)wide area network, 6.35(253)wide area networks, 253window, 179wireless, 209, 210, 6.5(216), 6.6(217)wireless channel, 6.2(210), 6.4(215)wireline, 209, 210, 6.5(216)wireline channel, 6.2(210), 6.3(210)World Wide Web, 6.37(256)
Z zero-pad, 187

290 ATTRIBUTIONS
Attributions
Collection: Fundamentals of Electrical Engineering IEdited by: Don JohnsonURL: http://cnx.org/content/col10040/1.9/License: http://creativecommons.org/licenses/by/1.0
Module: "Themes"By: Don JohnsonURL: http://cnx.org/content/m0000/2.18/Pages: 1-2Copyright: Don JohnsonLicense: http://creativecommons.org/licenses/by/1.0
Module: "Signals Represent Information"By: Don JohnsonURL: http://cnx.org/content/m0001/2.26/Pages: 2-5Copyright: Don JohnsonLicense: http://creativecommons.org/licenses/by/1.0
Module: "Structure of Communication Systems"By: Don JohnsonURL: http://cnx.org/content/m0002/2.16/Pages: 6-7Copyright: Don JohnsonLicense: http://creativecommons.org/licenses/by/1.0
Module: "The Fundamental Signal"By: Don JohnsonURL: http://cnx.org/content/m0003/2.15/Pages: 7-8Copyright: Don JohnsonLicense: http://creativecommons.org/licenses/by/1.0
Module: "Introduction Problems"By: Don JohnsonURL: http://cnx.org/content/m10353/2.16/Pages: 8-10Copyright: Don JohnsonLicense: http://creativecommons.org/licenses/by/1.0
Module: "Complex Numbers"By: Don JohnsonURL: http://cnx.org/content/m0081/2.27/Pages: 13-17Copyright: Don JohnsonLicense: http://creativecommons.org/licenses/by/1.0

ATTRIBUTIONS 291
Module: "Elemental Signals"By: Don JohnsonURL: http://cnx.org/content/m0004/2.26/Pages: 17-20Copyright: Don JohnsonLicense: http://creativecommons.org/licenses/by/1.0
Module: "Signal Decomposition"By: Don JohnsonURL: http://cnx.org/content/m0008/2.12/Pages: 20-21Copyright: Don JohnsonLicense: http://creativecommons.org/licenses/by/1.0
Module: "Discrete-Time Signals"By: Don JohnsonURL: http://cnx.org/content/m0009/2.23/Pages: 21-23Copyright: Don JohnsonLicense: http://creativecommons.org/licenses/by/1.0
Module: "Introduction to Systems"By: Don JohnsonURL: http://cnx.org/content/m0005/2.18/Pages: 24-26Copyright: Don JohnsonLicense: http://creativecommons.org/licenses/by/1.0
Module: "Simple Systems"By: Don JohnsonURL: http://cnx.org/content/m0006/2.23/Pages: 26-29Copyright: Don JohnsonLicense: http://creativecommons.org/licenses/by/1.0
Module: "Signals and Systems Problems"By: Don JohnsonURL: http://cnx.org/content/m10348/2.24/Pages: 29-33Copyright: Don JohnsonLicense: http://creativecommons.org/licenses/by/1.0
Module: "Voltage, Current, and Generic Circuit Elements"By: Don JohnsonURL: http://cnx.org/content/m0011/2.12/Pages: 35-36Copyright: Don JohnsonLicense: http://creativecommons.org/licenses/by/1.0
Module: "Ideal Circuit Elements"By: Don JohnsonURL: http://cnx.org/content/m0012/2.19/Pages: 36-39Copyright: Don JohnsonLicense: http://creativecommons.org/licenses/by/1.0

292 ATTRIBUTIONS
Module: "Ideal and Real-World Circuit Elements"By: Don JohnsonURL: http://cnx.org/content/m0013/2.9/Pages: 39-39Copyright: Don JohnsonLicense: http://creativecommons.org/licenses/by/1.0
Module: "Electric Circuits and Interconnection Laws"By: Don JohnsonURL: http://cnx.org/content/m0014/2.26/Pages: 39-43Copyright: Don JohnsonLicense: http://creativecommons.org/licenses/by/1.0
Module: "Power Dissipation in Resistor Circuits"By: Don JohnsonURL: http://cnx.org/content/m17305/1.5/Pages: 43-44Copyright: Don JohnsonLicense: http://creativecommons.org/licenses/by/2.0/
Module: "Series and Parallel Circuits"By: Don JohnsonURL: http://cnx.org/content/m10674/2.7/Pages: 44-49Copyright: Don JohnsonLicense: http://creativecommons.org/licenses/by/1.0
Module: "Equivalent Circuits: Resistors and Sources"By: Don JohnsonURL: http://cnx.org/content/m0020/2.22/Pages: 49-53Copyright: Don JohnsonLicense: http://creativecommons.org/licenses/by/1.0
Module: "Circuits with Capacitors and Inductors"By: Don JohnsonURL: http://cnx.org/content/m0023/2.11/Pages: 54-54Copyright: Don JohnsonLicense: http://creativecommons.org/licenses/by/1.0
Module: "The Impedance Concept"By: Don JohnsonURL: http://cnx.org/content/m0024/2.22/Pages: 54-56Copyright: Don JohnsonLicense: http://creativecommons.org/licenses/by/1.0
Module: "Time and Frequency Domains"By: Don JohnsonURL: http://cnx.org/content/m10708/2.6/Pages: 56-58Copyright: Don JohnsonLicense: http://creativecommons.org/licenses/by/1.0

ATTRIBUTIONS 293
Module: "Power in the Frequency Domain"By: Don JohnsonURL: http://cnx.org/content/m17308/1.2/Pages: 58-59Copyright: Don JohnsonLicense: http://creativecommons.org/licenses/by/2.0/
Module: "Equivalent Circuits: Impedances and Sources"By: Don JohnsonURL: http://cnx.org/content/m0030/2.19/Pages: 59-60Copyright: Don JohnsonLicense: http://creativecommons.org/licenses/by/1.0
Module: "Transfer Functions"By: Don JohnsonURL: http://cnx.org/content/m0028/2.18/Pages: 60-64Copyright: Don JohnsonLicense: http://creativecommons.org/licenses/by/1.0
Module: "Designing Transfer Functions"By: Don JohnsonURL: http://cnx.org/content/m0031/2.20/Pages: 65-66Copyright: Don JohnsonLicense: http://creativecommons.org/licenses/by/1.0
Module: "Formal Circuit Methods: Node Method"By: Don JohnsonURL: http://cnx.org/content/m0032/2.18/Pages: 66-71Copyright: Don JohnsonLicense: http://creativecommons.org/licenses/by/1.0
Module: "Power Conservation in Circuits"By: Don JohnsonURL: http://cnx.org/content/m17317/1.1/Pages: 71-73Copyright: Don JohnsonLicense: http://creativecommons.org/licenses/by/2.0/
Module: "Electronics"By: Don JohnsonURL: http://cnx.org/content/m0035/2.8/Pages: 73-73Copyright: Don JohnsonLicense: http://creativecommons.org/licenses/by/1.0
Module: "Dependent Sources"By: Don JohnsonURL: http://cnx.org/content/m0053/2.13/Pages: 73-75Copyright: Don JohnsonLicense: http://creativecommons.org/licenses/by/1.0

294 ATTRIBUTIONS
Module: "Operational Ampliers"By: Don JohnsonURL: http://cnx.org/content/m0036/2.28/Pages: 76-81Copyright: Don JohnsonLicense: http://creativecommons.org/licenses/by/1.0
Module: "The Diode"By: Don JohnsonURL: http://cnx.org/content/m0037/2.14/Pages: 81-84Copyright: Don JohnsonLicense: http://creativecommons.org/licenses/by/1.0
Module: "Analog Signal Processing Problems"By: Don JohnsonURL: http://cnx.org/content/m10349/2.37/Pages: 84-105Copyright: Don JohnsonLicense: http://creativecommons.org/licenses/by/1.0
Module: "Introduction to the Frequency Domain"By: Don JohnsonURL: http://cnx.org/content/m0038/2.10/Pages: 109-109Copyright: Don JohnsonLicense: http://creativecommons.org/licenses/by/1.0
Module: "Complex Fourier Series"By: Don JohnsonURL: http://cnx.org/content/m0042/2.24/Pages: 109-113Copyright: Don JohnsonLicense: http://creativecommons.org/licenses/by/1.0
Module: "Classic Fourier Series"By: Don JohnsonURL: http://cnx.org/content/m0039/2.22/Pages: 114-116Copyright: Don JohnsonLicense: http://creativecommons.org/licenses/by/1.0
Module: "A Signal's Spectrum"By: Don JohnsonURL: http://cnx.org/content/m0040/2.19/Pages: 116-117Copyright: Don JohnsonLicense: http://creativecommons.org/licenses/by/1.0
Module: "Fourier Series Approximation of Signals"By: Don JohnsonURL: http://cnx.org/content/m10687/2.8/Pages: 117-121Copyright: Don JohnsonLicense: http://creativecommons.org/licenses/by/1.0

ATTRIBUTIONS 295
Module: "Encoding Information in the Frequency Domain"By: Don JohnsonURL: http://cnx.org/content/m0043/2.15/Pages: 122-124Copyright: Don JohnsonLicense: http://creativecommons.org/licenses/by/1.0
Module: "Filtering Periodic Signals"By: Don JohnsonURL: http://cnx.org/content/m0044/2.9/Pages: 124-126Copyright: Don JohnsonLicense: http://creativecommons.org/licenses/by/1.0
Module: "Derivation of the Fourier Transform"By: Don JohnsonURL: http://cnx.org/content/m0046/2.19/Pages: 126-131Copyright: Don JohnsonLicense: http://creativecommons.org/licenses/by/1.0
Module: "Linear Time Invariant Systems"By: Don JohnsonURL: http://cnx.org/content/m0048/2.18/Pages: 131-133Copyright: Don JohnsonLicense: http://creativecommons.org/licenses/by/1.0
Module: "Modeling the Speech Signal"By: Don JohnsonURL: http://cnx.org/content/m0049/2.25/Pages: 134-140Copyright: Don JohnsonLicense: http://creativecommons.org/licenses/by/1.0
Module: "Frequency Domain Problems"By: Don JohnsonURL: http://cnx.org/content/m10350/2.32/Pages: 140-151Copyright: Don JohnsonLicense: http://creativecommons.org/licenses/by/1.0
Module: "Introduction to Digital Signal Processing"By: Don JohnsonURL: http://cnx.org/content/m10781/2.3/Pages: 155-155Copyright: Don JohnsonLicense: http://creativecommons.org/licenses/by/1.0
Module: "Introduction to Computer Organization"By: Don JohnsonURL: http://cnx.org/content/m10263/2.27/Pages: 155-159Copyright: Don JohnsonLicense: http://creativecommons.org/licenses/by/1.0

296 ATTRIBUTIONS
Module: "The Sampling Theorem"By: Don JohnsonURL: http://cnx.org/content/m0050/2.18/Pages: 159-162Copyright: Don JohnsonLicense: http://creativecommons.org/licenses/by/1.0
Module: "Amplitude Quantization"By: Don JohnsonURL: http://cnx.org/content/m0051/2.21/Pages: 162-165Copyright: Don JohnsonLicense: http://creativecommons.org/licenses/by/1.0
Module: "Discrete-Time Signals and Systems"By: Don JohnsonURL: http://cnx.org/content/m10342/2.13/Pages: 165-167Copyright: Don JohnsonLicense: http://creativecommons.org/licenses/by/1.0
Module: "Discrete-Time Fourier Transform (DTFT)"By: Don JohnsonURL: http://cnx.org/content/m10247/2.28/Pages: 167-172Copyright: Don JohnsonLicense: http://creativecommons.org/licenses/by/1.0
Module: "Discrete Fourier Transform (DFT)"Used here as: "Discrete Fourier Transforms (DFT)"By: Don JohnsonURL: http://cnx.org/content/m10249/2.26/Pages: 172-174Copyright: Don JohnsonLicense: http://creativecommons.org/licenses/by/1.0
Module: "DFT: Computational Complexity"By: Don JohnsonURL: http://cnx.org/content/m0503/2.11/Pages: 174-174Copyright: Don JohnsonLicense: http://creativecommons.org/licenses/by/1.0
Module: "Fast Fourier Transform (FFT)"By: Don JohnsonURL: http://cnx.org/content/m10250/2.15/Pages: 174-177Copyright: Don JohnsonLicense: http://creativecommons.org/licenses/by/1.0

ATTRIBUTIONS 297
Module: "Spectrograms"By: Don JohnsonURL: http://cnx.org/content/m0505/2.18/Pages: 177-180Copyright: Don JohnsonLicense: http://creativecommons.org/licenses/by/1.0
Module: "Discrete-Time Systems"By: Don JohnsonURL: http://cnx.org/content/m0507/2.5/Pages: 180-180Copyright: Don JohnsonLicense: http://creativecommons.org/licenses/by/1.0
Module: "Discrete-Time Systems in the Time-Domain"By: Don JohnsonURL: http://cnx.org/content/m10251/2.22/Pages: 181-184Copyright: Don JohnsonLicense: http://creativecommons.org/licenses/by/1.0
Module: "Discrete-Time Systems in the Frequency Domain"By: Don JohnsonURL: http://cnx.org/content/m0510/2.14/Pages: 185-186Copyright: Don JohnsonLicense: http://creativecommons.org/licenses/by/1.0
Module: "Filtering in the Frequency Domain"By: Don JohnsonURL: http://cnx.org/content/m10257/2.16/Pages: 186-189Copyright: Don JohnsonLicense: http://creativecommons.org/licenses/by/1.0
Module: "Eciency of Frequency-Domain Filtering"By: Don JohnsonURL: http://cnx.org/content/m10279/2.14/Pages: 189-192Copyright: Don JohnsonLicense: http://creativecommons.org/licenses/by/1.0
Module: "Discrete-Time Filtering of Analog Signals"By: Don JohnsonURL: http://cnx.org/content/m0511/2.20/Pages: 192-193Copyright: Don JohnsonLicense: http://creativecommons.org/licenses/by/1.0
Module: "Digital Signal Processing Problems"By: Don JohnsonURL: http://cnx.org/content/m10351/2.33/Pages: 193-203Copyright: Don JohnsonLicense: http://creativecommons.org/licenses/by/1.0

298 ATTRIBUTIONS
Module: "Information Communication"By: Don JohnsonURL: http://cnx.org/content/m0513/2.8/Pages: 209-209Copyright: Don JohnsonLicense: http://creativecommons.org/licenses/by/1.0
Module: "Types of Communication Channels"By: Don JohnsonURL: http://cnx.org/content/m0099/2.13/Pages: 210-210Copyright: Don JohnsonLicense: http://creativecommons.org/licenses/by/1.0
Module: "Wireline Channels"By: Don JohnsonURL: http://cnx.org/content/m0100/2.27/Pages: 210-215Copyright: Don JohnsonLicense: http://creativecommons.org/licenses/by/1.0
Module: "Wireless Channels"By: Don JohnsonURL: http://cnx.org/content/m0101/2.14/Pages: 215-216Copyright: Don JohnsonLicense: http://creativecommons.org/licenses/by/1.0
Module: "Line-of-Sight Transmission"By: Don JohnsonURL: http://cnx.org/content/m0538/2.13/Pages: 216-217Copyright: Don JohnsonLicense: http://creativecommons.org/licenses/by/1.0
Module: "The Ionosphere and Communications"By: Don JohnsonURL: http://cnx.org/content/m0539/2.10/Pages: 217-217Copyright: Don JohnsonLicense: http://creativecommons.org/licenses/by/1.0
Module: "Communication with Satellites"By: Don JohnsonURL: http://cnx.org/content/m0540/2.10/Pages: 217-218Copyright: Don JohnsonLicense: http://creativecommons.org/licenses/by/1.0
Module: "Noise and Interference"By: Don JohnsonURL: http://cnx.org/content/m0515/2.17/Pages: 218-219Copyright: Don JohnsonLicense: http://creativecommons.org/licenses/by/1.0

ATTRIBUTIONS 299
Module: "Channel Models"By: Don JohnsonURL: http://cnx.org/content/m0516/2.10/Pages: 219-220Copyright: Don JohnsonLicense: http://creativecommons.org/licenses/by/1.0
Module: "Baseband Communication"By: Don JohnsonURL: http://cnx.org/content/m0517/2.17/Pages: 220-221Copyright: Don JohnsonLicense: http://creativecommons.org/licenses/by/1.0
Module: "Modulated Communication"By: Don JohnsonURL: http://cnx.org/content/m0518/2.24/Pages: 221-222Copyright: Don JohnsonLicense: http://creativecommons.org/licenses/by/1.0
Module: "Signal-to-Noise Ratio of an Amplitude-Modulated Signal"By: Don JohnsonURL: http://cnx.org/content/m0541/2.16/Pages: 222-224Copyright: Don JohnsonLicense: http://creativecommons.org/licenses/by/1.0
Module: "Digital Communication"By: Don JohnsonURL: http://cnx.org/content/m0519/2.10/Pages: 224-224Copyright: Don JohnsonLicense: http://creativecommons.org/licenses/by/1.0
Module: "Binary Phase Shift Keying"By: Don JohnsonURL: http://cnx.org/content/m10280/2.13/Pages: 224-227Copyright: Don JohnsonLicense: http://creativecommons.org/licenses/by/1.0
Module: "Frequency Shift Keying"By: Don JohnsonURL: http://cnx.org/content/m0545/2.11/Pages: 227-228Copyright: Don JohnsonLicense: http://creativecommons.org/licenses/by/1.0
Module: "Digital Communication Receivers"By: Don JohnsonURL: http://cnx.org/content/m0520/2.17/Pages: 228-229Copyright: Don JohnsonLicense: http://creativecommons.org/licenses/by/1.0

300 ATTRIBUTIONS
Module: "Digital Communication in the Presence of Noise"By: Don JohnsonURL: http://cnx.org/content/m0546/2.12/Pages: 230-231Copyright: Don JohnsonLicense: http://creativecommons.org/licenses/by/1.0
Module: "Digital Communication System Properties"By: Don JohnsonURL: http://cnx.org/content/m10282/2.9/Pages: 231-233Copyright: Don JohnsonLicense: http://creativecommons.org/licenses/by/1.0
Module: "Digital Channels"By: Don JohnsonURL: http://cnx.org/content/m0102/2.13/Pages: 233-233Copyright: Don JohnsonLicense: http://creativecommons.org/licenses/by/1.0
Module: "Entropy"By: Don JohnsonURL: http://cnx.org/content/m0070/2.13/Pages: 234-234Copyright: Don JohnsonLicense: http://creativecommons.org/licenses/by/1.0
Module: "Source Coding Theorem"By: Don JohnsonURL: http://cnx.org/content/m0091/2.13/Pages: 235-236Copyright: Don JohnsonLicense: http://creativecommons.org/licenses/by/1.0
Module: "Compression and the Human Code"By: Don JohnsonURL: http://cnx.org/content/m0092/2.17/Pages: 236-237Copyright: Don JohnsonLicense: http://creativecommons.org/licenses/by/1.0
Module: "Subtleties of Source Coding"Used here as: "Subtlies of Coding"By: Don JohnsonURL: http://cnx.org/content/m0093/2.16/Pages: 237-238Copyright: Don JohnsonLicense: http://creativecommons.org/licenses/by/1.0

ATTRIBUTIONS 301
Module: "Channel Coding"By: Don JohnsonURL: http://cnx.org/content/m10782/2.4/Pages: 238-240Copyright: Don JohnsonLicense: http://creativecommons.org/licenses/by/1.0
Module: "Repetition Codes"By: Don JohnsonURL: http://cnx.org/content/m0071/2.21/Pages: 240-241Copyright: Don JohnsonLicense: http://creativecommons.org/licenses/by/1.0
Module: "Block Channel Coding"By: Don JohnsonURL: http://cnx.org/content/m0094/2.14/Pages: 241-242Copyright: Don JohnsonLicense: http://creativecommons.org/licenses/by/1.0
Module: "Error-Correcting Codes: Hamming Distance"By: Don JohnsonURL: http://cnx.org/content/m10283/2.28/Pages: 242-245Copyright: Don JohnsonLicense: http://creativecommons.org/licenses/by/1.0
Module: "Error-Correcting Codes: Channel Decoding"By: Don JohnsonURL: http://cnx.org/content/m0072/2.20/Pages: 245-246Copyright: Don JohnsonLicense: http://creativecommons.org/licenses/by/1.0
Module: "Error-Correcting Codes: Hamming Codes"By: Don JohnsonURL: http://cnx.org/content/m0097/2.24/Pages: 246-248Copyright: Don JohnsonLicense: http://creativecommons.org/licenses/by/1.0
Module: "Noisy Channel Coding Theorem"By: Don JohnsonURL: http://cnx.org/content/m0073/2.11/Pages: 248-249Copyright: Don JohnsonLicense: http://creativecommons.org/licenses/by/1.0
Module: "Capacity of a Channel"By: Don JohnsonURL: http://cnx.org/content/m0098/2.13/Pages: 249-250Copyright: Don JohnsonLicense: http://creativecommons.org/licenses/by/1.0

302 ATTRIBUTIONS
Module: "Comparison of Analog and Digital Communication"By: Don JohnsonURL: http://cnx.org/content/m0074/2.11/Pages: 250-251Copyright: Don JohnsonLicense: http://creativecommons.org/licenses/by/1.0
Module: "Communication Networks"By: Don JohnsonURL: http://cnx.org/content/m0075/2.10/Pages: 251-252Copyright: Don JohnsonLicense: http://creativecommons.org/licenses/by/1.0
Module: "Message Routing"By: Don JohnsonURL: http://cnx.org/content/m0076/2.8/Pages: 252-253Copyright: Don JohnsonLicense: http://creativecommons.org/licenses/by/1.0
Module: "Network architectures and interconnection"By: Don JohnsonURL: http://cnx.org/content/m0077/2.9/Pages: 253-254Copyright: Don JohnsonLicense: http://creativecommons.org/licenses/by/1.0
Module: "Ethernet"By: Don JohnsonURL: http://cnx.org/content/m10284/2.12/Pages: 254-256Copyright: Don JohnsonLicense: http://creativecommons.org/licenses/by/1.0
Module: "Communication Protocols"By: Don JohnsonURL: http://cnx.org/content/m0080/2.18/Pages: 256-258Copyright: Don JohnsonLicense: http://creativecommons.org/licenses/by/1.0
Module: "Information Communication Problems"By: Don JohnsonURL: http://cnx.org/content/m10352/2.21/Pages: 258-271Copyright: Don JohnsonLicense: http://creativecommons.org/licenses/by/1.0
Module: "Decibels"By: Don JohnsonURL: http://cnx.org/content/m0082/2.16/Pages: 279-279Copyright: Don JohnsonLicense: http://creativecommons.org/licenses/by/1.0

ATTRIBUTIONS 303
Module: "Permutations and Combinations"By: Don JohnsonURL: http://cnx.org/content/m10262/2.12/Pages: 280-281Copyright: Don JohnsonLicense: http://creativecommons.org/licenses/by/1.0
Module: "Frequency Allocations"By: Don JohnsonURL: http://cnx.org/content/m0083/2.10/Pages: 281-283Copyright: Don JohnsonLicense: http://creativecommons.org/licenses/by/1.0

Fundamentals of Electrical Engineering IThe course focuses on the creation, manipulation, transmission, and reception of information by electronicmeans. Elementary signal theory; time- and frequency-domain analysis; Sampling Theorem. Digital infor-mation theory; digital transmission of analog signals; error-correcting codes.
About ConnexionsSince 1999, Connexions has been pioneering a global system where anyone can create course materials andmake them fully accessible and easily reusable free of charge. We are a Web-based authoring, teaching andlearning environment open to anyone interested in education, including students, teachers, professors andlifelong learners. We connect ideas and facilitate educational communities.
Connexions's modular, interactive courses are in use worldwide by universities, community colleges, K-12schools, distance learners, and lifelong learners. Connexions materials are in many languages, includingEnglish, Spanish, Chinese, Japanese, Italian, Vietnamese, French, Portuguese, and Thai. Connexions is partof an exciting new information distribution system that allows for Print on Demand Books. Connexionshas partnered with innovative on-demand publisher QOOP to accelerate the delivery of printed coursematerials and textbooks into classrooms worldwide at lower prices than traditional academic publishers.