fundamentals of reservoir surface energy as related to ... library/research/oil-gas...1 fundamentals...
TRANSCRIPT

1
Fundamentals of reservoir surface energy as related to surface properties, wettability, capillary action, and oil
recovery from fractured reservoirs by spontaneous imbibition
DE-FC26-03NT15408
Semi-Annual Report 06/01/2005 – 12/31/2005
Norman R. Morrow, Principal Investigator
Herbert Fischer Yu Li
Geoffrey Mason Douglas Ruth
Siddhartha Seth Jason Zhengxin Tong
Peigui Yin Shaochang Wo
February 2006
Submitted by: Chemical & Petroleum Engineering
University of Wyoming Dept. 3295, 1000 E. University Ave
Laramie, WY 82071

2
Disclaimer
This report was prepared as an account of work sponsored by an agency of the United States Government. Neither the United States Government nor any agency thereof, nor any of their employees, makes any warranty, express or implied, or assumes any legal liability or responsibility for the accuracy, completeness, or usefulness of any information, apparatus, product, or process disclosed, or represents that its use would not infringe privately owned rights. Reference herein to any specific commercial product, process, or service by trade name, trademark, manufacturer, or otherwise does not necessarily constitute or imply its endorsement, recommendation, or favoring by the United States Government or any agency thereof. The views and opinions of authors expressed herein do not necessarily state or reflect those of the United States Government or any agency thereof.

3
ABSTRACT The objective of this project is to increase oil recovery from fractured reservoirs through improved fundamental understanding of the process of spontaneous imbibition by which oil is displaced from the rock matrix into the fractures. Spontaneous imbibition is fundamentally dependent on the reservoir surface free energy but this has never been investigated for rocks. In this project, the surface free energy of rocks will be determined by using liquids that can be solidified within the rock pore space at selected saturations. Thin sections of the rock then provide a two-dimensional view of the rock minerals and the occupant phases. Saturations and oil/rock, water/rock, and oil/water surface areas will be determined by advanced petrographic analysis and the surface free energy which drives spontaneous imbibition will be determined as a function of increase in wetting phase saturation. The inherent loss in surface free energy resulting from capillary instabilities at the microscopic (pore level) scale will be distinguished from the decrease in surface free energy that drives spontaneous imbibition. A mathematical network/numerical model will be developed and tested against experimental results of recovery versus time over broad variation of key factors such as rock properties, fluid phase viscosities, sample size, shape and boundary conditions. Two fundamentally important, but not previously considered, parameters of spontaneous imbibition, the capillary pressure acting to oppose production of oil at the outflow face and the pressure in the nonwetting phase at the no-flow boundary versus time, will also be measured and modeled. Simulation and network models will also be tested against special case solutions provided by analytic models. In the second stage of the project, application of the fundamental concepts developed in the first stage of the project will be demonstrated. The fundamental ideas, measurements, and analytic/numerical modeling will be applied to mixed-wet rocks. Imbibition measurements will include novel sensitive pressure measurements designed to elucidate the basic mechanisms that determine induction time and drive the very slow rate of spontaneous imbibition commonly observed for mixed-wet rocks. In further demonstration of concepts, three approaches to improved oil recovery from fractured reservoirs will be tested; use of surfactants to promote imbibition in oil wet rocks by wettability alteration: manipulation of injection brine composition: reduction of the capillary back pressure which opposes production of oil at the fracture face.

4
TABLE OF CONTENTS
INTRODUCTION .......................................................................................................................... 5
Objectives.................................................................................................................................... 5 TASKS ........................................................................................................................................ 5
EXECUTIVE SUMMARY ............................................................................................................ 7 Progress BY TASK - Budget Period 2 ........................................................................................... 8
Task 6. Rock preparation and Work of displacement and surface areas ................................... 8 Introduction ............................................................................................................................. 8 Experimental.......................................................................................................................... 10 Results and Discussion .......................................................................................................... 11 References ............................................................................................................................. 12
Task 7. Novel imbibition measurements on mixed-wet rock and network models.................... 20 Introduction ........................................................................................................................... 20 Experimental.......................................................................................................................... 20 Results and Discussion .......................................................................................................... 20
Task 8. Application of network/numerical model to mixed wet rocks. ..................................... 21 Introduction ........................................................................................................................... 21 Experiments ........................................................................................................................... 23 Results and Discussion .......................................................................................................... 24 References ............................................................................................................................. 50
Task 9. Increased oil recovery by spontaneous imbibition. ...................................................... 51 Introduction ........................................................................................................................... 51 Experimental.......................................................................................................................... 51 References ............................................................................................................................. 52
CONCLUSIONS........................................................................................................................... 52

5
INTRODUCTION
Objectives The long-range objective of this project is to improve oil recovery from fractured reservoirs through improved fundamental understanding of the process of spontaneous imbibition by which oil is displaced from the rock matrix into the fractures. Spontaneous imbibition is fundamentally dependent on the surface energy. An initial objective is to determine the surface energy and relate the dissipation of surface energy to the mechanism of spontaneous imbibition. A parallel objective is to model the mechanism of spontaneous imbibition by a combination of network analysis and numerical modeling. Also fundamentally important, but not previously considered, parameters of spontaneous imbibition, the capillary pressure acting to oppose production of oil at the outflow face and the pressure in the nonwetting phase at the no-flow boundary (in effect within oil in the non-invaded zone of the rock matrix) versus time, will also be measured and compared with values predicted by the mathematical model. The next objective is to measure surface energy and related spontaneous imbibition phenomena for mixed-wettability rocks prepared by adsorption from crude oil. The dissipation of surface free energy must then be related to oil production at mixed-wet conditions. The final objective is to apply the results of the project to improved oil recovery from fractured reservoirs in three ways: reduction of the capillary force that opposes oil production at the fracture face; change in wettability towards increased water wetness; identification of conditions where choice of invading brine composition can give improved recovery.
TASKS Budget period 1, July 1, 2003 through June 30, 2005 – Ideas and Concept development: Fundamentals of Spontaneous Imbibition
Task 1. Work of displacement and surface free energy. Obtain complementary sets of capillary pressure drainage and imbibition data and data on changes in rock/brine, rock/oil, and oil/brine interfacial areas with change in saturation for drainage and imbibition for at least two rock types (sandstone and carbonate). Determine free-energy/work-of-displacement efficiency parameters for drainage and imbibition for at least two rock types so that changes in rock/wetting phase/nonwetting phase surface areas can be closely estimated from capillary pressure measurements.
Task 2. Imbibition in simple laboratory and mathematical network models. Study imbibition in at least three simple tube networks that can be modeled analytically to establish and/or confirm fundamental aspects of the pore scale mechanism of dynamic spontaneous imbibition with special emphasis on determining how spontaneous imbibition is initiated and the key factors in how the saturation profile develops with time. Incorporate rules developed from laboratory measurements on relatively simple networks into the design of a computational network model. Use the network model to obtain an account of the mechanism by which imbibition is initiated, the saturation profile is developed, and the rate of spontaneous imbibition in terms of the dissipation of surface free energy that accompanies change in saturation.

6
Task 3. Novel observations on fluid pressures during imbibition and the mechanism of non-wetting phase production at the imbibition face. Make novel observations on the imbibition mechanism including details of the mechanism of oil production at the outflow rock face and the change in the nonwetting phase pressure at the no-flow boundary of the core during the course of spontaneous imbibition for at least 16 distinct combinations of rock/ fluid properties.
Task 4. Network/numerical model and new imbibition data. Develop a numerical simulator specifically designed for spontaneous imbibition. Incorporate the network model to obtain a network/numerical model that includes matching the measured pressure in the nonwetting phase at the no-flow boundary, and the pressure that opposes production of oil at the open rock face. Imbibition data will be obtained for at least 10 rocks with over six-fold variation in permeability, and at least 6 orders of magnitude variation in viscosity ratio, and at least 10 variations in sample size, shape, and boundary conditions.
Task 5. Comparison with similarity solutions. Compare results given by simulation with special case analytic results given by similarity solutions for spontaneous imbibition for at least five distinct cases of rock and fluid properties. Budget Period 2, July 1, 2005 through June 30, 2008 - Demonstration of concept: Application to mixed wettability rocks and improved oil recovery from fractures reservoirs.
Task 6. Rock preparation and Work of displacement and surface areas Obtain a range of rock types and identify and obtain crude oils that induce stable mixed wettability. Prepare at least 25 rocks with mixed wettability through crude oil/brine/rock interactions. Determine work of displacement for drainage and imbibition and measure the variation in rock/brine, rock/oil, and oil/brine interfacial areas during the course of drainage and imbibition for at least two examples of mixed wettability.
Task 7. Novel imbibition measurements on mixed-wet rock and network models. Obtain, for at least six mixed-wet rocks, spontaneous imbibition data that includes measurements of the nonwetting phase pressure at the no-flow boundary, observations on the capillary pressure that resists production at the open rock face.
Task 8. Application of network/numerical model to mixed wet rocks. Use network models to relate dissipation of surface energy to rate of spontaneous imbibition and to account for the frequently observed induction time prior to the onset of spontaneous imbibition into mixed wettability rocks.
Task 9. Increased oil recovery by spontaneous imbibition. The mechanism of increased recovery from mixed wet rocks by use of surfactants that promote spontaneous imbibition by favorable wettability alteration will be investigated for at least four distinct examples of crude oil/brine/rock/surfactant combinations. The mechanism of increased recovery by manipulation of brine composition will be investigated for at least four crude oil/brine/rock combinations.

7
Addition of very low concentration surfactants to the imbibing aqueous phase will be explored as a means of increasing the rate of oil recovery by reducing the capillary forces which resist production of oil at the fracture face. At least twelve combinations of rock and fluid properties including both very strongly wetted and mixed wet rocks will be tested.
EXECUTIVE SUMMARY
This report marks the transition to Tasks 6-9 which concern the fundamentals of spontaneous imbibition and improved oil recovery from mixed wet rocks. For the past 50 years or so, capillary pressure data have been used to determine changes in surface area that accompany displacement of one phase by another. However, the irreversibility of the displacement process because of spontaneous redistribution of fluids results in an inherent inefficiency in the conversion of work of drainage to the surface energy which drives spontaneous imbibition. A simple form of a new pore model for thermodynamic efficiency of drainage is presented which includes the effects of mixed wettability. The model will be extended to complex pore shapes that include retention of wetting phase in corners, variation in pore shape, the presence of micro-porosity, and variation in aspect ratio. Results are also presented of comparison of work of displacement from capillary pressure data and direct measurements of surface area. Values of efficiency of conversion of work to surface free energy determined by experiment of only about 25% are consistent with model calculations using published estimates of aspect ratio for Berea sandstone. Novel imbibition measurements have been made on mixed wet rocks. The pressure developed ahead of the imbibition front is measured by means of a sensitive pressure transducer. Preliminary results indicate distinct differences in the imbibition mechanism for mixed wet versus strongly water wet rocks. Extensive study through the behavior of networks, and the results of simulation, and experimental data, that cover over four orders of magnitude variation in viscosity ratio and three boundary conditions, have lead to a new model for spontaneous imbibition. The model is base on piston-like displacement. Wide variation in viscosity ratio was achieved by choice of oil and by viscosifying the aqueous phase with glycerol. Preliminary results have been obtained for imbibition of viscous aqueous phase into mixed wet cores. Selection of experimental systems has been made for three approaches to improved oil recovery by spontaneous imbibition. The methods are manipulation of brine composition, and use of surfactants to promote imbibition either by changing wettability towards increased water wetness, or by lowering the interfacial tension at the production face in order to drastically lower the capillary back pressure that opposes oil production.

PROGRESS BY TASK - BUDGET PERIOD 2
Task 6. Rock preparation and Work of displacement and surface areas
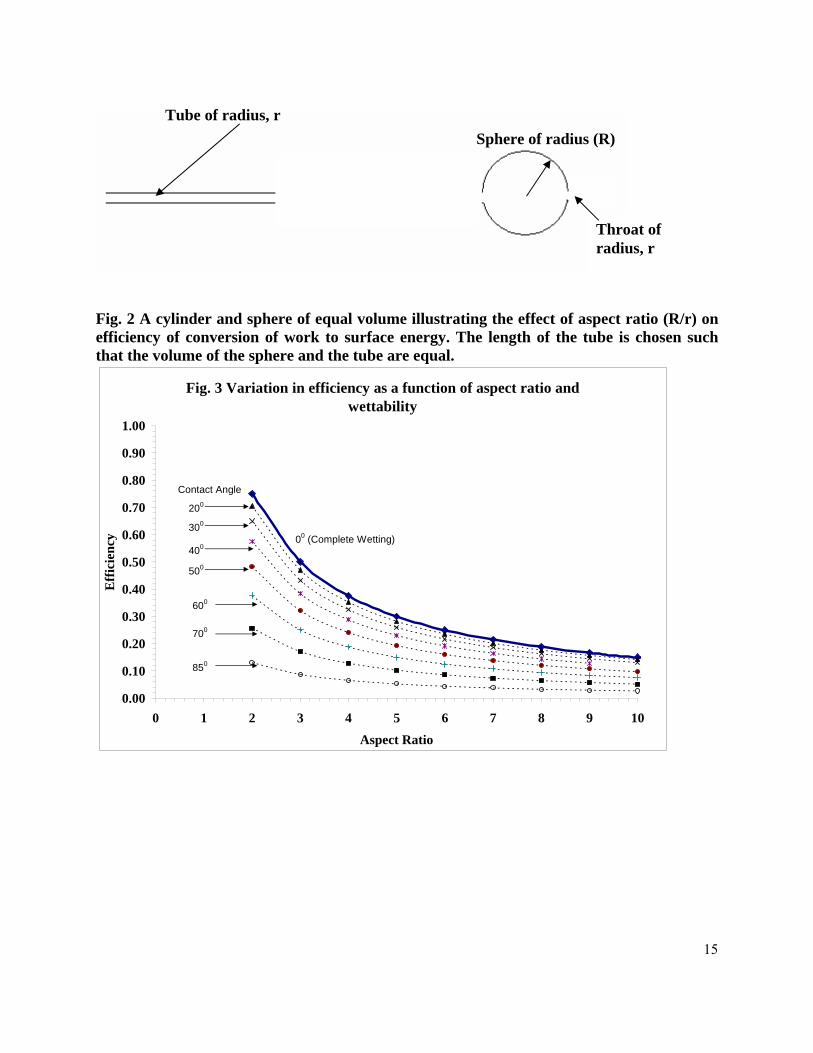
Introduction Measurement of changes interfacial areas that accompany immiscible displacement process has been of widespread interest1-12 and a variety of techniques such as use of interfacial tracer3-6, SEM7, thin sections8-9 and mathematical models10-12 have been used. Alpak1 and Bradford2 used the capillary pressure curve to derive interfacial areas i.e. Aw-nw = f (Pc, Sw) whereas others used the hypothesis developed by Hassanizadeh and Grey13 where capillary pressure was a function of not only saturation but also interfacial area (Pc = f (Aw-nw, Sw)). The area under the capillary pressure curve is the work done on the system that leads to change in surface energy that is determined by change in surface area. The fundamental flaw in using interfacial areas as a assessment to obtain capillary pressure1,2 or vice-versa10-12 is that 100% conversion efficiency of work to surface energy is assumed. In fine detail the capillary curves can be interpreted as a series of reversible displacements (termed isons) linked by spontaneous redistributions at constant saturation (termed rheons); this is the basic cause capillary pressure hysteresis. Experimental results that demonstrate this mechanistic interpretation have been reported by (Yuan et al.14). For porous media the efficiency of conversion of work of drainage to surface energy is less than 100%. Similarly the conversion of surface energy to work of imbibition is also less than 100%. Fig. 1 shows an interface moving through a throat that is connected to a larger size pore. As the interface starts to fill the pore body, its curvature changes and snap-off occurs to form disconnected blobs. At snap-off the work done is zero and the system losses surface energy (rheon). As the pore body fills, the drops will coalesce to eventually fill the pore body. This leads to inefficiency in conversion of work to surface energy. Wardlaw15 et al. reported that the pore throat to pore diameter distribution for a Berea sandstone is uncorrelated. This means that there is a high probability that a large pore is connected to one or more smaller throats (high aspect ratio). Roof16 had reported that for an oil-water interface during drainage, for a doughnut shaped hole, the non-wetting phase must protrude 7 times the throat radius before snap-off can occur. He also pointed out that for the case in which aspect ratio is low a snap-off may not occur. Li and Warlaw17 had also suggested that snap-off during drainage of the non-wetting phase is likely to take place. A simple tube model of non-uniform crosse-section can be used to illustrate the relationship between aspect ratio and the efficiency of conversion of work to surface energy. Consider a pore model formed by cylinders and spheres of the same volume (Fig. 2). In this case the non wetting phase entering a spherical cavity of radius (R) through cylindrical tube of throat of radius (r), the length, L, of the cylindrical pore of radius, r, having the same volume as the sphere of radius, (R), is given by:
32
34 RLr ππ = (1a)
8

so that, 2
3
34
rRL = (1b)
If the work of displacement in moving an interface is reversible, as in a uniform tube of radius, r, the conversion of work to surface energy is 100% (piston like displacement). However, for an interface which moves irreversibly into a pore of larger radius than the pore throat, we assume a sphere of radius R, the corresponding area created is less than the work defined by the entry pressure times the displacement volume. The ratio of the area created in draining the spherical pore to that for the equivalent cylindrical pore gives the efficiency of conversion of work, Ed,
Ed = Ratio of area created = rLR
ππ
24 2
(2)
Substituting for L from Eq. 1b in Eq. 2, the efficiency, Ed, is given by:
Ed = R
r5.1
or Ed = oAspectRati
5.1 (3)
For a mixed wettability condition with the contact angle of the sphere equal to θ, the surface energy of the spherical cavity would then be proportional to: (4) θπ cos4 2R Consequently the efficiency in this case is then given by:
Ed = oAspectRati
θcos5.1 (5)
Fig. 3 summarizes the results obtained by using Eq. 5 for change in displacement efficiencies as a function of the aspect ratio. The same principle can be used to determine displacement efficiency for a wide range of pore throat and body shapes and aspect ratio. Random packings of equal spheres provide a set of packings of statistically similar geometry with porosity almost constant at about 37% and permeability proportional to the square of the sphere radius. For three sizes of sphere, the fraction of sphere surface drained was shown to be constant and equal to 71 % of the total sphere surface (Morrow8). The wetting/nonwetting surface area at the irreducible saturation (with respect to mechanical equilibrium) was equal to about 7.5 % of the total sphere surface area (Morrow8). Comparison of the work of displacement with increase in surface energy provides an estimate of the efficiency of conversion of work to surface free energy. For a random packing of spheres this efficiency was found to be 79%. The
9

present work is focused on determining change in surface areas and the efficiency of conversion of work of drainage to surface free energy that accompany drainage of sandstone. Comparisons with sphere packs provided illustration of the challenges presented by more complex media such as sandstones. Procedures for establishing changes in wetting phase saturation and determination of changes in surface area present greater technical challenges and results cannot be cross checked because in general sandstones of different porosity and permeability are not geometrically similar. Equilibration times for determination of capillary pressure data and identification of equilibrium points are much longer than for sphere packs. There is no definitive value of irreducible saturation (and the associated control on surface area) resulting from mechanical equilibrium for sandstones because, unlike spheres which have smooth surfaces, paths of bulk wetting phase are maintained down to low wetting phase saturation. There is also a problem in obtaining unequivocal capillary pressure data. There are surprisingly large and unresolved differences between scaled results for widely used measurements of capillary pressure curves, namely by mercury injection, centrifuge, and porous plate (Sallier18).
Experimental Capillary pressure measurements Sallier18 et al. reported the ratio of the dimensionless capillary pressure (Pc/σ) obtained, for duplicate samples, from water/oil centrifuge and mercury injection to be as high as 2. The capillary pressure was calculated as: Capillary pressure, Pc = ½ ∆ρω2 (r2
outlet - r2) (6) Where r is the radii from the centre of rotation to the any point in the core routlet is the radii from the centre of rotation to the end of the core ω is the angular speed The saturation can be obtained from
dVSRL
S zr∫>=< ωπ ,,2
1 (7)
Where, <S> is the average saturation r, is distance from the axis of rotation to any point in the core R is the core radius L is the core length Various methods to obtain the capillary pressure S(Pc) from the average value of the fluid saturation, <S> using Eq 2 have been proposed by Hassler and Brunner19, Van Domselaar20, Hoffman21, Rajan22, Forbes23 (1st method), Clinch24, Chen and Ruth25, Forbes26, 23 (2nd method), Ruth and Wong27, 28 (1st method), Ruth and Wong29 (2nd method), Hermansen30 et al., Bentsen and Anli31, Nordtvedt32, Jaimes33, Skuse34 et al., King35 et al. In a SCA survey summarized by
10

11
Forbes36 et al. compared 19 different solutions and concluded that the final capillary pressure curve varied quantifiably from one method to any other. For the sandstone sample (PH2) used in this study, the raw data, obtained by centrifuge was converted to saturation at the inlet face using proprietary software developed by Dr. Douglas Ruth at the University of Manitoba. The curves obtained using 13 different equations proposed by various researchers are shown in Fig. 4. Three of the methods that were recommended over others were used to obtain work done from the area under the capillary pressure curve. The data for obtained by integrating under the capillary pressure curve for these selected methods and its comparison with mercury injection is shown in Fig 5. The curves differed quantifiably in shape and value for the same raw data, thus demonstrating the uncertainty in obtaining a unique capillary pressure curve. Additional results for sandstones The procedure used to make the thin sections, obtain pictures under reflected light, and application of stereology to obtain to calculate surface areas had been discussed in the quarterly report 8 (04/05 – 06/05). Also presented in that report, were data from 3 cores samples from which 7 thin sections were obtained and analyzed at 10 X magnification. To obtain the data for a wider range of saturation values, 2 more samples were cut and 7 more thin sections were prepared and analyzed at 20 X magnification. The data obtained at both 10 X and 20 X magnification matched closely showing that the data was not biased by the magnification used for analysis. The total surface area, TSSA, was calculated by adding the interfacial area between the solid – red and the solid – blue phases (Fig. 6) and was found to be 0.001 m2/g (average). TSSA was a fraction (1.6%) of the BET solid surface area (measured by nitrogen adsorption) because the wetting phase associated with the clays and other forms of microporosity (that are the main contributors to the BET surface area), is not invaded by the non-wetting phase at the capillary pressure applied. The interfacial area between the wetting and the non-wetting phase (red – blue) interface is of special interest with respect to flow and transport properties. As can be seen from Fig. 7, this area increased from 0 (at Sw = 100%) to a maximum close to (over a saturation (Sw) range of 30 – 75%) about 2% of the TSSA as operationally defined by imaging (or 0.03% of the BET solid surface area). Morrow8 reported that the maximum area between fluids in glass bead packs was 7.4% of the TSSA. Created surface area (CSA) increases with the decrease in the wetting phase saturation. At very low wetting phase saturation it approaches the operationally defined total surface area (TSSA). CSA was calculated as the sum of interfacial area between solid–red and the red–blue phase (Fig. 8). Most of the CSA corresponds to change in overlying phase at the solid surface (blue/solid to red/solid). Increase in CSA is almost linear with saturation.
Results and Discussion

12
Efficiency of conversion of work to surface area The area corresponding to the work done under the capillary pressure curve obtained from mercury injection and centrifuge and the corresponding change in surface area obtained from thin section (CSA) are shown in Fig. 9. The difficulty in obtaining a single valued capillary pressure curve were noted earlier and at present we do not have a compelling reason for choosing one method over the other. The presented range of efficiency conversion (20 – 36%) of work to surface energy corresponds to the difference in capillary pressure behavior. This efficiency, at different wetting phase saturations, is shown in Fig. 10. The efficiency of conversion of work is a non linear function of the saturation and the efficiency of conversion of work to surface energy in draining a fully saturated core to Sw = 20 % was found to vary from 20% (using mercury injection data) to 36% (using centrifuge data). On average this was much less than half of that reported for a random sphere pack (79%). It is concluded that the efficiency is greatly affected by ratio of pore throat to pore body size, referred to as aspect ratio. The aspect ratio for the case of a cubic packing of sphere is 1.77 and 1.45 – 2.67 for hexagonal packing. For a Berea sandstone as deduced from the data presented by Warldaw15 the aspect ratio was 7.7 (Fig. 11) while from Chatzis37 the aspect ratio ranged from 4 – 6.7. So assuming a average value of 6 (for aspect ratios ranging from 4 – 7.7) the model shown in Fig. 1 gives an efficiency of 25% which is consistent with measured efficiency of 36% (centrifuge) and 20% (mercury injection).
References 1. Alpak F.O., Lake L.W. and, Embid S.M., “Validation of a modified Carman – Kozeny
equation to model two phase relative permeabilities”, SPE (56479) Annual Technical Conference and Exhibition, Houston, TX, 3 – 6th Oct 1999
2. Bradford S., Leij F, “Estimating area for multi-fluid soil systems”, Journal of Contaminant Hydrology, 27 (1997) 83-105
3. Jain V., Bryant S., Sharma M.M., “Influence of wettability and saturation on liquid-liquid interfacial areas”, Environ. Sci. Technol. 2003, 37, 584-591
4. Kim H., Rao S.C., Annable M.D., “Determination of effective air-water interfacial area in partially saturated porous media using surfactant adsorption”, Water Resources Research, 33 , 2705-2711, Dec 1997
5. Schaefer C.E, DiCarlo D.A., and Blunt M, “Determination of water-oil interfacial area during 3-phase gravity drainage in porous media”, J. Colloid and Interface Science 221, 308-312 (2000)
6. Schaefer C.E, DiCarlo D.A., and Blunt M, “Experimental measurement of air-water interfacial area during gravity and secondary imbibition in porous media”, Water Resources Research. Vol. 36 No.4, 885-890 (April 2000)
7. Pyrak-Nolte L.J., Yu P., Cheng J.T., Chen D., Giordano N., Mustata M., Coy J., Cooper N., and Nolte D.D., “Experimental Investigation of Relative Permeability Upscaling from the Micro-Scale to the Macro-Scale” Semi-Annual Progress Report, Purdue Research Foundation Department of Physics, Dec 2002
8. Morrow, N.R., “Physics and thermodynamics of capillary action in porous media”, I&EC 1970
9. Cheng J.T, Pyrak-Nolte L.J., Nolte D.D, and Giordano N, “Linking pressure and saturation through interfacial areas in porous media” Geophysical Research Letters, Vol. 31, L08502, April 2004

13
10. Beliaev A.Y., and Hassannizadeh S.M. “A Theoretical Model of Hysteresis and Dynamic Effects in the Capillary Relation for Two-phase Flow in Porous Media” Transport in Porous Media 43: 487–510, 2001
11. Reeves P.C., and Celia M.A. “A functional relationship between capillary pressure, saturation, and interfacial area as revealed by a pore-scale network model”, Water Resources Research, Vol. 32, No. 8, 2345–2358, Aug 1996
12. Celia M.A, Gray W.G., and Montemagno “ On the inclusion of interfacial area in models of two-phase flow in porous media” Proc. Groundwater Quality Conference Tuebingen, Germany 1998
13. Hassanizadeh S.M, and Gray W.G., “Mechanics and thermodynamics of multiphase flow in porous media including interphase boundaries” Adv. Water Resources, Vol. 13 No. 4 (1990)
14. Yuan, H.H., and Swanson B.F, “Resolving pore-space chaterestics by rate-controlled porosimetry”, SPE Formation Evaluation, SPE 14892, 17 -24, March1989
15. Wardlaw N.C. and Forbes D., ‘Pore-throat size correlation from capillary pressure curves’, Transport in Porous Media 2 (1987), 597-614
16. Roof J.G., ‘Snap-off of oil droplets in water-wet pores’, SPEJ Transaction Vol. 249,1970, 85-90
17. Li Y. and Wardlaw N.C., ‘Mechanism of nonwetting phase trapping during imbibition at slow rates’, J. Colloid and Interface Science, Volume 109, No. 2, Feb 1986
18. Sallier B. and Hamon G. ‘Micritic limestone of the middle east: Influence of wettability, pore network and experimental technique on drainage capillary pressure curve’, SCA, Toronto, 2005
19. Hassler, G.L. and Brunner, E., ‘Measurement of capillary pressure in small cores’ Trans AIME 1945, 160, 114-123
20. Van Domselaar, H.R. ‘An exact equation to calculate actual saturations from centrifuge capillary pressure measurement’ Rev. Tec. INTEVEP, V.4, N.1, p.55-62, 1984
21. Hoffman R.N. ‘A technique for the determination of capillary pressure curves using a constantly accelerated centrifuge’, Trans AIME, 228, p 227-235, 1963
22. Rajan R.R. ‘Theoretically correct analytical solution for calculating capillary pressure-saturation from centrifuge experiments’, SPWLA Annual Logging Symp., June 9-13, p 1-17, 1986
23. Forbes P.L., ‘Simple and accurate methods for converting centrifuge data into drainage and imbibition capillary pressure curves’, SCA, August 20-22, San Antonio, 1991
24. Clinch S., ‘Interpreting centrifuge capillary pressure data: The approximation solution. Refer to Forbes P., ‘Centrifuge data analysis techniques: An SCA survey on the calculation of drainage capillary pressure curves from centrifuge measurements’ SCA 9714, 1997
25. Chen Z.A., and Ruth D.W., ‘Centrifuge capillary pressure reduction with modified Forbes method, JPSE, 9, 303-312, 1993
26. Forbes P.L., ‘Simple and accurate methods for converting centrifuge data into drainage and imbibition capillary pressure curves’, SCA, August 20-22, San Antonio, 1994
27. Ruth D., and Wong S., ‘Calculation of capillary pressure curves from data obtained by the centrifuge method’ SCA Conference, Aug 17-18, 1988
28. Ruth D., and Wong S., ‘Calculation of capillary pressure curves from data obtained by the centrifuge method’ The log Analyst, v. 32, n.5, p. 575-582, 1991
29. Ruth D., and Wong S., ‘Calculation of capillary pressure curves’ Journal of Canadian Petroelum Technology, v. 29, n.3, p. 67-72, 1990
30. Hermansen H., Eliassen O., Guo Y., and Skjaeveland S.M., ‘Capillary pressure from centrifuge – Anew direct method’ Advances in core evaluation II, Reservoir Appraisal,

Worthington and Longeron eds., Gordon and Breach Science Publishers, (reviewed proceedings of the SCA Conference Euroas II, London, UK, 20-22 May 1991 p. 453-468
31. Bentsen R.G., and Anli J., ‘Using parameter estimation technique to convert centrifuge data into capillary pressure curve’, SPEJ 1997 p. 57-54
32. Nordtvedt J.E., ‘Using inverse problem formulation to calculate characteristic properties of the porous medium’, Ph.D. Thesis, Bergen University Norway, 1989
33. Jaimes O., ‘Centrifuge capillary pressure: Method of centre of forces’, SPE 22687, Oct 6-9, 1991
34. Skuse B., Firoozabadi A., and Ramey H.J., ‘Computation and interpretation of capillary pressure from centrifuge’, SPE 18297, Oct 2-5 1988
35. King M.J., Falzone A.J., Cook W.R., Jennings J.W. jr., and Mills W.H., ‘Simultaneous determination of residual saturation and capillary pressure curves utalizing ultracentrifuge’, SPE 15595 ATCE, New Orleans, Oct 5-8 1986
36. Forbes P., ‘Centrifuge data analysis techniques: An SCA survey on the calculation of drainage capillary pressure curves from centrifuge measurements’ SCA 9714, 1997
37. Chatzis I., Morrow N.R., Lim H.T., ‘Magnitude and detailed structure of residual oil saturation’ SPE 10681 April 1993
Fig. 1 Sequence of steps leading to snap off in pores of high aspect ratio
14
Tube of radius, r
Throat of radius, r
Sphere of radius (R)
Fig. 2 A cylinder and sphere of equal volume illustrating the effect of aspect ratio (R/r) on efficiency of conversion of work to surface energy. The length of the tube is chosen such that the volume of the sphere and the tube are equal.
Fig. 3 Variation in efficiency as a function of aspect ratio and wettability
0.00
0.10
0.20
0.30
0.40
0.50
0.60
0.70
0.80
0.90
1.00
0 1 2 3 4 5 6 7 8 9 10Aspect Ratio
Eff
icie
ncy
Contact Angle
00 (Complete Wetting)
600
500
400
300
200
850
700
15

Fig 4 Capillary Pressure curves obtained by using different equations for the same raw data
0
100
200
300
400
500
600
700
800
0 0.1 0.2 0.3 0.4 0.5 0.6 0.7 0.8 0.9 1Sw
Pres
sure
, KPa
Raw Data Ruth Wong First MethodRajan's method Forbes Second MethodMelrose VanDomeslaar Cubic SplineHassler Brunner 1st Method Hassler Brunner Iterative MethodRuth Wong Second Method Ruth Forbes MethodBentson Model Ver 1 Bentson Model Ver 22nd Benston Model Ver 1 2nd Benston Model Ver 2
PH 2 SampleK = 740 mdPorosity = 22 %BET Surface Area = 0.626 m2/gCEC = 0.00145 meq/g
Fig. 5 Area obatined from different techniques by integrating under the capillary pressure curve (work done)
0
0.01
0.02
0.03
0.04
0.05
0 10 20 30 40 50 60 70 80 90 100Sw, %
Are
a m
2 /g
Centrifuge Cubic Spline
Centrifuge Forbes 2nd Solution
Centrifuge Ruth Wong First Method
Mercury Injection contact angle 0 degree
PH 2 SampleK = 540 - 740 mdPorosity = 21 %BET Surface Area = 0.626 m2/gCEC = 0.00145 meq/g
16

Fig. 6 Variation of total solid surface area (TSSA) with the wetting phase saturation
0
0.005
0.01
0.015
0.02
0.025
0.03
0 10 20 30 40 50 60 70 80 90 100Sw, %
Are
a m
2 /g
Solid RedSolid BlueTSSA
PH 2 SampleK = 540 - 740 mdPorosity ~ 21 %BET Surface Area = 0.626 m2/gCEC = 0.00145 meq/g
Total Solid Surface Area, TSSA
Solid - Wetting Surface Area
Solid - Non-wetting Surface Area
Fig 7 Variation in area between the wetting and the non-wetting phase
0
0.0005
0.001
0.0015
0.002
0.0025
0.003
0 10 20 30 40 50 60 70 80 90 100Sw, %
Are
a m
2 /g
Red - BluePH 2 SampleK = 540 - 740 mdPorosity ~ 21 %BET Surface Area = 0.626 m2/gCEC = 0.00145 meq/g
17

Fig 8 Variation in created surface area (CSA) with the wetting phase saturation
0
0.002
0.004
0.006
0.008
0.01
0.012
0.014
0 10 20 30 40 50 60 70 80 90 100Sw, %
Are
a m
2 /g
Solid - RedRed - BlueCSA
PH 2 SampleK = 540 - 740 mdPorosity ~ 21 %BET Surface Area = 0.626 m2/gCEC = 0.00145 meq/g
Created Surface Area, CSA
Wetting - Non-wetting Surface Area
Solid - Non-wetting Surface area
Fig 9 Area obatined from different techniques by integrating undere capillary pressure curve (work done) and the correspondin
ch
th g
ange in surface energy
0
0.005
0.01
0.015
0.02
0.025
0.03
0.035
0.04
0.045
0.05
0 10 20 30 40 50 60 70 80 90 100
Sw, %
Are
a m
2 /g
Centrifuge Cubic Spline (Work done)Centrifuge Forbes 2nd Solution (Work done)Centrifuge Ruth Wong First Method (Work done)Mercury Injection (Work done)Thin Section (Surface energy)
PH 2 SampleK = 540 - 740 mdPorosity = 21 %BET Surface Area = 0.626 m2/gCEC = 0.00145 meq/g
Fig. 9 Area obtained from different techniques by integrating under the capillary pressure curve (work done) and the
corresponding change in surface energy
18

Fig 10 Change in efficiency of conversion of work to surface energy as a function of the wetting phase saturation
0
10
20
30
40
50
60
70
80
90
100
0 10 20 30 40 50 60 70 80 90 100Sw, %
Eff
icie
ncy,
%
Centifuge Cubic SplineCentrifuge Forbes 2ndCentrifuge Ruth Wong 1st MethodMercury Injection contact angle 0 degree
PH 2 SampleK = 540 - 740 mdPorosity ~ 21 %BET Surface Area = 0.626 m2/gCEC = 0.00145 meq/g
19
Fig 11 Pore throat to pore body diameter for Berea sandstone (Wardlaw N.C. Li. Y., and Forbes D., “Pore-throat size correlation from capillary pressure curves”, Transport in Porous Media 2 (1987), 597-614

20
Task 7. Novel imbibition measurements on mixed-wet rock and network models.
Introduction Measurements of capillary end pressure for linear imbibition in very strongly water-wet rocks have been described previously (Li et al., 2004, Tong et al., 2003). Measurement of the capillary back pressures, Pcb, and frontal capillary pressure, Pcf, is being extended to mixed-wet cores.
Experimental The method is to obtain the end pressure (Pend) for one-face-open cores during COUCSI and convert to values of Pcf and Pcb separately from the Pend measured for cores with and without low permeability core segments at the open end of the core. The core properties: all tested cores were selected from high permeability Berea sandstone (D=3.6~3. 8 cm, L=6.5 cm, φ=22.5%, K=1 µm2). All low permeability core segments were selected from Texas Leuders limestone (D=3. 88 cm, L=1. 6 cm, φ=16 %, K=2 µm2). Cottonwood crude oil was chosen as a wettability alteration agent because of its moderate wettability alteration capability. The density of Cottonwood crude oil is 0.8874 (20ºC) and the viscosity is 24.1 Pa.s K=2 µm2). The brine was 10,000 ppm NaCl with viscosity of 0.00102 Pa. and a density of 0.998 (20ºC). The interfacial tension between Cottonwood crude oil and the brine was 29.7 mN/m. Aging An initial water saturation, Swi, of around 25 % was established by flow of crude oil. Cores were then aged at 75ºC for 10 days. One of the cores was completely saturated with Cottonwood crude oil and then aged at 75ºC for 10 days. Tests were also run on cores saturated partially with Soltrol 220 refined oil (viscosity of 0.0038 Pa.s) to give an Swi of around 21 %. These cores were not aged.
Results and Discussion Zero Initial Water Saturation of MXW Cores The preliminary results for MXW cores at Swi showed several differences in performance compared to very strongly water wet (VSWW) cores:
1. Electrical measurements showed that the front moves more quickly than in the VSWW case.
2. The frontal interfacial curvature is less than that in the VSWW case, but was greater than for a core that was completely saturated and aged with Cottonwood crude oil.
3. The interfacial curvature related to the back pressure is much less than that in the VSWW case.
References: Li, Y., Ruth, D., Mason, G., and Morrow, N.R., “Pressure Acting in Counter-current
Spontaneous Imbibition”, paper presented at the 8th International Symposium on Reservoir Wettability, May 16-18th, 2004, Houston, TX., JPSE in press.

21
Tong, Z.X., Xie, X. and Morrow, N.R., “Spontaneous Imbibition For Mixed-Wettability States In Sandstones Induced By Adsorption From Crude Oil”, JPSE, 39, 3-4, 2003, 351-361.
Table 1. Frontal capillary pressures HIGH
K CORE
D
(cm)
Lc
(cm)
K
(µm2)
φ
(%)
Swi
%
ρo µo
(Pa.s)
Pcf
(Pa)
σ
mN/m
TYPE
H6O 3.795 6.967 1.067 22.2 0 0.783 0.0038 12400 48.85 VSW HB1 3.343 6.567 0.86 21.5 21 0.783 0.0038 4800 48.85 VSW HC4 3.788 6.555 0.991 22 0 0.8874 0.0241 1550 29.7 MXW? HO3 3.703 6.45 1.026 22 25.3 0.8874 0.0241 880 29.7 MXW
Table 2. Capillary back pressures HIGH
K CORE
D
(cm)
Lc
(cm)
K
(µm2)
φ
(%)
Swi
%
ρo µo
(Pa.s)
Pend
(Pa)
σ
mN/m
TYPE
(µm-1) H8O 3.796 6.864 1.094 22.1 0 0.783 0.0038 3140 48.85 VSW HA1 3.3 6.594 0.894 21.6 21 0.783 0.0038 2120 48.85 VSW HC1 3.795 6.624 0.957 22 0 0.8874 0.0241 350 29.7 MXW? HO1 3.67 6.438 1.046 22.2 25.2 0.8874 0.0241 0 29.7 MXW
Task 8. Application of network/numerical model to mixed wet rocks. Abstract Spontaneous imbibition data for Berea sandstone cores are reported for linear, radial, and all-faces-open boundary conditions for oil viscosities of 4, 63 and 173 cP and six aqueous phase viscosities ranging from 1 to 495 cP. A linear correlation between the frontal position and imbibition time was obtained for both linear and radial counter-current flow on a log-log scale. Moreover, in the dimensionless format, the slopes of such linear correlations are close to 0.5. Behavior is consistent with near piston-like displacement by the imbibing water as is commonly observed for very strongly water wet porous media. The results are analyzed by a new mathematical model that accounts for counter-current spontaneous imbibition with symmetrical flow patterns. Although the capillary pressure changes linearly with distance behind the front, the change in saturation and permeabilities to counter-flowing phases with change in local interfacial curvatures is neglected. The dimensionless generalized scaling group (Ma et al., 1995) is extended to account for the effect of viscosity ratio for linear, radial and spherical flow. For the all-faces-open boundary condition, commonly used in core analysis studies, oil recovery vs. imbibition time can be estimated by combination of spherical and radial flow. Comparisons between the experimental and predicted results are presented. Introduction Laboratory experiments of spontaneous imbibition can be crucial for the investigation of the mechanism of oil recovery from fractured reservoirs where the rate of oil transfer from the rock matrix into the fractures determines oil production. Although capillary action is the dominant driving mechanism for spontaneous imbibition, the rate of oil recovery depends on many factors, including sample size, shape, the surfaces open to imbibition and fluid viscosities.

Simple network models of spontaneous imbibition demonstrate the pore-level dependency of the advancing wetting phase position on both the wetting/non-wetting phase viscosity ratio and the pore radii occupied by the wetting/non-wetting phase interfaces (Mason and Morrow, 2005). To study the dependence of imbibition rate on various factors, mathematical models have been developed to describe the process of spontaneous imbibition. Ideally, an improved model is needed that is not limited to specific conditions, can be verified by laboratory experiments, and has predictive capability. First applied by Blair (1964), the conventional differential equations that describe two-phase flow in porous media often serve as the basis for modeling spontaneous imbibition, in which the rate of water imbibition equals the rate of oil production by counter-current flow. In this approach (if boundary conditions, relative permeability and capillary pressure functions have been specified), the progress of saturation and pressure profiles can be calculated. The effect of relative permeability and capillary pressure functions may be lumped together as a single saturation function, as seen in some modified approaches (Pooladi-Darvish and Firoozabadi, 2000; Kashchiev and Firoozabadi, 2002; Li et al., 2003) in order to reduce the number of function parameters. In practice, saturation functions have to be tuned to either match the measured saturation profiles or the imbibition rate calculated by integration of the saturation profiles. Similar to Blair’s approach, a numerical simulation code was developed to simulate spontaneous imbibition in core samples with linear, radial, spherical or all-faces-open boundary conditions (Wo, 2002). The most significant departure of simulated results from observed imbibition behavior into a very strongly water wet medium with zero initial water saturation concerns the saturation profile at the imbibition front. For dynamic spontaneous imbibition into strongly water wet cores, a piston-like displacement of oil by the imbibing water is commonly observed regardless of the core boundary conditions. It is difficult to tune the saturation functions to match such a sharp front and still maintain continuity of the saturation functions. Furthermore, no single set of relative permeability and capillary pressure functions were found which could match both linear and radial production data using the same core and fluid properties but different boundary conditions. Any set of saturation functions that provides a match to the linear case always predicted a much higher imbibition rate for the radial case. Conversely, a set of saturation functions that matched the radial case always predicted a much lower imbibition rate for the linear case. It is questionable whether the traditional two-phase partial differential equations derived for forced flow by a pressure gradient are capable of describing the process of spontaneous imbibition for strongly water wet systems. Another approach to prediction of the rate of imbibition involves the definition of a dimensionless scaling group to compensate for the effect of sample size, shape, boundary condition and rock and fluid properties. A scaling group proposed by Mattax and Kyte (1962) was later modified by Ma et al. (1995) to
21
cwoD L
kttµµ
σφ
= (1)
22

23
where k is the rock permeability, φis rock porosity, σ is the water/oil interfacial tension, µw and µo are the water and oil viscosities and Lc is the characteristic length, which depends on the sample size and shape and the respective boundary conditions. The scaling group (Eq. 1) correlated available imbibition data satisfactorily (Ma et al., 1995, Zhang et al., 1996, Fischer and Morrow, 2004; Fischer and Morrow, 2005). Use of the geometric mean of the oil and water viscosities was determined empirically. Extension of experimental data to three orders of magnitude variation in viscosity showed systematic increase in tD for oil/water viscosity ratios smaller than 0.25. Correlation based on tD could therefore be improved. In addition, based on scaled imbibition data for fluid viscosity ratio of unity, small differences in shape of the recovery curves were identified for radial vs. linear flow (Fischer and Morrow, 2005). This study presents a new flow model and modifications of the definition of dimensionless time, tD, to account for the combined effects of viscosity ratio and boundary conditions. The new approach is based on the assumption of piston-like frontal displacement and the experimental observation of a linear correlation between the frontal position and imbibition time on a log-log scale for both linear and radial flow. For the all-faces-open boundary condition, most usually employed in imbibition tests, oil recovery vs. imbibition time can be estimated by a combination of spherical and radial flow. Comparison between experimental and predicted results provide a close match for all tested cases. Experiments Materials and experimental procedures are described by Fischer and Morrow (2005). Materials Liquids Oleic phase. The oil phase was composed of two refined oils; a mineral oil (Soltrol 220®) with a viscosity of 3.9 cP and a mixture of Soltrol 220® and a 173 cP white mineral oil to give a mixture viscosity of 63.3 cP. Prior to use, polar contaminants were removed from the refined oils and the mixtures were evacuated to remove any dissolved gas. Aqueous phase. Glycerol, supplied at 99.5% purity by EMD Chemicals Inc., was mixed with brine to obtain different levels of aqueous phase viscosities. For the data obtained in this study, the ionic strength of the brine was adjusted for addition of glycerol to give glycerol water mixtures of constant ionic strength (synthetic sea water, Table 6.1). Prior to use, each aqueous mixture was evacuated to minimize the possibility of evolution of gas bubbles during imbibition tests. Then, the density, viscosity and interfacial tension against the selected oleic phase were measured. Sandstone Twenty six cylindrical Berea sandstone cores with a nominal diameter, d, of 3.81 cm and nominal lengths, L, of either 6.35 or 7.62 cm were cut from a single Berea sandstone block, EV6. These were rinsed, dried for one day at ambient temperature and oven-dried at 105 °C for two days. Permeability to nitrogen gas, kg, was measured using a Hassler-type core holder at a confining pressure of 300 psi. The permeability to nitrogen ranged from 106.1 md to 153.5 md. Two additional cores, C1-1 and C1-3 as indicated, were cut from a separate block. Permeabilities

were 62.3 and 62.7 md, respectively, and porosities were 16.9 and 16.8 %, respectively. Porosity, φ, was obtained from the increase in mass after saturation with oil. Porosities for Block EV6 cores ranged from 17.8 to 19.3 % (see Tables 6.2 through 6.4). Boundary Conditions Specific core surfaces were sealed with epoxy resin (Devcon® 5 Minute® Epoxy and 5 Minute® Epoxy Hardener) to establish no flow boundaries. The boundary conditions were chosen to investigate linear (one-end-open, OEO), radial (two-ends-closed, TEC) and complex (all-faces-open, AFO) flow (see Table 5). Ma et al. (1995) defined a characteristic length, LC,
5.0
1/ ⎟
⎟⎠
⎞⎜⎜⎝
⎛= ∑
=
n
i A
ibc
ilA
VL (2)
that correlated the effect of boundary conditions satisfactorily for a wide range of spontaneous imbibition data (Ma et al., 1995; Zhang et al., 1996; Fischer and Morrow, 2004; Fischer and Morrow, 2005). Table 5 lists the expressions for LC in this study. Specific values for individual cores are included in Tables 2 through 4. Spontaneous imbibition Spontaneous imbibition data were obtained for three boundary conditions, three oil viscosities, and up to six aqueous phase viscosities. The initial water saturation was zero in all experiments. Oil production as a function of time was measured in standard imbibition cells at ambient temperature (close to 20 °C). Imbibition results were correlated by the modified Ma et al. scaling group (Eq. 1). Results and Discussion One-end-open (OEO) For the linear spontaneous imbibition tests, core and fluid properties are listed in Table 6.2. For each of the two oleic phase viscosities, five aqueous phase viscosities were prepared. The viscosity ratio, Ψ,
wo µµΨ /= (3) ranged from 0.01 to 63.30. Core porosities all fell within 17.8 to 19.0 %, while permeability to nitrogen ranged from 107 to 140 md. The imbibition curves for recovery of 4 cP and 63 cP oil are shown in Fig. 1a. Regardless of oil viscosity, the rate of oil recovery decreased systematically with increase in aqueous phase viscosity and extended over almost three orders of magnitude. Plots of recovery versus dimensionless time are shown in Fig. 1b. Close correlation was obtained for imbibition curves
24

25
with viscosity ratios of 0.65 to 3.90. A sequence of slightly faster imbibition with increase in viscosity ratio to values of 15.44 and 63.30 is observed. However, the four imbibition curves with viscosity ratios of 0.14 and smaller showed a marked increase towards higher tD. Final oil recoveries (% OOIP) were all within 47 ± 1.7 % (Fig. 2c). However, within this range consistent trends of increase in recovery with decrease in viscosity of the aqueous phase was observed. At a fixed viscosity ratio, recovery of 4 cP oil was nearly 2 % higher than for the 63 cP oil. These subtle trends in recovery were unexpected and indicate complexities in the pore level displacement mechanism. Previously it was observed that for linear spontaneous imbibition with matched liquid viscosities, final oil recoveries decreased with increase in matched liquid viscosity (Fischer and Morrow, 2005). Two-ends-closed (TEC) A total of twelve radial (TEC) imbibition tests were made with viscosity ratios ranging from 0.01 to 173.1. Table 3 lists the rock and fluid properties for the two-ends-closed experimental set. Core porosities ranged from 18.6 to 19.8 % and core permeabilities to nitrogen from 106.1 to 153.5 md. Oil recovery as a function of imbibition time for 4 cP and 63 cP oil, each with aqueous phase viscosities of 1, 4, 28, 98 and 495 cP, and 173.1 cP oil with water viscosities of 1.0 and 4.9 cP, are displayed in Fig. 2a. As for linear (OEO) imbibition results, the rate of oil recovery decreased as the water viscosity increased, for all oil phase viscosities. Fig. 2b shows that the dimensionless time, tD, gave close correlation of imbibition curves for viscosity ratios of 0.65 and larger, as was observed for the OEO boundary condition. For Ψ ≤ 0.14 the scaled production curves show distinct increase with dimensionless time. Final oil recoveries from radial flow as a function of viscosity ratio are displayed in Fig. 2c. In contrast to OEO, with the exception of one data point (Ψ= 2.28), final oil recoveries decrease with increase in viscosity ratio; results for 4, 63 and 173 cP oil show overlap (see Fig. 2c). All-faces-open (AFO) Table 4 lists the core and fluid properties for the all-faces-open boundary condition (combination of linear and radial imbibition). Core porosities for the four Berea EV6 cores ranged from 18.6 to 19.2 % and were thus somewhat higher than for the two Berea C cores (16.8 and 16.9 %). The permeability to nitrogen for the EV6 cores was significantly higher (112.3 to 148.4 md) than for the Berea C cores (62.3 and 62.7 md). Results for cores EV6-72, EV6-73, EV6-80 and EV6-81 are presented in Fig. 4a. Results for cores C-1 and C-3, taken from Fischer and Morrow (2004), are also included. After scaling (Fig. 3b), all but one imbibition curve (Ψ= 0.04, which corresponds to the lowest viscosity ratio in this data set) were closely correlated. As for the TEC cores, final oil recoveries for the all-faces-open cores (Fig. 3c) show a trend of decrease with increase in viscosity ratio, although the data for the 4 cP oil are distinctly different from the final oil recoveries for the 63 cP oil. This characteristic, however, is attributed to the utilization of a different Berea sandstone block for the measurement of 4 cP oil recovery in the AFO experiments.

26
Finally, for every viscosity ratio, final oil recoveries from radial imbibition are distinctly higher than final oil recoveries from linear imbibition, ranging from about 51 % to close to 53.3 %. Mathematical Model The effect of pore geometry and wetting on capillary displacement pressure has been calculated for a wide variety of pore shapes formed by rod, plate and sphere combinations (Mason et al, 1983; Mason and Morrow, 1986; Mason and Morrow, 1987; Mason and Morrow, 1991 and Ma et al., 1997). Many pore network models were also performed for quasi-static displacement (Mason, 1971; Dixit et al., 1999; Blunt, 1997 and Øren, 1998). However, advances in modeling spontaneous imbibition have been modest. For example, a longstanding assumption in modeling linear (OEO) spontaneous imbibition has been that capillary pressure at the open face immediately rises to a value which corresponds to the residual non-wetting phase saturation (Blair, 1964; Pooladi-Darvish and Firoozabadi, 2000). However, experimental measurements of the pressure build-up in the non-wetting phase for linear flow showed a distinct time lag (Li et al., 2004) and the residual saturation remaining after counter-current imbibition is about 12 - 20 % higher than that retained after co-current spontaneous imbibition (Bourbiaux and Kalaydjian, 1990; Zhou et al., 2002). Raimondi and Torcaso (1964) showed that the residual oil trapped by viscous displacement does not occur until within about 5 % of attaining trapped residual oil saturation. For displacement of oil by imbibition, the fraction of trapped oil over the range of saturation corresponding to different viscosity ratios is probably low. Furthermore, the back pressure associated with production of oil at the core face causes significant reduction in the effective pressure gradient that drives counter-flow of oil. Model Derivation The use of (µwµo)0.5 in the definition of tD was developed empirically from available data. In extending tests of scaling by tD, imbibition data have been obtained for very low oil-water viscosity ratios, mainly by increasing the viscosity of the aqueous phase. The results for increase in the range of investigation of viscosity ratio of liquids to over four orders of magnitude (see Figs. 1, 2 and 3) show that the correlation can be improved by including a function of viscosity ratio. In addition, expected small systematic differences in the shape of scaled curves have recently been demonstrated for linear vs. radial flow (Fischer and Morrow, 2005). Thus the scaling requires that both viscosity ratio and boundary conditions need to be taken into account in order to improve the match between model predictions and experimental data. A nearly piston-like displacement of oil by the imbibing water is commonly observed in very strongly water wet initially oil filled cores regardless of the core boundary conditions. For any pair of oil and water viscosities, this observation indicates that the ratio of the volume of the smaller pores occupied by the displacing water to the volume of the oil-filled larger pores is nearly constant behind the displacement front. Moreover, the pressure in the nonwetting phase ahead of the displacement front, pof, quickly reaches and maintains a stable value as the imbibition front advances (Li et al., 2004). Interface dynamics that determine the capillary pressure at the displacement front, pcf, are fundamental to the imbibition process; the mechanism of advance cannot be modeled as a quasi-

static process. The measured pressure, pcf, is the effective capillary pressure acting at the front under dynamic conditions which drives imbibition. Because pcf is constant its value is independent of rate of advance of the imbibition front. The main dependency of pcf is on interfacial tension and rock properties. In development of a mathematical model, it is assumed that pcf is constant and that the imbibition process in a core consists of two independent flow regimes behind the imbibition front. The region of counter-flow behind the front can be divided into a water-filled in-flow region and an oil-filled out-flow region. This assumption implies that the pressure gradient in each phase decreases with time while the water and oil saturations remain constant. A consequence of this assumption is that the capillary pressure varies linearly with distance at the oil-water interface behind the front, but there is no change in saturation. This condition can be closely realized physically by changes in interface curvature generally without significant change in location of three phase lines of contact. The interfacial area between oil and water is only about 3 % of the interfacial area associated with the flow of oil (Seth and Morrow, 2005), and the effects of counter-flow at these interfaces are modeled as negligible, through the assumption of independent permeabilities to each phase. The linear pressure distribution in each region is illustrated in Figure 6.4 for the one-dimensional OEO case, where pcb is the capillary pressure at the open boundary, also termed as the bubble or back pressure (Li et al., 2004) pcb = pob - pwb (4) where pob is the oil phase pressure at the open boundary and pwb is the water phase pressure at the open boundary. The pressure gradient in the oil and aqueous phase behind the imbibition front is determined by the fluid viscosities. Because oil recovery is directly related to the position of the imbibition front in a piston-like displacement, a relationship between the frontal position and imbibition time can be predicted from imbibition data for cores with symmetric open boundaries. Application of Darcy’s law to both regions give the oil out-flow rate, qo, and the water in-flow rate, qw, respectively,
xppk
Aq obof
o
Aooo
−=
µ (5)
xppk
Aq wfwb
w
Awww
−=
µ (6) where x is the frontal position, Ao is the cross-sectional area of the oil-filled region and kAo is the associated absolute permeability of that region and µo is the oil phase viscosity. Aw is the cross-sectional area of the water-filled region and kAw is the associated absolute permeability of that region, µw is the water phase viscosity and pwf is the water phase pressure at the imbibition front. It is assumed that kAo and kAw are independent of distance behind the front and are therefore independent of imbibition rate.
If both water and oil are considered incompressible, the counter-current condition, i.e. wo qq −= , oil flow rate is given by
27

Aww
w
Aoo
o
cbcfo
kAkAx
ppq
µµ+
−=
1
(7) The capillary pressure at the imbibition front, pcf, is is defined as pcf = pof - pwf (8) When the imbibition front advances, the differential equation of the dynamic mass balance is described by
AdxRdtqo φ= (9) where t is the imbibition time, R is the oil recovery, φ is the rock porosity, A is the cross-sectional area of the core. Substituting Eq. 7 into Eq. 9 and integrating Eq. 9, an analytic function is obtained that relates the frontal position to the imbibition time
)(
)(22
Aww
w
Aoo
o
cbcf
kAkAAR
pptx
µµφ +
−=
(10) Eq. 10 can be further written in the dimensionless format of Eq. 11,
( ) linearDD tEx _2 η= (11)
where xD is the normalized frontal position. In Eq. 11, is the linear-case dimensionless time as defined by Eq. 1, with the characteristic length equal to the core length L,
linearDt _
2_
Ltktwo
linearD µµσ
φ=
(12) In Eq. 11, E(η) is a dimensionless function of η, the square root of the viscosity ratio,
w
oµµ
η = (13)
The form of the results indicates that the data can be matched by E(η) that has two dimensionless parameters, a and b, defined in Eqs. 15 and 16, respectively
28

( )η
η
ηb
b
aE+
=1
(14) where
2
)(2
kA
kkAAR
ppa AwAowocbcf
φσ
−=
(15)
Aoo
Aww
kAkA
b = (16)
The linear model of Eq. 11 was tested against the OEO experimental data. It is found that a linear correlation between log(xD) and log(tD_linear) is evident for almost all cases. The slopes of the linear correlations were always close to 0.5. More significantly, a linear correlation was obtained between log(xD) and log(tD) for the radial flow cases where the characteristic length, Lc, for radial flow is used to define tD. It follows that a similar approach could model imbibition flow with
other symmetrical open boundaries, such as spherical flow. By replacing with (as
defined by Eq. 1) and freeing the power index of , Eq. 9 is empirically extended to a more general model of the form
linearDt _ Dt
Dx
( ) D
nD tEx η= (17)
In Eq. 6.17, an additional parameter n is introduced to account for cases where the linear correlation on the log-log plot may not have exactly a slope of 0.5 (departure from piston-like displacement with n ≠ 2 has been ascribed to rock heterogeneity (Fischer and Morrow, 2005)). Note that tD is the dimensionless time as defined by Ma. et al. (1995). Eq. 17 is a general format applicable to any symmetrical boundary conditions, such as linear, radial, and spherical counter-current flows. The conversions between the normalized front position, xD, and the normalized oil recovery, RN, for the respective flow regime is given in Eqs. 18 through 20. For linear flow,
ND Rx = (18) For radial flow,
radialND Rx −−−= 11 (19) and for spherical flow,
3 11 sphericalND Rx −−−= (20)
29

For AFO cores, the non-symmetrical flow pattern does not permit a simple analytical model. As an approximation, the imbibition into an open core can be estimated by a combination of spherical and radial flow. One approach is to model a cylindrical core of length L and diameter d by a rod with a half sphere attached at each end of the rod, where the volume of the new shape is equal to the core. Both the half spheres and the central cylinder have a diameter d. The cylinder length is L – 2d/3. As such, Eq. 21 describes the normalized recovery for the all-faces-open boundary condition through combination of the recovery from the central cylinder and both half spheres.
sphericalNradialNAFON RLdR
LdR −−− +⎟
⎠⎞
⎜⎝⎛ −=
32
321
(21) In the subsequent section it will be shown that a linear correlation between oil recovery (as given by the location of the imbibed wetting front) and dimensionless time is obtained on a log-log scale for all investigated boundary conditions, with a slope that is close to 0.5 (n ≈ 2) for most cases. Regression and Prediction Procedure The experimental data obtained for all three boundary conditions provide the basis for mathematical modeling. Firstly, all experimental spontaneous imbibition data from radial flow (TEC) were fitted visually with the model given by Eq. 17. The parameters E(η) and n are adjusted to fit the experimental data. The obtained E(η) are then plotted as a function of the respective square root of viscosity ratio, η. After regression of the parameters a and b, a curve fit of E(η) is obtained over a wide range of η, including the entire experimental range of η. The evaluated function of E(η) is then used to predict spontaneous imbibition data for the boundary conditions OEO (linear flow) and AFO (linear and radial flow) with values of η for the experiments. The predicted results are then compared with the experimental results to assess the quality of the prediction. Fitting of TEC Data The experimental spontaneous imbibition results for the two-ends-closed boundary condition are plotted on a log-log scale as normalized frontal position, xD, versus dimensionless time, tD. The oil recovery (normalized with the respective final oil recovery), RN, for radial flow (TEC) must be converted to the normalized frontal position, xD, by means of Eq. 19. The experimental data are then fitted by Eq. 17, which was rearranged to
( )ηExt
nD
D = (22)
For a given data set, parameters E(η) and n were adjusted to predict a dimensionless time, tD, for a specific normalized frontal position, xD, to obtain the best fit of the experimental data. Fig. 5a and b is a compilation of the results obtained for each tested value of η. Apart from a few data
30

31
points at early time and the expected departure from linearity at the final stages of imbibition, the experimental spontaneous imbibition data exhibit a distinct linear correlation on a log-log plot of normalized advancing front position, xD, vs. dimensionless time, tD. The base model as defined in Eq. 17 corresponds to a linear correlation between xD and √tD, with a slope of 0.5 (n= 2) on a log-log scale. For the twelve experimental TEC data sets in Fig. 6.5a and b, the best fit of n for the respective η was consistently very close to 2 (Table 6), except that for η= 1.97 the power index was 1.73. However, η= 1.97 was obtained with fluids having low viscosities (oil viscosity of 4 cP and a water viscosity of 1 cP). Larger experimental errors in the readings of oil recovery can be expected, because imbibition is very fast. Table 6.6 also includes the resulting values of E(η) obtained from the data fit. Fig. 6.6 is a plot of E(η) as a function of η. At low values of η the values for E(η) sharply increased up to a point (η ≈ 4), where the trend reverses and the values of E(η) decrease. This plot also includes the regression curve for the evaluated E(η) data set which is used to predict imbibition data for the linear (OEO) flow. The regression method to evaluate the parameters a and b is given in the Appendix. Prediction OEO (Linear Flow) The proposed imbibition model (Eq. 17) has been tested against experimental data for linear flow (one-end-open) (see Fig. 1 and Table 2). Ten predictions were performed with viscosity ratios identical to the radial flow experimental set. Eq. 17 was rearranged (Eq. 22) to predict the dimensionless time, tD, for a specific normalized front position, xD. For linear flow, the normalized front position corresponds to the normalized oil recovery (Eq. 18). E(η) for a specific η was determined from the regression curve obtained from fitting the radial flow experimental data (Fig. 6). The power index n was adjusted to obtain the best possible experimental fit. Results for the prediction of linear imbibition for each fluid viscosity pair as well as direct comparison with the respective experimental results are displayed in Fig. 7. A very good match of the experimental data was obtained for η ≥ 0.38. For η= 0.36 the experimental match is not as good, as the mathematical model predicts slightly longer dimensionless times, compared to tD obtained from experiment. Table 7 lists the calculated parameter E(η) and the adjusted power index n for each η. For the two data sets with the lowest square root of viscosity ratio (η = 0.09 and η = 0.20), the mathematical model yields a distinct departure of the predictions towards longer tD. Fig. 6 shows that the regression curve exhibits the largest relative departure from the evaluated E(η) for these two values of η, which explains the deviations of the predicted curves from the experimental ones. Overall, however, Fig. 7 illustrates that the proposed mathematical model produces satisfactory linear flow predictions for a wide range of viscosity ratios. Thus E(η) evaluated from radial flow provided close prediction of linear flow performance. Table 7 gives the values for E(η) and n for each η. Generally, n was consistently close to the value of 2 (similar for the TEC boundary condition) and exhibited only slight variation. Consequently, the close-to-linear correlation between the advancing front and the square root of time (n ≈ 2) implies that local phenomena (flow path generation by the capillary pressure at the water-oil contact) dominate spontaneous imbibition processes. Prediction AFO (Linear + Radial Flow) Finally, the analytical model is tested for the combination of linear and radial flow and predictions are compared with six experimental results (Table 4). The normalized recovery for the all-faces-open boundary condition, RN-AFO, is predicted for specific dimensionless times, tD,

according to Eq. 21. As such, the terms RN-radial and RN-spherical in Eq. 21 need to be evaluated separately. For RN-radial (from Eq. 19):
32
)
( 211 DradialN xR −−=− (23) Substituting xD as defined in Eq. 6.17 yields
( )[ ]21
11 ⎟⎟⎠
⎞⎜⎜⎝
⎛−−=− nDradialN tER η
(24) Since the flow regime is radial, Lc in the definition of tD (Eq. 1) is defined as shown in Table 5. For RN-spherical (from Eq. 20):
( )311 DsphericalN xR −−=− (25) Substituting xD as defined in Eq. 17 yields:
( )[ ]31
11 ⎟⎟⎠
⎞⎜⎜⎝
⎛−−=− nDsphericalN tER η
(26) Caution has to be applied in the calculation of Lc; because the flow regime is spherical, Lc in the tD term of Eq. 26 is defined as given in Table 5. For each of the six predictions, the normalized recovery for all-faces-open, RN-AFO, was calculated for exactly those imbibition times, t, for which an actual data point (the oil recovery) was measured. Comparison of the imbibition predictions with the experimental results for each value of η that was investigated is shown in Fig. 8. In general, good predictions could be achieved for all cases. Not only could the analytical model forecast recovery, but also the shape of the imbibition curves were well predicted. A distinct deviation of the predicted curve from the experimental data is observed for η= 0.20 at later dimensionless times. The cause of this discrepancy might be core heterogeneities. Also, slight differences between the predicted and the experimental data are evident at very early dimensionless times, especially for the data set for η= 7.96. However, unless both fluid viscosities are high, there is inherent error in the accurate determination of oil recovery at very early times when imbibition is fast; the fastest rate being for the all-faces-open boundary condition. Overall, the predictions for the combination of linear and radial flow are good because the derivation of the analytical model is based on an approximation of the actual fluid flow pattern in spontaneous imbibition with the boundary condition all-faces-open. One feature of the modeling

results, however, needs further investigation; from Table 8 it is seen that the power index n shows stronger variation around the value of 2, namely from 1.67 to 2.28. Scaling of imbibition data by the extended Ma et al. scaling group Fig. 9 is a plot of the scaled imbibition data for all boundary conditions using the generalized Ma et al. scaling group. The results show that the scaled data spread over 1 ¼ log-cycles, which is rather large. A significantly improved data correlation is obtained when the imbibition data are scaled with the Ma et al. scaling group extended by the dimensionless function E(η) (Fig. 10a and b). According to Eq. 17 data are plotted as the dimensionless front position, xD, vs. the n-th root of the extended Ma et al. scaling group, tD-New. For each data set the respective value of n as given in tables 6 – 8 was used. Furthermore, for the AFO data, the normalized front position was approximated by Eq. 19, assuming that radial flow is the dominant flow regime. Fig. 10 shows that very close data correlation was obtained by the extended Ma et al. scaling group. The data spread was narrowed down from 1 ¼ log-cycles to approximately a fifth of a log-cycle. Furthermore, Fig. 10b shows a linear correlation between the normalized front position and the n-th root of the extended Ma et al. scaling group, tD-New for linear, radial and the combination of linear and radial flow when plotted on a log-log scale. In addition, the theoretic curve for n= 2 is also included in Fig. 10a and b. Data scatter around this curve is caused by the deviation of n from the theoretic value of 2, which is attributed to rock heterogeneities.
i) APPENDIX Regression of a and b from experimental radial flow (TEC) data
Eq. 14 can be rewritten as
βηη
αη
+=1
)(1
E (27)
where
ab1
=α (28)
and
ab
=β (29)
33

If ( ) ,~1),,( Ni E ii =ηη are the parameters obtained from fitting the TEC experimental data set,
the parameters α and β are evaluated so that
( ) min)]1(1[),( 2 =+−= ∑ iii iE
F βηη
αη
βα (30)
Two necessary conditions for minimizing ) ,( βαF are
F 0=∂∂α
(31)
and
0=∂∂
βF (32)
From Eq. 31 and 32
( )∑ ∑ =−+i i iii E
N 0112 ηη
βη
α (33)
( )∑ ∑ =−+i i i
ii E
N 02η
ηηβα (34)
Therefore, βα and can be solved from Eq. 33 and 34:
( ) ( ) ∑∑∑ ∑∑ −−=i ii
ii i iii
ii
iN
NENE
]11/[]11[ 222
ηη
ηηη
ηη
α (35)
( ) ∑∑ −=i ii ii EN
]11[12η
αηη
β (36)
The parameters a and b can be calculated from
aαβ1
= (37)
and
34

βab = (38)
Regression of the parameters a and b resulted in a= 0.01609and b= 0.23300.
Mixed-wet cores Preliminary imbibition measurements have been made for mixed-wet cores using an aqueous phase viscosified by addition of glycerol
Table 1 Synthetic seawater Ionic strength
NaCl 28.0000 g/l KCl 0.9350 g/l MgCl2 5.3625 g/l CaCl2 1.1900 g/l Na2SO4 4.0000 g/l NaN3 0.1000 g/l TDS 39.5875 g/l
Table 2 Rock and Fluid Properties Boundary Condition: One End Open (OEO), Linear Flow
Lc kg φ σ µap µo µgm ψ Core cm md % dyn/cm cP cP cP
EV6-13 7.75 113.2 18.4 50.5 1.0 3.9 2.0 3.90 EV6-14 7.66 127.2 17.8 41.2 4.1 3.9 4.0 0.95 EV6-21 7.70 107.3 18.7 34.3 27.8 3.9 10.4 0.14 EV6-23 7.36 132.1 17.9 31.3 97.7 3.9 19.5 0.04 EV6-22 7.18 109.2 18.0 28.9 494.6 3.9 43.9 0.01 EV6-18 7.62 140.0 18.1 51.3 1.0 63.3 8.0 63.30 EV6-20 7.52 132.9 18.1 41.7 4.1 63.3 16.1 15.44 EV6-16 7.78 136.8 18.1 34.8 27.8 63.3 41.9 2.28 EV6-17 7.54 128.1 19.0 32.1 97.7 63.3 78.6 0.65 EV6-15 7.73 107.0 18.3 29.8 494.6 63.3 176.9 0.13
35

Table 3 Rock and Fluid Properties Boundary Condition: Two Ends Closed (TEC), Radial Flow
Lc kg φ σ µap µo µgm ψ Core cm md % dyn/cm cP cP cP
EV6-69 1.34 146.6 19.3 50.5 1.0 3.9 2.0 3.90 EV6-71 1.34 149.1 19.3 41.2 4.1 3.9 4.0 0.951 EV6-67 1.34 110.0 18.6 34.3 27.8 3.9 10.4 0.14 EV6-66 1.34 145.0 19.1 31.3 97.7 3.9 19.5 0.04 EV6-76 1.34 146.8 19.0 28.9 494.6 3.9 43.9 0.01 EV6-74 1.34 106.1 18.6 51.3 1.0 63.3 8.0 63.30 EV6-75 1.34 146.3 18.7 41.7 4.1 63.3 16.1 15.44 EV6-79 1.34 137.9 19.1 34.8 27.8 63.3 41.9 2.277 EV6-77 1.34 128.0 18.8 32.1 97.7 63.3 78.6 0.65 EV6-70 1.34 153.5 19.2 29.8 494.6 63.3 176.9 0.13
EV6-8 1.34 151.4 19.8 52.8 1.0 173.1 13.2 173.10 EV6-8A 1.34 138.7 19.4 43.1 4.9 173.1 29.1 35.33
Table 4 Rock and Fluid Properties Boundary Condition: All Faces Open (AFO), Linear + Radial Flow
LC kg φ σ µap µo µgm ψ Core cm md % dyn/cm cP cP cP
C1-1 * 1.24 62.3 16.9 39.8 4.4 3.9 4.1 0.89 C1-3 * 1.24 62.7 16.8 31.2 99.8 3.9 19.7 0.04 EV6-72 1.23 112.3 18.6 51.3 1.0 63.3 8.0 63.30 EV6-80 1.23 148.4 19.2 41.7 4.1 63.3 16.1 15.44 EV6-81 1.23 136.7 19.1 34.8 27.8 63.3 41.9 2.28 EV6-73 1.24 143.9 19.1 32.1 97.7 63.3 78.6 0.65 * Data adopted from (Fischer and Morrow, 2004)
36

Table 5 Flow Regimes and the Respective Characteristic Lengths
Boundary condition Flow regime
Characteristic length, Lc
One End Open (OEO) linear lLc =
Two Ends Closed (TEC) radial
22dLc =
All Faces Open (AFO) linear and radial 22 22 ld
ldLc+
=
Sphere spherical 32
dLc =
Table 6 BC: TEC (radial flow) Evaluated E(η) and n
η E(η) n 0.09 0.00057 2.12 0.20 0.00111 2.09 0.36 0.00171 2.10 0.38 0.00163 2.11 0.81 0.00320 2.04 0.98 0.00374 1.97 1.51 0.00497 1.97 1.97 0.00540 1.73 3.93 0.00782 1.94 5.94 0.00753 1.95 7.96 0.00657 2.04 13.15 0.00486 2.00
37

38
Table 7 BC: OEO (linear flow) Predicted E(η) and n (a, b evaluated from TEC fit)
η E(η) n 0.09 0.00034 2.20 0.20 0.00076 2.13 0.36 0.00134 2.12 0.38 0.00158 2.13 0.81 0.00294 2.13 0.98 0.00358 2.00 1.51 0.00504 1.97 1.97 0.00613 1.87 3.93 0.00781 1.87 7.96 0.00638 2.10
Table 8 BC: AFO (linear + radial flow) Predicted E(η) and n (a, b evaluated from TEC fit)
η E(η) n 0.20 0.00076 2.28 0.81 0.00294 1.99 0.98 0.00354 1.74 1.51 0.00537 1.80 3.98 0.00802 1.67 7.96 0.00638 1.96

0
10
20
30
40
50
60
1 10 100 1000 10000 100000 1000000Imbibition time, t (min)
Oil
Rec
over
y, R
, (%
OO
IP)
1 4 3.90 4 4 0.95 28 4 0.14 98 4 0.04 495 4 0.01 1 63 63.30 4 63 15.44 28 63 2.28 98 63 0.65 495 63 0.13
(a) BC: OEO, Linear
µ w µ o ψ (cP) (cP)
0
10
20
30
40
50
60
0.01 0.1 1 10 100 1000 10000
Dimensionless time , t D
Oil
Rec
over
y, R
, (%
OO
IP)
1 4 3.90 4 4 0.95 28 4 0.14 98 4 0.04 495 4 0.01 1 63 63.30 4 63 15.44 28 63 2.28 98 63 0.65 495 63 0.13
(b) BC: OEO, Linear
µ w µ o ψ (cP) (cP)
44
45
46
47
48
49
50
51
0.00 0.01 0.10 1.00 10.00 100.00Viscosity ratio, Ψ
Fina
l oil
reco
very
, Rf (
% O
OIP
)
4 cP 63 cP
(c) BC: OEO, Linear
µ o
Fig. 1: Recovery of oil by spontaneous imbibition for one-end-open cores and non-matched
viscosity versus (a) time, t, and (b) dimensionless time; tD, (c) final oil recovery, Rf, versus
viscosity ratio, Ψ.
39

0
10
20
30
40
50
60
1 10 100 1000 10000 100000Imbibition time, t (min)
Oil
Rec
over
y, R
, (%
OO
IP)
1 4 3.90 4 4 0.95 28 4 0.14 98 4 0.04 495 4 0.01 1 63 63.30 4 63 15.44 28 63 2.28 98 63 0.65 495 63 0.13 1 173 173.10 5 173 35.33
(a) BC: TEC, Radial
µ w µ o ψ (cP) (cP)
0
10
20
30
40
50
60
0.01 0.1 1 10 100 1000 10000
Dimensionless time, t D
Oil
Rec
over
y, R
, (%
OO
IP)
1 4 3.90 4 4 0.95 28 4 0.14 98 4 0.04 495 4 0.01 1 63 63.30 4 63 15.44 28 63 2.28 98 63 0.65 495 63 0.13 1 173 173.10 5 173 35.33
(b) BC: TEC, Radial
µ w µ o ψ (cP) (cP)
48
49
50
51
52
53
54
55
0.00 0.01 0.10 1.00 10.00 100.00 1000.00Viscosity ratio, Ψ
Fina
l oil
reco
very
, Rf (
% O
OIP
)
4 cP 63 cP173 cP
(c) BC: TEC, Radial
µ o
Fig. 2: Recovery of oil by spontaneous imbibition for two-ends-closed cores and non-
matched viscosity versus (a) time, t, and (b) dimensionless time; tD, (c) final oil recovery,
Rf, versus viscosity ratio, Ψ. 40

0
10
20
30
40
50
60
1 10 100 1000 10000Imbibition time, t (min)
Oil
Rec
over
y, R
, (%
OO
IP)
4 4 0.89 98 4 0.04 1 63 63.30 4 63 15.44 28 63 2.28 98 63 0.65
(a) BC: AFO, Linear + Radial
µ w µ o ψ (cP) (cP)
0
10
20
30
40
50
60
0.01 0.1 1 10 100 1000 10000
Dimensionless time, t D
Oil
Rec
over
y, R
, (%
OO
IP)
4 4 0.89 98 4 0.04 1 63 63.30 4 63 15.44 28 63 2.28 98 63 0.65
(b) BC: AFO, Linear + Radial
µ w µ o ψ (cP) (cP)
48
49
50
51
52
53
54
55
0.01 0.10 1.00 10.00 100.00Viscosity ratio, Ψ
Fina
l oil
reco
very
, Rf (
% O
OIP
)
4 cP 63 cP
(c) BC: AFO, Linear + Radial
µ o
Fig. 3: Recovery of oil by spontaneous imbibition for all-faces-open cores and non-
matched viscosity versus (a) time, t, and (b) dimensionless time; tD, (c) final oil recovery,
Rf, versus viscosity ratio, Ψ.
41

0 1
Distance to the Non-Flow Boundary
Pre
ssur
e
pof
Po po
Pres
sure
pob Pcf pcf
Pceb pcb
pwb Pw pw
Imbibition Front 1 0 Distance to the no-flow boundary
Fig. 4. Conceptual pressure distributions in the frontal disp
current spontaneous imbibition in strongly wa
42
lacement of counter-
ter wet cores.

43
ig. 5a: TEC (radial flow) experimental data and the respective best fit by adjustment
of the parameters E(η) and n.
0.0
0.1
1.0
10.0
1 10 100 1000 10000t D
x D
Experiment Fit
BC: TEC µ o = 4 cP, µ w= 98cP η = 0.20
0.0
0.1
1.0
10.0
1 10 100 1000 10000t D
x D Experiment Fit
BC: TEC µ o = 4 cP, µ w= 495cP η = 0.09
0.0
0.1
1.0
10.0
1 10 100 1000t D
x D
Experiment Fit
BC: TEC µ o = 63 cP, µ w= 495cP η = 0.36
0.0
0.1
1.0
10.0
1 10 100 1000 10000t D
x D
Experiment Fit
BC: TEC µ o = 4 cP, µ w = 28cP η = 0.38
0.0
0.1
1.0
10.0
1 10 100 1000t D
x D
Experiment Fit
BC: TEC µ o = 4 cP, µ w = 4cP η = 0.98
0.0
0.1
1.0
10.0
0.1 1 10 100 1000t D
x D
Experiment Fit
BC: TEC µ o = 63 cP, µ w= 98cP η = 0.81
0.0
0.1
1.0
10.0
0.1 1 10 100 1000t D
x D
Experiment Fit
BC: TEC µ o = 63 cP, µ w= 28cP η = 1.51
0.1
1.0
10.0
10 100 1000t D
x D
Experiment Fit
BC: TEC µ o = 4 cP, µ w= 1cP η = 1.97
F

44
Fig. 5b: TEC (radial flow) experimental data and the respective best fit by adjustment
of the parameters E(η) and n.
0.1
1.0
10.0
1 10 100 1000t D
x D
Experiment Fit
BC: TEC µ o = 63 cP, µ w = 4cP η = 3.93
0.1
1.0
10.0
1 10 100 1000
x D
Experiment Fit
BC: TEC µ o = 63 cP, µ w = 1cP η = 7.96
t D
0.1
1.0
10.0
1 10 100 1000t D
x D
Experiment Fit
BC: TEC µ o = 173 cP, µ w= 1cP η = 13.15
0.1
1.0
10.0
1 10 100 1000t D
x D
Experiment Fit
BC: TEC µ o = 173 cP, µ w= 4.9 cP η = 5.94

45
eter.
0.006
0.007
0.008
0.009
0
0.001
0.002
0.003
0.004
0.005
0 2 4 6 8 10 12 14
η= (µ o /µ w ) 0.5
E(η
)
Experimental (TEC) Regression
Fig. 6: Regression of TEC experimental fitting param

Fig. 7: OEO (linear flow) experimental data and the respective predictions from the
proposed analytical model.
0.0
0.1
1.0
10.0
0.1 1 10 100 1000t D
x D
Experiment Prediction
BC: OEO µ o = 4 cP, µ w = 1cP η = 1.97
0.0
0.1
1.0
10.0
0.1 1 10 100 1000t D
x D
Experiment Prediction
BC: OEO µ o = 63 cP, µ w = 1cP η = 7.96
0.0
0.1
1.0
10.0
0.1 1 10 100 1000t D
x D
Experiment Prediction
BC: OEO µ o = 63 cP, µ w = 4cP η = 3.93
0.0
0.1
1.0
10.0
0.01 0.1 1 10 100 1000t D
x D
Experiment Prediction
BC: OEO µ o = 63 cP, µ w = 28cP η = 1.51
0.0
0.1
1.0
10.0
0.1 1 10 100 1000t D
x D
Experiment Prediction
BC: OEO µ o = 4 cP, µ w = 4cP η = 0.98
0.0
0.1
1.0
10.0
0.1 1 10 100 1000t D
x D
Experiment Prediction
BC: OEO µ o = 63 cP, µ w = 98cP η = 0.81
0.0
0.1
1.0
10.0
0.1 1 10 100 1000t D
x D
Experiment Prediction
BC: OEO µ o = 4 cP, µ w = 28cP η = 0.38
0.0
0.1
1.0
10.0
0.01 0.1 1 10 100 1000t D
x D
Experiment Prediction
BC: OEO µ o = 63 cP, µ w = 495cP η = 0.36
0.0
0.1
10.0
0.1 1 10 100 1000 10000t D
x D
1.0
Experiment Prediction
BC: OEO µ o = 4 cP, µ w = 495cP η = 0.09
0.0
0.1
10.0
1 10 100 1000 10000t D
x D
1.0
Experiment Prediction
BC: OEO µ o = 4 cP, µ w = 98cP η = 0.20

DE-FC26-03NT15408 Semi-Annual Report 07/01/05 – 12/31/05
47
Fig. 8: AFO (combination of linear and radial flow) experimental data and the
respective predictions from the proposed analytical model.
0.0
0.2
0.4
0.6
0.8
1.0
0.1
R (%
Rf)
1 10 100 1000 10000t D
Experiment Prediction
BC: AFO o = 4 cP, µ w = 99cP = 0.20µη
0.0
0.2
0.4
0.6
0.8
1.0
1 10 100 1000t D
R (%
Rf)
Experiment Prediction
BC: AFO µ o = 4 cP, µ w = 4cP η = 0.98
0.0
0.4
0.6
0.8
1.0
1 10 100 1000t D
R (%
Rf)
0.2
Experiment Prediction
BC: AFO µ o = 63 cP, µ w = 1cP η = 7.96
0.0
0.2
0.4
0.6
0.8
1.0
0.1 1 10 100 1000t D
R (%
Rf)
Experim
BC: AFO µ o = 63 cP, µ w = 28cP η = 1.51
0.0
0.2
0.4
0.6
0.8
1.0
0.1 1 10 100 1000t D
R (%
Rf)
Experiment Predict n
BC: AFO µ o = 63 cP, µ w = 98cP η = 0.81
0.0
0.2
0.4
0.6
0.8
1.0
1 10 100 1000t D
R (%
Rf)
Experiment Prediction
BC: AFO
io
ent Prediction
µ o = 63 cP, µ w = 4 cP η = 3.933.98
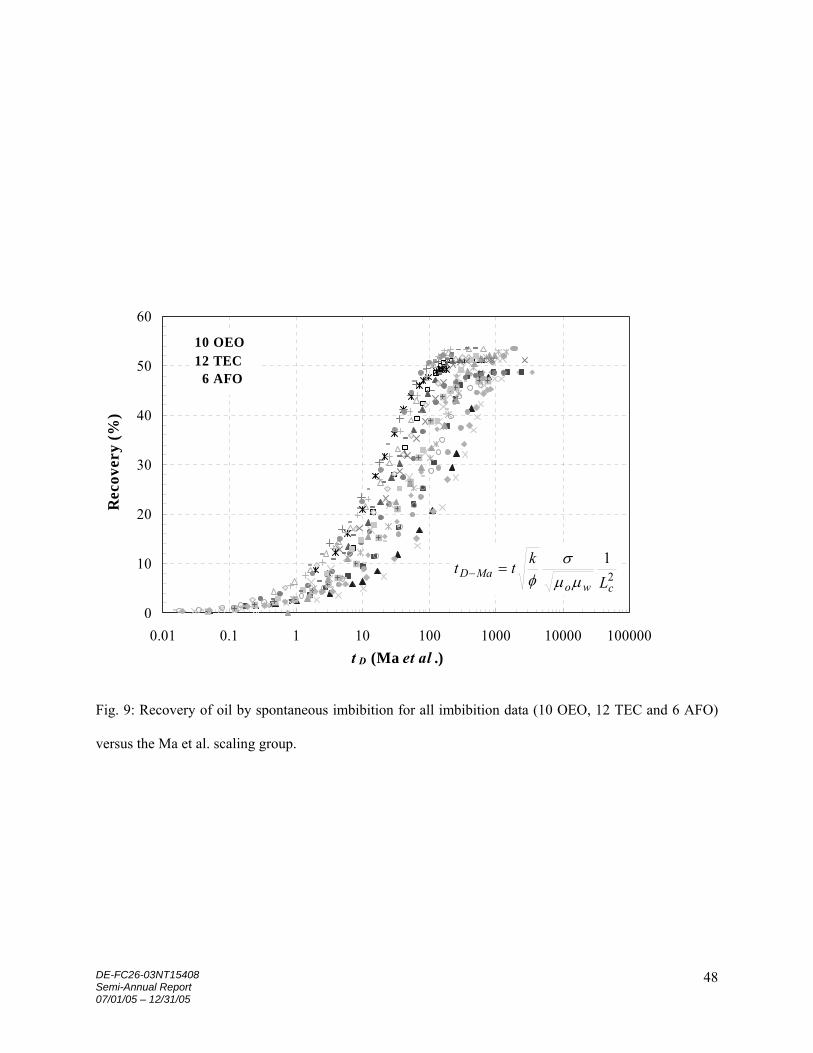
DE-FC26-03NT15408 Semi-Annual Report 07/01/05 – 12/31/05
48
Fig. 9: and 6 AFO)
ersus the Ma et al. scaling group.
Recovery of oil by spontaneous imbibition for all imbibition data (10 OEO, 12 TEC
v
0
10
20
30
40
50
60
0.01 0.1 1 10 100 1000 10000 100000t D (Ma et al .)
10 OEO12 TEC 6 AFO
21
cwoMaD
Lktt
µµσ
φ=−
) (%
ryve
coR
e

DE-FC26-03NT15408 Semi-Annual Report 07/01/05 – 12/31/05
49
0
0.2
0.4
0.6
0.8
1
1.2
0.0001 0.001 0.01 0.1 1 10 100 1000
(t D-New )1/n
x D
10 OEO12 TEC 6 AFO
22 bab
Lktt
owcNEWD
µµσ
φ +=−
0.001
10
0.0001 0.001 0.01 0.1 1 10 100 1000
x D
0.01
0.1
1
(t D-New )1/n
10 OEO12 TEC 6 AFO
22 bab
Lktt
owcNEWD
µµσ
φ +=−
Fig. 10: Normalized front position versus the et al. scaling group (E(η)tD)
for all imbibition data (10 OEO, 12 TEC and 6 AFO) on a semilog plot (a) and log-log plot (b).
xD2 = tD-New
tD-New= tD E(η)
xD2 = tD-New
tD-New= tD E(η)
n-th root of the extended Ma

References lair, P.M., “Calculation of Oil Displacement by Countercurrent Water Imbibition”, SPEJ, 1964, (Sep), 195-202. lunt, M. J.: “Pore Level Modeling of the Effects of Wettability”, SPEJ (1997), Dec, 2, 494-510. ourbiaux, B.J. and Kalaydjian, F.J., “Experimental Study of Cocurrent and Countercurrent Flows in Natural Porous Media”, SPE Res. Eng. (1990), 5, 361-368.
Dixit, A.B., McDougall, S.R., Sorbie, K.S. and Buckley, J.S., “Pore Scale Modeling of ettability Effects and Their Influence on Oil Recovery”, SPEREE (1999), Feb, 2,
25-36.
bibition in
, 309-326.
ta for ,
165-178. Mason, G., “A Model of the Pore Space in a Random Packing of Equal Spheres”, J. Coll.
Inter. Sci., (1971), 35, 279-287.
between Two Equal Contacting Rods and a Plate”, J. Coll. Inter. Sci., 1983, 95, 494. eniscus Displacement Curvatures of Perfectly Wetting
Liquid in Capillary Pore Throats Formed by Spheres”, J. Coll. Inter. Sci., (1986), Jan., 109, 46-56. ason, G. and Morrow, N.R., “Meniscus Configurations and Curvatures in Non- Asymmetric Pores of Open and Closed Uniform Cross-Section”, Proc. Royal Soc. London, (1987), A414, 111-33.
Mason, G. and Morrow N.R., “Capillary Behavior of a Perfectly Wetting Liquid in Irregular Triangular Tubes”, J. Coll. Inter. Sci., Jan. (1991), 141, 262-74.
Mason, G. and Morrow, N.R., “Counter-Current Spontaneous Imbibition into Model Systems”, in press. Unpublished work. Studies in Surface Science and Catalysis, Characterization in Porous Solids VII (COPS VII). Copyright 2005 by Elsevier Science B.V.
B
B
B
W
Fischer, H., and Morrow, N.R.,“Spontaneous Imbibition with Matched Liquid Viscosities”, paper SPE 96812. Paper presented at the 2005 SPE Annual Technical Conference and Exhibition, Dallas, TX, U.S.A., 9–12 Oct., 2005.
Fischer, H., and Morrow, N.R., “Scaling of Oil Recovery by Spontaneous Imbibition for Wide Variation in Aqueous Phase Viscosity with Glycerol as the Viscosifying Agent”, paper presented at the 8th International Symposium on Reservoir Wettability, May 16-18th, 2004, Houston, TX., JPSE in press.
Kashchiev, D. and Firoozabadi, A., “Analytical Solutions for 1-D Countercurrent ImWater-Wet Media,” paper SPE 75166, presented at SPE/DOE Oil Recovery Symposium, Tulsa, OK, 13-17 April, 2002.
Li, Y., Morrow N.R. and Ruth D., “Similarity Solution for Linear Counter-Current Spontaneous Imbibition”, Journal of Petroleum Science and Engineering, (2003), 39
Li, Y., Ruth, D., Mason, G., and Morrow, N.R., “Pressure Acting in Counter-current Spontaneous Imbibition”, paper presented at the 8th International Symposium on Reservoir Wettability, May 16-18th, 2004, Houston, TX., JPSE in press.
Ma, S., Zhang, X. and Morrow, N.R., “A Characteristic Length for Scaling of Mass Transfer between Rock Matrix and Fractures”, paper SPE 30232, (1995).
Ma, S., Morrow, N.R., Zhang, X., “Generalized Scaling of Spontaneous Imbibition DaStrongly Water-Wet systems”, Journal of Petroleum Science and Engineering, (1997), 18
Mason, G., Nguyen, M.D. and Morrow, N.R., “Effect of Contact Angle on the Meniscus
Mason, G. and Morrow, N.R., “M
M
DE-FC26-03NT15408 Semi-Annual Report 07/01/05 – 12/31/05
50

DE-FC26-03NT15408 Semi-Annual Report 07/01/05 – 12/31/05
51
attax, C.C. and Kyte, J.R., “Imbibition oil recovery from fractured, water-drive reservoir”, SPEJ, (1962), Jun, 177-184. re ork
ooladi-Darvish, M. and Firoozabadi, A., “Experiments and Modeling of Water Injection in Water-Wet Fractured Porous Media”, J. Can. Pet. Tech., (2000), Mar, 39, 3:31-42. aimondi, P. and Torcaso, M.A., “Distribution of the Oil Phase Obtained Upon Imbibition of Water”, SPEJ, (1964), Mar, 49-55.
eth, S. and Morrow, N. , ncy of Conversion of Work of Drainage to Surface Energy for a Sandstone”, unpublished work, abstract submitted for paper presentation at the 2006 SPE Annual Technical Conference and Exhibition, San Antonio, TX, U.S.A., 24-26 Sep., 2006.
er Guide for ImbiSim,”, University of Wyoming, USA, May, 2002. hang, X., Morrow, N.R., MA, S.: “Experimental Verification of a Modified Scaling Group for Spontaneous Imbibition”, SPERE, (1996), Nov, 280-285.
hou, D., Jia, L., Kamath, J. and Kovscek, A.R., “Scaling of Counter-Current Imbibition Process in Low-Permeability Porous Media”, J. Petr. Sci. Eng., (2002), 33, 61-74.
ask 9. Increased oil recovery by spontaneous imbibition.
Task 9 concerns increased oil recovery by spontaneous imbibition through either anipulation of brine composition or use of surfactants. In previous studies of improved oil
recovery by spontaneous imbibition from carbonates (Xie et al., 2005), the following observations were reported:
1. Some types of surfactant could enhance oil recovery from non-water wet
carbonates through promotion of spontaneous imbibition. 2. No surfactants were found that could improve oil recovery from strongly water-
wet carbonates. 3. Rock properties had a dominant effect on the effectiveness of surfactant
enhanced oil recovery by spontaneous imbibition. 4. The mechanism of surfactant enhanced oil recovery by spontaneous imbibition
is unpredictable.
xperimental
ed oil
capillary backpressure on counter-current imbibition through use of surfactants for alteration of interfacial tension will also be investigated. Surfactants:
Nonionic: Tomadol 91-8, (C9-11) ethoxylated alcohols (n=8);
M
Ø n, P.-E., Bakke, S. and Arntzen, O.J., “Extending Predictive Capabilities to NetwModels”, SPEJ (1998), Dec, 324-336.
P
R
S R. “Efficie
Wo, S., “UsZ
Z
T
Introduction
m
EFour types of surfactant, three types of rock samples, and four types of crude oil, as listed below, have been obtained for a proposed study of interfacial tension and wetting effects. Combinations of surfactants, oils, and rocks, will be used to explore the mechanism of surfactant enhancrecovery for both sandstones and carbonates at different wetting conditions. The effect of

Triton X-100, alkylphenol hydroxypolyoxyethylene (n=10.5); Pluronic L64, block copolymer surfactant. (HLB=12~18,
12-15, dodecyltrimethyl ammonium Chloride;
Anionic: Witconate 3203, sodium alpha olefin sulfonate;
Limestone outcrop: Whitestone UZ, 1-30 md;
O ir, Big Horn Basin, Wyoming;
in, Wyoming;
XR 5.
CONCLUSIONS
simple pes and
illary
ain obtained by
e wet
Cloud point =58~62ºC) Cationic: Arquad
Arquad C-50, cocoalkyltrimethyl ammonium Chloride.
Rhodapex CD-128, ammonium C8-10 alkyl ether sulfate. Zwitterionic: Mirataine CB, cocamidopropyl betaine.
Rock samples: Edwards GC, ~10 md.
Dolomite: Cottonwood Creek, Phosphoria formation, Big Horn Basin, Wyoming.
Sandstone: Berea sandstone, 40~250 md; Tensleep sandstone, Big Horn Basin, Wyoming.
il samples: Tensleep crude oil, sandstone reservo
Minnelusa crude oil, sandstone reservoir, Powder River Basin, Wyoming; Cottonwood crude oil, Cottonwood Creek, carbonate reservoir, Big Horn
Bas McElroy crude oil, carbonate reservoir, provided by ChevronTexaco.
References ie, X., Wiess, W., Tong, Z.X., and Morrow, N.R., “Improved Oil Recovery from Carbonate eservoirs by Chemical Stimulation”, SPEJ, Sept. 2005, 276 – 28
Task 6 1. Relationships between displacement efficiency and aspect ratio are presented for a
mixed-wet pore model. The model can be extended to a wide range of pore shaaspect ratios.
2. Experimental results of change in surface area with saturation, and related cap
pressure data have been obtained. 3. Efficiency of conversion of work to surface energy range from 20% to 30%. The m
cause of uncertainty is the lack of agreement for capillary pressure data centrifuge and mercury injection.
Task 7. 4. Preliminary measurements of interface advance and the end pressure ahead of th
imbibition front show distinct differences from behavior for very strongly waterconditions.
DE-FC26-03NT15408 Semi-Annual Report 07/01/05 – 12/31/05
52

Task 8. 5. Spontaneous imbibition for a wide range of oil/water viscosity ratios and three boundary
with
n of the
D,
frontal position,
) of 0.5 (n= 2) on a log-log scale.
xperimental data set for radial flow (two-ends-closed, TEC).
of E(η) determined from
radial flow data provided close prediction of linear flow (one-end-open, OEO) and a r all faces open as a combination of spherical and radial flow (all-faces-open,
AFO).
rther ombination
l flow, larger scatter of n around 2 was observed. Such scatter could be caused by rock directional heterogeneities.
12. Very e plotted as normalized
fr a the dimensionless function E(η).
13. A lin f the extended Ma et al. scaling
g ns.
14. Evaluation of the dimensionless parameter E(η) in the extended Ma et al. scaling group sets for carbonate rocks, and comparison with E(η) obtained for sandstone
ved oil
conditions showed systematic dependence on viscosity ratio.
6. A mathematical model based on displacement as a sharp front imbibing watercounter-flow of oil was derived which related the imbibition time to the positioadvancing front.
7. The model relates the dimensionless position of the front to the dimensionless time, tdefined by Ma et al. (1995) and a dimensionless function of viscosity ratio E(η).
8. The model corresponds to a linear correlation between the normalized xD, and the root of the Ma et al. dimensionless time extended by a dimensionless functionof viscosity ratio, √tD E(η), with a slope (power index
9. A consistent regression curve for E(η) was obtained after fitting the e
10. Comparison with experimental data showed that the values
model fo
11. For linear (OEO) and radial (TEC) flow the power index n was close to 2, which fu
validates the proposed mathematical model. For all-faces-open modeled as a cof spherical and radia
close correlation was obtained when imbibition data aront l position versus the n-th root of the Ma et al. scaling group extended by
ear correlation was obtained between the n-th root oroup and the normalized frontal position on a log-log scale for all boundary conditio
from datarocks would show the extent to which the function containing this dimensionless parameter is dependent on rock type.
Task 9. 15. Surfactants, rocks and crude oils have been assembled for investigation of impro
recovery by spontaneous imbibition through use of surfactants.
DE-FC26-03NT15408 Semi-Annual Report 07/01/05 – 12/31/05
53