fungicide-resistance management tactics: impacts on...
TRANSCRIPT

Fungicide-resistance managementtactics: impacts on Zymoseptoria tritici
populations
Thesis submitted in fulfillment of the Degree of Doctor of Philosophy
School of Agriculture, Policy and Development
Hilda Dooley
January 2015
i
Abstract
Azoles and Succinate Dehydrogenase Inhibitors (SDHIs) are the main fungicides available for
septoria tritici blotch control, causal agent Zymoseptoria tritici. Decline in azole sensitivity, in
combination with European legislation, poses a threat to wheat production in Ireland.
Azole fungicides select CYP51 mutations differentially; it was hypothesised that using
combinations of azoles could be an effective anti-resistance tool. Naturally inoculated field
experiments were carried out in order to understand the impacts of using combinations of
azoles, epoxiconazole and metconazole, on azole sensitivity. Approximately 3700 isolates
were isolated and their sensitivity to both azoles analysed. Findings showed that limiting the
number of applications, by alternating each fungicide, slowed selection for reduced azole
sensitivity. Limiting azole use by reducing doses did not reduce selection for decreased azole
sensitivity. Although not complete, cross-resistance was observed between the two azoles,
which will lead to general reduction in azole sensitivity.
A sub-selection of isolates from each treatment at each location were analysed for
changes in the CYP51 gene. Sequence analysis identified 49 combinations of mutations in the
CYP51 gene, and three different inserts in the CYP51 promoter. Intragenic recombination also
featured in these populations.
Baseline studies of five new SDHIs were carried out on 209 naturally infected, non-
SDHI-treated isolates. With the exception of fluopyram, cross-resistance was apparent
between the SDHIs. Analysis of 2300 isolates found that when compared to the solo products,
mixing the SDHI isopyrazam and the azole epoxiconazole increased epoxiconazole
sensitivity, but had no apparent effect on isopyrazam sensitivity. SDHI resistance-conferring
mutations were absent in the baseline and experimental isolates.
As long as azoles are used, Z. tritici populations will continue to evolve towards
resistance. Combining different modes-of-action, SDHIs and multi-sites, with azoles will
relieve some of that selective pressure. To get the best out of available fungicides, they should
be used in combination with host resistance and good crop management practices.

ii
Declaration
I confirm that this is my own work and the use of all material from other sources has been
properly and fully acknowledged.
Signed ……………………………….
Date…………………………………..
iii
Acknowledgements
This PhD was funded by Teagasc under its Walsh fellow scheme. The Walsh fellow scheme
also funded an invaluable three month study trip to the phytopathology lab in ETH, Zurich.
I would like to take this opportunity to thank a few people who supported me throughout my
PhD studies.
To all Teagasc research officers, technicians and farm staff who helped me whenever I needed
it. Special thanks to Jim Grace and Liz Glynn for all the help with field experiments and for
helping to find data which went rogue at times. Thanks Jeanne Mehenni-Ciz for the help in
the lab.
To the undergraduate students who helped me through the long day’s disease assessing and
isolating, thank you Aaron Mullins, Gillian Darby, Clair Jouan and Aurelien Lepenettier.
To all of the other PhD students at Teagasc, for keeping me sane during stressful times, and
for supplying the gossip that kept me smiling, thank you.
To my supervisors: for furnishing me with the skills needed to complete such a mammoth
task as a PhD; for allowing me to develop as a researcher at my own pace; for such graceful
reactions to my tears of frustration; and especially for almost never disagreeing with each
other, thank you Steven Kildea, Mike Shaw and John Spink. At this time I must also thank
Bruce McDonald (and everyone at ETH) for welcoming me into the phytopathology lab at
ETH, and for facilitating the collaboration with Patrick Brunner who advised and assisted
with analysis and discussion points for Chapter 3. Bruce and Patrick, thank you.
To all of my family and friends who have accepted without question my virtual absence for
the last two years. To my parents, who instilled in me the work ethic that got me through this
PhD, and who are still working hard to keep all of their children, grandchildren and friends
happy, thank you.
Last, but by no means least, to Mike, for putting up with me over the last three years, I may
have cracked by now if it weren’t for you. Thank you.

iv
Table of Contents
Abstract .........................................................................................................................................
Declaration................................................................................................................................. ii
Acknowledgements................................................................................................................... iii
Table of Contents...................................................................................................................... iv
List of Figures ......................................................................................................................... viii
List of Tables ............................................................................................................................ xi
Abbreviations.......................................................................................................................... xiv
Chapter 1: Introduction...............................................................................................................1
1.1 Preface ..............................................................................................................................1
1.2 Biology of Zymoseptoria tritici ........................................................................................2
1.3 Controlling Zymoseptoria tritici .......................................................................................3
1.3.1 Crop management ......................................................................................................3
1.3.2 Host resistance ...........................................................................................................4
1.3.3 Fungicides ..................................................................................................................5
1.4 Resistance evolution .........................................................................................................8
1.4.1 Fungicide resistance...................................................................................................8
1.4.2 History of fungicide resistance in Zymoseptoria tritici isolates ................................9
1.4.3 The development and spread of fungicide resistance in Zymoseptoria tritici .........11
1.5 Resistance management ..................................................................................................12

v
1.6 Aims and objectives of this Ph.D....................................................................................16
Chapter 2: Effect of azole fungicide mixtures, alternations and reduced dose rates on azole
sensitivity in the wheat pathogen Zymoseptoria tritici .............................................................18
2.1 Introduction.....................................................................................................................18
2.2 Materials and methods ....................................................................................................20
2.2.1 Disease and yield assessments.................................................................................21
2.2.2 Sampling Zymoseptoria tritici .................................................................................21
2.2.3 Isolating Zymoseptoria tritici...................................................................................22
2.2.4 In vitro sensitivity testing ........................................................................................25
2.2.5 Data analysis ............................................................................................................25
2.3 Results.............................................................................................................................27
2.3.1 Variability before fungicide applications ................................................................27
2.3.2 Main contrasts..........................................................................................................31
2.3.3 Principal components analysis.................................................................................34
2.3.4 Disease severity and its relationship with selection.................................................38
2.3.5 Effects if fungicides on yield ...................................................................................41
2.4 Discussion.......................................................................................................................42
Chapter 3: Molecular mechanisms associated with reduced azole sensitivity and the genetic
structure of azole treated populations of Zymoseptoria tritici in Ireland .................................49
3.1 Introduction.....................................................................................................................49
3.2 Materials and methods ....................................................................................................54
3.2.1 Origins of isolates ....................................................................................................54

vi
3.2.2 DNA extraction, amplification and sequencing.......................................................55
3.2.3 Analysis of the putative CYP51 promoter region ....................................................56
3.2.4 Data analysis ............................................................................................................57
3.3 Results.............................................................................................................................60
3.3.1 Brief description of the collection ...........................................................................60
3.3.2 Effect of CYP51 variants on sensitivity...................................................................61
3.3.3 Effect of location on amino-acid and insert frequencies, and genetic diversity ......68
3.3.4 Effect of treatment on amino-acid and insert frequencies and genetic diversity.....72
3.3.5 Effect of individual amino-acid alterations on sensitivity .......................................75
3.3.6 Effect of treatment on frequencies of CYP51 variants ............................................77
3.3.7 Evolutionary history of the whole collection...........................................................79
3.4 Discussion.......................................................................................................................84
Chapter 4: Succinate dehydrogenase inhibitor fungicides and their effect on baseline and
treated Zymoseptoria tritici field isolates .................................................................................94
4.1 Introduction.....................................................................................................................94
4.2 Materials and methods ....................................................................................................97
4.2.1 Origin of isolates......................................................................................................97
4.2.2 Determination of fungicide sensitivity- baseline and selection experiment ..........101
4.2.3 Molecular study of the Sdh genes in isolates from the baseline collection and
selection experiment .......................................................................................................101
4.2.4 Data analysis ..........................................................................................................103
4.3 Results...........................................................................................................................103

vii
4.3.1 Baseline fungicide sensitivity distributions ...........................................................103
4.3.2 Variation in the Sdh genes of baseline isolates......................................................106
4.3.3 Selection experiments ............................................................................................109
4.3.4 Disease severity and its relationship with selection...............................................115
4.3.5 Effects of fungicides on yield ................................................................................118
4.3.6 Variation in the Sdh genes of isolates from the selection experiment ...................119
4.4 Discussion.....................................................................................................................121
Chapter 5: General discussion ................................................................................................128
References...............................................................................................................................141

viii
List of Figures
Figure 2.1 Frequency distribution of log10EC50 values for epoxiconazole sensitivity (top) and metconazole
sensitivity (bottom) from Pre-T collections of Zymoseptoria tritici sampled from each of the six locations,
illustrated with box and whisker plots. The line through the box represents the median. Number of Pre-T isolates
tested from each location; Duleek n = 33; Julienstown n = 29; Killeagh n = 20; Knockbeg n = 25; Oak Park n = 21;
Stamullen n = 48 ....................................................................................................................................................30
Figure 2.2 Correlation matrix with principal component axes superimposed. PC1 accounts for 75% variation, PC2
accounts for 25% variation ....................................................................................................................................35
Figure 2.3 Effect of individual treatments on disease severity on the flag leaf at GS 69-73 averaged over all six
locations. Disease severity refers to the proportion of the flag leaf covered in Septoria tritici blotch (square root
transformed). Each line is used to connect the full and half doses of the same application pattern. Treatment
information: abbreviations denote the first and second sprays. E: epoxiconazole; M: metconazole; UnT: un-
treated control .......................................................................................................................................................38
Figure 2.4 Fitted and observed relationship between (top) epoxiconazole sensitivity and disease severity, R2 =
0.48, P < 0.001; common slope = -0.074; intercept for Duleek = 0.256; Julienstown = 0.252; ; Killeagh = 0.122;
Knockbeg = -0.004; Oak Park = 0.135; Stamullen = 0.264 and (bottom) metconazole sensitivity and disease
severity R2 = 0.60, P < 0.001, common slope = -0.096; intercept for Duleek = -0.227; Julienstown = -0.355;
Killeagh = -0.177; Knockbeg = -0.345; Oak Park = -0.361; Stamullen = -0.153 .....................................................40
Figure 2.5 Fitted and observed relationship between yield and disease severity R2 = 0.98, P = 0.014; Duleek: y=
11.49 + -0.-0.617 x; Julienstown: y = 6.62 + -0. 486x; Killeagh: y = 6.13 + -0.28x; Knockbeg: y = 15.4 + -0.814x;
Oak Park: y = 8.74 + -1.069x; Stamullen: y = 7.75 + -0.862x ..................................................................................41
Figure 2.6 Effect of total azole dosage on the sensitivity of epoxiconazole (top) and metconazole (bottom).
Treatment information: abbreviations denote the first and second sprays. E: epoxiconazole; M: metconazole;
UnT: un-treated control .........................................................................................................................................45
Figure 3.1 Homology model of the wild-type Z tritici CYP51, binding triadimenol (circled), courtesy of Mullins et
al. (2011)................................................................................................................................................................50
Figure 3.2 Gel electrophoresis showing the four PCR products found in the collection from amplifying the
regulatory sequences upstream of CYP51. 100 bp ladder in lane one and lane 13. Lanes 4 and 11 have the

ix
expected product size of 334 bp; lanes 3 and 10 have the 120 bp insert; lanes 5, 7, 8 and 12 have the ~800 bp
insert and lane 6 has the ~300 bp insert. (Image courtesy of J M-C, Teagasc) ......................................................60
Figure 3.3 Sensitivity, measured as log10EC50 mg L-1, to epoxiconazole (top) and metconazole (bottom) of isolates
in all CYP51 variants. CYP51 variants with one isolate only have a single dash with no box & whisker. For CYP51
variants with more than one isolate, the line through the box represents the median, and x represents an
outlier. See Table 3.3 for CYP51 variant details. Sensitivity categories: sensitive; as log10EC50 values of below -0.3
mg L-1 for epoxiconazole and log10 -0.523 mg L-1 for metconazole, insensitive; as log10EC50 values of above 0.176
mg L-1 for epoxiconazole and 0.0 mg L-1 for metconazole, and moderately sensitive: log10EC50 values between
sensitive and insensitive.........................................................................................................................................66
Figure 3.4 Sensitivity to epoxiconazole (top) and metconazole (bottom) of isolates in CYP51 variants, split into
groups with (a) and without (b) the ~800 bp insertion. CYP51 variants with only one isolate have no box &
whisker. For CYP51 variants with more than one isolate, the line through the box represents the median, and x
represents an outlier. See Table 3.3 for CYP51 variant details ..............................................................................67
Figure 3.5 Phylogenetic relationship between 61 (+ ST1) haplotypes in a median-joining network used to
highlight the high number of reticulations (thick lines) in the population. Yellow circles each represent a single
nucleotide haplotype, and circle size is proportional to number of isolates with that haplotype. Red circles
represent median vectors (hypothetical haplotypes) ............................................................................................79
Figure 3.6 Identification of intragenic recombination break points (RBP) in the CYP51 gene of Zymoseptoria
tritici. A single RBP at 1141 bp had a significant KH-test P < 0.001.......................................................................80
Figure 3.7 Reconstruction of phylogenetic trees. Branches with bootstrap values of 70 or greater are labelled.
Far left: the original data set, prior to the removal of recombinants. Middle: data from the left of the
recombination break point. Right: data from the right of the recombination break point ...................................81
Figure 3.8 After potential recombinants were removed: un-rooted phylogenetic analysis using Maximum
Likelihood method. The tree with the highest log likelihood (-2963.8) is shown. The analysis involved 52
nucleotide haplotypes, which included sequence data from the wild-type ST1. There were a total of 1635
positions in the final dataset. Branches with bootstrap values of 70 or greater are labelled. Branch labels: in
parenthesis the nucleotide haplotype name; the individual CYP51 alterations in each CYP51 variant; outside the
square bracket is the CYP51 variant name as in Table 3.3 (some CYP51 variants are present in more than one
nucleotide haplotype). The symbol at the beginning of branch labels represents the presence or absence of the

x
~800 bp insert in the nucleotide haplotype: no symbol = no insert; triangle = some isolates have and some
isolates have no insert; square = all isolates have the insert; circle = all except one has the insert, and the final
isolate has the ~300 bp insert. Grey bars to the right cover branches where the 120 bp insert is present; CYP51
variants 25, 1, 13, 14 and 26..................................................................................................................................82
Figure 3.9 Phylogenetic tree, excluding recombinants, highlighting epoxiconazole and metconazole sensitivity
(log10EC50 mg L-1) groups. Epoxiconazole sensitivity (left): white spots = < -0.3; black spot = > 0.176, grey spot =
between -0.3 and 0.176. Metconazole sensitivity (right) white spots = < -0.523; black spot = > 0.0, grey spot =
between -0.523 and 0.0 .........................................................................................................................................83
Figure 4.1 Matrix of correlations between fungicide sensitivities for baseline isolates (n = 209). Sensitivity was
measured as EC50 values (mg L-1) which were transformed using log10 for improved visualisation. P < 0.001
means the correlation was highly significant ......................................................................................................105
Figure 4.2 Distribution of log10EC50 values for epoxiconazole sensitivity (top) and isopyrazam sensitivity (bottom)
from the pre-treatment collection sampled from each of the six locations, illustrated with box and whisker plots.
The line through the box represents the median. Number of pre-treatment isolates tested from each site varied:
Drogheda n = 39; Julienstown = 29, Killeagh = 20, Midleton = 44, Oak Park 1 = 21, Oak Park 2 = 59.................112
Figure 4.3 Scatter plot showing the correlation between isopyrazam and epoxiconazole sensitivity for isolates
from the selection experiment: n = 2283, r = 0.2, P < 0.001 ................................................................................114
Figure 4.4 Fitted and observed relationship between disease severity (measured as average percent STB per flag
leaf, square root transformed) and sensitivity (measured as log10EC50) (top) epoxiconazole, R2 = 0.53, P < 0.001;
common slope = -0.04; intercept for Killeagh = -0.14; Midleton = 0.217; Drogheda = 0.16; Julienstown = -0.084;
Oak Park 1 = -0.248; Oak Park 2 = -0.039 and (bottom) isopyrazam sensitivity and disease severity R2 = 0.44, P =
0.002, common slope = -0.052; intercept for Killeagh = -0.885; Midleton = -0.933; Drogheda = -0.931;
Julienstown = -0.973; Oak Park 1 = -1.009; Oak Park 2 = -1.11 ...........................................................................117
Figure 4.5 Fitted and observed relationship between disease severity (measured as average percent STB per flag
leaf, (square root transformed) and yield (measured as tonne per hectare), R2 =0.96, P = 0.013. Drogheda: y =
9.64 + -0.271x; Julienstown: y = 6.84 + -0.562x; Killeagh: y = 6.1 + -0.289x; Midleton: y = 10.32 + -0.233x; Oak
Park 1: y = 9.2 + -1.261x; Oak Park 2: y =10.6 + -0.266x......................................................................................118

xi
List of Tables
Table 2.1 Location details: year each location was included, timing of fungicide applications and growth stage
at which fungicides were applied (GS) ...................................................................................................................23
Table 2.2 Treatments used: application pattern, dose rates applied, fungicides used and actual amount of active
ingredient (a.i.) at each treatment time ................................................................................................................24
Table 2.3 Mean sensitivity (log10EC50 mg L-1
) of isolates from individual treatments, including pre-treatment,
over all locations to (a) epoxiconazole and (b) metconazole, and broken down into treatment means per
location ..................................................................................................................................................................28
Table 2.4 Independent single degree of freedom contrasts between treatments in (a) epoxiconazole and (b)
metconazole sensitivity..........................................................................................................................................32
Table 2.5 Independent single degree of freedom contrasts between treatments with common azole sensitivity
(PC1 in a principal component transformation of the data)..................................................................................36
Table 2.6 Independent single degree of freedom contrasts between treatments in the difference between
epoxiconazole and metconazole sensitivity (PC2 in a principal component transformation of the data).............37
Table 2.7 Disease severity at GS 69-73 (measured as average percent STB per surface area of the flag leaf,
square root transformed) between treatments at each location. Underneath are the results of a cross-location
analysis using factorial plus control procedure......................................................................................................39
Table 2.8 Yield (t/ha) after treatments at each location, with a cross-location analysis using factorial plus
control procedure...................................................................................................................................................42
Table 3.1 Polymerase chain reaction (PCR) primers used to amplify the CYP51 gene in Z. tritici ..........................55
Table 3.2 Origin of isolates: number of isolates from each treatment; Epox = epoxiconazole; Mixture = epox +
metconazole; Met = metconazole; Pre-T = pre-treatment, at each of the six experimental locations in Chapter 2
...............................................................................................................................................................................56
Table 3.3 CYP51 variants in the current collection. Each CYP51 variant represents a different combination of
amino-acid alterations, and N the number of times that CYP51 variant was found. Treatment illustrates the
treatments from which CYP51 variants were found; E = epoxiconazole; M = metconazole; G = the mixture; P =
pre-treatment. Location illustrates the location in which CYP51 variants were found; D = Duleek; K = Knockbeg; S
= Stamullen; J = Julienstown; C = Killeagh; and O = Oak Park................................................................................63

xii
Table 3.4 Number of times amino-acid alterations, and promoter insert were found in the whole collection, and
at individual geographical locations represented as percentage of location sample size. ....................................69
Table 3.5 Summary statistics of molecular diversity found at the CYP51 gene in Zymoseptoria tritici isolates
collected from six different geographical locations ...............................................................................................71
Table 3.6 Proportion of common haplotypes between geographic location, and unique haplotypes within
geographic location (in bold numbers) ..................................................................................................................71
Table 3.7 Pairwise comparisons of gene flow (Nm) (above the diagonal) and population differentiation (Gst)
(below the diagonal) in the Zymoseptoria tritici populations from the six geographic locations..........................71
Table 3.8 Number of times amino-acid alterations, and promoter insert were found in the whole collection,
classified and split by treatment............................................................................................................................73
Table 3.9 Summary statistics of genetic diversity found at the CYP51 gene in Zymoseptoria tritici isolates
collected from plots treated with epoxiconazole, metconazole, both together (mixture) and from a pre-
treatment collection...............................................................................................................................................74
Table 3.10 Proportion of common haplotypes between treatments, and unique haplotypes within treatments (in
bold numbers) ........................................................................................................................................................74
Table 3.11 Pairwise comparisons population differentiation (Gst) in the Zymoseptoria tritici populations from
each of the four treatments (averaged over all locations) ....................................................................................75
Table 3.12 Effects of CYP51 amino-acid alterations, and promoter insertions on (top) epoxiconazole sensitivity,
and (bottom) metconazole sensitivity....................................................................................................................76
Table 3.13 Logistic regression results comparing the relationship between treatment and the frequency of the
more frequent (n > 10) CYP51 variants ..................................................................................................................78
Table 4.1 Selection experiment: details of site location, year each location was included, date of fungicide
applications and growth stage (GS) at which fungicides were applied, date of disease assessment and GS at that
time........................................................................................................................................................................99
Table 4.2 Treatments used in the selection experiment: application pattern, dose rates applied, fungicides used
amounts of active ingredient (a.i.) at each treatment time with overall amount of active ingredient per
treatment in parenthesis .....................................................................................................................................100
Table 4.3 Primers used in the polymerase chain reaction to amplify Sdh genes from Zymoseptoria tritici isolates
.............................................................................................................................................................................102

xiii
Table 4.4 Summary of baseline sensitivity (EC50 mg L-1
) of Zymoseptoria tritici isolates for each active ingredient
(a.i.) tested...........................................................................................................................................................104
Table 4.5 Summary of sensitivity profiles of (a) SdhC (n = 89) and (b) SdhD (n = 92) baseline Zympseptoria tritici
variants ................................................................................................................................................................107
Table 4.6 Mean sensitivity (log10EC50 mg L-1
) from individual treatments in the selection experiment, including
pre-treatment, over all locations to (a) epoxiconazole and (b) isopyrazam, and broken down into treatment
means per location ..............................................................................................................................................110
Table 4.7 Independent single degree of freedom contrasts between treatments for (a) epoxiconazole and (b)
isopyrazam sensitivity..........................................................................................................................................113
Table 4.8 Disease severity at GS 71-83 (measured as average percent STB per surface area of the flag leaf,
square root transformed) between treatments at each location. Underneath are the results of a cross-location
analysis using factorial plus control procedure....................................................................................................115
Table 4.9 Yield (measured as tonne per hectare) between treatments at each location. Underneath are the
results of a cross-location analysis using factorial plus control procedure..........................................................119
Table 4.10 Summary of sensitivity profiles of (a) SdhC (n = 81) and (b) SdhD (n = 89) variants from Zymospetoria
tritici isolates from the selection experiment.......................................................................................................120

xiv
Abbreviations
ABC: ATP-binding cassette
a.i.: active ingredient
ANOVA: Analysis of variance
ATP: Adenosine triphosphate
bp: base pair
cm: centimetre
DMI: Demethylation inhibitors
DMSO: dimethyl sulfoxide
DNA: Deoxyribonucleic acid
dNTP: Deoxynucleotide Triphosphates
FRAC: Fungicide Resistance Action Committee
FRAG-UK: Fungicide Resistance Action Group
GS: growth stage
ha: hectare
IPM: Integrated pest management
L: litre
MBC: Methylbenzimidazole carbamates
MDR: multiple drug resistance
MFS: Major facilitator superfamily
mg: milligrams
min: minute
ml: millilitres
ML: maximum likelihood
N: nitrogen
Ng: nanograms
nM: nano molar
nm: nanometres
PCA: principal components analysis

xv
PCR: polymerase chain reaction
PDB: potato dextrose broth
PGA: potato glucose agar
QoI: Quinone outside Inhibitors
RBP: recombination break point
REML: Restricted maximum likelihood
s: seconds
SDHI: Succinate dehydrogenase inhibitors
sqrt: square root transformed
STB: Septoria tritici blotch
t: tonnes
t/ha: tonnes per hectare
TM: trade mark
U: unit
UK: United Kingdom
µl: microliter
µM: micromolar
UV: ultra violet
WT: wild type
°C: degrees Celsius

1
Chapter 1: Introduction
1.1 Preface
Wheat is the most important cereal grown in the Northern Hemisphere (Oerke & Dehne,
2004), and is the second most important food crop after rice in developing countries
(http://www.wheatinitiative.org/). The worldwide average yield of wheat is approx. three t/ha
(Hawkesford et al., 2013), but Irish winter wheat crops produce some of the highest yields per
hectare in the world (Jess et al., 2014), averaging over eight t/ha between 2007-2010 (J.
Spink, personal communication). Ireland’s temperate climate with high rainfall during the
growing season complements wheat (Triticum aestivum) production, but is also conducive for
the growth of Zymoseptoria tritici, the causal agent of Septoria tritici blotch (STB). Although
a number of diseases affect wheat yields, STB is the main disease of winter wheat in Ireland
and many other wheat growing regions throughout the world (Viljanen-Rollinson et al., 2005,
Fraaije et al., 2012, Cools & Fraaije, 2013). Septoria tritici blotch is characterised by
irregular necrotic lesions interspersed with small black fruiting bodies (pycnidia) on the
leaves (Palmer & Skinner, 2002) and stem (Ponomarenka et al., 2011). It is these lesions that
reduce the green leaf area of the plant and which, particularly if present on the upper leaves
during grain filling, can reduce yield (Gooding et al., 2000). Burke and Dunne (2008)
recorded yield reductions of up to 50% resulting from STB under Irish growing conditions.
Such yield reductions make the cultivation of wheat economically un-viable. Given the
importance of wheat globally and locally, and considering the potential losses due to STB,
adequate control of Z. tritici is important for the continuation of wheat cultivation in Ireland
and Europe.
2
1.2 Biology of Zymoseptoria tritici
Zymoseptoria tritici (Desm.) Quaedvlieg & Crous is part of the Mycosphaerella complex
which contains a number of different families and genera (Quaedvlieg et al., 2011). Formerly
known as Mycosphaerella graminicola ((Fuckel) Schröter in Cohn), Quaedvlieg et al. (2011)
designated Septoria-like species with graminicolous hosts to the Zymoseptoria genus.
Morphologically, Zymoseptoria species have a yeast-like growth form in culture, and types of
conidia unlike those in the Septoria genus (Quaedvlieg et al., 2011). Zymoseptoria tritici is a
haploid (with a transient diploid stage (Whittenberg et al., 2009)), heterothallic ascomycete
(Kema et al., 1996), which has a hemibiotrophic lifecycle and reproduces both sexually
(teleomorph) and asexually (anamorph). It has a polycyclic lifecycle within wheat crops
(Henze et al., 2007) and undergoes multiple sexual (Kema et al., 1996) and asexual (Shaw &
Royle, 1993) lifecycles throughout the growing season. The lifecycle of STB begins soon
after the emergence of the wheat crop. Ascospores, which are the sexual progeny, are capable
of disseminating over distances of between 10-200 kilometres (Linde et al., 2002) . They are
the primary source of inoculum (Shaw & Royle, 1989), as well as contributors to the within
season spread of disease (Kema et al., 1996). They remain in perithecia in the stubble of
previous crops (Palmer & Skinner, 2002) until after periods of moisture and subsequent
fluctuations in relative humidity (Ponomarenka et al., 2011) when spores are ejected into the
air and land on a wheat host. Spores then germinate on the leaf surface and hyphae gain entry
to the leaf through the stomata (Ponomarenka et al., 2011) where they grow inter-cellularly
for a period of up to two weeks without any apparent damage to the host (Goodwin et al.,
2011). The pathogen then switches from a biotroph to a necrotroph and causes host cell
collapse which causes the necrotic lesions form. The long latent period (14-28 days) and the
ability to switch from biotrophy to nectrotrophy facilitates the evasion of host defence
systems by Z. tritici (Goodwin et al., 2011). Pycnidia form around the stomata within the

3
necrotic areas and exude conidia (Ponomarenko et al., 2011). These conidia, which cause the
secondary and most of the subsequent infections (Gladders et al., 2001), are discharged after
rain and high humidity events (Shaner & Finney, 1976). Additionally, conidia are tolerant of
low levels of humidity/moisture (Shaw, 1991), surviving desiccation and allowing the
pathogen to withstand fluctuations in levels of humidity (Gough & Lee, 1985 ).
1.3 Controlling Zymoseptoria tritici
Septoria tritici blotch can be controlled through a combination of measures including good
crop management practices, varietal resistance, and chemical control.
1.3.1 Crop management
The most basic agronomic practice for general control of cereal diseases is crop rotation. It
helps improve soil structure and nutrient management, which both serve to strengthen the
crop, and it removes the host from the immediate vicinity of lingering inoculum. However,
while crop rotation has obvious benefits for controlling soil borne diseases such as take-all
(Anon, 2014c), diseases which spread in the air such as STB will find their host over a wider
area. Because of soil conservation and potential savings in crop establishment costs,
minimum tillage (min-till) practices have gained popularity in recent years. Not much
research has been done on the effects of min-till on STB epidemics, however, considering that
ascospores on wheat stubble provide the biggest proportion of primary inoculum (Suffert et
al., 2011) it could be suggested that min-till is likely to increase the level of primary inoculum
early in the season (Sept-April, (Duvivier et al., 2013)), which depending on environmental
conditions may have a knock-on effect on disease severity on important leaf layers.
Conversely, the presence of microflora in the undisturbed soil system may reduce transfer of
disease to the next crop or encourage early defences. Later sowing reduces the host
availability early in the season, decreasing the ‘green-bridge’ between crops and potentially
4
reducing the carry-over of inoculum between crops. Gladders et al. (2001) established a link
between later sowing and reduced disease severity later in the growing season. They showed
that disease risk was significantly reduced by October sowing compared to September
sowing, and that thresholds were rarely reached after a November sowing time (in the UK).
Increased severity of STB under high nitrogen (N) fertilisation has been demonstrated
(Broscious et al., 1984, Leitch & Jenkins, 1995, Simón et al., 2003), but effects may depend
on whether the environmental conditions are conducive to N uptake and disease progress
(Simón et al., 2003). Hence, good management of soil N could be a factor in reducing STB
severity. It is possible that managing the crop architecture through controlling seed rate has
an effect on STB development, however, results are variable (Baccar et al., 2011). Baccar et
al. (2011) found no differences in Septoria epidemics between seeding rates tested but
Broscious et al. (1984) established that in some instances where higher seeding rates were
used, significantly higher levels of STB were observed. Higher seeding rates lead to a closed
canopy, possibly allowing easy transfer of spores horizontally and vertically within the crop
and providing a suitable microclimate for the development of the disease (Tompkins et al.,
1993). On the other hand, a more sparse open canopy would facilitate higher rain splash
(Eyal, 1981) and easy spread of conidia up the canopy. Low N rates, late sowing and low
seeding rates together may help to reduce STB incidence. Unfortunately, many of these
practices are also likely to reduce yield (Green & Ivins, 1985), resulting in few growers using
them.
1.3.2 Host resistance
In addition to good crop management, host resistance can play a role in STB control.
Miedaner et al. (2013) argue that breeding for resistance to STB is possibly the most
environmentally sound method of control, however development of STB host resistance is
hard because resistance has complex inheritance (Zhan et al., 1998). Host resistance to STB

5
can be based on a single gene resistance, but is usually controlled by many loci each with a
small effect size, i.e. polygenic resistance (Miedaner et al., 2013), which reduces the risk of
being overcome by a single resistant Z. tritici isolate. Host resistance is available for STB,
but good host resistance often comes with a trade-off, for example susceptibility to other
pathogens or reduced yields (Brown, 2002). Some of the higher yielding cultivars which are
typically grown in Ireland come with low STB resistance, often with resistance ratings of 4 to
5 on a scale of 1-9, where 1 is susceptible and 9 is resistant (Anon, 2013c), which alone is not
enough to maintain sufficient STB control, especially under high disease pressure. Gigot et
al. (2013) however demonstrated that mixing cultivars, at a 3:1 ratio of resistant:susceptible,
had the effect of reducing the level of sporulation on the susceptible host, compared to the
pure stand. Even though that result was seen under low-medium levels of STB disease
pressure and crops in Ireland are often under high disease pressure, this practice could
contribute towards reducing STB levels at the same time as utilising the higher yielding
potential of the susceptible cultivars. While field resistance to some of the major fungicide
groups has renewed the drive to look for durable, effective host resistance (Arraiano et al.,
2009), current varietal resistance in the wheat-Z. tritici pathosystem is limited in its
effectiveness.
1.3.3 Fungicides
The application of fungicides has been shown to contribute substantially to the yield of wheat
(Blake et al., 2011, Dunne et al., 2008) and intensive cereal production has come to rely on
chemical fungicides to secure yields in high disease pressure situations (Anon, 2014c).
Cereal fungicides are applied as either foliar or seed treatments to protect against a range of
fungal pathogens, including Z. tritici. While not targeting Z. tritici specifically, some
researchers have demonstrated that seed treatments do have an effect on STB. Christ and
Frank (1989) found that STB severity was reduced further in plots treated with a foliar and

6
seed treatments, compared to the foliar treatment alone. Dinoor (1977) found that a seed
treatment including thiabendazole contributed a moderate level of protection from STB, but
Shtienberg (1992) saw no such effect. Quérou et al. (1998) demonstrated that even though
most of the triticonazole seed treatment was translocated to the roots of the wheat plant, some
of the active ingredient reached the shoots also. Sundin et al. (1999) showed that triadimenol
and difenconazole both suppressed sporulation levels of Septoria for up to 6.5 weeks after
sowing.
Foliar fungicides, on the other hand, are used specifically to target STB and other
foliar pathogens. The top three leaves of the wheat plant, which make the most important
contribution to yield (Shaw & Royle, 1989), are best protected by applying foliar fungicides
at precise timings (Paveley et al., 2000). The first main application should take place as soon
as leaf 3 is fully emerged (approx. GS 32, (Zadoks et al., 1974)), and aims to give full
protection to leaf 3 and some protection to leaf 2. The second main treatment, applied when
the flag leaf is just fully emerged (approx. GS 39 (Zadoks et al., 1974)), aims to eradicate
disease on leaf two and protect the flag leaf (Sylvester-Bradley et al., 2008). In situations
where sprays are poorly timed, treated crops can suffer as much disease as untreated crops
(Thomas, 1986 In: Cook et al. (1999)), so getting the timing of application right is important
to ensure good control.
The rapid development of the fungicide market from the 1950s saw the introduction of
many new active ingredients. The multi-site fungicides folpet and chlorothalonol were
introduced in the 1950’s and 60’s (Russell, 2005). They are broad spectrum, contact
fungicides (where the fungicide is not taken into the plant, and protects only the area where
the fungicide lands), and act preventatively to impede spore germination (Leroux et al.,
2005). While initially used for the control of diseases of fruit, veg and glasshouse crops, they
are now primarily used for the control of STB. Active ingredients from the methyl

7
benzimidazole carbamate (MBC) group of fungicides were amongst the earliest (introduced in
the late 1960s) systemic fungicides (where the fungicide is taken into the plant and
transported around the plant in the transpiration stream (Russell, 2005)) to be used for the
control of wheat diseases such as Puccinia spp., Septoria spp., and Fusarium spp. (Russell,
2005). Griffin and Fisher (1985) found that in the UK in 1981 the pressure from S. tritici was
particularly high and, at that time, chemistries from the MBC group of fungicides were widely
used for STB control. Demethylation inhibitors (DMIs), were introduced to the market from
early 1970s, and grew to become a very important group of fungicides for many crops
(Russell, 2005). DMIs are broad-spectrum, are mostly systemic and exhibit eradicant/curative
activities (Leroux et al., 2005). The azoles, largely represented by triazoles but also
imidazoles, are the main chemical group within the DMI class. Indeed, for the control of
STB, the DMIs were the main group until the introduction of the Quinone outside Inhibitors
(QoIs). Strobilurins, initially azoxystrobin, from the QoIs were introduced in the 1990s
(Fraaije et al., 2005) and became the main group of fungicides for control of cereal pathogens.
This very effective group of systemic fungicides provided protectant and eradicant activity
(Russell, 2005), with the addition of contribution to delayed senescence of the flag leaves
(Ruske et al., 2003). Introduced in the mid-1960s, the carboxamide, carboxin, was used
against rusts, bunts and smuts in cereals (Pasche et al., 2005). In more recent years, second
generation carboxamides, commonly referred to as succinate dehydrogenase inhibitors
(SDHIs), have been introduced. The first of the new SDHIs, boscalid, came on the market in
2005 (Fraaije et al., 2012), and between 2010 and the present (2014) five new SDHIs have
been introduced for control of cereal diseases (Walter, 2011). The SDHIs exhibit largely
protectant with some curative activity. Currently, the three main groups of fungicides
available for STB control are the multi-site inhibitors, DMIs and SDHIs.

8
Effective fungicide use has the associated disadvantage of driving selection for
resistant strains, leaving some fungicides less effective, or in extreme cases totally ineffective.
The limited choice of fungicides available for use on cereals already places severe pressure on
winter wheat production, and if any of the available fungicides for STB were to succumb to
resistance, this would exacerbate the situation. On top of that, recent changes in European
regulations on fungicides means that some of the fungicides which are available may be
removed from the market in the near future, specifically the azoles and multi-sites (Blake et
al., 2011, Jess et al., 2014). If azoles were to be removed from the market, it has been
estimated that the drop in production of wheat in Europe would amount to 18.6 million t by
2020 (Di Tullio et al., 2012), which would have a knock on effect on worldwide markets (Jess
et al., 2014).
1.4 Resistance evolution
1.4.1 Fungicide resistance
Fungicide resistance is defined as occurring when a fungal pathogen can survive and
reproduce in the presence of a fungicide (Anderson, 2005). This is an acquired resistance that
occurs after a period of exposure of the pathogen to a fungicide: the pathogen population
which was sensitive to the fungicide at the time of introduction has become less sensitive over
time and is no longer controlled adequately (Brent & Hollomon, 2007). Pathogens differ in
their levels of risk of developing resistance depending on; the lifecycle of the pathogen - a
pathogen with a short generation time and large number of propagules will be at a greater risk
of resistance than one with a longer generation time and fewer propagules; and the inherent
properties of the fungicide - a fungicide which targets multiple genes will be at a lower risk of
resistance that one which targets a single gene (Brent & Hollomon, 2007). Resistance can
develop as qualitative or quantitative resistance. Qualitative resistance, also known as single

9
gene or major gene resistance, happens when loss of efficacy is brought about by a single
mutation in the target gene. Quantitative resistance, also known as multiple gene resistance,
occurs when a gradual reduction in sensitivity is brought about by the development of many
individual genetic changes, such as mutations in the target gene or over-expression of the
target gene. Different terminology is used when qualifying resistance, i.e. if a strain is
labelled laboratory resistant (resistance found in strains in controlled laboratory conditions)
that does not automatically mean that those strains are field resistant (where a fungicide has a
reduced level of control of the those strains in the field), and the presence of field resistant
strains does not automatically mean that practical resistance (where total loss of efficacy of a
fungicide is observed in the field) is present or imminent (Brent & Hollomon, 2007).
1.4.2 History of fungicide resistance in Zymoseptoria tritici isolates
The multi-site inhibitors which have been available since the 1950s and 60s (Russell, 2005)
have not declined in efficacy since their introduction. Additionally, they have not been
affected by resistance in Z. tritici, reflecting their low risk of resistance status (Brent &
Hollomon, 2007). The systematic change in use from more general toxins such as the multi-
sites to safer target-site-specific fungicides increased the risk of resistance occurring (Clark,
2006a). The first major development of resistance in Z. tritici to affect fungicide efficacy
involved the methylbenzimidazole carbamate (MBC) group of fungicides, and occurred by
1984 (Griffin & Fisher, 1985). Brought about by a single genetic change (Fraaije et al.,
2005), MBC resistance is still present in recent Z. tritici populations even though MBC
fungicides have not been widely applied to wheat for over 20 years (O'Sullivan, 2009);
evidence that it carries no significant fitness costs. After registration for use on cereals, the
strobilurins quickly became key fungicides for cereal production (Russell, 2005). However,
strains with major-gene resistance to the QoIs were found in Z. tritici populations in the UK
and Ireland in 2002 (Fraaije et al., 2003), after which resistance developed rapidly in the

10
population. QoI resistance in Z. tritici is now complete, and fungicides from this group are no
longer recommended for STB control. They are however still effective against other diseases
such as Puccinia sp. in wheat (Oxley et al., 2014), and Rhyncosporium commune in barley
(Gosling et al., 2014) and so still have a place in cereal disease control programmes.
Additionally, they also have a greening effect on the plant (Anon, 2014c), so may be of use to
help maintain green leaf area at important yield forming stages of the crop.
Like the MBCs and the QoIs (Fraaije et al., 2005), Z. tritici resistance to the SDHIs is
purported to be due to monogenic or qualitative resistance. But, while the single-site
mechanisms for SDHI resistance have been elucidated through lab experiments (Fraaije et al.,
2012, Scalliet et al., 2012), a few field isolates with mutations conferring reduced sensitivity
have been detected (Anon, 2014a). Even so, SDHI resistant Z tritici isolates have yet to be
found in the field. FRAG rate the risk of Z. tritici resistance to SDHIs as medium-high, but
because of the risk of single-site resistance occurring in SDHIs, other workers considered Z.
tritici to be at a high-risk of resistance (Fraaije et al., 2012).
Resistance to azoles has been described as a polygenic trait (Stergiopoulos et al.,
2003), or quantitative resistance, which develops in a gradual stepwise progression, and Z.
tritici is thought to be at a medium risk of resistance to azoles (Brent & Hollomon, 2007).
Functionally, all azoles are in the same cross-resistance group (FRAC, 2012), signifying the
high risk of Z. tritici becoming cross-resistant to all DMIs. However, within the group it is
recognised that there is much variation between the fungicides (Bean, 2008), and it is a very
diverse group in terms of mobility in planta, disease control and intrinsic activity (Kendall et
al., 1994, Du Rieu & Burke, 1994). Hence, while cross-resistance between some azoles has
been observed (Hermann & Gisi, 1994, Kildea et al., 2006), it is not always the case (Cools et
al., 2005a, Fraaije et al., 2007, Kildea, 2009). Point mutations in the CYP51 gene has been
the major mechanism involved in reducing azole sensitivity (Bean, 2005, Cools et al., 2005a,

11
Cools et al., 2005b, Leroux et al., 2007, Stammler et al., 2008). In addition, over-expression
of the target gene (Cools et al., 2012), possibly over-expression of the drug efflux transporter
genes (Leroux & Walker, 2011, Fillinger et al., 2014) and combinations of all these
mechanisms contribute to the slow but steady decline in azole efficacy. While the beginning
of the decline in in-vitro sensitivity was seen in the early 1990’s (Leroux et al., 2007), it was
thought that azole insensitivity reached a plateau by 2008 (Stammler et al., 2008). However,
recent analysis of epoxiconazole sensitivity results (Buitrago et al., 2014, Kildea & Glynn,
2014) showed a continuation of the decrease in sensitivity from 2010 to 2013. This is
described in more detail in the introduction to Chapter 2.
1.4.3 The development and spread of fungicide resistance in Zymoseptoria tritici
Pathogen evolution occurs by changes in allele frequencies in populations (McDonald, 2004),
and is driven by evolutionary processes such as mutation, migration, genetic drift, and mating
system (Zhan & McDonald, 2004). Due to its mixed reproductive system and polycyclic
lifecycle, Z. tritici is said to have high evolutionary potential (Zhan & McDonald, 2004).
Frequent asexual reproduction creates a large effective population size which is adapted to its
environment (Linde et al., 2002, Zhan & McDonald, 2004). This is an important feature of Z.
tritici; as each individual propagule has a chance of acquiring a mutation (Anderson, 2005),
larger populations will produce more mutations. In a strictly clonal pathogen, successive
random mutational events would have to occur in a single variant before multiple resistance
alleles would be found in combination. But, sexual reproduction in Z. tritici facilitates the
rapid combining of resistance alleles (Brunner et al., 2008) which can be ‘tested’ in new
environments, as the progeny are wind dispersed.
This introduction of genetic variation/novel alleles into the population by mutation
and invasion is the first step in the process of evolution. While most new alleles do not
survive, some do by random chance. If the new allele is fit enough to survive in a hostile

12
environment such as post-fungicide application, it will be able to reproduce in that
environment. At this point, processes such as selection and gene-flow change the allele
frequencies in the population (McDonald, 2004). This is known as the emergence phase of
fungicide resistance, the first of three phases in the evolution of fungicide resistance;
emergence, selection and adjustment (Van den Bosch et al., 2011). The emergence phase
lasts from the introduction of the new fungicide until the resistant strain increases in number
to a size where it is unlikely to die out by chance (Hobbelen et al., 2014). Following this, the
increase of resistant strains as a proportion of the pathogen population can be described as the
selection phase. Unlike the emergence phase, selection is not about the absolute number of
resistant strains in the population but more about the rate of increase of the resistant
population relative to the sensitive population (Van den Bosch et al., 2011). The use of
fungicides in the presence of resistant strains undoubtedly increases the selective advantage of
such strains and hence their proportion in a population. When the resistant subpopulation
becomes so large that the field efficacy of the respective fungicide(s) is compromised and
adjustment of disease management practices is necessary, this is known as the adjustment
phase. Management of resistance during each phase may differ, but this thesis generally
focusses on the selection phase.
1.5 Resistance management
The aim of fungicide anti-resistance strategies is to reduce the rate at which field resistance
develops, at the same time as maintaining control of the disease, thereby increasing the
‘effective life’ of the product (van den Berg et al., 2013). This is achieved by minimising the
selection coefficient, i.e. the difference in fitness between the resistant and sensitive strains
(van den Bosch et al., 2014) by either reducing the rates of increase of both sensitive and
resistant strains, reducing the rate of increase of resistant strains relative to that of sensitive
strains, or by reducing the exposure time of the target pathogen to the fungicide. Anti-
13
resistance recommendations, also known as resistance management tactics, are based on the
overall premise that reducing the time that the pathogen is exposed to the fungicide would
increase the effective life of that fungicide (van den Bosch et al., 2014). Recommendations
include mixing or alternating different modes-of-action, limiting the number of applications
of an individual fungicide, and choice of application dose (van den Bosch et al., 2014). In
addition, reducing the levels of disease in the crop by utilising existing host resistance and
suitable agronomic practices would ease the pressure on fungicides. Different versions of
these tactics are used and previous studies on this subject have been reviewed recently by van
den Bosch et al. (2014) who discuss nine separate tactics used to potentially minimise the
selection coefficient. There are of course many complicating factors in resistance
management, e.g. not only can populations be at different stages of resistance evolution to the
different fungicides being used at the same time, where management tactics may vary
depending on the stage (van den Bosch et al., 2014b), but also, in cases of polygenic
resistance, individual isolates within a population can have different levels of resistance,
potentially all levels from very sensitive to very resistant. In theory, this means that each
fungicide resistance case should be managed on an individual basis. However this is not
always practical and inferences from other studies may be the only information available for a
particular pathosystem. So, even though there is much available information on fungicide
resistance in Z. tritici, it is not complete.
Fungicides are conventionally mixed to extend the spectrum of activity and to improve
the disease control seen with weaker products, but also as an insurance against resistance to
one component and as a general anti-resistance tactic (van den Bosch et al., 2014b). From an
anti-resistance point of view, most strains resistant to one component of a mixture are likely
to be sensitive to the other component, and vice versa, (assuming cross-resistant fungicides
are not mixed). Reviews by van den Bosch et al. (2014) and van den Bosch et al. (2014b)
14
highlighted that much empirical (Sanders et al., 1985, Samoucha & Gisi, 1987, Pijls & Shaw,
1997, Koller & Wilcox, 1999, Hollomon et al., 2002, Mavroidis & Shaw, 2002, Kuck &
Mehl, 2004, Genet et al., 2006, Mavroeidi & Shaw, 2006, Thygesen et al., 2009, Perron et al.,
2012) and modelling (Kable & Jeffery, 1980, Skylakakis, 1981, Levy et al., 1983, Kosman &
Cohen, 1996, Birch & Shaw, 1997, Paveley et al., 2003, Shaw, 2007, Hobbelen et al., 2011b,
Hobbelen et al., 2013, Mikaberidze et al., 2014) work has been done on the effects of
mixtures on selection for resistance. Most of these publications consider mixtures with
different modes–of-action, as the manufacturers recommend, and after a review of the
literature van den Bosch et al. (2014) conclude that adding a mixing partner (low-risk)
reduces selection for resistance to the high-risk component. However, some of the most
popular and effective anti-fungal products for STB control in Ireland are azole mixtures
which combine epoxiconazole and metconazole, prothioconazole and tebuconazole, and
difenconazole and tebuconazole. The differential selection (where one fungicide is seen to
select for a specific strain, and a different fungicide selects against the same strain) observed
in azoles (Fraaije et al., 2007, Leroux et al., 2007) suggests that combinations of active
ingredients from this group may be used without the expected detrimental effects of over-
using fungicides with the same mode-of-action. Even so, these are mixtures of fungicides
which have a similar risk of resistance development, and on which little research has been
carried out (van den Bosch et al., 2014b).
Compared to the body of work on mixtures, less has been done on the effects of
alternations (sequential application of fungicides) on the selection for resistant Z. tritici
strains, and the research has been more theoretical (Kable & Jeffery, 1980, Birch & Shaw,
1997, Hobbelen et al., 2013) than empirical (Sanders et al., 1985, Bolton & Smith, 1988).
The review by van den Bosch et al. (2014) discussed two possible scenarios for alternating
fungicides. First, maintaining the basic fungicide program which uses an effective (and

15
probably high-risk of resistance) fungicide, but with the addition of a different mode-of-action
between those applications. They conclude that this tactic did not alter selection, probably
because the number of applications of the high-risk fungicide was not reduced. The second
alternation scenario involves the replacement of one application of the high-risk fungicides
with a different mode-of-action, i.e. reducing the number of applications of an individual a.i.
and so reducing exposure time to that fungicide, which in turn reduces selection (van den
Bosch et al., 2014). Similar to mixtures, when alternations have been studied, fungicides with
different modes-of-action were mostly considered (van den Bosch et al., 2014). In the
theoretical work that compares mixtures to alternations, it is clear that the difference between
the two can depend on many factors, such as: initial frequency of resistant strains or the
presence of fitness costs in resistant strains (Hobbelen et al., 2013); spray coverage (Kable &
Jeffery, 1980); dose used and whether two pesticides are suitable for mixing (Birch & Shaw,
1997). Even so, van den Bosch et al. (2014) conclude that mixtures are often the best
strategy, but decisions should be made on a case-by-case basis.
Manufacturers’ recommended dose rates presumably aim to keep the pathogen
population to a minimum, which should decrease the chances of resistant mutations occurring
(Zhan & McDonald, 2004). Conversely, large populations make it difficult for a mutant to
build up to any damaging level, in the presence of so many sensitive types (van den Berg et
al., 2013). An alternative theory, reviewed by Shaw (2009), is that if no fungicide is applied
there can be no selection, so if less fungicide is present, there will be less selection. When
considering fungicide dose as an anti-resistance tactic, there are multiple options (van den
Bosch et al., 2014): (i) Using split applications: where the same overall amount of fungicide
is applied but over an increased number of applications; using this tactic, exposure time is
increased and hence, selection increased; (ii) Manipulating the dose of mixture components:
in this scenario, the dose of the high-risk fungicide is reduced relative to the dose of the low-

16
risk fungicide. This reduces the rate of increase of both resistant and sensitive strains, and so
reduces the selection coefficient (van den Bosch et al., 2014). However, when two high-risk
fungicides are mixed, both of which select for resistant strains, this tactic may not have the
same effect and is likely to lead to stronger selection for the fungicide kept at the full dose
(Shaw, 1993); (iii) Reduce the overall amount of fungicide but apply it over the same number
of application times: this decreases the fitness difference between the resistant and sensitive
strains, which in turn reduces selection (van den Bosch et al., 2014). This tactic goes against
the general manufacturers’ recommendation to only use at recommended dose rate.
Considerable experimental, theoretical and review studies have been carried out on the subject
of dose (Sanders et al., 1985, Shaw, 1989, Zziwa & Burnett, 1994, Burnett & Zziwa, 1997,
Metcalfe & Shaw, 1998, Koller & Wilcox, 1999, Metcalfe et al., 2000, Shaw, 2000,
Mavroidis & Shaw, 2002, Genet et al., 2006, Mavroeidi & Shaw, 2006, Shaw, 2007, Shaw,
2009, Gressel, 2010, Van den Bosch et al., 2011, Van den Berg et al., 2013, van den Bosch et
al., 2014), many of which suggest that reducing rates can be an effective anti-resistance tactic.
However, Van den Bosch et al. (2011) hypothesise that in the case of step-wise resistance
development, it may be feasible that high doses reduce selection, but in practice it is unlikely
and currently there is no experimental evidence to support this theory (van den Bosch et al.,
2014).
1.6 Aims and objectives of this Ph.D.
Winter wheat yields are vulnerable to economically important scale of losses due to diseases.
In general, crop losses can be reduced by adopting an integrated approach to crop
management, including good cultivation practices, utilising available host resistance and
where necessary, using available chemical control methods. For growers of winter wheat in
Ireland and the other wheat growing regions in northern Europe, after tillage and nutrient
management, controlling STB is often the main focus of crop management. While control of

17
STB is dependent upon chemical means, unfortunately fungicides are not the panacea they
once were expected to be and loss of available active ingredients, either through resistance or
regulation, is a real threat to control and crop losses. A reduction in field efficacy of azoles
has already been seen. Further reductions in efficacy or direct removal of azoles from the
market would expose the SDHIs to an increased risk of resistance development (Jess et al.,
2014), which could eventually lead to the loss of all available fungicides for STB control.
Hence, protection of these active ingredients now is of paramount importance to future winter
wheat production in Ireland and Europe.
The overall aim of this project was to examine the effects of combining fungicides on
the selection for resistance in Z. tritici populations, which in turn will contribute to future
decision making processes regarding control of STB. In order to reach this goal, the
following three chapters worked on accomplishing specific objectives:
Chapter 2: To clarify how resistance management tactics, in this case mixtures, alternations
and reduced recommended dose rates of azoles, affect the selection for resistant phenotypes
for each fungicide component, in addition to their effect on disease control and yield.
Chapter 3: To elucidate the target gene changes brought about by the application of azoles
and combinations of azoles. In addition, an evolutionary history of the azole treated
population was proposed, and can be used to predict what will happen with populations in the
future.
Chapter 4: To clarify how resistance management tactics, in this case mixtures and reduced
recommended dose rates of two different modes-of-action, an azole and an SDHI, affect the
selection for resistant phenotypes for each fungicide component, as well as their effect on
disease control and yield. In addition, this chapter also studied the baseline sensitivity of new
SDHI active ingredients.

18
Chapter 2: Effect of azole fungicide mixtures, alternations and reduced
dose rates on azole sensitivity in the wheat pathogen Zymoseptoria tritici
2.1 Introduction
Control of STB is currently largely reliant on the timely application of fungicides.
Unfortunately the development and widespread occurrence of resistance to the quinone
outside inhibitor (QoI) and methyl benzimidazole carbamate (MBC) classes of fungicides in
European Z. tritici populations has reduced the number of effective groups of fungicides
available for STB control (Fraaije et al., 2005) to the multi-sites, the DMIs and the SDHIs.
The development of insensitivity in Z. tritici to these remaining chemistries poses a threat to
the future control of STB in Europe.
Since their introduction, prior to the introduction of the QoIs and subsequent to the
development of resistance to the QoIs, the azoles (the largest group within the DMIs) have
been the backbone of STB control in winter wheat (Fraaije et al., 2007). All azoles have the
same mode-of-action: they target the cytochrome P450 enzyme, specifically eburicol 14α-
demethylase (coded for by CYP51) (Yoshida & Aoyama, 1987), and work by preventing the
biosynthesis of ergosterol, which is required for functioning fungal cell membranes (Bean et
al., 2009). For more than a decade, a progressive reduction in sensitivity to azoles has been
observed in European Z. tritici populations (Stammler & Semar, 2011). This reduction in
sensitivity has been attributed to a number of different mechanisms including amino-acid
alterations in the target site (14α-demethylase or CYP51), overexpression of the target site,
and perhaps, increased efflux of the fungicides (Cools & Fraaije, 2013). Since the early
1990s, alterations in the CYP51 gene have been identified, many of which had only slight
effects on sensitivity to the majority of azoles (Cools & Fraaije, 2013). However, these early
alterations may have, over the past 10-15 years, facilitated the emergence of alterations which
affect the binding of specific azoles, leading to a reduction in sensitivity (Mullins et al.,
19
2011). Many of these changes can alter the sensitivity to specific azoles differently, as
highlighted by Fraaije et al. (2007). For example, the now common I381V mutation is
strongly selected by both tebuconazole and metconazole but the same mutation is selected
against by the imidazole, prochloraz. The mutation V136A, however, makes Z. tritici more
sensitive to tebuconazole but less sensitive to prochloraz (Fraaije et al., 2007). Since 2008,
strains of Z. tritici with reduced sensitivity to epoxiconzole and prothioconazole have become
common in Ireland, but as these strains have predominantly had the CYP51 alterations V136A
and S524T (Stammler & Semar, 2011) they have maintained their sensitivity to metconazole
and tebuconazole (O'Sullivan & Kildea, 2010). This apparent lack of complete cross-
resistance suggests that using multiple azoles in combination, either as mixtures or
sequentially, may provide a means of reducing selection for less sensitive strains while
maintaining disease control (Cools & Fraaije, 2013).
Using combinations of fungicides with the intention of slowing down the selection for
resistance usually include fungicides with different modes-of-action. However, due to the
commercial preference for fungicide products with activity against multiple fungal targets,
combining azoles has become increasingly common in fungicide programmes on winter
wheat. Unfortunately, not much is known about how such combinations alter the evolution of
Z. tritici sensitivity. Most of the few sources of empirical data available for azole mixtures
measured only STB control (Kendall & Hollomon, 1994, Kendall et al., 1996, Du Rieu et al.,
1994), rather than the impact on Z. tritici sensitivity. A single report included azole mixtures
(imidazole and triazole fungicides) in the context of resistance management (Fraaije et al.,
2011). It suggested that using combinations of azoles which differentially select specific
CYP51 alterations can lead to a reduction of mutations, but it depends on the components of
the combination. Similarly, there is very little empirical information available on how
alternations of azoles affect selection for reduced sensitivity. Hobbelen et al. (2013) reviewed

20
models which study the effects of mixtures and alternations as anti-resistance strategies and
found that most were designed to study combinations of low- and high-risk fungicides. None
of these models discussed in depth the mixing or alternation of fungicides which target the
same site.
In addition to mixing and alternating fungicides, the reduction of fungicide dose has
been suggested as an anti-resistance strategy (Birch & Shaw, 1997, Burnett & Zziwa, 1997,
Genet et al., 2006, Mavroeidi & Shaw, 2005, Mavroeidi & Shaw, 2006, Metcalfe et al., 2000,
Pijls & Shaw, 1997, Shaw, 2000, Shaw, 2007, Shaw, 2009, Van den Bosch et al., 2011,
Zziwa & Burnett, 1994), particularly in the selection phase. However, where strains with
reduced sensitivity are present in a large proportion of the population, reducing the
recommended dose per application is likely to lead to a reduction in disease control,
potentially making such a strategy impractical (Hobbelen et al., 2011b).
The aim of the work reported here was to test the following hypotheses. Firstly, that
combinations of azoles, either in mixtures or alternated at different application timings, will
slow the rate at which strains with reduced sensitivity to either fungicide is selected in field
populations of Z. tritici. Secondly, that reduced doses at each application reduce selection for
less sensitive strains. To test these hypotheses, field trials using commercially available
products, in high disease pressure environments were combined with sensitivity testing of Z.
tritici isolates sampled pre- and post-fungicide application. The products used are widely
employed in Ireland, Europe and elsewhere, and are of great commercial relevance.
2.2 Materials and methods
Field trials were conducted during 2010-11 and 2011-12 at six locations throughout Ireland
(Table 2.1). Experimental plots were situated in commercial fields, and aside from fungicide
treatments all experimental plots were treated as the rest of the commercial crop. All trials

21
were laid out as complete randomised block designs with four replicate blocks, each
containing 10 fungicide treatments and an un-treated control. Plots were 2.5m × 10m with a
30-40cm path between plots. Zymoseptoria tritici was allowed to develop naturally in each
trial. Experimental treatments consisted of two foliar fungicide applications (referred to as T1
at GS 32-37 and T2 at GS 39-53 depending on location (Zadoks et al., 1974) of the triazoles
epoxiconazole (Opus®, BASF) and metconazole (Caramba®, BASF) as solo products, in
alternation with one another at the different timings or as a mixture of both (Gleam®, BASF),
and all of the above at full and half the recommended dose (see Table 2.2 for further details).
All fungicides were applied in 200 L/ha water using a knapsack sprayer with compressed air.
2.2.1 Disease and yield assessments
Disease was assessed at GS 69-73 on the flag leaf of ten main tillers chosen at random,
approximately equidistant apart in each plot. The percentage leaf area with STB was visually
estimated. Plots were harvested each year using a specially adapted combine harvester. The
grain from each plot was weighed and the moisture content determined in a representative
sample from each plot. Yields were then calculated as t/ha at 15% moisture.
2.2.2 Sampling Zymoseptoria tritici
To determine the distribution of fungicide sensitivity in the Z. tritici population prior to
spraying, each location was sampled. In 2011 approximately 100 diseased leaves and in 2012
approximately 50 diseased leaves were collected from each of the trial site locations, sampled
uniformly from across the whole site. At the second sampling time (six weeks post T2
fungicide application), approximately 40 diseased flag leaves were collected, without regard
to actual amount of disease, at roughly equal distances apart within each plot and avoiding
ends and edges of plots. At the Stamullen and Knockbeg locations in 2011, disease levels
were too low six weeks after T2 so sampling was conducted eight weeks after the T2
fungicide application. At these two locations, disease levels were still low after eight weeks

22
and diseased leaves were actively sought. The diseased leaves from each plot were air dried
for five days at room temperature and then stored at -20 °C awaiting pathogen isolation.
2.2.3 Isolating Zymoseptoria tritici
Isolations were carried out according to Kildea (2009). Briefly, diseased leaves (cut to fit
four in a ten cm petri dish) were washed in running tap water for two hours before being
surface sterilised (immersed in 70% ethanol for 20 seconds, 10% sodium hypochlorite for two
minutes and triple rinsed with sterile distilled water). The leaves were subsequently dried
using tissue paper and placed, exposed pycnidia facing upwards, on water agar, then
incubated in the dark at 18 °C for 24-48 hours to promote sporulation. Following incubation,
a single cirrus from each leaf was picked using a fine sterile needle and streaked onto potato
glucose agar (PGA) (Sigma-Aldrich, St. Louis, MO, USA) amended with 50 mg L-1
chloramphenicol and 50 mg L-1 streptomycin. Petri dishes were sealed and incubated in the
dark at 18 °C for 4-6 days. Isolates were sub-cultured onto antibiotic amended PGA (as
above), sealed and incubated at 18° for a further three days. Pure cultures were scraped from
the plates and individually stored in 30% glycerol at -80 °C until further use.
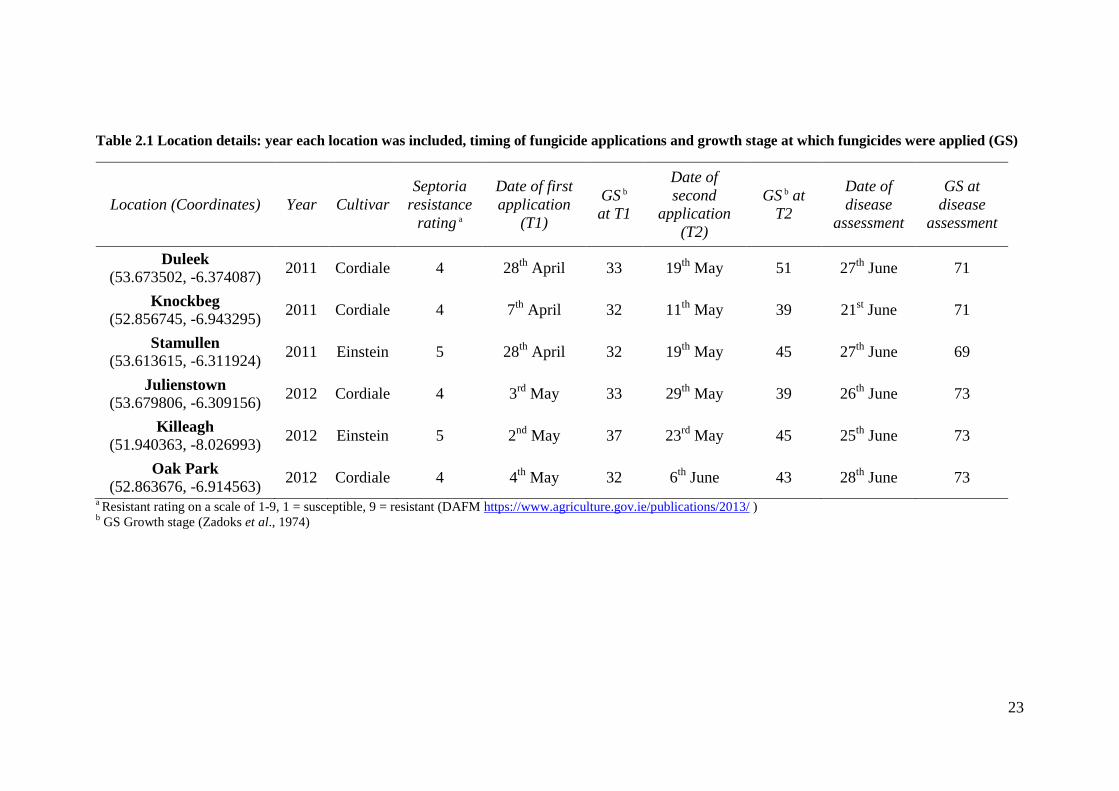
23
Table 2.1 Location details: year each location was included, timing of fungicide applications and growth stage at which fungicides were applied (GS)
Location (Coordinates) Year CultivarSeptoria
resistancerating a
Date of firstapplication
(T1)
GS b
at T1
Date ofsecond
application(T2)
GS b atT2
Date ofdisease
assessment
GS atdisease
assessment
Duleek(53.673502, -6.374087)
2011 Cordiale 4 28th April 33 19th May 51 27th June 71
Knockbeg(52.856745, -6.943295)
2011 Cordiale 4 7th April 32 11th May 39 21st June 71
Stamullen(53.613615, -6.311924)
2011 Einstein 5 28th April 32 19th May 45 27th June 69
Julienstown(53.679806, -6.309156)
2012 Cordiale 4 3rd May 33 29th May 39 26th June 73
Killeagh(51.940363, -8.026993)
2012 Einstein 5 2nd May 37 23rd May 45 25th June 73
Oak Park(52.863676, -6.914563)
2012 Cordiale 4 4th May 32 6th June 43 28th June 73
a Resistant rating on a scale of 1-9, 1 = susceptible, 9 = resistant (DAFM https://www.agriculture.gov.ie/publications/2013/ )b GS Growth stage (Zadoks et al., 1974)

24
Table 2.2 Treatments used: application pattern, dose rates applied, fungicides used and actual amount of active ingredient (a.i.) at each treatmenttime
Applicationpattern
Treatmentname a Dose b
Active ingredient (a.i) applied Litres/ha applied at T1 & T2(total a.i. applied) d
T1 c T2 c
Un-Treated Un-T 0 None None N/A (0 g)
Solo EE 1 Epoxiconazole Epoxiconazole 1.5 (249 g)
MM 1 Metconazole Metconazole 1.5 (180 g)
ee 0.5 Epoxiconazole Epoxiconazole 0.75 (124.5 g)
mm 0.5 Metconazole Metconazole 0.75 (90 g)
Alternation EM 1 Epoxiconazole Metconazole 1.5 (214 g)
ME 1 Metconazole Epoxiconazole 1.5 (214g)
em 0.5 Epoxiconazole Metconazole 0.75 (107 g)
me 0.5 Metconazole Epoxiconazole 0.75 (107 g)
Mixture EMEM 1Epoxiconazole& metconazole
Epoxiconazole& metconazole
3 (390 g)
emem 0.5Epoxiconazole& metconazole
Epoxiconazole& metconazole
1.5 (195 g)
a Abbreviations denote the first and second sprays. Un-T= un-treated control; E or e: epoxiconazole; M or m: metconazole; uppercase: full dose; lowercase: half doseb Application dose at Treatment 1 and Treatment 2; 1 = the full label recommended dose, 0.5 = half the label recommended dosec Epoxiconazole = Opus Max, Metconazole = Caramba, Epoxiconazole + Metconazole = Gleam. All fungicides are BASF productsd Active ingredient (a.i.) per litre of product; Opus max: 83 g/l; Caramba: 60 g/l; Gleam: 37.5 g/l epoxiconazole + 27.5 g/l metconazole

25
2.2.4 In vitro sensitivity testing
The sensitivity of all isolates to epoxiconazole and metconazole was determined using a
microtitre plate assay as described by Kildea (2009). Technical grade epoxiconazole and
metconazole (purchased from Sigma-Aldrich) were dissolved in 100% methanol and added to
Potato Dextrose Broth (PDB) (Sigma-Aldrich Co.) to give final test concentrations of 30, 10,
3.3, 1.1, 0.37, 0.123, 0.04, and 0 mg L-1of which 150 µl were added to wells of flat bottomed
sterile 96-well microtitre plates (Sarsted AG & Co., Germany). Inoculum of each isolate was
produced by spotting 30 µl of the pure culture stock solutions described in 2.2.3 on PGA and
incubated for three days at 18 °C. Test suspensions were made in PDB and adjusted to a final
concentration of 1x10⁵ spores/ml, of which 50 µl was added to the wells of the microplates
containing the different fungicide concentrations. Each plate consisted of a negative control
(PDB only), a positive control (isolate 4465, of Irish origin and kindly supplied by BASF) and
10 experimental isolates. In some exceptional cases, isolate 4465 did not produce sufficient
spores to allow for the inclusion of a positive control in all test plates. All plates were tested
in replicate at the same time, sealed with parafilm, stored in sealable bags to reduce
condensation and incubated in the dark at 18 °C for 7 days. Due to the large number of
isolates in the whole experiment, isolates from the same plot, replicate, location or treatment
were not necessarily tested on the same date. Fungal growth was assessed as a measure of
light absorbance at 405 nm using Synergy-HT plate reader and Gen5™ microplate software
(BioTek Instruments, Inc., USA).
2.2.5 Data analysis
The fungicide dose reducing growth in the microplate wells by 50% (EC50), estimated by
optical density, was determined by fitting a logistic curve to percentage inhibition data
generated from the optical density measurements for each isolate using the computer program
XLfit (IDBS Inc., UK). Where a plate had a reference isolate, EC50 values from that plate

26
were adjusted for differences in the reference isolate between plates, according to Mavroeidi
and Shaw (2005). The subsequent analysis was weighted to allow for the increased variance
of observations from plates where the EC50 of the reference isolate could not be measured.
Observations from plates with a successful reference isolate measurement were given a
weight of 1 and a value of 1-(variance within the standards/variance in isolates from plates
with standards) given otherwise. All statistical analyses were carried out in GenStat 14th
Edition (VSN International Ltd. United Kingdom). Differences between plate replicates were
analysed using ANOVA.
As the numbers of isolates with successfully measured EC50 values varied between
plots, the data were not balanced. Differences in EC50 values between treatments were
therefore analysed and means constructed using Restricted Maximum Likelihood (REML).
Data from the early sampling time (Pre-T) were analysed using REML, whilst data from the
later sampling time were analysed using REML with contrasts (Crawley, 2005), using the
FCONTRASTS procedure. In the model, treatment (11 levels) was considered a fixed effect,
whilst location (six levels) and rep (four levels) and location.treatment were considered
random effects. Contrasts were estimated separately for epoxiconazole and metconazole
sensitivity. Principal Component Analysis (PCA) was used to determine the common effects
of using epoxiconazole and metconazole on overall sensitivity, and to look at how selection
by epoxiconazole and metconazole affected specific resistance to each fungicide. Sensitivity
data were subjected to PCA based on sums of squares and products. Principal component
scores, PC1 and PC2, were analysed using REML with contrasts.
Disease severity data were square root (sqrt) transformed and differences between
treatments were analysed using ANOVA with a factorial plus control procedure. Disease
severity data were correlated with the sensitivity data using general linear regression
including differences in sensitivity between locations as a factor. Differences in yield were

27
analysed using ANOVA with a factorial plus control procedure and the relationship between
yield and disease control was estimated using general linear regression including location
differences.
2.3 Results
The sensitivity of 3703 single pycnidial Z. tritici isolates were determined. Of these, all were
tested for sensitivity to epoxiconazole, but due to contamination in some plates, only 3683
isolates were tested for sensitivity to metconazole. Sensitivity data were not determined for
the half-dose alternation treatments in 2011-12. There was no statistical difference (P = 0.9)
between replicate plate measurements of each isolate and therefore mean EC50 values for each
isolate were used in the subsequent analysis. The mean sensitivity of Z. tritici isolates to
epoxiconazole and metconazole varied with treatment (Table 2.3a & Table 2.3b).
2.3.1 Variability before fungicide applications
Isolates from the population prior to fungicide applications (Pre-T) ranged in sensitivity to
epoxiconazole from a log10EC50 (mg L-1) of -2.38 to 0.51 (a variation factor of 776), and to
metconazole from a log10EC50 (mg L-1) of -2.38 to 1.35 (a variation factor of 5370) (Figure
2.1). At this sampling time epoxiconazole sensitivity was similar at all locations (Figure 2.1,
P = 0.15), but metconazole sensitivity differed between locations (Figure 2.1, P < 0.001).

28
Table 2.3 Mean sensitivity (log10EC50 mg L-1) of isolates from individual treatments, including pre-treatment, over all locations to (a) epoxiconazoleand (b) metconazole, and broken down into treatment means per location
a Epoxiconazole sensitivity (log10EC50 mg L-1)
Experiment average Individual location
Treatmenta n Mean SEDuleek
(n = 770)Julienstown
(n = 449)Killeagh(n = 502)
Knockbeg(n = 710)
Oak Park(n = 490)
Stamullen(n =7 82)
Pre-T 176 -0.479 0.0711 -0.457 -0.427 -0.480 -0.641 -0.449 -0.403
Un-T 357 -0.377 0.0687 -0.438 -0.355 -0.344 -0.464 -0.330 -0.328
EE 391 -0.042 0.0685 -0.112 0.141 -0.012 -0.135 -0.114 -0.014
MM 388 -0.209 0.0686 -0.151 0.001 -0.292 -0.393 -0.347 -0.079
ee 325 -0.131 0.0691 -0.258 -0.055 0.031 -0.369 -0.218 0.079
mm 356 -0.292 0.0688 -0.274 -0.199 -0.283 -0.536 -0.269 -0.195
EM 379 -0.173 0.0687 -0.235 0.077 -0.368 -0.258 -0.266 0.006
ME 371 -0.054 0.0687 -0.058 0.140 0.038 -0.313 -0.302 0.162
em 168 -0.167 0.0832 -0.191 * * -0.404 * 0.030
me 172 -0.111 0.0825 -0.011 * * -0.435 * 0.039
EMEM 313 -0.034 0.0694 0.081 0.370 -0.189 -0.342 -0.133 -0.012
emem 307 -0.044 0.0692 0.142 0.217 -0.181 -0.321 -0.054 -0.090

29
Table 2.3 contd.
b Metconazole sensitivity (log10EC50 mg L-1)
Experiment average Individual location
Treatmenta n Mean SEDuleek
(n = 762)Julienstown
(n = 448)Killeagh(n = 503)
Knockbeg(n = 708)
Oak Park(n = 489)
Stamullen(n = 773)
Pre-T 176 -0.780 0.0606 -0.893 -0.713 -0.505 -0.957 -0.865 -0.728
Un-T 350 -0.765 0.0583 -0.902 -0.918 -0.837 -0.730 -0.525 -0.678
EE 389 -0.650 0.0581 -0.694 -0.725 -0.672 -0.717 -0.653 -0.449
MM 388 -0.507 0.0582 -0.635 -0.502 -0.568 -0.540 -0.509 -0.293
ee 325 -0.673 0.0586 -0.856 -0.864 -0.679 -0.733 -0.508 -0.406
mm 356 -0.533 0.0583 -0.631 -0.679 -0.385 -0.649 -0.423 -0.437
EM 379 -0.507 0.0582 -0.690 -0.357 -0.595 -0.615 -0.368 -0.406
ME 366 -0.591 0.0584 -0.654 -0.514 -0.565 -0.666 -0.706 -0.444
em 166 -0.641 0.0766 -0.823 * * -0.821 * -0.289
me 170 -0.570 0.0758 -0.609 * * -0.734 * -0.403
EMEM 312 -0.453 0.059 -0.419 -0.187 -0.508 -0.619 -0.614 -0.378
emem 306 -0.505 0.0587 -0.499 -0.390 -0.525 -0.642 -0.529 -0.452aTreatment information in Table 2.2. Briefly, Pre-T=pre-treatment sample, Un-T= un-treated control, abbreviations denote the first and second sprays; E or e: epoxiconazole;
M or m: metconazole; uppercase: full dose; lowercase: half dosen = number of isolates per group

30
Figure 2.1 Frequency distribution of log10EC50 values for epoxiconazole sensitivity (top) andmetconazole sensitivity (bottom) from Pre-T collections of Zymoseptoria tritici sampled fromeach of the six locations, illustrated with box and whisker plots. The line through the boxrepresents the median. Number of Pre-T isolates tested from each location; Duleek n = 33;Julienstown n = 29; Killeagh n = 20; Knockbeg n = 25; Oak Park n = 21; Stamullen n = 48

31
2.3.2 Main contrasts
Specific differences between the effects of particular treatment patterns at individual locations
and years of observation would not be relevant to the choice of overall resistance strategy, so
main effect contrasts are reported, using location and location interactions as random factors
in the mixed effect REML model. Zymoseptoria tritici treated in any way with either of the
fungicides became less sensitive to both epoxiconazole and metconazole than Z. tritici from
the un-treated plots (P < 0.001 and P < 0.001 respectively, Table 2.4a and Table 2.4b, contrast
1) with large reductions in sensitivity at some locations, for example at Duleek, Julienstown
and Killeagh, there was a two to four-fold decrease in sensitivity to epoxiconazole but at
Stamullen, a 44-fold decrease was observed (Table 2.3a). All treatments containing
epoxiconazole saw a larger shift in sensitivity than those treatments without (P < 0.001, Table
2.4a, contrast 2). The same was seen for metconazole sensitivity, where all treatments
containing metconazole measured a larger shift in sensitivity than treatments without
metconazole (P = 0.002, Table 2.4b, contrast 2). There was no significant difference between
the effect of the mixture and the solo epoxiconazole on epoxiconazole sensitivity (P = 0.3,
Table 2.4a, contrast 3) or between the effect of the mixture and the solo metconazole on
metconazole sensitivity (P = 0.42, Table 2.4b, contrast 3). Zymoseptoria tritici isolates from
treatments which received two applications of epoxiconazole were less sensitive than those
that received only one, although the difference was not quite significant (P = 0.09, Table 2.4a,
contrast 4). For metconazole sensitivity, the treatments which applied metconazole twice
caused a significant decrease in sensitivity (P = 0.03, Table 2.4b, contrast 4) compared to the
treatments which applied metconazole only once. The order in which the a.i. was applied in
the alternation had no effect on epoxiconazole sensitivity (P = 0.1, Table 2.4a, contrast 5) or
metconazole sensitivity (P = 0.9, Table 2.4b, contrast 5).

32
Table 2.4 Independent single degree of freedom contrasts between treatments in (a) epoxiconazole and (b) metconazole sensitivity
a Treatment coefficients* included in each contrast question
ContrastContrast
sizesP a Un-T b EE MM ee mm EM ME em me EMEM emem
1. Effect of fungicide 0.023 <0.001 -10 1 1 1 1 1 1 1 1 1 1
2. Treatments with any epoxiconazolecf. those without
0.031 <0.001 0 1 -4 1 -4 1 1 1 1 1 1
3. Mixture cf epoxiconazole solo -0.024 0.3 0 1 0 1 0 0 0 0 0 -1 -1
4. Treatments with two applications ofepoxiconazole cf. those with one
0.0322 0.09 0 1 0 1 0 -1 -1 -1 -1 1 1
5. Order of application of a.i. inalternation
-0.043 0.1 0 0 0 0 0 1 -1 1 -1 0 0
6. Effect of dose 0.023 0.2 0 1 1 -1 -1 1 1 -1 -1 1 -1
7. Dose interaction with contrast 2 -0.004 0.5 0 1 -4 -1 4 1 1 -1 -1 1 -1
8. Dose interaction with contrast 3 0.02 0.4 0 1 0 -1 0 0 0 0 0 -1 1
9. Dose interaction with contrast 4 0.006 0.8 0 1 0 -1 0 -1 -1 1 1 1 -1
10. Dose interaction with contrast 5 -0.16 0.6 0 0 0 0 0 1 -1 -1 1 0 0

33
Table 2.4 cont.
b Treatment coefficients* included in each contrast question
ContrastContrast
sizesP a Un-T b EE MM ee mm EM ME em me EMEM emem
1. Effect of fungicide 0.018 <0.001 -10 1 1 1 1 1 1 1 1 1 1
2. Treatments with any metconazolecf. those without
0.025 0.002 0 -4 1 -4 1 1 1 1 1 1 1
3. Mixture cf metconazole solo -0.019 0.4 0 0 1 0 1 0 0 0 0 -1 -1
4. Treatments with two applicationsof metconazole cf. those with one
0.042 0.03 0 0 1 0 1 -1 -1 -1 -1 1 1
5. Order of application of a.i. inalternation
0.003 0.9 0 0 0 0 0 1 -1 1 -1 0 0
6. Effect of dose 0.022 0.2 0 1 1 -1 -1 1 1 -1 -1 1 -1
7. Dose interaction with contrast 2 0.002 0.7 0 -4 1 4 -1 1 1 -1 -1 1 -1
9. Dose interaction with contrast 3 -0.008 0.7 0 0 1 0 -1 0 0 0 0 -1 1
8. Dose interaction with contrast 4 -0.007 0.7 0 0 1 0 -1 -1 -1 1 1 1 -1
10. Dose interaction with contrast 5 0.041 0.2 0 0 0 0 0 1 -1 -1 1 0 0a P-value is based on the F-distributionb Treatment information in Table 2.2. Briefly, Un-T= un-treated control, abbreviations denote the first and second sprays; E or e: epoxiconazole; M or m: metconazole;uppercase: full dose; lowercase: half dose-*Each coefficient denotes the weight by which a mean value was multiplied to calculate the contrast

34
Epoxiconazole sensitivity did not differ between locations (P = 0.15) whereas metconazole
sensitivity did (P < 0.001). Even though a larger shift in sensitivity to both fungicides was
observed after full doses, (ns, P = 0.12, Table 2.3) averaged over all treatments the difference
between half doses and full doses was not significant for either epoxiconazole or metconazole
sensitivity (P = 0.2 and P = 0.2 respectively, Table 2.4a & Table 2.4b, contrast 6).
Interactions between dose and contrasts 2-5 were all non-significant (Table 2.4a & Table
2.4b, contrasts 7, 8, 9 and 10).
2.3.3 Principal components analysis
The first principal component (PC1: a measure of common sensitivity to both epoxiconazole
and metconazole) accounted for 75% of the total variation amongst the isolates (Figure 2.2).
The loadings for each variable were almost equal, meaning both epoxiconazole and
metconazole sensitivity made an almost equal contribution to the variation between isolates.
PC1 differed significantly between the un-treated and treated plots (P < 0.001, Table 2.5,
contrast 1) and between the solo products and the mixture (P = 0.002, Table 2.5, contrast 3).
No other contrasts were significant. The second principal component (PC2: a measure of the
distinction between epoxiconazole and metconazole sensitivity) accounted for the remaining
25% of total variation (Figure 2.2). PC2 differed between the solo active ingredients (P <
0.001, Table 2.6, contrast 2). Also, the order of active ingredients in the alternation
treatments affected selection on PC2 (P = 0.05, Table 2.6, contrast 5) but this effect differed
between doses (P = 0.01, Table 2.6, contrast 10). All other contrasts were non-significant.

35
Figure 2.2 Correlation matrix with principal component axes superimposed. PC1 accounts for75% variation, PC2 accounts for 25% variation
PC2
PC1

36
Table 2.5 Independent single degree of freedom contrasts between treatments with common azole sensitivity (PC1 in a principal componenttransformation of the data)
Treatment coefficients* included in each contrast question
ContrastContrast
sizesP a Un-T b EE MM ee mm EM ME em me EMEM emem
1. Effect of fungicide 0.029 <0.001 -10 1 1 1 1 1 1 1 1 1 1
2. Epoxiconazole solo cf.metconazole solo
0.014 0.6 0 1 -1 1 -1 0 0 0 0 0 0
3. Mixture cf. solo fungicides 0.057 0.002 0 1 1 1 1 0 0 0 0 -2 -2
4. Treatments with two applicationsof an azole cf. those with one
0.006 0.8 0 1 1 1 1 -1.5 -1.5 -1.5 -1.5 1 1
5. Order of application of a.i. inalternation
0.035 0.3 0 0 0 0 0 1 -1 1 -1 0 0
6. Effect of dose 0.033 0.12 0 1 1 -1 -1 1 1 -1 -1 1 -1
7. Dose interaction with contrast 2 -0.003 0.9 0 -1 1 1 -1 0 0 0 0 0 0
8. Dose interaction with contrast 3 0.006 0.7 0 1 1 -1 -1 0 0 0 0 -2 2
9. Dose interaction with contrast 4 0.001 0.9 0 1 1 -1 -1 -1.5 -1.5 1.5 1.5 1 -1
10. Dose interaction with contrast 5 0.014 0.7 0 0 0 0 0 1 -1 -1 1 0 0a P-value is based on the F-distributionb Treatment information in Table 2.2. Briefly, Un-T= un-treated control, abbreviations denote the first and second sprays; E or e: epoxiconazole; M or m: metconazole;uppercase: full dose; lowercase: half dose*Each coefficient denotes the weight by which a mean value was multiplied to calculate the contrast

37
Table 2.6 Independent single degree of freedom contrasts between treatments in the difference between epoxiconazole and metconazole sensitivity(PC2 in a principal component transformation of the data)
Treatment coefficients* included in each contrast question
ContrastContrast
sizesP a Un-T b EE MM ee Mm EM ME em me EMEM emem
1. Effect of fungicide 0.0005 0.9 -10 1 1 1 1 1 1 1 1 1 1
2. Epoxiconazole solo cf. metconazolesolo
0.107 <0.001 0 1 -1 1 -1 0 0 0 0 0 0
3. Mixture cf. solo fungicides 0.001 0.9 0 1 1 1 1 0 0 0 0 -2 -2
4. Treatments with two applications ofan azole cf. those with one
-0.01 0.2 0 1 1 1 1 -1.5 -1.5 -1.5 -1.5 1 1
5. Order of application of a.i. inalternation
0.034 0.05 0 0 0 0 0 1 -1 1 -1 0 0
6. Effect of dose -0.001 0.9 0 1 1 -1 -1 1 1 -1 -1 1 -1
7. Dose interaction with contrast 2 -0.0002 0.9 0 -1 1 1 -1 0 0 0 0 0 0
9. Dose interaction with contrast 3 0.012 0.1 0 1 1 -1 -1 0 0 0 0 -2 2
8. Dose interaction with contrast 4 0.01 0.2 0 1 1 -1 -1 -1.5 -1.5 1.5 1.5 1 -1
10. Dose interaction with contrast 5 -0.044 0.01 0 0 0 0 0 1 -1 -1 1 0 0a P-value is based on the F-distributionb Treatment information in Table 2.2. Briefly, Un-T= un-treated control, abbreviations denote the first and second sprays; E or e: epoxiconazole; M or m: metconazole;uppercase: full dose; lowercase: half dose*Each coefficient denotes the weight by which a mean value was multiplied to calculate the contrast

38
2.3.4 Disease severity and its relationship with selection
Un-treated control plots had the most disease at all locations (P < 0.001); with an average of
12% (3.46 sqrt %) disease severity on the flag leaf at GS 69-73 (Figure 2.3).
Figure 2.3 Effect of individual treatments on disease severity on the flag leaf at GS 69-73averaged over all six locations. Disease severity refers to the proportion of the flag leaf coveredin Septoria tritici blotch (square root transformed). Each line is used to connect the full and halfdoses of the same application pattern. Treatment information: abbreviations denote the first andsecond sprays. E: epoxiconazole; M: metconazole; UnT: un-treated control
Significant differences in disease severity in the un-treated plots were observed between
locations (P < 0.001); Julienstown had the most disease in un-treated plots, with 25% (4.964
sqrt %) of the flag leaf infected with STB, and Stamullen had the least, with 0.3% (0.510 sqrt
%). Significant differences in disease severity in the treated plots were observed between
locations (P < 0.001, Table 2.7); Stamullen had the least disease after treatment, with 0.05%
(0.22 sqrt %) and Julienstown and Killeagh had the most, both with 3.5% (1.87 sqrt %)
disease on the flag leaf. The full dose treatments generally controlled STB better than their
half dose counterparts, but the effect depended on locations (P = 0.015, Table 2.7). Disease
control differed between treatments (mean of full and half doses of each product) (P < 0.001,
0
0.5
1
1.5
2
2.5
3
3.5
4
No fungicide Half dose Full dose
Dis
eas
ese
veri
ty(s
qrt
(%))
UnT
EE
MM
EM
ME
EMEM

39
Table 2.7); with the mixture providing significantly better disease control (0.78% disease
severity (0.88 sqrt %)) than any of the other treatments (average 2.17% (1.47 sqrt %) disease
severity). There was an inverse relationship between disease severity and EC50 values of
isolates to epoxiconazole and metconazole (Figure 2.4, R2 = 0.48, P <0.001 and Figure 2.4, R2
= 0.60, P <0.001 respectively; common slope but intercepts differing between locations).
Table 2.7 Disease severity at GS 69-73 (measured as average percent STB per surface area of theflag leaf, square root transformed) between treatments at each location. Underneath are theresults of a cross-location analysis using factorial plus control procedure
LocationMean
Treatmenta Duleek Julienstown Killeagh KnockbegOakPark
Stamullen
Un-T 4.71 4.96 4.71 2.46 3.43 0.51 3.46
EE 1.43 1.48 2.00 0.79 1.26 0.23 1.20
ee 2.43 2.97 2.15 1.62 1.69 0.23 1.85
MM 1.18 1.87 1.66 1.30 1.05 0.06 1.19
mm 2.33 2.37 2.60 1.35 1.94 0.40 1.83
EM 1.59 1.02 1.63 1.10 1.33 0.24 1.15
em 1.58 2.55 2.57 1.54 1.65 0.16 1.67
ME 0.74 1.68 1.43 1.35 1.38 0.34 1.15
me 1.32 2.60 2.32 1.89 1.92 0.40 1.74
EMEM 1.29 0.76 0.91 0.44 0.96 0.08 0.74
emem 1.09 1.36 1.31 1.14 1.15 0.11 1.03
Mean 1.79 2.15 2.12 1.36 1.61 0.25 1.55
Factorial plus control P LSD (5% level)
Location < 0.001 0.579
Productb < 0.001 0.276
Ratec < 0.001 0.247
Location.Product 0.11 0.676
Location.Rate 0.015 0.605
Product.Rate 0.5 0.319
Location.Product.Rate 0.47 0.781a
Treatment information in Table 2.2. Briefly, Un-T= un-treated control, abbreviations denote the first andsecond sprays; E or e: epoxiconazole, M or m: metconazole; uppercase: full dose; lowercase: half doseb
Product is full and half rates of each treatment compared; EE+ee, MM+mm, and EMEM+ememc
Full rates cf. half rates; EE+MM+EMEM cf. ee+mm+emem
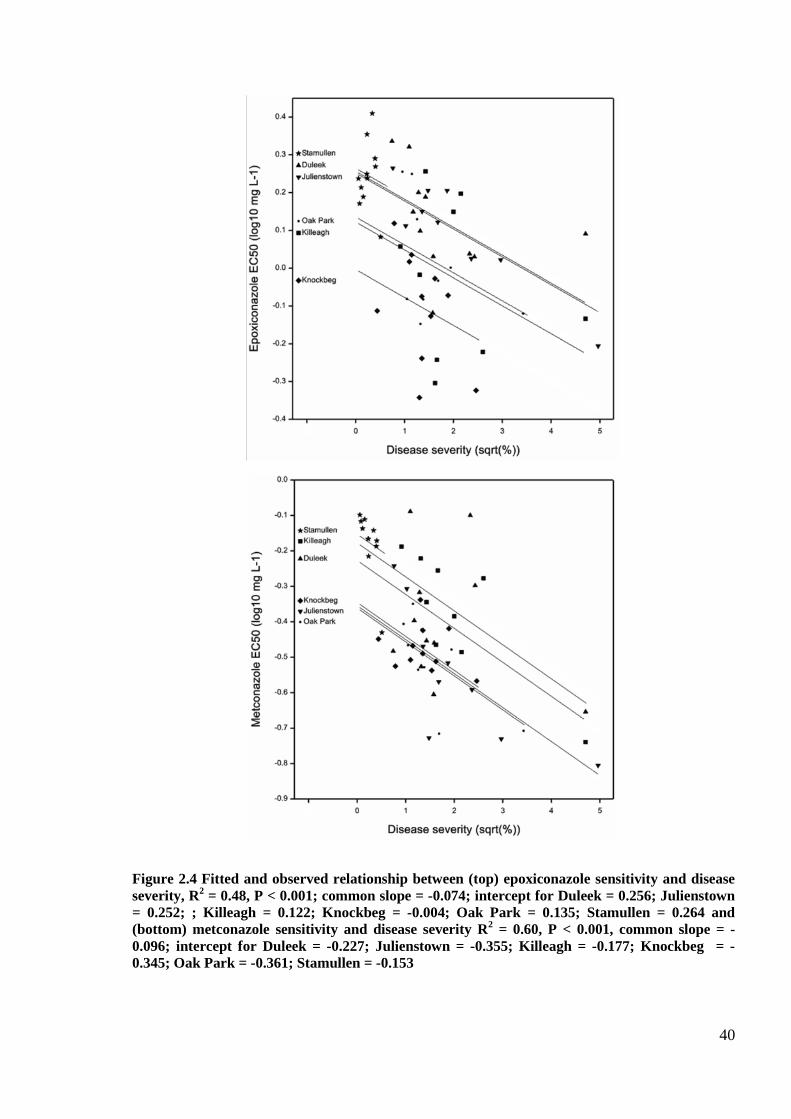
40
Figure 2.4 Fitted and observed relationship between (top) epoxiconazole sensitivity and diseaseseverity, R2 = 0.48, P < 0.001; common slope = -0.074; intercept for Duleek = 0.256; Julienstown= 0.252; ; Killeagh = 0.122; Knockbeg = -0.004; Oak Park = 0.135; Stamullen = 0.264 and(bottom) metconazole sensitivity and disease severity R2 = 0.60, P < 0.001, common slope = -0.096; intercept for Duleek = -0.227; Julienstown = -0.355; Killeagh = -0.177; Knockbeg = -0.345; Oak Park = -0.361; Stamullen = -0.153

41
2.3.5 Effects if fungicides on yield
Un-treated control plots yielded significantly less than treated plots (P < 0.001, Table 2.8).
Yield improvements after fungicide application varied between locations (P < 0.001, Table
2.8). Oak Park, Duleek and Knockbeg each had an improvement of 2 t/ha after fungicide
treatments (mean of all treated plots) whereas Stamullen had the lowest with an improvement
of only 0.1 t/ha, consistent with the low un-treated severity. Averaged over all treatments,
full doses provided significantly higher yield than the half doses, and the half doses were
significantly better than no fungicide (P = 0.001, Table 2.8). No differences in yield were
seen between the two solo a.i.s, the two alternations or the mixture (P = 0.17, Table 2.8).
There was a significant inverse relationship between disease and yield; but both the slope and
intercept of this varied between locations (Figure 2.5, R2 = 0.98, P = 0.014).
Figure 2.5 Fitted and observed relationship between yield and disease severity R2 = 0.98, P =0.014; Duleek: y= 11.49 + -0.-0.617 x; Julienstown: y = 6.62 + -0. 486x; Killeagh: y = 6.13 + -0.28x; Knockbeg: y = 15.4 + -0.814x; Oak Park: y = 8.74 + -1.069x; Stamullen: y = 7.75 + -0.862x

42
Table 2.8 Yield (t/ha) after treatments at each location, with a cross-location analysis usingfactorial plus control procedure
LocationMean
Treatmenta Duleek Julienstown Killeagh Knockbeg Oak Park Stamullen
Un-T 8.52 4.13 4.82 12.42 5.17 7.32 7.07
EE 10.46 5.68 5.97 14.82 7.19 7.8 8.65
ee 10 5.36 4.98 14.83 6.91 7.62 8.28
MM 10.82 5.84 5.7 14.73 7.62 7.44 8.69
mm 10.31 5.28 5.35 13.4 6.74 7.41 8.08
EM 10.62 5.83 4.82 15.32 7.3 7.38 8.54
em 10.27 5.47 6.03 14.3 6.48 7.38 8.32
ME 11.02 5.82 5.24 14.47 7.5 7.55 8.6
me 10.52 5.39 5.44 14.5 6.76 7.21 8.3
EMEM 10.98 6.49 6.41 14.3 8.14 7.27 8.93
emem 10.76 6.03 6.16 14.04 7.42 7.41 8.63
Mean 10.39 5.57 5.54 14.29 7.02 7.44 8.37
Factorial plus control P LSD (5% level)
Location <0.001 0.891
Productb 0.17 0.425
Ratec 0.001 0.38
Location.Product 0.6 1.04
Location.Rate 0.5 0.93
Product.Rate 0.8 0.491
Location.Product.Rate 0.9 1.20aTreatment information in Table 2.2. Briefly, Un-T= un-treated control, abbreviations denote the first and
second sprays; E or e: epoxiconazole; M or m: metconazole; uppercase: full dose; lowercase: half doseb
Full and half rates of each treatment (Product) compared; EE+ee, MM+mm, EM+em, ME+me andEMEM+ememcFull rates cf. half rates; EE+MM+EM+ME+EMEM cf. ee+mm+em+me+emem
2.4 Discussion
To prolong the effective life of fungicides, strategies of use which delay both emergence of
new resistant strains and selection for existing resistant strains, without compromising yield,
are needed. In the experiments here, where STB was the dominant disease, yields achieved
were directly related to the control of disease. Unfortunately, the success of the disease
control was inversely related to the sensitivity of Z. tritici to those fungicides following
treatment. This confirms the findings of Mavroeidi and Shaw (2006) who demonstrated that
when the azole fluquinconazole was applied as a solo product, the greatest selection occurred
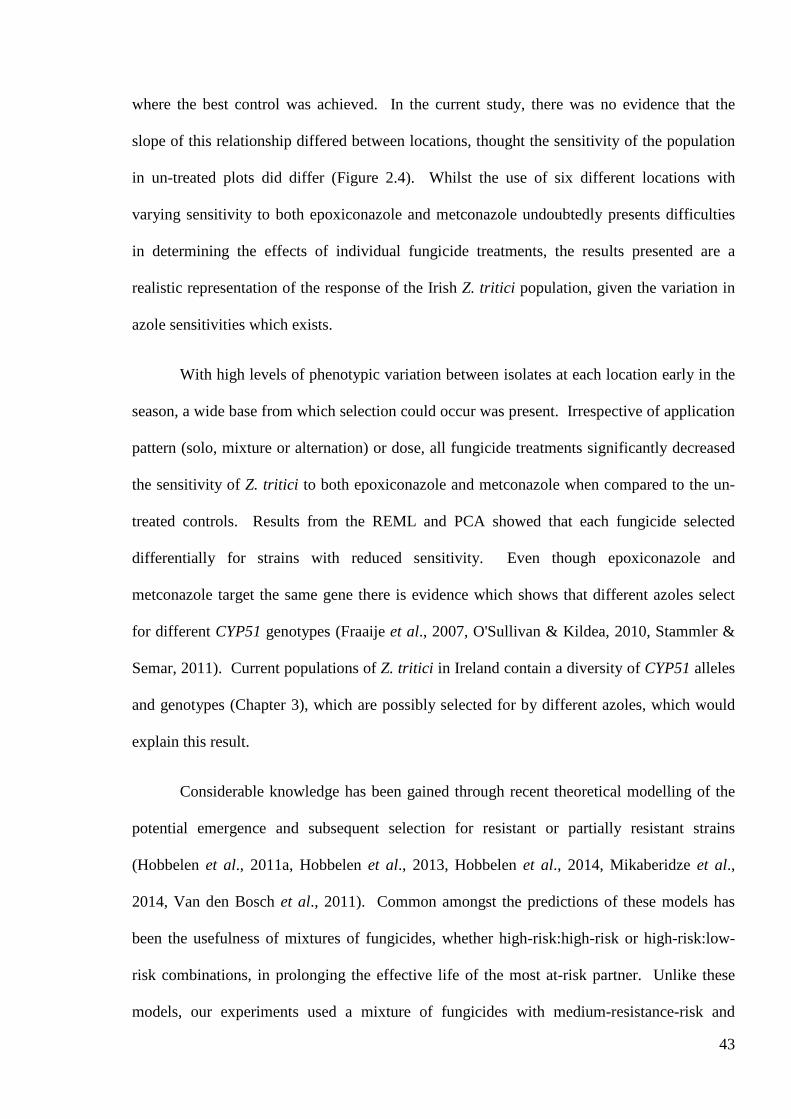
43
where the best control was achieved. In the current study, there was no evidence that the
slope of this relationship differed between locations, thought the sensitivity of the population
in un-treated plots did differ (Figure 2.4). Whilst the use of six different locations with
varying sensitivity to both epoxiconazole and metconazole undoubtedly presents difficulties
in determining the effects of individual fungicide treatments, the results presented are a
realistic representation of the response of the Irish Z. tritici population, given the variation in
azole sensitivities which exists.
With high levels of phenotypic variation between isolates at each location early in the
season, a wide base from which selection could occur was present. Irrespective of application
pattern (solo, mixture or alternation) or dose, all fungicide treatments significantly decreased
the sensitivity of Z. tritici to both epoxiconazole and metconazole when compared to the un-
treated controls. Results from the REML and PCA showed that each fungicide selected
differentially for strains with reduced sensitivity. Even though epoxiconazole and
metconazole target the same gene there is evidence which shows that different azoles select
for different CYP51 genotypes (Fraaije et al., 2007, O'Sullivan & Kildea, 2010, Stammler &
Semar, 2011). Current populations of Z. tritici in Ireland contain a diversity of CYP51 alleles
and genotypes (Chapter 3), which are possibly selected for by different azoles, which would
explain this result.
Considerable knowledge has been gained through recent theoretical modelling of the
potential emergence and subsequent selection for resistant or partially resistant strains
(Hobbelen et al., 2011a, Hobbelen et al., 2013, Hobbelen et al., 2014, Mikaberidze et al.,
2014, Van den Bosch et al., 2011). Common amongst the predictions of these models has
been the usefulness of mixtures of fungicides, whether high-risk:high-risk or high-risk:low-
risk combinations, in prolonging the effective life of the most at-risk partner. Unlike these
models, our experiments used a mixture of fungicides with medium-resistance-risk and

44
belonging to the same chemical class. Mixtures are designed to expose the pathogen
populations to different modes-of-action, albeit simultaneously rather than sequentially as
with alternations. Each component should control a proportion of the strains selected by the
other component, thereby reducing the overall selection compared to using a single fungicide.
The mixtures provided better disease control but the same yield as the solo products in this
experiment. When the effects of treatments on sensitivity were studied for each fungicide
separately, the expected positive effect of mixing two components was not seen. Further,
when the effects common to both epoxiconazole and metconazole sensitivity were analysed
using PCA, the mixtures measured larger shifts in sensitivity than the solo treatments. This
increase in selection could simply be due to a further dose effect (Figure 2.6). The pre-
formulated mixture used in this experiment contained 90% of the solo epoxiconazole dose
and 92% of the solo metconazole dose. If effects are additive this would explain both the
improvement in disease control and the absence of a reduction in selection relative to the solo
treatments. Interactions between the fungicides in the mixture are likely to have some effect
on both disease control and selection, and synergism between the fungicides could explain the
improvement in disease control (Kendall & Hollomon, 1994) and the absence of a reduction
in selection (Shaw, 1993).
Shaw (1993) suggests that such synergism could be used to reduce selection by using
the minimum fungicide dose needed for adequate control. These results contradict this
however, as the same size shift was observed after the reduced dose of the mixture as the full
dose. From an anti-resistance perspective, this mixture is unusual; it is made up of two azoles
which have been shown to select differentially (Fraaije et al., 2007), although there is a strong
element of cross-resistance shown here by PC1. There is evidence of considerable evolution
in the CYP51 gene (Cools & Fraaije, 2013) and recent work has identified CYP51 alterations
and combinations of alterations which can reduce sensitivity to the majority of azoles, in
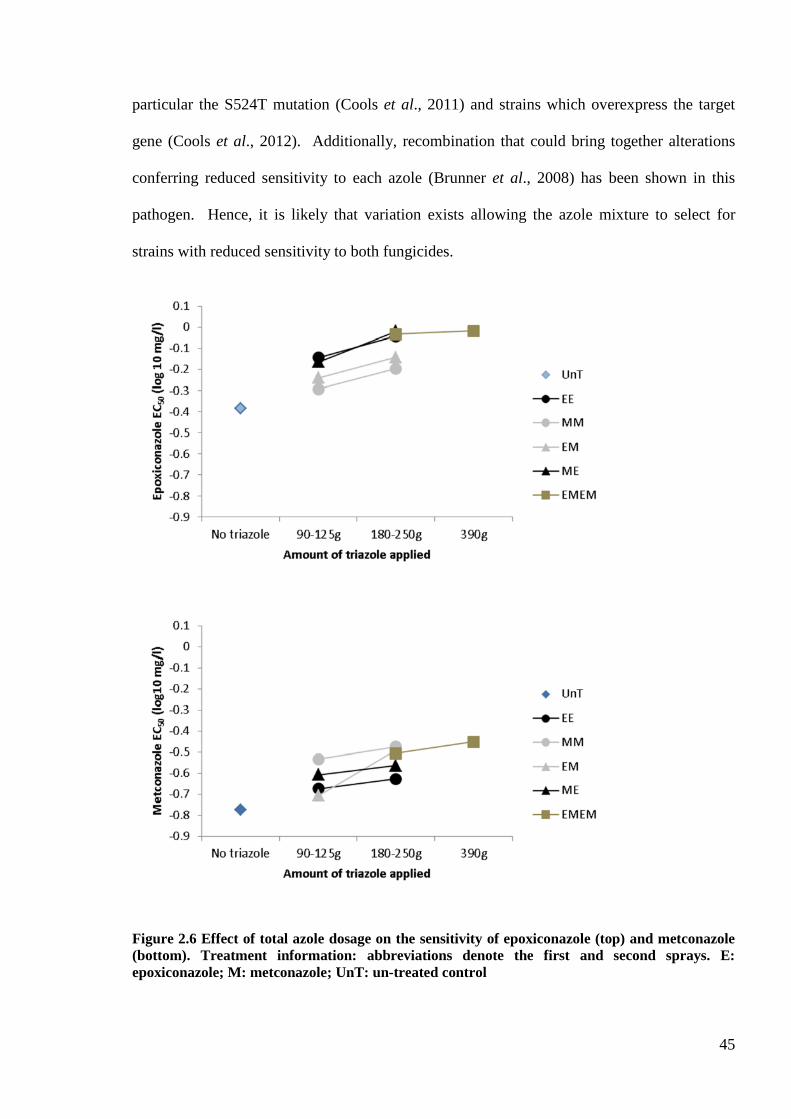
45
particular the S524T mutation (Cools et al., 2011) and strains which overexpress the target
gene (Cools et al., 2012). Additionally, recombination that could bring together alterations
conferring reduced sensitivity to each azole (Brunner et al., 2008) has been shown in this
pathogen. Hence, it is likely that variation exists allowing the azole mixture to select for
strains with reduced sensitivity to both fungicides.
Figure 2.6 Effect of total azole dosage on the sensitivity of epoxiconazole (top) and metconazole(bottom). Treatment information: abbreviations denote the first and second sprays. E:epoxiconazole; M: metconazole; UnT: un-treated control

46
Limiting the number of applications of an a.i. decreased the selection for strains which
are less sensitive to that fungicide. In the treatments where only one application of
metconazole was made, i.e. the alternations, the population was significantly more sensitive
than the treatments where two applications were made. Even though this was just non-
significant at the 5% level for epoxiconazole sensitivity (P = 0.09), the same pattern was seen.
This supports the prediction in the fungicide resistance model by Hobbelen et al. (2011a) in
which a significant increase in the selection ratio after an increase in spray numbers was
predicted. Applying the same fungicide at each treatment time, i.e. solo treatments and
mixtures, keeps the pathogen population under constant selection pressure. Alternations on
the other hand allow time between applications of the same fungicide for back-selection of
susceptible strains and means the pathogen population is exposed to chemicals exerting
different selection pressure at each application time.
The benefit of the two alternations was demonstrated in PC2 of the PCA. Isolates of
Z. tritici from plots treated with metconazole first and epoxiconazole second were less
sensitive to epoxiconazole, and those isolated from plots treated with epoxiconazole first and
metconazole second were less sensitive to metconazole, i.e. the most recently applied
fungicide had the greatest effect on selection. No comparable findings in an agricultural
setting are available. Hobbelen et al. (2013) included alternations in their model; however
those were fungicides with different modes-of-action. Based on their findings the use of
fungicides in alternation is likely to delay the selection for strains with reduced sensitivity,
and while different sequences of fungicides were included in the model, this effect of the
order of fungicide was not predicted. Results from this experiment are a practical example of
what is theoretically expected from combining fungicides for anti-resistance purposes;
fungicide A controls the strains sensitive to it while fungicide B controls the strains sensitive
to it which happened to be selected by fungicide A and, selects for the strains resistant to it, as

47
if the population is being pushed one way and then back to keep a balance. However, there is
some positive cross-resistance between the two fungicides, so while these push-pull effects
should slow the shifts in sensitivity down, it will not completely halt it. There are a number
of possible causes of this effect of order of application, which the experimental design does
not allow us to distinguish. There could be fitness costs causing back-selection between the
first and second applications, so that the second application gave the most response when
measured later. There could also be sampling bias, with sampled leaves having been directly
treated with the second fungicide but not the first. The effect of dose varied significantly
according to the order of application of the two fungicides, but can be explained as an
interaction of scale rather than direction. Smaller shifts in sensitivity were observed after
both half dose alternations in comparison to their full dose counterparts, but the difference
between full and half dose of epoxiconazole followed by metconazole alternation was smaller
than the other way round, and probably led to the observed statistical interaction.
Averaged over all application strategies, halving doses did not significantly decrease
the shifts in sensitivity. As expected, full doses provided significantly better disease control
and, where there was high disease pressure, higher yields. While full recommended doses of
fungicide are designed to provide the best possible disease control and are recommended as
an anti-resistance strategy by manufacturers, reducing fungicide doses in order to reduce the
rate of selection has been argued and tested by numerous researchers; Van den Bosch et al.
(2011) reviewed the available literature and concluded that all models and most experimental
studies show that selection for strains with reduced sensitivity increases with dose. However,
the same study also suggested the theory that pathogens which develop a gradual insensitivity,
such as Z. tritici insensitivity to azoles, may be an exception to the rule, but no evidence was
available to add weight to the theory. It is probable that the presence of a large proportion of
strains with reduced sensitivity in the population has eroded the efficacy of the fungicides and

48
that the evolution of azole sensitivity is now in the adjustment phase. So while this study has
shown that over all treatments half doses did not increase or decrease sensitivity compared to
full doses, and in many individual cases they did increase sensitivity (Table 2.6), the inferior
disease control and lower yields after reduced doses makes the strategy used in these
experiments impractical. However, in a different situation, such as when fungicides are
combined with a different mode-of-action, reduced doses may be more effective .
In conclusion, evidence is presented that limiting the number of applications of an
individual a.i. is the most important strategy for managing azole insensitivity; having two
azoles which select differentially, and using each sequentially rather than simultaneously, will
take advantage of that differential selection to slow down the selection for strains with
reduced sensitivity to specific azoles. Disease control achieved by the alternations was the
same as that of solo products and control by both was significantly poorer than the mixtures.
However, the yields of plots given each application pattern were not significantly different.
This strengthens the case for choosing alternations over mixtures or solo products, and
emphasises that aiming for perfect disease control may incur costs and increase selection
without increasing profit. But how long will that last? The azole mixture here selected for a
level of insensitivity to both partners which highlights the need for the inclusion of alternative
chemistries in fungicide programs. Reduced doses of azole fungicides were not always
effective enough for control of STB. While this conflicts with some other empirical evidence,
it shows that the azole insensitive Z. tritici population targeted in this experiment is likely to
be in the adjustment phase where higher doses are needed for control. Our results
demonstrate that anti-resistance recommendations suitable for fungicides with distinct modes-
of-action are not always effective when using combinations of azoles. Advice to combine
azoles which select for different resistance alleles or loci is vulnerable to continuing genetic
change in the pathogen.

49
Chapter 3: Molecular mechanisms associated with reduced azole sensitivity
and the genetic structure of azole treated populations of Zymoseptoria tritici
in Ireland
3.1 Introduction
Populations of Zymoseptoria tritici, the causal agent of Septoria tritici blotch in winter wheat,
are characterised by high gene and genotypic diversity (Zhan et al., 2006) and combined with
its mixed reproductive system and large (effective) population sizes, Z. tritici is regarded as
having a high evolutionary potential (Zhan & McDonald, 2004). This level of adaptability
allows populations of Z. tritici to survive and reproduce in new or hostile environments, such
as in response to fungicides or resistant hosts. Whilst STB host resistance is available,
varieties are generally only moderately resistant (Anon, 2013c). Consequently, multiple well-
timed fungicide applications per season are required to control STB. Zymoseptoria tritici
populations in the major wheat growing regions of the world are seeing shifts in sensitivity to
azoles, e.g. in Europe (Leroux et al., 2007, Stammler et al., 2008, Leroux & Walker, 2011,
Stammler & Semar, 2011), Tunisia (Boukef et al., 2012) and North America (Estep et al.,
2014). However, the shift is at different stages in different regions, possibly because of
differences in when azoles were introduced and the subsequent level of use, as well as
differences in varieties used and agronomic practices.
Previous work has highlighted amino-acid alterations (mutations) in the target protein
as the main mechanism which contributes to the reduction in azole sensitivity in Z. tritici
populations (Cools et al., 2005a, Leroux et al., 2007, Stammler et al., 2008, Cools et al.,
2010, Cools et al., 2011, Cools & Fraaije, 2013). Homology modelling has been used to
present a 3D structure of the changes in the target protein that the pathogen goes through
during the development of resistance. Resistance to azoles has been studied in this way by
Mullins et al. (2011) and resistance to SDHIs by Glattli et al. (2011), Fraaije et al. (2012) and
50
Scalliet et al. (2012). Mullins et al. (2011) found that some amino-acid mutations can alter
the structure of the binding cavity (region in the protein which is targeted by a specific
fungicide molecule (ligand)), but it depends on the location of the altered residue (amino-
acid) in relation to the fungicide docking site in the cavity; the closer the mutated amino-acid
to the docking site, the more likely it is to interfere with the docking infinity of the fungicide.
Figure 3.1 shows where the residues subject to alteration lie in relation to the binding site of
the azole, triadimenol. The I381 is very close to the binding cavity and has the effect of
reducing the volume of the cavity, possibly bringing remaining residues closer to the binding
site. The S188 and N513 residues are just outside of the protein, and far removed from the
binding site, meaning that alterations at these residues have less of an impact on the azole
binding.
Figure 3.1 Homology model of the wild-type Z tritici CYP51, binding triadimenol (circled),courtesy of Mullins et al. (2011)

51
Analysis of Z. tritici CYP51 target site alterations has confirmed that different azoles
select for different alterations (Leroux et al., 2007, Fraaije et al., 2007), for example,
tebuconazole positively selects for the I381V mutation but negatively selects for the V136A
mutation. This highlighted the potential of combining differentially selecting azoles as a
possible anti-resistance tactic, while maintaining STB control at an acceptable level (Cools &
Fraaije, 2008). Recently however, isolates carrying combinations of alterations conferring lab
resistance to the most widely used azoles, epoxiconazole and prothioconazole, have emerged
(Cools et al., 2011), raising concerns that combining azoles might accelerate the development
of resistance and loss of azole efficacy in the field. The effect of using combinations of
azoles on the selection for insensitive isolates has been covered in more depth in Chapter 2.
Evidence of Z. tritici CYP51 alterations date from isolates sampled in the early 1990s
(Leroux et al., 2007, Brunner et al., 2008). To date, 34 amino-acid alterations have been
reported (Cools & Fraaije, 2013) of which the mutations V136A, A379G, I381V, Y461S,
S524T and the double deletion, ΔY459/G460, appear to affect azole sensitivity the most.
Leroux et al. (2007) studied the genetic characteristics of European Z. tritici isolates from
between 1988 and 2005. They identified alterations at the 459-461 position in French isolates
from as early as 1993. Most of the collections prior to 1997 consisted of wild-type sensitive
strains, but from 1997 onwards amino-acid alterations started to accumulate. All
combinations of changes in that study showed increasing resistance factors to epoxiconazole
and metconazole. In 2007, populations from continental Europe, as well as the UK, were
dominated by the I381V mutation and either a mutation or deletion at 459-461 position, and
indeed I381V and the double deletion (ΔY459/G460) combined with the A379G mutation
was the most common CYP51 variant in most European countries (Stammler et al., 2008).
That CYP51 variant continued to dominate in UK and German populations in 2010, whereas
populations in other countries saw a reduction in CYP51 variants with A379G mutation and

52
an increase in the frequency of V136C mutation (Stammler & Semar, 2011). Combinations
of the V136A and I381V amino-acid mutations were first identified by Stammler et al. (2008)
in an isolate from 2007, but by 2010 were considerably more frequent in European
populations (Stammler & Semar, 2011).
Leroux et al. (2007) categorised Z. tritici strains according to their sensitivity to
specific azoles, and subsequently associated these with changes in their CYP51. Earlier
CYP51 variants with few alterations started out as TriS (sensitive) or TriR1-3, which had
individual alterations and were slightly less sensitive than TriS. As combinations of
alterations which affected sensitivity to specific azoles appeared over time, the number of
categories increased and most recently reached TriR12 (V136A, I381V, an alteration at 459-
461, and S524T) (Leroux & Walker, 2011). Irish Z. tritici strains, compared to strains from
other European countries, are relatively advanced along this series; Stammler and Semar
(2011) found that two thirds of the Irish population sampled (n = 155) fell into the TriR9
group (V136A, a mutation at 459-461, and S524T) as classified by Leroux & Walker (2011).
Since DMI monitoring began around the late 1980s (Leroux et al., 2007), Irish Z. tritici
populations have been somewhat different to the rest of the European populations. Two Irish
isolates from 2003 were included in a study by Leroux et al. (2007), and they identified the
V136A mutation and either a mutation or deletion at 459-461 position in those isolates tested.
Research by Kildea (2009) found that the V136A and Y461S mutations were the most
common amino-acid alterations, and when combined together was the most frequent CYP51
variant found in that population. I381V was present but not as common. Leroux and Walker
(2011) identified CYP51 variants in the form of I381V + A379G + ΔY459/G460 and V136A
+ Y461S + S524T in three Irish isolates from 2009. The latter CYP51 variant was found to
dominate Irish populations in 2010 (Stammler & Semar, 2011), and aside from the UK and
Sweden, was not found elsewhere in Europe. Additionally in 2010, isolates with V136A +

53
Y461S + S524T mutations plus the addition of I381V were identified, albeit in small
frequencies. In a more recent but retrospective study, Kildea et al. (2014) found the
combined V136A + I381V mutations in Irish populations from 2006, and between 2006 and
2011 frequencies of this combination fluctuated.
Recent homology studies (Mullins et al., 2011) and heterologous expression of
mutated Z. tritici CYP51 genes (Cools et al., 2010) have demonstrated that it is often specific
combinations of alterations rather than the individual alterations which have the greatest
effect on azole sensitivity. This is also evident in the numerous studies on the development of
reduced azole sensitivity in European populations (Cools et al., 2005a, Fraaije et al., 2007,
Leroux et al., 2007, Stammler et al., 2008, Leroux & Walker, 2011, Stammler & Semar,
2011, Buitrago et al., 2014). For a very basic example, Mullins et al. (2011) suggest that the
early mutation L50S, which has no direct effect on azole sensitivity (Leroux et al., 2007),
brings the normally deleterious mutations at 136 and 381 into closer proximity with certain
azoles, which in turn interferes with the docking ability of the azole, making it less effective.
Populations are now significantly more complex, with combinations of many alterations
which affect azole sensitivity (Buitrago et al., 2014).
In addition to amino-acid alterations in the protein encoded by the CYP51 gene, other
mechanisms are believed to have contributed to the reduction in azole sensitivity in Z. tritici
(Stergiopoulos et al., 2003). Cools et al. (2012) have demonstrated that a 120 bp insert in the
putative CYP51 promoter region of field isolates of Z. tritici has resulted in the constitutive
over-expression of 14α-demethylase, which confers a reduction in sensitivity to all azole
fungicides. Chassot et al. (2008), Kildea (2009) and Leroux and Walker (2011) have all
previously reported a large insert of around 800-1000 bp in the putative CYP51 promoter
region, but whether it was associated with over-expression was unclear (Cools et al., 2012).

54
In comparison to earlier studies of European populations such as Stammler and Semar
(2011) and Kildea (2009) who identified eight and nine CYP51 variants respectively, a recent
study by Buitrago et al. (2014) identified 38 different genotypes, and included two promoter
inserts, 120 bp and 1000 bp, highlighting the extent of increase in CYP51 diversity in
European populations in recent years. To help slow the further development of insensitivity,
it may be possible to manipulate selection by making fungicide application decisions based
on, amongst other things, knowledge of the current genetic structure of local and regional
populations, and of the evolutionary history of these populations. In theory, predictions can
be made of how a population will change depending on which active ingredient (a.i.) or
combination of a.i.s, are used. In Chapter 2, effects of treatment on azole sensitivity were
demonstrated. In the present chapter the hypothesis that treatments have an effect on the
variability associated with the CYP51 gene were tested. The whole CYP51 gene and the
putative CYP51 promoter region from selected azole treated and un-treated isolates was
sequenced and analysed for changes. Further, an evolutionary history of the CYP51 gene of
this Z. tritici population is proposed and discussed.
3.2 Materials and methods
3.2.1 Origins of isolates
Zymoseptoria tritici isolates for this study originated from the experiment in Chapter 2, which
looked at the effects of combining the azoles epoxiconazole and metconazole on the
sensitivity of Z. tritici populations. The isolates were selected without knowledge of their
genotype, but based on their sensitivity to epoxiconazole and metconazole. Roughly equal
numbers of isolates (between 5-7) were chosen from the highest, lowest and intermediate
EC50 ranges at each location from each of the four treatment groups, pre-treatment, full rate
epoxiconazole, full rate metconazole and the full rate mixture of epoxiconazole and
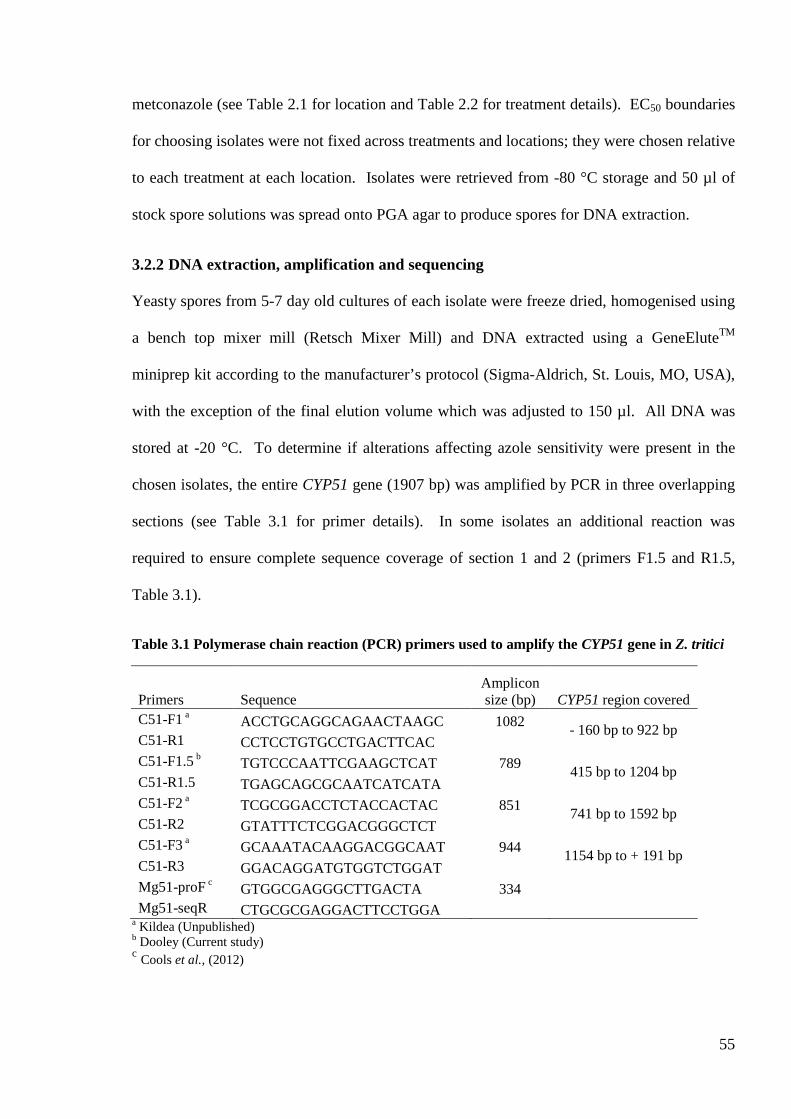
55
metconazole (see Table 2.1 for location and Table 2.2 for treatment details). EC50 boundaries
for choosing isolates were not fixed across treatments and locations; they were chosen relative
to each treatment at each location. Isolates were retrieved from -80 °C storage and 50 µl of
stock spore solutions was spread onto PGA agar to produce spores for DNA extraction.
3.2.2 DNA extraction, amplification and sequencing
Yeasty spores from 5-7 day old cultures of each isolate were freeze dried, homogenised using
a bench top mixer mill (Retsch Mixer Mill) and DNA extracted using a GeneEluteTM
miniprep kit according to the manufacturer’s protocol (Sigma-Aldrich, St. Louis, MO, USA),
with the exception of the final elution volume which was adjusted to 150 µl. All DNA was
stored at -20 °C. To determine if alterations affecting azole sensitivity were present in the
chosen isolates, the entire CYP51 gene (1907 bp) was amplified by PCR in three overlapping
sections (see Table 3.1 for primer details). In some isolates an additional reaction was
required to ensure complete sequence coverage of section 1 and 2 (primers F1.5 and R1.5,
Table 3.1).
Table 3.1 Polymerase chain reaction (PCR) primers used to amplify the CYP51 gene in Z. tritici
Primers SequenceAmpliconsize (bp) CYP51 region covered
C51-F1 aACCTGCAGGCAGAACTAAGC 1082
- 160 bp to 922 bpC51-R1 CCTCCTGTGCCTGACTTCAC
C51-F1.5 bTGTCCCAATTCGAAGCTCAT 789
415 bp to 1204 bpC51-R1.5 TGAGCAGCGCAATCATCATA
C51-F2 aTCGCGGACCTCTACCACTAC 851
741 bp to 1592 bpC51-R2 GTATTTCTCGGACGGGCTCT
C51-F3 aGCAAATACAAGGACGGCAAT 944
1154 bp to + 191 bpC51-R3 GGACAGGATGTGGTCTGGAT
Mg51-proF cGTGGCGAGGGCTTGACTA 334
Mg51-seqR CTGCGCGAGGACTTCCTGGAa Kildea (Unpublished)b Dooley (Current study)c
Cools et al., (2012)
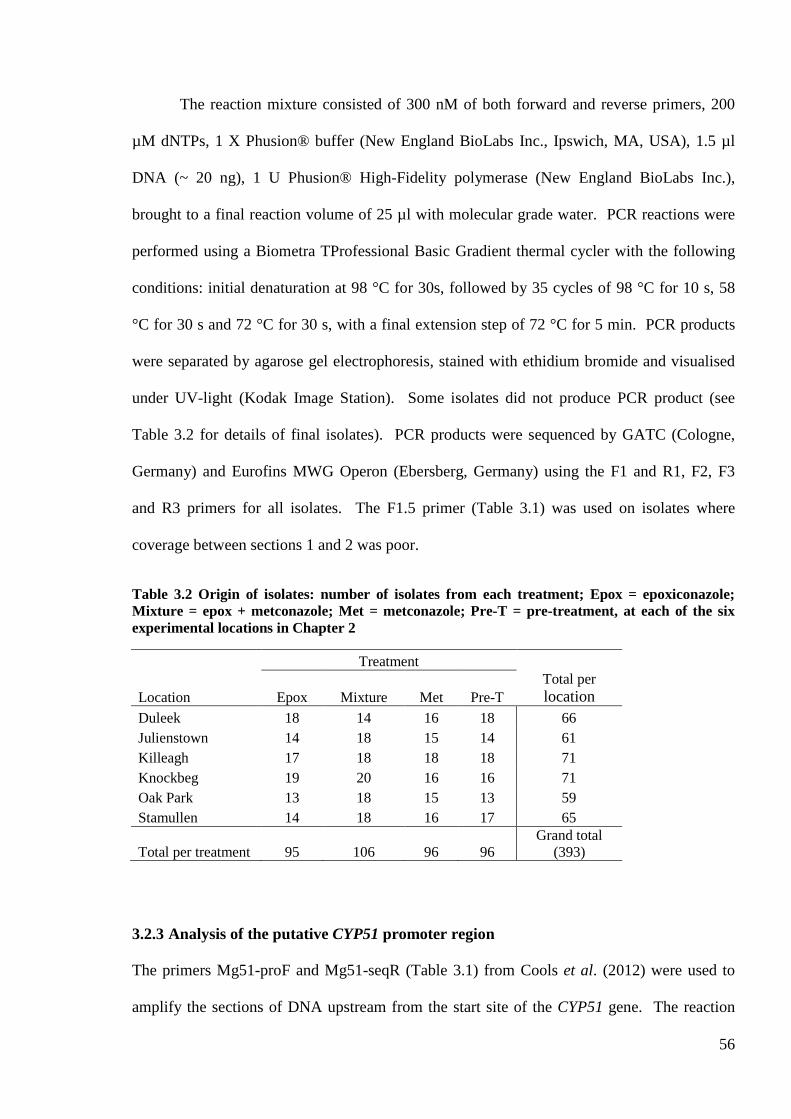
56
The reaction mixture consisted of 300 nM of both forward and reverse primers, 200
µM dNTPs, 1 X Phusion® buffer (New England BioLabs Inc., Ipswich, MA, USA), 1.5 µl
DNA (~ 20 ng), 1 U Phusion® High-Fidelity polymerase (New England BioLabs Inc.),
brought to a final reaction volume of 25 µl with molecular grade water. PCR reactions were
performed using a Biometra TProfessional Basic Gradient thermal cycler with the following
conditions: initial denaturation at 98 °C for 30s, followed by 35 cycles of 98 °C for 10 s, 58
°C for 30 s and 72 °C for 30 s, with a final extension step of 72 °C for 5 min. PCR products
were separated by agarose gel electrophoresis, stained with ethidium bromide and visualised
under UV-light (Kodak Image Station). Some isolates did not produce PCR product (see
Table 3.2 for details of final isolates). PCR products were sequenced by GATC (Cologne,
Germany) and Eurofins MWG Operon (Ebersberg, Germany) using the F1 and R1, F2, F3
and R3 primers for all isolates. The F1.5 primer (Table 3.1) was used on isolates where
coverage between sections 1 and 2 was poor.
Table 3.2 Origin of isolates: number of isolates from each treatment; Epox = epoxiconazole;Mixture = epox + metconazole; Met = metconazole; Pre-T = pre-treatment, at each of the sixexperimental locations in Chapter 2
Treatment
Location Epox Mixture Met Pre-T
Total perlocation
Duleek 18 14 16 18 66
Julienstown 14 18 15 14 61
Killeagh 17 18 18 18 71
Knockbeg 19 20 16 16 71
Oak Park 13 18 15 13 59
Stamullen 14 18 16 17 65
Total per treatment 95 106 96 96Grand total
(393)
3.2.3 Analysis of the putative CYP51 promoter region
The primers Mg51-proF and Mg51-seqR (Table 3.1) from Cools et al. (2012) were used to
amplify the sections of DNA upstream from the start site of the CYP51 gene. The reaction

57
mixture consisted of 300 nM of both forward and reverse primers, 200 µM dNTPs, 1 X
ThermoPol™ Buffer (New England BioLabs Inc.), 1.5 µl DNA (~ 20 ng), 1 U Taq
polymerase (New England BioLabs Inc.), brought to a final reaction volume of 25 µl with
molecular grade water. PCR reactions were performed using the following conditions: initial
denaturation at 95 °C for 2 min, followed by 35 cycles at 95 °C for 30 s, 60 °C for 30 s and 72
°C for 30 s, with a final incubation at 72 °C for 5 min. Deviations from the expected 334 bp
amplicons indicated an indel event.
3.2.4 Data analysis
Sequence data for each isolate were assembled using CLC genomics workbench v5.1
(www.clcbio.com [Accessed 28-12-14]), edited and aligned with sequence data from the
wild-type CYP51 gene ST1 (Accession no. AY730587
http://www.ncbi.nlm.nih.gov/nuccore/AY730587 [Accessed 28-12-14]) using the Clustal W
function in BioEdit v7.0.9.0 (Hall, 1999) (http://www.mbio.ncsu.edu/bioedit/bioedit.html
[Accessed 28-12-14]). Introns were removed from the sequence. Nucleotide sequences (all
synonymous and non-synonymous substitutions) were used for the study of the overall
genetic diversity of the population and evolutionary history of the isolates, but translated to
amino-acids (non-synonymous substitutions only) for the study of the CYP51 variants.
Synonymous substitutions are changes to the nucleotide sequence which have no effect on the
protein, and non-synonymous substitutions change the protein.
A chi-square test was used to associate frequencies of individual amino-acid
alterations with treatments and with geographic locations, and to identify possible interactions
between treatment and location. Amino-acid alterations which were found at least once at
every location and in every treatment were included in this analysis which was performed
using a generalised linear model with a Poisson distribution and log link function in GenStat
v14.1.0. Rarefaction analysis was used to correct for uneven sample sizes when analysing

58
CYP51 variant diversity between locations, and between treatments. Population
differentiation (Gst, (Nei, 1973)) was measured between locations and between treatment
groups, and notional amount of gene flow (Nm, (Boeger et al., 1993)) was measured between
geographic locations using the gene flow and genetic differentiation function in DnaSP
v5.10.01 (http://www.ub.edu/dnasp/ [Accessed 28-12-14]) (Librado & Rozas, 2009). Effects
of all amino-acid alterations (including the presence of an insert in the promoter; a combined
factor for rare alterations seen less than 5 times; and a combined factor for all alterations at
136 position) and all combinations of alterations, on epoxiconazole and metconazole
sensitivity measured on a log concentration scale, were tested using a generalised linear
model in GenStat, with normal error distribution. The models were simplified by dropping all
non-significant interactions, after which all non-significant main effects were also removed.
Logistic regression, carried out in GenStat, was used to analyse the effect of treatment
on frequencies of CYP51 variants; only variants which were seen at least once in each
treatment group were analysed. The effects of CYP51 variants on fungicide sensitivity were
measured using the linear mixed model (REML) function in GenStat: in the model, CYP51
variant (49 levels) was considered a fixed effect, whilst isolate was considered random effect.
The REML function in GenStat was also used to test the association between fungicide
sensitivity and CYP51 variants split with/without the ~800 bp insert: in the model, the split
variants were considered a fixed effect (12 levels) whilst isolate was considered random
effect.
Isolates and CYP51 variants were grouped according to sensitivity of the whole
collection where log10EC50 values of below -0.3 mg L-1 (0.5 mg L-1) for epoxiconazole and
log10 -0.523 mg L-1 (0.3 mg L-1) for metconazole were considered to be sensitive, log10EC50
values of above 0.176 mg L-1 (1.5 mg L-1) for epoxiconazole and 0.0 mg L-1 (1.0 mg L-1) for
metconazole were considered to be insensitive, and the remainder were considered to be

59
moderately sensitive. Phenotypes were visually analysed, using boxplots and variant means,
and interesting features discussed.
Evolutionary analysis of the data set began with the construction of a maximum
likelihood (ML) tree using MEGA v6.0 (http://www.megasoftware.net/) (Tamura et al.,
2013). All analyses were performed using the Kimura 2-parameter model. The tree with the
highest log likelihood was shown. A bootstrap analysis was performed to test for statistical
significance of the trees generated with 200 pseudoreplications. Initial tree(s) for the heuristic
search were obtained by applying the Neighbor-Joining method to a matrix of pairwise
distances estimated using the Maximum Composite Likelihood (MCL) approach. A discrete
Gamma distribution was used to model evolutionary rate differences among sites (5
categories (+G, parameter = 0.1000)). The tree was drawn to scale, with branch lengths
measured in the number of substitutions per site. Because recombination cannot be identified
in the ML tree, a median-joining network was constructed using NETWORK v4.6.1.2
(http://www.fluxus-engineering.com/sharenet.htm [Accessed 28-12-14]) to identify whether
recombination was likely to be present in the collection. Specific recombination break points
(RBP) were highlighted using the GARD (a genetic algorithm for recombination detection)
function in the open source HyPhy software found at DataMonkey.org
(http://www.datamonkey.org/ [Accessed 28-12-14]). New phylogenetic trees were created
using MEGA v6.0 with sequence data from the left and from the right of the potential RBP;
tree topologies were compared, and recombination was inferred when tree topologies were
significantly different. Visual analysis of the trees highlighted which haplotypes are
recombinants; haplotypes which have switched clades in the tree to the right of the RBP are
identified as potential recombinants. Potential recombinants were removed from the data set
and a new ML tree created in MEGA v6.0.

60
3.3 Results
3.3.1 Brief description of the collection
The 1907 bp CYP51 gene of each isolate was sequenced, of which a 1635 bp sequence
(introns removed) was screened for changes compared to the wild-type strain ST1. A total of
50 polymorphic sites were identified, where non-synonymous substitutions leading to 21
amino-acid alterations at 17 positions throughout the protein were found. There were 49
different combinations of mutations (CYP51 variants, Table 3.3). In addition, a 6 bp-deletion
leading to the deletion of two amino-acids (ΔY459/G460) was found. No wild-type
sequences were found, and all isolates had at least one amino-acid alteration previously
associated with a decrease in azole sensitivity (Cools & Fraaije, 2013). The most commonly
observed alterations were L50S, I381V, V136A and S524T, found in 99%, 66%, 55% and
54% of the isolates respectively (Table 3.4). Two amino-acid mutations were novel; I377V
and I384M. In addition, three different size inserts were found in the collection following
PCR amplification of the putative promoter region (Figure 3.2). A single isolate had no PCR
product. A total of 195 isolates had the expected product size of 334 bp, i.e. no insert present;
Figure 3.2 Gel electrophoresis showing the four PCR products found in the collection fromamplifying the regulatory sequences upstream of CYP51. 100 bp ladder in lane one and lane 13.Lanes 4 and 11 have the expected product size of 334 bp; lanes 3 and 10 have the 120 bp insert;lanes 5, 7, 8 and 12 have the ~800 bp insert and lane 6 has the ~300 bp insert. (Image courtesy ofJ M-C, Teagasc)
1 2 3 4 5 6 7 8 9 10 11 12 13

61
43 isolates had the 120 bp insertion as identified by Cools et al. (2012); a single isolate had an
insert with an estimated size of ~300 bp; and the remaining 153 isolates had an insert of
approximately ~800 bp (see Table 3.4 and Table 3.8 for frequencies of each amino-acid
alteration and inserts at each location and treatment).
3.3.2 Effect of CYP51 variants on sensitivity
The collection of isolates consisted of 49 unique combinations of amino-acid alterations (six
of which split into two groups, a and b, to represent the presence or absence of the ~800 bp
insert), ranging in frequency from 1 to 97 (n = 393, Table 3.3). The nine most frequent
CYP51 variants represent 80% of all isolates, and approximately half of all CYP51 variants
were only seen in single isolates. CYP51 variants had between three and eight alterations.
Sensitivity tended to decrease as the number of alterations per CYP51 variant increased
(Table 3.3). Even though the range of EC50 values for many CYP51 variants overlapped
(Figure 3.3), there was a significant effect of CYP51 variant on the sensitivity to both
epoxiconazole and metconazole (REML, P < 0.001 for both fungicides).
Isolates with the 120 bp insert were found in five different CYP51 variants and whilst
there were differences in the mean sensitivity between these variants (Table 3.3), 65% of the
individual isolates from those CYP51 variants were classed in the insensitive categories of
both epoxiconazole and metconazole. Within the isolate collection, the 120 bp insert did not
appear in a common background to any CYP51 variants without the insert, so it was not
possible to compare the effects of that insert on sensitivity. The larger insert of ~800 bp was
found in 24 CYP51 variants, including variants 2, 4, 31, 35, 37 and 38, where there was a mix
of isolates with and without the insert. In the two CYP51 variants 31 and 35 (where there
were a sufficient number of isolates to compare the effects on sensitivity between those with
and without the insert.) the ~800 bp insert significantly reduced sensitivity to both fungicides
(REML, P < 0.001, Figure 3.4).
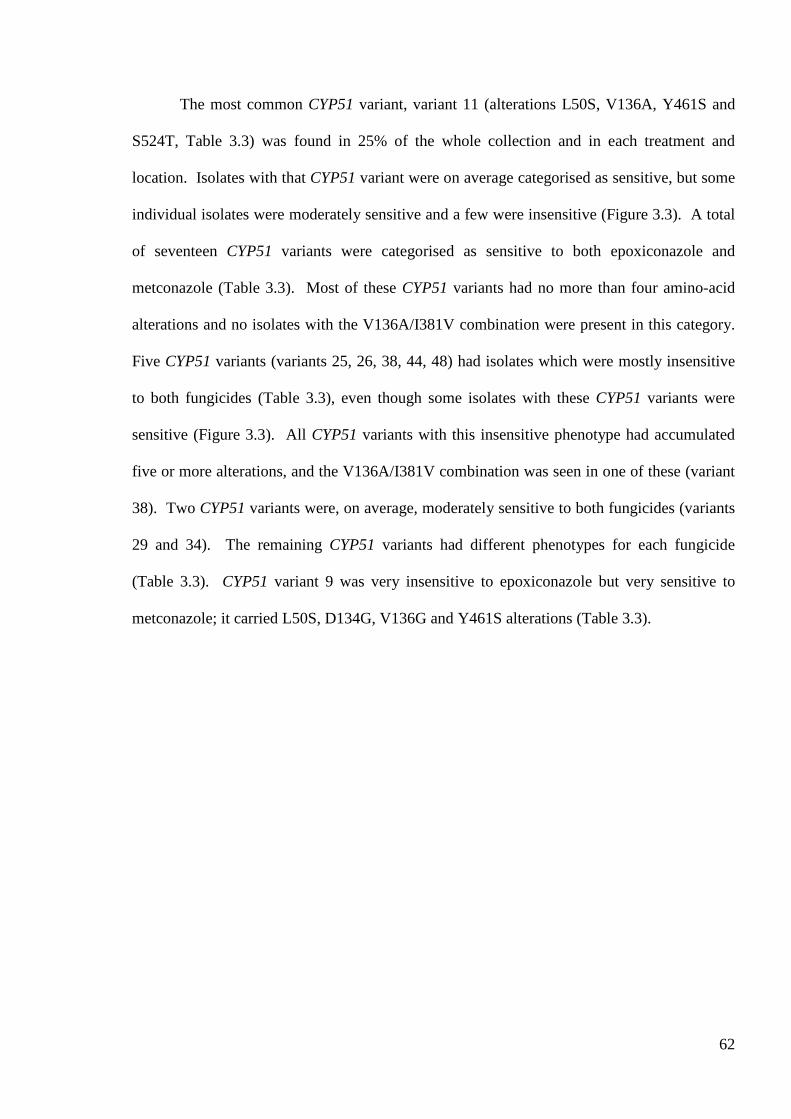
62
The most common CYP51 variant, variant 11 (alterations L50S, V136A, Y461S and
S524T, Table 3.3) was found in 25% of the whole collection and in each treatment and
location. Isolates with that CYP51 variant were on average categorised as sensitive, but some
individual isolates were moderately sensitive and a few were insensitive (Figure 3.3). A total
of seventeen CYP51 variants were categorised as sensitive to both epoxiconazole and
metconazole (Table 3.3). Most of these CYP51 variants had no more than four amino-acid
alterations and no isolates with the V136A/I381V combination were present in this category.
Five CYP51 variants (variants 25, 26, 38, 44, 48) had isolates which were mostly insensitive
to both fungicides (Table 3.3), even though some isolates with these CYP51 variants were
sensitive (Figure 3.3). All CYP51 variants with this insensitive phenotype had accumulated
five or more alterations, and the V136A/I381V combination was seen in one of these (variant
38). Two CYP51 variants were, on average, moderately sensitive to both fungicides (variants
29 and 34). The remaining CYP51 variants had different phenotypes for each fungicide
(Table 3.3). CYP51 variant 9 was very insensitive to epoxiconazole but very sensitive to
metconazole; it carried L50S, D134G, V136G and Y461S alterations (Table 3.3).

63
Table 3.3 CYP51 variants in the current collection. Each CYP51 variant represents a different combination of amino-acid alterations, and N thenumber of times that CYP51 variant was found. Treatment illustrates the treatments from which CYP51 variants were found; E = epoxiconazole; M= metconazole; G = the mixture; P = pre-treatment. Location illustrates the location in which CYP51 variants were found; D = Duleek; K =Knockbeg; S = Stamullen; J = Julienstown; C = Killeagh; and O = Oak Park
Variantname
Mean log10EC50 (mg L-1)
N Amino-acid changes in each CYP51 variant Insert Epoxiconazole Metconazole Treatment Location
1 1 L50S, S188N, I381V 120 -0.648 -1.223 E S
2 6 L50S, V136A, Y461S 800* -0.982 ± 0.102 -1.443 ± 0.15 P, E D, J, K, S
2a 5 L50S, V136A, Y461S 0 -1.000 ± 0.123 -1.500 ± 0.169 P, E D, J, K, S
2b 1 L50S, V136A, Y461S 800 -0.889 -1.157 P K
3 16 L50S, V136C, Y461S 0 -0.729 ± 0.069 -0.855 ± 0.083 P, E, G, M D, J, K, O, S
4 13 L50S, I381V, Y461H 800* -0.896 ± 0.114 -1.015 ± 0.096 P, E, G, M D, J, K, O, S
4a 2 L50S, I381V, Y461H 0 -0.896 ± 0.114 -1.036 ± 0.283 E, G, O, S
4b 11 L50S, I381V, Y461H 800 -0.891 ± 0.136 -1.012 ± 0.108 P, E, G, M D, J, C, K, O, S
5 3 L50S, I381V, Y459S 0 -0.2 ± 0.585 -0.801 ± 0.042 P, E, G D, O
6 2 L50S, I381V, Y459D 0 -0.753 ± 0.153 -0.868 ± 0.059 P, G C, K
7 1 L50S, Y461S, S524T 0 -0.741 -1.439 E J
8 1 L50S, Y461S, V490L 0 -1.096 -0.682 P K
9 1 L50S, D134G, V136G, Y461S 0 0.610 -0.719 E D
10 5 L50S, V136A, Y461H, S524T 0 -0.621 ± 0.152 -1.233 ± 0.182 E, G, M D, K, S
11 97 L50S, V136A, Y461S, S524T 0 -0.440 ± 0.032 -0.946 ± 0.043 P, E, G, M D, J, C, K, O, S
12 1 L50S, V136C, Y461S, S524T 0 -0.308 -0.353 G K
13 3 L50S, S188N, I381V, Y461S 120 -0.397 ± 0.315 -0.670 ± 0.467 M D
14 2 L50S, S188N, I381V, Y461H 120 0.027 ± 0.648 0.236 ± 0.414 G S
15 1 L50S, A311G, Y461S, V490L 0 -0.918 -0.655 M O
16 3 L50S, I377V, I381V, Y461H 800 -0.543 ± 0.049 -0.732 ± 0.032 P, E, G C, O
17 1 L50S, I381V, Y461S, S524T 0 -0.757 -1.264 E J
18 1 L50S, A379G, I381V, Del, N513K 0 -0.759 -0.106 P K
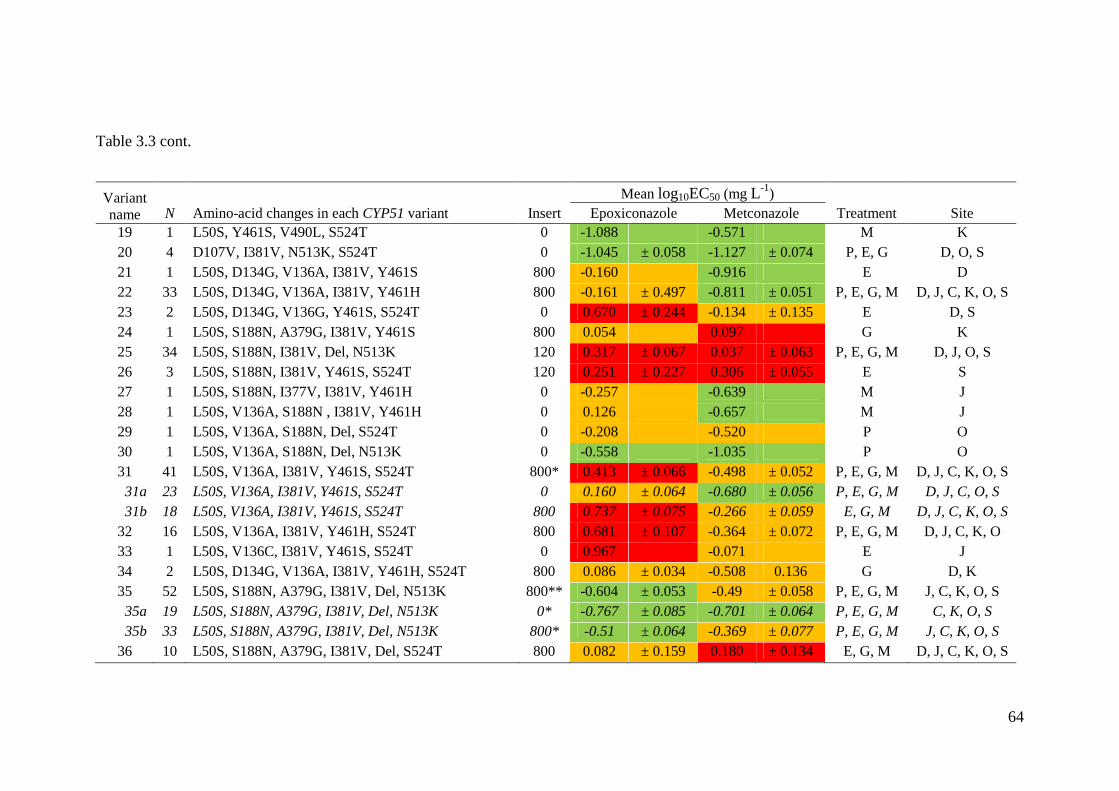
64
Table 3.3 cont.
Variantname
Mean log10EC50 (mg L-1)
N Amino-acid changes in each CYP51 variant Insert Epoxiconazole Metconazole Treatment Site
19 1 L50S, Y461S, V490L, S524T 0 -1.088 -0.571 M K
20 4 D107V, I381V, N513K, S524T 0 -1.045 ± 0.058 -1.127 ± 0.074 P, E, G D, O, S
21 1 L50S, D134G, V136A, I381V, Y461S 800 -0.160 -0.916 E D
22 33 L50S, D134G, V136A, I381V, Y461H 800 -0.161 ± 0.497 -0.811 ± 0.051 P, E, G, M D, J, C, K, O, S
23 2 L50S, D134G, V136G, Y461S, S524T 0 0.670 ± 0.244 -0.134 ± 0.135 E D, S
24 1 L50S, S188N, A379G, I381V, Y461S 800 0.054 0.097 G K
25 34 L50S, S188N, I381V, Del, N513K 120 0.317 ± 0.067 0.037 ± 0.063 P, E, G, M D, J, O, S
26 3 L50S, S188N, I381V, Y461S, S524T 120 0.251 ± 0.227 0.306 ± 0.055 E S
27 1 L50S, S188N, I377V, I381V, Y461H 0 -0.257 -0.639 M J
28 1 L50S, V136A, S188N , I381V, Y461H 0 0.126 -0.657 M J
29 1 L50S, V136A, S188N, Del, S524T 0 -0.208 -0.520 P O
30 1 L50S, V136A, S188N, Del, N513K 0 -0.558 -1.035 P O
31 41 L50S, V136A, I381V, Y461S, S524T 800* 0.413 ± 0.066 -0.498 ± 0.052 P, E, G, M D, J, C, K, O, S
31a 23 L50S, V136A, I381V, Y461S, S524T 0 0.160 ± 0.064 -0.680 ± 0.056 P, E, G, M D, J, C, O, S
31b 18 L50S, V136A, I381V, Y461S, S524T 800 0.737 ± 0.075 -0.266 ± 0.059 E, G, M D, J, C, K, O, S
32 16 L50S, V136A, I381V, Y461H, S524T 800 0.681 ± 0.107 -0.364 ± 0.072 P, E, G, M D, J, C, K, O
33 1 L50S, V136C, I381V, Y461S, S524T 0 0.967 -0.071 E J
34 2 L50S, D134G, V136A, I381V, Y461H, S524T 800 0.086 ± 0.034 -0.508 0.136 G D, K
35 52 L50S, S188N, A379G, I381V, Del, N513K 800** -0.604 ± 0.053 -0.49 ± 0.058 P, E, G, M J, C, K, O, S
35a 19 L50S, S188N, A379G, I381V, Del, N513K 0* -0.767 ± 0.085 -0.701 ± 0.064 P, E, G, M C, K, O, S
35b 33 L50S, S188N, A379G, I381V, Del, N513K 800* -0.51 ± 0.064 -0.369 ± 0.077 P, E, G, M J, C, K, O, S
36 10 L50S, S188N, A379G, I381V, Del, S524T 800 0.082 ± 0.159 0.180 ± 0.134 E, G, M D, J, C, K, O, S

65
Table 3.3 cont.
Variantname
Mean log10EC50 (mg L-1)
N Amino-acid changes in each CYP51 variant Insert Epoxiconazole Metconazole Treatment Site
37 6 L50S, S188N, A379G, I381V, Y461S, S524T 800* -0.387 ± 0.206 -0.350 ± 0.24 G, M J, K
37a 2 L50S, S188N, A379G, I381V, Y461S, S524T 0 -0.783 ± 0.22 -0.961 ± 0.153 G, M J, K
37b 4 L50S, S188N, A379G, I381V, Y461S, S524T 800 -0.189 ± 0.243 -0.045 ± 0.217 G, M J, K
38 3 L50S, V136A, A379G, I381V, Y461S, S524T 800* 0.629 ± 0.324 0.042 ± 0.147 E, G D
38a 2 L50S, V136A, A379G, I381V, Y461S, S524T 0 0.328 ± 0.207 0.036 ± 0.255 E, G D
38b 1 L50S, V136A, A379G, I381V, Y461S, S524T 800 1.231 0.053 G D
39 1 L50S, A379G, I381V, Del, N513K, S524T 800 -0.076 0.107 M J
40 1 L50S, D134G, V136A, A379G, I381V, Y461S,S524T
800 1.383 -0.285 E O
41 1 L50S, S188N, N284H, A379G, I381V, Del, N513K 0 0.323 -0.115 M C
42 1 L50S, S188N, A379G, I381V, I384M, Del, N513K 800 -0.703 -0.125 P S
43 1 L50S, S188N, A379G, I381V, A410S, Del, N513K 0 -0.201 0.196 E C
44 4 L50S, S188N, A379G, I381V, Del, N513K, S524T 800 0.245 ± 0.264 0.364 ± 0.168 G, M D, C, K, O
45 1 L50S, S188N, A379G, I381V, Y461S, N513K,S524T
800 -0.336 -1.067 M K
46 3 L50S, V136A, S188N, A379G, I381V, Y461S,S524T
0 0.636 ± 0.163 -0.049 ± 0.134 P, E, G D, O
47 6 L50S, V136A, S188N, A379G, I381V, Del, S524T 800 0.715 ± 0.137 -0.127 ± 0.012 E, G, M J, C, O
48 1 L50S, V136C, S188N, A379G, I381V, Del, S524T 800 1.176 0.775 E C
49 1 L50S, V136A, S188N, A379G , I381V, Del, N513K,S524T
800 0.986 -0.012 G K
* CYP51 variants which are split by the presence or absence of the ~800 bp insert, underneath each of these variants and in italics is the breakdown of information of the splitvariants, with and without the ~800 bp insert.The colours highlighting the mean EC50 values represent the phenotypic classification each CYP51 variant falls into. Green = sensitive: log10EC50 values of below -0.3 mg L-1
for epoxiconazole and log10 -0.523 mg L-1 for metconazole, Red = insensitive: log10EC50 values of above 0.176 mg L-1 for epoxiconazole and 0.0 mg L-1 for metconazole,Orange = moderately sensitive: log10EC50 values between sensitive and insensitive.

66
Figure 3.3 Sensitivity, measured as log10EC50 mg L-1, to epoxiconazole (top) and metconazole(bottom) of isolates in all CYP51 variants. CYP51 variants with one isolate only have a singledash with no box & whisker. For CYP51 variants with more than one isolate, the line throughthe box represents the median, and x represents an outlier. See Table 3.3 for CYP51 variantdetails. Sensitivity categories: sensitive; as log10EC50 values of below -0.3 mg L-1 forepoxiconazole and -0.523 mg L-1 for metconazole, insensitive; as log10EC50 values of above 0.176mg L-1 for epoxiconazole and 0.0 mg L-1 for metconazole, and moderately sensitive: log10EC50
values between sensitive and insensitive

67
Figure 3.4 Sensitivity to epoxiconazole (top) and metconazole (bottom) of isolates in CYP51variants, split into groups with (a) and without (b) the ~800 bp insertion. CYP51 variants withonly one isolate have no box & whisker. For CYP51 variants with more than one isolate, the linethrough the box represents the median, and x represents an outlier. See Table 3.3 for CYP51variant details

68
3.3.3 Effect of location on amino-acid and insert frequencies, and genetic diversity
There were significant associations between the frequency of some amino-acid
alterations/inserts and geographic location (Table 3.4). The S188N, N513K and ΔY459/G460
alterations varied in frequency patterns between sites in a similar way, all three were seen
most frequently at Killeagh and Stamullen, and least frequently at Duleek. Patterns of
frequency of Y461S and S524T were also similar; they were seen most frequently at Duleek
and least frequently at Killeagh. I381V was mostly found at Killeagh and was found least
often at Duleek. V136A was found most frequently at Duleek and least frequently at
Stamullen. The 120 bp insert was found at four sites with the highest frequency at Stamullen
(n = 25) and the lowest at Oak Park (n = 1). The ~800 bp insert however was found least
frequently at Stamullen and most frequently at Killeagh and Knockbeg.
High levels of genotypic diversity were seen at each geographic location (Table 3.5).
Between 15 and 20 CYP51 variants were found at each geographic location (Table 3.5), many
of which were common between locations (Table 3.6). Killeagh had the least CYP51 variant
diversity, followed by Stamullen, with the remaining four locations having higher and similar
levels of CYP51 variant diversity. Rarefaction analysis demonstrated that the pattern of
CYP51 variant diversity between locations would have been similar if sample sizes were
equal (Table 3.5). Genetic differentiation between locations was low, with Gst values of
between 0.001 and 0.07 (Table 3.7), and equivalent gene flow between locations was
therefore high, Nm of between 3 and 127 (Table 3.7). Gene flow was highest between Oak
Park and Knockbeg (Nm = 127) and lowest between Killeagh and Duleek/Julienstown (Nm =
3).
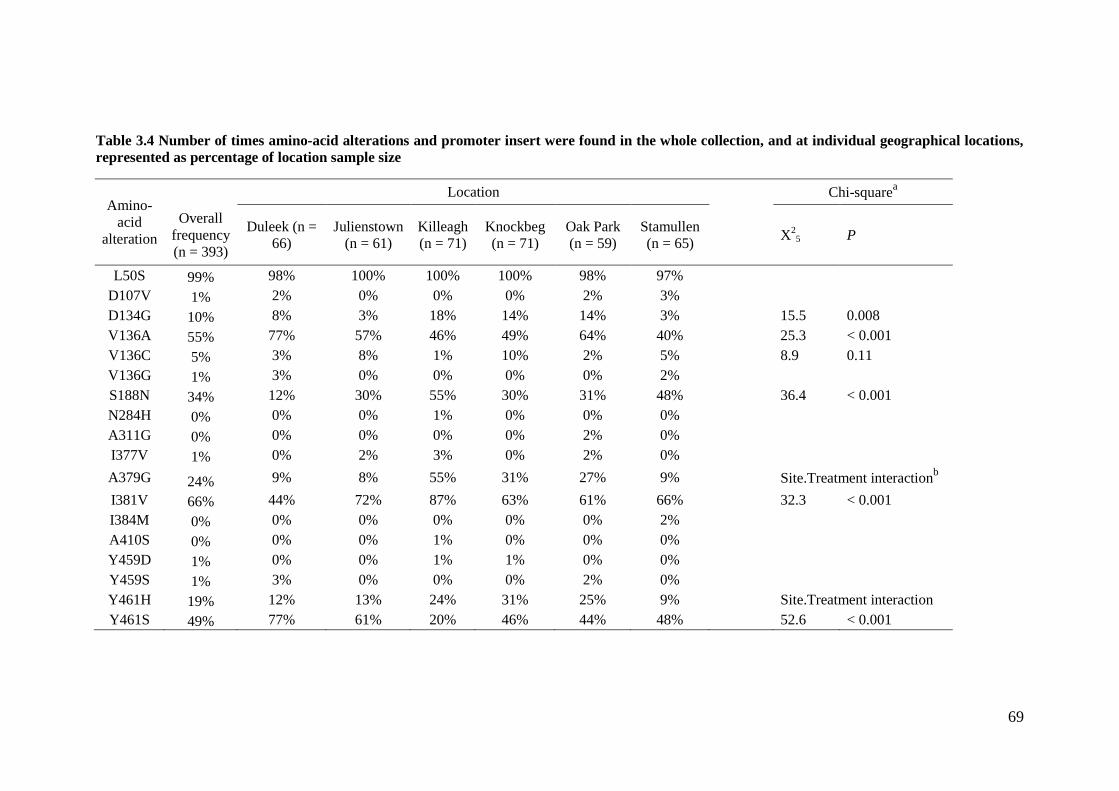
69
Table 3.4 Number of times amino-acid alterations and promoter insert were found in the whole collection, and at individual geographical locations,represented as percentage of location sample size
Amino-acid
alteration
Location Chi-squarea
Overallfrequency(n = 393)
Duleek (n =66)
Julienstown(n = 61)
Killeagh(n = 71)
Knockbeg(n = 71)
Oak Park(n = 59)
Stamullen(n = 65)
X25 P
L50S 99% 98% 100% 100% 100% 98% 97%
D107V 1% 2% 0% 0% 0% 2% 3%
D134G 10% 8% 3% 18% 14% 14% 3% 15.5 0.008
V136A 55% 77% 57% 46% 49% 64% 40% 25.3 < 0.001
V136C 5% 3% 8% 1% 10% 2% 5% 8.9 0.11
V136G 1% 3% 0% 0% 0% 0% 2%
S188N 34% 12% 30% 55% 30% 31% 48% 36.4 < 0.001
N284H 0% 0% 0% 1% 0% 0% 0%
A311G 0% 0% 0% 0% 0% 2% 0%
I377V 1% 0% 2% 3% 0% 2% 0%
A379G 24% 9% 8% 55% 31% 27% 9% Site.Treatment interactionb
I381V 66% 44% 72% 87% 63% 61% 66% 32.3 < 0.001
I384M 0% 0% 0% 0% 0% 0% 2%
A410S 0% 0% 0% 1% 0% 0% 0%
Y459D 1% 0% 0% 1% 1% 0% 0%
Y459S 1% 3% 0% 0% 0% 2% 0%
Y461H 19% 12% 13% 24% 31% 25% 9% Site.Treatment interaction
Y461S 49% 77% 61% 20% 46% 44% 48% 52.6 < 0.001

70
Table 3.4 cont.
Amino-acid
alteration
Location Chi-squarea
Overallfrequency
Duleek(n = 66)
Julienstown(n = 61)
Killeagh(n = 71)
Knockbeg(n = 71)
Oak Park(n = 59)
Stamullen(n = 65)
X25 P
Delc
29% 6% 26% 55% 21% 27% 38% 48.2 < 0.001
V490L 1% 0% 0% 0% 3% 2% 0%
N513K 26% 6% 23% 44% 21% 24% 37% 33.4 < 0.001
S524T 54% 79% 61% 35% 46% 56% 51% 30.8 < 0.001
120 bp 11% 8% 20% 0% 0% 2% 38% 78.3 < 0.001
~300 bp 0% 0% 0% 1% 0% 0% 0%
~800 bp 39% 17% 34% 66% 55% 44% 14% 68 < 0.001aThe Chi square statistic shows the P-value for the association between the locations sampled and the occurrence of the more common amino-acid alterations and promoterinserts in Zymospetoria tritici isolatesbThe site.treatment interaction highlights the amino-acid alterations/promoter inserts where the chi square results for the associations with treatments (Table 3.8) differedsignificantly between locationscDel = ΔY459/G460

71
Table 3.5 Summary statistics of molecular diversity found at the CYP51 gene in Zymoseptoriatritici isolates collected from six different geographical locations
Location N S h Hd SS NSS* Var RareFn NSS/SS
Duleek 66 42 54 0.803 25 14 Del 20 19 0.56
Knockbeg 71 35 24 0.915 19 13 Del 20 17 0.68
Stamullen 65 39 17 0.851 22 14 Del 16 15 0.63
Julienstown 61 34 18 0.855 19 12 Del 18 17 0.63
Killeagh 71 36 17 0.807 18 15 Del 15 13 0.83
Oak Park 59 41 19 0.855 21 16 Del 19 19 0.76N = sample sizeS = number of segregating (polymorphic) sites (incl 6 bp deletion)h = number of nucleotide haplotypesHd = haplotype diversitySS = number of synonymous substitutionsNSS * = number of non-synonymous substitutions and deletionVar = actual number of CYP51 variantsRareFn: Potential numbers of CYP51 variants if all sample sizes were equal to the smallest current sample size
Table 3.6 Proportion of common haplotypes between geographic location, and uniquehaplotypes within geographic location (in bold numbers)
Location Duleek Knockbeg Stamullen Julienstown Killeagh Oak Park
Duleek 0.24
Knockbeg 0.65 0.3
Stamullen 0.65 0.45 0.25
Julienstown 0.53 0.56 0.5 0.33
Killeagh 0.41 0.6 0.47 0.44 0.27
Oak Park 0.71 0.45 0.47 0.56 0.67 0.21
Table 3.7 Pairwise comparisons of gene flow (Nm) (above the diagonal) and populationdifferentiation (Gst) (below the diagonal) in the Zymoseptoria tritici populations from the sixgeographic locations
Location Duleek Knockbeg Stamullen Killeagh Julienstown Oak Park
Duleek * 8 8 3 8 17
Knockbeg 0.03 * 7 15 7 127
Stamullen 0.03 0.03 * 3 35 8
Killeagh 0.07 0.02 0.07 * 4 11
Julienstown 0.03 0.03 0.007 0.06 * 7
Oak Park 0.01 0.001 0.03 0.02 0.03 *

72
3.3.4 Effect of treatment on amino-acid and insert frequencies and genetic diversity
Although the isolates studied were selected based on sensitivity within site-treatment
collections, and so it is a non-random sample, it is worth noting the following observations.
In comparison to the pre-treatment collection, the S188N, N513K and ΔY459/G460
alterations were found more commonly after the metconazole and mixture treatments, but less
often after epoxiconazole. The S524T and D134G alterations increased in frequency after the
epoxiconazole and mixture treatments but decreased after metconazole. Y461S decreased
after the metconazole and mixture treatments but stayed the same after epoxiconazole.
V136A increased after epoxiconazole and the mixture but decreased after metconazole (Table
3.8). I381V increased after all treatments, but more so after the mixture. The 120 bp insert
increased after the mixture and metconazole treatments and the ~800 bp increased after all
treatments, but mostly after the mixture. The frequency of A379G and Y461H alterations
were different after each treatment depending on the location. In Killeagh and Knockbeg,
where the A379G and Y461H alterations were more common than at other locations, A379G
was more frequent after the metconazole and mixture treatments and Y461H was most
frequently found after the epoxiconazole treatment.
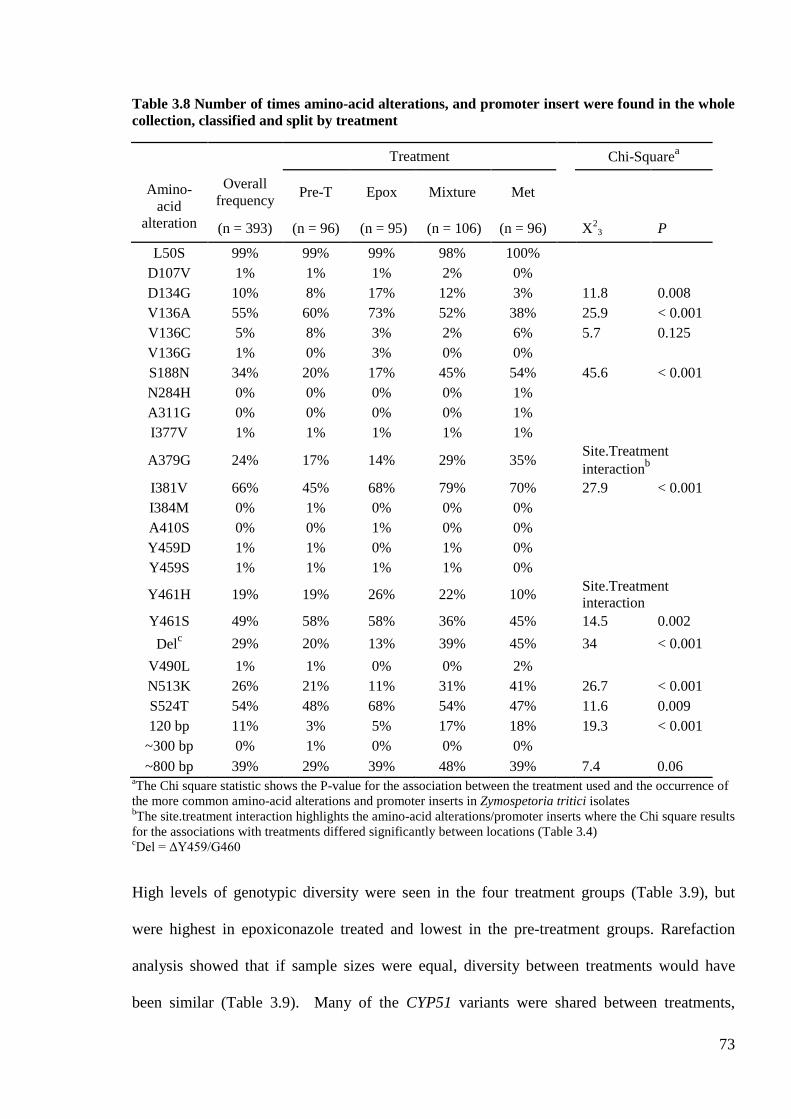
73
Table 3.8 Number of times amino-acid alterations, and promoter insert were found in the wholecollection, classified and split by treatment
Treatment Chi-Squarea
Amino-acid
alteration
Overallfrequency
Pre-T Epox Mixture Met
(n = 393) (n = 96) (n = 95) (n = 106) (n = 96) X23 P
L50S 99% 99% 99% 98% 100%
D107V 1% 1% 1% 2% 0%
D134G 10% 8% 17% 12% 3% 11.8 0.008
V136A 55% 60% 73% 52% 38% 25.9 < 0.001
V136C 5% 8% 3% 2% 6% 5.7 0.125
V136G 1% 0% 3% 0% 0%
S188N 34% 20% 17% 45% 54% 45.6 < 0.001
N284H 0% 0% 0% 0% 1%
A311G 0% 0% 0% 0% 1%
I377V 1% 1% 1% 1% 1%
A379G 24% 17% 14% 29% 35%Site.Treatmentinteraction
b
I381V 66% 45% 68% 79% 70% 27.9 < 0.001
I384M 0% 1% 0% 0% 0%
A410S 0% 0% 1% 0% 0%
Y459D 1% 1% 0% 1% 0%
Y459S 1% 1% 1% 1% 0%
Y461H 19% 19% 26% 22% 10%Site.Treatmentinteraction
Y461S 49% 58% 58% 36% 45% 14.5 0.002
Delc 29% 20% 13% 39% 45% 34 < 0.001
V490L 1% 1% 0% 0% 2%
N513K 26% 21% 11% 31% 41% 26.7 < 0.001
S524T 54% 48% 68% 54% 47% 11.6 0.009
120 bp 11% 3% 5% 17% 18% 19.3 < 0.001
~300 bp 0% 1% 0% 0% 0%
~800 bp 39% 29% 39% 48% 39% 7.4 0.06aThe Chi square statistic shows the P-value for the association between the treatment used and the occurrence ofthe more common amino-acid alterations and promoter inserts in Zymospetoria tritici isolatesbThe site.treatment interaction highlights the amino-acid alterations/promoter inserts where the Chi square resultsfor the associations with treatments differed significantly between locations (Table 3.4)cDel = ΔY459/G460
High levels of genotypic diversity were seen in the four treatment groups (Table 3.9), but
were highest in epoxiconazole treated and lowest in the pre-treatment groups. Rarefaction
analysis showed that if sample sizes were equal, diversity between treatments would have
been similar (Table 3.9). Many of the CYP51 variants were shared between treatments,
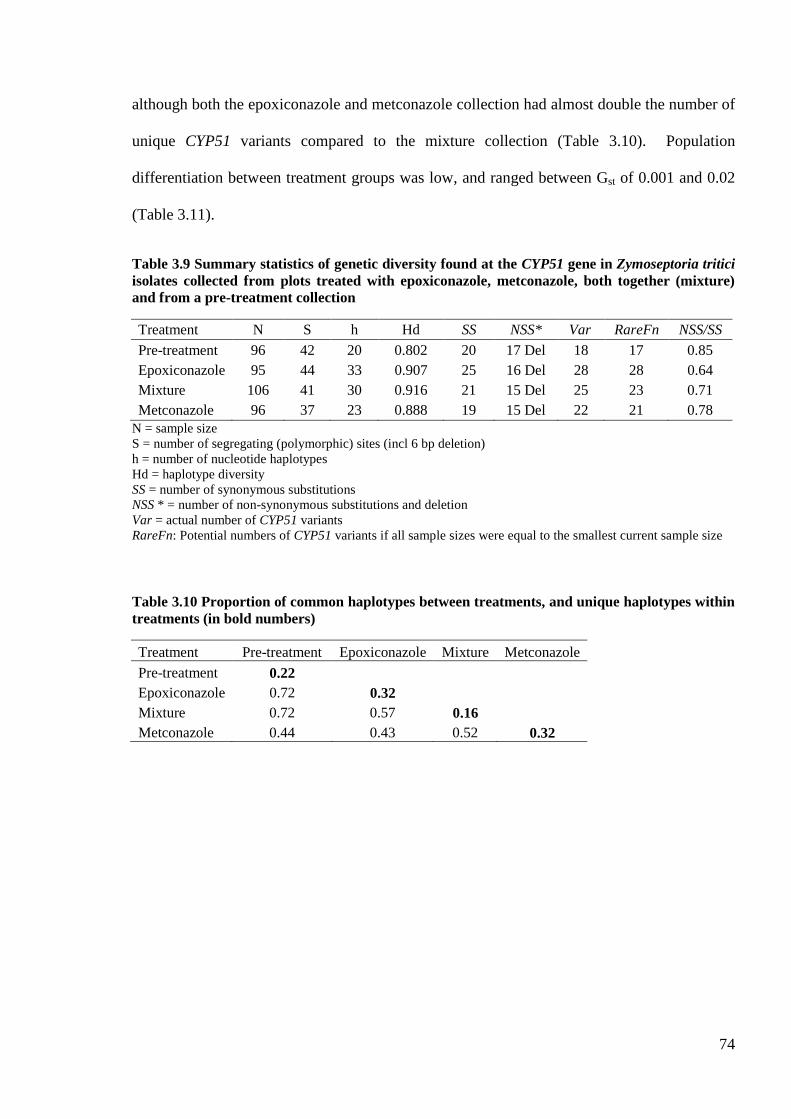
74
although both the epoxiconazole and metconazole collection had almost double the number of
unique CYP51 variants compared to the mixture collection (Table 3.10). Population
differentiation between treatment groups was low, and ranged between Gst of 0.001 and 0.02
(Table 3.11).
Table 3.9 Summary statistics of genetic diversity found at the CYP51 gene in Zymoseptoria triticiisolates collected from plots treated with epoxiconazole, metconazole, both together (mixture)and from a pre-treatment collection
Treatment N S h Hd SS NSS* Var RareFn NSS/SS
Pre-treatment 96 42 20 0.802 20 17 Del 18 17 0.85
Epoxiconazole 95 44 33 0.907 25 16 Del 28 28 0.64
Mixture 106 41 30 0.916 21 15 Del 25 23 0.71
Metconazole 96 37 23 0.888 19 15 Del 22 21 0.78N = sample sizeS = number of segregating (polymorphic) sites (incl 6 bp deletion)h = number of nucleotide haplotypesHd = haplotype diversitySS = number of synonymous substitutionsNSS * = number of non-synonymous substitutions and deletionVar = actual number of CYP51 variantsRareFn: Potential numbers of CYP51 variants if all sample sizes were equal to the smallest current sample size
Table 3.10 Proportion of common haplotypes between treatments, and unique haplotypes withintreatments (in bold numbers)
Treatment Pre-treatment Epoxiconazole Mixture Metconazole
Pre-treatment 0.22
Epoxiconazole 0.72 0.32
Mixture 0.72 0.57 0.16
Metconazole 0.44 0.43 0.52 0.32

75
Table 3.11 Pairwise comparisons population differentiation (Gst) in the Zymoseptoria triticipopulations from each of the four treatments (averaged over all locations)
Treatment Pre-treatment Epoxiconazole Mixture Metconazole
Pre-treatment *
Epoxiconazole 0.02 *
Mixture 0.02 0.005 *
Metconazole 0.01 0.01 0.001 *
3.3.5 Effect of individual amino-acid alterations on sensitivity
A general linear regression model was used to extract significant effects of alterations and
interactions on epoxcionazole and metconazole sensitivity (Table 3.12). Changes at the V136
position, the I381V position, a deletion at Y459/G460 and an insert in the CYP51 promoter
region all decreased epoxiconazole sensitivity. S188N interacted with I381V to decrease
sensitivity to epoxiconazole. Conversely, an increase in sensitivity to epoxiconazole was
noted if S188N was present with A379G, and in isolates where an insert and a rare alteration
were combined. For metconazole sensitivity, the S188N mutation, ΔY459/G460 and an insert
in the promoter region, in addition to the interaction between S524T and I381V, all decreased
sensitivity. The S188N mutation also interacted with A379G to increase sensitivity to
metconazole. As no individual amino-acid alterations were found in isolation in the current
data set, combinations of amino-acid alterations (CYP51 variants) are the focus for the
remainder of the study.
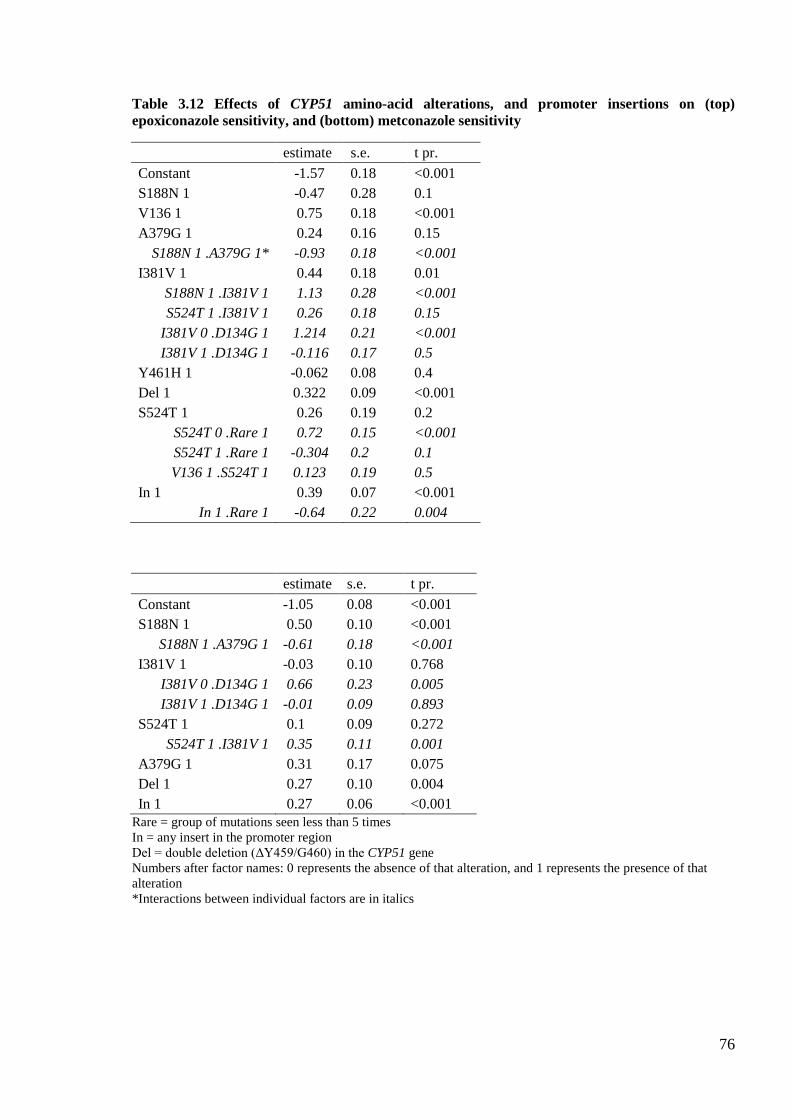
76
Table 3.12 Effects of CYP51 amino-acid alterations, and promoter insertions on (top)epoxiconazole sensitivity, and (bottom) metconazole sensitivity
estimate s.e. t pr.
Constant -1.57 0.18 <0.001
S188N 1 -0.47 0.28 0.1
V136 1 0.75 0.18 <0.001
A379G 1 0.24 0.16 0.15
S188N 1 .A379G 1* -0.93 0.18 <0.001
I381V 1 0.44 0.18 0.01
S188N 1 .I381V 1 1.13 0.28 <0.001
S524T 1 .I381V 1 0.26 0.18 0.15
I381V 0 .D134G 1 1.214 0.21 <0.001
I381V 1 .D134G 1 -0.116 0.17 0.5
Y461H 1 -0.062 0.08 0.4
Del 1 0.322 0.09 <0.001
S524T 1 0.26 0.19 0.2
S524T 0 .Rare 1 0.72 0.15 <0.001
S524T 1 .Rare 1 -0.304 0.2 0.1
V136 1 .S524T 1 0.123 0.19 0.5
In 1 0.39 0.07 <0.001
In 1 .Rare 1 -0.64 0.22 0.004
estimate s.e. t pr.
Constant -1.05 0.08 <0.001
S188N 1 0.50 0.10 <0.001
S188N 1 .A379G 1 -0.61 0.18 <0.001
I381V 1 -0.03 0.10 0.768
I381V 0 .D134G 1 0.66 0.23 0.005
I381V 1 .D134G 1 -0.01 0.09 0.893
S524T 1 0.1 0.09 0.272
S524T 1 .I381V 1 0.35 0.11 0.001
A379G 1 0.31 0.17 0.075
Del 1 0.27 0.10 0.004
In 1 0.27 0.06 <0.001Rare = group of mutations seen less than 5 timesIn = any insert in the promoter regionDel = double deletion (ΔY459/G460) in the CYP51 geneNumbers after factor names: 0 represents the absence of that alteration, and 1 represents the presence of thatalteration*Interactions between individual factors are in italics

77
3.3.6 Effect of treatment on frequencies of CYP51 variants
In comparison to the pre-treatment collection, changes in frequency of CYP51 variants after
treatments were apparent but not always statistically significant (Table 3.13). Significant
changes in frequency were seen in; CYP51 variant 11, where numbers were reduced after all
treatments; CYP51 variant 25 where numbers increased after the metconazole and mixture
treatments but remained unchanged after epoxiconazole: CYP51 variant 31, where a
significant increase was observed after the epoxiconazole treatment; and CYP51 variant 3,
where a reduction in frequency was seen after the epoxiconazole and mixture treatments.
CYP51 Variant 31 without the ~800 bp insert (31a) was seen much more frequently after
epoxiconazole treatment and CYP51 variant 4 with that insert (4b) was found significantly
less frequently after the mixture treatment (Table 3.13).

78
Table 3.13 Logistic regression results comparing the relationship between treatment and the frequency of the more frequent (n > 10) CYP51 variants
Frequency of CYP51 varianta
Insertb
Treatment n 3 4 11 22 25 31 32 35 4b 31a 31b 35a 35b
Control 96 8.1 7.1 39.1 8.1 3.1 3.1 2.1 13.1 7.1 3.1 0.1 5.1 8.1
Epox 95 1.1* 2.1 20.1** 11.1 2.1 20.1*** 8.1 6.1 1.1 13.1* 7.1 2.1 4.1
Mixture 106 1.1* 2.1 18.1*** 11.1 16.1** 11.1 4.1 13.1 1.1* 3.1 8.1 5.1 8.1
Met 97 6.1 2.1 20.1** 3.1 13.1* 7.1 2.1 20.1 2.1 4.1 3.1 7.1 13.1
Chi-sq pr. 0.01 0.155 <0.001 0.1 <0.001 <0.001 0.1 0.03 0.04 0.008 0.008 0.4 0.15a In order to be able to include an analysis of the CYP51 variants with and without the ~800 bp insert (one CYP51 variant was not observed in the pre-treatment collection)data were transformed by adding 0.1b CYP51 variants which had individual isolates with and without the ~800 bp insert in large enough numbers to allow statistical analysisn = total sample size per treatment. Control = pre-treatment collection* represents the level of contribution of each treatment to the relevant Chi-sq result. * Significant to P = 0.05; ** Significant to P = 0.01 ;*** Significant to P < 0.001

79
3.3.7 Evolutionary history of the whole collection
Intragenic recombination in Z. tritici populations is a distinct possibility (Brunner et al.,
2008). The presence of recombination will bias the reconstructed ML tree (Arenas & Posada,
2010), hence evidence of potential recombination was sought. The median-joining network
(Figure 3.5) highlighted numerous reticulations, which are evidence of homoplasy due to
either independent mutation events or intragenic recombination (Brunner et al., 2008).
Figure 3.5 Phylogenetic relationship between 61 (+ ST1) haplotypes in a median-joining networkused to highlight the high number of reticulations (thick lines) in the population. Yellow circleseach represent a single nucleotide haplotype, and circle size is proportional to number of isolateswith that haplotype. Red circles represent median vectors (hypothetical haplotypes)
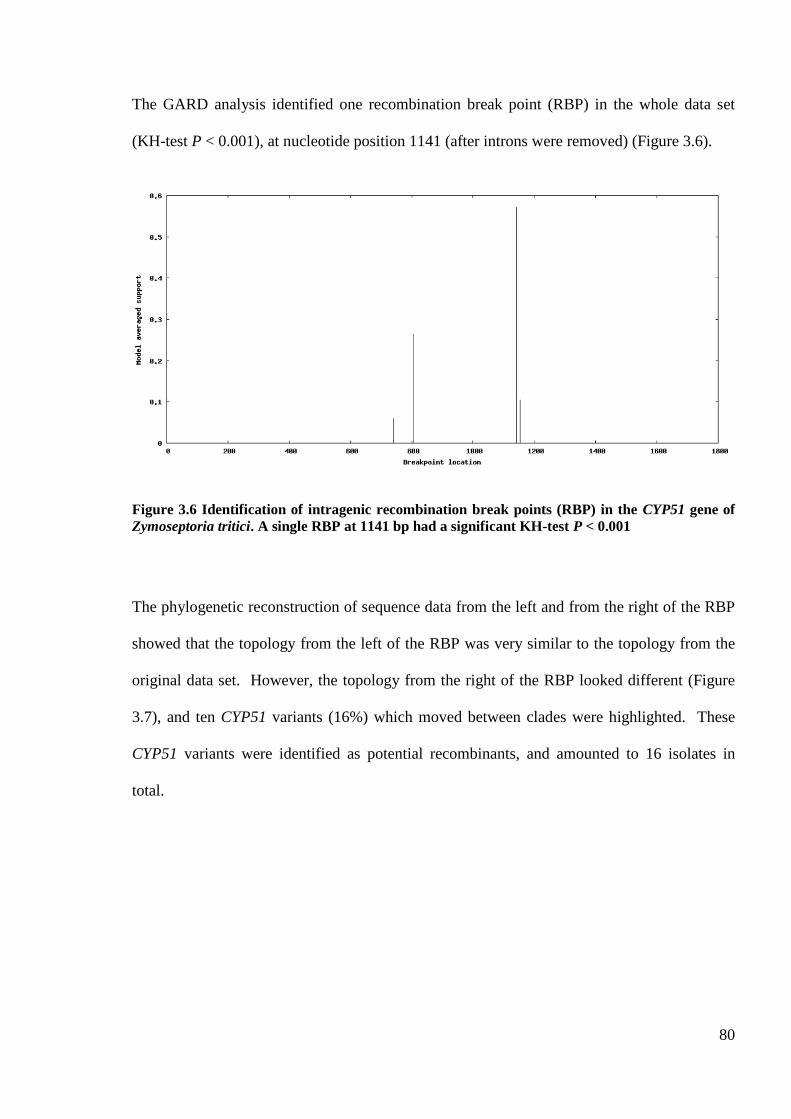
80
The GARD analysis identified one recombination break point (RBP) in the whole data set
(KH-test P < 0.001), at nucleotide position 1141 (after introns were removed) (Figure 3.6).
Figure 3.6 Identification of intragenic recombination break points (RBP) in the CYP51 gene ofZymoseptoria tritici. A single RBP at 1141 bp had a significant KH-test P < 0.001
The phylogenetic reconstruction of sequence data from the left and from the right of the RBP
showed that the topology from the left of the RBP was very similar to the topology from the
original data set. However, the topology from the right of the RBP looked different (Figure
3.7), and ten CYP51 variants (16%) which moved between clades were highlighted. These
CYP51 variants were identified as potential recombinants, and amounted to 16 isolates in
total.

81
Figure 3.7 Reconstruction of phylogenetic trees. Branches with bootstrap values of 70 or greaterare labelled. Far left: the original data set, prior to the removal of recombinants. Middle: datafrom the left of the recombination break point. Right: data from the right of the recombinationbreak point
After the potential recombinant isolates/variants were removed from the data set, a new
maximum-likelihood tree was constructed (Figure 3.8). This tree also showed two distinct
groups, which were supported by 100% bootstrap value. CYP51 variants possessing most of
the more common amino-acid alterations, L50S, I381V, V136A/C, S524T, Y461S, and
A379G, were present in both clades. Some alterations were found only in one clade; Clade A:
D134G, V136G, A311G, I377V, Y459S/D, and V490L; Clade B: S188N, N513K and
ΔY459/G460, N284H, I384M and A410S. The amino-acid mutation S188N was common
among all CYP51 variants in Clade B. CYP51 variants with the 120 bp insert also fell into
Clade B only, but the ~800 bp insert was found in both clades (Figure 3.8).

82
Figure 3.8 After potential recombinants were removed: un-rooted phylogenetic analysis usingMaximum Likelihood method. The tree with the highest log likelihood (-2963.8) is shown. Theanalysis involved 52 nucleotide haplotypes, which included sequence data from the wild-typeST1. There were a total of 1635 positions in the final dataset. Branches with bootstrap values of70 or greater are labelled. Branch labels: in parenthesis the nucleotide haplotype name; theindividual CYP51 alterations in each CYP51 variant; outside the square bracket is the CYP51variant name as in Table 3.3 (some CYP51 variants are present in more than one nucleotidehaplotype). The symbol at the beginning of branch labels represents the presence or absence ofthe ~800 bp insert in the nucleotide haplotype: no symbol = no insert; triangle = some isolateshave and some isolates have no insert; square = all isolates have the insert; circle = all except onehas the insert, and the final isolate has the ~300 bp insert. Grey bars to the right cover brancheswhere the 120 bp insert is present; CYP51 variants 25, 1, 13, 14 and 26
Clade A
Clade B

83
Figure 3.9 Phylogenetic tree, excluding recombinants, highlighting epoxiconazole andmetconazole sensitivity (log10EC50 mg L-1) groups. Epoxiconazole sensitivity (left): white spots =< -0.3; black spot = > 0.176, grey spot = between -0.3 and 0.176. Metconazole sensitivity (right)white spots = < -0.523; black spot = > 0.0, grey spot = between -0.523 and 0.0
Clade A Clade A
Clade B Clade B

84
3.4 Discussion
In the populations analysed here, wild-type strains were absent, and the population was very
diverse. In total, 49 different CYP51 variants, 55 when the inserts in the promoter region are
included, were identified. V136A and Y461S were still the most commonly found alterations
in populations prior to treatment, although both have declined in frequency since the study
done by Kildea (2009), and V136A + Y461S + S524T is still the most common CYP51
variant as found by Kildea (2009). A substantial increase in the frequency of the I381V and
S524T mutations has taken place since the work done by Kildea (2009), and current levels of
the V136A + I381V combination are higher than those shown in Kildea et al. (2014). As
well as two new mutations and the many CYP51 variants seen, ten of which have accumulated
seven or more CYP51 alterations, the current populations also contained three different size
inserts in the promoter, one which has not been reported previously.
Previous workers have demonstrated the effects of individual amino-acid alterations
on sensitivity and protein function using heterologous expression (Cools et al., 2010, Cools et
al., 2011), and on protein structure using molecular modelling (Mullins et al., 2011). Similar
studies were beyond the scope of this work, but using regression analysis, a number of amino-
acid alterations and some combinations of alterations which affected epoxiconazole and
metconazole sensitivity were identified. As demonstrated in previous studies (Leroux et al.,
2007, Cools et al., 2010, Cools et al., 2011, Leroux & Walker, 2011), some combinations of
amino-acid alterations, with or without other mechanisms, had greater effects on azole
sensitivity than others. Thus, the effect of each CYP51 variant on sensitivity to different
azoles depends on the details of the variant, i.e. an additional mutation may make a CYP51
variant more or less sensitive depending on the other mutations in that variant.

85
A general decrease in sensitivity was associated with an increase in the number of
alterations in the CYP51 variants, as has been shown previously (Leroux et al., 2007).
Isolates from two of the more frequent CYP51 variants which had only accumulated three
alterations (variants 3 and 4) were mostly sensitive (Figure 3.3) to both epoxiconazole and
metconazole. The most common CYP51 variant in this collection (variant 11) was, on
average, sensitive to both epoxiconazole and metconazole, and arose from the addition of
S524T to the even more sensitive variant 2, L50S, V136A and Y461S. The further
accumulation of alterations to this CYP51 variant, first I381V (variant 31) which has
previously been reported (Cools et al., 2011, Leroux & Walker, 2011, Buitrago et al., 2014),
then A379G (variant 38) and finally D134G (variant 40), had the effect of reducing sensitivity
to both fungicides, although having more of an impact on epoxiconazole.
Even though I381V has been associated with the increase in strains with reduced azole
sensitivity in recent years (Cools et al., 2010), it was present here in many CYP51 variants (~
70%) spread throughout the range of phenotypes, sensitive as well as less sensitive. On its
own, I381V is deleterious, but an alteration at the 459-461 coding positions partially restores
the protein function (Cools et al., 2010). Leroux et al. (2007) found that TriR6 variants,
I381V + mutation at 459-461, predominant in Europe since monitoring began (Stammler et
al., 2008, Stammler & Semar, 2011), were more sensitive to metconazole than epoxiconazole,
but the TriR7 variants, I381V + ΔY459/G460, affected epoxiconazole and metconazole
sensitivity in a similar manner. In contrast, isolates studied by Cools et al. (2012), which had
I381V + ΔY459/G460 plus S188N and N513K, were selected for more by metconazole than
by epoxiconazole. In Ireland, I381V + alteration at 459-461 has been less prevalent
(Stammler & Semar, 2011) until recently, and in this work has been mostly found in
combination with other alterations, which have varying effects on fungicides (Table 3.3).

86
This change in frequency of particular CYP51 alterations probably reflects changes in
fungicide usage patterns over time.
CYP51 variants which had both the V136A and I381V alterations were generally less
sensitive to epoxiconazole than metconazole. Previously, strains with the V136A alteration
have been shown to remain sensitive to metconazole (Kildea, 2009) and tebuconazole (Cools
et al., 2011), while sensitivity to epoxiconazole and other azoles such as prothioconazole and
prochloraz tend to decrease in its presence (Cools et al., 2011). Hence, it is possible that the
occurrence of the V136A alteration creates a barrier to reduced metconazole sensitivity in
these and other CYP51 variants: either, isolates with the V136A mutation are sensitive to
metconazole and so it works even though these CYP51 variants are common, or it is possible
that further changes are necessary for V136A to be able to affect the metconazole binding
position in order to have an effect on sensitivity. Indeed, in this collection, the addition of
S524T to that combination tended to decrease sensitivity to both fungicides, in agreement
with Cools et al. (2011) who found that S524T reduced sensitivity to all azoles tested (they
did not include metconazole). Even so, amongst the eight CYP51 variants with those three
alterations, only a single CYP51 variant, L50S, V136A, A379G, I381V, Y461S, S524T (variant
38) was metconazole insensitive. It is possible that the A379G mutation, which was always
found with I381V in this collection, and which was selected strongly by the metconazole and
mixture treatments, reduces sensitivity to metconazole even in the presence of V136A.
CYP51 variants with an insert in the putative CYP51 promoter had varying effects on
azole sensitivity (Table 3.3 and Figure 3.3), but in CYP51 variants which were found
frequently (n > 10), the presence of either the 120 bp or ~800 bp inserts reduced sensitivity to
both fungicides, in agreement with Cools et al. (2012), Chassot et al. (2008) and Buitrago et
al. (2014), but conflicting with Kildea (2009) and Leroux and Walker (2011). Cools et al.
(2012) found an association between a 120 bp insert in the promoter and CYP51 over-

87
expression in Z. tritici isolates with reduced sensitivity. Prior to that finding, over-expression
of the target gene had been shown to contribute to reduced DMI sensitivity in numerous other
plant pathogens: Ventura inaequalis (Schnabel & Jones, 2001), Penecillium digitatum
(Hamamoto et al., 2000), Blumeriella jaapii (Ma et al., 2006), Cercospora beticola (Nikou et
al., 2009) and Monilinia fucticola (Luo & Schnabel, 2008). While Chassot et al. (2008)
inferred that a large insert of ~1000 bp was associated with over-expression of the Z. tritici
CYP51 gene, Leroux and Walker (2011) did not make the same connection. Further analysis
of the putative CYP51 promoter region is needed to confirm if these large inserts are
associated with CYP51 over-expression.
The population prior to fungicide application, from which selection could take place,
was genetically very diverse, with many amino-acid alterations and CYP51 variants present.
In comparison to the pre-treatment collection, solo fungicide treatments were seen to select
specific mutations, a feature of azole fungicides which has been highlighted previously. But
whilst solo epoxiconazole and metconazole selected the D134G, V136A, S188N, A379G,
Y461H, ΔY459/G460, N513K and S524T alterations differentially, selection for these
alterations by the mixture was mostly positive, and neutral in one case. In addition, the
frequency of I381V, which was positively selected by all fungicides, almost doubled after the
mixture. In the same way, CYP51 variants which were selected differentially by the solo
epoxiconazole and metconazole treatments were also mostly positively selected by the
mixture. The observed selection for amino-acid alterations/variants was in agreement with
sensitivity data for all three fungicide treatments, as seen in Chapter 2. In that chapter, when
EC50 values were compared, cross-resistance between the epoxiconazole applied alone and the
metconazole applied alone was observed, but not complete. However, the mixture reduced
sensitivity to both fungicides. When mixing two fungicides as an anti-resistance tactic, it is
expected that each component of the mixture would negatively select isolates which have

88
been positively selected by the other component, therefore reducing final selection by each
component and maintaining sensitivity. In this case, the mixture positively selected most
CYP51 variants and little negative selection took place, indicating that this specific mixture of
metconazole and epoxiconazole increases the selection for CYP51 variants with reduced azole
sensitivity.
A single alteration can affect the protein in different ways. It may have little direct
effect on the function of the protein, it might be a direct mutation of a key residue or it could
change the structure of the protein which moves a residue out of reach of an azole (Mullins et
al., 2011). When an amino-acid change does affect protein function it can result in a reduced
azole binding affinity or a loss of azole accommodation in the active site (Mullins et al.,
2011). Multiple alterations together may either further reduce sensitivity or may act in a
compensatory capacity. Two of the amino-acid alterations known to affect azole sensitivity,
V136A and I381V, have been shown to be deleterious when found in isolation; only when
they arose in isolates which already had other specific alterations could they affect sensitivity
(Cools et al., 2010, Cools et al., 2011). Those other alterations, in this case, a mutation or
deletion at 459-461 coding positions, could be considered to be compensatory, i.e. they
restore or improve the function of CYP51 variants which otherwise would have low fitness
(Mullins et al., 2011). Indeed, changes at the 459-461 positions appear to be essential for
other alterations which reduce azole sensitivity (Buitrago et al., 2014). In a similar manner,
the absence of a CYP51 variant with the V136A and I381V alterations together in earlier
populations may have been due to structural constraints in the protein which would have
limited the accumulation of those alterations (Cools & Fraaije, 2008). If this were the case,
compensatory mutations may have had a role to play in the appearance of this, and possibly
other combinations.

89
The S524T alteration, identified retrospectively in isolates from as early as 2001 and
in combination with the now rare Y137F (Cools et al., 2011), re-emerged in isolates from
2006 (Kildea et al., 2014), and is presently found in many CYP51 variants spread throughout
Ireland and Europe (Buitrago et al., 2014, Kildea et al., 2014). Cools et al. (2011) showed
that in a CYP51 variant with L50S, D134G, V136A and Y461S, the S524T mutation had the
effect of opening up the binding cavity, which removed residues from the immediate vicinity
of the epoxiconazole bound ligand, which led to reduced azole binding and loss of efficacy.
Mullins et al. (2011) propose that this is a feasible evolutionary solution to azole inhibition;
accommodating the larger azole molecules but reducing their activity, while restricting the
structural rearrangements to maintain the integrity of the enzyme. They also showed that this
alteration reduced sensitivity to all fungicides tested. It is possible that the S524T mutation
may have facilitated the continued accumulation of alterations, i.e. acted as a compensatory
mutation.
In some CYP51 variants, e.g. variants 31 and 35, where a broad range in sensitivity
was observed, differences in the putative promoter region (the presence of a ~800 bp insert) is
likely to have contributed to these differences in sensitivity. However, in CYP51 variants
where no inserts in the promoter were identified, e.g. variant 11, where EC50 values of
individual isolates ranged from -2.2 to 0.74 (log10 mg L-1), alternative mechanisms may be
acting. Over-expression of drug efflux proteins is a possibility, and is the most frequently
documented mechanism for DMI resistance in Candida albicans (Leroux & Walker, 2011).
While Cools and Fraaije (2013) confirm that the potential for this mechanism to affect azole
resistance is there, over-expression of drug efflux proteins ATP-binding cassette (ABC) and
major facilitator superfamily (MFS) transporters have not been shown specifically as a DMI
resistance mechanism in Z. tritici. Leroux and Walker (2011) however, suggested that this
mechanism may be involved in observed multi-drug-resistant strains, and in a more recently

90
paper Fillinger et al. (2014) demonstrated that active efflux, probably caused by over-
expression of the membrane transporter gene MgMFS1, mediated multi-drug-resistance
(resistance to DMIs and SDHIs).
The high level of genetic diversity currently seen in the Z. tritici CYP51 gene in
Ireland is comparable to populations from other countries (Schnieder et al., 2001, Brunner et
al., 2008, Boukef et al., 2012, Drabešová et al., 2013, Estep et al., 2014). But how is this
diversity generated and dispersed? Mutations are the ultimate source of genetic diversity
(McDonald, 2004); when a mutation has a fitness benefit in the presence of a fungicide, it can
survive and reproduce, and under fungicide selection will eventually increase as a proportion
of the whole population. Knowledge of whether the specific mutations which confer a
decrease in azole sensitivity have emerged once and have been dispersed to different
geographic regions, or have emerged multiple times in different genetic backgrounds
(homoplasy) is important for understanding disease epidemiology and the evolution of
resistance (Brunner et al., 2008). Brunner et al. (2008) proposed that the multiple emergence
of a mutation into different genetic backgrounds is not likely in Z. tritici populations, given
the low likelihood of all alterations and combinations of alterations arising independently in
different regions. The high level of gene flow observed in this study, which is comparable to
other studies (Linde et al., 2002, Zhan et al., 2003, Zhan & McDonald, 2004), would certainly
facilitate the dispersal of an emerged CYP51 variant, and the current phylogenetic analysis
appears to provide evidence for such events. For example, S188N, N513K, ΔY459/G460 and
the 120 bp insert are only seen in clade B, demonstrating a common ancestral lineage. Even
so, extensive homoplasy was also observed, as evidenced by the multiple recurrences of the
V136A, I381V, Y461S and S524T alterations throughout the phylogeny. Brunner et al.
(2008) also found evidence of homoplasy, and in particular demonstrated that the I381V
mutation arose twice in different ancestral lineages. Identical alterations which are found in

91
different genetic backgrounds occur either through de novo (new) mutation events or through
intragenic recombination events. Brunner et al. (2008) made a strong case for the role of
intragenic recombination in the introduction of novel alleles into new genetic backgrounds,
which they feel contributed to the rapid evolution of Z. tritici populations. Intragenic
recombination was identified in the current study, but considering the high level of genetic
diversity, the number of potential recombinants found was relatively low. Only 16% of the
overall haplotype diversity were recombinants, which is comparable to the older European
populations before many of the mutations in the recent populations had in fact emerged
(Brunner et al., 2008). In order to be able to construct an undistorted evolutionary history of
the population (Schierup & Hein, 2000, Graham et al., 2005, Lemey & Posada, 2009), these
potential recombinants were removed from the analysis, after which there was still a
considerable level of homoplasy in the phylogeny. While it is possible that other intragenic
recombination events occurred but were not detected in this analysis, de novo mutations in
different genetic backgrounds are the most likely explanation for this high level of
homoplasy.
The split of this population into two clades has been previously observed by Leroux et
al. (2007) and Brunner et al. (2008), both of whom found one clade to be less sensitive to
azoles than the other. The current analysis demonstrates a somewhat similar result (Figure
3.9), with the more sensitive CYP51 variants found in Clade A, but seems to affect
metconazole more than epoxiconazole. Leroux et al. (2007) propose that these two clades are
separate genetic units, of which one is more naturally insensitive to DMIs. Further analysis is
needed to confirm the function of the two separate clades, and whether the clades in the
current work are related to those demonstrated previously.
In a recent review by Cools et al. (2013), the authors propose that the fitness costs and
trade-offs associated with azole resistance will mean that this group of fungicides is not likely

92
to succumb to complete field resistance in the near future. It has been hypothesised that there
are likely to be constraints on the number of alterations that the CYP51 gene can tolerate
while maintaining its basic functions (Mullins et al., 2011), but as we have seen in the recent
Z. tritici populations, for example with the V136A and I381V combination, compensatory
mechanisms could allow for the continued accrual of alterations, and until we see the
combinations, we do not know if they will happen. Even if there are constraints on the
accumulation of CYP51 alterations, the presence of other mechanisms which reduce azole
sensitivity, such as over-expression of the CYP51 gene, may fill that evolutionary gap. The
120 bp insert has only been reported in CYP51 variants with five or less amino-acid
alterations. Considering that it looks as though the number of amino-acid alterations in a
CYP51 variant has an effect on sensitivity, it would be of some concern if this 120 bp insert
were to recombine with some of the more evolved/insensitive CYP51 variants, especially if
insensitive variants which are also over-expressed have the potential to affect field efficacy of
all azoles (Cools et al., 2013). Additionally, the potential for over-expression of drug efflux
proteins to reduce azole sensitivity, although probably limited in practice (Cools et al., 2013),
could add to the ability of Z. tritici populations to respond to selection.
The increased amount of CYP51 variation in the current study compared to previous
studies demonstrates the continued evolution of the CYP51 gene. This evolution has been
driven by the continued use of azoles in general, but the results here suggest that using
mixtures of two azoles speeds up the process. Particularly, as the mixture seemed to select for
isolates with reduced sensitivity to both components. This is concerning as azole mixtures are
commonly used in winter wheat production and highlights the need to always add a fungicide
with a different mode-of-action when using azole mixtures. The complexity of the target
protein and fitness landscape (where populations are located on a landscape depending on the
genetic distance from each other (Kaplan, 2008)) of CYP51 variants has been demonstrated in

93
this chapter and it has become evident that tracking single CYP51 variants will not suffice to
predict field control, or more precisely, field control failure. We have seen that routes around
blocked pathways in an evolutionary landscape often exist and that regulatory sequences,
other than those already known, can profoundly affect phenotype. For example, the addition
of A379G to the V136A mutation may have restricted access of metconazole to the target,
reducing the ability of metconazole to work properly. On top of this, the probability that
selected codon changes have repeatedly evolved in different genetic backgrounds, and the
effect of intragenic recombination on accumulating resistance mechanisms; all of these factors
together are likely to ensure the continued evolution of azole insensitivity.

94
Chapter 4: Succinate dehydrogenase inhibitor fungicides and their effect on
baseline and treated Zymoseptoria tritici field isolates
4.1 Introduction
SDHIs are single-site inhibitors, like the azoles. The SDHI target site, succinate
dehydrogenase, is composed of four subunits, SdhA, SdhB, SdhC and SdhD, (Stammler et al.,
2011) of which the SdhB, SdhC and SdhD directly interact with the SDHI fungicides. They
inhibit the succinate dehydrogenase enzyme, which in turn disrupts the tricarboxylic acid
cycle (Scalliet et al., 2012), which is a key part of aerobic respiration. Resistance to SDHI
fungicides were initially thought to be conferred by mutations at one locus (Leroux et al.,
2011). That is, full resistance is possibly due to a single amino-acid change in the target
protein which does not need compensatory mutations to be fit enough to survive in the field.
Lab resistance (the level of reduction in sensitivity varied depending on the mutations) to the
different SDHIs has readily developed in mutagenesis studies (Skinner et al., 1998, Stammler
et al., 2011, Fraaije et al., 2012, Scalliet et al., 2012), demonstrating the potential for SDHI
resistance in this pathogen. And so some researchers therefore considered Z. tritici to be a
high risk of developing resistance (Fraaije et al., 2012). The aforementioned mutagenesis
studies all identified, amongst others, the histidine residue in SdhB at the 267 codon. The
SdhB subunit is highly conserved between species (Scalliet et al., 2011) and homologous
positions of the 267 codon in Z. tritici have been identified as resistance hotspots in field
resistant isolates of other pathogens (Avenot et al., 2008, Ishii et al., 2011, Veloukas et al.,
2013). This similarity in the target protein in several diverse pathogens suggests the same
change may have similar effects in Z. tritici field isolates. Field resistance towards the first
generation SDHI carboxin, and to the “oldest” of the newer SDHIs, boscalid, has been seen in
many pathogens (Sierotzki & Scalliet, 2013). While a few individual Z. tritici field isolates
have been found to have a slightly reduced sensitivity (but low resistance factors) to the

95
SDHIs (Anon, 2013b), one found in France and one in the UK in 2012 which had the SdhC
mutations T79N and W80S respectively, resistance is not yet (in 2014) evident in field
isolates of Z. tritici. Two additional mutations found in field isolates, N225H in the SdhB
subunit and N86S in the SdhC subunit, were cited in a subsequent report (Anon, 2015), but
not noted in the minutes of the most recent FRAC meeting (Anon, 2014d). The presence of
these multiple mutations suggests that a gradual loss of sensitivity in a step-wise manner is
also a possibility.
Knowledge of sensitivity levels in unexposed pathogen populations is essential to
identify early shifts in sensitivity; allowing timely adjustment of spray programmes and
avoiding loss of control in the field (Avenot & Michailides, 2010). Baseline studies can also
be used to determine levels of cross-resistance between active ingredients. Knowing if
fungicides are cross-resistant allows management plans to include differentially selecting
fungicides in programs. Cross-resistance between some SDHIs has been reported in some
pathogens but not in others, e.g. Avenot and Michailides (2010) found cross-resistance
between boscalid and penthiopyrad in Alternaria alternata, but Gudmestad et al. (2013) saw
no cross-resistance between the same two fungicides in A. solani. As SDHI activity (Scalliet
et al., 2011) and cross-resistance appear to be pathogen dependent, even though the target
gene is highly conserved between species, inferences from other studies should not be made
for Z. tritici.
In order to manage resistance, the ideal strategy may differ depending on the phase of
fungicide resistance the population is at (Van den Bosch et al., 2011). Currently the Irish Z.
tritici population is at different stages in the development of azole and SDHI resistance. With
azole insensitive Z. tritici strains now well established in most of north-western Europe, the
evolution of azole insensitivity is firmly in the selection, if not the adjustment phase.
Management must therefore focus on slowing the selection for insensitive isolates and where

96
necessary and possible, altering standard control programmes in order to maintain control.
SDHI insensitivity on the other hand has yet to emerge, so delaying the emergence of
resistance and monitoring the population to identify early changes are the main priorities.
Mixing fungicides with different modes-of-action is one approach to slowing the rate
of resistance evolution. This method exposes the strains resistant to one component to a
different mode-of-action, thereby reducing the rate of increase of those strains. Given the
potential for superior disease control and the additional benefits of delayed resistance
development, mixtures of fungicides are commonly used for STB control. Indeed, because of
the high-resistance risk, manufacturer recommendations state that SDHIs must always be used
in combination with other modes-of-action, and SDHI/azole mixtures are now commonly
used in wheat production. In the past, resistance management usually commenced after the
emergence of resistance (van den Bosch et al., 2014); hence most studies have focussed on
the selection phase and less on the emergence phase. Even so, Hobbelen et al., (2014)
concluded that strategies that are most effective at delaying the evolution of fungicide
resistance do not differ between the emergence and the selection phase. Empirical (Mavroeidi
& Shaw, 2006, Thygesen et al., 2009) and modelling studies (Birch & Shaw, 1997, Hobbelen
et al., 2011b, Hobbelen et al., 2013) have looked at the effects of mixing fungicides,
manipulating both dose and ingredients, as a way of managing fungicide resistance.
However, the effects of mixing two fungicides both at-risk of resistance - such as azoles and
SDHIs - are underrepresented in studies on mixtures (Hobbelen et al., 2013). Hobbelen et al.
(2013) predicted that mixing two at-risk fungicides increased the effective lives of both
fungicides compared to sequential use and concurrent use on neighbouring fields, particularly
so when strains insensitive to both components were at low initial frequencies.
The study reported here was initiated to establish baseline sensitivities and cross
resistance patterns to newly commercialised SDHI fungicides, in Irish Z. tritici populations.

97
Selection experiments were undertaken to determine the impact that mixing an azole and a
SDHI fungicide has on Z. tritici sensitivity to both fungicides. Field trials were conducted at
different locations through Ireland. Treatments were applied at both full and half the
recommended dose rates and the sensitivity of Z. tritici populations were monitored pre- and
post-treatment. Additionally, the sequences of the Sdh subunits typically involved in
resistance were determined in a sub-set of isolates from the baseline and selection experiment
collections; isolates were chosen based on their sensitivity to isopyrazam. The findings
presented and discussed provide the empirical data required to formulate strategies to prolong
the effectiveness of both azole and SDHI fungicides against STB.
4.2 Materials and methods
4.2.1 Origin of isolates
4.2.1.1 Baseline collection
A collection of 209 field isolates from the years 2005-2010 were used to determine the
baseline sensitivity to five of the newer SDHI fungicides, isopyrazam, bixafen, fluxapyraxad,
penthiopyrad and fluopyram, as well as to boscalid which has been in use since 2005. Isolates
came from commercial fields, representing 21 locations in Ireland, and four locations in the
UK for comparison. The UK isolates (Courtesy of J. Blake, ADAS) were collected in 2010
only.
4.2.1.2 Selection experiments- trial design, fungicide application and sampling
Field trials were conducted over two growing seasons between 2011 and 2013, at six
locations throughout Ireland (Table 4.1). All trials were laid out as complete randomised
block designs with four replicate blocks of six fungicide treatments and an un-treated control.
Plots were 2.5 m × 10 m with a 30-40 cm path between plots, and disease was allowed to
develop naturally. Fungicide treatments consisted of two foliar applications (referred to as T1

98
at GS 32-37 and T2 at GS 39-53 (Zadoks et al., 1974) depending on location) of the
fungicides epoxiconazole (Opus®, BASF) and isopyrazam (Zulu®, Syngenta) as solo a.i.s, and
together in a pre-formulated mixture (Seguris®, Syngenta), and at full and half the
recommended dose rates (Table 4.2). All fungicides were applied in 200 L/ha water using a
knapsack sprayer with compressed air. Each location was sampled prior to spraying in order
to determine the pre-treatment distribution of fungicide sensitivity. Approximately 50
diseased leaves were sampled at each location in 2012 and approximately 100 per location in
2013. At the sampling time after treatment (six weeks post T2), approximately 40 diseased
leaves were taken, regardless of disease severity, at roughly equal distances apart within each
plot, and avoiding ends and edges of plots. All leaves were air dried for five days at room
temperature and then stored at -20 °C awaiting pathogen isolation.

99
Table 4.1 Selection experiment: details of site location, year each location was included, date of fungicide applications and growth stage (GS) atwhich fungicides were applied, date of disease assessment and GS at that time
Location (Coordinates) Year CultivarResistance
rating a Date of T1GS b at
T1Date of
T2GS b at
T2Date of disease
assessmentGS at disease
assessment
Julienstown(53.679806, -6.309156)
2012 Cordiale 4 3rd May 33 29th May 39 26th June 73
Killeagh(51.940363, -8.026993)
2012 Einstein 5 2nd May 37 23rd May 45 25th June 73
Oak Park 1(52.863676, -6.914563)
2012 Cordiale 4 4th May 32 6th June 43 28th June 73
Drogheda(53.740894, -6.404514)
2013 Einstein 5 21st May 32 7th June 45 19th July 81
Midleton(51.823312, -8.168507)
2013 Cordiale 4 20th May 32 6th June 55 18th July 83
Oak Park2(52.863029, -6.915464)
2013 Cordiale 4 22nd May 37 5th June 49 11th July 79
a Resistant rating on a scale of 1-9, 1 = susceptible, 9 = resistant (DAFM https://www.agriculture.gov.ie/publications/2013/ )b GS Growth stage (Zadoks et al., 1974)

100
Table 4.2 Treatments used in the selection experiment: application pattern, dose rates applied, fungicides used amounts of active ingredient (a.i.) ateach treatment time with overall amount of active ingredient per treatment in parenthesis
Applicationpattern
Treatmentname a Dose b
Active ingredient (a.i.) appliedcLitres/ha applied at T1 & T2
(total a.i. applied) dT1 T2
Un-Treated Un-T 0 None None N/A (0 g)
Solo a.i. EE 1 Epoxiconazole Epoxiconazole 1.5 (249 g)
II 1 Isopyrazam Isopyrazam 1 (250 g)
ee 0.5 Epoxiconazole Epoxiconazole 0.75 (124.5 g)
ii 0.5 Isopyrazam Isopyrazam 0.5 (125 g)
Mixture EIEI 1Epoxiconazole& isopyrazam
Epoxiconazole& isopyrazam
1 (180g & 250g)
eiei 0.5Epoxiconazole& isopyrazam
Epoxiconazole& isopyrazam
0.5 (90g & 125g)
a Abbreviations denote the first and second sprays. Un-T= un-treated control; E or e: epoxiconazole; M or m: metconazole; uppercase: full dose; lowercase: half doseb Application dose at Treatment 1 and Treatment 2; 1 = the full label recommended dose, 0.5 = half the label recommended dosec Epoxiconazole = Opus® (product of BASF), isopyrazam = Zulu® (product of Syngenta), epoxiconazole + isopyrazam = Seguris® (product of Syngenta).d Active ingredient (a.i.) per litre of product; Opus: 83 g/l; Zulu: 125 g/l; Seguris: 90 g/l epoxiconazole + 125 g/l metconazole

101
4.2.2 Determination of fungicide sensitivity- baseline and selection experiment
4.2.2.1 Isolation of fungal isolates
Isolations were carried out according to Kildea (2009), as in Chapter 2. For the baseline
isolates, single-spore isolates were produced; 50 µl of the stock solution was spread over
PGA, after three-five days a single-spore colony was isolated and further grown in Potato
Dextrose Broth (PDB) (Sigma-Aldrich Co.) for five-seven days, after which 50 µl of the PDB
inoculum was sub-cultured onto antibiotic amended PGA (as above), sealed and incubated at
18 °C for a further three days. Clean cultures were scraped from the plates and individually
stored in 30% glycerol at -80 °C until further use.
4.2.2.2 In vitro sensitivity testing- baseline and selection experiment
The sensitivity of all experimental isolates to epoxiconazole and isopyrazam and of all
baseline isolates to bixafen, boscalid, fluopyram, fluxapyroxad, isopyrazam and penthiopyrad
was determined using a microtitre plate assay as described by Kildea (2009). Initially, SDHI
fungicides were dissolved in dimethyl sulfoxide (DMSO), whereas epoxiconazole was
dissolved in methanol. All fungicides were subsequently diluted in 100% methanol and
added to PDB to give final test concentrations, as in Chapter 2. The remainder of this process
was carried out as in Chapter 2.
4.2.3 Molecular study of the Sdh genes in isolates from the baseline collection and
selection experiment
4.2.3.1 Choosing isolates
A subset of 96 isolates was chosen from the baseline collection for further molecular studies.
Isolates were chosen based on their sensitivity to isopyrazam. From each of the five years, 19
isolates were chosen, six of which had low, seven had medium and six had high EC50 values
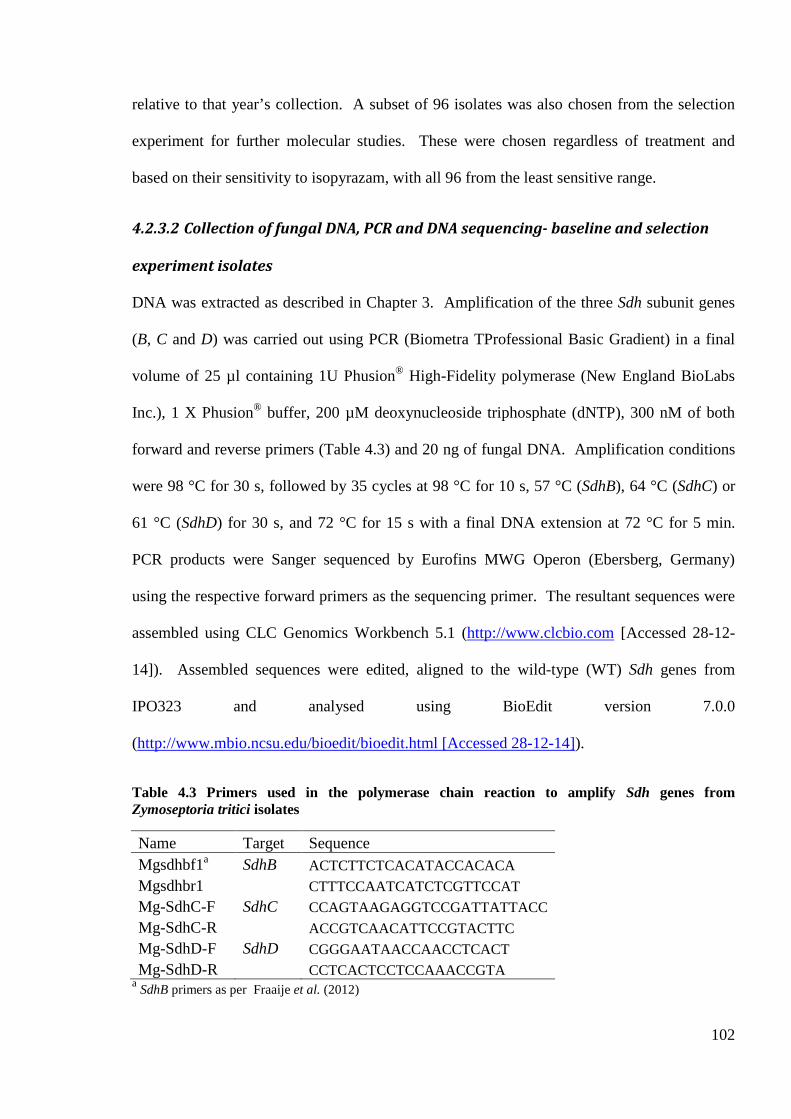
102
relative to that year’s collection. A subset of 96 isolates was also chosen from the selection
experiment for further molecular studies. These were chosen regardless of treatment and
based on their sensitivity to isopyrazam, with all 96 from the least sensitive range.
4.2.3.2 Collection of fungal DNA, PCR and DNA sequencing- baseline and selection
experiment isolates
DNA was extracted as described in Chapter 3. Amplification of the three Sdh subunit genes
(B, C and D) was carried out using PCR (Biometra TProfessional Basic Gradient) in a final
volume of 25 µl containing 1U Phusion® High-Fidelity polymerase (New England BioLabs
Inc.), 1 X Phusion® buffer, 200 µM deoxynucleoside triphosphate (dNTP), 300 nM of both
forward and reverse primers (Table 4.3) and 20 ng of fungal DNA. Amplification conditions
were 98 °C for 30 s, followed by 35 cycles at 98 °C for 10 s, 57 °C (SdhB), 64 °C (SdhC) or
61 °C (SdhD) for 30 s, and 72 °C for 15 s with a final DNA extension at 72 °C for 5 min.
PCR products were Sanger sequenced by Eurofins MWG Operon (Ebersberg, Germany)
using the respective forward primers as the sequencing primer. The resultant sequences were
assembled using CLC Genomics Workbench 5.1 (http://www.clcbio.com [Accessed 28-12-
14]). Assembled sequences were edited, aligned to the wild-type (WT) Sdh genes from
IPO323 and analysed using BioEdit version 7.0.0
(http://www.mbio.ncsu.edu/bioedit/bioedit.html [Accessed 28-12-14]).
Table 4.3 Primers used in the polymerase chain reaction to amplify Sdh genes fromZymoseptoria tritici isolates
Name Target Sequence
Mgsdhbf1a SdhB ACTCTTCTCACATACCACACA
Mgsdhbr1 CTTTCCAATCATCTCGTTCCAT
Mg-SdhC-F SdhC CCAGTAAGAGGTCCGATTATTACC
Mg-SdhC-R ACCGTCAACATTCCGTACTTC
Mg-SdhD-F SdhD CGGGAATAACCAACCTCACT
Mg-SdhD-R CCTCACTCCTCCAAACCGTAa
SdhB primers as per Fraaije et al. (2012)

103
4.2.4 Data analysis
EC50 values were calculated and adjusted as in Chapter 2. For the baseline collection,
normality of the non-transformed EC50 distribution for each fungicide was tested using the
Shapiro-Wilk test. Associations between SDHIs were evaluated using Pearson’s correlation
analysis. For the selection experiment, EC50 values were analysed as in Chapter 2. Briefly,
data from the pre-treatment sampling time (Pre-T) were analysed using REML, whilst data
from the post treatment sampling time were analysed using REML with contrasts (Crawley,
2005), using the FCONTRASTS procedure. In the model, treatment (7 levels) was
considered a fixed effect, whilst location (six levels), replicate (four levels) and
location.treatment were considered random effects. Contrasts were estimated separately for
epoxiconazole and isopyrazam sensitivity. Contrasts 1 and 2 included only data from the full
rate treatments. Isolations were not made from the half rate solo isopyrazam or azole/SDHI
mixture treatments in 2012, so the dose rate contrast (contrast 3) applied only to 2013 data.
Disease severity and yield were analysed as in Chapter 2.
4.3 Results
4.3.1 Baseline fungicide sensitivity distributions
Isolates were tested for their sensitivities to bixafen, fluopyram, fluxapyroxad, isopyrazam,
penthiopyrad and boscalid; 2005 n = 26; 2006 n = 36; 2007 n = 19; 2009 n = 80; 2010 n = 48.
There was no difference in sensitivity between the UK isolates and Irish isolates from 2010 (P
> 0.05), so the whole collection was further analysed as a single unit. For all fungicides
tested, including boscalid, there was no difference in sensitivity between the years of
sampling (P > 0.05). The intrinsic sensitivity of the Z. tritici collection to the SDHI
fungicides varied; ranked in the order of lowest median EC50 first, isopyrazam < fluxapyroxad
< penthiopyrad < bixafen < boscalid < fluopyram. Boscalid and fluopyram had significantly

104
higher EC50 values than the other four fungicides (P < 0.001), and the distribution of their
transformed EC50 values were non-normal, based on W-test they were leptokurtic and skewed
to the right respectively (Table 4.4).
Table 4.4 Summary of baseline sensitivity (EC50 mg L-1) of Zymoseptoria tritici isolates for eachactive ingredient (a.i.) tested
Active ingredient Range Mean Median VFa
W testb
Bixafen 0.018 - 0.822 0.209 0.165 45 P = 0.5
Boscalid 0.066 - 2.903 0.748 0.661 44 P = 0.02
Fluopyram 0.076 - 10.95 1.12 0.588 143 P < 0.001
Fluxapyroxad 0.022 - 0.668 0.188 0.149 30 P = 0.34
Isopyrazam 0.012 - 3.121 0.201 0.146 271 P = 0.1
Penthiopyrad 0.015 - 1.618 0.228 0.163 105 P = 0.17a variance factor was calculated by dividing the highest EC50 in the range by the lowest EC50 in the rangeb W test is the Shapiro-Wilk test for normality of distribution (log scale); P < 0.05 is not normally distributed

Pearson’s correlation indicated that there was cross-resistance between all fungicides (P <
0.001). Cross-resistance with other SDHIs was weakest for fluopyram (Figure 4.1).
Figure 4.1 Matrix oSensitivity was meaimproved visualisati
R= 0.57P<0.001
R= 0.24P<0.001
f
R= 0.61P<0.001
o
R= 0.60P<0.001
R= 0.61P<0.001
correlations besured as EC50
n. P < 0.001 me
R= 0.39P<0.001
R= 0.56P<0.001
R= 0.62P<0.001
R= 0.55P<0.001
tween fuvalues (ans the
R= 0.31P<0.001
R= 0.42P<0.001
R= 0.27P<0.001
ngicide sensitivmg L-1) whichcorrelation was
R= 0.74P<0.001
ities fowere t
highly
R= 0.73P<0.001
r baselinransform
significan
R= 0.81P<0.001
105
e isolates (n = 209).ed using log10 fort

106
4.3.2 Variation in the Sdh genes of baseline isolates
DNA sequences of the SdhB (n = 93), SdhC (n = 89) and SdhD (n = 92) subunits in the
baseline collection were compared. Only two nucleotide substitutions were observed in the
SdhB subunit and neither altered the target protein. There was more variation in the SdhC
subunit; 60 nucleotide substitutions were observed in the protein coding region, 49 of which
were synonymous mutations, i.e. having no effect on the target protein, and 11 were non-
synonymous, i.e. altering the target protein. While 36% of those isolates had no non-
synonymous mutations, comparable to the reference wild-type IPO323, the remaining 64% of
isolates had changes in the protein (Table 4.5a). In the SdhD subunit; 52 mutations were
observed, 12 of which were non-synonymous (Table 4.5b), leading to protein changes in 10%
of isolates. Three isolates had amino-acid changes in both SdhC and SdhD subunits. With all
fungicides, including boscalid, the distribution of EC50 in the non-wild-type variants was
similar to that of the wild-type EC50 values (Table 4.5).
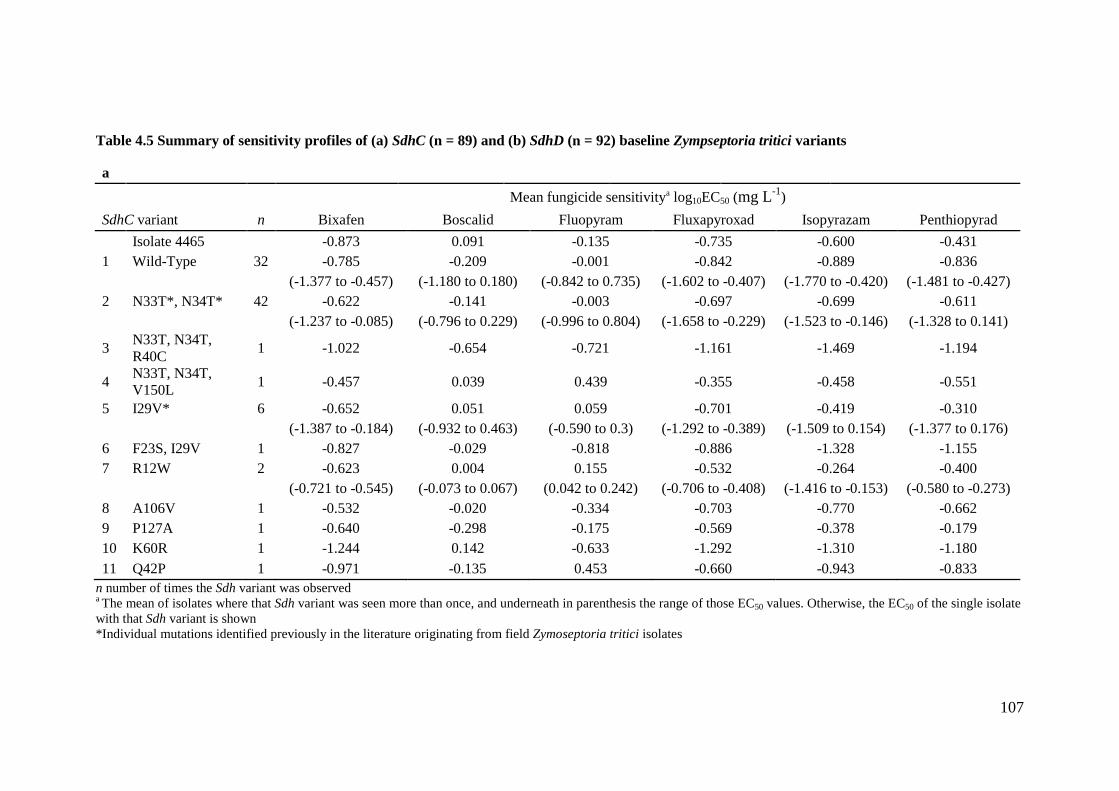
107
Table 4.5 Summary of sensitivity profiles of (a) SdhC (n = 89) and (b) SdhD (n = 92) baseline Zympseptoria tritici variants
a
Mean fungicide sensitivitya log10EC50 (mg L-1)
SdhC variant n Bixafen Boscalid Fluopyram Fluxapyroxad Isopyrazam Penthiopyrad
Isolate 4465 -0.873 0.091 -0.135 -0.735 -0.600 -0.431
1 Wild-Type 32 -0.785 -0.209 -0.001 -0.842 -0.889 -0.836
(-1.377 to -0.457) (-1.180 to 0.180) (-0.842 to 0.735) (-1.602 to -0.407) (-1.770 to -0.420) (-1.481 to -0.427)
2 N33T*, N34T* 42 -0.622 -0.141 -0.003 -0.697 -0.699 -0.611
(-1.237 to -0.085) (-0.796 to 0.229) (-0.996 to 0.804) (-1.658 to -0.229) (-1.523 to -0.146) (-1.328 to 0.141)
3N33T, N34T,R40C
1 -1.022 -0.654 -0.721 -1.161 -1.469 -1.194
4N33T, N34T,V150L
1 -0.457 0.039 0.439 -0.355 -0.458 -0.551
5 I29V* 6 -0.652 0.051 0.059 -0.701 -0.419 -0.310
(-1.387 to -0.184) (-0.932 to 0.463) (-0.590 to 0.3) (-1.292 to -0.389) (-1.509 to 0.154) (-1.377 to 0.176)
6 F23S, I29V 1 -0.827 -0.029 -0.818 -0.886 -1.328 -1.155
7 R12W 2 -0.623 0.004 0.155 -0.532 -0.264 -0.400
(-0.721 to -0.545) (-0.073 to 0.067) (0.042 to 0.242) (-0.706 to -0.408) (-1.416 to -0.153) (-0.580 to -0.273)
8 A106V 1 -0.532 -0.020 -0.334 -0.703 -0.770 -0.662
9 P127A 1 -0.640 -0.298 -0.175 -0.569 -0.378 -0.179
10 K60R 1 -1.244 0.142 -0.633 -1.292 -1.310 -1.180
11 Q42P 1 -0.971 -0.135 0.453 -0.660 -0.943 -0.833
n number of times the Sdh variant was observeda The mean of isolates where that Sdh variant was seen more than once, and underneath in parenthesis the range of those EC50 values. Otherwise, the EC50 of the single isolatewith that Sdh variant is shown*Individual mutations identified previously in the literature originating from field Zymoseptoria tritici isolates
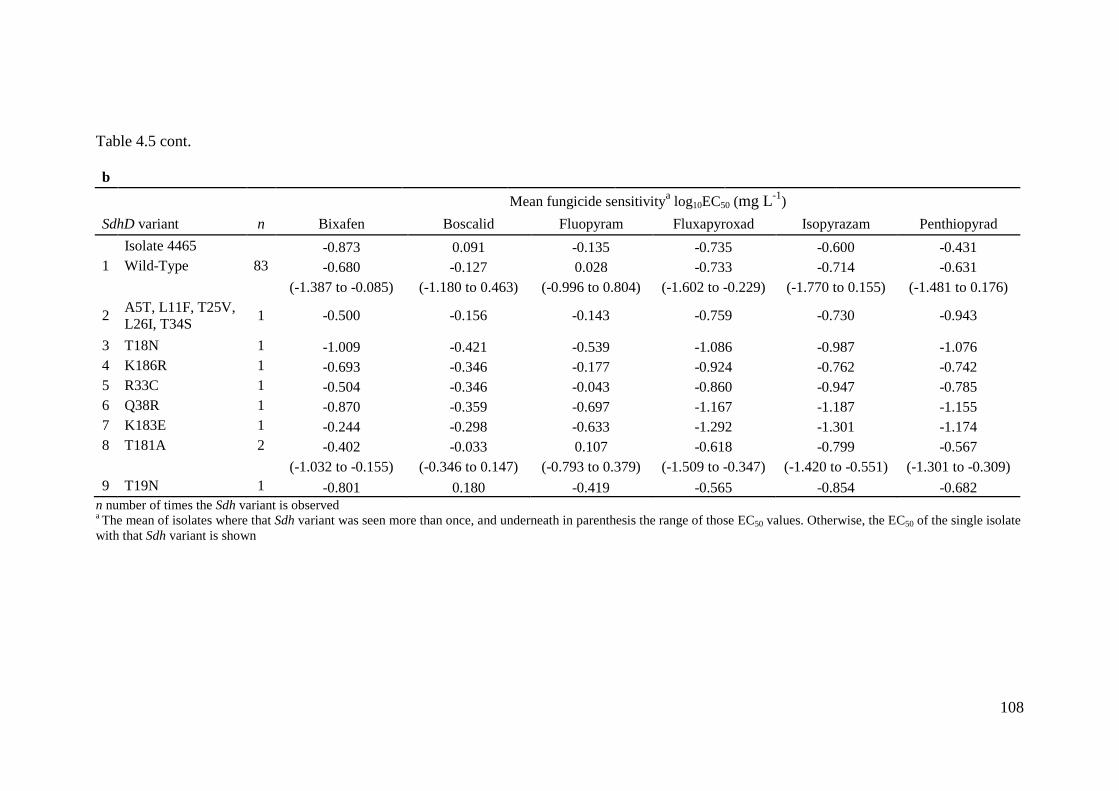
108
Table 4.5 cont.
b
Mean fungicide sensitivitya
log10EC50 (mg L-1)
SdhD variant n Bixafen Boscalid Fluopyram Fluxapyroxad Isopyrazam Penthiopyrad
Isolate 4465 -0.873 0.091 -0.135 -0.735 -0.600 -0.431
1 Wild-Type 83 -0.680 -0.127 0.028 -0.733 -0.714 -0.631
(-1.387 to -0.085) (-1.180 to 0.463) (-0.996 to 0.804) (-1.602 to -0.229) (-1.770 to 0.155) (-1.481 to 0.176)
2A5T, L11F, T25V,L26I, T34S
1 -0.500 -0.156 -0.143 -0.759 -0.730 -0.943
3 T18N 1 -1.009 -0.421 -0.539 -1.086 -0.987 -1.076
4 K186R 1 -0.693 -0.346 -0.177 -0.924 -0.762 -0.742
5 R33C 1 -0.504 -0.346 -0.043 -0.860 -0.947 -0.785
6 Q38R 1 -0.870 -0.359 -0.697 -1.167 -1.187 -1.155
7 K183E 1 -0.244 -0.298 -0.633 -1.292 -1.301 -1.174
8 T181A 2 -0.402 -0.033 0.107 -0.618 -0.799 -0.567
(-1.032 to -0.155) (-0.346 to 0.147) (-0.793 to 0.379) (-1.509 to -0.347) (-1.420 to -0.551) (-1.301 to -0.309)
9 T19N 1 -0.801 0.180 -0.419 -0.565 -0.854 -0.682n number of times the Sdh variant is observeda The mean of isolates where that Sdh variant was seen more than once, and underneath in parenthesis the range of those EC50 values. Otherwise, the EC50 of the single isolatewith that Sdh variant is shown

109
4.3.3 Selection experiments
The sensitivity of 2297 mono-pycnidial Z. tritici isolates collected both pre- and post-
fungicide treatment was tested (Table 4.6). Due to contamination or poor growth of some
isolates, only 2292 isolates were tested for sensitivity to epoxiconazole and 2283 isolates were
tested for sensitivity to isopyrazam. The pre-treatment collection (Pre-T) ranged in sensitivity
to epoxiconazole from a log10EC50 (mg L-1) of -1.475 to 0.815 (variation factor of 195) and to
isopyrazam from a log10EC50 (mg L-1) of -2.737 to 0.063 (variation factor of 632).
Epoxiconazole sensitivity did not differ between locations before treatment (P = 0.3), but
isopyrazam sensitivity did (P = 0.003); the pre-treatment sample from Drogheda was the most
sensitive to isoyprazam and Julienstown, Killeagh and Oak Park 1 were the least sensitive
(Figure 4.2). In treatments containing epoxiconazole, i.e. solo epoxiconazole and the mixture,
larger shifts in sensitivity to epoxiconazole were measured compared to in treatments without
(P = 0.002) (contrast 1, Table 4.7a). Similarly, treatments including isopyrazam saw larger
shifts in sensitivity to isopyrazam than those without (P = 0.026) (contrast 1, Table 4.7b).
Smaller shifts in sensitivity to epoxiconazole were observed after the full rate mixture in
comparison to the full rate solo epoxiconazole (P = 0.015) (contrast 2, Table 4.7a), but there
was no difference in isopyrazam sensitivity between the mixture and solo isopyrazam (P =
0.8) (contrast 2, Table 4.7b).
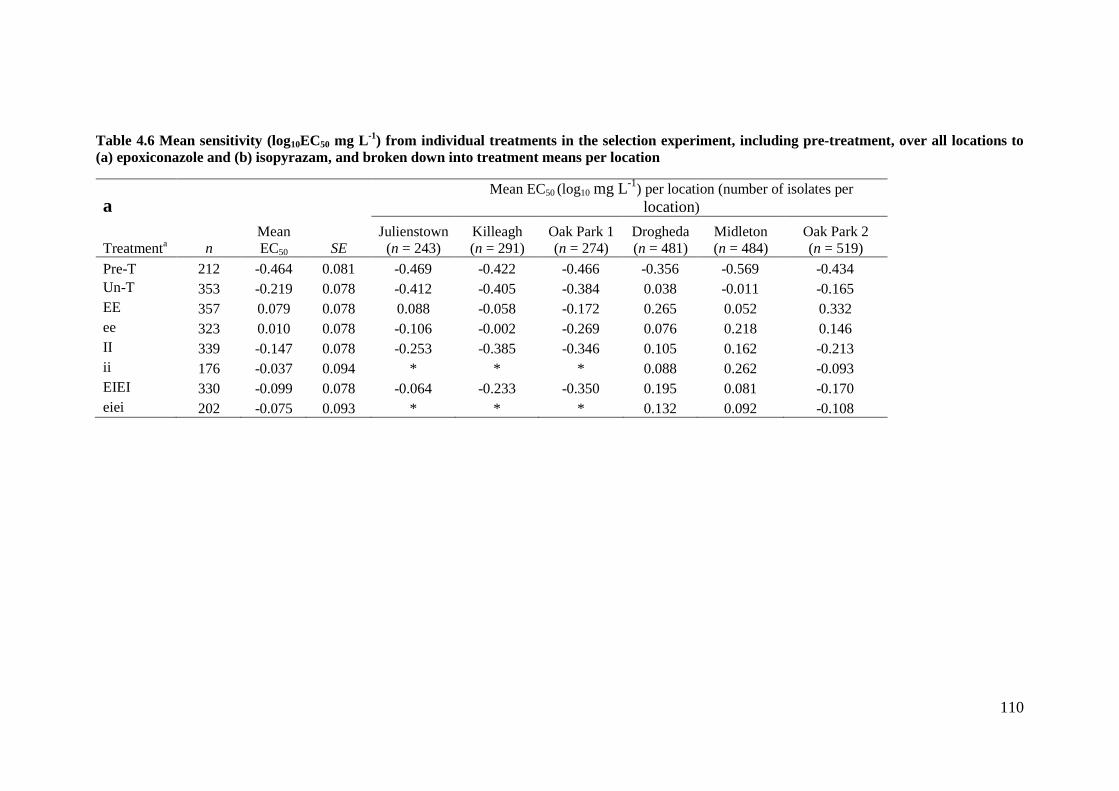
110
Table 4.6 Mean sensitivity (log10EC50 mg L-1) from individual treatments in the selection experiment, including pre-treatment, over all locations to(a) epoxiconazole and (b) isopyrazam, and broken down into treatment means per location
aMean EC50 (log10 mg L-1
) per location (number of isolates per
location)
Treatmenta nMeanEC50 SE
Julienstown(n = 243)
Killeagh(n = 291)
Oak Park 1(n = 274)
Drogheda(n = 481)
Midleton(n = 484)
Oak Park 2(n = 519)
Pre-T 212 -0.464 0.081 -0.469 -0.422 -0.466 -0.356 -0.569 -0.434
Un-T 353 -0.219 0.078 -0.412 -0.405 -0.384 0.038 -0.011 -0.165
EE 357 0.079 0.078 0.088 -0.058 -0.172 0.265 0.052 0.332
ee 323 0.010 0.078 -0.106 -0.002 -0.269 0.076 0.218 0.146
II 339 -0.147 0.078 -0.253 -0.385 -0.346 0.105 0.162 -0.213
ii 176 -0.037 0.094 * * * 0.088 0.262 -0.093
EIEI 330 -0.099 0.078 -0.064 -0.233 -0.350 0.195 0.081 -0.170
eiei 202 -0.075 0.093 * * * 0.132 0.092 -0.108
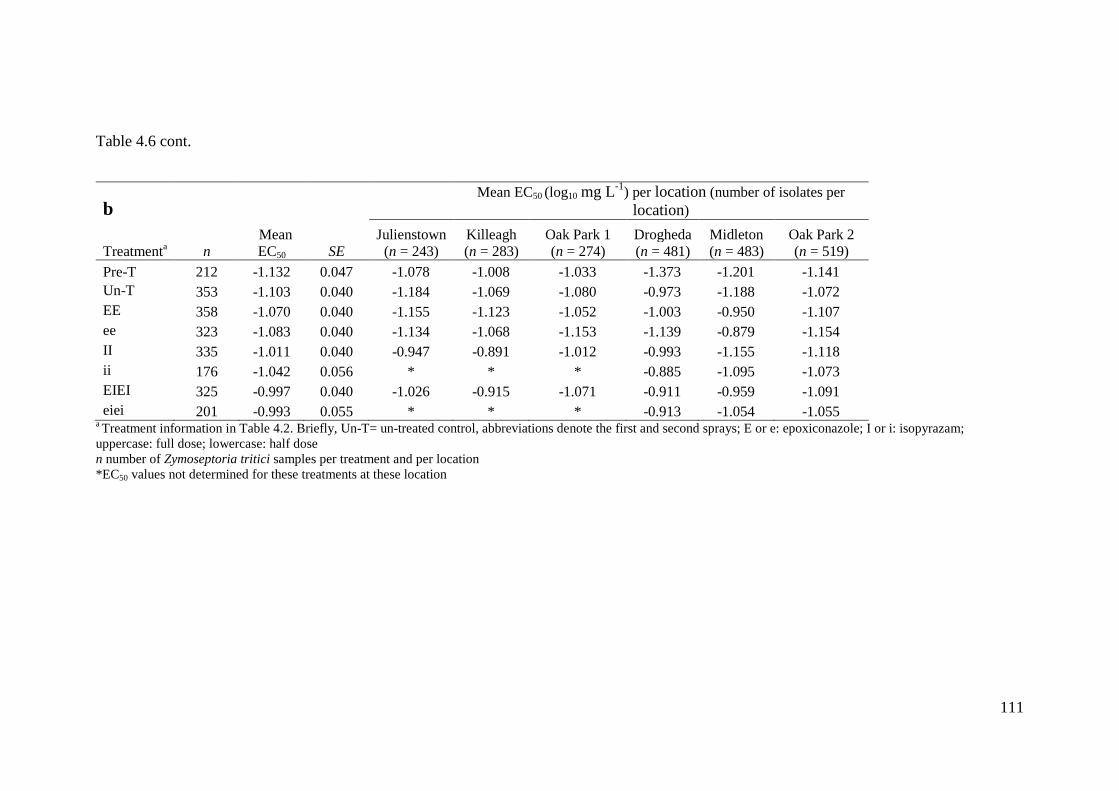
111
Table 4.6 cont.
bMean EC50 (log10 mg L-1
) per location (number of isolates per
location)
Treatmenta nMeanEC50 SE
Julienstown(n = 243)
Killeagh(n = 283)
Oak Park 1(n = 274)
Drogheda(n = 481)
Midleton(n = 483)
Oak Park 2(n = 519)
Pre-T 212 -1.132 0.047 -1.078 -1.008 -1.033 -1.373 -1.201 -1.141
Un-T 353 -1.103 0.040 -1.184 -1.069 -1.080 -0.973 -1.188 -1.072
EE 358 -1.070 0.040 -1.155 -1.123 -1.052 -1.003 -0.950 -1.107
ee 323 -1.083 0.040 -1.134 -1.068 -1.153 -1.139 -0.879 -1.154
II 335 -1.011 0.040 -0.947 -0.891 -1.012 -0.993 -1.155 -1.118
ii 176 -1.042 0.056 * * * -0.885 -1.095 -1.073
EIEI 325 -0.997 0.040 -1.026 -0.915 -1.071 -0.911 -0.959 -1.091
eiei 201 -0.993 0.055 * * * -0.913 -1.054 -1.055a Treatment information in Table 4.2. Briefly, Un-T= un-treated control, abbreviations denote the first and second sprays; E or e: epoxiconazole; I or i: isopyrazam;uppercase: full dose; lowercase: half dosen number of Zymoseptoria tritici samples per treatment and per location*EC50 values not determined for these treatments at these location
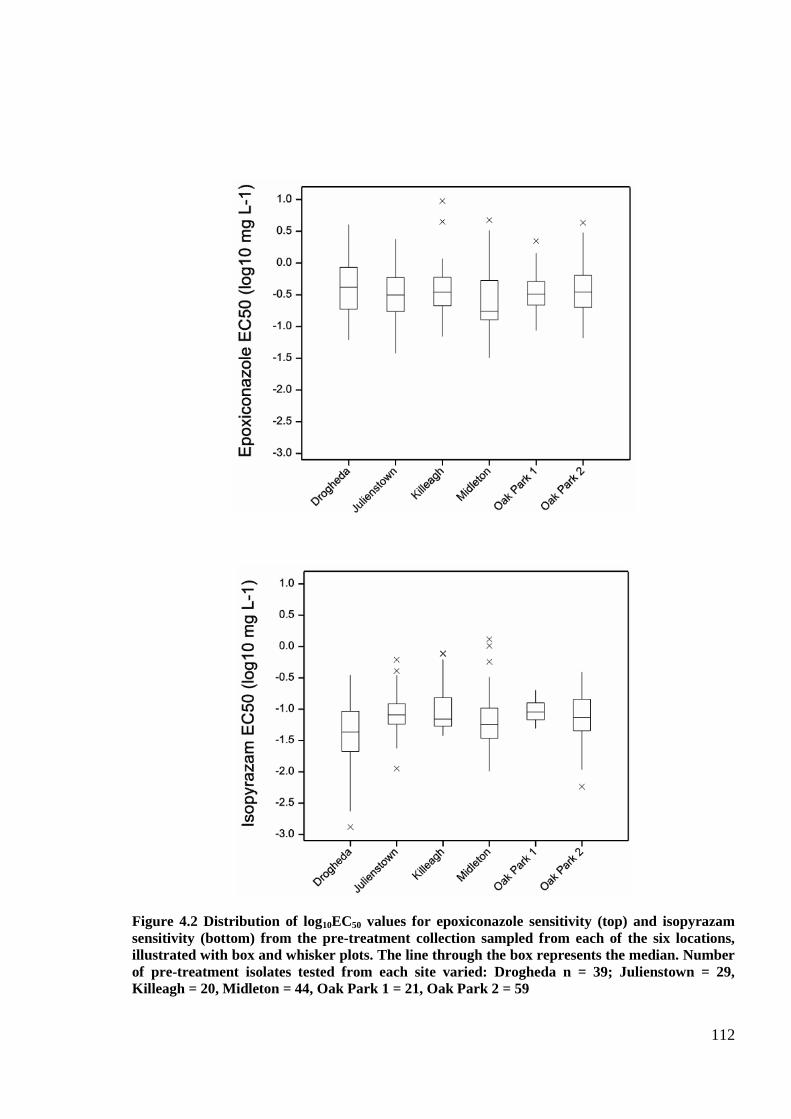
112
Figure 4.2 Distribution of log10EC50 values for epoxiconazole sensitivity (top) and isopyrazamsensitivity (bottom) from the pre-treatment collection sampled from each of the six locations,illustrated with box and whisker plots. The line through the box represents the median. Numberof pre-treatment isolates tested from each site varied: Drogheda n = 39; Julienstown = 29,Killeagh = 20, Midleton = 44, Oak Park 1 = 21, Oak Park 2 = 59

113
Table 4.7 Independent single degree of freedom contrasts between treatments for (a) epoxiconazole and (b) isopyrazam sensitivity
a Treatment coefficients* included in each contrast question
ContrastEffectsizes
Pa Un-T b EE ee II ii EIEI eiei
1. Treatments with anyepoxiconazole cf. those without
0.086 0.002 -1 1 0 -1 0 1 0
2. Mixture cf. epoxiconazole solo 0.089 0.015 0 1 0 0 0 -1 0
3. Effect of dose 0.015 0.7 0 1 -1 1 -1 1 -1
b Treatment coefficients* included in each contrast question
ContrastEffectsizes
Pa Un-T b EE ee II ii EIEI eiei
1. Treatments with any isopyrazamcf. those without
0.041 0.026 -1 -1 0 1 0 1 0
2. Mixture cf. isopyrazam solo -0.007 0.8 0 0 0 1 0 -1 0
3. Effect of dose -0.02 0.6 0 1 -1 1 -1 1 -1a P-value is based on the F-distributionb Treatment information in Table 4.2. Briefly, Un-T= un-treated control, abbreviations denote the first and second sprays; E or e: epoxiconazole; I or i: isopyrazam;uppercase: full dose; lowercase: half dose*Each coefficient denotes the weight by which a mean value was multiplied to calculate the contrast

114
There were no significant effects of reducing dose on either epoxiconazole (P = 0.6) or
isopyrazam (P = 0.7) sensitivity (contrast 3, Table 4.7a & Table 4.7b). Isopyrazam and
epoxiconazole sensitivities were significantly (P < 0.001) and positively correlated, but that
correlation was weak (r = 0.2) (Figure 4.3).
Figure 4.3 Scatter plot showing the correlation between isopyrazam and epoxiconazolesensitivity for isolates from the selection experiment: n = 2283, r = 0.2, P < 0.001

115
4.3.4 Disease severity and its relationship with selection
Un-treated control plots had significantly more disease than the treated with an overall mean
of 11.6% (3.4 sqrt %) of the flag leaf area diseased at GS 71-83 (P < 0.001, Table 4.8).
Levels of STB in the un-treated plots varied between locations: Midleton showed the highest
severity with an average of 23% of leaf area infected (4.8 sqrt %) STB on flag leaves; lowest
severity was at Oak Park 2 where flag leaves had an average of 1% of leaf area infected (1
sqrt %) STB. The performance of each product (full and half rate) depended greatly on
location (P < 0.001, Table 4.8).
Table 4.8 Disease severity at GS 71-83 (measured as average percent STB per surface area of theflag leaf, square root transformed) between treatments at each location. Underneath are theresults of a cross-location analysis using factorial plus control procedure
Location
Treatment a Julienstown KilleaghOak
Park 1Drogheda Midleton
OakPark 2
Mean
Un-T 4.74 4.63 3.07 2.13 4.81 1.01 3.4
EE 1.26 1.8 1.02 0.59 1.33 0.08 1.01
ee 2.67 1.9 1.24 1.01 1.46 0.2 1.41
II 0.53 0.67 0.9 0.12 2.58 0 0.8
ii 1.47 1.54 1.21 0.41 2.66 0 1.21
EIEI 0.92 1.08 1.25 0.15 0.72 0.03 0.69
eiei 1.57 1.94 1.5 0.16 1.6 0 1.13
Mean 1.88 1.94 1.45 0.65 2.17 0.19 1.38
Factorial plus control P LSD (5% level)
Control b < 0.001 0.174
Location < 0.001 0.427
Productc 0.001 0.198
Rate d < 0.001 0.186
Location.Product < 0.001 0.485
Location.Rate 0.001 0.459
Product.Rate 0.97 0.228
Location.Product.Rate 0.16 0.559a
Treatment information in Table 4.2. Briefly, Un-T= un-treated control, abbreviations denote the first andsecond sprays; E or e: epoxiconazole; I or i: isopyrazam; uppercase: full dose; lowercase: half doseb
Control is all fungicides treatments compared to the un-treated control; EE+II+ee+ii+EIEI+eiei cf. Un-TcProduct is full and half rates of each treatment compared; EE+ee, II+ii, and EIEI+eiei
dFull rates cf. half rates; EE+II+EIEI cf. ee+ii+eiei

116
Epoxiconazole applied as a solo active ingredient gave the lowest level of control of
all fungicides at all locations except at Midleton and Oak Park 1, where isopyrazam applied as
a solo active ingredient and the mixture respectively provided the lowest levels of control
(Table 4.8). The solo isopyrazam provided the best disease control at four of the locations,
with the exception of Midleton and Drogheda, where the mixture performed best (Table 4.8).
There was an effect of dose on disease (P < 0.001), but this varied between location (P =
0.001). The full dose applications provided better disease control than their half dose
counterparts at all locations, but the difference between the two was not significant at every
location (Table 4.8). There was an inverse relationship between disease severity and EC50 to
both epoxiconazole and isopyrazam, and most of the variation was accounted for with the
inclusion of location differences (Figure 4.4A, R2 = 0.59, P < 0.001 and Figure 4.4 B, R2 =
0.50, P = 0.002 respectively, common slope but intercepts differing between locations).

117
Figure 4.4 Fitted and observed relationship between disease severity (measured as averagepercent STB per flag leaf, square root transformed) and sensitivity (measured as log10EC50) (A)epoxiconazole, R2 = 0.53, P < 0.001; common slope = -0.04; intercept for Killeagh = -0.14;Midleton = 0.217; Drogheda = 0.16; Julienstown = -0.084; Oak Park 1 = -0.248; Oak Park 2 = -0.039 and (B) isopyrazam sensitivity and disease severity R2 = 0.44, P = 0.002, common slope = -0.052; intercept for Killeagh = -0.885; Midleton = -0.933; Drogheda = -0.931; Julienstown = -0.973; Oak Park 1 = -1.009; Oak Park 2 = -1.11
B
A

118
4.3.5 Effects of fungicides on yield
The un-treated control plots were lower yielding (7.05 t/ha) than the mean of all the fungicide
treatments (P < 0.001, Table 4.9). Overall yield was significantly different between locations
(P < 0.001, Table 4.9) with the 2013 locations (Oak Park 2, Midleton and Drogheda) yielding
more than the 2012 locations (Oak Park 1, Julienstown and Killeagh). Yield improvements
after fungicide application varied between locations (P < 0.001, Table 4.9). Oak Park 1 and
Julienstown had improvements in yield of 2.5 and 1.9 t/ha respectively due to fungicides, and
Oak Park 2 saw an improvement of just 0.2 t/ha. The product used had an effect on yield (P =
0.028, Table 4.9) with the solo isopyrazam and the mixture providing higher yields than the
solo epoxiconazole. There was no significant difference in yield between full and half rates
(P = 0.2, Table 4.9). There was a significant inverse relationship between disease and yield;
but both the slope and intercept of this varied between locations (Figure 4.5, R2 = 0.96, P =
0.01).
Figure 4.5 Fitted and observed relationship between disease severity (measured as averagepercent STB per flag leaf, (square root transformed) and yield (measured as tonne per hectare),R2 =0.96, P = 0.013. Drogheda: y = 9.64 + -0.271x; Julienstown: y = 6.84 + -0.562x; Killeagh: y =6.1 + -0.289x; Midleton: y = 10.32 + -0.233x; Oak Park 1: y = 9.2 + -1.261x; Oak Park 2: y =10.6+ -0.266x
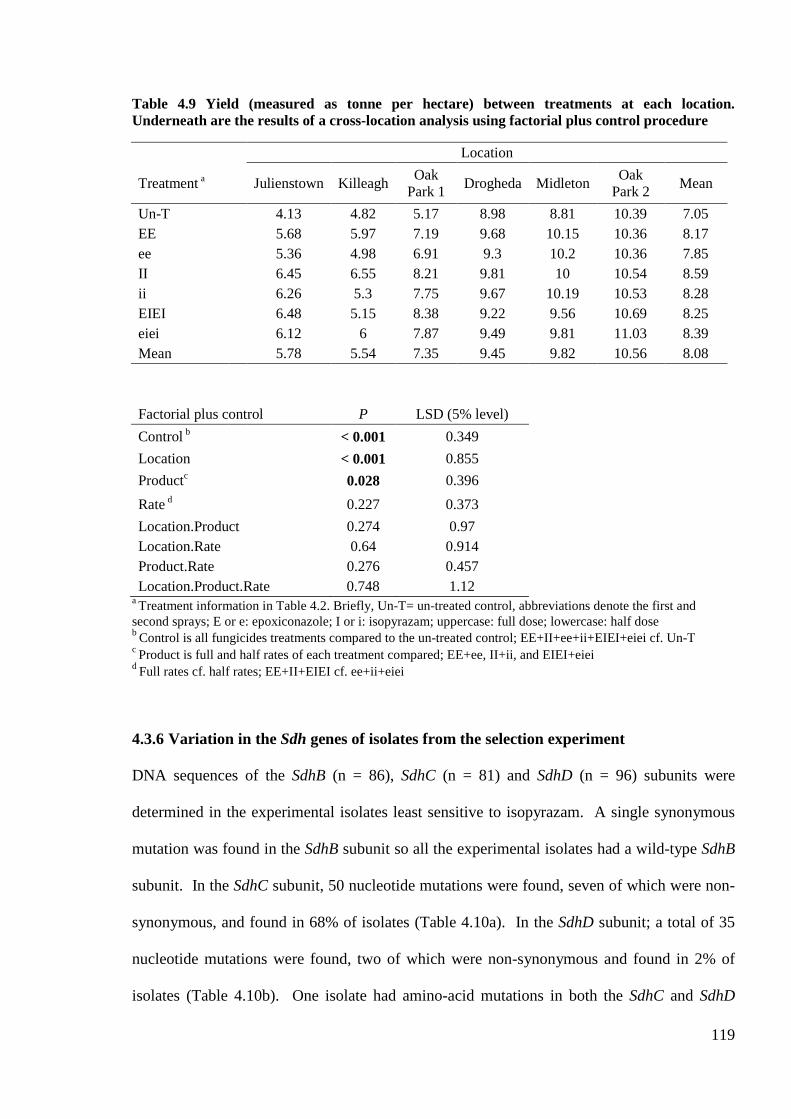
119
Table 4.9 Yield (measured as tonne per hectare) between treatments at each location.Underneath are the results of a cross-location analysis using factorial plus control procedure
Location
Treatment a Julienstown KilleaghOak
Park 1Drogheda Midleton
OakPark 2
Mean
Un-T 4.13 4.82 5.17 8.98 8.81 10.39 7.05
EE 5.68 5.97 7.19 9.68 10.15 10.36 8.17
ee 5.36 4.98 6.91 9.3 10.2 10.36 7.85
II 6.45 6.55 8.21 9.81 10 10.54 8.59
ii 6.26 5.3 7.75 9.67 10.19 10.53 8.28
EIEI 6.48 5.15 8.38 9.22 9.56 10.69 8.25
eiei 6.12 6 7.87 9.49 9.81 11.03 8.39
Mean 5.78 5.54 7.35 9.45 9.82 10.56 8.08
Factorial plus control P LSD (5% level)
Control b < 0.001 0.349
Location < 0.001 0.855
Productc 0.028 0.396
Rate d 0.227 0.373
Location.Product 0.274 0.97
Location.Rate 0.64 0.914
Product.Rate 0.276 0.457
Location.Product.Rate 0.748 1.12aTreatment information in Table 4.2. Briefly, Un-T= un-treated control, abbreviations denote the first and
second sprays; E or e: epoxiconazole; I or i: isopyrazam; uppercase: full dose; lowercase: half doseb
Control is all fungicides treatments compared to the un-treated control; EE+II+ee+ii+EIEI+eiei cf. Un-TcProduct is full and half rates of each treatment compared; EE+ee, II+ii, and EIEI+eiei
dFull rates cf. half rates; EE+II+EIEI cf. ee+ii+eiei
4.3.6 Variation in the Sdh genes of isolates from the selection experiment
DNA sequences of the SdhB (n = 86), SdhC (n = 81) and SdhD (n = 96) subunits were
determined in the experimental isolates least sensitive to isopyrazam. A single synonymous
mutation was found in the SdhB subunit so all the experimental isolates had a wild-type SdhB
subunit. In the SdhC subunit, 50 nucleotide mutations were found, seven of which were non-
synonymous, and found in 68% of isolates (Table 4.10a). In the SdhD subunit; a total of 35
nucleotide mutations were found, two of which were non-synonymous and found in 2% of
isolates (Table 4.10b). One isolate had amino-acid mutations in both the SdhC and SdhD

120
subunits. The EC50 distribution of isolates with Sdh variant sequences was similar to the EC50
distribution observed in the isolates with wild-type sequences, for both isopyrazam and
epoxiconazole. Apart from the wild-type isolates, only a single Sdh variant was found in more
than one isolate: N33T/N34T in the SdhC subunit was found in 49% of isolates but as with
the other variants the EC50 values were spread over the entire range of both isopyrazam and
epoxiconazole.
Table 4.10 Summary of sensitivity profiles of (a) SdhC (n = 81) and (b) SdhD (n = 89) variantsfrom Zymospetoria tritici isolates from the selection experiment
a
Mean fungicide sensitivitya
log10EC50 (mg L-1)
SdhC variant n Isopyrazam Epoxiconazole
1 Wild-Type 34 -0.121 0.544
(-0.384 to 0.359) (-0.606 to 1.245)
2 N33T*, N34T* 40 -0.137 0.521
(-0.376 to 0.368) (-0.644 to 1.238)
3 L11I 1 -0.198 -0.040
4 I29V*,N33T, N34T 1 0.052 -0.166
5N33T, N34T,V150L
1 -0.258 0.815
6 P127Q 1 -0.351 0.448
7 V48A 1 -0.302 0.482
8 I29V 2 -0.134 0.560
(-0.344 to 0.007) (-0.198 to 0.821)
b
Mean fungicide sensitivitya
log10EC50 (mg L-1)
SdhD variant n Isopyrazam Epoxiconazole
1 Wild-Type 94 -0.130 0.580
(-1.377 to 0.368) (-0.664 to 1.245)
2 K186R 1 -0.108 0.339
3 L32I 1 -0.345 -0.396
a The mean of isolates where that Sdh variant was seen more than once, and underneath in parenthesis the rangeof those EC50 values. Otherwise, the EC50 of the single isolate with that Sdh variant is shownn number of times the Sdh variant is observed*Individual mutations identified previously in the literature (Fraaije et al., 2012) originating from fieldZymoseptoria tritici isolates
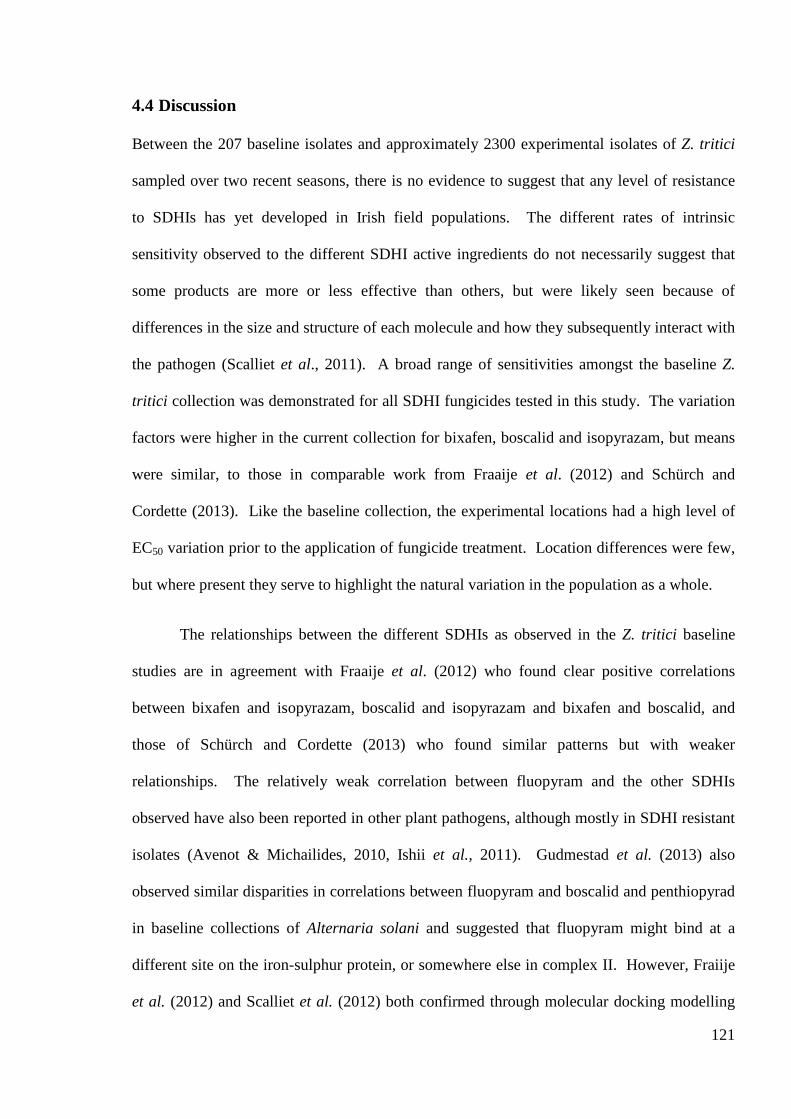
121
4.4 Discussion
Between the 207 baseline isolates and approximately 2300 experimental isolates of Z. tritici
sampled over two recent seasons, there is no evidence to suggest that any level of resistance
to SDHIs has yet developed in Irish field populations. The different rates of intrinsic
sensitivity observed to the different SDHI active ingredients do not necessarily suggest that
some products are more or less effective than others, but were likely seen because of
differences in the size and structure of each molecule and how they subsequently interact with
the pathogen (Scalliet et al., 2011). A broad range of sensitivities amongst the baseline Z.
tritici collection was demonstrated for all SDHI fungicides tested in this study. The variation
factors were higher in the current collection for bixafen, boscalid and isopyrazam, but means
were similar, to those in comparable work from Fraaije et al. (2012) and Schürch and
Cordette (2013). Like the baseline collection, the experimental locations had a high level of
EC50 variation prior to the application of fungicide treatment. Location differences were few,
but where present they serve to highlight the natural variation in the population as a whole.
The relationships between the different SDHIs as observed in the Z. tritici baseline
studies are in agreement with Fraaije et al. (2012) who found clear positive correlations
between bixafen and isopyrazam, boscalid and isopyrazam and bixafen and boscalid, and
those of Schürch and Cordette (2013) who found similar patterns but with weaker
relationships. The relatively weak correlation between fluopyram and the other SDHIs
observed have also been reported in other plant pathogens, although mostly in SDHI resistant
isolates (Avenot & Michailides, 2010, Ishii et al., 2011). Gudmestad et al. (2013) also
observed similar disparities in correlations between fluopyram and boscalid and penthiopyrad
in baseline collections of Alternaria solani and suggested that fluopyram might bind at a
different site on the iron-sulphur protein, or somewhere else in complex II. However, Fraiije
et al. (2012) and Scalliet et al. (2012) both confirmed through molecular docking modelling
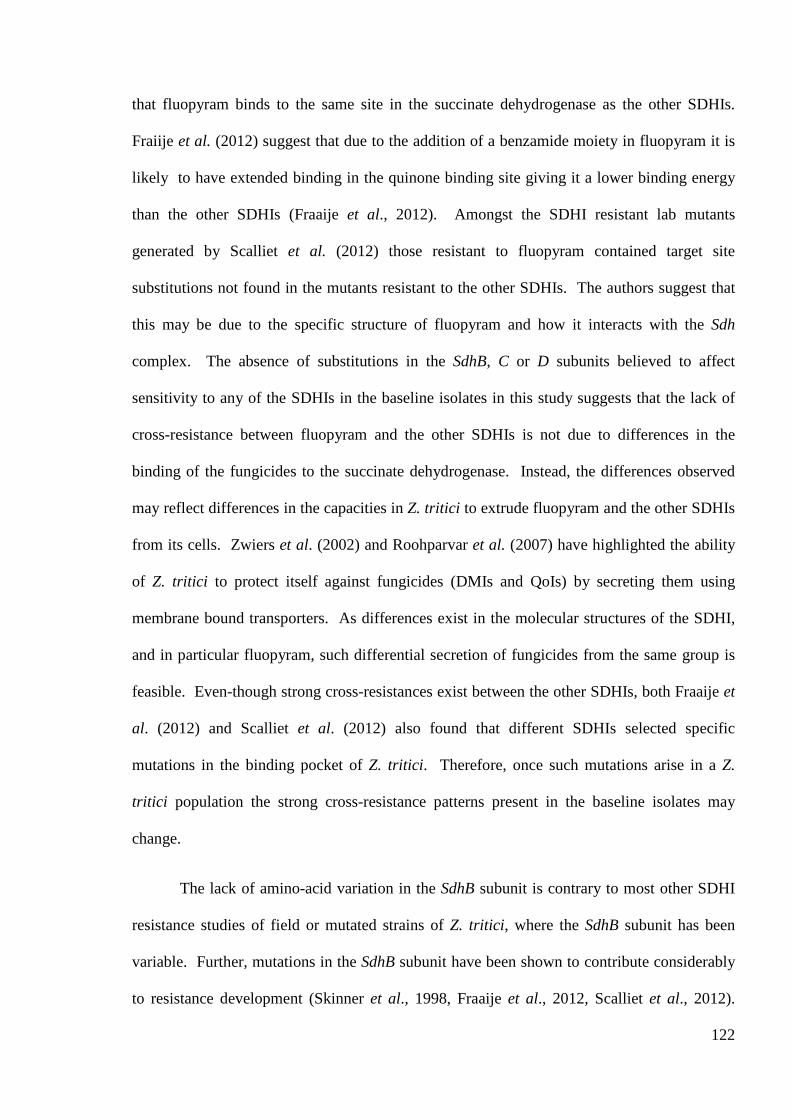
122
that fluopyram binds to the same site in the succinate dehydrogenase as the other SDHIs.
Fraiije et al. (2012) suggest that due to the addition of a benzamide moiety in fluopyram it is
likely to have extended binding in the quinone binding site giving it a lower binding energy
than the other SDHIs (Fraaije et al., 2012). Amongst the SDHI resistant lab mutants
generated by Scalliet et al. (2012) those resistant to fluopyram contained target site
substitutions not found in the mutants resistant to the other SDHIs. The authors suggest that
this may be due to the specific structure of fluopyram and how it interacts with the Sdh
complex. The absence of substitutions in the SdhB, C or D subunits believed to affect
sensitivity to any of the SDHIs in the baseline isolates in this study suggests that the lack of
cross-resistance between fluopyram and the other SDHIs is not due to differences in the
binding of the fungicides to the succinate dehydrogenase. Instead, the differences observed
may reflect differences in the capacities in Z. tritici to extrude fluopyram and the other SDHIs
from its cells. Zwiers et al. (2002) and Roohparvar et al. (2007) have highlighted the ability
of Z. tritici to protect itself against fungicides (DMIs and QoIs) by secreting them using
membrane bound transporters. As differences exist in the molecular structures of the SDHI,
and in particular fluopyram, such differential secretion of fungicides from the same group is
feasible. Even-though strong cross-resistances exist between the other SDHIs, both Fraaije et
al. (2012) and Scalliet et al. (2012) also found that different SDHIs selected specific
mutations in the binding pocket of Z. tritici. Therefore, once such mutations arise in a Z.
tritici population the strong cross-resistance patterns present in the baseline isolates may
change.
The lack of amino-acid variation in the SdhB subunit is contrary to most other SDHI
resistance studies of field or mutated strains of Z. tritici, where the SdhB subunit has been
variable. Further, mutations in the SdhB subunit have been shown to contribute considerably
to resistance development (Skinner et al., 1998, Fraaije et al., 2012, Scalliet et al., 2012).

123
Even so, in the current study, as in Fraaije et al. (2012), the SdhC subunit was the most
diverse in the gene. No isolates in either the baseline collection or the experimental field
collection had any known resistance-conferring amino-acid changes, and few out-of-WT-
range EC50 values were found in either baseline or experimental isolates. Those mutations
which were present appeared to be neutral; EC50 values were within the wild-type range and,
while having no apparent effect on the fitness of the isolate in the presence of a fungicide, the
mutations still persist in the population. In addition, mutations were not found in or close to
the putative Sdh binding pocket as described by Fraaije et al. (2012) and Scalliet et al. (2012),
indicating that they have no direct effect on binding/fungicidal activity. This is despite the
fact that the baseline isolates may have been exposed to boscalid (as it has been commercially
used in Ireland since 2005) and the isolates within the selection experiment collection were
chosen because they had the highest levels of isopyrazam EC50 values available from the
whole collection. The absence of mutations in field isolates which were found in mutagenesis
studies (Skinner et al., 1998, Fraaije et al., 2012, Scalliet et al., 2012) suggests that either the
mutations have not actually occurred, or that the changes brought about in Z. tritici by
mutagenesis may have no overall selective advantage in the field. Reduced enzyme activity
in some of the mutated strains, as demonstrated by Scalliet et al. (2012), may contribute to
reduced fitness.
The weak cross-resistance and the differential selection observed between isopyrazam
and epoxiconazole was expected as each a.i. targets a different site. This suggests that strains
resistant to one a.i. are only weakly selected by the other and demonstrates that these two a.i.s
are currently suitable for mixing. Much work has been done on the effects of mixtures on
selection for resistance. Hobbelen et al. (2013) provide a short review of the literature. Many
studies include a combination of two at-risk fungicides, but only report the effects on one;
whichever one the authors class as the most at risk of resistance. Ensuring that SDHIs are
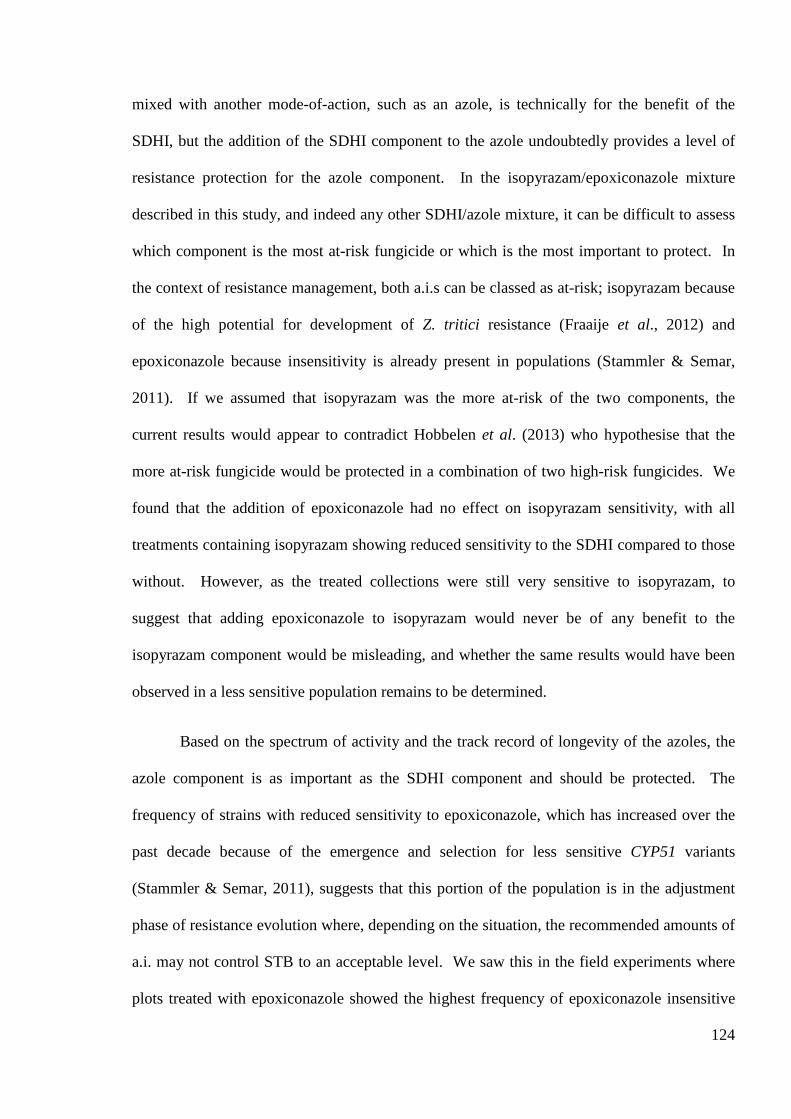
124
mixed with another mode-of-action, such as an azole, is technically for the benefit of the
SDHI, but the addition of the SDHI component to the azole undoubtedly provides a level of
resistance protection for the azole component. In the isopyrazam/epoxiconazole mixture
described in this study, and indeed any other SDHI/azole mixture, it can be difficult to assess
which component is the most at-risk fungicide or which is the most important to protect. In
the context of resistance management, both a.i.s can be classed as at-risk; isopyrazam because
of the high potential for development of Z. tritici resistance (Fraaije et al., 2012) and
epoxiconazole because insensitivity is already present in populations (Stammler & Semar,
2011). If we assumed that isopyrazam was the more at-risk of the two components, the
current results would appear to contradict Hobbelen et al. (2013) who hypothesise that the
more at-risk fungicide would be protected in a combination of two high-risk fungicides. We
found that the addition of epoxiconazole had no effect on isopyrazam sensitivity, with all
treatments containing isopyrazam showing reduced sensitivity to the SDHI compared to those
without. However, as the treated collections were still very sensitive to isopyrazam, to
suggest that adding epoxiconazole to isopyrazam would never be of any benefit to the
isopyrazam component would be misleading, and whether the same results would have been
observed in a less sensitive population remains to be determined.
Based on the spectrum of activity and the track record of longevity of the azoles, the
azole component is as important as the SDHI component and should be protected. The
frequency of strains with reduced sensitivity to epoxiconazole, which has increased over the
past decade because of the emergence and selection for less sensitive CYP51 variants
(Stammler & Semar, 2011), suggests that this portion of the population is in the adjustment
phase of resistance evolution where, depending on the situation, the recommended amounts of
a.i. may not control STB to an acceptable level. We saw this in the field experiments where
plots treated with epoxiconazole showed the highest frequency of epoxiconazole insensitive

125
Z. tritici, in addition to being the least effective of the fungicides for STB control and
providing the lowest eventual yield of all the fungicides tested. Currently the azole
insensitive isolates remain sensitive to the SDHIs, and even though some selection for
reduced epoxiconazole sensitivity did occur after the mixture with isopyrazam, the addition of
isopyrazam to epoxiconazole had a large buffering effect on the level of that selection.
One of the caveats when mixing two fungicides as an anti-resistance strategy is that
the individual components of a mixture should be included at a rate which provides effective
control when applied alone (Anon, 2013b). If the proportion of epoxiconazole in the mixture
could be increased to a level where it provided good control, it may provide more protection
for the SDHI, however in the present study epoxiconazole was applied in the mixture at the
recommended label rate and any further increases may adversely increase selection for azole
resistance. Alternatively, mixing the SDHI with a more effective azole might improve the
situation. Combining the only non-cross-resistant SDHI, fluopyram, with isopyrazam may be
an option to protect the SDHI and azole component, but this is a short term solution which is
likely to speed up the selection for resistance once it emerges, and so not to be recommended.
If this option were to be utilised, alternating the SDHIs instead of mixing might be the better
option. Alternating two products which contain different SDHIs limits the exposure of the
population to the same SDHI to once per season, which reduces the selection coefficient (van
den Bosch et al., 2014). The ideal option for protecting both the SDHI and azole components
would be however, to add a fungicide which is at a low risk-of-resistance, i.e. a multi-site,
such as chlorothalonil or folpet. The multi-sites are protectants which work best to prevent
disease, and are most effective at the earliest stages of disease development. Early in the
season, in a low disease pressure situation, a multi-site applied as a solo product can be
effective. In high disease pressure and in curative situations, the multi-sites, if used alone,
may not be the best option (compared to azoles and SDHIs) (Anon, 2013a), but used in
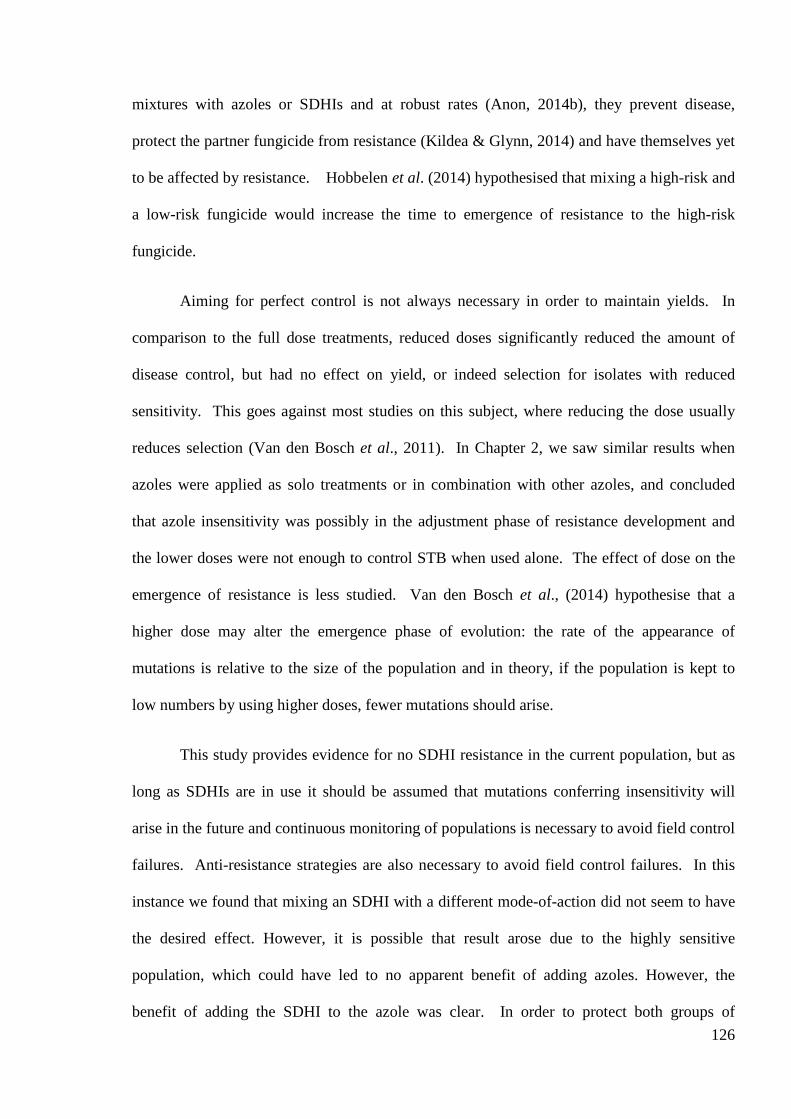
126
mixtures with azoles or SDHIs and at robust rates (Anon, 2014b), they prevent disease,
protect the partner fungicide from resistance (Kildea & Glynn, 2014) and have themselves yet
to be affected by resistance. Hobbelen et al. (2014) hypothesised that mixing a high-risk and
a low-risk fungicide would increase the time to emergence of resistance to the high-risk
fungicide.
Aiming for perfect control is not always necessary in order to maintain yields. In
comparison to the full dose treatments, reduced doses significantly reduced the amount of
disease control, but had no effect on yield, or indeed selection for isolates with reduced
sensitivity. This goes against most studies on this subject, where reducing the dose usually
reduces selection (Van den Bosch et al., 2011). In Chapter 2, we saw similar results when
azoles were applied as solo treatments or in combination with other azoles, and concluded
that azole insensitivity was possibly in the adjustment phase of resistance development and
the lower doses were not enough to control STB when used alone. The effect of dose on the
emergence of resistance is less studied. Van den Bosch et al., (2014) hypothesise that a
higher dose may alter the emergence phase of evolution: the rate of the appearance of
mutations is relative to the size of the population and in theory, if the population is kept to
low numbers by using higher doses, fewer mutations should arise.
This study provides evidence for no SDHI resistance in the current population, but as
long as SDHIs are in use it should be assumed that mutations conferring insensitivity will
arise in the future and continuous monitoring of populations is necessary to avoid field control
failures. Anti-resistance strategies are also necessary to avoid field control failures. In this
instance we found that mixing an SDHI with a different mode-of-action did not seem to have
the desired effect. However, it is possible that result arose due to the highly sensitive
population, which could have led to no apparent benefit of adding azoles. However, the
benefit of adding the SDHI to the azole was clear. In order to protect both groups of

127
fungicides from resistance, it would be prudent to limit the number of applications of
individual a.i.s from each group to once per season. However, if it is necessary to use multiple
applications from a single fungicide group in one season, alternation between a.i. within a
group should reduce selection pressure. Moreover, the addition of a multi-site fungicide
would add protection for the SDHI while not affecting selection for resistance in any way.

128
Chapter 5: General discussion
This PhD project arose because of the continuing decrease in azole sensitivity, and the
prospect of managing cereal crops without them. The aim of this work was to investigate the
effects of combining different fungicides on fungicide sensitivity, and on changes in the
fungicide target protein. A reduction in the frequency of isolates with reduced azole
sensitivity was brought about by reducing the number of applications of a specific active
ingredient through i) alternating two azoles, ii) mixing an azole with an SDHI. Mixing two
azoles did not reduce the frequency of isolates with reduced azole sensitivity.
The three experimental chapters in this thesis cover three separate but connected
subjects. Chapter 2 investigated the effects of combining two azoles, and of reducing
recommended dose rates of these combinations, on azole sensitivity. This was a large
experiment, and provides a solid contribution to this field of research. While much
experimental work has been done on combining fungicides, few of those studies look at the
effects of alternating fungicides (sequential application of different fungicides) and even
fewer study the effects of mixing azoles - this work tackles both. Chapter 3 was a direct
extension of Chapter 2, and studied the exact target protein changes brought about by
applying solo azoles and a mixture of azoles. This is the first large scale study of the
complete CYP51 gene of Irish Z. tritici populations and will contribute to the growing body of
work on the evolution of azole resistance. Finally, Chapter 4 moved on to study the effects
that combining fungicides with different modes-of-action, an azole and a SDHI, would have
on azole and SDHI sensitivity and on Sdh target protein changes. It combines three separate
studies on fungicide sensitivity; i) the establishment of baseline sensitivity levels to new
SDHI fungicides; ii) the determination of the effects of mixing SDHIs and azoles on fungicide
sensitivity; and iii) the determination of the genetic diversity in the Sdh target gene in baseline
and experimental isolates.

129
Fungicide resistance management is about getting a balance between disease control
and selection for resistance, and can entail a trade-off; specifically, lower fungicide use can
lead to a reduction in selection pressure, but may also mean a reduction in disease control.
However this reduction in disease control should not always be viewed as leading to a
reduction in yield. In Chapter 2, the azole mixture (epoxiconazole and metconazole)
controlled STB significantly better than either the alternations or solo products, but there was
no statistical difference between yields. This demonstrates that aiming for perfect control is
not necessary, and additionally, in some cases may be uneconomical. A good level of control
is however necessary. In this study when the recommended dose rates of the azole based
fungicide combinations were halved and compared to the full doses, smaller shifts in
sensitivity were observed, but were not significant, while disease control and yield were
reduced significantly. So, the half rates of those fungicides were of limited practical use.
However, extrapolation of that result to other fungicides in other pathosystems is not
necessarily appropriate. Azole insensitivity in Z. tritici has evolved to the extent that
management is now in the adjustment phase, where full recommended doses, and possibly
increased doses, are needed for effective control. The work here was limited to the study of
two doses, half and full recommended dose rates. Had the resources been available, another
dose rate, for example ¾ of the full recommended amount, may have shown better disease
control results. SDHI resistance on the other hand is in the pre-emergence phase of resistance
where reduced application rates can provide effective control so as not to affect yield (as seen
in Chapter 4) as well as possibly slowing the emergence of resistance (Shaw, 2009).
Hobbelen et al. (2014) discuss two opposing effects of dose on the emergence of resistant
strains: high doses may keep the population small which will reduce the number of mutations
per unit time, but they will also reduce the competition between the sensitive and resistant
strains, which will increase the chances of the resistant strain emerging. They conclude that

130
within the range of doses used in a commercial situation, dose rate had no effect on the
emergence time of resistance. Nevertheless, if resistant strains were to emerge, reduced rates
would be expected to lessen the selection pressure compared to full rates (Van den Bosch et
al., 2011).
A recent review by van den Bosch et al. (2014) highlighted that most of the evidence
on the subject concluded that mixtures can slow the selection for resistant strains. The two
components of the azole mixture used in these experiments have in the past been shown to
select differentially (Fraaije et al., 2007, Leroux et al., 2007, Kildea, 2009), and even though
results in Chapter 2 confirm that is still the case, high levels of cross-resistance between both
azoles existed in these Z. tritici populations. It was established that this mixture of
epoxiconazole and metconazole did not have the effect of reducing selection for isolates with
reduced sensitivity, but instead increased selection for isolates with reduced sensitivity to both
fungicides. Correspondingly, from the CYP51 alterations and variants which were positively
selected by epoxiconazole or metconazole, most were positively selected by the mixture.
This mixture is still commonly used, and it might be expected that the dual selection caused
by mixing epoxiconazole and metconazole will lead to a faster evolution towards resistance to
both components. This however does not spell the end for this or other azole mixtures.
Firstly, azole mixtures still provide effective disease control, although how long this may last
is questionable given the presence of strains in the Irish Z. tritici population with high levels
of insensitivity to both fungicides. Secondly, it is possible that if we studied a different
combination of azole fungicides the results may be different, but given the high evolutionary
potential of Z tritici populations, any advantages of mixing azoles are likely to be temporary.
Finally, the addition of an a.i. with a different mode-of-action to azole mixtures would protect
the azole components at the same time as adding disease control, and is recommended by both
FRAC and FRAG-UK.

131
Results from Chapter 2 demonstrated that if two azoles are to be combined in an effort
to reduce selection for insensitive Z. tritici isolates while not adversely affecting yield,
alternating, and in doing so limiting the application of either fungicide to once per season,
would be the more successful tactic; however, the success of alternating two azoles was only
applicable to the a.i. applied first in the alternation. Restricting the application of individual
azoles to only once per season demonstrates the importance of maintaining and utilising the
full range of azoles currently available. Further, the example of prochloraz could be used to
initiate studies which might lead to the improved formulation of some older azoles or to the
use of older azoles in new combinations - providing a new outlook for those fungicides and
STB control. However, as most recent studies have shown, the rate at which the Z. tritici
populations are evolving towards insensitivity highlights that the continued mixing of azoles
is a short term solution which will accelerate selection for resistance. The method of sampling
the experimental plots as previously discussed may have affected this result, i.e. the leaf layer
sampled was treated with only the T2 fungicide and it could be maintained that the isolates
collected were only affected by that one fungicide. However, it might be counter argued that
as the disease is known to spread vertically through the crop canopy (Baccar et al., 2011),
aside from ascospores coming in from outside the crop, most inoculum found on the flag leaf,
and therefore directly affected by the T2 fungicide, would have been pre-selected by the T1
fungicide.
Considering that the same effect of alternating would probably apply to the sequential
use of any two differentially selecting azoles, it would be a sensible approach to apply the
more at-risk azole only once per season, and at the T1 application timing. Of the four
standard fungicide timings T0, T1, T2 and T3, a consistently high yield response to the T2
(Anon, 2014c) means that that application provides the best return on investment, and so the
more disease you can control at that time, the bigger the return. Hence, the most effective
132
product should be used at T2. In this instance, where epoxiconazole and metconazole were as
effective as each other, it made little difference to disease control or yield which azole was
applied at T1 or T2. However, when applying fungicides with different levels of efficacy, and
assuming there are resistant strains present in the population, the more effective fungicide
when applied at T2, is also likely to provide the strongest selection pressure compared to
applying the more effective fungicide at T1. This takes us back to the importance of getting
the correct balance between disease control and selection.
Even though limiting the number of applications of a specific azole can help slow the
selection for strains with reduced sensitivity, as long as azoles are being used, Z. tritici
populations will probably continue to evolve towards resistance. But do in-vitro resistance
studies really reflect what is actually happening in the field? Some workers (Stammler et al.,
2008, Strobel et al., 2014) suggested that field efficacy of epoxiconazole has seldom been
compromised in the presence of amino-acid alterations that reduce the in-vitro sensitivity.
However, Kildea (2009) showed that in 2006-07 epoxiconazole was significantly more
effective than metconazole. In comparison to the current work, where the two fungicides were
very similar, this indicates a loss of efficacy in epoxiconazole since then. Indeed,
collaborative studies carried out in the UK by the HGCA and partners (Anon, 2014) saw a
decrease in performance in azoles over the last decade. To slow the worsening of this
situation and to maintain/extend the effective life of both epoxiconazole and metconazole, the
addition of other modes-of-action to this and other azole mixtures is necessary. Indeed,
azoles are currently seldom used without the protection of another mode-of-action.
With the decline in efficacy of the azoles in recent years, keeping on top of STB with
the aim of avoiding a highly curative situation would help to maintain the effective life of
azoles. However, as wet weather conditions in Ireland regularly inhibit the timely application
of fungicides, they are often applied in situations which are in need of strong curative activity,

133
and so azoles which have curative activity are often necessary at T1 and T2. At these
treatment times, when there are multiple generations of Z. tritici in the field, an additional
mode-of-action which will protect the leaves, as well as provide a curative activity - to cover
the loss of azole efficacy - is required. Mixing with an SDHI is currently one of the best
options for disease control and protection of the azoles at these application timings. The
addition of isopyrazam to epoxiconazole reduced the shift in epoxiconazole sensitivity
compared to the solo products. However, the benefit was not seen both ways. It is possible
that if SDHI resistant strains do emerge, the benefit of adding the azole may become more
apparent. However, a couple points of caution should be noted here. In comparison to the
Gleam treatments (the pre-formulated epoxiconazole + metconazole mixture), the Seguris
treatments (the pre-formulated epoxiconazole + isopyrazam mixture) contained less
epoxiconazole. Mixture components should be included at rates which are effective when
used alone, and we saw in Chapter 2 that reduced rates of solo epoxiconazole were not
effective when used alone. The lower amount of epoxiconazole in the azole/SDHI mixture
(an amount of 3/4 the a.i. in the solo epoxiconazole) likely reduced the level of persistence of
epoxiconazole. This would have reduced the exposure time, having the effect of reducing
selection for strains with reduced epoxiconazole sensitivity. Conversely, it would have had
the effect of increasing the time that populations were exposed to the isolated SDHI. In the
instance of a high- plus low-risk mixture, reducing the dose of the high-risk or increasing the
dose of the low-risk fungicide has been shown to reduce the selection pressure on the high-
risk fungicide (Hobbelen et al., 2013). The components of the azole/SDHI mixture however,
are two at-risk fungicides. Few studies on this type of mixture have been carried out (van den
Bosch et al., 2014b), but in order to avoid unintentional exposure of one component to
resistance, it would be safest to mix components which have similar levels of persistence
(Shaw, 1993). Hence, one might speculate that if SDHI resistance strains were to arise, a
134
more effective rate of epoxiconazole in this mixture would be needed to control them.
However, that is assuming that SDHI resistance will arise in otherwise sensitive strains. What
happens if SDHI resistance arises in azole insensitive strains? Indeed, Fillinger et al. (2014)
showed that it is possible, if not likely, that such field strains will emerge. Consideration
should be given to how such strains would be controlled and what their impact on wheat
production would be.
If SDHIs are mixed in the same way that azoles are mixed, how would that affect the
development of resistance? In the baseline SDHI study, the level of cross-resistance between
most of the SDHIs provided evidence that those SDHIs should not be mixed together.
Conversely, the lack of cross-resistance between fluopyram and the other SDHIs might be a
characteristic which in theory could be exploited. Either way, mixing SDHIs should not be
viewed as an anti-resistance tactic, and should be done with caution (Anon, 2014a). The
Fungicide Resistance Action Group (FRAG-UK) publishes guidelines each year in line with
current research, and they suggest that tank mixtures of two SDHIs should be applied in a
balanced mixture, and always with another fungicide with a different mode-of-action which
provides equivalent disease control (Anon, 2014a). It is not made clear however, if the two
SDHIs can or should be added at the full solo rates, or if reducing the rates to the equivalent
of a single SDHI application is the best option. Shaw (1993) suggests that the latter option
would be best, and the current chair of FRAG-UK confirmed that the latter approach is best
(F. Burnett, personal communication). This should be clarified in the guidelines. Ultimately,
with the knowledge gained from these azole experiments, combined with the potential for
SDHI resistance to emerge (Fraaije et al., 2012) and for insensitive Z. tritici strains to re-
combine (Brunner et al., 2008), SDHI mixtures need to be managed carefully from the outset,
by limiting the total amount of SDHI active ingredient to the equivalent of a solo product and
by adding a mixing partner with a different mode-of-action.

135
Between 2008 and 2010, there was evidence that shifts in azole sensitivity had
stabilised (Stammler et al., 2008, Clark et al., 2010). However, the number of CYP51
variants found in the most recent studies of European strains (Buitrago et al., 2014) and the
collection in this study is an indication that the population has continued to evolve towards
azole resistance. This continued evolution means that constant updating of the research and
recommendations is a requirement for continuation of disease control and for resistance
management guidelines. In the early days of resistance monitoring it was hoped that
monitoring single amino-acid alterations could be used to make decisions regarding fungicide
application programs or to predict field control. However, the high levels of variation in Z.
tritici populations now makes that approach inadequate, and more complex molecular
diagnostic solutions are needed for these complex populations. It was previously thought that
managing wheat stubble, and so reducing the available primary inoculum, would help to
reduce gene-flow of azole insensitive alleles on a regional level (Linde et al., 2002).
However, parallel evolution of such alleles into different genetic backgrounds appears to be a
normal occurrence, and circumvents attempts to reduce their spread through mechanical
means. This highlights the importance of tackling the evolution of Z. tritici populations on a
wide scale, nationally, and internationally where possible. There are regions with higher
disease pressure and more diverse populations, and strains from those populations will
eventually spread or re-emerge. Lessons can be learned from these high disease pressure
areas.
For the moment, even though variation in the Sdh genes is present, it has no effect on
sensitivity. But, how long until resistant alleles emerge? Once they do emerge, they may
follow the same step-wise pattern as azole insensitive alleles, and the most recent survey data
suggest that this is a possibility. However, earlier experimental evidence suggests otherwise:
as with many other pathogens, Z. tritici populations may develop resistance to SDHIs which

136
is an all-consuming single-gene-no-fitness-cost resistance (Leroux & Walker, 2011), similar
to QoI resistance, and protecting SDHIs from that scenario is very important for wheat
production. Even though it has been speculated that the further accumulation of CYP51
alterations might be restricted (Mullins et al., 2011), the evidence for recombination between
CYP51 variants, as well as the presence of alternative resistance mechanisms, strongly
suggests that these populations are likely to continue evolving. Additionally, azoles are now
not only threatened by resistance, but also by legislation. European Regulation 1107/2009
has set out to improve agricultural systems while protecting human health and the
environment (Jess et al., 2014). Approval of products will move from a risk based to hazard
based decision system, and in the best case scenario, 16 products which are currently
approved for use in Ireland are likely to be withdrawn (Jess et al., 2014), which potentially
include some azoles and the multi-site chlorothalonil. In the long term, if azoles are removed
from the approved list, Europe-wide production of winter wheat and wheat self-sufficiency is
likely to decrease significantly (Di Tullio et al., 2012). In the short term, the loss of azoles
through either means would leave the SDHIs more exposed to resistance development.
Yield response to fungicide treatments in high disease pressure situations can be as
high as 5 t/ha (Blake, 2011), suggesting that the continuation of winter wheat production in
Ireland and other wheat growing regions of Europe is, in the immediate term at least, reliant
on the availability of effective fungicides. If azoles were to become unavailable for control of
STB, it would not be long before winter wheat production in Ireland would become
unsustainable. Winter wheat crops could be replaced by winter/spring barley without much
effort or capital. However, barley production is in itself at risk of losing the azoles which are
used to control pathogens such as Rhyncosporium commune, Ramularia collo-cygni and
Pyrenophora teres. Unlike Z. tritici though, the strobilurins, morpholines, and cyprodinyl are

137
all available and effective against the main disease of barley, R. commune, suggesting that the
loss of azoles will not impact barley production as quickly as it will impact wheat production.
The loss of wheat production in Ireland is the worst case scenario. We have relied on
fungicides for disease control for a long time, but other tools for managing STB are available.
Collectively known as integrated pest management (IPM), with the potential loss of azoles we
are being reminded of crop management practices which were once taken for granted, and
which are now necessary for sustainable crop production. Indeed, European Parliament
Directive 2009/128/EC requires each member country to draw up and act upon a plan for the
sustainable use of pesticides (National Action Plan, NAP), which should include a plan for the
promotion and adoption of IPM practices. Integrated pest management utilises all available
crop protection resources and crop management techniques. It is undertaken with a view to
reducing the disease pressure in the crop and our reliance on pesticides, and thus protecting
the environment while reducing inputs and associated costs. The principal method of
managing STB should be host variety choice. Taking into consideration local conditions and
expected disease pressure, STB host resistance, while not currently perfect, can reduce the
disease control burden on fungicides by reducing disease development, especially used in a
high disease pressure situation. The benefits of using good host resistance would also be
evident in situations where a grower has land some distance from the yard and in other
situations where precise application timings are not likely to be achieved. The drawback to
relying on host resistance is that varieties resistant to one disease may be susceptible to
another or have undesirable physiological traits (Brown, 2002). The search for useful STB-
resistant wheat germplasm is on-going. However, to be meaningful, research into and
subsequent development of varieties for STB resistance requires a multifaceted approach
(O'Driscoll et al., 2014). Use of many partial-resistance genes: pyramiding two or more R
genes, and mutating susceptibility genes, or even a combination of all three methods, would

138
provide a more solid base for STB host resistance (O'Driscoll et al., 2014). More generally,
integrated management of STB might include the following strategies: management of crop
canopy in order to reduce horizontal or vertical transfer of disease (Arraiano et al., 2009),
achieved through manipulation of seeding rates, N management and variety choice based on
physiological traits; reducing the green bridge in order to reduce early incidence of inoculum
(Suffert et al., 2011), achieved through stubble management, manipulation of sowing date and
host resistance; moving away from prophylactic spraying by making use of scientifically
sound forecasting and early diagnosis systems (Burke & Dunne, 2008), as well as designing
fungicide programmes which could be tailored around knowledge of the genetic makeup of
local populations. Additionally, biological agents for the control of wheat leaf spot diseases
are used successfully in some countries - such as Argentina (Perelló et al., 2009), and initial
studies have been carried out on the potential of biological control agents for management of
Z. tritici in an Irish setting (Kildea et al., 2008). However, poor efficacy of products outside
of the controlled environment (Kildea et al., 2008) suggests that further studies are necessary
before bio-control products will be accepted as a control for STB. While research on these
individual IPM parameters has been carried out previously, a study which combines all these
factors and examines them in an Irish setting is necessary to reach the IPM goal of the Irish
NAP.
Whilst this thesis provides a solid contribution to the current body of work on azole
sensitivity in Z. tritici, this work has also highlighted areas which would undoubtedly benefit
from further investigation:
Repeat the selection experiment (SDHI/azole) in controlled conditions using SDHI
lab mutants, or subsequent to SDHI resistance development. That would help provide
a more realistic picture of how our treatments would affect less sensitive populations.

139
Research on and promotion of IPM for managing STB, i.e. studies on the effects of
varietal resistance, seeding date, sowing rate, fertilisation on the development of STB.
This would provide up to date information on the benefits of utilising agronomic
practices in order to reduce the incidence of disease, and so reducing the pressure on
fungicides.
Inclusion of azole mixtures in modelling studies: to extend the range of models
available to cover azole mixtures and alternations, and to validate existing models on
combining two high-risk fungicides. Additionally, the inclusion of data from the
study of inserts in the promoter could be included into these models.
An extended study of the CYP51 gene of the complete collection of isolates in this
PhD would be a valuable addition to this work, and the general field of study. It
would help explain the observed effects of alternating and reducing doses of azoles.
This addition would only be practical if using cost-efficient sequencing methods such
as KASP or Next generation genotyping.
Inserts in the promoter region: while these were associated with reduced sensitivity,
further work is needed to ascertain whether it was a causal relationship and if so, what
the exact mechanisms were, especially for the ~800 bp insert.
Further work is needed to elucidate the mechanisms (other than potential over-
expression) which cause the large ranges in sensitivities in isolates from a single
CYP51 variant.
Fitness costs of resistance: to determine whether fitness costs to azole or SDHI
insensitivity exist or not.

140
A natural progression from this work would be to look at the effects of a full disease
control program on sensitivity. Additionally, a study on seed treatments to determine
whether azole seed treatments should be included in resistance management plans.

141
References
Anderson JB, 2005. Evolution of antifungal-drug resistance: mechanisms and pathogen
fitness. Nature Reviews Microbiology 3, 547-56.
Anon, 2013a. Winter Wheat Recommended list 2013 In.
http://www.agriculture.gov.ie/publications/2013/: Department of Agriculture, Food and the
Marine. (Accessed: 7/12/14)
Anon, 2013b. Fungicide performance in wheat for 2013. In.
http://www.bayercropscience.nl/BAYER/CropScience/BCS_NL.nsf/id/NL_20121213_news_
agri_jb_dos/$file/Fungicide_performance_in_wheat_for_2013.pdf: HGCA. (Accessed:
20/12/14)
Anon, 2013c. Sterol Biosynthesis Inhibitor (SBI) Working Group Annual Meeting. In.
http://www.frac.info/work/Minutes%20of%20the%202013%20Meeting%20Recommendation
s%20for%202014.pdf: Fungicide Resistance Action Committee. (Accessed: 28/12/14)
Anon, 2013d. Succinate Dehydrogenase Inhibitor (SDHI) Working Group annual meeting. In.
http://www.frac.info/work/Minutes%20of%20the%202013%20SDHI%20Meeting,%20Reco
mmendations%20for%202014.pdf: FRAC. (Accessed: 28/12/14)
Anon, 2014. Fungicide performance in wheat 2014. In.
http://cereals.ahdb.org.uk/media/547811/Fungicide-performance-in-wheat-2014-V2.pdf.
(Accessed: 28/06/15)
Anon, 2014a. FRAG-UK statement on SDHI fungicides and resistance risk in cereals. In.
http://www.pesticides.gov.uk/Resources/CRD/Migrated-Resources/Documents/F/frag-sdhi-
statement-cereals-april-2014.pdf: FRAG. (Accessed: 23/12/14)
Anon, 2014b. Fungicide resistance management in cereals. In.
http://www.hgca.com/media/175998/frag-2014-fungicide-resistance-management-in-cereals-
frag-2014-.pdf: HGCA. (Accessed: 19/12/14)
Anon, 2014c. The HGCA Wheat Disease Management Guide. In.
http://www.hgca.com/media/176167/g58-wheat-disease-management-guide-feb-2014-
update.pdf: HGCA. (Accessed: 28/06/15)

142
Anon, 2014d. Succinate Dehydrogenase Inhibitor (SDHI) Working Group annual meeting. In
http://www.frac.info/docs/default-source/sdhi-wg/minutes-of-the-2014-sdhi-meeting-
recommendations-for-2015-v2.pdf?sfvrsn=4 FRAC. (Accessed 08/07/15)
Anon, 2015. List of species resistant to SDHIs April 2015. In
http://www.frac.info/docs/default-source/sdhi-wg/sdhi-references/list-of-species-resistant-to-
sdhis-april-2015.pdf?sfvrsn=2: FRAC (Accessed: 08/07/15)
Arenas M, Posada D, 2010. The effect of recombination on the reconstruction of ancestral
sequences. Genetics 184, 1133-9.
Arraiano LS, Balaam N, Fenwick PM, et al., 2009. Contributions of disease resistance and
escape to the control of Septoria tritici blotch of wheat. Plant Pathology 58, 910-22.
Avenot HF, Michailides TJ, 2010. Progress in understanding moleular mechanisms and
evolution of resistance to succinate dehydrogenase inhibiting (SDHI) fungicides in
phytopathogenic fungi. Crop Protection 29, 643-51.
Avenot HF, Sellam A, Karaoglanidis G, Michailides TJ, 2008. Characterization of mutations
in the iron-sulphur subunit of succinate dehydrogenase correlating with boscalid resistance in
Alternaria alternata from California Pistachio. Phytopathology 98, 736-42.
Baccar R, Fournier C, Dornbusch T, Andrieu B, Gouache D, Robert C, 2011. Modelling the
effect of wheat canopy architecture as affected by sowing density on Septoria tritici
epidemics using a coupled epidemic- virtual plant model. Annals of Botany 108, 1179-94.
Bean TP. Amino acid alterations in CYP51 contribute toward reduced triazole sensitivities in
a UK field population of Mycosphaerella graminicola. Proceedings of the The BCPC
International congress- Crop Science & Technology, 2005, 467-70.
Bean TP, 2008. Characterisation of Mycosphaerella graminicola isolates with reduced azole
sensitivities. In.: HGCA, 1-42.
Bean TP, Cools HJ, Lucas JA, et al., 2009. Sterol content analysis suggests altered eburicol
14α-demethylase (CYP51) activity in isolates of Mycosphaerella graminicola adapted to
azole fungicide. Federation of European Microbiological Societies, Microbiology Letter 296,
266-73.

143
Birch CPD, Shaw MW, 1997. When can reduced doses of mixtures delay the build-up of
pesticide resistance? A mathematical model. Journal of Applied Ecology 34, 1032-42.
Blake J, Wynn S, Maumene C, Jorgensen LN, 2011. Evaluation of the benefits provided by
the azole class of compounds in wheat, and the effect of losing all azoles on wheat and potato
production in Denmark, France and the UK. In. Impact of the loss of all azoles. ADAS, 23.
(Adas, ed.)
Boeger JM, Chen RS, McDonald BA, 1993. Gene flow between geographic populations of
Mycosphaerella graminicola (Anamorph Septoria tritici) detected with restriction length
polymorphism markers. Phytopathology 83, 1148-54.
Bolton NJE, Smith JM, 1988. Strategies to combat fungicide resistance in barley powdery
mildew. Brighon Crop Protection conference- Pests and Diseases, 367-72.
Boukef S, McDonald BA, Yahyaoui A, Rezgui S, Brunner PC, 2012. Frequency of mutations
associated with fungicide resistance and population structure of Mycosphaerella graminicola
in Tunisia. European Journal of Plant Pathology 132, 111-22.
Brent KJ, Hollomon DW, 2007. Fungicide resistance: The assessment of risk. FRAC
monograph No. 2.
Broscious SC, Frank JA, Frederick JR, 1984. Influence of winter wheat management practices
on the severity of powdery mildew and septoria blotch in Pennsylvania. Phytopathology 75,
538-42.
Brown JKM, 2002. Yield penalties of disease resistance in crops. Current Opinion in Plant
Biology 5, 339-44.
Brunner PC, Stefanato FL, McDonald BA, 2008. Evolution of the CYP51 gene in
Mycosphaerella graminicola: evidence for intragenic recombination and selective
replacement. Molecular Plant Pathology 9, 305-16.
Buitrago C, Frey R, Wullschleger J, Sierotzki H. An update on the genetic changes in the
CYP51 gene of Mycosphaerella graminicola and thier relationship to DMI fungicide
sensitivity. In: Dehne HW, Deising HB, Fraaije B, et al., eds. Proceedings of the Modern
Fungicdes and Antifungal Compounds VII, 2014. Reinhardsbrunn, Germany: Deutsche
Phytomedizinische Gesellschaft, Braunschweig, 103-10.

144
Burke JJ, Dunne B, 2008. Field testing of six decision support systems for scheduling
fungicide applications to control Mycosphaerella graminicola on winter wheat crops in
Ireland. Journal of Agricultural Science 146, 415-28.
Burnett FJ, Zziwa MCN, 1997. Effect of application rate on the sensitivity of Erisiphe
graminis f.sp. tritici to fenpropimorph. Pesticide Science 51, 335-40.
Chassot C, Hugelshofer U, Sierotzki H, Gisi U. Sensitivity of CYP51 genotypes to DMI
fungicides in Mycosphaerella graminicola. In: Dehne HW, Deising HB, Gisi U, Kuck HH,
Russell PE, Lyr H, eds. Proceedings of the 15th International Reinhardsbrunn Symposium,
2008. Friedrichroda, Germany, 129-36.
Christ BJ, Frank JA, 1989. Influence of foliar fungicdes and seed treatments on powdery
mildew, septoria and leaf rust epidemics on winter wheat. Plant Disease 73, 148-50.
Clark B, Fraaije B, Lucas J, Cools H, 2010. Septoria resistance and azole use 2010. RRA
newsletter January 2010.
Clark WS, 2006a. Fungicide resistance: are we winning the battle but losing the war? Aspects
of Applied Biology 78, 119-26.
Cook RJ, Hims MJ, Vaughan TB, 1999. Effects of fungicide spray timing on winter wheat
disease control. Plant Pathology 48, 33-50.
Cools HJ, Bayon C, Atkins S, Lucas JA, Fraaije BA, 2012. Overexpression of the sterol 14α-
demethylasegene (MgCYP51) in Mycosphaerella graminicola isolates confers a novel azole
fungicide sensitivity phenotype. Pest Management Science 68, 1034-40.
Cools HJ, Fraaije BA, 2006. Evolution of azole resistance mechanisms in UK populations of
Mycosphaerella graminicola. Aspects of Applied Biology 78, 21-7.
Cools HJ, Fraaije BA, 2008. Are azole fungicides losing ground against Septoria wheat
disease? Resistance mechanisms in Mycosphaerella graminicola. Pest Management Science
64, 681-4.
Cools HJ, Fraaije BA, 2013. Update on mechanisms of azole resistance in Mycosphaerella
graminicola and implications for future control. Pest Management Science 69, 150-5.

145
Cools HJ, Fraaije BA, Lucas JA. Molecular examination of Septoria tritici isolates with
reduced sensitivities to triazoles. In: Dehne HW, Gisi U, Kuck KH, Russell PE, Lyr H, eds.
Proceedings of the Modern Fungicides and Antifungal Compounds IV, 2005b. BCPC, Alton,
UK, 103-14.
Cools HJ, Fraaije BA, Lucas. JA. Molecular mechanisms correlated with changes in triazole
sensitivity in isolates of Mycosphaerella graminicola. Proceedings of the Proceedings of the
BCPC congress, Crop Science & Technology, 2005a. Alton, Hants, UK, 267-74.
Cools HJ, Hawkins NJ, Fraaije BA, 2013. Constraints on the evolution of azole resistance in
plant pathogenic fungi. Plant Pathology 62, 36-42.
Cools HJ, Mullins JGL, Fraaije BA, et al., 2011. Impact of recently emerged sterol 14α-
demethylase (CYP51) variants of Mycosphaerella graminicola on azole fungicide sensitivity.
Applied and Environmental Microbiology 77, 3830-7.
Cools HJ, Parker JE, Kelly DE, Lucas JA, Fraaije BA, Kelly SL, 2010. Heterologous
expression of mutated eburicol 14α-Demethylase (CYP51) proteins of Mycosphaerella
graminicola to assess effects on azole fungicide sensitivity and intrinsic protein function.
Applied and Environmental Microbiology 76, 2866-72.
Crawley MJ, 2005. Statistics: An introduction using R. The Atrium, Southern Gate,
Chichester, West Sussex, PO19 8SQ, England: John Wiley & Sons, Ltd.
Di Tullio E, Camanzi L, Fontolan F, Volpato C, Zucconi S, 2012. The assessment of the
economic importance of azoles in European agriculture: Wheat case study. In. Nomisma,
Bologna, Italy.
Dinoor A, 1977. Seed treatment of wheat with benzimidazole fungicides against Septoria
tritici under semi-arid conditions. Netherlands Journal of Plant Pathology 83, 339-42.
Drabešová J, Ryšánek P, Brunner P, McDonald B, Croll D, 2013. Population genetic structure
of Mycosphaerella graminicola and Quinone Outside Inhibitor (QoI) resistance in the Czech
Republic. European Journal of Plant Pathology 135, 211-24.
Du Rieu AG, Burke RJ, Murray A, 1994. Effectiveness of a novel
propiconazole/fenbuconazole mixture for the control of Septoria spp. and Puccinia spp. in
wheat. Brighton Crop Protection Conference- Pests and Diseases 1, 319-24.

146
Dunne B, Burke JJ, Grace J. Maximising returns from fungicide use in cereals. Proceedings
of the National Tillage Conference, 2008, 47-58.
Duvivier M, Dedeurwaerder G, De Proft M, Moreau J-M, Legreve A, 2013. Real-time PCR
quantification and spatio-temporal distribution of airborne inoculum of Mycosphaerella
graminicola in Belgium. European Journal of Plant Pathology 137, 325-41.
Estep LK, Torriani SFF, Zala M, et al., 2014. Emergence and early evolution of fungicide
resistance in North American populations of Zymoseptoria tritici. Plant Pathology, n/a-n/a.
Eyal A, 1981. Integrated control of Septoria diseases of wheat. Plant Disease 65, 763-8.
Fillinger S, Omrane S, Sghyer H, et al. Characterisation of molecular mechanisms underlying
the multi-drug-resistant phenotypes of Mycosphaerella graminicola field isolates. In: Dehne
HW, Deising HB, Fraaije B, et al., eds. Proceedings of the Modern Fungicdes and Antifungal
Compounds VII, 2014. Reinhardsbrunn, Germany: Deutsche Phytomedizinische Gesellschaft,
Braunschweig, 111-6.
Fraaije B, Cook RJ, Kim SH, Motteram J, Clark WS, Lucas J, 2007. A novel substitution
I381V in the sterol 14α-demethylase (CYP51) of Mycosphaerella graminicola is
differentially selected by azole fungicides. Molecular Plant Pathology 8, 245-54.
Fraaije BA, Bayon C, Atkins S, Cools HJ, Lucas JA, Fraaije MW, 2012. Risk assessments
studies on succinate dehydrogenase inhibitors, the new weapons in the battle to control
septoria leaf blotch in wheat. Molecular Plant Pathology 13, 263-75.
Fraaije BA, Burnett FJ, Cools HJ, et al., 2011. Understanding evolution and selection of azole
resistance mechanisms in UK populations of Mycosphaerella graminicola. In. HGCA Project
Report 475. Home Grown Cereals Authority- HGCA.
Fraaije BA, Cools HJ, Fountaine J, et al., 2005. Role of ascospores in further spread of QoI-
resistant cytochrome b alleles (G143A) in field populations of Mycosphaerella graminicola.
Phytopathology 95, 933-41.
Fraaije BA, Lucas JA, Clark WS, Burnett FJ, 2003. QoI resistance development in
populations of cereal pathogens in the UK. In. Proceedings British Crop Protection Council
International Congress- Crop Science & Technology. The British Crop Protection Council,
Alton, Hampshire, UK, 689-94. (2.)

147
Genet J, Jaworska G, Deparis F, 2006. Effect of dose rate and mixtures of fungicides on
selection for QoI resistance in populations of Plasmopara viticola. Pest Management Science
62, 188-94.
Gigot C, Saint-Jean S, Huber L, et al., 2013. Protective effects of a wheat cultivar mixture
against splash-dispersed Septoria tritici blotch epidemics. Plant Pathology 62, 1011-9.
Gladders P, Paveley ND, Barrie IA, et al., 2001. Agronomic and meteorological factors
affecting the severity of leaf blotch caused by Mycosphaerella graminicola in commercial
wheat crops in England. Annals of Applied Biology 138, 301-11.
Gooding MJ, Dimmock JPRE, France J, Jones SA, 2000. Green leaf ares decline of wheat
flag leaves: the influence of fungicides and relationships with mean grain weight and grain
yield. Annals of Applied Biology 136, 77-84.
Goodwin SB, Ben M'barek S, Dhillon B, et al., 2011. Finished genome of the fungal wheat
pathogen Mycosphaerella graminicola reveals dispensome structure, chromosome plasticity,
and stealth pathogenesis. PLoS Genetics 7, e1002070.
Gosling P, Nicholls C, Watts J, 2014. HGCA Barley disease management guide. In: Boys E,
Burgess J, eds. http://www.hgca.com/media/176243/g59-barley-disease-management-guide-
feb-2014-update.pdf: HGCA, 28. (Publications H, ed.)
Gough FJ, Lee TS, 1985 Moisture effects on the discharge and survival of conidia of Septoria
tritici. Phytopathology 75, 180-2.
Graham J, Mcneney B, Seillier-Moiseiwitsch F, 2005. Stepwise detection of recombination
breakpoints in sequence alignments. Bioinformatics 21, 589-95.
Green CF, Ivins JD, 1985. Time of sowing and the yield of winter wheat. Journal of
Agricultural Science 104, 235-8.
Gressel J, 2010. Low pesticide rates may hasten the evolution of resistance by increasing
mutation frequencies. Pest Management Science 67, 253-7.
Griffin MJ, Fisher N, 1985. Laboratory studies of benzimidazole resistance in Septoria tritici.
EPPO Bulletin 15, 505-11.

148
Gudmestad NC, Arabiat S, Miller JS, Pasche JS, 2013. Prevalence and impact of SDHI
fungicide resistance in Alternaria solani. Plant Disease 97, 952-60.
Hall TA, 1999. BioEdit: a user friendly biological sequence alignment editor and analysis
program for Windows 95/98/NT. In. Oxford University Press, 95-8. (Nucleic Acids
Symposium; vol. 41.)
Hamamoto H, Hasegawa K, Nakaunem R, et al., 2000. Tanden repeat of transcriptional
enhancer upstream of the sterol 14α-demethylase gene (CYP51) in Penecillium digitatum.
Applied and Environmental Microbiology 66, 3421-6.
Hawkesford MJ, Araus J-L, Park R, et al., 2013. Prospects of doubling global wheat yields.
Food and Energy Security 2, 34-48.
Henze M, Beyer M, Klink H, Verreet JA, 2007. Characterising meteorological scenarios
favourable for Septoria tritici infections in wheat and estimation of latent periods. The
Americal Phytopathological Society, Plant Disease 91, 1445-9.
Hermann D, Gisi U, 1994. Cross-resistance among DMI-fungicides and sensitivity
distributions of Septoria tritici populations. Brighton Crop Protection Conference- Pests and
Diseases, 487-92.
Hobbelen PHF, Paveley ND, Fraaije BA, Lucas JA, Van Den Bosch F, 2011a. Derivation and
testing of a model to predict selection for fungicide resistance. Plant Pathology 60, 304-13.
Hobbelen PHF, Paveley ND, Oliver RP, Van Den Bosch F, 2013. The usefulness of fungicide
mixtures and alternation for delaying the selection for resistance in populations of
Mycosphaerella graminicola on winter wheat: A modeling analysis. Phytopathology 103,
690-707.
Hobbelen PHF, Paveley ND, Van Den Bosch F, 2011c. Delaying selection for fungicide
insensitivity by mixing fungicides at a low and high risk of resistance development: A
modelling analysis. Phytopathology 101, 1224-33.
Hobbelen PHF, Paveley ND, Van Den Bosch F, 2014. The emergence of resistance to
fungicides. PLoS One 9, e91910.

149
Hollomon D, Cooke LR, Locke T, 2002. Maintaining the effectiveness of DMI fungicides in
cereal disease control strategies. In. HGCA Project Report 275. Home Grown Cereals
Association- HGCA.
Ishii H, Miyamoto T, Ushio S, Kakishima M, 2011. Lack of cross-resistance to a novel
succinate dehydrogenase inhibitor, fluopyram, in highly boscalid-resistant isolates of
Cornespora cassiicola and Podosphaera xanthii. Pest Management Science 67, 474-82.
Jess S, Kildea S, Moody A, Rennick G, Murchie AK, Cooke LR, 2014. European Union
policy on pesticides: implications for agriculture in Ireland. Pest Management Science 70,
1646-54.
Kable PF, Jeffery H, 1980. Selection for tolerance in organisms exposed to sprays of biocide
mixtures: A theoretical model. Phytopathology 70, 8-12.
Kema GHJ, Verstappen ECP, Todorova M, Waalwijk C, 1996. Successful crosses and
molecular tetrad and progeny analyses demonstrate heterothallism in Mycosphaerella
graminicola. Current Genetics 30, 251-8.
Kendall SJ, Hollomon D, Tolbutt KB, Salter AC, 1996. Triazole mixtures and the control of
wheat leaf blotch (Septoria tritici). Brighton Crop Protection Conference- Pests and
Diseases, 251-6.
Kendall SJ, Hollomon DW, 1994. Towards the rational use of triazole mixtures for cereal
disease control. Brighton Crop Protection Conference- Pests and Diseases, 549-56.
Kildea S, 2009. Fungicide resistance in the wheat pathogen Mycosphaerella graminicola.
Belfast: The Queen's Universsity of Belfast, PhD.
Kildea S, Glynn L. Cereal disease control. Proceedings of the National Tillage Conference:
Understanding variability to improve precision and profit, 2014. Kilkenny: Teagasc.
Kildea S, Mullins E, Mercer PC, Cooke LR, Dunne B, O'Sullivan E, 2006. Sensitivity of
Mycosphaerella graminicola populations in the Republic of Ireland to DMI and QoI
fungicides. Aspects of Applied Biology 78.
Kildea S, Ransbotyn V, Khan MR, Fagan B, Leonard G, Mullins E, Doohan FM, 2008.
Bacillus megaterium shows potential for the biocontrol of septoria tritici blotch of wheat.
Biological Control 47:1, 37-45.

150
Kildea S, Mehenni-Ciz J, Spink J, O'Sullivan E. Changes in the frequency of Irish
Mycosphaerella graminicola CYP51 variants 2006-2010. In: Dehne HW, Deising HB, Fraaije
B, et al., eds. Proceedings of the Modern Fungicdes and Antifungal Compounds VII, 2014.
Reinhardsbrunn, Germany: Deutsche Phytomedizinische Gesellschaft, Braunschweig, 143-4.
Koller W, Wilcox WF, 1999. Evaluation of tactics for managing resistance of venturia
inaequalis to sterol demethylation inhibitors. Plant Disease 83, 857-63.
Kosman E, Cohen Y, 1996. Procedures for calculating and differentiating synergism and
antagonism in action of fungicide mixtures. Phytopathology 86, 1263-72.
Kuck HH, Mehl A, 2004. Prothioconazole: Sensitivity profile and anti-resistance strategy.
Pflanzenschutz-Nachrichten Bayer 57, 225-36.
Leitch MH, Jenkins PD, 1995. Influence of nitrogen on the development of Septoria
epidemics in winter wheat. The Journal of Agricultural Science 124, 361-8.
Lemey P, Posada D, 2009. Introduction to recombination detection. In: Lemey P, Salemi M,
Vandamme A-M, eds. The Phylogenetic Handbook: A Practical Approach to Phylogenetic
Analysis and Hypothesis Testing. University Printing House, Cambridge, CB2 8BS, United
Kingdom: Cambridge University Press, 493-518.
Leroux P, Albertini C, Gautier A, Gredt M, Walker AS, 2007. Mutations in the CYP51 gene
correlated with changes in sensitivity to sterol 14α-demethylation inhibitors in field isolates of
Mycosphaerella graminicola. Pest Management Science 63, 688-98.
Leroux P, Gredt M, Walker AS, Moinard JM, Caron D. Resistance of the wheat leaf blotch
pathogen Septoria tritici to fungicides in France. In: Dehne HW, Gisi U, Kuck KH, Russell
PE, Lyr H, eds. Proceedings of the Modern Fungicides and Antifungal compounds IV, 2005.
BCPC, Alton, UK, 115-24.
Leroux P, Walker AS, 2011. Multiple mechanisms account for resistance to sterol 14α-
demethylation inhibitors in field isolates of Mycosphaerella graminicola. Pest Management
Science 67, 44-59.
Levy Y, Levi R, Cohen Y, 1983. Build-up of a pathogen subpopulation resistant to a systemic
fungicide under various control strategies: a flexible simulation model. Phytopathology 73,
1475-80.

151
Librado P, Rozas J, 2009. DnaSP v5: A software for comphrensive analysis of DNA
polymorphism data. Bioinformatics 25, 1451-2.
Linde CC, Zhan J, McDonald BA, 2002. Population structure of Mycosphaerella
graminicola: from lesions to continents. Phytopathology 92, 946-55.
Luo C-X, Schnabel G, 2008. The cytochrome p450 lanosterol 14α-demethylase gene is a
demethylation inhibitor fungicide resistance determinant in Monilinia fructicola field isolates
from Georgia. Applied and Environmental Microbiology 74, 359-66.
Ma Z, Proffer TJ, Jacobs JL, Sundin GW, 2006. Overexpression of the 14α-demethylase
target gene (CYP51) mediates fungicides resistance in Blumeriella jaapii. Applied and
Environmental Microbiology 72, 2581-5.
Mavroeidi VI, Shaw MW, 2005. Sensitivity distributions and cross-resistance patterns of
Mycosphaerella graminicola to fluquinconazole, prochloraz and azoxystrobin over a period
of 9 years. Crop Protection 24, 259-66.
Mavroeidi VI, Shaw MW, 2006. Effects of fungicide dose and mixtures on selection for
triazole resistance in Mycosphaerella graminicola under field conditions. Plant Pathology 55,
715-25.
Mavroidis VJ, Shaw MW, 2002. Effect of dose rate and mixture on selection for reduced
sensitivity to triazole fungicides in Mycosphaerella graminicola. The BCPC Conference-
Pests and Diseases 8D-13, 859-64.
McDonald BA, 2004. Population genetics of plant pathology. In. The Plant Health Instructor.
The American Phytopathological Society. Online
http://www.apsnet.org/edcenter/advanced/topics/popgenetics/Pages/default.aspx (Accessed 1-
5-2015)
Metcalfe RJ, Shaw MW, 1998. Factors affecting the strength of selection for resistance to
DMI fungicides in Septoria tritici. Brighton 1998 Conf: Pests Dis. British Crop Protection
Council, Farnham, U.K., 535-42.
Metcalfe RJ, Shaw MW, Russell PE, 2000. The effect of dose and mobility on the strength of
selection for DMI fungicide resistance in inoculated field experiments. Plant Pathology 49,
546-57.
152
Miedaner T, Zhao Y, Gowda M, et al., 2013. Genetic architecture of resistance to Septoria
tritici blotch in European wheat. BMC Genomics 14, 858.
Mikaberidze A, McDonald BA, Bonhoeffer S, 2014. Can high-risk fungicides be used in
mixtures without selecting for fungicide resistance? Phytopathology 104, 324-31.
Mullins JGL, Parker JE, Cools HJ, et al., 2011. Molecular Modelling of the Emergence of
Azole Resistance in Mycosphaerella graminicola. PLoS One 6, e20973.
Nei M, 1973. Analysis of gene diversity in subdivided populations. Proceedings of the
National Academy of Sciences USA 70, 3321-3.
Nikou D, Malandrakis A, Konstantakaki M, Vontas J, Markoglou A, Ziogas B, 2009.
Molecular characterization and detection of overexpression C-14 alpha-demethylase-based
DMI resistance in Cercospora beticola field isolates. Pesticide Biochemistry and Physiology
95, 18-27.
O'Driscoll A, Kildea S, Doohan F, Spink J, Mullins E, 2014. The wheat-Septoria conflict: a
new front opening up? Trends in Plant Science 19, 602-10.
O'Sullivan E, 2009. Assessing populatuons of the major cereal pathogens for reduced
sensitivity to MBC, DMI and Strobilurin fungicides. In. Teagasc End of Year Report 5078.
Teagasc, 1-16.
O'Sullivan E, Kildea S. Sensitivity of septoria to fungicides- What’s new? Proceedings of the
National Tillage Conference, 2010, 50-60.
Oerke EC, Dehne HW, 2004. Safeguarding production- losses in major crops and the role of
crop protection. Crop Protection 23, 275-85.
Oxley S, Gosling P, Nicholls C, Watts J, 2014. HGCA Wheat disease management guide. In:
Boys E, Burgess J, eds. http://www.hgca.com/media/176167/g58-wheat-disease-management-
guide-feb-2014-update.pdf: HGCA, 28. (Publications H, ed.)
Palmer C-L, Skinner W, 2002. Mycosphaerella graminicola: latent infection, crop devestation
and genomics. Molecular Plant Pathology 3, 63-70.
Paveley ND, Lockley D, Vaughan TB, Thomas J, Schmidt K, 2000. Predicting effective
fungicide doses through observation of leaf emergence. Plant Pathology 49, 748-66.

153
Paveley ND, Thomas JM, Vaughan TB, Havis ND, Jones DR, 2003. Predicting effective
doses for the joint action of two fungicide applications. Plant Pathology 52, 638-47.
Perelló AE, Moreno MV, Mónaco C, Simón MR, Cordo C, 2009. Biological control of
Septoria tritici blotch on wheat by Trichoderma spp. under field conditions in Argentina.
BioControl 54, 113-22.
Perron GG, Kryazhimskiy S, Rice DP, Buckling A, 2012. Multidrug-therapy and evolution of
antibiotic resistance: When order matters. Applied and Environmental Microbiology 78, 6137-
42.
Pijls CFN, Shaw MW, 1997. Weak selection by field sprays for flutriafol resistance in
Septoria tritici. Plant Pathology 46, 247-63.
Ponomarenka A, Goodwin SB, Kema GHJ, 2011. Septoria tritici blotch (STB) of wheat. In.
Plant Health Instructor.
Quaedvlieg W, Kema GHK, Groenewald JZ, et al., 2011. Zymoseptoria gen. nov.:a new
genus to accommodate Septoria-like species occurring in graminicolous hosts. Persoonia 26,
57-69.
Quérou R, Euvrard M, Gauvrit C, 1998. Uptake and fate of triticonazole applied as seed
treatment to spring wheat (Triticum aestivum L.). Pesticide Science 53, 324-32.
Russell PE, 2005. A century of fungicide evolution. Journal of Agricultural Science 143, 11-
25.
Samoucha T, Gisi U, 1987. Use of two- and three-way mixtures to prevent build-up of
resistance to phenylamide fungicides in Phytophthora and Plasmopara. The Americal
Phytopathological Society 77, 1405-9.
Sanders PL, Houser WJ, Parish PJ, Cole J, H., 1985. Reduced-rate fungicide mixtures to
delay fungicide resistance and to control selected turfgrass diseases. Plant Disease 69, 939-
43.
Scalliet G, Boehler M, Bowler J, Green PS, Kilby PM, Fonne-Pfister R. SDHIs and the fungal
succinate dehydrogenase. In: Dehne HW, Deising HB, Gisi U, Kuck KH, Russell PE, Lyr H,
eds. Proceedings of the Modern fungicides and Antifungal compounds VI, 2011.
Reinhardsbrunn, Friedrichroda, Germany, 171-8.

154
Scalliet G, Bowler J, Luksch T, et al., 2012. Mutagenesis and functional studies with
succinate dehydrogenase inhibitors in the wheat pathogen Mycosphaerella gramninicola.
PLoS One 7, e35429.
Schierup MH, Hein J, 2000. Consequences of recombination on traditional phylogenetic
analysis. Genetics 156, 879-91.
Schnabel G, Jones AL, 2001. The 14α-demethylase (CYP51A1) gene is overexpressed in
Venturia inaequalis strains resistant to myclobutanil. Phytopathology 91, 102-10.
Schnieder F, Koch G, Jung C, Verreet JA, 2001. Genotypic diversity of the wheat leaf blotch
pathogen Mycosphaerella graminicola (anamorph) Septoria tritici in Germany. European
Journal of Plant Pathology 107, 285-90.
Schürch S, Cordette T, 2013. Grundempfindlichkeit der Septoria-Blattdürre des Weizens
gegenüber den SDHI-Fungiziden. Agrarforschung Schweiz 4, 82-7.
Shaner G, Finney RE, 1976. Weather and epidemics of septoria leaf blotch of wheat.
Phytopathology 66, 781-5.
Shaw MW, 1989. A model of the evolution of polygenically controlled fungicide resistance.
Plant Pathology 38, 44-55.
Shaw MW, 1991. Interacting effects of interrupted humid periods and light on infection of
wheat leaves by Mycosphaerella graminicola (Septoria tritici). Plant Pathology 40, 595-607.
Shaw MW, 1993. Theoretical analysis of the effect if interacting activities on the rate of
selection for combined resistance to fungicide mixtures. Crop Protection 12, 120-7.
Shaw MW, 2000. Models of the effects of dose heterogeneity and escape on selection
pressure for pesticide resistance. Phytopathology 90, 333-9.
Shaw MW, 2007. Is there such a thing as a fungicide resistance strategy? A modeller's
perspective. Aspects of Applied Biology 78, 37-43.
Shaw MW, 2009. Fungicide resistance: the dose rate debate. Outlooks on Pest Management
20, 100-3.

155
Shaw MW, Royle DJ, 1989. Airborne inoculum as a major source of Septoria tritici
(Mycosphaerella graminicola) infections in winter wheat crops in the UK. Plant Pathology
38, 35-43.
Shaw MW, Royle DJ, 1993. Factors determining the severity of epidemics of Mycosphaerella
graminicola (Septoria tritici) on winter wheat in the UK. Plant Pathology 42, 882-99.
Shtienberg D, 1992. Effects of seed treatment with thiabendazole on septoria leaf blotch and
growth of wheat. Plant Disease 76, 178-82.
Sierotzki H, Scalliet G, 2013. A review of current knowledge of resistance aspects for the
next-generation succinate dehydrogenase inhibitor fungicides. Phytopathology 103, 880-7.
Simón MR, Cordo CA, Perelló AE, Struik PC, 2003. Influence of nitrogen supply on the
susceptibility of wheat to Septoria tritici. Journal of Phytopathology 151, 283-9.
Skinner W, Bailey A, Renwick A, Keon J, Gurr S, Hargreaves J, 1998. A single amino-acid
substitution in the iron-sulphur protein subunit of succinate dehydrogenase determines
resistance to carboxin in Mycosphaerella graminicola. Current Genetics 34, 393-8.
Skylakakis G, 1981. Effects of alternating and mixing pesticides on the buildup of fungal
resistance. The Americal Phytopathological Society 71, 1119-21.
Stammler G, Carstensen M, Koch A, Semar M, Strobel D, Schlehuber S, 2008. Frequency of
different CYP51-haplotypes of Mycosphaerella graminicola and their impact on
epoxiconazole-sensitivity and -field efficacy. Crop Protection 27, 1448-56.
Stammler G, Glattli A, Koch A, Schlehuber S. Mutations in the target protein conferring
resistance to SDHI fungicides. In: Dehne HW, Deising HB, Gisi U, Kuck KH, Russell PE,
Lyr H, eds. Proceedings of the Modern fungicides and Antifungal compounds VI, 2011.
Reinhardsbrunn, Friedrichroda, Germany, 195-8.
Stammler G, Semar M, 2011. Sensitivity to Mycosphaerella graminicola (anamorph: Septoria
tritici) to DMI fungicides across Europe and impact on field performance. EPPO Bulletin 41,
149-55.
Stergiopoulos I, Van Nistelrooy JG, Kema GH, De Ward MA, 2003. Multiple mechanisms
account for variation in base-line sensitivity to azole fungicides in field isolates of
Mycosphaerella graminicola. Pest Management Science 59 1333-43.

156
Strobel D, Bryson R, Stammler G, Semar M. A European overview of the sensitivity of
Mycosphaerella graminicola (Zymoseptoria tritici) to DMI fungicides in vitro and the relative
impact on field performance. In: Dehne HW, Deising HB, Fraaije B, et al., eds. Proceedings
of the Modern Fungicdes and Antifungal Compounds VII, 2014. Reinhardsbrunn, Germany:
Deutsche Phytomedizinische Gesellschaft, Braunschweig, 257-62.
Suffert F, Sache I, Lannou C, 2011. Early stages of septoria tritici blotch epidemics of winter
wheat: build-up, over seasoning, and release of primary inoculum. Plant Pathology 60, 166-
77.
Sundin DR, Bockus WW, Eversmeyer MG, 1999. Triazole treatments suppress spore
production by Puccinia recondita, Septoria tritici and Stagonospora nodorum from wheat
leaves. Plant Disease 83, 328-32.
Sylvester-Bradley R, Berry PM, Blake J, et al., 2008. The wheat growth guide. Caledonian
House, 223 Pentonville, London, N1 9HY: HGCA.
Tamura K, Stecher G, Peterson D, Filipski A, Kumar S, 2013. MEGA6: Molecular
Evoultionary Genetics Analysis version 6.0. Molecular Biology and Evolution 30, 2725-9.
Thygesen K, Jorgensen LN, Jensen KS, Munk L, 2009. Spatial and temporal impact of
fungicide spray strategies on fungicide sensitivity of Mycosphaerella graminicola in winter
wheat. European Journal of Plant Pathology 123, 435-47.
Tompkins DK, Fowler DB, Wright AT, 1993. Influence of agronomic practices on canopy
microclimate and septoria development in no-till winter wheat production in the Parkland
region of Saskatchewan. Canadian Journal of Plant Science 73, 331-44.
Van Den Berg F, Van Den Bosch F, Paveley ND, 2013. Optimal fungicide application
timings for disease control are also an effective anti-resistance strategy: A Case Study for
Zymoseptoria tritici (Mycosphaerella graminicola) on Wheat. Phytopathology 103, 1209-19.
Van Den Bosch F, Oliver R, Van Den Berg F, Paveley N, 2014a. Governing principles can
guide fungicide-resistance management tactics. Annual Review of Phytopathology 52, 175-95.
Van Den Bosch F, Paveley N, Shaw M, Hobbelen P, Oliver R, 2011. The dose rate debate:
does the risk of fungicide resistance increase or decrease with dose? Plant Pathology 60, 597-
606.

157
Van Den Bosch F, Paveley N, Van Den Berg F, Hobbelen P, Oliver R, 2014b. Mixtures as a
fungicide resistance management tactic. Phytopathology 104, 1264-73.
Veloukas T, Markoglou AN, Karaoglanidis GS, 2013. Differential effect of SdhB gene
mutations on the sensitivity to SDHI fungicides in Botrytis cinerea. Plant Disease 97, 118-22.
Viljanen-Rollinson SLH, Marroni MV, Butler RC, Deng Y, Armour T, 2005. Latent periods
of Septoria tritici blotch on ten cultivars of wheat. New Zealand Plant Protection 58, 256-60.
Walter H. New fungicides and new modes of action. In: Dehne HW, Deising HB, Gisi U,
Kuck KH, Russell PE, Lyr H, eds. Proceedings of the Modern fungicides and Antifungal
compounds VI, 2011. Reinhardsbrunn, Friedrichroda, Germany, 47-54.
Whittenberg AHJ, Van Der Lee TaJ, Ben M'barek S, et al., 2009. Meiosis drives
extraordinary genome plasticity in the haploid fungal plant pathogen Mycosphaerella
graminicola. PLoS One 4, e5863.
Yoshida Y, Aoyama Y, 1987. Interaction of azole antifungal agents with cypochrome P-
45014dm purified from Saccharomyces cerevisiae microsomes. Biochemical Pharmacology 36,
229-35.
Zadocks JC, Chang TT, Konzak CF, 1974. A decimal code for the growth stages. Weed
Research 14, 415-21.
Zhan J, McDonald BA, 2004. The interaction among evolutionary forces in the pathogenic
fungus Mycosphaerella graminicola. Fungal Genetics and Biology 41, 590-9.
Zhan J, Mundt CC, McDonald BA, 1998. Measuring immigration and sexual reproduction in
field populations of Mycosphaerella graminicola. Phytopathology 88, 1330-7.
Zhan J, Mundt CC, McDonald BA, 2007. Sexual reproduction facilitates the adaption of
parasites to antagonistic host environments: evidence from empirical study in the wheat-
Mycosphaerella graminicola system. International Journal of Parasitology 37 861-70.
Zhan J, Pettway RE, McDonald BA, 2003. The global genetic structure of the wheat pathogen
Mycosphaerella graminicola is characterized by high nuclear diversity, low mitochondrial
diversity, regular recombination, and gene flow. Fungal Genetics and Biology 38, 286-97.

158
Zhan J, Stefanato FL, McDonald BA, 2006. Selection for increased cypoconazole tolerance in
Mycosphaerella graminicola through local adaption and in response to host resistance.
Molecular Plant Pathology 7, 259-68.
Zwiers L-H, Stergiopoulous I, Van Nistelrooy JGM, De Waard MA, 2002. ABC transporters
and azole sensitivity in laboratory strains of the wheat pathogen Mycosphaerella graminicola.
Antimicrobial Agents and Chemotherapy 46, 3900-6.
Zziwa MCN, Burnett FJ, 1994. The effect of reduced doses on the sensitivity of powdery
mildew to fenpropimorph in barley field trials. BCPC Monograph No 60: Fungicide
resistance, 303-8.