further investigations into the lower hunter river estuary
TRANSCRIPT

Acid Sulfate Soils Further investigations into the Lower Hunter River Estuary:
Woodberry, Irrawang and West Hexham Swamps
December 2010

Title: Acid Sulfate Soils: Further investigations into the Lower Hunter River Estuary (Woodberry, Irrawang and West Hexham Swamps).
Authors: Roy Lawrie, Jenny Fredrickson and Brett Enman
© State of New South Wales through Department of Industry and Investment (Industry & Investment NSW) 2010
This publication is copyright. You may download, display, print and reproduce this material in an unaltered form only (retaining this notice) for your personal use or for non-commercial use within your organisation. To copy, adapt, publish, distribute or commercialise any of this publication you will need to seek permission from the Manager Publishing, Industry & Investment NSW, Orange.
Cover photos: Soil sampling in Woodberry Swamp (top left), Western Hexham Swamp (top right), Woodberry Soil Core (bottom left), Deep core soil sampling in Irrawang Swamp (bottom right).
This report should be cited as Industry and Investment NSW (2010) , Acid Sulfate Soils: Further investigations into the Lower Hunter River Estuary (Woodberry, Irrawang and West Hexham Swamps). Report to the Hunter Central River Catchment Management Authority. Industry and Investment NSW, Port Stephens.
This report follows on from NSW Department of Primary Industries (2008) Acid Sulfate Soils: Priority Investigations for the Lower Hunter River Estuary. Report to the Department of Environment, Water, Heritage and the Arts.
Disclaimer The information contained in this publication is based on knowledge and understanding at the time of writing. However, because of advances in knowledge, users are reminded of the need to ensure that information on which they rely is up to date and to check the currency of the information with the appropriate officer of Industry & Investment NSW or the user’s independent advisor.

ACID SULFATE SOILS: FURTHER INVESTIGATIONS INTO THE LOWER HUNTER ESTUARY PAGE I
EXECUTIVE SUMMARY
Acid sulfate soils are a naturally occurring feature of many coastal floodplains. Changes to land use on floodplains, for example wetland drainage, have lead to the oxidation of sulfidic soils, resulting in acid leaching from the soil causing water quality problems and impacts on aquatic habitat.
This report details the results of a study into the distribution and severity of acid sulfate soils in three wetlands in the Lower Hunter River Estuary on the Lower North Coast of NSW, near Newcastle: Woodberry Swamp, Irrawang Swamp and Hexham Swamp (the western margins), as well as providing recommendations for future research and on ground works in view of the findings.
This study, entitled Acid Sulfate Soils: Further Investigations into the Lower Hunter River Estuary, was funded by the Caring for our Country Hunter Coastal Hotspot Project and was undertaken by Industry and Investment NSW.
This study builds on the initial Priority Investigations for the Lower Hunter River Estuary study undertaken in 2008 (NSW DPI, 2008), which investigated five other wetland areas: Kooragang Wetlands, Tomago Wetland, Shortland Wetlands, Hexham Swamp (the eastern portion) and Fullerton Cove.
A range of methods were used to assess soils, including soil profile coring and laboratory analysis of soil and water samples. Analysis of soil chemistry at these sites revealed that acid sulfate soils are scarce in these three swamps and their influence on water quality is generally low. Despite the low incidence of acid sulfate soils within the soil profile, this study identified a risk in certain swamps of significant accumulation of acidity on the soil surface. A summary of the results and recommendations is as follows:
Woodberry Swamp
Surface acidity is the main risk at Woodberry Swamp, and in some areas the topsoil has already been affected by oxidation of surface sulfides during dry conditions. Ensuring continuous waterlogging in areas with chronic surface acid sulfate soils is recommended to reduce the risk of acid discharge. If surface water levels are not able to ensure waterlogging, surface sulfides will continue to accumulate. Treatment with lime is one option available to neutralise this acid.
A sulfide-rich subsoil layer containing potential acid sulfate soil was found in only one profile in the centre of the swamp, but it was present well below the water table at a depth of 1.9 m and had a very low sulfide concentration. If deep sulfide-rich layers are excavated in the future, spoil will require testing for sulfide content, and will need to be limed appropriately.
It is recommended that regular tidal flushing of the drains be reinstated through opening the Greenways Creek floodgate. This will help reduce the damaging effect of any surface acid sulfate soils leaching from the Swamp, and also help keep drains clear of freshwater vegetation.
Irrawang Swamp
Acid sulfate soils beneath Irrawang Swamp at present are likely to have only a minor effect on water quality and aquatic life. This is mainly because the potential acid sulfate soil layer lies deep in the subsoil (deeper than -1m Australian Height Datum at sites sampled near the

ACID SULFATE SOILS: FURTHER INVESTIGATIONS INTO THE LOWER HUNTER ESTUARY PAGE II
Williams River). If deep sulfide-rich layers are excavated in the future, spoil will require testing for sulfide content, and will need to be limed appropriately.
Any occasional acidic and/or saline seepage in Pennington Drain is likely to come from deposits of surface sulfides and a narrow strip of the subsoil adjacent to the Williams River.
It is recommended that the Irrawang (Pennington Drain) Floodgates be opened to allow tidal water to flush up the drain to improve water quality in the long term. It should be noted that water quality in the drain may be affected in the short term by the decomposition of salt intolerant plants following tidal inundation. A gradual change in water regime would reduce this short term risk to water quality.
Hexham Swamp (Western Portion)
In the western part of Hexham Swamp surface drainage is poor and the soils are dominated by dense clays of low permeability. Historically constructed drains are now clogged with freshwater emergent vegetation. Anaerobic conditions in the waterlogged areas have favoured sulfide formation on the soil surface. After drying, iron minerals and acid then wash off and appear as iron flocculate in waterways.
In the western part of the swamp no subsoil acidity was discovered. The potential acid sulfate soil layer, if present, lies deeper than -1.5 m Australian Height Datum (AHD), well below the watertable. The risk to water quality arising from acid sulfate soil conditions is consequently rated low in the western part of the swamp (this is not the case in the east, where sulfides were found in the subsoil at shallow depths, see DPI, 2008). Nevertheless, waterlogging and poor drainage in the west of the swamp will continue to increase the risk of surface acidification.
It is recommended that the Ironbark Creek Floodgates and other minor floodgates located along the Pacific Highway remain open to tidal flushing in order to further neutralise and dilute poor water quality emanating from the swamp. This is unlikely to raise soil salinity because most soils are already highly saline. The water table (groundwater), which usually occurs within 1m of the soil surface, is also saline.

ACID SULFATE SOILS: FURTHER INVESTIGATIONS INTO THE LOWER HUNTER ESTUARY PAGE III
TABLE OF CONTENTS
Executive Summary .................................. ................................................................................. i
1. Project Background ................................. ........................................................................... 1
2. Project Aims ....................................... ................................................................................. 1
3. Project Methods .................................... .............................................................................. 1
3.1 Study Sites...................................................................................................................... 1
3.1.1. Woodberry Swamp ................................................................................................ 3
3.1.2. Irrawang Swamp.................................................................................................... 3
3.1.3. Hexham Swamp (West) ......................................................................................... 4
4. Soil and Water Sampling Methods.................... ................................................................. 5
5. Results............................................ ..................................................................................... 6
5.1 Woodberry Swamp ......................................................................................................... 6
5.2 Irrawang Swamp............................................................................................................. 12
5.3 Hexham Swamp (West) .................................................................................................. 17
6. Discussion and Recommendations..................... .............................................................. 23
6.1 Woodberry Swamp ......................................................................................................... 23
6.2 Irrawang Swamp............................................................................................................. 23
6.3 Hexham Swamp (West) .................................................................................................. 24
7. Acknowledgements................................... .......................................................................... 25
8. References......................................... .................................................................................. 25
Appendix A: Digital Elevation Models............... ........................................................................ 26
Appendix B: Lower Hunter Acid Sulfate Soil Risk Map ........................................................... 30
Appendix C: Data and Graphs........................ ........................................................................... 32

ACID SULFATE SOILS: FURTHER INVESTIGATIONS INTO THE LOWER HUNTER ESTUARY 1
1. PROJECT BACKGROUND
The disturbance of coastal Acid Sulfate Soils (ASS) represents a significant major threat to coastal and marine ecosystems. ASS has the potential to impact on water quality, biodiversity and commercial industries (oyster farming and fisheries). Previous observations along the North Coast of NSW have shown that inappropriately drained wetland sites have been responsible for chronic discharges of ASS-related poor water quality. ASS affected sites may be impacting on the Hunter Estuary through poor water quality, loss of wetland habitats and the degradation of associated food sources. It is vital to prevent further disturbance and to identify management options to mitigate the impacts of any disturbed ASS. In 2008 a Coastal Catchments Initiative grant was received by NSW Department of Primary Industries (now Industry and Investment NSW) from the Commonwealth Department of Environment, Water, Heritage and The Arts to undertake a detailed investigation into ASS in the Lower Hunter River Estuary Wetlands. The 2008 project investigated soils in five wetland areas: Kooragang Wetlands, Tomago Wetland, Shortland Wetlands, Hexham Swamp (the eastern portion) and Fullerton Cove, and culminated in a final report entitled Acid Sulfate Soils: Priority Investigations in the Lower Hunter River Estuary. The initial ASS investigation (DPI, 2008) provides detailed information on the formation, effects and implications of ASS, plus remediation options for ASS degraded areas. The project revealed that ASS occurs in all five wetlands. The depth of the potential acid sulfate soil (PASS) layer varies, and is often well below sea level. There are also some sites where PASS is absent. Rather than repeating the bulk of the information previously provided, we suggest the reader refer to the previous report for details on ASS and the findings for the five abovementioned wetlands. This project builds on the initial 2008 project, by investigating a further three wetland areas: Woodberry Swamp, Irrawang Swamp and Hexham Swamp (the western margins), which have not been previously had detailed ASS investigations undertaken. Funding for this investigation has been provided by the Australian Government’s Hunter Coastal Hotspots project, which is administered through the Hunter-Central Rivers Catchment Management Authority.
2. PROJECT AIMS
• Provide detailed investigations and assessments of actual and potential ASS at three sites in the Lower Hunter River Estuary.
• Provide management options for mitigating the impacts of ASS, if discovered.
• Build on ASS risk ratings and management recommendations of the 2008 study, “Acid Sulfate Soils: Priority Investigations in the Lower Hunter River Estuary”.
• Communicate the project outcomes to relevant authorities, site managers and the general community.
3. PROJECT METHODS
3.1 STUDY SITES
Three sites have been selected for ASS investigation:
ACID SULFATE SOILS: FURTHER INVESTIGATIONS INTO THE LOWER HUNTER ESTUARY 2
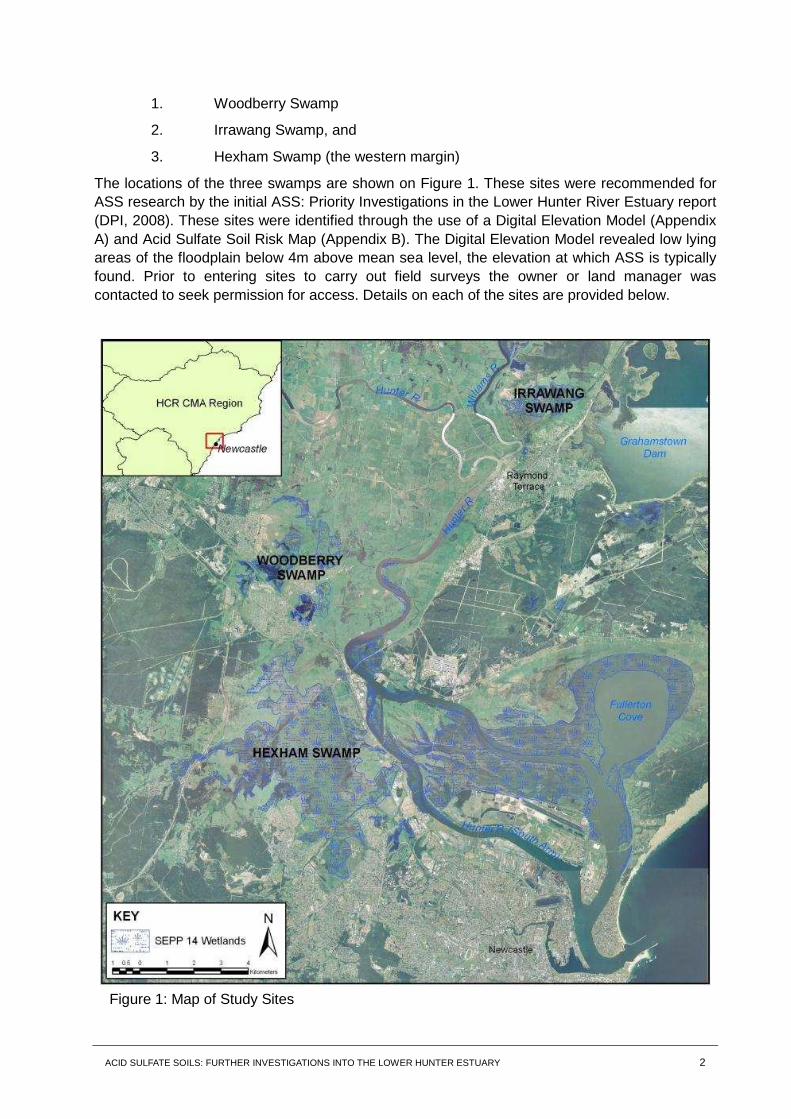
1. Woodberry Swamp
2. Irrawang Swamp, and
3. Hexham Swamp (the western margin)
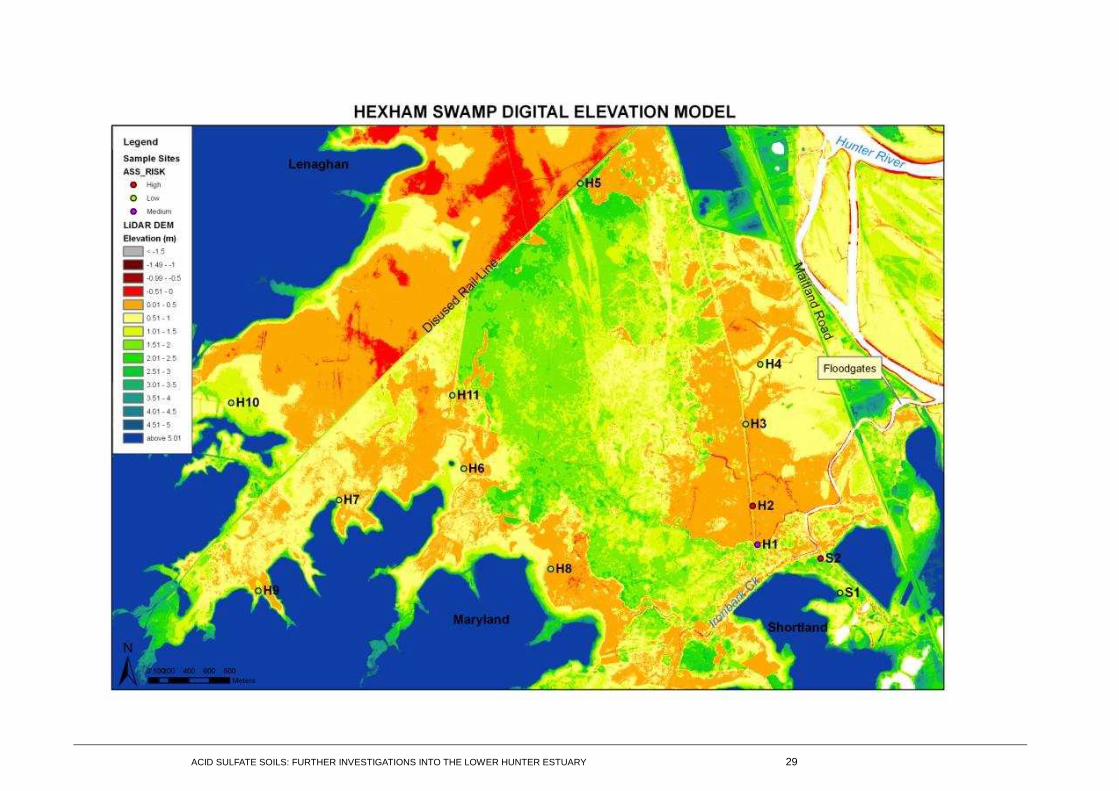
The locations of the three swamps are shown on Figure 1. These sites were recommended for ASS research by the initial ASS: Priority Investigations in the Lower Hunter River Estuary report (DPI, 2008). These sites were identified through the use of a Digital Elevation Model (Appendix A) and Acid Sulfate Soil Risk Map (Appendix B). The Digital Elevation Model revealed low lying areas of the floodplain below 4m above mean sea level, the elevation at which ASS is typically found. Prior to entering sites to carry out field surveys the owner or land manager was contacted to seek permission for access. Details on each of the sites are provided below.
Figure 1: Map of Study Sites
ACID SULFATE SOILS: FURTHER INVESTIGATIONS INTO THE LOWER HUNTER ESTUARY 3
3.1.1. Woodberry Swamp
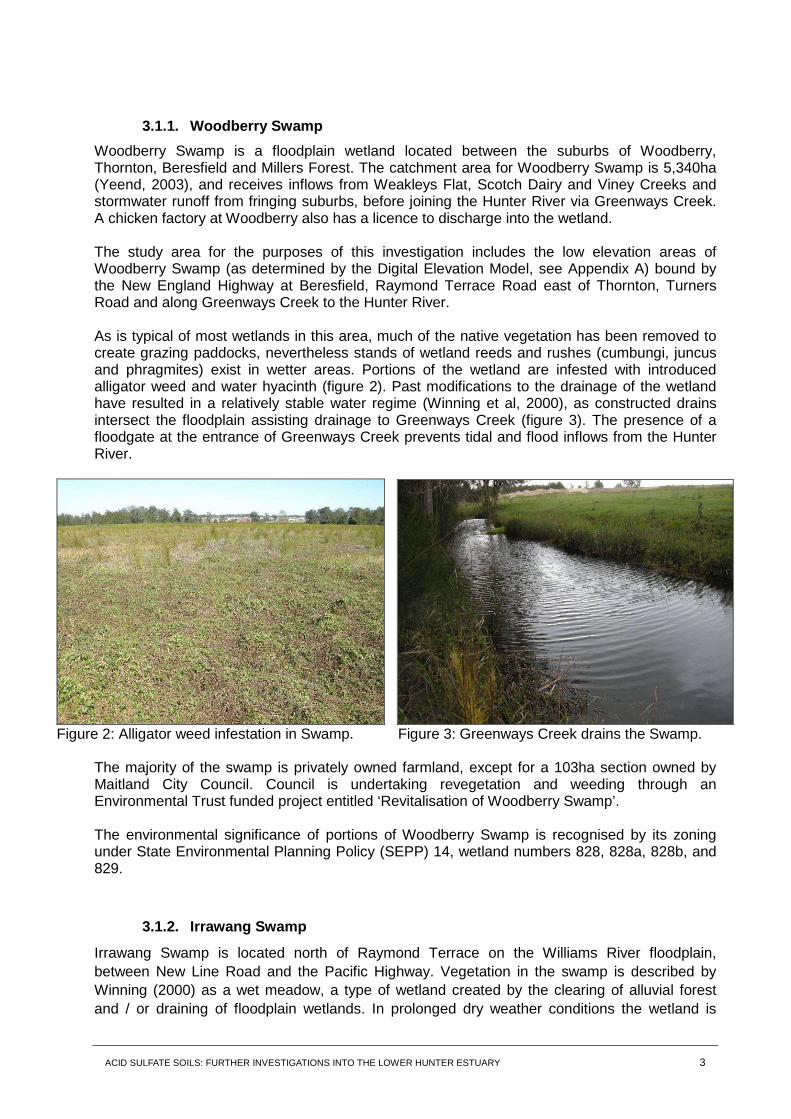
Woodberry Swamp is a floodplain wetland located between the suburbs of Woodberry, Thornton, Beresfield and Millers Forest. The catchment area for Woodberry Swamp is 5,340ha (Yeend, 2003), and receives inflows from Weakleys Flat, Scotch Dairy and Viney Creeks and stormwater runoff from fringing suburbs, before joining the Hunter River via Greenways Creek. A chicken factory at Woodberry also has a licence to discharge into the wetland. The study area for the purposes of this investigation includes the low elevation areas of Woodberry Swamp (as determined by the Digital Elevation Model, see Appendix A) bound by the New England Highway at Beresfield, Raymond Terrace Road east of Thornton, Turners Road and along Greenways Creek to the Hunter River. As is typical of most wetlands in this area, much of the native vegetation has been removed to create grazing paddocks, nevertheless stands of wetland reeds and rushes (cumbungi, juncus and phragmites) exist in wetter areas. Portions of the wetland are infested with introduced alligator weed and water hyacinth (figure 2). Past modifications to the drainage of the wetland have resulted in a relatively stable water regime (Winning et al, 2000), as constructed drains intersect the floodplain assisting drainage to Greenways Creek (figure 3). The presence of a floodgate at the entrance of Greenways Creek prevents tidal and flood inflows from the Hunter River.
Figure 2: Alligator weed infestation in Swamp. Figure 3: Greenways Creek drains the Swamp.
The majority of the swamp is privately owned farmland, except for a 103ha section owned by Maitland City Council. Council is undertaking revegetation and weeding through an Environmental Trust funded project entitled ‘Revitalisation of Woodberry Swamp’. The environmental significance of portions of Woodberry Swamp is recognised by its zoning under State Environmental Planning Policy (SEPP) 14, wetland numbers 828, 828a, 828b, and 829.
3.1.2. Irrawang Swamp
Irrawang Swamp is located north of Raymond Terrace on the Williams River floodplain, between New Line Road and the Pacific Highway. Vegetation in the swamp is described by Winning (2000) as a wet meadow, a type of wetland created by the clearing of alluvial forest and / or draining of floodplain wetlands. In prolonged dry weather conditions the wetland is

ACID SULFATE SOILS: FURTHER INVESTIGATIONS INTO THE LOWER HUNTER ESTUARY 4
effectively grassland or pasture, while in prevailing wet weather it becomes waterlogged or flooded (figure 4) and can support a variety of wetland plants and animals.
The wetland is degraded due to the construction and operation of drainage channels and floodgates on Pennington Drain, which reduce tidal inflows and increase surface water outflows. The wetland has undergone historic clearing for farming, planting of pasture grasses and grazing maintained the wet meadow vegetation community (rather than permitting a recovery of the original forest or shrubland) (Winning, 2000). Residential development in Raymond Terrace abuts the eastern margin of the swamp.
Hunter Water Corporation owns all low lying land in the Swamp, purchased for the Grahamstown Dam augmentation. The Grahamstown Dam Spillway discharges into the swamp when the Dam overflows. Constructed drainage channels, including the main Pennington Drain (figure 5) which bisects the swamp, carry water from the spillway to the Hunter River. There are several secondary drainage channels (evident in the Digital Elevation Model in Appendix A).
Figure 4: Surface water ponds in Irrawang Swamp Figure 5: Pennington Drain channels surface flows
3.1.3. Hexham Swamp (West)
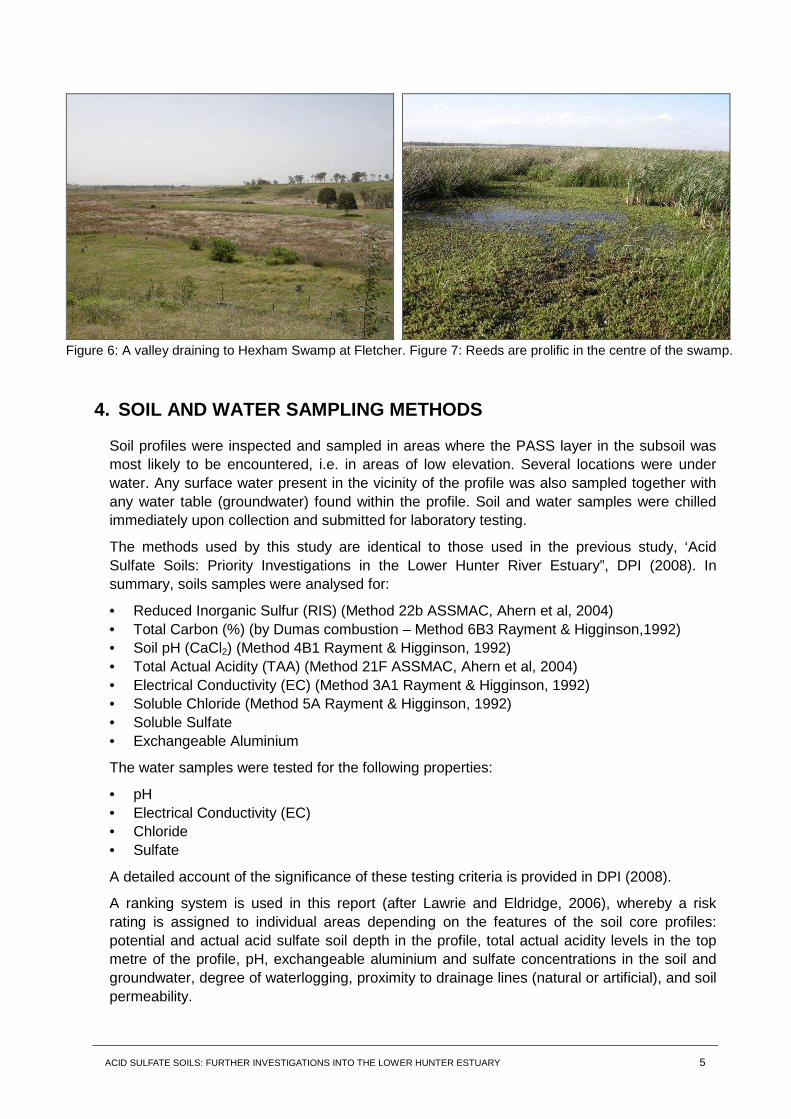
The previous ASS study (DPI, 2008) focused on the eastern portion of the swamp, extending from the northern corner near the disused rail line, along the Chichester pipeline and to Fishery Creek in the south. The western portion of the swamp was not previously assessed due to difficulties accessing waterlogged areas. Sites studied this round include the valleys on the western margins and into the interior of Hexham Swamp, accessed via the suburbs of Maryland, Minmi, Fletcher and Lenaghan (figures 6 and 7). Further description of Hexham Swamp is provided in DPI (2008).
ACID SULFATE SOILS: FURTHER INVESTIGATIONS INTO THE LOWER HUNTER ESTUARY 5
Figure 6: A valley draining to Hexham Swamp at Fletcher. Figure 7: Reeds are prolific in the centre of the swamp.
4. SOIL AND WATER SAMPLING METHODS
Soil profiles were inspected and sampled in areas where the PASS layer in the subsoil was most likely to be encountered, i.e. in areas of low elevation. Several locations were under water. Any surface water present in the vicinity of the profile was also sampled together with any water table (groundwater) found within the profile. Soil and water samples were chilled immediately upon collection and submitted for laboratory testing.
The methods used by this study are identical to those used in the previous study, ‘Acid Sulfate Soils: Priority Investigations in the Lower Hunter River Estuary”, DPI (2008). In summary, soils samples were analysed for:
• Reduced Inorganic Sulfur (RIS) (Method 22b ASSMAC, Ahern et al, 2004) • Total Carbon (%) (by Dumas combustion – Method 6B3 Rayment & Higginson,1992) • Soil pH (CaCl2) (Method 4B1 Rayment & Higginson, 1992) • Total Actual Acidity (TAA) (Method 21F ASSMAC, Ahern et al, 2004) • Electrical Conductivity (EC) (Method 3A1 Rayment & Higginson, 1992) • Soluble Chloride (Method 5A Rayment & Higginson, 1992) • Soluble Sulfate • Exchangeable Aluminium
The water samples were tested for the following properties:
• pH • Electrical Conductivity (EC) • Chloride • Sulfate
A detailed account of the significance of these testing criteria is provided in DPI (2008).
A ranking system is used in this report (after Lawrie and Eldridge, 2006), whereby a risk rating is assigned to individual areas depending on the features of the soil core profiles: potential and actual acid sulfate soil depth in the profile, total actual acidity levels in the top metre of the profile, pH, exchangeable aluminium and sulfate concentrations in the soil and groundwater, degree of waterlogging, proximity to drainage lines (natural or artificial), and soil permeability.
ACID SULFATE SOILS: FURTHER INVESTIGATIONS INTO THE LOWER HUNTER ESTUARY 6
5. RESULTS
5.1 WOODBERRY SWAMP
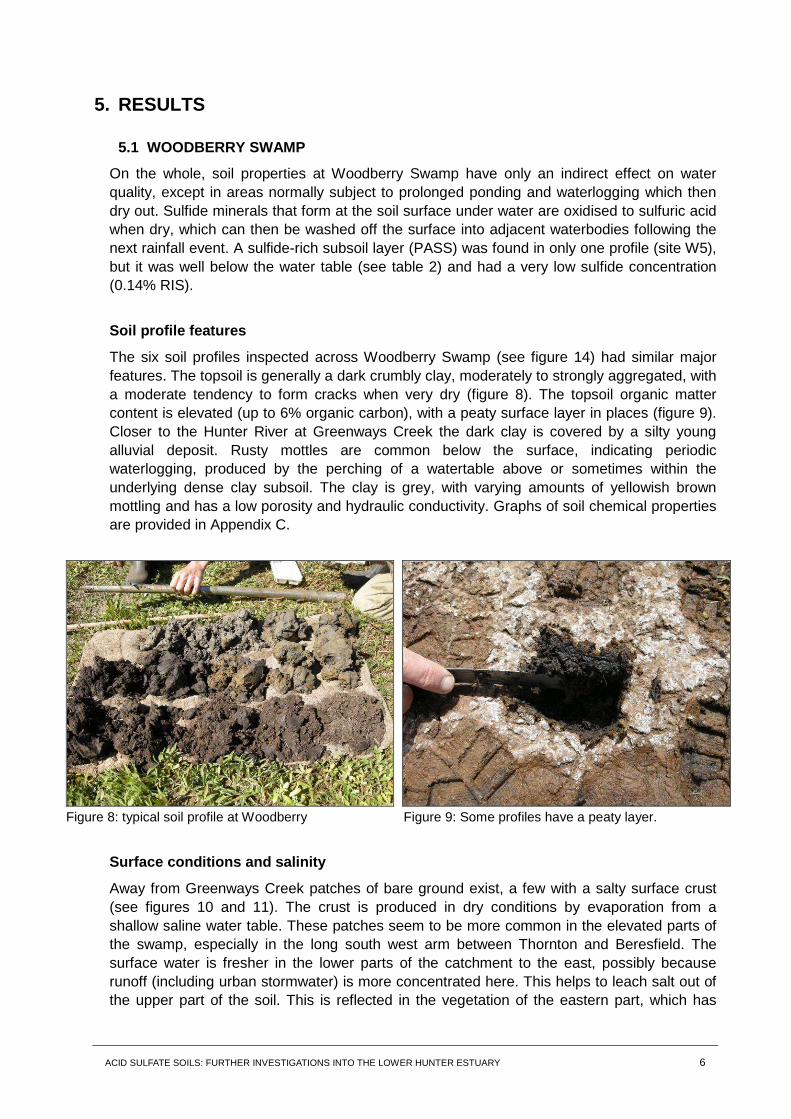
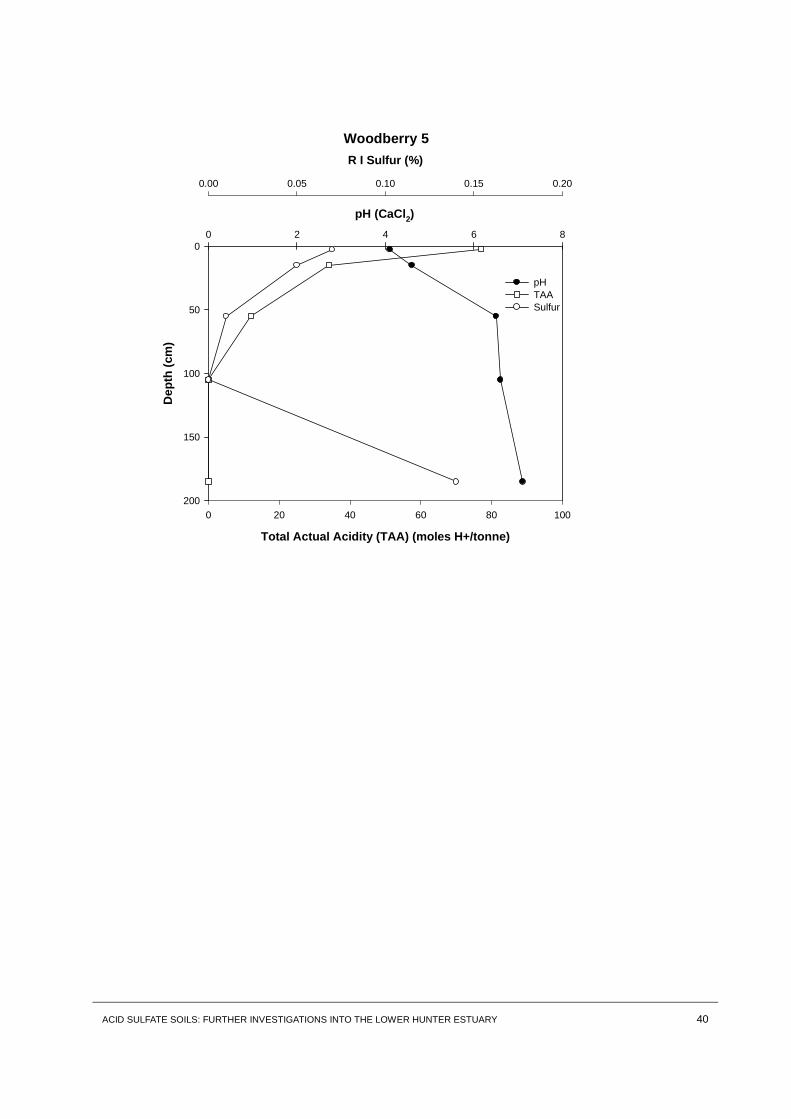
On the whole, soil properties at Woodberry Swamp have only an indirect effect on water quality, except in areas normally subject to prolonged ponding and waterlogging which then dry out. Sulfide minerals that form at the soil surface under water are oxidised to sulfuric acid when dry, which can then be washed off the surface into adjacent waterbodies following the next rainfall event. A sulfide-rich subsoil layer (PASS) was found in only one profile (site W5), but it was well below the water table (see table 2) and had a very low sulfide concentration (0.14% RIS).
Soil profile features
The six soil profiles inspected across Woodberry Swamp (see figure 14) had similar major features. The topsoil is generally a dark crumbly clay, moderately to strongly aggregated, with a moderate tendency to form cracks when very dry (figure 8). The topsoil organic matter content is elevated (up to 6% organic carbon), with a peaty surface layer in places (figure 9). Closer to the Hunter River at Greenways Creek the dark clay is covered by a silty young alluvial deposit. Rusty mottles are common below the surface, indicating periodic waterlogging, produced by the perching of a watertable above or sometimes within the underlying dense clay subsoil. The clay is grey, with varying amounts of yellowish brown mottling and has a low porosity and hydraulic conductivity. Graphs of soil chemical properties are provided in Appendix C.
Figure 8: typical soil profile at Woodberry Figure 9: Some profiles have a peaty layer.
Surface conditions and salinity
Away from Greenways Creek patches of bare ground exist, a few with a salty surface crust (see figures 10 and 11). The crust is produced in dry conditions by evaporation from a shallow saline water table. These patches seem to be more common in the elevated parts of the swamp, especially in the long south west arm between Thornton and Beresfield. The surface water is fresher in the lower parts of the catchment to the east, possibly because runoff (including urban stormwater) is more concentrated here. This helps to leach salt out of the upper part of the soil. This is reflected in the vegetation of the eastern part, which has

ACID SULFATE SOILS: FURTHER INVESTIGATIONS INTO THE LOWER HUNTER ESTUARY 7
more kikuyu and carpet grass than salt-tolerant grasses like water couch or water button and other salt marsh plants.
Figures 10 and 11: Woodberry (W2) core site, exhibiting saline scalds on the soil surface.
Evidence of earlier tidal activity
Tiny gypsum crystals are present in the clay subsoils at several of the western sites, indicating a lack of leaching and a probable history of tidal inundation. Some tidal water appears to reach up the channel of Greenways Creek to Woodberry Road, possibly due to a leaky floodgate. The creek water tested here (site W3, see table 1) had the same chloride: sulfate ratio (7:1) as seawater, but had a lower conductivity, indicating some dilution by freshwater runoff or urban stormwater. The extent of tidal action is much reduced now, compared to when the district was first settled. A levee and floodgate along the river bank has since been constructed, and the creek channel has probably silted up considerably, after early clearing produced erosion in the catchment. Before that, a slightly higher sea level a few thousand years ago would have pushed tidal water onto land about a metre higher than present.
Historical changes in sea level
In many areas of Woodberry Swamp historical tidal influence has raised salinity and reduced acidity in the soil and groundwater. Sulfate concentrations are very high in the groundwater and also in the surface water away from Greenways Creek. It is considered likely that the high soil sulfate levels were produced by drying and oxidation of a sulfidic layer deep in the subsoil at the time when the water table and the sea level were lower by a metre or two; the sea level rose at the end of the last Ice Age by 100 metres or more, to just above the current level before fluctuating and receding slightly (see Sloss et al, 2007 for details). Some soil profiles on higher ground, well back from the Hunter River (e.g. sites W4 and W5) may have been exposed to less frequent tidal action and so remain more acidic and less saline.
Deep burial of sulfidic PASS layer
Remnants of the sulfidic layer, if any, may lie 1.5 m or more below the current sea level (beyond the maximum depth of soil inspection); the top of such a layer was encountered at
ACID SULFATE SOILS: FURTHER INVESTIGATIONS INTO THE LOWER HUNTER ESTUARY 8
site W5, 190 cm below the surface (see table 2). Unless this material is excavated and brought to the surface this is too deep for drying and oxidation under present day conditions. This deep layer was formed long ago when the site was affected by tides, but has since been covered by a thick layer of alluvial sediment deposited during floods.
Present day sulfide formation on the surface
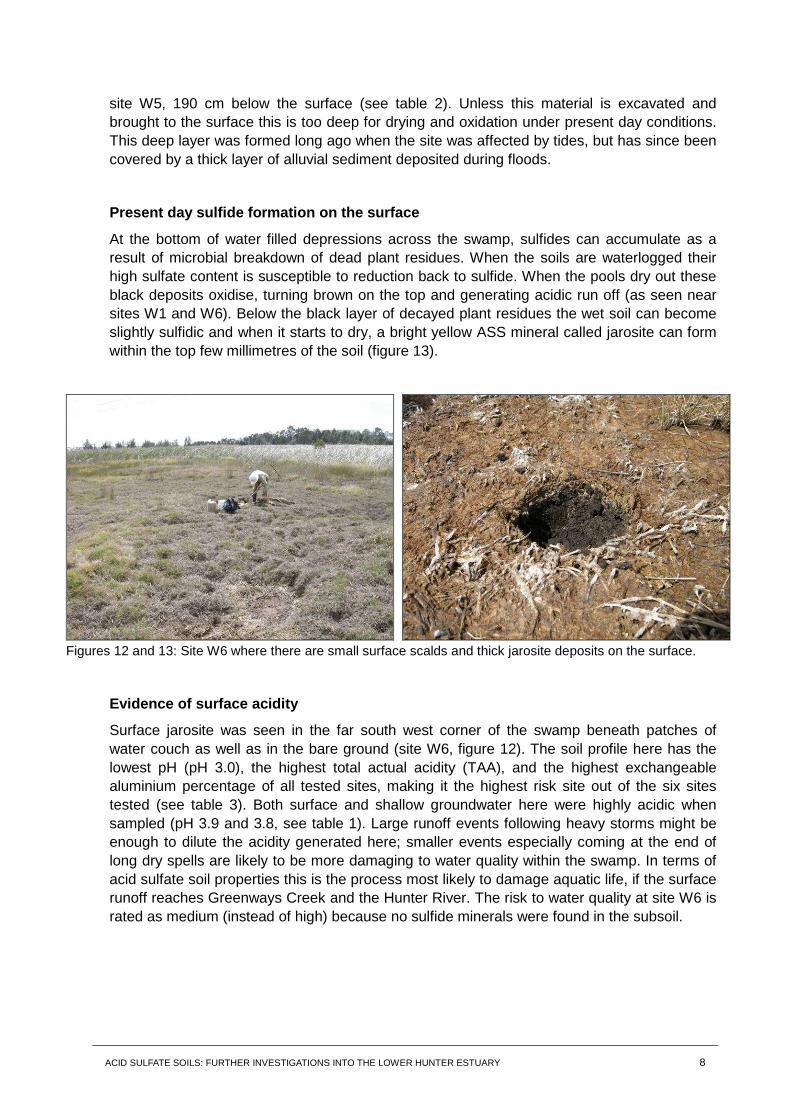
At the bottom of water filled depressions across the swamp, sulfides can accumulate as a result of microbial breakdown of dead plant residues. When the soils are waterlogged their high sulfate content is susceptible to reduction back to sulfide. When the pools dry out these black deposits oxidise, turning brown on the top and generating acidic run off (as seen near sites W1 and W6). Below the black layer of decayed plant residues the wet soil can become slightly sulfidic and when it starts to dry, a bright yellow ASS mineral called jarosite can form within the top few millimetres of the soil (figure 13).
Figures 12 and 13: Site W6 where there are small surface scalds and thick jarosite deposits on the surface.
Evidence of surface acidity
Surface jarosite was seen in the far south west corner of the swamp beneath patches of water couch as well as in the bare ground (site W6, figure 12). The soil profile here has the lowest pH (pH 3.0), the highest total actual acidity (TAA), and the highest exchangeable aluminium percentage of all tested sites, making it the highest risk site out of the six sites tested (see table 3). Both surface and shallow groundwater here were highly acidic when sampled (pH 3.9 and 3.8, see table 1). Large runoff events following heavy storms might be enough to dilute the acidity generated here; smaller events especially coming at the end of long dry spells are likely to be more damaging to water quality within the swamp. In terms of acid sulfate soil properties this is the process most likely to damage aquatic life, if the surface runoff reaches Greenways Creek and the Hunter River. The risk to water quality at site W6 is rated as medium (instead of high) because no sulfide minerals were found in the subsoil.

ACID SULFATE SOILS: FURTHER INVESTIGATIONS INTO THE LOWER HUNTER ESTUARY 9
Table 1. Surface and ground water quality, Woodberry Swamp.
Site Number pH Electrical conductivity (micro S/cm)
Chloride/ Sulfate ratio*
W1 surface water 3.0 1600 0.97
W1 groundwater 7.1 38000 0.92
W2 surface water 5.0 28000 1.7
W2 groundwater 7.2 24000 2.8
W3 surface water 7.6 24000 7.1
W5 groundwater 7.1 2800 1.02
W6 surface water 3.9 5700 0.65
W6 groundwater 3.8 14000 0.37
* A chloride/sulfate ratio of below 7 indicates sulfate enrichment: the acidic site W6 is the most enriched.

ACID SULFATE SOILS: FURTHER INVESTIGATIONS INTO THE LOWER HUNTER ESTUARY 10
Table 2: Acid Production Profile Features/ ASS Indicators: Woodberry Swamp
Site number
Core depth (m)
Approx elevation m AHD
Depth of PASS
(m)
PASS elevation
(m)
Notable profile features Depth of AASS
(m)
AASS elevation
(m) W1 1.90 0.82 - - Watertable @1.00 m - - W2 1.50 0.75 - - Watertable @ 0.72m - - W3 1.75 0.01 - - Too impermeable to sample watertable - - W4 1.94 0.36 - - Too impermeable to sample watertable - - W5 1.90 0.58 1.9 -1.3 Watertable @ 0.70 m; only moderate reaction of PASS
with peroxide - -
W6 1.00 1.23 - - Jarosite in 2-3 mm band just below dead vegetation on soil surface
0 1.23
Note: ASS indicators in bold , elevation estimated based on the Digital Elevation Model (±0.15m)
Table 3: Soil chemical properties important for acid production: Woodberry Swamp
Site No. Soil Parameters Max TAA
(moles H+/t) % of Profile top 1m with TAA >100 moles H+/t
% Profile top 1m with TAA 50-100 moles H+/t
Minimum profile soil pH
% of profile top 1m with a pH ≤ 4
Max % exchange Al value in profile
Max. RIS in profile (%)
High Risk Areas (Nil) Medium Risk Areas W6 260 100 0 3.0 100 44 0.03 Low Risk Areas W1 <5 0 0 4.8 0 0.2 <0.01 W2 <5 0 0 6.8 0 0.1 0.02 W3 65 0 0 3.9 0 4.8 0.01 W4 30 0 0 5.3 0 0.1 0.01 W5 77 0 5 4.1 0 1.4 0.14
ACID SULFATE SOILS: FURTHER INVESTIGATIONS INTO THE LOWER HUNTER ESTUARY 11
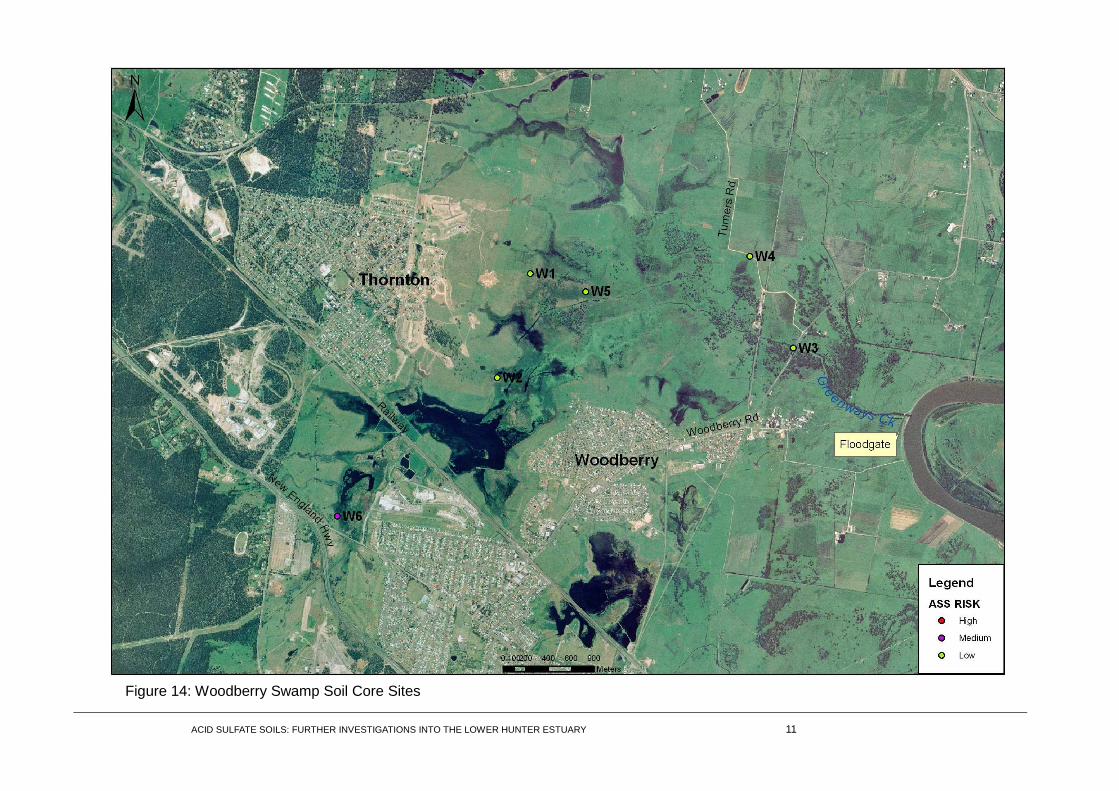
Figure 14: Woodberry Swamp Soil Core Sites

ACID SULFATE SOILS: FURTHER INVESTIGATIONS INTO THE LOWER HUNTER ESTUARY 12
5.2 IRRAWANG SWAMP
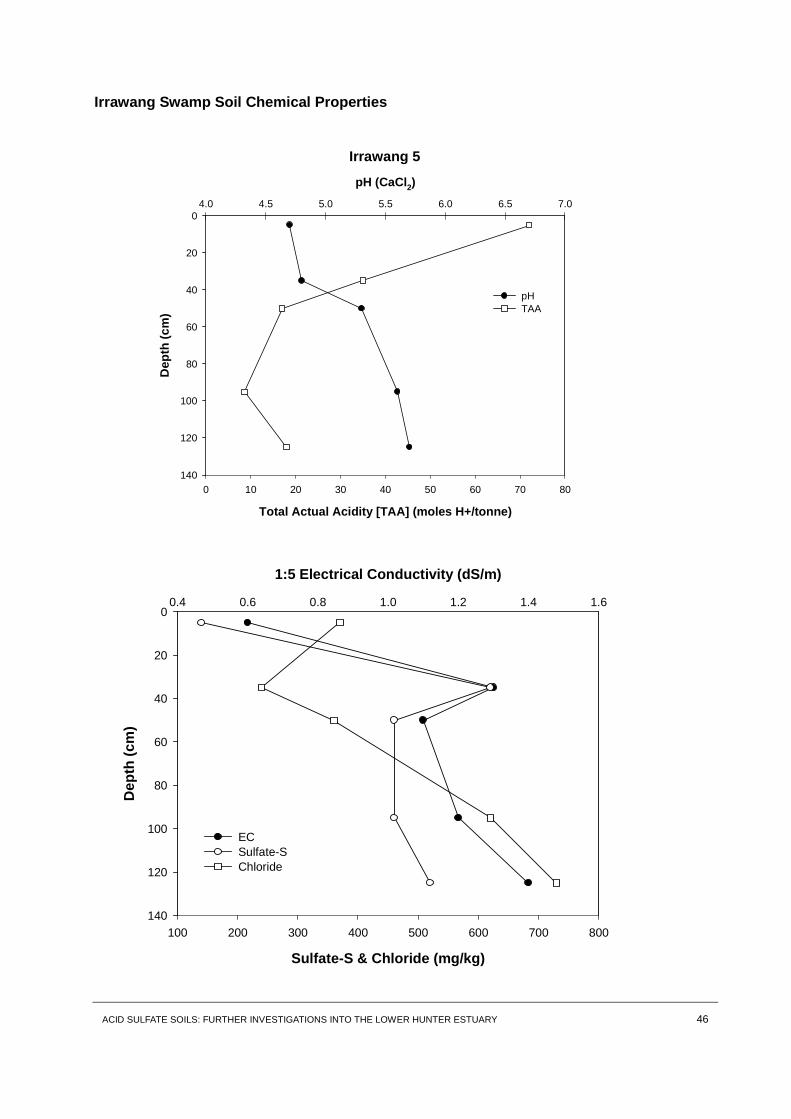
Acid sulfate soils beneath Irrawang Swamp (see figure 17) at present are likely to have only a minor effect on water quality and aquatic life. This is mainly because the PASS layer lies too deep in the subsoil and no longer appears to be contributing acid into soil or water resources. The soils are salty probably as a result of tidal flooding in the past. The clayey subsoils are too impermeable for this salt to have been leached out. The salt contains a high concentration of sulfate, most likely derived from oxidation of the sulfide-rich deep subsoil prior to European settlement. Some of this sulfate has been reduced back to sulfide by surface waterlogging of the topsoil, as decomposition of dead plant material and soil organic matter can strip dissolved oxygen out of the surface water.
Soil profile features in the centre of the Swamp
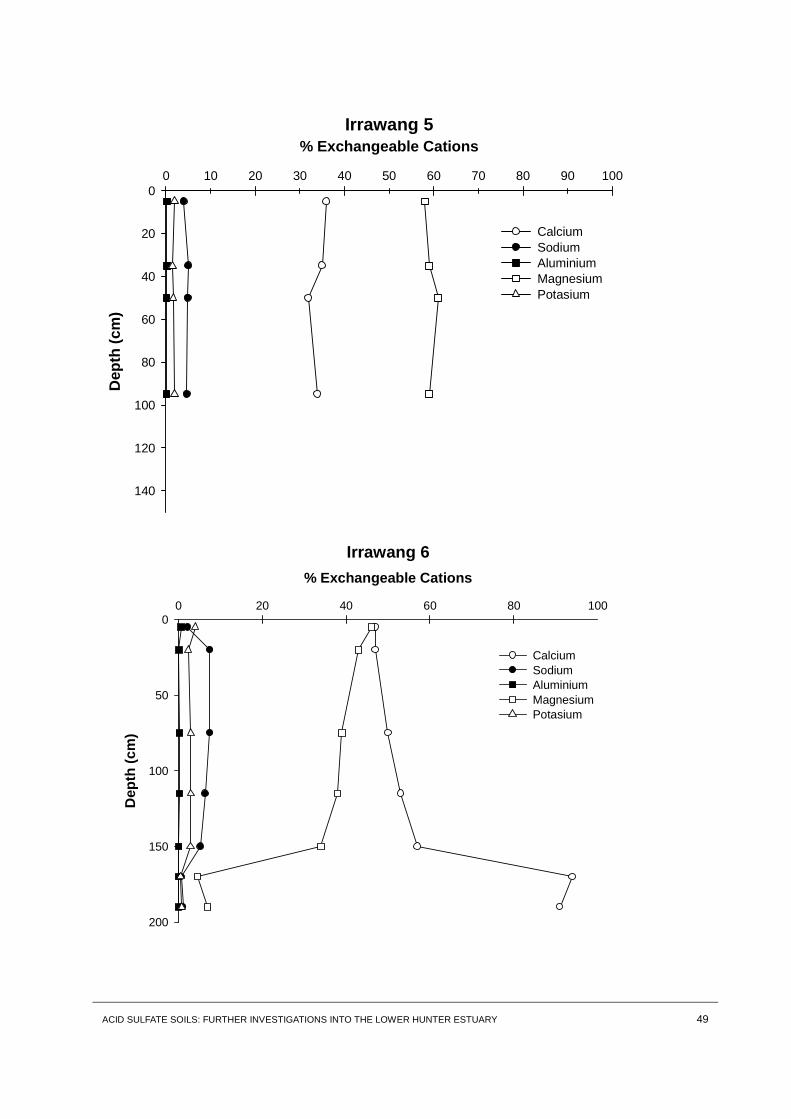
The typical profile in the central area of the swamp (sites I1 - I5) is a very dark grey clay topsoil overlying a mottled grey and yellow brown dense clay subsoil. The surface is moderately to well structured, with aggregates that remain coherent and stable even when waterlogged. Some areas are peaty and the topsoils’ organic carbon content is generally high (e.g. 8.7% at site W5); whilst carbon levels are lower in the subsoil.
Surface conditions and salinity
Water perches above the low permeability subsoil, and in the lowest elevation parts of Irrawang Swamp forms pools on the soil surface. Irregular surface depressions are common and can remain waterlogged for weeks after major rainfall events. Constructed surface drainage channels which once removed much of this water are no longer actively maintained, and to some degree have become clogged with vegetation (see figures 4 and 5 in Section 3). Groundwater is highly saline (up to 14 000 µS/cm) and enriched with sulfate (the chloride/sulfate ratio is well below the seawater ratio of 7:1). The surface water however is much less saline and depleted of sulfate (see table 4).
Sulfate in ground water
At site I5, the subsoil becomes increasingly saline at depth (surface soil EC 0.60 dS/m increasing to 1.4 dS/m at 120-130cm) but sulfate concentrations peak in the lower part of the topsoil (620mg/kg at 30-40cm), graphs of soil chemical properties are provided in Appendix C. This has increased the sulfate concentration in the watertable that sits in this part of the profile (560mg/L compared to 18mg/L in the surface water), above the very dense clay subsoil (see table 4).
Subsoil features in the centre of the Swamp
No sulfidic horizon was detected in the central area of Irrawang Swamp (site I1 - I5, table 5), although the dense clay subsoil limited the penetration of the sampling gear to a maximum depth of 1.3m (at site I5). The moisture content in the subsoil peaked just below the boundary with the topsoil and the profile becomes harder and drier at increasing depths. Profile features

ACID SULFATE SOILS: FURTHER INVESTIGATIONS INTO THE LOWER HUNTER ESTUARY 13
associated with actual acid sulfate soils (AASS, i.e. jarosite layers or tubular iron concretions) were not observed in this part of the swamp (down to about -0.6m Australian Height Datum). It is possible that sulfidic material (PASS) occurs at greater depth, but was not reached by soil cores sampled in this study (i.e. to a depth of 1.3m beneath the soil surface).
Table 4: Surface and ground water quality for Irrawang Swamp
Site Number pH Electrical conductivity (micro S/cm)
Chloride/ Sulfate Ratio*
I1 surface water 6.2 3000 48
I1 groundwater 5.0 14000 1.6
I3 surface water 6.9 1000 17
I4 groundwater 4.9 2800 1.0
I5 surface water 5.1 600 12.2
I5 groundwater 5.5 2000 0.75
* A chloride/sulfate ratio of over 7 indicates depletion of sulfate: the surface water at site I1 is severely depleted.
Lack of subsoil acidity
Drying and subsequent oxidation of sulfides in the past (e.g. at times of lower sea levels) has boosted sulfate concentrations in the subsoil. Some of this sulfate has subsequently migrated upwards, under the influence of long term watertable movements or via evapo-transpiration by plant roots. Any accompanying acidity generated by the oxidation process may have been neutralised, either by reactions with soil minerals or by tidal flooding as the sea level rose. Whichever process was operating, the result is a low level of stored acidity in the profile (see table 6). Total actual acidity (TAA) peaks at the soil surface, the most acidic part of the profile. Cycling of organic matter and oxidation of minor amounts of sulfide minerals in the topsoil (i.e. 0.15% reduced inorganic sulfur at site I5) has generated this minor level of acidity in the central part of the swamp.
Different profile features in the west of the Swamp
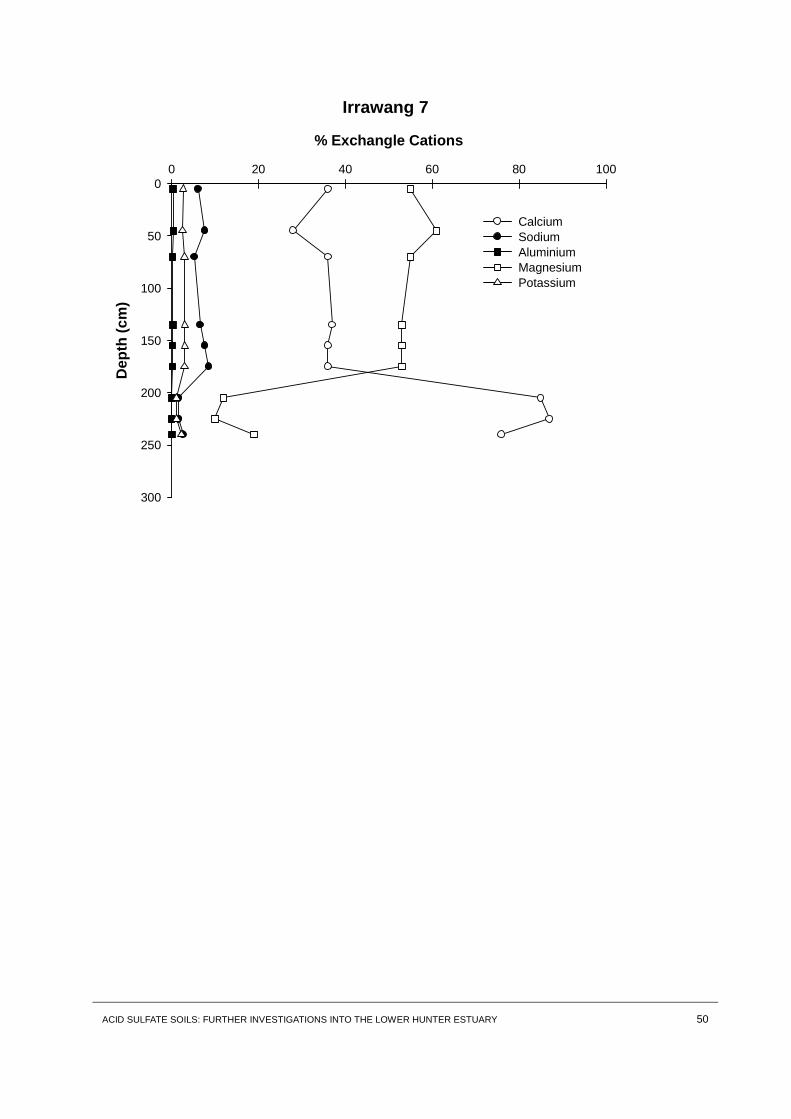
In the western part of Irrawang Swamp (closer to the Williams River) there is a change in the subsurface conditions. The subsoil is slightly more permeable, with more pronounced mottling and contains a layer of iron-rich tubular concretions (at 120-150cm depth at site I6, and at 55-75cm at site I7). The water table is therefore deeper than in the central area and surface

ACID SULFATE SOILS: FURTHER INVESTIGATIONS INTO THE LOWER HUNTER ESTUARY 14
water is virtually absent (none could be collected in the vicinity of sites I6 and I7 at the time of sampling).
Below the water table the subsoil becomes very soft and there is a grey sulfidic layer containing shells (figure 15), and traces of jarosite are present just above it. This layer, which reacted vigorously with a peroxide test (figure 16), lies well below sea level (its upper boundary is -0.8m Australian Height Datum (AHD) at site I6 and -1.4 m AHD at site I7) and contains much more sulfide than the topsoil (0.74% at site I6 and up to 1.0% at site I7), see table 5 and 6.
Figure 15: Site I6 has shells in profile at 167cm. Figure 16: A soil reaction with peroxide at site I6 (190cm depth)
indicates the presence of PASS. Low risk of subsoil acidity
The top of the PASS layer is a long way below the water table, nearly a metre at site I6, and 1.7m below at site I7. Nevertheless the traces of jarosite and tubular concretions above it suggest some minor oxidation has occurred, probably in the distant past. These zones of the subsoil however have little or no stored acidity and have relatively moderate sulfate levels. Sulfate concentrations increase markedly deep in the subsoil, just above the PASS layer. The soil and groundwater pH is neutral to alkaline here, suggesting that any acid generated has been neutralised probably by reacting with the shells.
Surface sulfide formation
Under current conditions it is most unlikely that oxidation of the sulfidic subsoil is currently contributing acid to surface water in the swamp. High levels of soil organic matter and decomposition of the plant resides on the soil surface are likely to be a major influence on acidity in water resources. Anaerobic conditions in pools of surface water and drains, coupled with high background levels of sulfate (in both soil and groundwater) favour sulfide formation at the soil surface. When the pools and drains dry out these minor amounts of sulfide can then be oxidised and produce acid. This is why stored acidity levels peak in the topsoil layer. The TAA levels are moderate to low and the exchangeable aluminium level in the soil is also low. These conditions do not present a serious risk to water quality.

ACID SULFATE SOILS: FURTHER INVESTIGATIONS INTO THE LOWER HUNTER ESTUARY 15
Table 5: Acid Production Profile Features/ ASS Indicators: Irrawang Swamp
Site number
Core depth (m)
Approx elevation m AHD
Top of depth (m)
PASS elevation
(m)
Notable profile features Top of depth (m)
AASS elevation
(m) I1 0.94 0.67 - - Watertable @ 0.32 m - - I2 0.40 0.71 - - Too impermeable to sample watertable - - I3 0.35 0.73 - - Waterlogged at surface - - I4 0.45 0.67 - - Waterlogged at surface - - I5 1.36 0.69 - - Waterlogged at surface - - I6 2.00 0.86 1.85 -1.1 Watertable @ .75m shelly bel ow 1.67 m - absent I7 2.48 0.81 2.20 -1.4 Watertable @ .45m shelly bel ow 2.15 m - absent
Note: ASS indicators in bold , elevation estimated based on the Digital Elevation Model (±0.15m) Table 6: Soil chemical properties important for acid production: Irrawang Swamp
Note: No soil samples were taken at sites I1 – I4.
Site No. Soil Parameters Max TAA
(moles H+/t) % of Profile top 1m with TAA >100 moles H+/t
% Profile top 1m with TAA 50-100 moles H+/t
Minimum profile soil pH
% of profile top 1m with a pH ≤ 4
Max % exchange Al value in profile
Max. RIS in profile (%)
High Risk Areas (Nil) Medium Risk Areas I6 57 0 0 4.5 0 0.2 0.74 I7 30 0 0 4.7 0 0.5 1.0 Low Risk Areas I5 72 0 0 4.7 0 0.2 0.15
ACID SULFATE SOILS: FURTHER INVESTIGATIONS INTO THE LOWER HUNTER ESTUARY 16
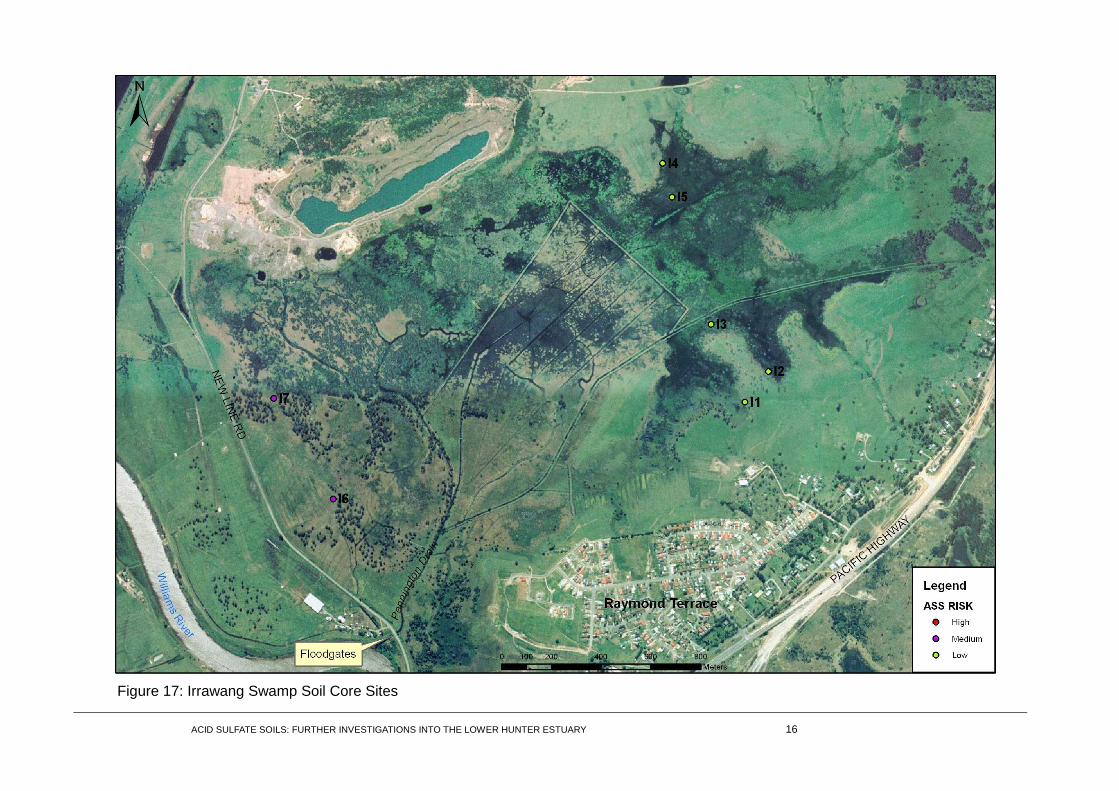
Figure 17: Irrawang Swamp Soil Core Sites

ACID SULFATE SOILS: FURTHER INVESTIGATIONS INTO THE LOWER HUNTER ESTUARY 17
5.3 HEXHAM SWAMP (WEST)
Soils of the western margin of Hexham Swamp have an indirect effect on water quality, mainly arising from their surface properties. Any risk to water quality arises from acid generated on the soil surface, instead of from deep in the subsoil.
The swamp receives large volumes of surface runoff from the surrounding catchment, especially as urban stormwater. Surface drainage is poor and the soils are dominated by dense clays making them low in permeability. The old drains are clogged with accumulated sediment and freshwater swamp vegetation. As a result water ponds extensively for weeks after major rain events (figures 18 and 19). Grazing is still the predominant land use north-west of the abandoned railway, utilising grasses like water couch that tolerate frequent waterlogging. Much of this area is up to 0.5 m below sea level. It should be noted that sites H1-H6 were sampled in DPI (2008), refer to previous report for results.
Figure 18: surface water ponds in Hexham Swamp. Figure 19: Waterlogged drainage lines in the west.
East of the old railway line are extensive beds of reeds and rushes (e.g. Phragmites – figure 17), and reduced grazing pressure since the gazettal of Hunter Wetlands National Park, which incorporates a large portion of Hexham Swamp. Beneath the surface water ponds, conditions can readily become anaerobic as plant residues decay and consume dissolved oxygen.
The high levels of sulfate in the soil are reduced to sulfide under these conditions, allowing iron sulfide minerals to form at the bottom of the ponds. When the ponds dry out the sulfide minerals can oxidise and produce sulfuric acid, which is then washed into local waterways at the next rainfall event.
Figure 20 (right): Phragmites dominates the swamp (site H10)

ACID SULFATE SOILS: FURTHER INVESTIGATIONS INTO THE LOWER HUNTER ESTUARY 18
Soil profile features
Six soil profiles were inspected and sampled (see figure 24), four of them located just above surface water close to the south-western edge of the swamp (H6 - H9) and two of them under 0.3-0.5 m of water further north (H10 & H11). The profiles typically have a very dark clayey topsoil about 30 cm thick (containing 1.7-7.6% organic matter) overlying a dense grey clay subsoil with occasional yellow brown mottles. The maximum depth of inspection was 1.85m. No sulfidic material was found in the subsoil, despite field testing at 10 cm intervals down the profile (see table 8). In the laboratory, only five of the 27 samples tested for reduced inorganic sulfur (RIS) contained more than the detection limit of 0.01%. The maximum level found was only 0.09% at the surface (0-10 cm) at H9. The only subsurface sample of the five cores taken (a dark grey clay from H11, 20-40 cm depth) had 0.06% RIS, which is below the regulatory remediation limit (0.1%). Graphs of soil chemical properties are provided in Appendix C.
Salinity and tidal action
Most soils are very salty, most likely as a result of tidal action in the past, prior to the construction of the Ironbark Creek Floodgates, and probably also when the sea level was about a metre higher. Close to the southern margins of the swamp, well back from the Hunter River, are remnants of salt marsh vegetation on ground elevated slightly above the waterlogged areas (figures 21 and 22). One of the profiles here (H6) has a shelly layer at a depth of 85-90 cm. Elsewhere in the swamp the vegetation pattern suggests that tidal action currently appears to be minimal, apart from small areas in the south east near Fishery Creek where mangroves occur. The current project opening of Ironbark Creek Floodgates in stages will see tidal influence progressively reintroduced.
Figures 21 and 22: Saltmarsh and saline scalds near Rocky Knob (site H6).
Subsoil properties
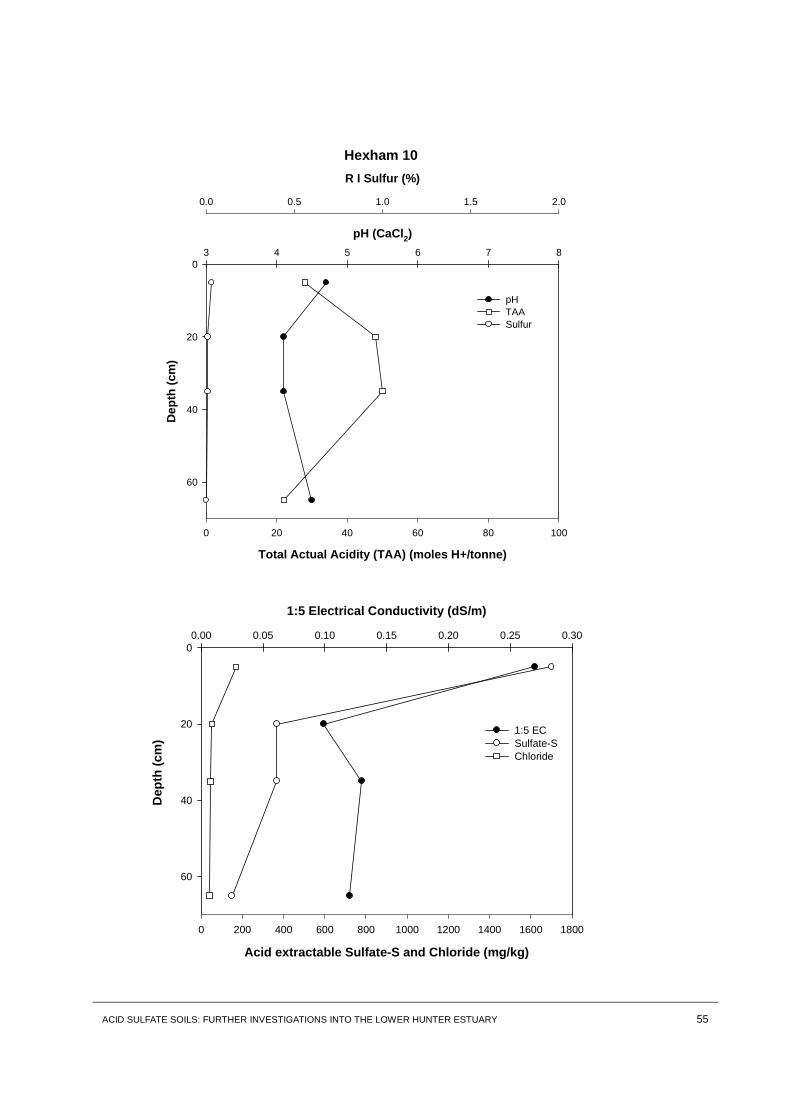
The only non saline profile (H10) is the one furthest from the river; it is also the most acidic (pH range 4.1-4.7), a feature associated with the subsoil, an impermeable ancient deeply weathered sandy clay (probably of Pleistocene age). This profile also has the highest exchangeable aluminium percentage (only 5.2%) and total actual acidity (TAA maximum 50 moles H+/t, a

ACID SULFATE SOILS: FURTHER INVESTIGATIONS INTO THE LOWER HUNTER ESTUARY 19
moderate level found in many non acid sulfate soils). All the other subsoils tested are neutral to alkaline (maximum pH 8.3, at H8 120-125 cm) and have lower TAA levels. It is possible that sulfides exist very deep in the subsoil, beyond the depth of inspection. If so, their potential influence on water quality is low because they would be unlikely to dry out and oxidise under current conditions (see table 9).
Water quality
Three ground water samples and six surface water samples were tested (where present) from sites adjacent to the profiles with the aim of assessing whether the soils were permeable enough for their chemical properties to be similar.
Only one sample was acidic (H9 surface) but it did not have an elevated sulfate level, suggesting that oxidation of sulfide minerals was not involved in producing the acidity.
The ratio of chloride to sulfate was close to the sea water ratio in the very salty sites at H6 and H8 groundwater (see table 7), but across the swamp the range in this ratio was very broad (0.9-25.5).
This range, and the equally wide range in salinity (electrical conductivity 380-76000 µS/cm), suggest that soil permeability, both laterally and vertically, is generally very low across the swamp (all samples were collected within three days); groundwater was much more saline than surface water. The high ratio of chloride to sulfate (in four of the surface water samples) suggests loss of dissolved sulfate due to formation of insoluble iron sulfide minerals.
Old man-made embankments are also affecting surface water movement in some areas (near site H7 for example). South of the raised bank at site H7A the water was much saltier than on the other side at site H7B only 20-30 m away. Both ground and surface water at H7A are enriched with sulfate (the soil profile a few metres away contains very high concentrations of acid extractable sulfur).
Table 7: Surface and ground water quality for Hexham Swamp (West) Site pH Electrical
conductivity (micro S/cm)
Chloride/ sulfate ratio
H6 surface water 6.6 1200 13.4
H6 groundwater 7.2 63000 5.2
H7A (inside bund) surface water
6.9 4900 1.8
H7A groundwater 6.3 16000 0.9
H7B (outside bund) surface water
6.6 570 10.0
H8 groundwater 6.6 76000 5.1
H9 surface water 3.5 2100 5.8
H10 surface water 6.5 380 25.5
H11 surface water 6.5 1100 17.3
ACID SULFATE SOILS: FURTHER INVESTIGATIONS INTO THE LOWER HUNTER ESTUARY 20
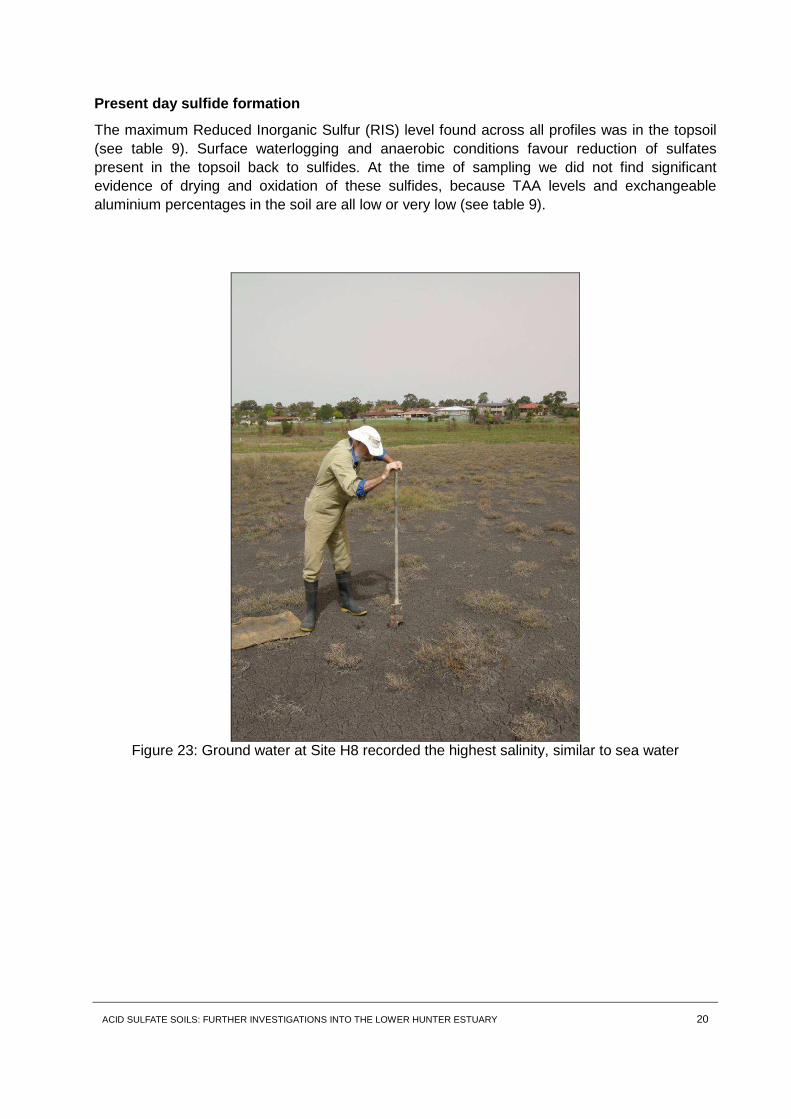
Present day sulfide formation
The maximum Reduced Inorganic Sulfur (RIS) level found across all profiles was in the topsoil (see table 9). Surface waterlogging and anaerobic conditions favour reduction of sulfates present in the topsoil back to sulfides. At the time of sampling we did not find significant evidence of drying and oxidation of these sulfides, because TAA levels and exchangeable aluminium percentages in the soil are all low or very low (see table 9).
Figure 23: Ground water at Site H8 recorded the highest salinity, similar to sea water
ACID SULFATE SOILS: FURTHER INVESTIGATIONS INTO THE LOWER HUNTER ESTUARY 21
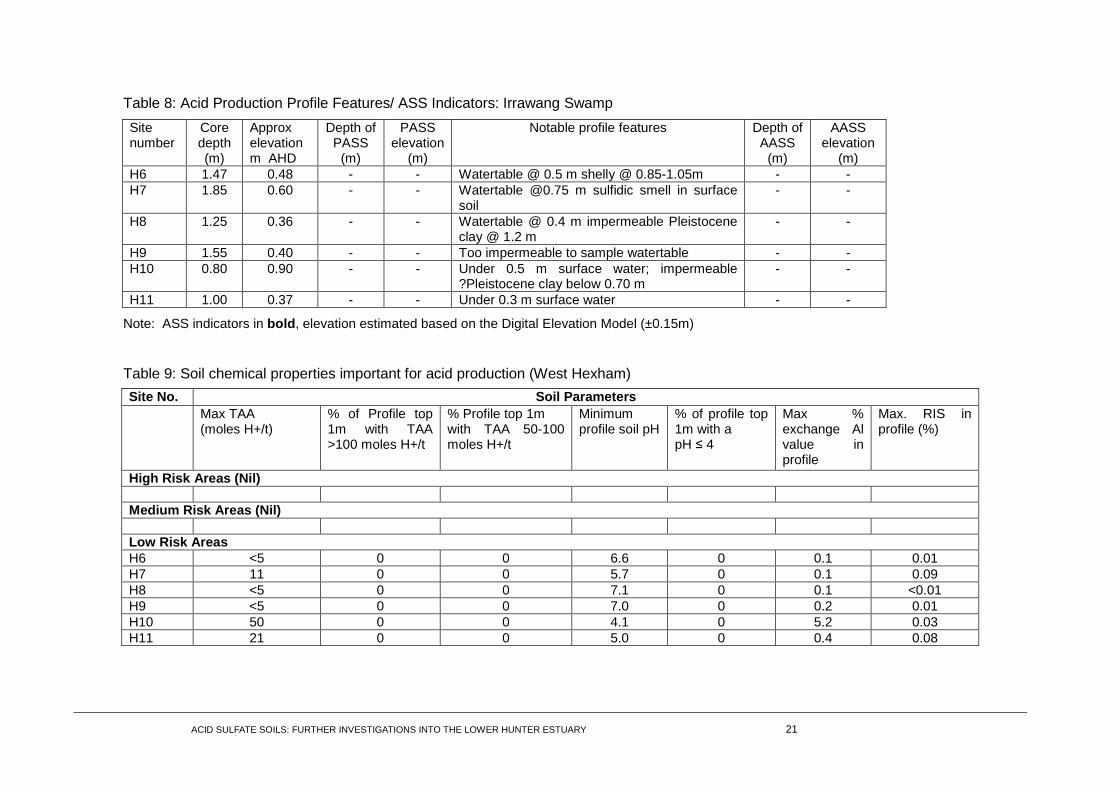
Table 8: Acid Production Profile Features/ ASS Indicators: Irrawang Swamp
Site number
Core depth (m)
Approx elevation m AHD
Depth of PASS
(m)
PASS elevation
(m)
Notable profile features Depth of AASS
(m)
AASS elevation
(m) H6 1.47 0.48 - - Watertable @ 0.5 m shelly @ 0.85-1.05m - - H7 1.85 0.60 - - Watertable @0.75 m sulfidic smell in surface
soil - -
H8 1.25 0.36 - - Watertable @ 0.4 m impermeable Pleistocene clay @ 1.2 m
- -
H9 1.55 0.40 - - Too impermeable to sample watertable - - H10 0.80 0.90 - - Under 0.5 m surface water; impermeable
?Pleistocene clay below 0.70 m - -
H11 1.00 0.37 - - Under 0.3 m surface water - -
Note: ASS indicators in bold , elevation estimated based on the Digital Elevation Model (±0.15m)
Table 9: Soil chemical properties important for acid production (West Hexham)
Site No. Soil Parameters Max TAA
(moles H+/t) % of Profile top 1m with TAA >100 moles H+/t
% Profile top 1m with TAA 50-100 moles H+/t
Minimum profile soil pH
% of profile top 1m with a pH ≤ 4
Max % exchange Al value in profile
Max. RIS in profile (%)
High Risk Areas (Nil) Medium Risk Areas (Nil) Low Risk Areas H6 <5 0 0 6.6 0 0.1 0.01 H7 11 0 0 5.7 0 0.1 0.09 H8 <5 0 0 7.1 0 0.1 <0.01 H9 <5 0 0 7.0 0 0.2 0.01 H10 50 0 0 4.1 0 5.2 0.03 H11 21 0 0 5.0 0 0.4 0.08

ACID SULFATE SOILS: FURTHER INVESTIGATIONS INTO THE LOWER HUNTER ESTUARY 22
Figure 24: Hexham Swamp Soil Core Sites (including sites tested in 2008)

ACID SULFATE SOILS: FURTHER INVESTIGATIONS INTO THE LOWER HUNTER ESTUARY 23
6. DISCUSSION AND RECOMMENDATIONS
6.1 WOODBERRY SWAMP
Subsoil ASS
Acid sulfate soils present a low risk to aquatic life across Woodberry Swamp and its receiving waters, as there is very little acid stored within the subsoil. A sulfide-rich subsoil layer (PASS) was found in only one profile (site W5 in the centre of the swamp), but it was well below the water table and had a very low sulfide concentration.
Of the sites studied, there appears to be no risk of the constructed drainage system causing the subsoil to dry out enough to generate acid, because the subsoil sulfidic layer is too deep or absent.
While current conditions pose a low risk of acid being generated within the subsoil, if deep sulfide-rich layers are excavated in the future, spoil will require testing for sulfide content, and will need to be limed appropriately.
Surface ASS
Surface acidity is the main risk at Woodberry Swamp, and in some areas (including the far south west corner of the swamp near the New England Highway at site W6) the topsoil has already been acidified by oxidation of surface sulfides during dry conditions. Surface sulfide minerals that form at the soil surface under water are oxidised to sulfuric acid when dry, which can then be washed off the surface into adjacent waterbodies following the next rainfall event.
Urban expansion has increased the volume of runoff from the area surrounding Woodberry Swamp leading to further surface waterlogging, and increased surface sulfide formation (except in the small areas which are permanently under water). Altering surface hydrology to ensure continuous waterlogging in areas with chronic surface ASS is recommended to reduce the risk of acid discharge. If it is not possible to ensure waterlogging, surface sulfides will continue to accumulate, and may be able to be treated with neutralising lime.
It is recommended that regular tidal flushing of the drains be reinstated through opening the Greenways Creek floodgate. This will help reduce the damaging effect of any acid from surface ASS leaching from the swamp, and also help keep drains clear of freshwater vegetation.
6.2 IRRAWANG SWAMP
Like Woodberry Swamp, Irrawang Swamp’s acid sulfate soils present a low risk to aquatic life and receiving waters as there is little acid stored within the subsoil. Of those sites where PASS was discovered (near the Williams River), these layers are deep in the profile – deeper than -1.1m AHD.
The soils at Irrawang Swamp are salty, probably as a result of tidal flooding in the past. Their clay subsoils are too impermeable for this salt to have been leached out. The salt contains a high concentration of sulfate, most likely derived from oxidation of the sulfide-rich deep

ACID SULFATE SOILS: FURTHER INVESTIGATIONS INTO THE LOWER HUNTER ESTUARY 24
subsoil prior to European settlement. Some of this sulfate has been reduced back to sulfide by surface waterlogging of the topsoil, as decomposition of dead plant material and soil organic matter can strip dissolved oxygen out of the surface water.
Under current conditions ASS at Irrawang poses a low risk, however if deep sulfide-rich layers are excavated in the future, spoil will require testing for sulfide content, and will need to be limed appropriately.
Any occasional acidic and/or saline seepage in Pennington Drain is likely to come from deposits of surface sulfides and a narrow strip of the subsoil adjacent to the Williams River. If the Irrawang Floodgates are opened to allow tidal water to flush up the drain, water quality will be improved in the long term. It should be noted that water quality in the drain may be affected in the short term by the decomposition of salt intolerant plants following tidal inundation. A gradual change in water regime would reduce this short term risk to water quality.
6.3 HEXHAM SWAMP (WEST)
Soils of the western margin of Hexham Swamp have an indirect effect on water quality, mainly arising from their surface properties. The main risk to water quality comes from acid generated on the soil surface, instead of from deep in the subsoil.
In the western part of Hexham Swamp surface drainage is poor and the soils are dominated by dense clays of low permeability. Large volumes of surface runoff are received by the swamp from the surrounding catchment, especially as urban stormwater. Historically constructed drains are now clogged with freshwater emergent vegetation (e.g. phragmites) and as a result water ponds for extended periods of time after major rainfall events. Beneath the surface water ponds, conditions can readily become anaerobic as plant residues decay and consume dissolved oxygen. The naturally high levels of sulfate in the soil are reduced to sulfide under these conditions, allowing iron sulfide minerals to form at the bottom of the ponds. When the ponds dry out the sulfide minerals can oxidise and produce sulfuric acid, which can then be washed into local waterways during the next rainfall event. This process is most likely the cause of the red staining and corrosion of concrete bridge abutments in Fishery Creek.
Waterlogging and poor drainage in the west of the swamp will continue to increase the risk of surface acidification. However, as the tidal influence extends further into the swamp due to the opening of floodgates on Ironbark Creek and other smaller creeks flowing under the Pacific Highway, constructed drains will progressively become clear of salt intolerant vegetation and surface drainage in the west of the swamp will improve. Any previously waterlogged areas dried out by improved surface drainage need to either be kept dry to prevent further surface acidification or subject to tidal influence to neutralise any acidic runoff.
In the western part of the swamp no subsoil acidity was discovered. The PASS layer, if present, lies deeper than -1.5 m AHD, well below the watertable. The risk to water quality arising from ASS conditions is consequently rated low in the western part of the Swamp (this is not the case in the east, where sulfides were found in the subsoil at shallow depths, see DPI, 2008).
To further neutralise and dilute poor water quality emanating from the swamp, it is recommended that the Ironbark Creek Floodgates and other minor floodgates located along the Pacific Highway remain open to tidal flushing.
ACID SULFATE SOILS: FURTHER INVESTIGATIONS INTO THE LOWER HUNTER ESTUARY 25
7. ACKNOWLEDGEMENTS
This study was funded by the Australian Government’s Caring for our Country Hunter Coastal Hotspots project, administered by the Hunter-Central Rivers Catchment Management Authority.
This report was written by Roy Lawrie, Jenny Fredrickson and Brett Enman of Industry and Investment NSW. Field work was carried out with the assistance of Kylie Russell, John Simpson and Simon Walsh. Field work for this project was performed when one of the authors (Roy Lawrie) was an associate of the University of Technology, Sydney.
Thanks to Simon Eldridge. Kylie Russell and Craig Copeland of Industry and Investment NSW for comments on the draft report.
The assistance of the late Geoff Winning, especially regarding his comments on water quality in Hexham Swamp, is greatly appreciated.
8. REFERENCES
Lawrie, R. and Eldridge, S. (2006) Reduction in Acid Discharge to the Shoalhaven – Crookhaven Estuary. Final Report to Shoalhaven City Council. NSW DPI, Richmond.
NSW Department of Primary Industries (2008) Acid Sulfate Soils: Priority Investigations for the Lower Hunter River Estuary. Report to the Department of Environment, Water, Heritage and the Arts. NSW DPI, Port Stephens.
Sloss, CR, Murray-Wallace, CV & Jones, BG 2007, ‘Holocene sea-level change on the southeast coast of Australia: a review’. The Holocene’, 17 (7): 999-1014.
Winning, G., King, J-P. and Bailey, S. (2000) How Wide is a Wetland Boundary? Wetlands (Australia) 18 (2): 64-71.
Winning, G. (2000) Stage 2 Augmentation of Grahamstown Dam – Ecological Management, Report to Hunter Water Corporation, Newcastle.
Yeend, K. (2003) Investigating Woodberry Swamp, In: A Sense Of Place In Maitland – Resource Kit for Schools, Maitland Regional Landcare, Available at http://www.maitland.nsw.gov.au/OurEnvironment/EducationPrograms (accessed 25/08/10).

ACID SULFATE SOILS: FURTHER INVESTIGATIONS INTO THE LOWER HUNTER ESTUARY 26
APPENDIX A: DIGITAL ELEVATION MODELS

ACID SULFATE SOILS: FURTHER INVESTIGATIONS INTO THE LOWER HUNTER ESTUARY 27

ACID SULFATE SOILS: FURTHER INVESTIGATIONS INTO THE LOWER HUNTER ESTUARY 28
ACID SULFATE SOILS: FURTHER INVESTIGATIONS INTO THE LOWER HUNTER ESTUARY 29

ACID SULFATE SOILS: FURTHER INVESTIGATIONS INTO THE LOWER HUNTER ESTUARY 30
APPENDIX B: LOWER HUNTER ACID SULFATE SOIL RISK MAP

ACID SULFATE SOILS: FURTHER INVESTIGATIONS INTO THE LOWER HUNTER ESTUARY 31

ACID SULFATE SOILS: FURTHER INVESTIGATIONS INTO THE LOWER HUNTER ESTUARY 32
APPENDIX C: DATA AND GRAPHS

ACID SULFATE SOILS: FURTHER INVESTIGATIONS INTO THE LOWER HUNTER ESTUARY 33
Woodberry Swamp Soil Analysis Results
Site Depth Lab No. EC pH
(CaCl2) Chloride Organic
Carbon
Total Actual Acidity
Acid extractable Sulfate
Acid Extractable Sulfate-S
Aluminium Calcium Potassium Magnesium Reduced Inorganic Sulfur
cm Unit dS/m pH units mg/kg % moles
H+/t cmol(+)/kg cmol(+)/kg cmol(+)/kg cmol(+)/kg % CrS
LOR 0.01 0.04 1.5 0.05 5 mg/kg mg/kg 0.01 0.01 0.02 0.008 Woodberry Site 1 0-10 8345 2.3 4.8 2300 4.7 16 4800 1600 0.10 12 1.7 47 0 40-50 8346 5.9 7.1 3100 0.43 <5 20000 6667 0.042 8.9 0.58 26 0 90-95 8347 4.9 6.9 4400 NT <5 7800 2600 0.053 6.9 1.0 57 0 25-140 8348 6.8 7.1 3600 NT <5 48000 16000 0.036 15 0.76 38 0 75-190 8349 7 7 3800 NT <5 51000 17000 0.044 18 0.84 35 12 Site 2 0-10 8350 6.4 6.8 7100 2.7 <5 6300 2100 0.043 12 1.7 56 0 40-50 8351 4.4 7.4 3400 0.52 <5 8100 2700 0.046 16 0.97 26 0 90-95 8352 3.4 7.4 3800 NT <5 3300 1100 0.041 13 0.88 27 6 97-102 8353 3.7 7.3 3000 NT <5 6900 2300 0.035 15 0.99 31 6 135-150 8354 5.3 7.1 3000 NT <5 30000 10000 0.042 23 0.95 23 6 Site 3 0-10 8355 0.25 5.0 130 3.2 17 1200 400 0.059 18 1.2 30 6 20-30 8356 0.76 4.9 770 1.8 21 1100 367 0.065 9.3 1.7 42 0 60-70 8357 2.1 5.7 2400 0.75 10 2000 667 0.057 3.9 1.4 30 0 75-90 8358 2.4 4.2 3000 NT 44 2200 733 0.69 2.9 1.2 18 0 160-175 8359 2.4 3.9 3100 NT 65 2500 833 1.5 3.0 1.3 19 0 Site 4 0-10 8360 0.34 5.3 79 2.7 16 1600 533 0.03 17 0.76 12 6 80-90 8361 0.26 6.4 82 NT <5 480 160 0.029 10 0.41 16 0 105-120 8362 0.28 6.1 96 NT 30 570 190 0.028 9.8 0.51 13 6 180-194 8363 0.18 6.6 88 NT <5 220 73 0.030 9.7 0.63 17 0 Site 5 0-5 8364 1.1 4.1 190 5.0 77 13000 4333 0.51 17 1.5 16 44 10-20 8365 0.77 4.6 180 5.1 34 5700 1900 0.15 16 1.2 22 31 50-60 8366 0.75 6.5 300 0.50 12 1400 467 0.029 13 0.78 20 6 95-110 8367 0.42 6.6 180 NT <5 750 250 0.032 13 0.72 9.7 0 175-190 8368 3.1 7.1 290 NT <5 33000 11000 0.023 27 0.66 4.1 87 Site 6 0-1 8369 12 3.0 9300 6.1 260 160000 53333 4.4 3.9 0.032 2.0 19 1-10 8370 3.4 3.5 3900 5.8 250 13000 4333 6.2 1.9 0.22 4.4 6 40-50 8371 2.2 3.6 1000 1.2 190 7800 2600 4.6 2.4 0.36 10 6 85-100 8372 1.7 3.6 720 NT 190 5100 1700 2.3 3.2 0.40 19 0
ACID SULFATE SOILS: FURTHER INVESTIGATIONS INTO THE LOWER HUNTER ESTUARY 34
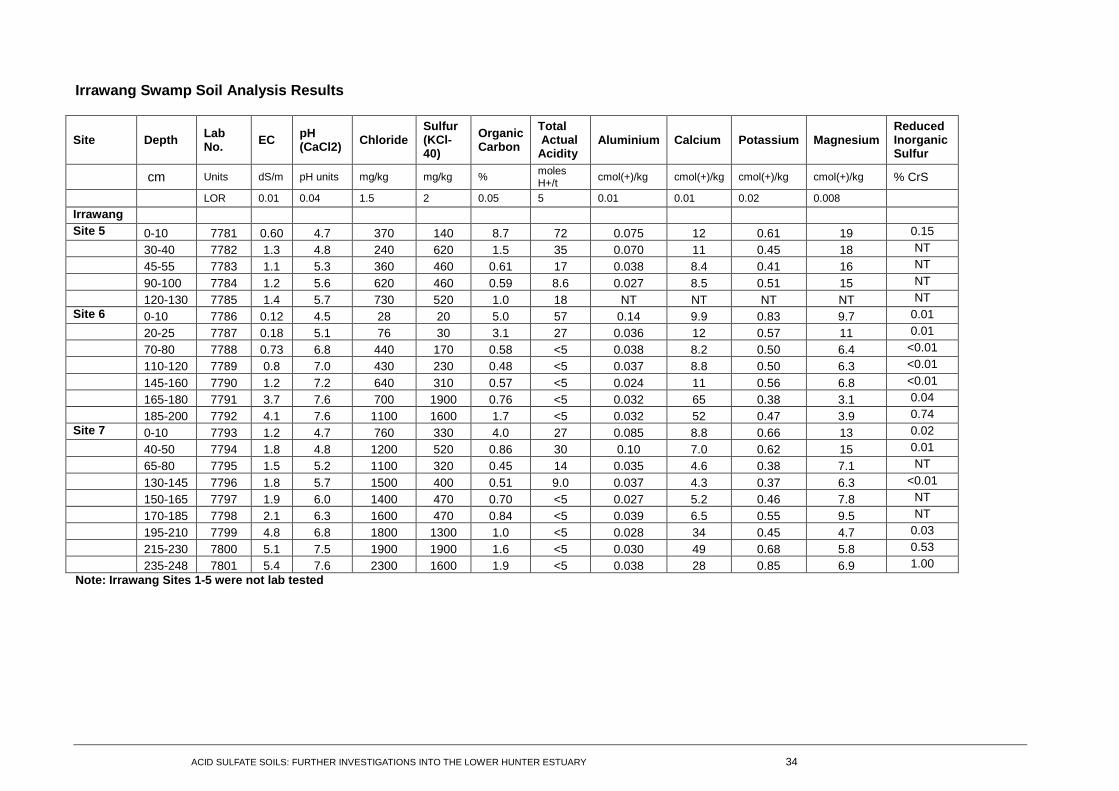
Irrawang Swamp Soil Analysis Results
Site Depth Lab No. EC pH
(CaCl2) Chloride Sulfur (KCl-40)
Organic Carbon
Total Actual Acidity
Aluminium Calcium Potassium Magnesium Reduced Inorganic Sulfur
cm Units dS/m pH units mg/kg mg/kg % moles H+/t
cmol(+)/kg cmol(+)/kg cmol(+)/kg cmol(+)/kg % CrS
LOR 0.01 0.04 1.5 2 0.05 5 0.01 0.01 0.02 0.008
Irrawang Site 5 0-10 7781 0.60 4.7 370 140 8.7 72 0.075 12 0.61 19 0.15 30-40 7782 1.3 4.8 240 620 1.5 35 0.070 11 0.45 18 NT 45-55 7783 1.1 5.3 360 460 0.61 17 0.038 8.4 0.41 16 NT 90-100 7784 1.2 5.6 620 460 0.59 8.6 0.027 8.5 0.51 15 NT 120-130 7785 1.4 5.7 730 520 1.0 18 NT NT NT NT NT Site 6 0-10 7786 0.12 4.5 28 20 5.0 57 0.14 9.9 0.83 9.7 0.01 20-25 7787 0.18 5.1 76 30 3.1 27 0.036 12 0.57 11 0.01 70-80 7788 0.73 6.8 440 170 0.58 <5 0.038 8.2 0.50 6.4 <0.01 110-120 7789 0.8 7.0 430 230 0.48 <5 0.037 8.8 0.50 6.3 <0.01 145-160 7790 1.2 7.2 640 310 0.57 <5 0.024 11 0.56 6.8 <0.01 165-180 7791 3.7 7.6 700 1900 0.76 <5 0.032 65 0.38 3.1 0.04 185-200 7792 4.1 7.6 1100 1600 1.7 <5 0.032 52 0.47 3.9 0.74 Site 7 0-10 7793 1.2 4.7 760 330 4.0 27 0.085 8.8 0.66 13 0.02 40-50 7794 1.8 4.8 1200 520 0.86 30 0.10 7.0 0.62 15 0.01 65-80 7795 1.5 5.2 1100 320 0.45 14 0.035 4.6 0.38 7.1 NT 130-145 7796 1.8 5.7 1500 400 0.51 9.0 0.037 4.3 0.37 6.3 <0.01 150-165 7797 1.9 6.0 1400 470 0.70 <5 0.027 5.2 0.46 7.8 NT 170-185 7798 2.1 6.3 1600 470 0.84 <5 0.039 6.5 0.55 9.5 NT 195-210 7799 4.8 6.8 1800 1300 1.0 <5 0.028 34 0.45 4.7 0.03 215-230 7800 5.1 7.5 1900 1900 1.6 <5 0.030 49 0.68 5.8 0.53 235-248 7801 5.4 7.6 2300 1600 1.9 <5 0.038 28 0.85 6.9 1.00 Note: Irrawang Sites 1-5 were not lab tested

ACID SULFATE SOILS: FURTHER INVESTIGATIONS INTO THE LOWER HUNTER ESTUARY 35
Hexham Swamp (West) Soil Analysis Results
Site Depth Lab No. EC pH
(CaCl2) Chloride Organic Carbon
Total Actual Acidity
Acid extractable Sulfate
Acid Extractable Sulfate-S
Aluminium
Calcium
Potassium
Magnesium
Reduced Inorganic Sulfur
cm Unit dS/m pH units mg/kg %
moles H+/t
cmol(+)/kg
cmol(+)/kg
cmol(+)/kg
cmol(+)/kg
% CrS
LOR 0.01 0.04 1.5 0.05 5 mg/kg mg/kg 0.01 0.01 0.02 0.008
Hexham Site 6 0-10 8318 4.6 6.6 6300 2.0 <5 3600 1200 0.024 8.6 1.5 37 6 30-40 8319 7 7.5 7100 0.47 <5 15000 5000 0.022 15 0.96 23 6 75-80 8320 9.8 7.5 11000 0.64 <5 90000 30000 0.021 26 0.95 16 0 85-90 8321 9.5 8.0 11000 NT <5 90000 30000 0.021 28 0.77 9.0 6 95-105 8322 9.6 7.7 10000 NT <5 72000 24000 0.029 26 0.84 12 6 125-140 8323 8.5 8.1 8700 NT <5 45000 15000 0.015 20 0.66 9.0 0 Site 7 0-10 8324 5.1 5.7 1500 5.7 11 30000 10000 0.017 25 2.4 19 56 45-50 8325 5.1 6 1900 0.69 9.5 36000 12000 0.030 19 1.5 14 6 85-100 8326 4.5 5.8 2100 NT 8.0 12000 4000 0.030 14 1.5 27 0 170-185 8327 3.7 6.2 2500 NT 9.9 5400 1800 0.038 12 1.5 32 0 Site 8 0-10 8328 5.4 7.3 7000 1.7 <5 3600 1200 0.022 11 2.3 38 0 40-50 8329 9.4 7.1 8800 0.50 <5 39000 13000 0.016 17 0.94 8.4 0
100-115 8330 9.7 7.2 9400 NT <5 29000 9667 0.027 15 0.96 6.2 0 120-125 8331 6.5 8.3 6200 NT <5 33000 11000 NT NT NT NT NT
Site 9 0-5 8332 2.2 6.3 2300 6.5 <5 7500 2500 0.01 29 1.2 27 19 30-40 8333 1 7 870 1.5 <5 1300 433 0.029 19 1.3 14 0 67-70 8334 0.91 7.2 840 0.65 <5 1300 433 0.054 15 0.87 15 0 110-125 8335 0.93 7.4 770 NT <5 630 210 0.045 15 1.0 15 6 150-155 8336 NT NT NT NT NT NT NT NT NT NT NT 6 Site 10 0-10 8337 0.27 4.7 170 6.4 28 5100 1700 0.25 14 0.78 10 19 15-25 8338 0.099 4.1 53 1.6 48 1100 367 1.0 7.7 0.73 9.6 6
30-40 8339 0.13 4.1 45 0.82 50 1100 367 0.91 8.3 0.70 16 6 60-70 8340 0.12 4.5 40 NT 22 450 150 0.24 5.4 0.42 8.6 0 Site 11 0-20 8341 0.61 5 540 7.6 21 9000 3000 0.16 14 1.6 19 50 20-40 8342 1.4 5.4 1300 3.2 10 7800 2600 0.026 17 1.9 28 37 50-70 8343 2 6.6 1700 1.2 5.1 2900 967 0.035 10 1.4 23 0 80-100 8344 2.5 6.9 2400 NT <5 3000 1000 0.045 10 1.4 22 0 Note: Hexham Sites 1 – 5 results presented in DPI ( 2008)

ACID SULFATE SOILS: FURTHER INVESTIGATIONS INTO THE LOWER HUNTER ESTUARY 36
Woodberry Swamp Soil Chemical Properties
Woodberry 1
pH (CaCl2)
4 5 6 7 8
Dep
th (
cm)
0
50
100
150
200
Total Actual Acidity (TAA) (moles H+/tonne)
0 20 40 60 80 100
R I Sulfur0.0 0.5 1.0 1.5 2.0
pHTAASulfur
1:5 Electrical Conductivity (dS/m)
2 3 4 5 6 7 8
Dep
th (
cm)
0
50
100
150
200
Acid extractable Sulfate-S and Chloride (mg/kg)
0 2000 4000 6000 8000 10000 12000 14000 16000 18000
1:5 ECSulfate-SChloride

ACID SULFATE SOILS: FURTHER INVESTIGATIONS INTO THE LOWER HUNTER ESTUARY 37
Woodberry 2
pH (CaCl2)
6.0 6.5 7.0 7.5 8.0
Dep
th (
cm)
0
20
40
60
80
100
120
140
160
Total Actual Acidity (TAA) (moles H+/tonne)
0 10 20 30 40 50
R I Sulfur (%)
0.0 0.5 1.0 1.5 2.0
pHTAASulfur
1:5 Electrical Conductivity (dS/m)
3.0 3.5 4.0 4.5 5.0 5.5 6.0 6.5 7.0
Dep
th (
cm)
0
20
40
60
80
100
120
140
160
Acid extractable Sulfate-S and Chloride (mg/kg)
0 2000 4000 6000 8000 10000 12000
1:5 ECSulfate-SChloride

ACID SULFATE SOILS: FURTHER INVESTIGATIONS INTO THE LOWER HUNTER ESTUARY 38
Woodberry 3
pH (CaCl 2)
3.5 4.0 4.5 5.0 5.5 6.0
Dep
th (
cm)
0
20
40
60
80
100
120
140
160
180
Total Actual Acidity (TAA) (moles H+/tonne)
0 10 20 30 40 50 60 70
R I Sulfur (%)
0.0 0.5 1.0 1.5 2.0
pHTAASulfur
1:5 Electrical Conductivity (dS/m)
0.0 0.5 1.0 1.5 2.0 2.5 3.0
Dep
th (
cm)
0
20
40
60
80
100
120
140
160
180
Acid extractable Sulfate-S and Chloride (mg/kg)
0 1000 2000 3000 4000
1:5 ECSulfate-SChloride

ACID SULFATE SOILS: FURTHER INVESTIGATIONS INTO THE LOWER HUNTER ESTUARY 39
Woodberry 4
pH (CaCl 2)
5.0 5.5 6.0 6.5 7.0
Dep
th (
cm)
0
50
100
150
200
Total Actual Acidity (TAA) (moles H+/tonne)
0 5 10 15 20 25 30 35
R I Sulfur (%)
0.00 0.05 0.10 0.15 0.20
pHTAASulfur
1:5 Electrical Conductivity (dS/m)
0.0 0.1 0.2 0.3 0.4
Dep
th (
cm)
0
50
100
150
200
Acid extractable Sulfate-S and Chloride (mg/kg)
0 100 200 300 400 500 600
1:5 ECSulfate-SChloride
ACID SULFATE SOILS: FURTHER INVESTIGATIONS INTO THE LOWER HUNTER ESTUARY 40
Woodberry 5
pH (CaCl 2)
0 2 4 6 8
Dep
th (
cm)
0
50
100
150
200
Total Actual Acidity (TAA) (moles H+/tonne)
0 20 40 60 80 100
R I Sulfur (%)
0.00 0.05 0.10 0.15 0.20
pHTAASulfur

ACID SULFATE SOILS: FURTHER INVESTIGATIONS INTO THE LOWER HUNTER ESTUARY 41
1:5 Electrical Conductivity (dS/m)
0.0 0.5 1.0 1.5 2.0 2.5 3.0 3.5
Dep
th (
cm)
0
50
100
150
200
Acid extractable Sulfate-S and Chloride (mg/kg)
0 2000 4000 6000 8000 10000 12000
1:5 ECSulfate-SChloride
Woodberry 6
pH (CaCl 2)
2 3 4 5 6 7
Dep
th (
cm)
0
20
40
60
80
100
Total Actual Acidity (TAA) (moles H+/tonne)
180 200 220 240 260 280
R I Sulfur (%)
0.00 0.05 0.10 0.15 0.20
pHTAASulfur

ACID SULFATE SOILS: FURTHER INVESTIGATIONS INTO THE LOWER HUNTER ESTUARY 42
1:5 Electrical Conductivity (dS/m)
0 2 4 6 8 10 12 14
Dep
th (
cm)
0
20
40
60
80
100
Acid extractable Sulfate-S and Chloride (mg/kg)
0 10000 20000 30000 40000 50000 60000
1:5 ECSulfate-SChloride
Woodberry 1% Exchangeable Cations
0 20 40 60 80 100
Dep
th (
cm)
0
50
100
150
200
CalciumSodiumAluminium MagnesiumPotassium

ACID SULFATE SOILS: FURTHER INVESTIGATIONS INTO THE LOWER HUNTER ESTUARY 43
Woodberry 2
% Exchangeable Cations
0 20 40 60 80 100
dept
h (c
m)
0
20
40
60
80
100
120
140
160
CalciumSodiumAluminiumMagnesiumPotassium
Woodberry 3% Exchangeable Cations
0 20 40 60 80 100
Dep
th (
cm)
0
20
40
60
80
100
120
140
160
180
CalciumSodiumAluminiumMagnesiumPotassium

ACID SULFATE SOILS: FURTHER INVESTIGATIONS INTO THE LOWER HUNTER ESTUARY 44
Woodberry 4% Exchangeable Cations
0 20 40 60 80 100D
epth
(cm
)0
50
100
150
200
CalciumSodiumAluminiumMagnesiumPatassium
Woodberry 5
% Exchangeable Cations
0 20 40 60 80 100
Dep
th (
cm)
0
50
100
150
200
CalciumSodiumAluminiumMagnesiumPotassium

ACID SULFATE SOILS: FURTHER INVESTIGATIONS INTO THE LOWER HUNTER ESTUARY 45
Woodberry 6% Exchangeable Cations
0 20 40 60 80 100
Dep
th (
cm)
0
20
40
60
80
100
CalciumSodiumAluminiumMagnesiumPotassium
ACID SULFATE SOILS: FURTHER INVESTIGATIONS INTO THE LOWER HUNTER ESTUARY 46
Irrawang Swamp Soil Chemical Properties
Irrawang 5
pH (CaCl2)
4.0 4.5 5.0 5.5 6.0 6.5 7.0
Dep
th (
cm)
0
20
40
60
80
100
120
140
Total Actual Acidity [TAA] (moles H+/tonne)
0 10 20 30 40 50 60 70 80
pHTAA
1:5 Electrical Conductivity (dS/m)
0.4 0.6 0.8 1.0 1.2 1.4 1.6
Dep
th (
cm)
0
20
40
60
80
100
120
140
Sulfate-S & Chloride (mg/kg)
100 200 300 400 500 600 700 800
ECSulfate-SChloride

ACID SULFATE SOILS: FURTHER INVESTIGATIONS INTO THE LOWER HUNTER ESTUARY 47
Irrawang 6
pH (CaCl 2)
4.0 4.5 5.0 5.5 6.0 6.5 7.0 7.5 8.0
Dep
th (
cm)
0
50
100
150
200
Total Actual Acidity (TAA) (moles H+/tonne)
0 20 40 60 80 100
R I Sulfur (%)
0.0 0.5 1.0 1.5 2.0
pH TAASulfur
Top of jarosite layer
Top of PASS
1: 5 Electrical Conductivity (dS/m)
0 1 2 3 4 5
Dep
th (
cm)
0
50
100
150
200
Sulfate-S & Chloride units (mg/kg)
0 500 1000 1500 2000 2500
1:5 ECSulfate-SChloride

ACID SULFATE SOILS: FURTHER INVESTIGATIONS INTO THE LOWER HUNTER ESTUARY 48
Irrawang 7
pH (CaCl 2)
4 5 6 7 8
Dep
th (
cm)
0
50
100
150
200
250
300
Total Actual Acidity [TAA] (moles H+/tonne)
0 20 40 60 80 100
R I Sulfur (%)
0.0 0.5 1.0 1.5 2.0
pHTAASulfur
Top of jarosite layer
Top of PASS
Electrical Conductivity 1:5
0 1 2 3 4 5 6
Dep
th (
cm)
0
50
100
150
200
250
300
Sulfate-S & Chloride units (mg/kg)
0 500 1000 1500 2000 2500
ECSulfate-SChloride
ACID SULFATE SOILS: FURTHER INVESTIGATIONS INTO THE LOWER HUNTER ESTUARY 49
Irrawang 5% Exchangeable Cations
10 30 50 70 900 20 40 60 80 100
Dep
th (
cm)
0
20
40
60
80
100
120
140
CalciumSodiumAluminiumMagnesiumPotasium
Irrawang 6
% Exchangeable Cations
0 20 40 60 80 100
Dep
th (
cm)
0
50
100
150
200
CalciumSodiumAluminiumMagnesiumPotasium
ACID SULFATE SOILS: FURTHER INVESTIGATIONS INTO THE LOWER HUNTER ESTUARY 50
Irrawang 7
% Exchangle Cations
0 20 40 60 80 100
Dep
th (
cm)
0
50
100
150
200
250
300
CalciumSodiumAluminiumMagnesiumPotassium
ACID SULFATE SOILS: FURTHER INVESTIGATIONS INTO THE LOWER HUNTER ESTUARY 51
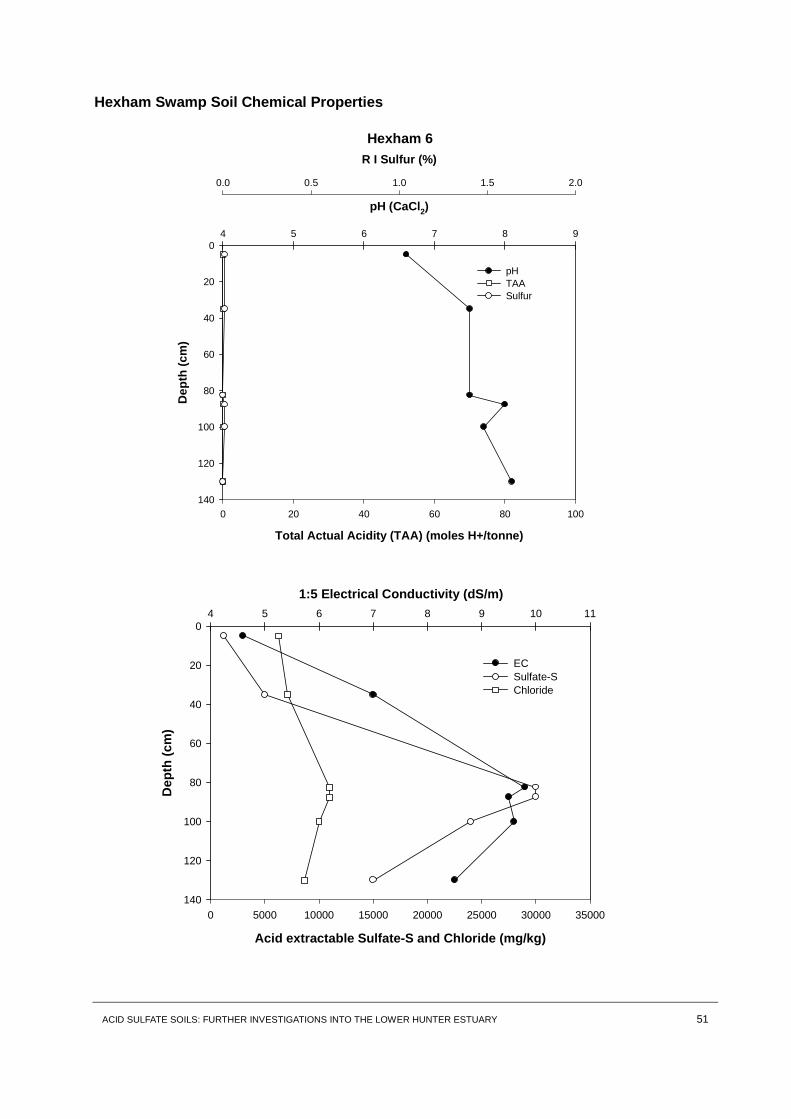
Hexham Swamp Soil Chemical Properties
Hexham 6
pH (CaCl 2)
4 5 6 7 8 9
Dep
th (
cm)
0
20
40
60
80
100
120
140
Total Actual Acidity (TAA) (moles H+/tonne)
0 20 40 60 80 100
R I Sulfur (%)
0.0 0.5 1.0 1.5 2.0
pHTAASulfur
1:5 Electrical Conductivity (dS/m)4 5 6 7 8 9 10 11
Dep
th (
cm)
0
20
40
60
80
100
120
140
Acid extractable Sulfate-S and Chloride (mg/kg)
0 5000 10000 15000 20000 25000 30000 35000
ECSulfate-SChloride
ACID SULFATE SOILS: FURTHER INVESTIGATIONS INTO THE LOWER HUNTER ESTUARY 52
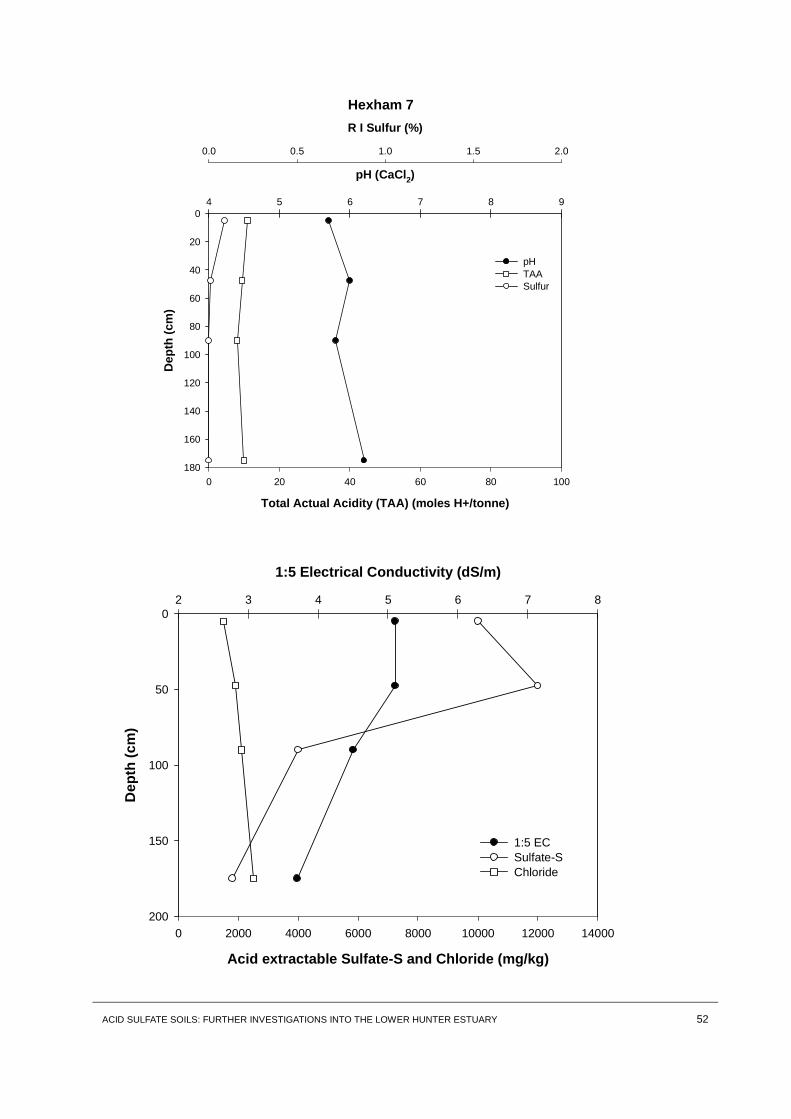
Hexham 7
pH (CaCl 2)
4 5 6 7 8 9
Dep
th (
cm)
0
20
40
60
80
100
120
140
160
180
Total Actual Acidity (TAA) (moles H+/tonne)
0 20 40 60 80 100
R I Sulfur (%)
0.0 0.5 1.0 1.5 2.0
pHTAASulfur
1:5 Electrical Conductivity (dS/m)
2 3 4 5 6 7 8
Dep
th (
cm)
0
50
100
150
200
Acid extractable Sulfate-S and Chloride (mg/kg)
0 2000 4000 6000 8000 10000 12000 14000
1:5 ECSulfate-SChloride
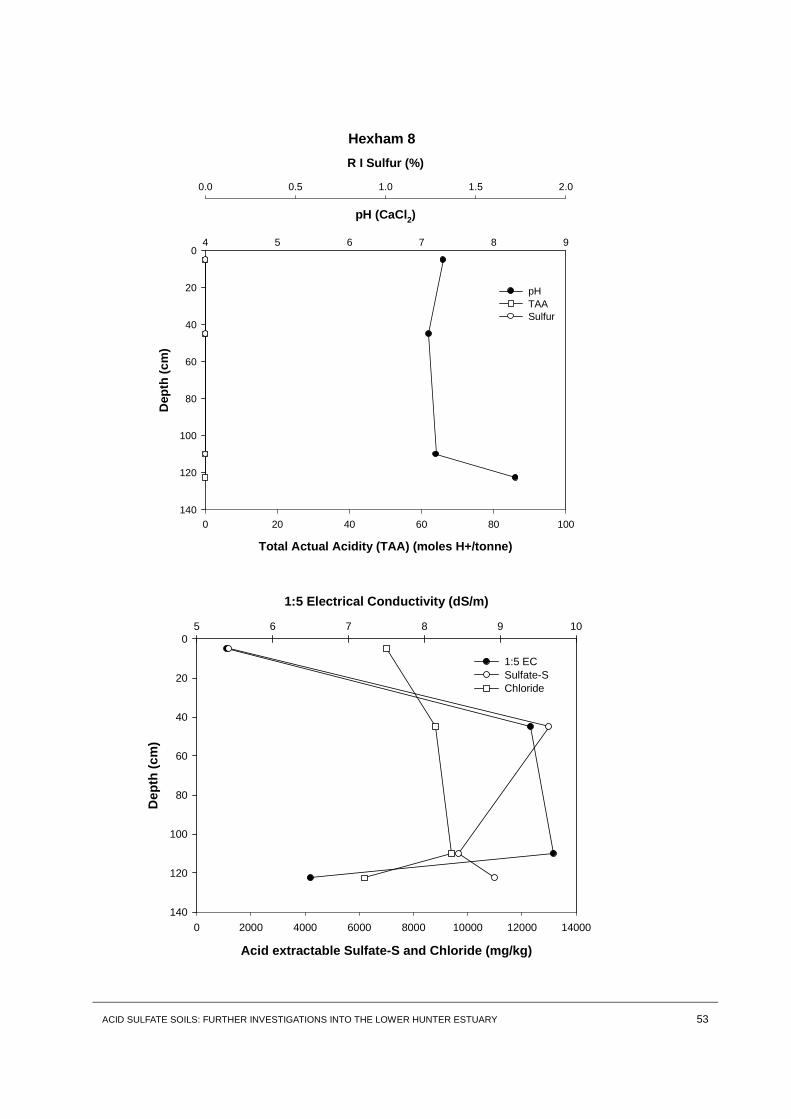
ACID SULFATE SOILS: FURTHER INVESTIGATIONS INTO THE LOWER HUNTER ESTUARY 53
Hexham 8
pH (CaCl2)
4 5 6 7 8 9
Dep
th (
cm)
0
20
40
60
80
100
120
140
Total Actual Acidity (TAA) (moles H+/tonne)
0 20 40 60 80 100
R I Sulfur (%)
0.0 0.5 1.0 1.5 2.0
pHTAASulfur
1:5 Electrical Conductivity (dS/m)
5 6 7 8 9 10
Dep
th (
cm)
0
20
40
60
80
100
120
140
Acid extractable Sulfate-S and Chloride (mg/kg)
0 2000 4000 6000 8000 10000 12000 14000
1:5 ECSulfate-SChloride
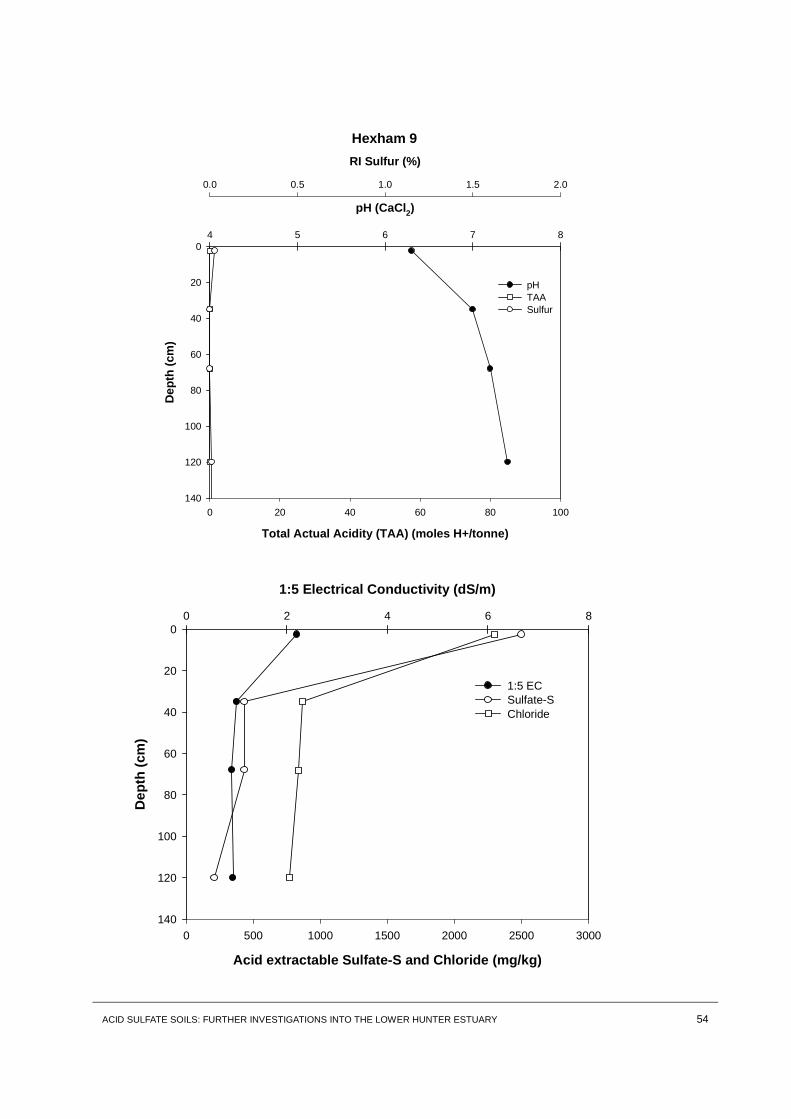
ACID SULFATE SOILS: FURTHER INVESTIGATIONS INTO THE LOWER HUNTER ESTUARY 54
Hexham 9
pH (CaCl2)
4 5 6 7 8
Dep
th (
cm)
0
20
40
60
80
100
120
140
Total Actual Acidity (TAA) (moles H+/tonne)
0 20 40 60 80 100
RI Sulfur (%)
0.0 0.5 1.0 1.5 2.0
pHTAASulfur
1:5 Electrical Conductivity (dS/m)
0 2 4 6 8
Dep
th (
cm)
0
20
40
60
80
100
120
140
Acid extractable Sulfate-S and Chloride (mg/kg)
0 500 1000 1500 2000 2500 3000
1:5 ECSulfate-SChloride
ACID SULFATE SOILS: FURTHER INVESTIGATIONS INTO THE LOWER HUNTER ESTUARY 55
Hexham 10
pH (CaCl 2)
3 4 5 6 7 8
Dep
th (
cm)
0
20
40
60
Total Actual Acidity (TAA) (moles H+/tonne)
0 20 40 60 80 100
R I Sulfur (%)
0.0 0.5 1.0 1.5 2.0
pHTAASulfur
1:5 Electrical Conductivity (dS/m)
0.00 0.05 0.10 0.15 0.20 0.25 0.30
Dep
th (
cm)
0
20
40
60
Acid extractable Sulfate-S and Chloride (mg/kg)
0 200 400 600 800 1000 1200 1400 1600 1800
1:5 ECSulfate-SChloride

ACID SULFATE SOILS: FURTHER INVESTIGATIONS INTO THE LOWER HUNTER ESTUARY 56
Hexham 11
pH (CaCl 2)
4.5 5.0 5.5 6.0 6.5 7.0
Dep
th (
cm)
0
20
40
60
80
100
Total Actual Acidity (TAA) (moles H+/tonne)
0 20 40 60 80 100
R I Sulfur (%)
0.0 0.5 1.0 1.5 2.0
pHTAASulfur
1:5 Electrical Conductivity (dS/m)
0.0 0.5 1.0 1.5 2.0 2.5 3.0
Dep
th (
cm)
0
20
40
60
80
100
Acid extractable Sulfate-S and Chloride (mg/kg)
0 500 1000 1500 2000 2500 3000 3500
1:5 ECSulfate-SChloride
ACID SULFATE SOILS: FURTHER INVESTIGATIONS INTO THE LOWER HUNTER ESTUARY 57
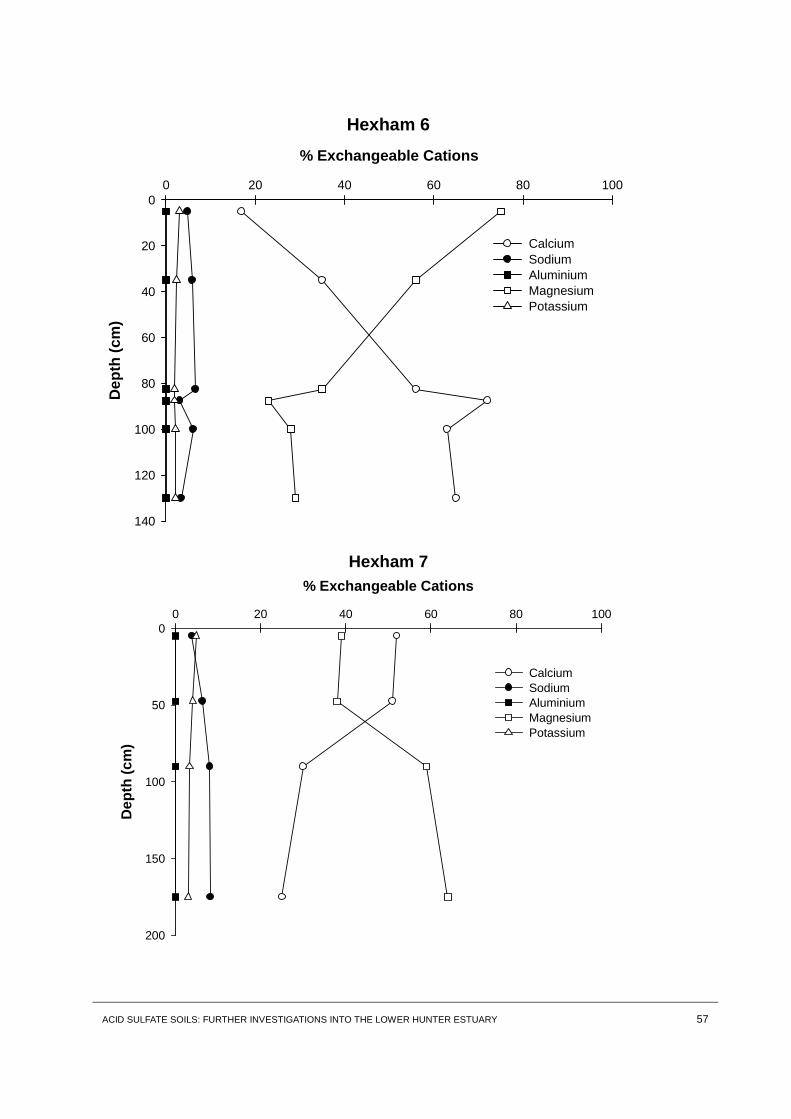
Hexham 6
% Exchangeable Cations
0 20 40 60 80 100
Dep
th (
cm)
0
20
40
60
80
100
120
140
CalciumSodium AluminiumMagnesiumPotassium
Hexham 7
% Exchangeable Cations
0 20 40 60 80 100
Dep
th (
cm)
0
50
100
150
200
CalciumSodiumAluminiumMagnesium Potassium
ACID SULFATE SOILS: FURTHER INVESTIGATIONS INTO THE LOWER HUNTER ESTUARY 58
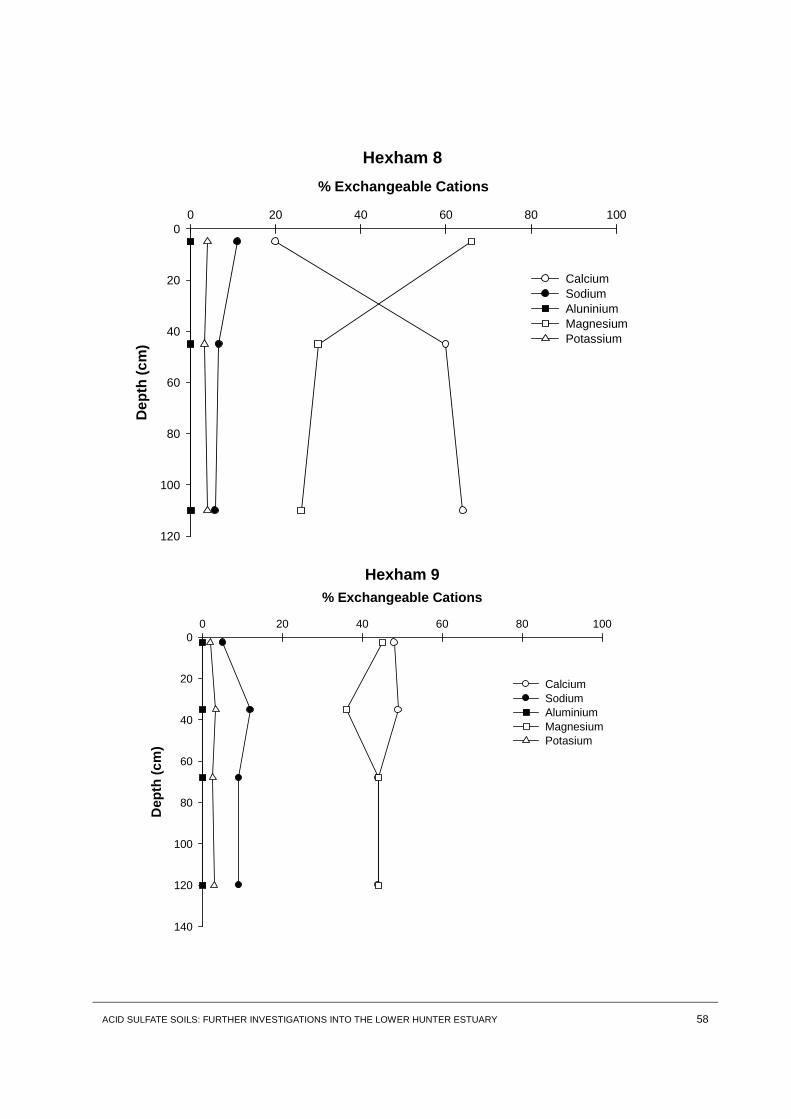
Hexham 8
% Exchangeable Cations
0 20 40 60 80 100
Dep
th (
cm)
0
20
40
60
80
100
120
CalciumSodiumAluniniumMagnesiumPotassium
Hexham 9
% Exchangeable Cations
0 20 40 60 80 100
Dep
th (
cm)
0
20
40
60
80
100
120
140
Calcium SodiumAluminiumMagnesiumPotasium

ACID SULFATE SOILS: FURTHER INVESTIGATIONS INTO THE LOWER HUNTER ESTUARY 59
Hexham 10
% Exchangeable Cations
0 20 40 60 80 100
Dep
th (
cm)
0
20
40
60
80
CalciumSodiumAluminiumMagnesiumPotassium
Hexham 11% Exchangeable Cations
0 20 40 60 80 100
Dep
th (
cm)
0
20
40
60
80
100
CalciumSodiumAluminiumMagnesiumPotassium