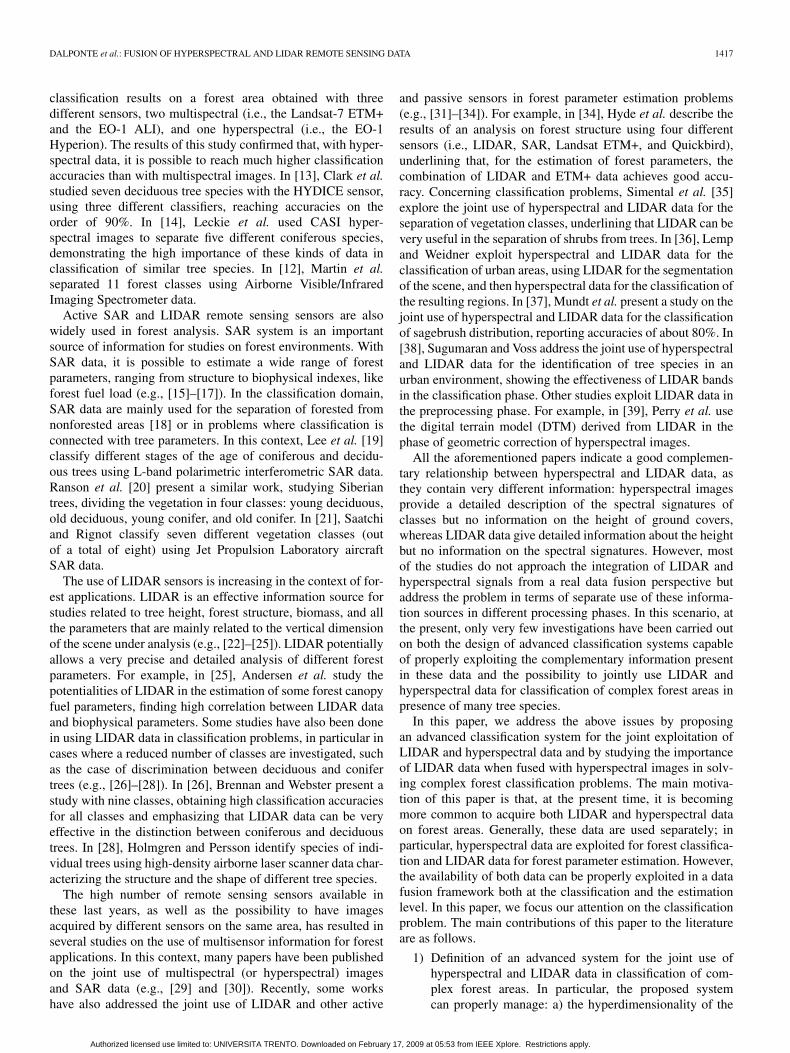
fusion of hyperspectral and lidar remote sensing data for
TRANSCRIPT

1416 IEEE TRANSACTIONS ON GEOSCIENCE AND REMOTE SENSING, VOL. 46, NO. 5, MAY 2008
Fusion of Hyperspectral and LIDAR Remote SensingData for Classification of Complex Forest Areas
Michele Dalponte, Student Member, IEEE, Lorenzo Bruzzone, Senior Member, IEEE, and Damiano Gianelle
Abstract—In this paper, we propose an analysis on the jointeffect of hyperspectral and light detection and ranging (LIDAR)data for the classification of complex forest areas. In greater detail,we present: 1) an advanced system for the joint use of hyperspec-tral and LIDAR data in complex classification problems; 2) aninvestigation on the effectiveness of the very promising supportvector machines (SVMs) and Gaussian maximum likelihood withleave-one-out-covariance algorithm classifiers for the analysis ofcomplex forest scenarios characterized from a high number ofspecies in a multisource framework; and 3) an analysis on theeffectiveness of different LIDAR returns and channels (elevationand intensity) for increasing the classification accuracy obtainedwith hyperspectral images, particularly in relation to the discrim-ination of very similar classes. Several experiments carried out ona complex forest area in Italy provide interesting conclusions onthe effectiveness and potentialities of the joint use of hyperspectraland LIDAR data and on the accuracy of the different classificationtechniques analyzed in the proposed system. In particular, the ele-vation channel of the first LIDAR return was very effective for theseparation of species with similar spectral signatures but differentmean heights, and the SVM classifier proved to be very robust andaccurate in the exploitation of the considered multisource data.
Index Terms—Data fusion, forestry, hyperspectral images, lightdetection and ranging (LIDAR) data, multisensor classification.
I. INTRODUCTION
FOREST preservation and management are important andcomplex processes, which have significant implications on
the environment (e.g., protection of biological diversity andclimate mitigation) and on the economy (e.g., estimation of tim-ber volume for commercial usage). An efficient prevention andmanagement policy requires a detailed knowledge of speciescomposition, distribution, and density. However, the assessmentof the distribution of tree species in large forests by a ground in-ventory is a difficult and time-consuming task. Remote sensingis a very useful technology to perform such kind of study. Thistechnology, if properly integrated with automatic processingtechniques, allows the analysis of large areas in a fast andaccurate way. Several studies have been carried out in this field,analyzing the potentialities of different remote sensing sensors,including passive multispectral and hyperspectral sensors, as
Manuscript received July 6, 2007; revised November 22, 2007.M. Dalponte is with the Department of Information and Communication
Technology, University of Trento, 38050 Trento, Italy, and also with theCentro di Ecologia Alpina, 38100 Trento, Italy (e-mail: [email protected]).
L. Bruzzone is with the Department of Information and Communica-tion Technology, University of Trento, 38050 Trento, Italy (e-mail: [email protected]).
D. Gianelle is with the Centro di Ecologia Alpina, 38100 Trento, Italy(e-mail: [email protected]).
Digital Object Identifier 10.1109/TGRS.2008.916480
well as active light detection and ranging (LIDAR) and syn-thetic aperture radar (SAR) systems (e.g., [1]–[36]). All thesesensors, with their different peculiarities and characteristics,can provide different information about the analyzed forest,allowing to reach different targets such as classification of treespecies or estimation of biophysical parameters.
Standard passive multispectral sensors (like the ThematicMapper of the Landsat satellites) have been widely used in thepast years for forest classification and analysis. In the literature,several studies are present on both classification and estimationof forest parameters (e.g., [1]–[4]). Regarding classification,due to the different spectral and geometrical characteristicsof multispectral sensors available, it is possible to find worksthat analyze the problem with different levels of geometricaldetail. Regarding low-resolution multispectral data, the analysisis generally limited to the discrimination between forestedand nonforested areas (see, for example, [5]). With medium-resolution sensors, the level of detail can be increased, andthus, the analysis can be focused on more specific classes, likein the study presented in [6] where, using Landsat EnhancedThematic Mapper Plus (ETM+) images, eight different vege-tation classes are analyzed. High geometrical resolution multi-spectral sensors (e.g., Quickbird, Ikonos, and SPOT5) allow amore detailed geometrical analysis considering the high spatialresolution, but due to the poor spectral information acquiredby these sensors, they do not allow a detailed analysis of treespecies. As an example, Kosaka et al. [7] analyze six foresttypes using Quickbird images and Wang et al. [8] distinguishthree kinds of mangrove using Ikonos and Quickbird data.
However, although significant results in forest analysis canbe obtained with these kinds of data, in forest characterized by ahigh number of similar tree species, these sensors do not allow adetailed analysis of the different forest species, as they acquireinformation in a relatively small number of bands with largespectral intervals. The new generation of passive hyperspectralsensors, due to their ability to make a dense sampling of thespectral signature, can instead collect a valuable informationfor a detailed classification and analysis of similar forest types.In particular, these data can be used in a wide range of differentanalyses of forest environments. Several studies have addressedthe capability of hyperspectral data to estimate particular bio-physical parameters like chlorophyll concentration or biomassvolume (e.g., [9]–[11]). Concerning classification problems,hyperspectral images have been used in a wide number offorest applications, ranging from general cases focusing onthe discrimination between forest and other land covers, toa more detailed analysis dealing with the distinction of dif-ferent tree species (e.g., [6], [12]–[14]). In [6], for example,Goodenough et al. present an interesting analysis comparing
0196-2892/$25.00 © 2008 IEEE
Authorized licensed use limited to: UNIVERSITA TRENTO. Downloaded on February 17, 2009 at 05:53 from IEEE Xplore. Restrictions apply.
DALPONTE et al.: FUSION OF HYPERSPECTRAL AND LIDAR REMOTE SENSING DATA 1417
classification results on a forest area obtained with threedifferent sensors, two multispectral (i.e., the Landsat-7 ETM+and the EO-1 ALI), and one hyperspectral (i.e., the EO-1Hyperion). The results of this study confirmed that, with hyper-spectral data, it is possible to reach much higher classificationaccuracies than with multispectral images. In [13], Clark et al.studied seven deciduous tree species with the HYDICE sensor,using three different classifiers, reaching accuracies on theorder of 90%. In [14], Leckie et al. used CASI hyper-spectral images to separate five different coniferous species,demonstrating the high importance of these kinds of data inclassification of similar tree species. In [12], Martin et al.separated 11 forest classes using Airborne Visible/InfraredImaging Spectrometer data.
Active SAR and LIDAR remote sensing sensors are alsowidely used in forest analysis. SAR system is an importantsource of information for studies on forest environments. WithSAR data, it is possible to estimate a wide range of forestparameters, ranging from structure to biophysical indexes, likeforest fuel load (e.g., [15]–[17]). In the classification domain,SAR data are mainly used for the separation of forested fromnonforested areas [18] or in problems where classification isconnected with tree parameters. In this context, Lee et al. [19]classify different stages of the age of coniferous and decidu-ous trees using L-band polarimetric interferometric SAR data.Ranson et al. [20] present a similar work, studying Siberiantrees, dividing the vegetation in four classes: young deciduous,old deciduous, young conifer, and old conifer. In [21], Saatchiand Rignot classify seven different vegetation classes (outof a total of eight) using Jet Propulsion Laboratory aircraftSAR data.
The use of LIDAR sensors is increasing in the context of for-est applications. LIDAR is an effective information source forstudies related to tree height, forest structure, biomass, and allthe parameters that are mainly related to the vertical dimensionof the scene under analysis (e.g., [22]–[25]). LIDAR potentiallyallows a very precise and detailed analysis of different forestparameters. For example, in [25], Andersen et al. study thepotentialities of LIDAR in the estimation of some forest canopyfuel parameters, finding high correlation between LIDAR dataand biophysical parameters. Some studies have also been donein using LIDAR data in classification problems, in particular incases where a reduced number of classes are investigated, suchas the case of discrimination between deciduous and conifertrees (e.g., [26]–[28]). In [26], Brennan and Webster present astudy with nine classes, obtaining high classification accuraciesfor all classes and emphasizing that LIDAR data can be veryeffective in the distinction between coniferous and deciduoustrees. In [28], Holmgren and Persson identify species of indi-vidual trees using high-density airborne laser scanner data char-acterizing the structure and the shape of different tree species.
The high number of remote sensing sensors available inthese last years, as well as the possibility to have imagesacquired by different sensors on the same area, has resulted inseveral studies on the use of multisensor information for forestapplications. In this context, many papers have been publishedon the joint use of multispectral (or hyperspectral) imagesand SAR data (e.g., [29] and [30]). Recently, some workshave also addressed the joint use of LIDAR and other active
and passive sensors in forest parameter estimation problems(e.g., [31]–[34]). For example, in [34], Hyde et al. describe theresults of an analysis on forest structure using four differentsensors (i.e., LIDAR, SAR, Landsat ETM+, and Quickbird),underlining that, for the estimation of forest parameters, thecombination of LIDAR and ETM+ data achieves good accu-racy. Concerning classification problems, Simental et al. [35]explore the joint use of hyperspectral and LIDAR data for theseparation of vegetation classes, underlining that LIDAR can bevery useful in the separation of shrubs from trees. In [36], Lempand Weidner exploit hyperspectral and LIDAR data for theclassification of urban areas, using LIDAR for the segmentationof the scene, and then hyperspectral data for the classification ofthe resulting regions. In [37], Mundt et al. present a study on thejoint use of hyperspectral and LIDAR data for the classificationof sagebrush distribution, reporting accuracies of about 80%. In[38], Sugumaran and Voss address the joint use of hyperspectraland LIDAR data for the identification of tree species in anurban environment, showing the effectiveness of LIDAR bandsin the classification phase. Other studies exploit LIDAR data inthe preprocessing phase. For example, in [39], Perry et al. usethe digital terrain model (DTM) derived from LIDAR in thephase of geometric correction of hyperspectral images.
All the aforementioned papers indicate a good complemen-tary relationship between hyperspectral and LIDAR data, asthey contain very different information: hyperspectral imagesprovide a detailed description of the spectral signatures ofclasses but no information on the height of ground covers,whereas LIDAR data give detailed information about the heightbut no information on the spectral signatures. However, mostof the studies do not approach the integration of LIDAR andhyperspectral signals from a real data fusion perspective butaddress the problem in terms of separate use of these informa-tion sources in different processing phases. In this scenario, atthe present, only very few investigations have been carried outon both the design of advanced classification systems capableof properly exploiting the complementary information presentin these data and the possibility to jointly use LIDAR andhyperspectral data for classification of complex forest areas inpresence of many tree species.
In this paper, we address the above issues by proposingan advanced classification system for the joint exploitation ofLIDAR and hyperspectral data and by studying the importanceof LIDAR data when fused with hyperspectral images in solv-ing complex forest classification problems. The main motiva-tion of this paper is that, at the present time, it is becomingmore common to acquire both LIDAR and hyperspectral dataon forest areas. Generally, these data are used separately; inparticular, hyperspectral data are exploited for forest classifica-tion and LIDAR data for forest parameter estimation. However,the availability of both data can be properly exploited in a datafusion framework both at the classification and the estimationlevel. In this paper, we focus our attention on the classificationproblem. The main contributions of this paper to the literatureare as follows.
1) Definition of an advanced system for the joint use ofhyperspectral and LIDAR data in classification of com-plex forest areas. In particular, the proposed systemcan properly manage: a) the hyperdimensionality of the
Authorized licensed use limited to: UNIVERSITA TRENTO. Downloaded on February 17, 2009 at 05:53 from IEEE Xplore. Restrictions apply.
1418 IEEE TRANSACTIONS ON GEOSCIENCE AND REMOTE SENSING, VOL. 46, NO. 5, MAY 2008
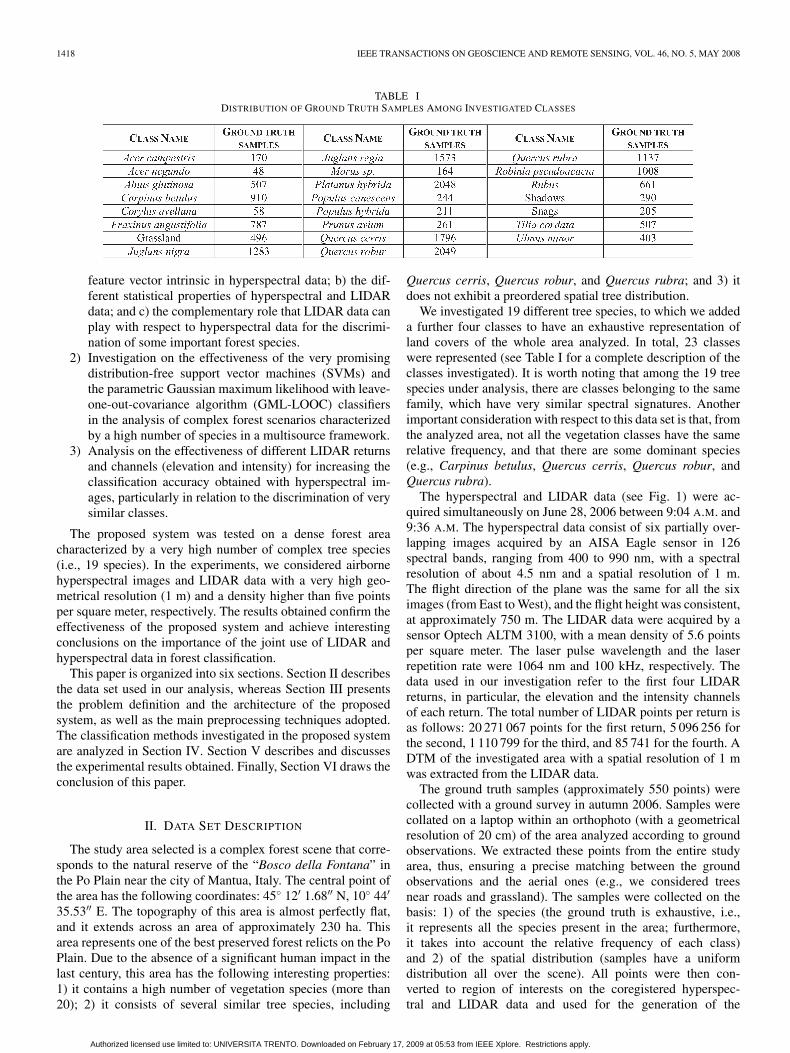
TABLE IDISTRIBUTION OF GROUND TRUTH SAMPLES AMONG INVESTIGATED CLASSES
feature vector intrinsic in hyperspectral data; b) the dif-ferent statistical properties of hyperspectral and LIDARdata; and c) the complementary role that LIDAR data canplay with respect to hyperspectral data for the discrimi-nation of some important forest species.
2) Investigation on the effectiveness of the very promisingdistribution-free support vector machines (SVMs) andthe parametric Gaussian maximum likelihood with leave-one-out-covariance algorithm (GML-LOOC) classifiersin the analysis of complex forest scenarios characterizedby a high number of species in a multisource framework.
3) Analysis on the effectiveness of different LIDAR returnsand channels (elevation and intensity) for increasing theclassification accuracy obtained with hyperspectral im-ages, particularly in relation to the discrimination of verysimilar classes.
The proposed system was tested on a dense forest areacharacterized by a very high number of complex tree species(i.e., 19 species). In the experiments, we considered airbornehyperspectral images and LIDAR data with a very high geo-metrical resolution (1 m) and a density higher than five pointsper square meter, respectively. The results obtained confirm theeffectiveness of the proposed system and achieve interestingconclusions on the importance of the joint use of LIDAR andhyperspectral data in forest classification.
This paper is organized into six sections. Section II describesthe data set used in our analysis, whereas Section III presentsthe problem definition and the architecture of the proposedsystem, as well as the main preprocessing techniques adopted.The classification methods investigated in the proposed systemare analyzed in Section IV. Section V describes and discussesthe experimental results obtained. Finally, Section VI draws theconclusion of this paper.
II. DATA SET DESCRIPTION
The study area selected is a complex forest scene that corre-sponds to the natural reserve of the “Bosco della Fontana” inthe Po Plain near the city of Mantua, Italy. The central point ofthe area has the following coordinates: 45 12′ 1.68′′ N, 10 44′
35.53′′ E. The topography of this area is almost perfectly flat,and it extends across an area of approximately 230 ha. Thisarea represents one of the best preserved forest relicts on the PoPlain. Due to the absence of a significant human impact in thelast century, this area has the following interesting properties:1) it contains a high number of vegetation species (more than20); 2) it consists of several similar tree species, including
Quercus cerris, Quercus robur, and Quercus rubra; and 3) itdoes not exhibit a preordered spatial tree distribution.
We investigated 19 different tree species, to which we addeda further four classes to have an exhaustive representation ofland covers of the whole area analyzed. In total, 23 classeswere represented (see Table I for a complete description of theclasses investigated). It is worth noting that among the 19 treespecies under analysis, there are classes belonging to the samefamily, which have very similar spectral signatures. Anotherimportant consideration with respect to this data set is that, fromthe analyzed area, not all the vegetation classes have the samerelative frequency, and that there are some dominant species(e.g., Carpinus betulus, Quercus cerris, Quercus robur, andQuercus rubra).
The hyperspectral and LIDAR data (see Fig. 1) were ac-quired simultaneously on June 28, 2006 between 9:04 A.M. and9:36 A.M. The hyperspectral data consist of six partially over-lapping images acquired by an AISA Eagle sensor in 126spectral bands, ranging from 400 to 990 nm, with a spectralresolution of about 4.5 nm and a spatial resolution of 1 m.The flight direction of the plane was the same for all the siximages (from East to West), and the flight height was consistent,at approximately 750 m. The LIDAR data were acquired by asensor Optech ALTM 3100, with a mean density of 5.6 pointsper square meter. The laser pulse wavelength and the laserrepetition rate were 1064 nm and 100 kHz, respectively. Thedata used in our investigation refer to the first four LIDARreturns, in particular, the elevation and the intensity channelsof each return. The total number of LIDAR points per return isas follows: 20 271 067 points for the first return, 5 096 256 forthe second, 1 110 799 for the third, and 85 741 for the fourth. ADTM of the investigated area with a spatial resolution of 1 mwas extracted from the LIDAR data.
The ground truth samples (approximately 550 points) werecollected with a ground survey in autumn 2006. Samples werecollated on a laptop within an orthophoto (with a geometricalresolution of 20 cm) of the area analyzed according to groundobservations. We extracted these points from the entire studyarea, thus, ensuring a precise matching between the groundobservations and the aerial ones (e.g., we considered treesnear roads and grassland). The samples were collected on thebasis: 1) of the species (the ground truth is exhaustive, i.e.,it represents all the species present in the area; furthermore,it takes into account the relative frequency of each class)and 2) of the spatial distribution (samples have a uniformdistribution all over the scene). All points were then con-verted to region of interests on the coregistered hyperspec-tral and LIDAR data and used for the generation of the
Authorized licensed use limited to: UNIVERSITA TRENTO. Downloaded on February 17, 2009 at 05:53 from IEEE Xplore. Restrictions apply.

DALPONTE et al.: FUSION OF HYPERSPECTRAL AND LIDAR REMOTE SENSING DATA 1419
Fig. 1. Example of images used in the experiments. (a) Channel 34 (550 nm) of the hyperspectral image. (b) DCM of the analyzed area.
training and test sets. The total number of ground truth samples(16 816 pixels) represents about 0.7% of the whole investi-gated area.
III. PROBLEM DEFINITION AND SYSTEM ARCHITECTURE
A. Problem Definition
Generally, the analysis of large forest areas with hyperspec-tral scanners (usually characterized from a relatively smallfield of view) requires the acquisition of different images thatare then integrated according to a mosaic procedure. In thiscontext, let us consider a series of M hyperspectral images Xi
(i = 1, . . . ,M ) acquired in partially overlapping portions of theinvestigated area, and a LIDAR image L taken simultaneouslywith the hyperspectral ones. Let H be the radiometric normal-ized mosaic of these images, and Hnr be the correspondingnoise-reduced hyperspectral image. Xi (i = 1, . . . ,M ), H ,and Hnr are n-dimensional images, where n is the totalnumber of spectral bands. Let L denote the LIDAR interpolatedimage that consists of the elevation and the intensity channels ofthe first m LIDAR returns. The total number of bands of L is 2 ∗m, due to the fact that for each return, we have both elevationE and intensity I image (i.e., L = E ∪ I). Thus, E and I arem-dimensional images, representing the elevation and the in-tensity of the first m LIDAR returns, respectively. Let xp be theq-dimensional feature vector that represents the pth pattern ininput to the classifier. Finally, let Ω = ω1, ω2, . . . , ωK be theset of the K land-cover classes in the considered classificationproblem, with ωi the ith class.
As stated in Section I, we focus on a specific problem: thefusion of hyperspectral and LIDAR data for classification oftrees species. To reach this objective, we propose a systembased on an architecture that processes both hyperspectral andLIDAR data, exploiting the complementary role that these datacan play. The architecture of the proposed system (with theaforementioned notation) is shown in Fig. 2. In the following,we present, in detail, the different parts of the system.
B. System Architecture
The analysis of two different kinds of data (hyperspectraland LIDAR) requires the use of two different preprocessing
schemes. For hyperspectral data, according to what was pre-viously described, it is necessary to mosaic various images toachieve coverage of the whole site. Before this phase, a relativeradiometric normalization should be applied to the single im-ages to obtain a uniform mosaic image. Several normalizationalgorithms have been proposed in literature (e.g., [40] and [41]).Since the investigated area is almost perfectly flat, and the datawere acquired in a reduced interval of time (about 30 min), itis reasonable to assume that all six hyperspectral images weretaken under the same illumination conditions. Therefore, andtaking into account that in the classification phase we use a su-pervised classification system, we applied a relative radiometricnormalization to the images without any specific atmosphericcorrection. In greater detail, we adopted a simple linear normal-ization based on the mean-standard deviation algorithm [40].
After creating the mosaic, we coregistered the hyperspectraldata to the LIDAR images, using approximately 75 groundcontrol points distributed across the entire image. In particular,to warp the image, we selected a polynomial transformation ofthird order and a nearest-neighbor resampling of the pixels. Theroot-mean-square error resulting after the coregistration phasewas 0.76. The hyperspectral data were then denoised with asimple low-pass filter with a window size of 3 × 3 pixels. Inthe previously published literature, several studies pointed outthe usefulness of this operation (e.g., [42] and [43]). In our case,given the high geometrical resolution of the images, the spatialdegradation involved by the filter is acceptable with respect toboth the reduction of the noise present in the images and theexpected increase in class separability [42].
From a methodological viewpoint, the automatic analysisof hyperspectral data in the presence of a high number offorest classes is not a trivial task. In particular, the complexitycan be attributed to: 1) the high computational cost; 2) theneed of advanced classification systems capable of adequatelymodeling the nonlinear hyperdimensional discrimination func-tions associated with the presence of many tree species; and3) the curse of dimensionality. In the context of a supervisedclassification, one of the main difficulties is related to theusually small ratio between the number of available trainingsamples and the number of features (Hughes phenomenon [44])that makes it difficult (or impossible) to estimate the parameters
Authorized licensed use limited to: UNIVERSITA TRENTO. Downloaded on February 17, 2009 at 05:53 from IEEE Xplore. Restrictions apply.

1420 IEEE TRANSACTIONS ON GEOSCIENCE AND REMOTE SENSING, VOL. 46, NO. 5, MAY 2008
Fig. 2. Architecture of the system developed.
of the classifier [e.g., with the Gaussian maximum-likelihood(GML) algorithm].
A possible solution to this problem is to use a featureselection technique. The rationale of this approach is to reducethe number of features by selecting a representative subset ofthe original spectral channels. A feature selection techniqueis made up of a search strategy and of a separability crite-rion. In the literature, several algorithms have been proposedfor both these tasks. Concerning the search strategy, we canfind optimal procedures (e.g., branch and bound [43]), whichallow us to identify the subset of features that maximizesthe separability criterion, or suboptimal ones (e.g., sequentialforward floating selection (SFFS) [45], steepest ascent [46]),which find a suboptimal solution with a reduced computationalcost. For our study, we adopted the SFFS algorithm, whichis widely used in the literature as it provides solutions rea-sonably close to the optimal one. Regarding the separabilitycriterion, several measures have been presented in the literature,including the Bhattacharyya distance, the Jeffreys–Matusitadistance, and transformed divergence [43], [47]. We selectedthe Jeffreys–Matusita distance, which is associated to theChernoff upper bound to the Bayesian error also in the mul-ticlass case [48].
For the LIDAR analysis, we rasterized the raw data (corre-sponding to the LAS format) of all the returns. The elevationand the intensity channels were converted into a raster imagewith a spatial resolution of 1 m, assigning to each pixel themean value of points within the corresponding area on theground. The few pixels with missing data in the first return werereplaced by a linear interpolation, whereas no interpolation wasapplied to the other returns. After this phase, to determine theheight of vegetation with respect to the ground, we extractedthe digital canopy model (DCM) by subtracting the DTM to
the elevation channel of the LIDAR return. This procedure wasapplied to the elevation band of all four LIDAR returns.
IV. CLASSIFICATION TECHNIQUES
In the definition of the proposed system, we analyzed andcompared two advanced classification techniques, specificallysuitable to the analysis of hyperdimensional feature spaces,to evaluate their effectiveness in classifying complex forestareas in a multisource framework. The first technique is aparametric regularized GML classifier that applies the leave-one-out-covariance (LOOC) procedure [48] to the estimationof the statistics of the classifier. The second technique is adistribution-free machine learning classifier based on the SVM[49], [50]. The main motivations for this choice are: 1) GML-LOOC and SVM have been widely used in previous studieson classification of hyperspectral data (e.g., [48]–[50]), provingtheir effectiveness in hyperdimensional feature spaces; 2) bothtechniques are intrinsically able to solve ill-posed classificationproblems, in which the ratio between the number of avail-able training samples and the number of features is relativelysmall (this is a typical situation with hyperspectral data); and3) despite the aforementioned common properties, GML-LOOC and SVM represent a good sampling of two differ-ent categories of classification algorithms. GML-LOOC is aparametric classifier based on the Gaussian model for the ap-proximation of the class distributions. It represents an effectiveversion of the widely used standard ML classifier for the analy-sis of hyperspectral data. The SVM classifier is a distribution-free complex classifier, which is based on machine learningand, thus, on a completely different theoretical background withrespect to GML-LOOC. SVM proved to be very effective forclassification of hyperspectral data (e.g., [49] and [50]).
Authorized licensed use limited to: UNIVERSITA TRENTO. Downloaded on February 17, 2009 at 05:53 from IEEE Xplore. Restrictions apply.

DALPONTE et al.: FUSION OF HYPERSPECTRAL AND LIDAR REMOTE SENSING DATA 1421
In the following, we briefly recall the main properties of theseclassifiers.
A. GML-LOOC
This algorithm belongs to the family of parametric tech-niques and is based on the GML classifier. The standard GMLprocedure is effective when the ratio between the number oftraining samples and the dimension of the feature space isrelatively high, but its performance degrades when this ratiodecreases (Hughes phenomenon [43]). In particular, when thenumber of training samples is smaller than the number offeatures, the covariance matrix used in the decision rule be-come singular, and thus, the GML cannot be used. To avoidthis problem, several algorithms have been developed for theestimation of a nonsingular covariance matrix (e.g., [48]–[54]).In our study, we chose the algorithm proposed in [48], calledLOOC algorithm. In the following, we give more details on thisclassifier.
Let xp be the pth pattern to be classified, and µi and Σi (withi = 1, . . . , K) be the mean value and the covariance matrix ofthe ith investigated class, respectively. The decision rule is asfollows:
xp ∈ ωj ⇔ dj(xp) > di(xp) ∀ i = j (1)
where di(xp) is computed as
di(xp) = (xp − µi)tΣ−1i (xp − µi) + ln |Σi|. (2)
Usually, the true values of the mean vectors and of the covari-ance matrices are not known, and they should be estimated fromthe training samples. When a reduced number of samples isavailable, the covariance matrices can be replaced with the com-mon covariance matrix, defined as S = (1/K)
∑Ki=1 Σi [48].
The LOOC algorithm proposes a more refined way to estimatethe covariance matrices for classes characterized by a reducednumber of training samples. In particular, the covariance matrixΣLOOC
i of the ith class is estimated as follows:
ΣLOOCi (αi) =
(1 − αi)diag(Σi) + αiΣi, 0 ≤ αi ≤ 1(2 − αi)Σi + (αi − 1)S, 1 < αi ≤ 2(3 − αi)S + (αi − 2)diag(S), 2 < αi ≤ 3
(3)
where αi is a mixing parameter, whose value is selected ac-cording to the following procedure: 1) removing one sample;2) computing the mean and covariance from the remainingsamples; and 3) computing the likelihood of the sample whichwas left out, given the mean and covariance estimates. Eachsample is removed in turn, and the average log likelihood iscomputed. The value that maximizes the average log likelihoodis selected [55]. This implementation has proved to be particu-larly effective in hyperspectral data classification.1
It is worth noting that since this classifier models the classdistributions according to a Gaussian function, its applicationto multisensor data implies a Gaussian approximation of the
1In this paper, we used the implementation contained in the MultiSpecsoftware [55].
distribution of classes on the stacked feature vector. This ap-proximation is reasonable from an application viewpoint, but itis not rigorous from a theoretical prospective.
B. SVM
SVMs are distribution-free classifiers that overcome theaforementioned approximation of the GML-LOOC classifier.Developed by Vapnik [56], SVM classifiers have undergonegreat development in the last ten years and have been suc-cessfully applied to several remote sensing problems (e.g., [49]and [50]). Their success is justified from four main properties:1) their relatively high classification accuracy and very goodgeneralization capability with respect to other classifiers; 2) thelimited effort required for architecture design and trainingphase if compared to other machine learning algorithms (suchas multilayer perceptron neural networks); 3) the convexityof the cost function that always finds the optimum solution;and 4) their effectiveness in ill-posed classification problems(problems with a low ratio between number of training samplesand number of features) [50]. In the following, we briefly relatethe main concepts and the mathematical formulation of SVMs.2
Let us consider a binary classification problem. Let usassume that the training set consists of Q vectors xp ∈ Rq,with the corresponding target yp ∈ −1;+1, where “+1”and “−1” denote the labels of the considered classes. Thenonlinear SVM approach consists of mapping the data into ahigher dimensional feature space, i.e., Φ(xp) ∈ Rq′
(q′ q),where it looks for a separation between the two classes bymeans of an optimal hyperplane defined by a weight vectorw ∈ R
q′and a bias b ∈ R. In particular, w is a vector or-
thogonal to the separating hyperplane, b is a scalar value suchthat the ratio b/‖w‖ represents the distance of the hyperplanefrom the origin, and the function Φ represents a nonlineartransformation. The membership decision rule is defined ac-cording to sign[f(x)], where f(x) represents the discriminantfunction associated with the hyperplane and is written as
f(x) = w · Φ(x) + b. (4)
The optimal hyperplane is the one that minimizes a cost func-tion, which expresses a combination of two criteria: marginmaximization and error minimization. It is defined as
Ψ(w, ξ) =12‖w‖2 + C
Q∑p=1
ξp. (5)
This cost function minimization is subject to the followingconstraints:
yp · (w · xp + b) ≥ 1 − ξp ∀ p = 1, . . . , Q (6)ξp ≥ 0 ∀ p = 1, . . . , Q (7)
where ξp are the so-called slack variables and are defined asfollows:
ξ ((xp,yp), (w, b)) = ξp = max (0, 1 − yp (w · Φ(xp) + b))(8)
2We used our own implementation of SVM, which is based on the sequentialminimal optimization procedure.
Authorized licensed use limited to: UNIVERSITA TRENTO. Downloaded on February 17, 2009 at 05:53 from IEEE Xplore. Restrictions apply.

1422 IEEE TRANSACTIONS ON GEOSCIENCE AND REMOTE SENSING, VOL. 46, NO. 5, MAY 2008
and they are introduced to take into account nonseparabledata. The constant C represents a regularization parameter thatcontrols the shape of the discriminant function, and conse-quently, the decision boundary when data are nonseparable.The above optimization problem can be reformulated througha Lagrange functional for which the Lagrange multipliers canbe found by means of a dual optimization leading to a quadraticprogramming solution [56]. The final result is a discriminantfunction conveniently expressed as a function of the data in theoriginal (lower) dimensional feature space, i.e.,
f(x) =∑i∈S
αiyiΦ(xi,x) + b (9)
where Φ(·, ·) is a kernel function, and S is the subset of trainingsamples corresponding to the nonzero Lagrange multipliers.It is worth noting that the Lagrange multipliers αi effectivelyweight each training sample according to its importance indetermining the discriminant function. The training samplesassociated with nonzero weights are termed support vectors[50]. In particular, the support vectors, where αi = C, arereferred to as bound support vector, and support vectors with0 < αi < C are called nonbound support vectors. The kernelΦ(·, ·) must satisfy the condition of Mercer’s theorem so that itcorresponds to some type of inner product in the transformed(higher) dimensional feature space [56].
The SVM classifier was developed to solve binary classi-fication problems, but it can be easily extended to multiclassproblems. The two main strategies used for K class problemsare as follows. 1) One-Against-One—the K-class problem isdecomposed into K(K − 1)/2 binary problems, each focusedon the recognition of a pair of classes. A generic pattern is asso-ciated with the class that receives the majority of the votes fromthe ensemble of binary classifiers. 2) One-Against-All—theK-class problem is decomposed into K binary problems, eachfocused on the recognition of one class against all the oth-ers. The “winner-takes-all” rule is used for the final decision,i.e., the winning class is the one corresponding to the SVM withthe highest output (discriminant function value). We refer thereader to [50] for greater details on SVM classifiers and on therelated multiclass strategies.
V. EXPERIMENTAL ANALYSIS AND DISCUSSION
A. Experimental Design
To assess the effectiveness of the proposed system and toachieve the goals of this paper, we defined three differentexperiments: 1) analysis of the importance of the joint use ofhyperspectral images and the first LIDAR return on the classifi-cation of complex forest areas; 2) analysis on the usefulnessof multiple LIDAR returns and of the different informationcontained in elevation and intensity channels; and 3) analysison the generalization capability of the proposed system.
For the first two experiments, we carried out the learning ofthe classifier (with the model selection) and the accuracy as-sessment according to a k-fold cross-validation procedure. Thisallowed us to analyze, from a rigorous statistical perspective,the potential of the proposed system, and of the hyperspectral
and LIDAR sensors, in the considered scenario. We randomlydivided the available ground truth data into five subsets, andwe then adopted a fivefold cross-validation procedure, withtraining samples (pixels) distributed all over the scene. Thesamples of ground truth data available were used as follows:20% in the training set (about 3300 samples) and 80% in thetest set (about 13 500 samples). It is worth noting that the useof only 20% of the ground truth samples for learning tendsto result in minority classes with very few training samples.However, this choice is reasonable as it represents a typicalcondition of real operational applications.
With regard to the last experiment, we defined the trainingand the test sets by considering samples from different spatiallydisjoint areas to analyze the generalization capability of thesystem with respect to the variability and the nonstationarybehavior of the spectral signatures of the classes. In furtherdetail, for this experiment, the training and test samples wereselected purposefully avoiding that they share pixels belongingto the same tree crown (i.e., all the pixels of a tree crown arecompletely included in only one of the two sets).
The performances of the system were assessed by usingerror matrices. We derived the overall kappa coefficients fromthese matrices, as described by Congalton and Green [57], andanalyzed the statistic significance of results according to theZeta test [57].
In our experiments, we used also the k-Nearest Neighbor(k-NN) classifier to compare the accuracy provided by theadvanced classifiers included in the proposed system with asimple distribution-free classification technique. For the modelselection of the SVM classifier, we chose a Gaussian kernelfunction and applied a grid search strategy in a range between50 and 240 for C and in a range between 1 and 1000 for γ. Forthe k-NN classifier, the value of k varied from 1 to 29.
B. Experiment 1: Analysis of the Effectiveness of the ProposedMultisensor Classification System
Let us consider the noise-reduced hyperspectral data, as wellas the intensity and the corrected elevation of the first LIDARreturn. In this experiment, we analyze the effectiveness ofthe first LIDAR return channels, at first, considering only theglobal kappa accuracy, and then analyzing in greater detail theclass-by-class accuracies. Experiments were conducted withthree classifiers: SVM, GML-LOOC, and k-Nearest Neigh-bor (k-NN). We carried out different trials using 126, 40,and 25 spectral channels derived according to the feature se-lection algorithm. Fig. 3 shows the behavior of the averageJeffreys–Matusita distance versus the number of hyperspectralchannels selected with the SFFS search strategy. It is worthnoting that the typical trend of this distance, which reachessaturation when the number of features used do not change theseparability among information classes. We reached saturationwith about 25 features but, in this experiment and in the fol-lowing, we also analyzed what occurred with 40 hyperspectralfeatures. This was done for consideration of some margin on theminimum number of input channels derived from the featureselection phase. This is reasonable to better consider also theaccuracy of minority classes that less affect the behavior of theaverage Jeffreys–Matusita distance.
Authorized licensed use limited to: UNIVERSITA TRENTO. Downloaded on February 17, 2009 at 05:53 from IEEE Xplore. Restrictions apply.

DALPONTE et al.: FUSION OF HYPERSPECTRAL AND LIDAR REMOTE SENSING DATA 1423
Fig. 3. Behavior of the average Jeffreys–Matusita distance versus the numberof selected features.
TABLE IIKAPPA ACCURACIES OBTAINED ON THE TEST SET WITH DIFFERENT
SPECTRAL FEATURES AND CLASSIFIERS
Table II illustrates the kappa accuracies obtained with differ-ent classifiers when varying the features used. From the analysisof these accuracies, we can infer some important points. Forthe SVM classifier, the accuracies obtained are particularlyhigh considering the number of classes (23) and the numberof training samples per class (as shown in Table I, for someclasses in the training phase, we have only ten samples). Inparticular, it is possible to observe that the SVM classifieralways provided significantly higher accuracy than both the k-NN and the GML-LOOC techniques. In greater detail, due to itsstrongly nonlinear properties, the SVM classifier obtained with25 features a kappa accuracy that is higher than that obtainedby the GML-LOOC technique with all the 126 channels. Theseresults confirm the superior performances of the SVM tech-nique, which also involves an intrinsically better generalizationability. The higher potentialities of the SVM classifier can beexplained by the fact that it is a distribution-free techniquethat does not approximate the distribution of classes with anypredefined statistical model (the GML-LOOC assume Gaussianapproximation) but models the decision boundary on the basisof the available training data. This results in the capability tomodel also strongly nonlinear decision boundaries. Anotherimportant issue to note is that both SVM and GML-LOOC donot seem significantly affected by the Hughes phenomenon,since the classification accuracies increase with the increaseof the number of features. In the case of k-NN, the kappaaccuracies for all the experiments were much smaller than thoseobtained by the other classifiers. This confirms that k-NN isnot able to manage hyperdimensional feature spaces. This isparticularly true when classes with very few training samplesare considered. The small kappa accuracies also illustrate theimportance of using specific classifiers that exhibit a highgeneralization ability.
Let us now analyze the effect of the first LIDAR returnchannels on the classification accuracy. Table III shows the
TABLE IIIKAPPA ACCURACIES OBTAINED ON THE TEST SET WITH DIFFERENT
SPECTRAL AND LIDAR FEATURES AND CLASSIFIERS
accuracies obtained adding to different spectral feature subsetsthe elevation and intensity channels of the first LIDAR return.Comparing the results in Tables II and III reveals an increase inkappa accuracy from 1% to 4%, which is less relevant for theSVM and GML-LOOC classifiers and more significant for thek-NN technique (which, however, does not obtain acceptableaccuracies). From these results, it seems that LIDAR chan-nels provide relatively sparse information for discriminatingbetween tree species. However, if we analyze the class-by-classaccuracies, with and without LIDAR channels, the conclusionsare quite different. Table IV shows class-by-class accuraciesobtained with the SVM classifier, adding the two LIDARchannels to different spectral band subsets (25 and 40). Fromthe analysis of the table, we observe that, in general, very highaccuracies were reached for very similar tree species, includingQuercus cerris, Quercus robur, and Quercus rubra. Concerningthe role of LIDAR channels, we have different classificationbehaviors varying the number of spectral bands used. When40 bands were used, an increase in the classification accuracyoccurs for classes characterized by a low height. In particular,for four of the classes, the increment was higher than 5%. Theincrease in the classification accuracy becomes more relevantwhen reducing the number of hyperspectral bands used. With25 hyperspectral channels, the accuracy increased by morethan 10% for two classes and more than 5% for seven classes.For example, Acer negundo increased in accuracy by 13.56%,adding LIDAR bands to 25 hyperspectral channels. Analyzingthe confusion matrices, this class increases its separability withrespect to Carpinus betulus, Platanus hybrida, and Quercusrobur (which are characterized by a very different mean heightwith respect to Acer negundo). It is possible to draw similarconclusions also for others classes that have relevant increasein the classification accuracy. It is worth noting that the classesthat significantly increase their accuracy by introducing LIDARfeatures are the underrepresented classes. This is the motivationfor the relatively small impact of this improvement on theoverall classification accuracy.
The Zeta test [57] was computed between kappa accuraciesobtained with 40 hyperspectral bands, with and without LIDARchannels, using SVM and GML-LOOC classifiers. All thedifferences in accuracy were statistically significant at 95% ofthe confidence interval.
Authorized licensed use limited to: UNIVERSITA TRENTO. Downloaded on February 17, 2009 at 05:53 from IEEE Xplore. Restrictions apply.

1424 IEEE TRANSACTIONS ON GEOSCIENCE AND REMOTE SENSING, VOL. 46, NO. 5, MAY 2008
TABLE IVCLASS-BY-CLASS ACCURACY OBTAINED BY THE SVM CLASSIFIER WITH LIDAR AND
WITHOUT LIDAR WITH A DIFFERENT NUMBER OF HYPERSPECTRAL CHANNELS
From these results, it is possible to conclude that the firstLIDAR return can be very useful in the discrimination of spe-cific tree species. In addition, if LIDAR channels are available,it is convenient to use a reduced number of spectral channelsand to add to these channels the LIDAR information. In thisperspective, on the one hand, the LIDAR channels compensatethe minor lost of information due to the reduced number ofspectral channels; on the other hand, the resulting smallernumber of features allows both a reduction of computationtime and an increase in the generalization capability of thesystem.
C. Experiment 2: Detailed Analysis of the ComplementaryInformation Contained in LIDAR Returns
In the first part of this experiment, we considered 40 hyper-spectral bands and the two channels of the first LIDAR return.From the results of the previous experiment, it is clear that thesechannels are useful in classification of complex forest areas,particularly for discriminating between specific tree species.The next step is to understand the amount of informationpresent in each channel (i.e., elevation and intensity).
Table V presents the kappa accuracies obtained with theSVM, with: 1) 40 hyperspectral bands; 2) 40 hyperspectralbands plus elevation and intensity of the first LIDAR return;3) 40 hyperspectral bands plus elevation of the first LIDARreturn; and 4) 40 hyperspectral bands plus intensity of the firstLIDAR return. As it is clear from the table, the increase in theclassification accuracy obtained with LIDAR data is mainlydue to the elevation channel, whereas the intensity channeldoes not give any relevant information for the classificationof the considered forest area (it slightly decreases the overallkappa accuracy).
TABLE VKAPPA ACCURACIES OBTAINED WITH SVM VARYING THE
FIRST LIDAR RETURN CHANNELS USED
TABLE VIKAPPA ACCURACIES OBTAINED WITH SVM VARYING THE
NUMBER OF LIDAR RETURNS JOINTLY USED WITH
THE 40 HYPERSPECTRAL FEATURES SELECTED
The second part of this experiment was focused on multipleLIDAR returns available in the data set used for this paper.To analyze the information contained in these channels for theclassification process, we carried out a series of trials incremen-tally adding the first, the second, the third, and the fourth returnchannels (elevation and intensity) to the 40 hyperspectral bands.
Table VI shows the overall kappa accuracies obtained inthese trials. From these results, it seems that returns differentfrom the first do not increase kappa accuracy. On the contrary,they result in a slight decrease of the accuracy with respect to
Authorized licensed use limited to: UNIVERSITA TRENTO. Downloaded on February 17, 2009 at 05:53 from IEEE Xplore. Restrictions apply.

DALPONTE et al.: FUSION OF HYPERSPECTRAL AND LIDAR REMOTE SENSING DATA 1425
TABLE VIIKAPPA ACCURACIES OBTAINED ON TEST SET WITH DIFFERENT
CLASSIFIERS USING DISJOINT TRAINING AND TEST SETS
that yielded using hyperspectral features plus the first LIDARreturn channels. These results depend on the properties ofavailable multiple LIDAR returns. As described in Section II,the number of pulses is different for each return, and, in partic-ular, it decreases by increasing the return number. This can beexplained by the fact that the analyzed area is characterized by avery dense tree crown coverage that precludes the generation ofsecondary returns in many portions of the scene. For this reason,during the rasterization phase of the LIDAR data, not all thepixels were associated with a value. In particular, for returns 3and 4, we have many pixels with no data points. This introducesa noise in the classification process, thus, balancing possibleadvantages in the characterization of the canopy of differentspecies. In general, we expect that this issue should be betterinvestigated using data with a higher number of representativesamples from multiple returns.
D. Experiment 3: Generalization Capability of the System
As described in Section V-A, with this last experiment, wesimulate a borderline case, in which training and test samplesare as disjoined as possible. This allows us to verify thebehavior of the proposed system when test samples belong toa significantly different area from the one considered for thetraining of the system. It is worth noting that, in this specificcase, we have some classes with a reduced number of groundtruth samples; this means that only few (three or four) treesin the whole scene were available for these classes. Thus, theexclusive assignment of a tree to the training or the test setmakes ground truth for minority classes unrepresentative of thevariability of the spectral signature over the scene, resulting ina very difficult classification problem.
In Table VII, one can see that the kappa accuracies decreasewith respect to the previous experiments for all the threeclassifiers considered. On the contrary, the differences inaccuracies between the two subsets of features (with andwithout LIDAR) remain almost the same. The kappa accuracyof SVM was still significantly higher than those provided byother classifiers (i.e., 0.717 versus 0.658 and 0.484), but therewas a large decrease with respect to those yielded in previousexperiments. In addition, the GML-LOOC significantlydecreased the kappa accuracy. However, as expected, the morerelevant degradation was associated with the k-NN classifier,that resulted in a kappa accuracy lower than 50%. Analyzingthe SVM class-by-class accuracies, we observed that for somedominant classes, including Carpinus betulus, Juglans regia,Platanus hypbrida, and Quercus rubra, the accuracies are stillon the order of 85%–90% (88.41%, 87.43%, 84.35%, and
93.47%, respectively), whereas, for the minority classes, wehave a dramatic decrease of accuracies. For example, for Acercampestris, Populus hybrida, Prunus avium, and Ulmus minor,the accuracies were lower than 50% (42.86%, 30.56%, 32.39%,and 24.31%, respectively). These results were expected in thisvery critical scenario (see [58]) that should be addressed byusing semisupervised classification techniques (like semisuper-vised SVM [59]) particularly developed for strongly ill-posedproblems.
The differences in kappa accuracy between trials with andwithout LIDAR channels, with SVM and GML-LOOC classi-fiers, were also tested with the Z-test [57]. All the differencesresulted to be statistically significant at 95% of the confidenceinterval.
VI. CONCLUSION
In this paper, we investigated the joint use of hyperspectraland LIDAR remote sensing data for the classification of com-plex forest areas. We analyzed this issue by proposing a novelclassification system, based on different possible classifiers thatwere able to properly integrate multisensor information. Froman analysis of the results of all the experiments carried outusing the proposed system, we can conclude that, in general,it provided high accuracies, managing in an effective waythe complementary information contained in hyperspectral andLIDAR data. In greater detail, we verified the following.
1) The presented system is very effective for classifyinghyperspectral and LIDAR data, providing high accuracyon almost all the considered forest classes (it yieldedaccuracies of over 90% for certain classes).
2) The distribution-free SVM classifier provided muchhigher accuracies than the other classifiers investigated.The parametric GML-LOOC, even if less effective thanSVM, yielded acceptable accuracies, whereas the k-NNtechnique (used for comparison) was unsuitable for thesolution of hyperdimensional problems.
3) The elevation channel of the first LIDAR return dataplayed the most important role for increasing the discrim-inability (and, thus, the accuracy) of the forest classes byhaving similar spectral signatures. This was due to thedifferent average elevation of some forest classes.
4) LIDAR returns that are different from the first return donot seem capable of improving the kappa accuracy whenused jointly with hyperspectral channels. However, thisissue should be better analyzed on other data sets byconsidering a more complex feature extraction phase.
5) In critical cases, with a large difference between trainingand test samples, the system based on the SVM classifiershould provide an acceptable accuracy. However, in thisextreme case, the performances were degraded signifi-cantly, and it is recommended to use specific classifica-tion techniques developed for ill-posed problems (e.g.,semisupervised [59]).
As a final remark, it is important to observe that the proposedsystem and study seem particularly relevant when consideringthat, in several forest areas, both hyperspectral and LIDAR dataare acquired for species classification and parameter estimation,respectively. In these situations, it is important to properly
Authorized licensed use limited to: UNIVERSITA TRENTO. Downloaded on February 17, 2009 at 05:53 from IEEE Xplore. Restrictions apply.

1426 IEEE TRANSACTIONS ON GEOSCIENCE AND REMOTE SENSING, VOL. 46, NO. 5, MAY 2008
integrate LIDAR data in the classification process because:1) the use of hyperspectral and LIDAR data increases theseparability of tree species having similar spectral signaturesbut different height and 2) the introduction of the first LIDARreturn elevation channel produces, with a limited number ofspectral features, accuracies similar to those yielded with asignificantly higher number of features. This results in a lowercomputational time and in an increase of the generalizationcapability of the system.
In terms of future developments of this paper, we are plan-ning to: 1) introduce, in the classification phase, semisupervisedclassifiers to increase the generalization ability of the systemand improve the modeling of the nonstationarity of the spectralsignatures of classes in the scene [58] and 2) jointly exploithyperspectral images and LIDAR data for the estimation ofbiophysical forest parameters (e.g., biomass and structure).
ACKNOWLEDGMENT
The authors would like to thank Dr. F. Mason (CentroNazionale per lo Studio e la Conservazione della BiodiversitàForestale—Bosco della Fontana—Verona) for providing thehyperspectral and LIDAR data used in this paper.
REFERENCES
[1] A. A. Abuelgasim, R. A. Fernandes, and S. G. Leblanc, “Evaluation ofnational and global LAI products derived from optical remote sensinginstruments over Canada,” IEEE Trans. Geosci. Remote Sens., vol. 44,no. 7, pp. 1872–1884, Jul. 2006.
[2] F. Maselli and M. Chiesi, “Evaluation of statistical methods to estimateforest volume in a Mediterranean region,” IEEE Trans. Geosci. RemoteSens., vol. 44, no. 8, pp. 2239–2250, Aug. 2006.
[3] A. Baraldi, V. Puzzolo, P. Blonda, L. Bruzzone, and C. Tarantino, “Auto-matic spectral rule-based preliminary mapping of calibrated Landsat TMand ETM+ images,” IEEE Trans. Geosci. Remote Sens., vol. 44, no. 9,pp. 2563–2586, Sep. 2006.
[4] C. Song, T. A. Schroeder, and W. B. Cohen, “Predicting temperate coniferforest successional stage distributions with multitemporal Landsat The-matic Mapper imagery,” Remote Sens. Environ., vol. 106, no. 2, pp. 228–237, Jan. 2007.
[5] F. Sedano, P. Gong, and M. Ferrao, “Land cover assessment with MODISimagery in southern African Miombo ecosystems,” Remote Sens. Envi-ron., vol. 98, no. 4, pp. 429–441, Oct. 2005.
[6] D. G. Goodenough, A. Dyk, K. O. Niemann, J. S. Pearlman, H. Chen,T. Han, M. Murdoch, and C. West, “Processing Hyperion and ALI forforest classification,” IEEE Trans. Geosci. Remote Sens., vol. 41, no. 6,pp. 1321–1331, Jun. 2003.
[7] N. Kosaka, T. Akiyama, B. Tsai, and T. Kojima, “Forest type classi-fication using data fusion of multispectral and panchromatic high-resolution satellite imageries,” in Proc. IGARSS, Jul. 25–29, 2005, vol. 4,pp. 2980–2983.
[8] L. Wang, W. P. Sousa, P. Gong, and G. S. Biging, “Comparison ofIKONOS and QuickBird images for mapping mangrove species on theCaribbean coast of Panama,” Remote Sens. Environ., vol. 91, no. 3/4,pp. 432–440, Jun. 2004.
[9] D. M. Gates, H. J. Keegan, J. C. Schleter, and V. R. Weidner, “Spectralproperties of plants,” Appl. Opt., vol. 4, no. 1, pp. 11–20, Jan. 1965.
[10] E. B. Knipling, “Physical and physiological basis for the reflectance ofvisible and near-infrared radiation from vegetation,” Remote Sens. Envi-ron., vol. 1, no. 3, pp. 155–159, 1970.
[11] P. J. Zarco-Tejadaa, J. R. Millera, J. Harrona, B. Hub, T. L. Noland,N. Goele, G. H. Mohammed, and P. Sampson, “Needle chlorophyll con-tent estimation through model inversion using hyperspectral data fromboreal conifer forest canopies,” Remote Sens. Environ., vol. 89, no. 2,pp. 189–199, Jan. 2004.
[12] M. E. Martin, S. D. Newman, J. D. Aber, and R. G. Congalton, “De-termining forest species composition using high spectral resolution re-mote sensing data,” Remote Sens. Environ., vol. 65, no. 3, pp. 249–254,Sep. 1998.
[13] M. L. Clark, D. A. Roberts, and D. B. Clark, “Hyperspectral discrimina-tion of tropical rain forest tree species at leaf to crown scales,” RemoteSens. Environ., vol. 96, no. 3/4, pp. 375–398, Jun. 2005.
[14] D. G. Leckie, S. Tinis, T. Nelson, C. Burnett, F. A. Gougeon,E. Cloney, and D. Paradine, “Issues in species classification of trees inold growth conifer stands,” Can. J. Remote Sens., vol. 31, no. 2, pp. 175–190, 2005.
[15] M. Watanabe, M. Shimada, A. Rosenqvist, T. Tadono, M. Matsuoka,S. A. Romshoo, K. Ohta, R. Furuta, K. Nakamura, and T. Moriyama,“Forest structure dependency of the relation between L-band σ and bio-physical parameters,” IEEE Trans. Geosci. Remote Sens., vol. 44, no. 11,pp. 3154–3165, Nov. 2006.
[16] S. Saatchi, K. Halligan, D. G. Despain, and R. L. Crabtree, “Estimation offorest fuel load from radar remote sensing,” IEEE Trans. Geosci. RemoteSens., vol. 45, no. 6, pp. 1726–1740, Jun. 2007.
[17] H. Balzter, L. Skinner, A. Luckman, and R. Brooke, “Estimation of treegrowth in a conifer plantation over 19 years from multi-satellite L-bandSAR,” Remote Sens. Environ., vol. 84, no. 2, pp. 184–191, Feb. 2003.
[18] L. Bruzzone, M. Marconcini, U. Wegmuller, and A. Wiesmann, “Anadvanced system for the automatic classification of multitemporal SARimages,” IEEE Trans. Geosci. Remote Sens., vol. 42, no. 6, pp. 1321–1334, Jun. 2004.
[19] J. S. Lee, K. P. Papathanassiou, I. Hajnsek, T. Mette, M. R. Grunes,T. Ainsworth, and L. Ferro-Famil, “Applying polarimetric SAR interfero-metric data for forest classification,” in Proc. IGARSS, Jul. 25–29, 2005,vol. 7, pp. 4848–4851.
[20] K. J. Ranson, G. Sun, V. I. Kharuk, and K. Kovacs, “Characterizationof forests in Western Sayani mountains, Siberia from SIR-C SAR data,”Remote Sens. Environ., vol. 75, no. 2, pp. 188–200, Feb. 2001.
[21] S. S. Saatchi and E. Rignot, “Classification of boreal forest cover typesusing SAR images,” Remote Sens. Environ., vol. 60, no. 3, pp. 270–281,Jun. 1997.
[22] M. Maltamoa, K. Eerikaeinen, J. Pitkaenen, J. Hyyppae, and M. Vehmas,“Estimation of timber volume and stem density based on scanning laseraltimetry and expected tree size distribution functions,” Remote Sens.Environ., vol. 90, no. 3, pp. 319–330, Apr. 2004.
[23] B. Koetz, F. Morsdorf, G. Sun, K. J. Ranson, K. Itten, and B. Allgöwer,“Inversion of a LIDAR waveform model for forest biophysical parameterestimation,” IEEE Geosci. Remote Sens. Lett., vol. 3, no. 1, pp. 49–53,Jan. 2006.
[24] N. Skowronski, K. Clark, R. Nelson, J. Hom, and M. Patterson, “Remotelysensed measurements of forest structure and fuel loads in the pinelandsof New Jersey,” Remote Sens. Environ., vol. 108, no. 2, pp. 123–129,May 2007.
[25] H. E. Andersen, R. J. McGaughey, and S. E. Reutebuch, “Estimatingforest canopy fuel parameters using LIDAR data,” Remote Sens. Environ.,vol. 94, no. 4, pp. 441–449, Feb. 2005.
[26] R. Brennan and T. L. Webster, “Object-oriented land cover classificationof LIDAR-derived surfaces,” Can. J. Remote Sens., vol. 32, no. 2, pp. 162–172, 2006.
[27] A. P. Charaniya, R. Manduchi, and S. K. Lodha, “Supervised parametricclassification of aerial LiDAR data,” in Proc. IEEE Comput. Soc. Conf.CVPRW, 2004, p. 30.
[28] J. Holmgren and Å. Persson, “Identifying species of individual trees usingairborne laser scanner,” Remote Sens. Environ., vol. 90, no. 4, pp. 415–423, Apr. 2004.
[29] M. Moghaddam, J. L. Dungan, and S. Acker, “Forest variable estimationfrom fusion of SAR and multispectral optical data,” IEEE Trans. Geosci.Remote Sens., vol. 40, no. 10, pp. 2176–2187, Oct. 2002.
[30] R. M. Lucas, N. Cronin, M. Moghaddam, A. Lee, J. Armston, P. Bunting,and C. Witte, “Integration of radar and Landsat-derived foliage projectedcover for woody regrowth mapping, Queensland, Australia,” Remote Sens.Environ., vol. 100, no. 3, pp. 388–406, Feb. 2006.
[31] A. T. Hudak, M. A. Lefsky, W. B. Cohen, and M. Berterretche, “Integra-tion of LIDAR and Landsat ETM+ data for estimating and mapping forestcanopy height,” Remote Sens. Environ., vol. 82, no. 2/3, pp. 397–416,Oct. 2002.
[32] G. A. Blackburn, “Remote sensing of forest pigments using airborneimaging spectrometer and LIDAR imagery,” Remote Sens. Environ.,vol. 82, no. 2/3, pp. 311–321, Oct. 2002.
[33] P. Hyde, R. Nelson, D. Kimes, and E. Levine, “Exploring LiDAR–RaDARsynergy—Predicting aboveground biomass in a southwestern ponderosapine forest using LiDAR, SAR and InSAR,” Remote Sens. Environ.,vol. 106, no. 1, pp. 28–38, Jan. 2007.
[34] P. Hyde, R. Dubayah, W. Walker, J. B. Blair, M. Hofton, and C. Hunsaker,“Mapping forest structure for wildlife habitat analysis using multi-sensor(LiDAR, SAR/InSAR, ETM+, Quickbird) synergy,” Remote Sens. Envi-ron., vol. 102, no. 1/2, pp. 63–73, May 2006.
Authorized licensed use limited to: UNIVERSITA TRENTO. Downloaded on February 17, 2009 at 05:53 from IEEE Xplore. Restrictions apply.

DALPONTE et al.: FUSION OF HYPERSPECTRAL AND LIDAR REMOTE SENSING DATA 1427
[35] E. Simental, D. J. Ragsdale, E. Bosch, R. Dodge, Jr., and R. Pazak,“Hyperspectral dimension reduction and elevation data for supervisedimage classification,” in Proc. 14th ASPRS Conf., Anchorage, AK,May 3–9, 2003.
[36] D. Lemp and U. Weidner, “Improvements of roof surface classi-fication using hyperspectral and laser scanning data,” in Proc. ISPRSJoint Conf.: 3rd Int. Symp. Remote Sens. Data Fusion Over Urban Areas(URBAN), 5th Int. Symp. Remote Sens. Urban Areas (URS), Tempe, AZ,Mar. 14–16, 2005.
[37] J. T. Mundt, D. R. Streutker, and N. F. Glenn, “Mapping sage-brush distribution using fusion of hyperspectral and LIDAR classifi-cations,” Photogramm. Eng. Remote Sens., vol. 72, no. 1, pp. 47–54,Jan. 2006.
[38] R. Sugumaran and M. Voss, “Object-oriented classification of LIDAR-fused hyperspectral imagery for tree species identification in an urbanenvironment,” in Proc. Urban Remote Sens. Joint Event, Paris, France,Apr. 11–13, 2007, pp. 1–6.
[39] E. M. Perry, H. P. Foote, G. M. Petrie, K. L. Steinmaus, D. E. Irwin, andA. J. Stephan, “Exploitation of hyperspectral imagery and Lidarfor landuse classification,” in Proc. IGARSS, Seattle, WA, 1998, pp. 1013–1015.
[40] D. Yuan and C. D. Elvidge, “Comparison of relative radiometric normal-ization techniques,” ISPRS J. Photogramm. Remote Sens., vol. 51, no. 3,pp. 117–126, Jun. 1996.
[41] Y. Du, J. Cihlar, J. Beaubien, and R. Latifovic, “Radiometric normaliza-tion, compositing, and quality control for satellite high resolution imagemosaics over large areas,” IEEE Trans. Geosci. Remote Sens., vol. 39,no. 3, pp. 623–634, Mar. 2001.
[42] P. Hsieh and D. Landgrebe, “Lowpass filter for increasing class separa-bility,” in Proc. IGARSS, 1998, pp. 2691–2693.
[43] J. A. Richards and X. Jia, Remote Sensing Digital Image Analysis. NewYork: Springer-Verlag, 1999.
[44] G. F. Hughes, “On the mean accuracy of statistical pattern recognizers,”IEEE Trans. Inf. Theory, vol. IT-14, no. 1, pp. 55–63, Jan. 1968.
[45] P. Pudil, J. Novovicova, and J. Kittler, “Floating search methods in fea-ture selection,” Pattern Recognit. Lett., vol. 15, no. 11, pp. 1119–1125,Nov. 1994.
[46] S. B. Serpico and L. Bruzzone, “A new search algorithm for featureselection in hyperspectral remote sensing images,” IEEE Trans. Geosci.Remote Sens., vol. 39, no. 7, pp. 1360–1367, Jul. 2001.
[47] L. Bruzzone, F. Roli, and S. B. Serpico, “An extension of theJeffreys–Matusita distance to multiclass cases for feature selection,”IEEE Trans. Geosci. Remote Sens., vol. 33, no. 6, pp. 1318–1321,Nov. 1995.
[48] J. P. Hoffbeck and D. A. Landgrebe, “Covariance matrix estimation andclassification with limited training data,” IEEE Trans. Pattern Anal. Mach.Intell., vol. 18, no. 7, pp. 763–767, Jul. 1996.
[49] G. Camps-Valls and L. Bruzzone, “Kernel-based methods for hyperspec-tral image classification,” IEEE Trans. Geosci. Remote Sens., vol. 43,no. 6, pp. 1351–1362, Jun. 2005.
[50] F. Melgani and L. Bruzzone, “Classification of hyperspectral remote sens-ing images with support vector machines,” IEEE Trans. Geosci. RemoteSens., vol. 42, no. 8, pp. 1778–1790, Aug. 2004.
[51] J. H. Friedman, “Regularized discriminant analysis,” J. Amer. Stat. Assoc.,vol. 84, no. 405, pp. 165–175, Mar. 1989.
[52] S. Marks and O. J. Dunn, “Discriminant functions when the covariancematrices are unequal,” J. Amer. Stat. Assoc., vol. 69, no. 346, pp. 555–559, Jun. 1974.
[53] S. P. Lin and M. D. Perlman, “A Monte Carlo comparison of four estima-tors of a covariance matrix,” in Proc. 6th Int. Symp. Multivariate Anal.,1985, pp. 411–429.
[54] P. W. Wahl and R. A. Kronmall, “Discriminant functions when covari-ances are unequal and sample sizes are moderate,” Biometrics, vol. 33,no. 3, pp. 479–484, Sep. 1977.
[55] L. Biehl. (2001). An Introduction to MultiSpec, West Lafayette, IN:School Electr. Comput. Eng., Purdue Univ. [Online]. Available: http://cobweb.ecn.purdue.edu/~biehl/MultiSpec/
[56] V. N. Vapnik, Statistical Learning Theory. Hoboken, NJ: Wiley, 1998.[57] R. G. Congalton and K. Green, Assessing the Accuracy of Remotely
Sensed Data: Principles and Practices. Boca Raton, FL: CRC Press,1999.
[58] M. Chi and L. Bruzzone, “Semisupervised classification of hyperspectralimages by SVMs optimized in the primal,” IEEE Trans. Geosci. RemoteSens., vol. 45, pt. 2, no. 6, pp. 1870–1880, Jun. 2007.
[59] L. Bruzzone, M. Chi, and M. Marconcini, Semisupervised Support VectorMachines for Classification of Hyperspectral Remote Sensing Images.Hyperspectral Data Exploitation Theory and Applications. New York:Wiley-Interscience, 2007, pp. 275–311.
Michele Dalponte (S’07) received the M.S. degreein telecommunications engineering from the Univer-sity of Trento, Trento, Italy, in 2006, where he iscurrently working toward the Ph.D. degree.
He is with the Remote Sensing Laboratory, De-partment of Information and Communication Tech-nology, University of Trento, and also with theCentro di Ecologia Alpina, Trento. His researchinterests include the field of remote sensing andpattern recognition, in particular on the analysis ofhyperspectral and LIDAR data for forest monitoring.
Lorenzo Bruzzone (S’95–M’98–SM’03) receivedthe M.S. degree (summa cum laude) in electronicengineering and the Ph.D. degree in telecommuni-cations from the University of Genoa, Genoa, Italy,in 1993 and 1998, respectively.
From 1998 to 2000, he was a Postdoctoral Re-searcher with the University of Genoa. In 2000, hejoined the University of Trento, Trento, Italy, wherehe is currently a Full Professor of telecommunica-tions and the Head of the Remote Sensing Labora-tory, Department of Information and Communication
Technology. He teaches remote sensing, pattern recognition, and electricalcommunications. He is an evaluator of project proposals for many differentgovernments (including European Commission) and scientific organizations.He is the author or coauthor of 60 scientific publications in referred in-ternational journals, more than 120 papers in conference proceedings, and7 book chapters. He is a referee for many international journals and has servedon the scientific committees of several international conferences. His currentresearch interests include the area of remote-sensing image processing andrecognition (analysis of multitemporal data, feature selection, classification,regression and estimation, data fusion, and machine learning). He conducts andsupervises research on these topics within the frameworks of several nationaland international projects.
Dr. Bruzzone ranked first place in the Student Prize Paper Competition of the1998 IEEE International Geoscience and Remote Sensing Symposium (Seattle,July 1998). He was a recipient of Recognition of IEEE TRANSACTIONS ON
GEOSCIENCE AND REMOTE SENSING Best Reviewers in 1999. He was a GuestEditor of a special issue of the IEEE TRANSACTIONS ON GEOSCIENCE AND
REMOTE SENSING on the subject of the analysis of multitemporal remote-sensing images (November 2003). He was the General Chair and a Cochairof the First and Second IEEE International Workshop on the Analysis of Multi-temporal Remote-Sensing Images (MultiTemp), and is currently a member ofthe Permanent Steering Committee of this series of workshops. Since 2003, hehas been the Chair of the SPIE Conference on Image and Signal Processingfor Remote Sensing. From 2004 to 2006, he was an Associate Editor of theIEEE GEOSCIENCE AND REMOTE SENSING LETTERS. He is currently anAssociate Editor of the IEEE TRANSACTIONS ON GEOSCIENCE AND REMOTE
SENSING. He is a member of the Scientific Committee of the India–Italy Centerfor Advanced Research. He is also a member of the International Associationfor Pattern Recognition and the Italian Association for Remote Sensing.
Damiano Gianelle received the M.S. degree in for-est sciences and the Ph.D. degree in environmentalagronomy from the University of Padua, Padua, Italy,in 1993 and 1997, respectively.
In 1997, he joined the Centro di Ecologia Alpina,Trento, Italy, where he is currently a Scientific Coor-dinator. He taught some university courses for M.Sc.(Veterinary Faculty, Padova) and some postgraduatecourses (Veterinary Faculty, Milano) for two years.He supervised many graduate thesis and Ph.D. workson remote sensing and modeling. He is currently
the coordinator for the institution of the UE projects Carboeurope-IP andNitroeurope-IP and of the national project Carboitaly. He is the author orcoauthor of 10 scientific publications in referred international journals, morethan 20 papers in conference proceedings, and 2 book chapters. He is a refereefor the International Journal of Remote Sensing. His research interests includeremote sensing, eddy covariance, carbon balance, ecophysiology, and forestresources inventory. He conducts and supervises research on these topics withinthe frameworks of several national and international projects.
Authorized licensed use limited to: UNIVERSITA TRENTO. Downloaded on February 17, 2009 at 05:53 from IEEE Xplore. Restrictions apply.