future demand for new c developing countries: going beyond...
TRANSCRIPT

UMTRI-2008-47 SEPTEMBER 2008
FUTURE DEMAND FOR NEW CARS IN
DEVELOPING COUNTRIES: GOING BEYOND
GDP AND POPULATION SIZE
MICHAEL SIVAK
OMER TSIMHONI
FUTURE DEMAND FOR NEW CARS IN DEVELOPING COUNTRIES: GOING BEYOND GDP AND POPULATION SIZE
Michael Sivak Omer Tsimhoni
The University of Michigan Transportation Research Institute
Ann Arbor, Michigan 48109-2150 U.S.A.
Report No. UMTRI-2008-47 September 2008
i
Technical Report Documentation Page
1. Report No.
UMTRI-2008-47 2. Government Accession No.
3. Recipient s Catalog No.
5. Report Date
September 2008 4. Title and Subtitle Future Demand For New Cars in Developing Countries: Going Beyond GDP and Population Size
6. Performing Organization Code
383818
7. Author(s)
Sivak, M. and Tsimhoni, O. 8. Performing Organization Report No.
UMTRI-2008-47
10. Work Unit no. (TRAIS)
9. Performing Organization Name and Address
The University of Michigan Transportation Research Institute 2901 Baxter Road Ann Arbor, MI 48109-2150 U.S.A
11. Contracts or Grant No.
13. Type of Report and Period Covered
12. Sponsoring Agency Name and Address
The University of Michigan Strategic Worldwide Transportation 2020 14. Sponsoring Agency Code
15. Supplementary Notes
The current members of Strategic Worldwide Transportation 2020 include ArvinMeritor, Bendix, Bosch, Continental Automotive Systems, Ford Motor Company, General Motors, Nissan Technical Center North America, and Toyota Motor Engineering and Manufacturing North America. Information about Strategic Worldwide Transportation 2020 is available at: http://www.umich.edu/~umtriswt 16. Abstract
In this study we first modeled the effects of GDP and population size on sales of new cars in 2006 for the following 25 developing countries: Algeria, Argentina, Brazil, China, Chile, Columbia, Egypt, Hungary, India, Indonesia, Iran, Malaysia, Mexico, Pakistan, Peru, Philippines, Poland, Romania, Russia, South Africa, Thailand, Turkey, Ukraine, Venezuela, and Vietnam. The main results are that while both GDP and population have significant effects on sales of new cars, substantial deviations between projected and actual sales still remain. The countries that exceeded the projected sales include Iran, Russia, Brazil, Malaysia, Romania, India, Pakistan, Venezuela, and South Africa. In other words, for these countries, reliance only on GDP and population size underestimates the actual sales. Using the relationship that was derived from the 2006 data, projected future GDPs and populations, and assuming that the deviations from the 2006 model are systematic and will remain proportionally constant in the medium term, illustrative calculations were then made for sales of new cars in 2014 and 2020. According to these calculations, the countries with the greatest absolute increases in projected sales from 2006 to both 2014 and 2020 are likely to be China, India, Russia, Brazil, Iran, Malaysia, Mexico, Pakistan, South Africa, and Turkey. 17. Key Words
cars, sales, developing countries, GDP, population 18. Distribution Statement
Unlimited
19. Security Classification (of this report)
None 20. Security Classification (of this page)
None 21. No. of Pages
14 22. Price
ii
Acknowledgments
This research was supported by Strategic Worldwide Transportation 2020
(http://www.umich.edu/~umtriswt). The current members of this research consortium are
ArvinMeritor, Bendix, Bosch, Continental Automotive Systems, Ford Motor Company,
General Motors, Nissan Technical Center North America, and Toyota Motor Engineering
and Manufacturing North America.
iii
Contents
Acknowledgments....................................................................................................... ii
Introduction................................................................................................................... 1
Method.......................................................................................................................... 2
Results .......................................................................................................................... 4
Discussion..................................................................................................................... 9
Summary....................................................................................................................... 10
References..................................................................................................................... 11
1
Introduction
Two fundamental variables that influence the demand for personal vehicles in a
country are the size and wealth of the population. Larger countries, with all other factors
being equal, have greater sales of new cars than smaller countries. Analogously, richer
countries, with all other factors being equal, have greater sales than poorer countries.
This report is designed to evaluate how well these two variables predict the current sales
of new cars in 25 developing countries. Of interest are both the fit of a predictive model
using these two variables as well as the deviations from the model. The deviations are
then used as corrective factors that planners could utilize (in addition to projected future
size and wealth of the population) in projecting future vehicle demand. Illustrative
calculations for 2014 and 2020 are provided.
2
Method
Countries examined
The following 25 developing countries were analyzed: Algeria, Argentina, Brazil,
China, Chile, Columbia, Egypt, Hungary, India, Indonesia, Iran, Malaysia, Mexico,
Pakistan, Peru, Philippines, Poland, Romania, Russia, South Africa, Thailand, Turkey,
Ukraine, Venezuela, and Vietnam.
The examined 25 countries met the following criteria in 2006: (1) were not among
the 60 high-income countries (World Bank, 2007), and (2) were the next 25 largest
economies in terms of GDP purchasing power parity that had GDP per capita of at least
$2,500 (World Bank, 2007). Thus, we used the same criteria as Grant Thornton in a
recent general examination of emerging markets (Grant Thornton, 2008), except that we
also added the minimum GDP per capita criterion.
The selected countries include the four BRIC countries of Brazil, Russia, India,
and China (Wilson and Purushothaman, 2003), as well as nine out the Next Eleven (N-
11) countries (O’Neill, Wilson, Purushothaman, and Stupnytska, 2005). (The remaining
two Next Eleven countries, Bangladesh and Nigeria, did not meet the minimum GDP per
capita criterion.)
Variables considered
• Sales of new cars in 2006 (Automotive News, 2007).
• Population in 2006 (Grant Thornton, 2008), and projected population in 2014 and
2020 (U.S. Census Bureau, 2008).
• Wealth as measured by GDP purchasing power parity. The 2006 values were from
the World Bank, as cited in Grant Thornton (2008). The 2014 and 2020 values were
derived from the 2006 values by applying the average growth rate forecasted by
Grant Thornton (2008) for 2006 through 2014.
3
Approach
In the first step, we used a multiple regression to model the influences of the
current GDP and population on current sales of new cars. In the second step, the
deviations of the actual sales from projected sales were quantified. In the third step, the
equation derived in the first step using the current values, along with the correction
factors from the second step, were applied to the projected 2014 and 2020 values of GDP
and population to provide illustrative calculations of future sales of new cars.

4
Results
Multiple regression of current sales of new cars on current GDP and population
A multiple regression of the current (2006) sales of new cars on the current (2006)
GDP and population was highly significant, F (2, 22) = 141.3, p < .001, with both
predictor variables being significant in the model. The model accounted for 93% of the
variance in sales of new cars (r2 = .93). The equation of the model is as follows:
sales of new cars = 80980 + (712 * GDP) - (1799 * population) (1)
where GDP is in billions of US$ purchasing power parity and population is in millions.
It is interesting to note in Equation (1) that population has a negative coefficient.
The implication is that for a given value of GDP (country wealth), a larger population
results in smaller car sales. This is the case because in such a situation, GDP per person
(individual wealth) is reduced.
Deviations of the actual sales from the projected sales of new cars
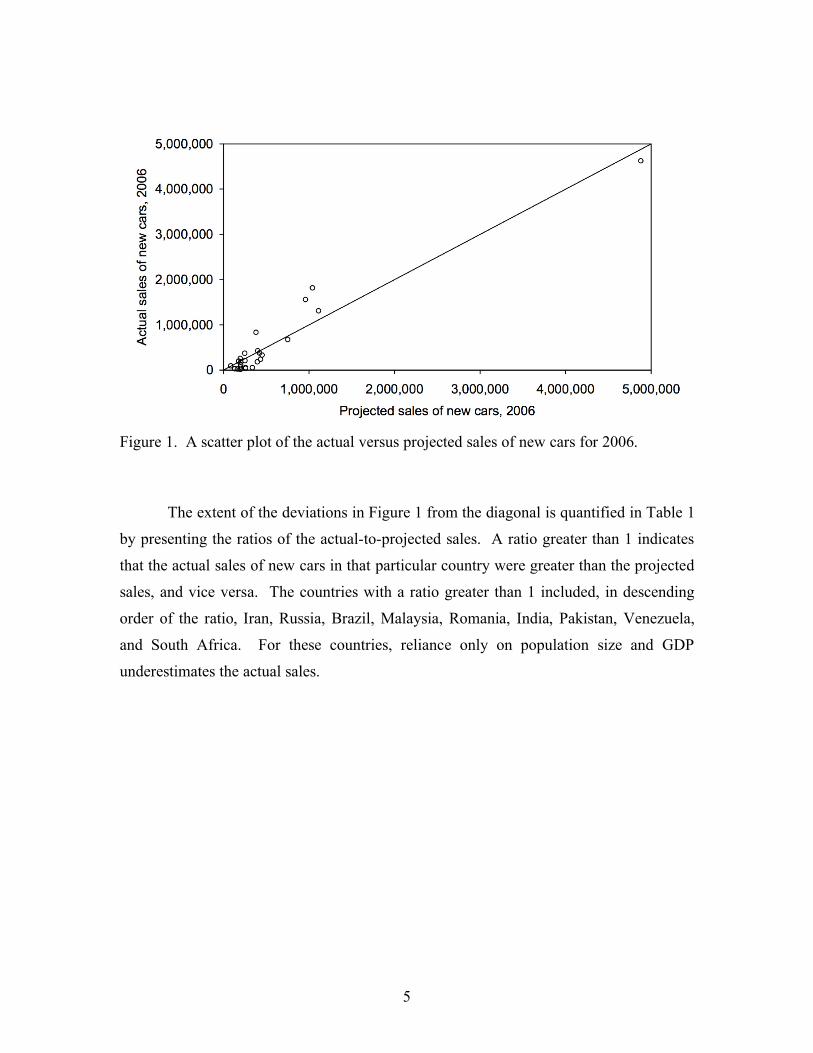
Figure 1 shows a scatter plot of the actual versus projected sales of new cars for
2006. If the actual sales were the same as the projected sales, the points would fall on the
diagonal line.
5
Figure 1. A scatter plot of the actual versus projected sales of new cars for 2006.
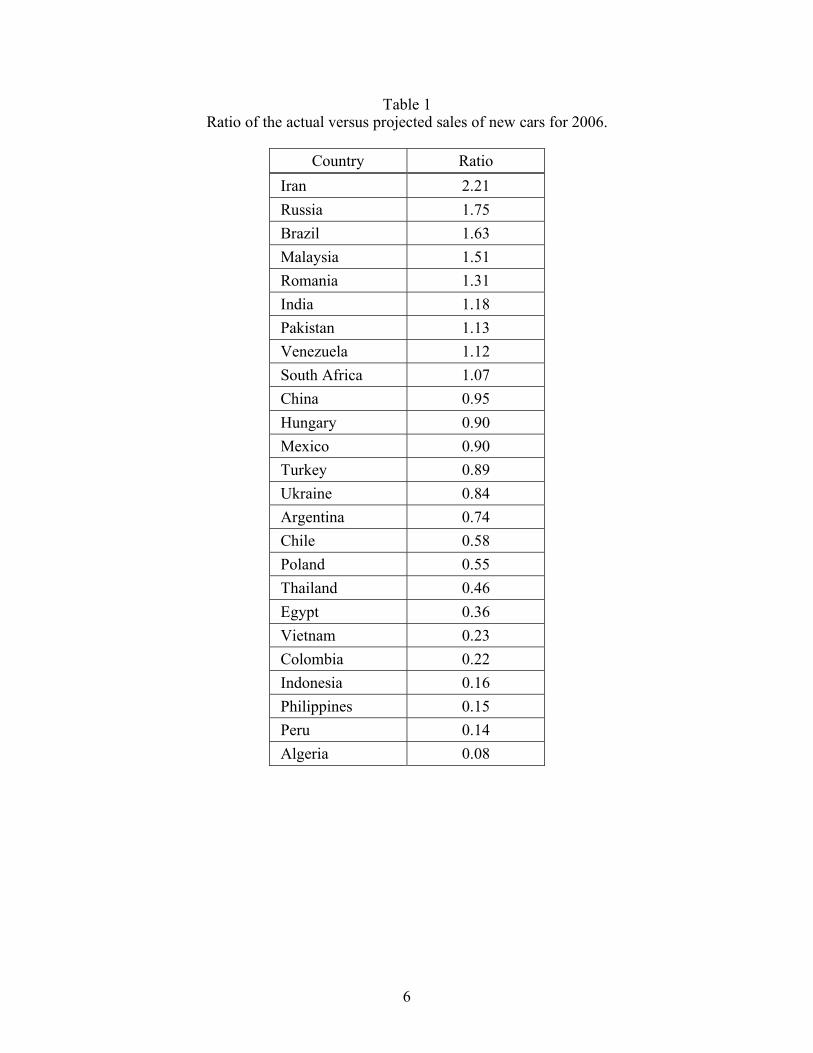
The extent of the deviations in Figure 1 from the diagonal is quantified in Table 1
by presenting the ratios of the actual-to-projected sales. A ratio greater than 1 indicates
that the actual sales of new cars in that particular country were greater than the projected
sales, and vice versa. The countries with a ratio greater than 1 included, in descending
order of the ratio, Iran, Russia, Brazil, Malaysia, Romania, India, Pakistan, Venezuela,
and South Africa. For these countries, reliance only on population size and GDP
underestimates the actual sales.
6
Table 1 Ratio of the actual versus projected sales of new cars for 2006.
Country Ratio
Iran 2.21
Russia 1.75
Brazil 1.63
Malaysia 1.51
Romania 1.31
India 1.18
Pakistan 1.13
Venezuela 1.12
South Africa 1.07
China 0.95
Hungary 0.90
Mexico 0.90
Turkey 0.89
Ukraine 0.84
Argentina 0.74
Chile 0.58
Poland 0.55
Thailand 0.46
Egypt 0.36
Vietnam 0.23
Colombia 0.22
Indonesia 0.16
Philippines 0.15
Peru 0.14
Algeria 0.08
7
The deviations of the ratios in Table 1 from 1 reflect the contributions of factors
other than GDP and population size to the demand for personal vehicles. These factors
(see, for example, Dargay and Gately, 1999) include the cost and availability of gasoline,
availability and cost of public transportation, road density, country geography, income
homogeneity, population-age distribution, population density, etc.
A critical assumption that we made in this study is that the influence of these
factors in a given country will remain relatively stable through 2020. We also made the
assumption that the influence of these factors on future sales of new cars will be
multiplicative. (For example, if in 2006 a country had 120% of the predicted sales, it
would continue through 2020 to have 120% of the value derived from the regression
Equation (1).) Consequently, in the next analysis we used the ratios in Table 1 as
corrections to provide illustrative calculations of 2014 and 2020 sales of new cars based
on projected 2014 and 2020 GDPs and populations.
Illustrative calculations for 2014 and 2020
We used the following information in these calculations:
• GDP projections for 2014 and 2020, derived from the actual 2006 values by applying
the average annual growth rate forecasted by Grant Thornton (2008) for 2006 through
2014.
• Population projections for 2014 and 2020 by the U.S. Census Bureau (2008).
• Equation (1) derived from the 2006 relationship.
• The correction factors from Table 1.
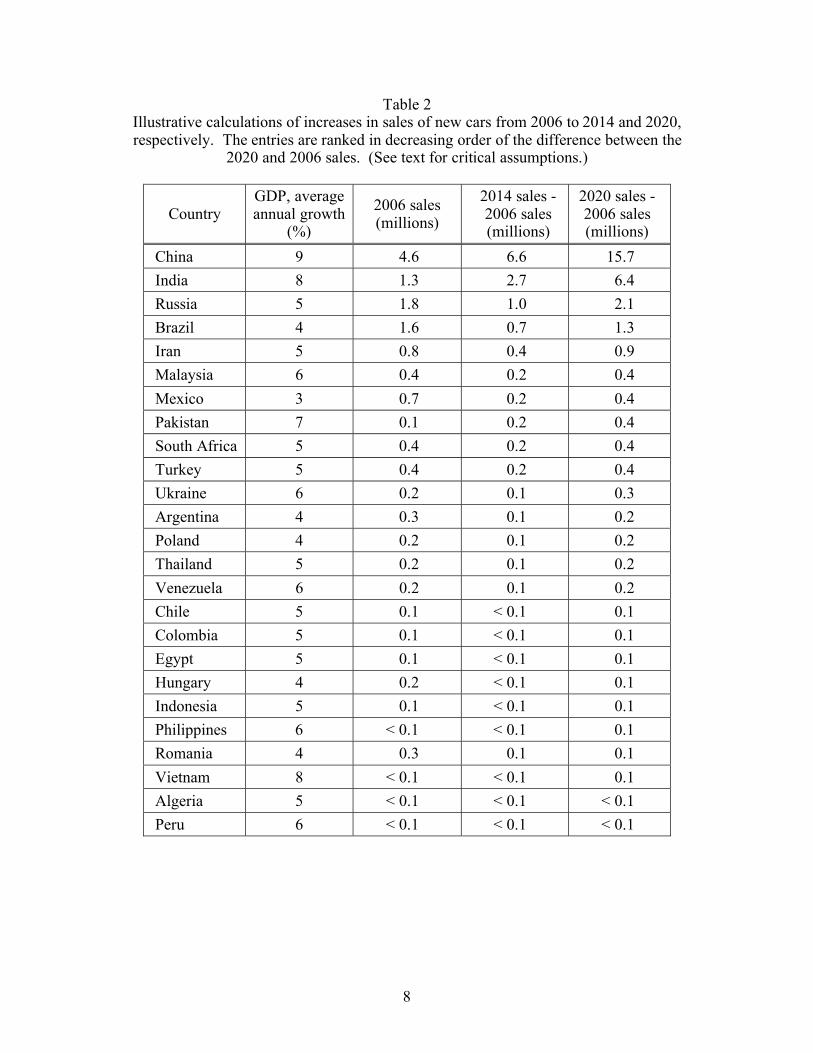
The results for 2014 and 2020 are shown in Table 2 in terms of the calculated
increases in sales of new cars relative to 2006 sales. For both 2014 and 2020, the ten
countries with the greatest absolute increases in sales over 2006 are China, India, Russia,
Brazil, Iran, Malaysia, Mexico, Pakistan, South Africa, and Turkey.
8
Table 2 Illustrative calculations of increases in sales of new cars from 2006 to 2014 and 2020, respectively. The entries are ranked in decreasing order of the difference between the
2020 and 2006 sales. (See text for critical assumptions.)
Country GDP, average annual growth
(%)
2006 sales (millions)
2014 sales - 2006 sales (millions)
2020 sales - 2006 sales (millions)
China 9 4.6 6.6 15.7
India 8 1.3 2.7 6.4
Russia 5 1.8 1.0 2.1
Brazil 4 1.6 0.7 1.3
Iran 5 0.8 0.4 0.9
Malaysia 6 0.4 0.2 0.4
Mexico 3 0.7 0.2 0.4
Pakistan 7 0.1 0.2 0.4
South Africa 5 0.4 0.2 0.4
Turkey 5 0.4 0.2 0.4
Ukraine 6 0.2 0.1 0.3
Argentina 4 0.3 0.1 0.2
Poland 4 0.2 0.1 0.2
Thailand 5 0.2 0.1 0.2
Venezuela 6 0.2 0.1 0.2
Chile 5 0.1 < 0.1 0.1
Colombia 5 0.1 < 0.1 0.1
Egypt 5 0.1 < 0.1 0.1
Hungary 4 0.2 < 0.1 0.1
Indonesia 5 0.1 < 0.1 0.1
Philippines 6 < 0.1 < 0.1 0.1
Romania 4 0.3 0.1 0.1
Vietnam 8 < 0.1 < 0.1 0.1
Algeria 5 < 0.1 < 0.1 < 0.1
Peru 6 < 0.1 < 0.1 < 0.1
9
Discussion
This study was based on the following critical assumptions:
• The deviations of the actual from the projected sales in the 2006 model are reflections
of systematic differences across different countries, and these deviations will remain
proportionally the same throughout the time period examined. Future studies would
need to be performed to address the validity of these two assumptions, especially in
view of the recent upheavals in the oil and financial markets.
• Projected increases in population are valid. It is likely that these U.S. Census
Bureau projections, especially for 2014, are reasonably accurate.
• Projected increases in GDP are valid. The average annual increases in GDP that
were used in the analysis (see Table 2) were projections developed by Grant Thornton
(2008) for a time period from 2006 through 2014. Thus, we extrapolated the Grant
Thornton projections beyond the time frame originally intended. Furthermore, it is
unclear whether major upheavals would influence future growth in GDP in ways not
envisioned in Grant Thornton projections, and whether such upheavals would also
have psychological effects not captured by GDP.
10
Summary
In this study we examined the relationship between both the wealth and size of the
population and sales of new cars in 25 developing countries. The main results are that
while both GDP and population have significant effects on sales of new cars, substantial
deviations between projected and actual sales still remain. The countries that exceeded
the projected sales include Iran, Russia, Brazil, Malaysia, Romania, India, Pakistan,
Venezuela, and South Africa. In other words, for these countries, reliance only on GDP
and population size underestimates the actual sales.
We argued that the deviations of the actual from the projected sales likely reflect
the effects of other factors, such as the cost and availability of gasoline, availability and
cost of public transportation, road density, country geography, income homogeneity,
population-age distribution, and population density. Furthermore, we argued that the
contribution of these factors in the medium term is likely to remain proportionally the
same. Consequently, we used these deviations, along with projected GDP and population
size, to provide illustrative calculations for sales of new cars in 2014 and 2020. The
results indicate that the ten countries with the greatest absolute increases in sales over
2006 are likely to be China, India, Russia, Brazil, Iran, Malaysia, Mexico, Pakistan,
South Africa, and Turkey.
The calculated sales of new cars in this report should be taken with a substantial
grain of salt. Importantly, these are not forecasts, but calculations given certain
assumptions whose validity is uncertain. The user of the calculated values should
evaluate for himself or herself the likelihood that the assumptions will hold for the time
period in question. In other words, this study provides a potentially powerful tool for
planners who are willing and able to independently assess the approach and the
underlying assumptions. Thus, use at your own risk (and rewards).

11
References
Automotive News. (2007, June 25, Supplement). Detroit: Crain Communications.
Dargay, J. and Gately, D. (1999). Income’s effect on car and vehicle ownership
worldwide: 1960-2015. Transportation Research Part A, 33, 101-138.
Grant Thornton. (2008). Emerging markets: Reshaping the global economy
(http://www.internationalbusinessreport.com/files/ibr_2008_emerging_markets_r
eport_final.pdf).
O’Neill, J., Wilson, D., Purushothaman, R., and Stupnytska, A. (2005). How solid are
the BRICs? (Global Economics Paper No. 134). New York: Goldman Sachs.
U.S. Census Bureau. (2008). International data base (IDB)
(http://www.census.gov/ipc/www/idb/ranks.html).
Wilson, D. and Purushothaman, R. (2003). Dreaming with BRICs: The path to 2050
(Global Economics Paper No. 99). New York: Goldman Sachs.
World Bank. (2007). World development indicators 2007 (http://www.worldbank.org).