future economic prosperity - valleyvision.org · governments to collaborate with the brookings ......
TRANSCRIPT

C H A R T I N G a C O U R S E t o
T H E S A C R A M E N T O R E G I O N ’ S
F U T U R E ECO N O M I C P R OS P E R I T Y


CHARTING A
COURSE TO
THE SACRAMENTO
REGION’S FUTURE
ECONOMIC
PROSPERITY
1
S U M M A R Y
In 2018, a combination of uncertainty in the face of highly disruptive trends—
globalization, technological change, demographic shifts—and new leadership
among the region’s business, government, and civic organizations motivated
stakeholders to take a fresh perspective on the regional economy, defined as
the six-county Sacramento region.
In late 2017, Valley Vision led a partnership with
Greater Sacramento Economic Council, Sacramento
Metro Chamber, Sacramento Region Business
Association, and Sacramento Area Council of
Governments to collaborate with the Brookings
Institution on four objectives:
• Provide stakeholders in the Sacramento region
with a collective framework for gauging economic
success in order to set objectives, guide decision-
making, and measure results
• Produce and compile research on the global
economic competitiveness of the region,
increasing understanding about the challenges
and opportunities and enabling a candid self-
assessment of alignment with current and
proposed activities
• Offer considerations to help translate findings
on the region’s economy into a set of goals,
strategies, and tactics, with institutional ownership
to execute
The Sacramento region is one of 16 American Middleweight regions
FIGURE 1
Sacramento
Riverside
Phoenix
San Antonio
Kansas City St. Louis
Indianapolis
Cincinnati
Columbus
Pittsburgh
ClevelandDetroit
Charlotte
OrlandoTampa
Miami
Source: ‘Redefi ning Global Cities’, Brookings, 2016
Sacramento MSA’s performance on growth, prosperity, and inclusion
FIGURE 2
+3.4% +4.0% -23.3%
Growth
67thOVERALL
JOBS
65th
GROSS METROPOLITANPRODUCT (GMP)
76th
JOBS AT YOUNG FIRMS
70th
Sacramento United States
80
90
100
110
2006 2007 2008 2009 2010 2011 2012 2013 2014 2015 2016
Jobs, 2006-2016 (2006 = 100)
Prosperity change
71stOVERALL
PRODUCTIVITY
77th+0.6%
STANDARD OF LIVING
83rd-6.8%
AVERAGE ANNUAL WAGE
25th+9.4%
80
90
100
110
2006 2007 2008 2009 2010 2011 2012 2013 2014 2015 2016
Productivity, 2006-2016 (2006 = 100)
Inclusion change
84thOVERALL
MEDIAN WAGE
70th-1.4%
RELATIVE POVERTY
81st+3.1%
EMPLOYMENT RATE
80th-2.2%
80
90
100
110
2006 2007 2008 2009 2010 2011 2012 2013 2014 2015 2016
Median wage, 2006-2016 (2006 = 100)
Source: ‘Metro Monitor 2018’, Brookings, 2018

BROOKINGS
METROPOLITAN
POLICY
PROGRAM
2
• Promote stakeholder agreement on a shared
regional economic philosophy and agenda
that ultimately can drive individual efforts and
investments
Based on these objectives, this report offers
information and insights on the Sacramento
region’s economic position by benchmarking the
region against 15 peer regions based on economic
size, wealth, productivity, industrial structure, and
competitiveness factors. Its key findings are:
The Sacramento region is relatively prosperous
compared to other large metro areas, but
the region has been on a troubling economic
trajectory since 2006. Compared to the rest of
the nation, the Sacramento region is relatively
productive and prosperous; middle class earnings
are higher in the region as is worker productivity.
Notwithstanding this strong starting point, the
region has struggled over the past decade. Between
2006 and 2016, the Sacramento metropolitan
statistical area (MSA) ranks in the bottom-third of
the 100 largest metro areas in composite rankings
measuring improvements in growth, prosperity,
and inclusion, three critical elements of regional
economies that work for everybody. These long-term
trends reflect that the downturn during the Great
Recession was deeper and more sustained in the
Sacramento MSA than in other parts of the nation.
As a result, the region’s economic performance has
looked better over the past five years. This progress
notwithstanding, 34 percent of the Sacramento
region’s residents live in struggling families, defined
as residents in households that do not earn enough
to cover their basic household expenses. Nearly two-
thirds of the region’s residents without a high school
degree are in struggling families, as are 47 percent
and 42 percent of black and Hispanic residents,
respectively.
The Sacramento region is one of 16 American Middleweight regions
FIGURE 1
Sacramento
Riverside
Phoenix
San Antonio
Kansas City St. Louis
Indianapolis
Cincinnati
Columbus
Pittsburgh
ClevelandDetroit
Charlotte
OrlandoTampa
Miami
Source: ‘Redefi ning Global Cities’, Brookings, 2016
Sacramento MSA’s performance on growth, prosperity, and inclusion
FIGURE 2
+3.4% +4.0% -23.3%
Growth
67thOVERALL
JOBS
65th
GROSS METROPOLITANPRODUCT (GMP)
76th
JOBS AT YOUNG FIRMS
70th
Sacramento United States
80
90
100
110
2006 2007 2008 2009 2010 2011 2012 2013 2014 2015 2016
Jobs, 2006-2016 (2006 = 100)
Prosperity change
71stOVERALL
PRODUCTIVITY
77th+0.6%
STANDARD OF LIVING
83rd-6.8%
AVERAGE ANNUAL WAGE
25th+9.4%
80
90
100
110
2006 2007 2008 2009 2010 2011 2012 2013 2014 2015 2016
Productivity, 2006-2016 (2006 = 100)
Inclusion change
84thOVERALL
MEDIAN WAGE
70th-1.4%
RELATIVE POVERTY
81st+3.1%
EMPLOYMENT RATE
80th-2.2%
80
90
100
110
2006 2007 2008 2009 2010 2011 2012 2013 2014 2015 2016
Median wage, 2006-2016 (2006 = 100)
Source: ‘Metro Monitor 2018’, Brookings, 2018

CHARTING A
COURSE TO
THE SACRAMENTO
REGION’S FUTURE
ECONOMIC
PROSPERITY
3
The Sacramento region can take advantage of
changing market, technology, and demographic
trends, but it must focus on the core drivers
and enablers of regional competitiveness and
prosperity. U.S. cities and regions must respond
to global and national forces outside their control,
namely globalization, technological change,
demographic transition, and declining national
investment in economic growth and opportunity.
This requires a focus on five key factors: competitive
tradable industries, innovation ecosystems, skilled
labor, spatially efficient infrastructure, and reliable
governance. By building on existing strengths and
addressing weaknesses, the Sacramento region has
an opportunity to better deploy these five factors to
increase shared prosperity:
• Tradable industries: Tradable industries are
critical for local prosperity in their ability to
improve productivity and bring in wealth from
outside the region. Therefore, one notable
challenge for the region is that employment growth
in tradable industries has trailed the nation as
a whole, suggesting competitive deficits. Partly
due to these trends and partly due its role as a
government capital, exports account for a lower
share of economic output in the Sacramento region
than in any other peer region. Most of the region’s
job creation, therefore, has been in locally serving
industries such as health care and transportation
and logistics, parts of the economy that do not pay
as well as advanced manufacturing and tradable
services. More optimistically, the Sacramento
region has a notable traded cluster opportunity
at the intersection of food, agriculture, and
technology.
The Sacramento region exports less than its peers
FIGURE 3
15%
12% 12%11% 10% 10% 10% 10%
9% 9% 9% 8%8% 7% 7%
6%
Source: ‘Export Monitor 2017’, Brookings, 2017
Export share of regional output, 2016
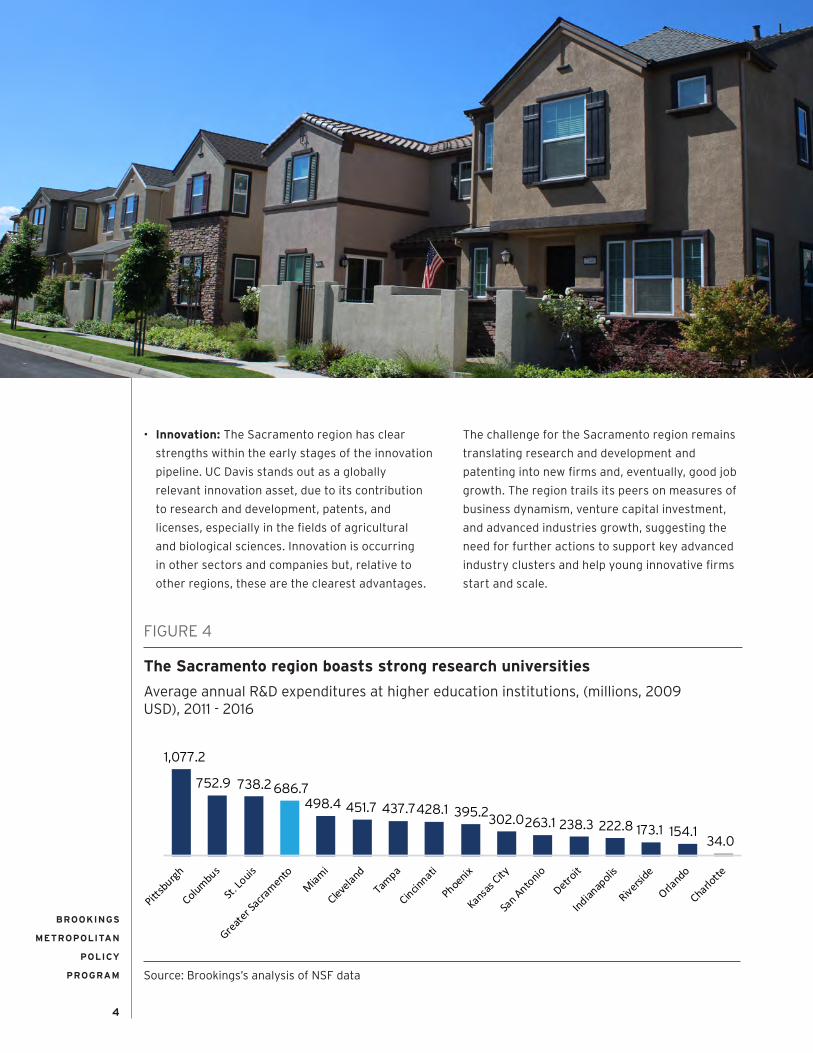
The Sacramento region boasts strong research universities
FIGURE 4
1,077.2
752.9 738.2 686.7498.4 451.7 437.7428.1 395.2
302.0263.1 238.3 222.8 173.1 154.134.0
Source: Brookings’s analysis of NSF data
Average annual R&D expenditures at higher education institutions, (millions, 2009 USD), 2011 - 2016
The Sacramento region
has clear strengths
within the early stages
of the innovation
pipeline.
BROOKINGS
METROPOLITAN
POLICY
PROGRAM
4
• Innovation: The Sacramento region has clear
strengths within the early stages of the innovation
pipeline. UC Davis stands out as a globally
relevant innovation asset, due to its contribution
to research and development, patents, and
licenses, especially in the fields of agricultural
and biological sciences. Innovation is occurring
in other sectors and companies but, relative to
other regions, these are the clearest advantages.
The challenge for the Sacramento region remains
translating research and development and
patenting into new firms and, eventually, good job
growth. The region trails its peers on measures of
business dynamism, venture capital investment,
and advanced industries growth, suggesting the
need for further actions to support key advanced
industry clusters and help young innovative firms
start and scale.
The Sacramento region exports less than its peers
FIGURE 3
15%
12% 12%11% 10% 10% 10% 10%
9% 9% 9% 8%8% 7% 7%
6%
Source: ‘Export Monitor 2017’, Brookings, 2017
Export share of regional output, 2016
The Sacramento region boasts strong research universities
FIGURE 4
1,077.2
752.9 738.2 686.7498.4 451.7 437.7428.1 395.2
302.0263.1 238.3 222.8 173.1 154.134.0
Source: Brookings’s analysis of NSF data
Average annual R&D expenditures at higher education institutions, (millions, 2009 USD), 2011 - 2016

CHARTING A
COURSE TO
THE SACRAMENTO
REGION’S FUTURE
ECONOMIC
PROSPERITY
5
Close to three-quarters of occupations in the region now require high or medium levels of digital skills
FIGURE 6
53.2%
28.1%
40.5%
47.8%
6.2%
24.1%
2002 2016
Low Medium High
Source: ‘Digitalization and the American Workforce’, Brookings, 2017
Share of occupations by digital skill level, the Sacramento region
The Sacramento region experienced relatively slow job growth in advanced industries
FIGURE 5
3.7%
2.8% 2.6%
1.3% 1.0% 0.9% 0.9% 0.9% 0.7%0.4% 0.4% 0.3%
-0.2%-0.8% -0.9%
-1.3%
Source: ‘America’s Advanced Industries: What They Are, Where They Are, and Why They Matter’, Brookings, 2015
Employment CAGR in advanced industries, 2005 - 2015

BROOKINGS
METROPOLITAN
POLICY
PROGRAM
6
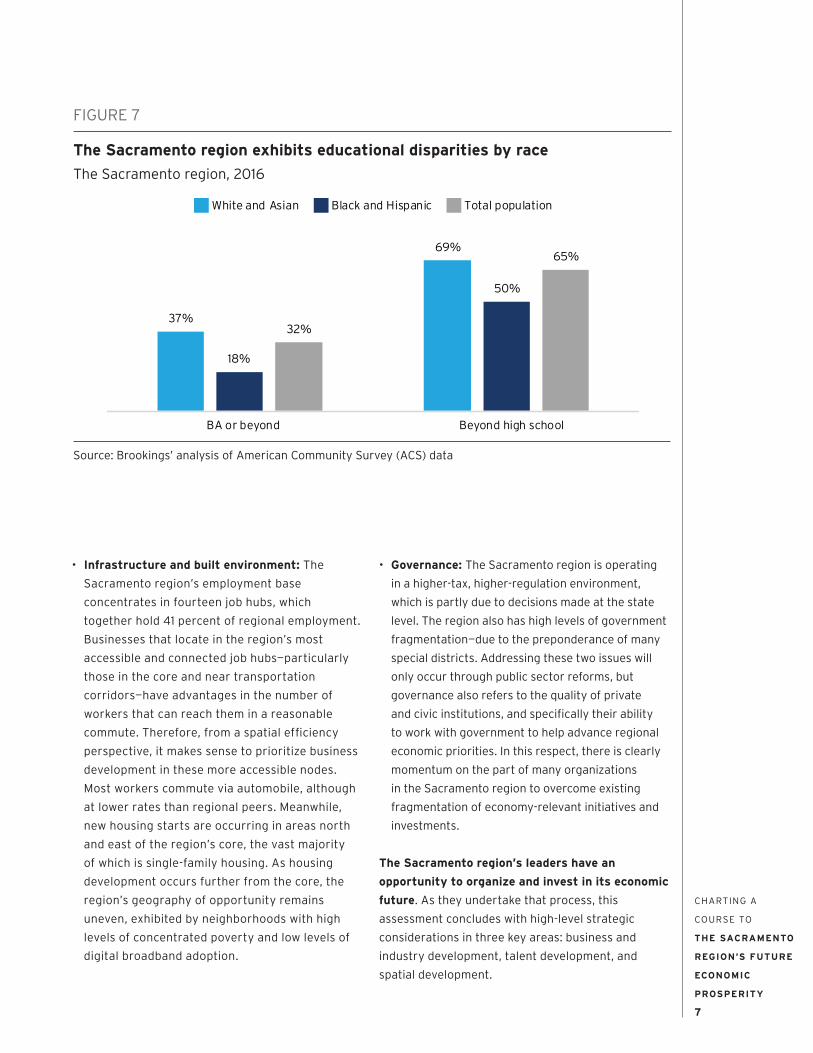
• Talent: By national standards, the Sacramento
region has a relatively strong base of educated
workers. But its labor market is changing due to
two significant transformations. First, employers
are demanding and rewarding workers with higher
education and technology-relevant skills. The
share of the Sacramento region’s jobs requiring
minimal digital skills has decreased from 53
percent in 2002 to 28 percent in 2016. Second, the
Sacramento region’s workforce supply is becoming
much more racially diverse, which makes closing
educational and employment disparities by race
extremely urgent. Notwithstanding the region’s
ability to attract well-educated workers from
outside California to fill workforce gaps, it must
educate and train a broader, more diverse set of its
homegrown population for in-demand jobs.
Close to three-quarters of occupations in the region now require high or medium levels of digital skills
FIGURE 6
53.2%
28.1%
40.5%
47.8%
6.2%
24.1%
2002 2016
Low Medium High
Source: ‘Digitalization and the American Workforce’, Brookings, 2017
Share of occupations by digital skill level, the Sacramento region
The Sacramento region experienced relatively slow job growth in advanced industries
FIGURE 5
3.7%
2.8% 2.6%
1.3% 1.0% 0.9% 0.9% 0.9% 0.7%0.4% 0.4% 0.3%
-0.2%-0.8% -0.9%
-1.3%
Source: ‘America’s Advanced Industries: What They Are, Where They Are, and Why They Matter’, Brookings, 2015
Employment CAGR in advanced industries, 2005 - 2015
The Sacramento
region’s leaders have
an opportunity to
organize and invest in its
economic future.
CHARTING A
COURSE TO
THE SACRAMENTO
REGION’S FUTURE
ECONOMIC
PROSPERITY
7
• Infrastructure and built environment: The
Sacramento region’s employment base
concentrates in fourteen job hubs, which
together hold 41 percent of regional employment.
Businesses that locate in the region’s most
accessible and connected job hubs—particularly
those in the core and near transportation
corridors—have advantages in the number of
workers that can reach them in a reasonable
commute. Therefore, from a spatial efficiency
perspective, it makes sense to prioritize business
development in these more accessible nodes.
Most workers commute via automobile, although
at lower rates than regional peers. Meanwhile,
new housing starts are occurring in areas north
and east of the region’s core, the vast majority
of which is single-family housing. As housing
development occurs further from the core, the
region’s geography of opportunity remains
uneven, exhibited by neighborhoods with high
levels of concentrated poverty and low levels of
digital broadband adoption.
• Governance: The Sacramento region is operating
in a higher-tax, higher-regulation environment,
which is partly due to decisions made at the state
level. The region also has high levels of government
fragmentation—due to the preponderance of many
special districts. Addressing these two issues will
only occur through public sector reforms, but
governance also refers to the quality of private
and civic institutions, and specifically their ability
to work with government to help advance regional
economic priorities. In this respect, there is clearly
momentum on the part of many organizations
in the Sacramento region to overcome existing
fragmentation of economy-relevant initiatives and
investments.
The Sacramento region’s leaders have an
opportunity to organize and invest in its economic
future. As they undertake that process, this
assessment concludes with high-level strategic
considerations in three key areas: business and
industry development, talent development, and
spatial development.
The Sacramento region exhibits educational disparities by race
FIGURE 7
37%
69%
18%
50%
32%
65%
BA or beyond Beyond high school
White and Asian Black and Hispanic Total population
Source: Brookings’ analysis of American Community Survey (ACS) data
The Sacramento region, 2016

BROOKINGS
METROPOLITAN
POLICY
PROGRAM
8
• Business and industry development refers to
the set of systems and organizations that work
with companies to shape this process—from
universities to entrepreneurship networking
groups to economic development organizations.
Our comparative assessment points to two
considerations:
• Explore the potential for a cluster initiative at
the intersection of agriculture, food, and science
and technology, a promising tradable cluster
opportunity.
• Identify and address gaps that hinder business
dynamism. While we identified that young
firm growth is not as robust in the Sacramento
region, more work needs to be done to identify
the specific reasons why young firms may not be
starting and scaling locally.
• Talent development refers to the set of systems
and organizations that influence the talent pipeline
– from educational institutions to workforce
development organizations to employers offering
on-the-job training. Our comparative assessment
points to two considerations:
• Invest in digital skills training, to both grow
the pool of high-skill technical workers and
expand the number of workers with basic digital
literacy, by making digital skills a shared priority
for community colleges, universities, and
workforce and economic development groups.
• Prepare and connect young workers,
especially young workers of color, to
in-demand occupations and industries through
alignment between talent development systems
and economic development systems.
CHARTING A
COURSE TO
THE SACRAMENTO
REGION’S FUTURE
ECONOMIC
PROSPERITY
9
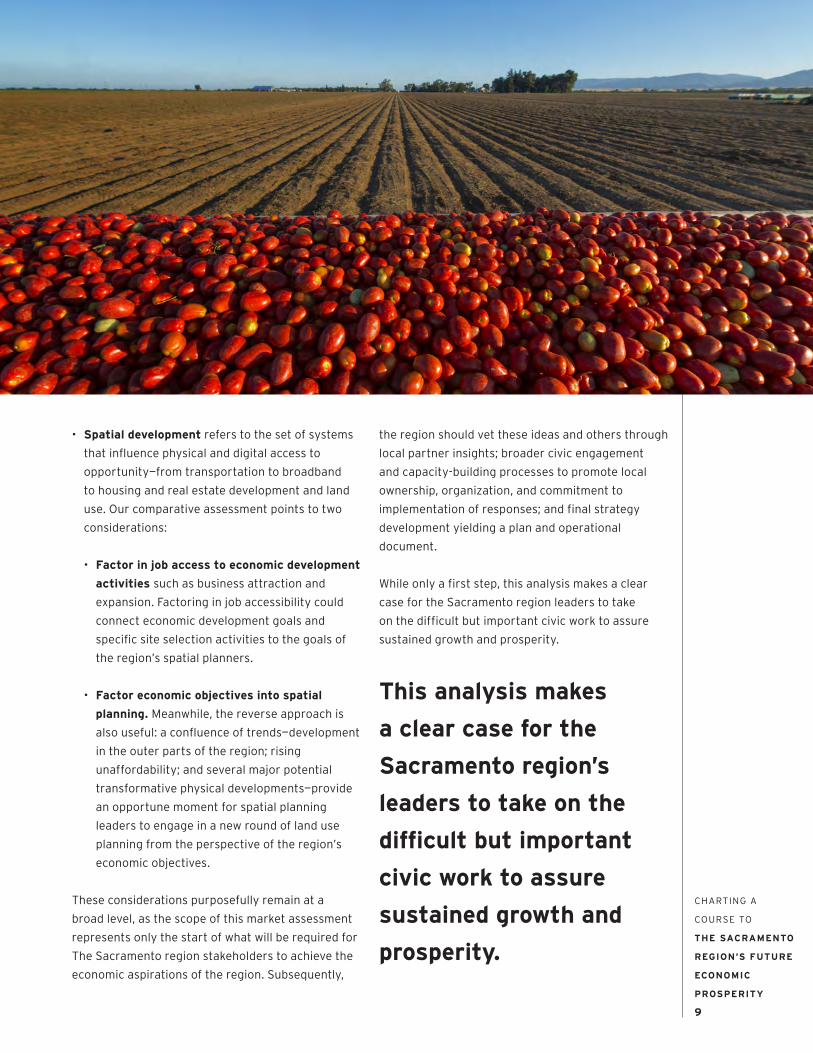
• Spatial development refers to the set of systems
that influence physical and digital access to
opportunity—from transportation to broadband
to housing and real estate development and land
use. Our comparative assessment points to two
considerations:
• Factor in job access to economic development
activities such as business attraction and
expansion. Factoring in job accessibility could
connect economic development goals and
specific site selection activities to the goals of
the region’s spatial planners.
• Factor economic objectives into spatial
planning. Meanwhile, the reverse approach is
also useful: a confluence of trends—development
in the outer parts of the region; rising
unaffordability; and several major potential
transformative physical developments—provide
an opportune moment for spatial planning
leaders to engage in a new round of land use
planning from the perspective of the region’s
economic objectives.
These considerations purposefully remain at a
broad level, as the scope of this market assessment
represents only the start of what will be required for
The Sacramento region stakeholders to achieve the
economic aspirations of the region. Subsequently,
the region should vet these ideas and others through
local partner insights; broader civic engagement
and capacity-building processes to promote local
ownership, organization, and commitment to
implementation of responses; and final strategy
development yielding a plan and operational
document.
While only a first step, this analysis makes a clear
case for the Sacramento region leaders to take
on the difficult but important civic work to assure
sustained growth and prosperity.
This analysis makes
a clear case for the
Sacramento region’s
leaders to take on the
difficult but important
civic work to assure
sustained growth and
prosperity.

1775 Massachusetts Avenue, NW
Washington, D.C. 20036-2188
telephone 202.797.6139
fax 202.797.2965
www.brookings.edu/metro