future of transportation-final report-july 29 · limitations of transportation planning models 21...
TRANSCRIPT
FHWA-NJ- 2005-016
March 2005
THE FUTURE OF TRANSPORTATION MODELING FINAL REPORT
Submitted by
Dr. Maria P. Boile Assistant Professor and Principal Investigator
Dept. Of Civil and Environmental Engineering Rutgers University
NJDOT RESEARCH PROJECT MANAGER
In cooperation with
New Jersey Department of Transportation
Division of Research and Technology And
U.S. Department of Transportation Federal Highway Administration
Co-Author
Dr. Kaan Ozbay
Associate Professor Dept. Of Civil and Environmental Engineering
Rutgers University
Dr. NAZHAT ABOOBAKER
DISCLAIMER STATEMENT
“The contents of this report reflect the views of the authors who are responsible for the facts and the
accuracy of the data presented herein. The contents do not necessarily reflect the official views or policies of the New Jersey Department of Transportation or the Federal Highway Administration. This report does not constitute
a standard, specification, or regulation”
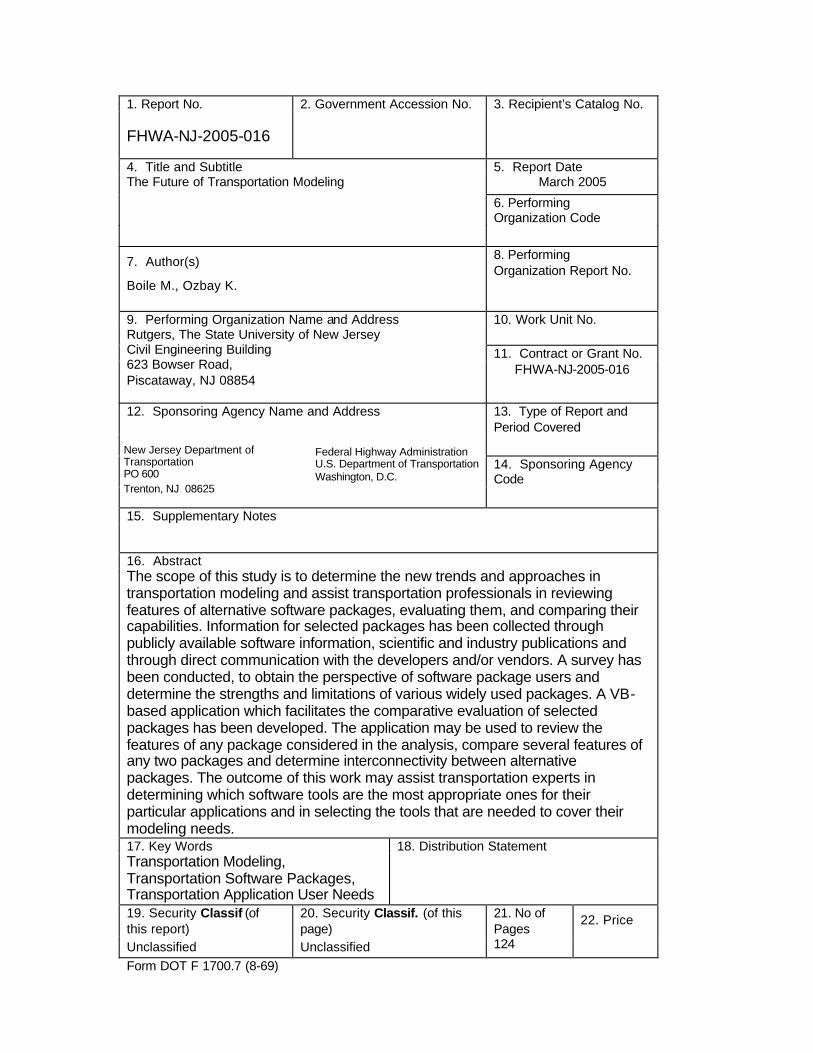
1. Report No. 2. Government Accession No. 3. Recipient’s Catalog No. FHWA-NJ-2005-016
4. Title and Subtitle 5. Report Date March 2005
6. Performing Organization Code
The Future of Transportation Modeling
7. Author(s) 8. Performing Organization Report No.
Boile M., Ozbay K.
9. Performing Organization Name and Address 10. Work Unit No. 11. Contract or Grant No.
Rutgers, The State University of New Jersey Civil Engineering Building 623 Bowser Road, Piscataway, NJ 08854
FHWA-NJ-2005-016
12. Sponsoring Agency Name and Address 13. Type of Report and Period Covered
14. Sponsoring Agency Code
15. Supplementary Notes
16. Abstract The scope of this study is to determine the new trends and approaches in transportation modeling and assist transportation professionals in reviewing features of alternative software packages, evaluating them, and comparing their capabilities. Information for selected packages has been collected through publicly available software information, scientific and industry publications and through direct communication with the developers and/or vendors. A survey has been conducted, to obtain the perspective of software package users and determine the strengths and limitations of various widely used packages. A VB-based application which facilitates the comparative evaluation of selected packages has been developed. The application may be used to review the features of any package considered in the analysis, compare several features of any two packages and determine interconnectivity between alternative packages. The outcome of this work may assist transportation experts in determining which software tools are the most appropriate ones for their particular applications and in selecting the tools that are needed to cover their modeling needs. 17. Key Words 18. Distribution Statement Transportation Modeling, Transportation Software Packages, Transportation Application User Needs
19. Security Classif (of this report)
20. Security Classif. (of this page)
21. No of Pages
22. Price
Unclassified Unclassified 124
Form DOT F 1700.7 (8-69)
Federal Highway Administration U.S. Department of Transportation Washington, D.C.
New Jersey Department of Transportation PO 600 Trenton, NJ 08625
ii
Acknowledgements
This research has been supported by the New Jersey Department of Transportation and the Center for Advanced Infrastructure and
Transportation. This support is gratefully acknowledged, but implies no endorsement of the conclusions by NJDOT or CAIT.
The contents of this report reflect the views of the authors who are responsible for the facts and the accuracy of the information
presented herein.
We would like to thank the members of the Advisory Board who helped guide us in our efforts and provided technical insights,
comments, criticisms and suggestions.
Finally, we wish to acknowledge the contributions of Ms. Tejal Patel, Ms. Anne Meehan and Mr. Krunoslav Peric, Research
Assistants at Rutgers University, Department of Civil and Environmental Engineering.
iii
TABLE OF CONTENTS
SUMMARY 1
INTRODUCTION 3
Need for this Study 3
Scope 4
Methodology 5
LITERATURE REVIEW 7
Overview of Transportation Modeling in the US and Europe 9
The US Experience 9
The European Experience 14
The Transportation Planning Process 18
Regional Travel Demand Models 18
Inventory and Data Requirements 19
Land Use Models 19
Four Step Planning Process 20
Discrete Models 20
GIS and Transportation Planning Models 20
Emissions Models 21
Limitations of Transportation Planning Models 21
Models versus Software Packages 22
Interconnectivity of Subsystems and their relation to Transportation Analysis
22
The Florida DOT Study 24
LIST OF SOFTWARE PACKAGES 26
Criteria for Software Package Selection 26
Page No.
iv
Software Package Classification 29
List of Features 30
SOFTWARE MATRIX 31
TRANSPORTATION SOFTWARE PACKAGE USER SURVEY 33
Introduction and Purpose of the Survey 33
Survey Design 33
Survey Distribution and Collection 35
Survey Analysis 36
Level of Operation of Respondent’s Organization 36
Use of Transportation Planning Software Packages 37
Use of Traffic Simulation Software Packages 37
Use of Land Use Software Packages 38
Use of Integrated Transportation Planning and Traffic Simulation
Packages 39
Use of Integrated Traffic Simulation and Land Use Software Packages 39
Use of Emissions Modeling Software Packages 40
Use of ITS Modeling Software Packages 40
Use of Supporting Applications 41
Use of Software Packages in Years 41
Version of Software Used 43
Scale of Use of Software Packages by Region 44
Reason to Choose / Purchase a Software Package 46
Strengths of Transportation Planning and Simulation Software Packages
48
Limitations of Transportation Planning and Simulation Software Packages
49
Strengths and Limitations of Land Use Modeling Software Packages 51
Strengths and Limitations of Emissions Modeling Software Packages 52
v
Summary of Strengths and Limitations 53
Familiarity with Alternative Software Packages 53
Willingness to Adopt Commercially Unavailable or Under Development
Models 54
Willingness to Adopt TRANSIMS 55
TRANSPORTATION MODELING NEEDS ASSESSMENT TOOL 56
Data Base Development 57
Functions 57
Description 58
Comparison 61
Integration of Applications 65
DataBase 69
Quick Review Function 73
SUMMARY OF FINDINGS AND FUTURE DIRECTION 74
Summary of Survey Findings 74
Private vs. Public Organization Needs 77
Future Trends 78
CONCLUSIONS 79
APPENDICES 81
APPENDIX A. 81
TRANSIMS 81
Introduction 81
Federal Legislation and the Need for TRANSIMS 82
ISTEA and CAAA requirements and TRANSIMS 82
Functional Requirements for TRANSIMS 83
vi
Computer Requirements 85
The Six Modules of TRANSIMS 85
Data Tables 86
Population Synthesizer 87
Activity Generator 88
Router 90
Microsimulator 92
Selector and Iteration Database 94
Emissions Estimator - Environmental Module 95
The TRANSIMS Visualizer 97
Dallas-Ft. Worth Case Study 97
Background 97
The Dallas-Fort Worth Network 98
Populations and Activities 98
Router 98
Microsimulation 98
Calibration 99
Results 99
Dallas-Fort Worth Case Study Source 99
Portland, Oregon Case Study 99
Purposes of the Portland Study 99
The Portland Network 100
Population 102
Activities 102
Router 102
Microsimulation 103
Emissions Estimator 103
Portland Study Source 103
Diamond Drive Local Engineering Study 103
vii
APPENDIX B. SOFTWARE MATRIX 104
APPENDIX C. USER SURVEY INSTRUMENT 104
APPENDIX D. TRANSPORTATION SOFTWARE SELECTION TOOL (TSSS) 109
REFERENCES 110
LIST OF TABLES Table 1: List of Software Packages.........................................................................................30 Table 2: List of Unique Features of Software Packages......................................................31 Table 3: Contacts for the Survey.............................................................................................35 Table 4: Response Rate and Distribution per Type of Organization .................................35 Table 5: Scale of Use of Software Packages by Number of Respondents ......................42 Table 6: Latest Version of Software Packages Used ...........................................................43 Table 7: Scale of Use of Software Packages ........................................................................45 Table 8: Reasons for Purchasing a Software Package .......................................................46 Table 9: Reasons for Purchasing a Software Package (cont) ............................................47 Table 10: Strengths of Transportation Planning Software Packages ................................48 Table 11: Strengths of Traffic Simulation Software Packages............................................49 Table 12: Limitations of Transportation Planning Software Packages ..............................50 Table 13: Limitations of Traffic Simulation Software Packages..........................................51 Table 14: Strengths and Limitations of Land Use Modeling Software Packages ............52 Table 15: Strengths and Limitations of Emissions Modeling Software Packages ...........52 Table 16: Familiarity with Alternative Software Packages...................................................54 LIST OF FIGURES Figure 1: Graphical Representation of Methodology of Work 5 Figure 2: The Interconnected Subsystems 24 Figure 3: Screen Shot of Software Matrix 32 Figure 4: Use of Transportation Planning Packages 37 Figure 5: Use of Traffic Simulation Software Packages 38 Figure 6: Use of Land Use Software Packages 39 Figure 7: Percentage Use of Emissions Modeling Software Packages 40 Figure 8: Willingness to Adopt TRANSIMS 56 Figure 9: Main Screen 58 Figure 10: Description Selection in the Main Menu 59 Figure 11: Menu selections within Description 59 Figure 12: Software Selection 60 Figure 13: Feature Selection 60 Figure 14: Selected Feature Information 61 Figure 15: Comparison Function in the Main Menu 62
viii
Figure 16: Software Package Categories 62 Figure 17: List of Packages within a Category 63 Figure 18: List of Features 64 Figure 19: Software Package Comparison base on Selected Features 64 Figure 20: Integration of Applications Selection from the Main Menu 65 Figure 21: Integration of Applications Drop Down Menu 66 Figure 22: Interconnectivity Categories 67 Figure 23: Classification based on Industry Usage 68 Figure 24: Classification Based on Single License Cost 68 Figure 25: DataBase Drop Down Menu 69 Figure 26: Adding New Software Package to the Database 70 Figure 27: Software Group selection 70 Figure 28: Software Package selection 71 Figure 29: Type of Information selection 71 Figure 30: Software Group selection 72 Figure 31: Select Software Package for deletion 72 Figure 32: Quick Information Search 73 Figure 33: Query Results from the Quick Review Function 74 Figure 34: Inputs and Outputs of the Populations Synthesizer 88 Figure 35: Parallel computation can be used in the module to accelerate processing
time 89 Figure 36: Inputs and Outputs of the Router 91 Figure 37: Inputs and Outputs of the Microsimulator 92 Figure 38: Selector/Iteration Module 95
1
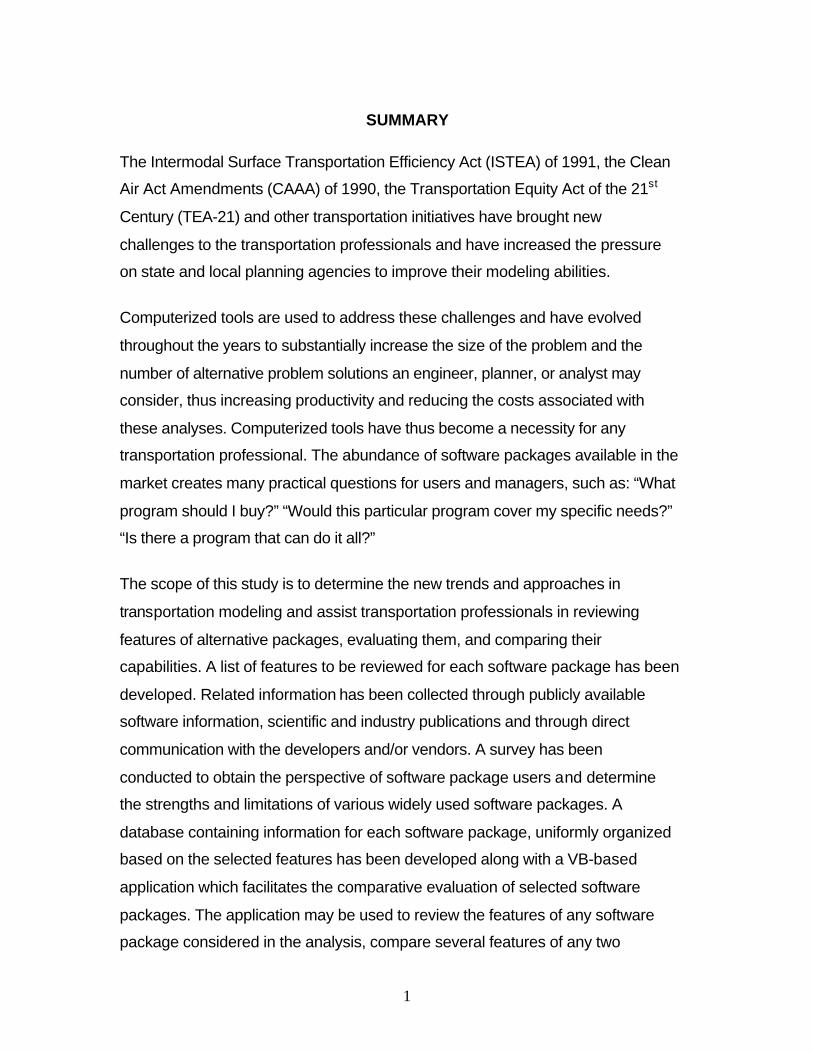
SUMMARY
The Intermodal Surface Transportation Efficiency Act (ISTEA) of 1991, the Clean
Air Act Amendments (CAAA) of 1990, the Transportation Equity Act of the 21st
Century (TEA-21) and other transportation initiatives have brought new
challenges to the transportation professionals and have increased the pressure
on state and local planning agencies to improve their modeling abilities.
Computerized tools are used to address these challenges and have evolved
throughout the years to substantially increase the size of the problem and the
number of alternative problem solutions an engineer, planner, or analyst may
consider, thus increasing productivity and reducing the costs associated with
these analyses. Computerized tools have thus become a necessity for any
transportation professional. The abundance of software packages available in the
market creates many practical questions for users and managers, such as: “What
program should I buy?” “Would this particular program cover my specific needs?”
“Is there a program that can do it all?”
The scope of this study is to determine the new trends and approaches in
transportation modeling and assist transportation professionals in reviewing
features of alternative packages, evaluating them, and comparing their
capabilities. A list of features to be reviewed for each software package has been
developed. Related information has been collected through publicly available
software information, scientific and industry publications and through direct
communication with the developers and/or vendors. A survey has been
conducted to obtain the perspective of software package users and determine
the strengths and limitations of various widely used software packages. A
database containing information for each software package, uniformly organized
based on the selected features has been developed along with a VB-based
application which facilitates the comparative evaluation of selected software
packages. The application may be used to review the features of any software
package considered in the analysis, compare several features of any two

2
software packages and determine interconnectivity between alternative software
packages.
The outcome of this work may assist transportation experts in determining which
tools are the most appropriate ones for their particular applications and in
selecting the tools that are needed to cover their modeling needs.
3
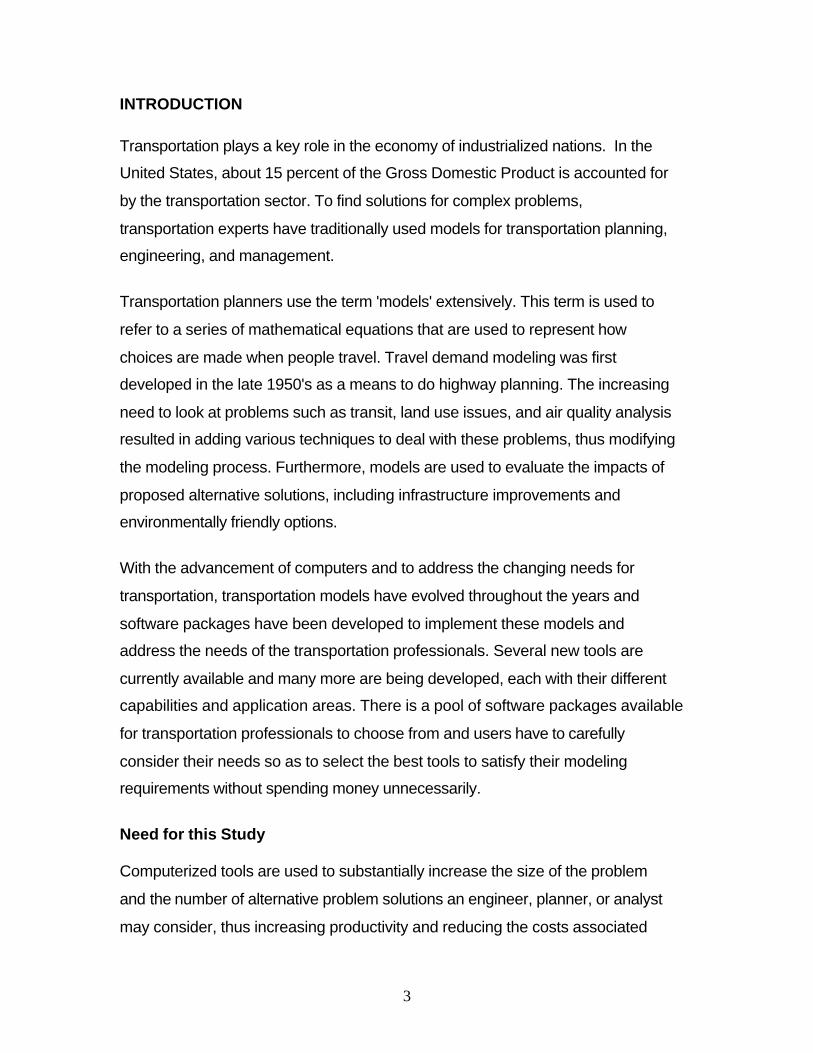
INTRODUCTION
Transportation plays a key role in the economy of industrialized nations. In the
United States, about 15 percent of the Gross Domestic Product is accounted for
by the transportation sector. To find solutions for complex problems,
transportation experts have traditionally used models for transportation planning,
engineering, and management.
Transportation planners use the term 'models' extensively. This term is used to
refer to a series of mathematical equations that are used to represent how
choices are made when people travel. Travel demand modeling was first
developed in the late 1950's as a means to do highway planning. The increasing
need to look at problems such as transit, land use issues, and air quality analysis
resulted in adding various techniques to deal with these problems, thus modifying
the modeling process. Furthermore, models are used to evaluate the impacts of
proposed alternative solutions, including infrastructure improvements and
environmentally friendly options.
With the advancement of computers and to address the changing needs for
transportation, transportation models have evolved throughout the years and
software packages have been developed to implement these models and
address the needs of the transportation professionals. Several new tools are
currently available and many more are being developed, each with their different
capabilities and application areas. There is a pool of software packages available
for transportation professionals to choose from and users have to carefully
consider their needs so as to select the best tools to satisfy their modeling
requirements without spending money unnecessarily.
Need for this Study
Computerized tools are used to substantially increase the size of the problem
and the number of alternative problem solutions an engineer, planner, or analyst
may consider, thus increasing productivity and reducing the costs associated
4
with these analyses. Computerized tools have thus become a necessity for any
transportation professional. The abundance of software packages available in the
market, however, creates many practical questions for users and managers,
such as: “What program should I buy?” “Would this particular program cover my
specific needs?” “Is there a program that can do it all?”
This research intends to give an overview of selected software packages, so that
their potential applications can be evaluated. It aims to assist transportation
professionals in reviewing features of alternative packages, evaluating them, and
comparing their capabilities. More specifically, this research intends to assist the
NJDOT Bureau of Systems Development and Analysis in selecting the
appropriate tools to cover their modeling needs.
Scope
Many important changes have occurred during the past few years in the use of
transportation planning methods. The latest software packages offer increased
flexibility with a greater ability to respond to the requirements of the users. The
primary purpose of this research is to present a comprehensive introduction to
new trends and approaches of transportation modeling methods. The scope of
the research includes:
• Identification of the most widely used, publicly as well as privately
developed computerized software packages.
• Review of the basic functions and capabilities of the software
products.
• Evaluation of widely available and prevalent software products by
obtaining both the developer and the user perspective.
• Development of an interactive tool to assist in the comparative
evaluation of alternative software packages.
• Identification of current and future trends in transportation
modeling.
5
• Identification of new challenges posed by the current issues in
transportation, which may be met by adopting a flexible modeling
approach for particular or varied needs.
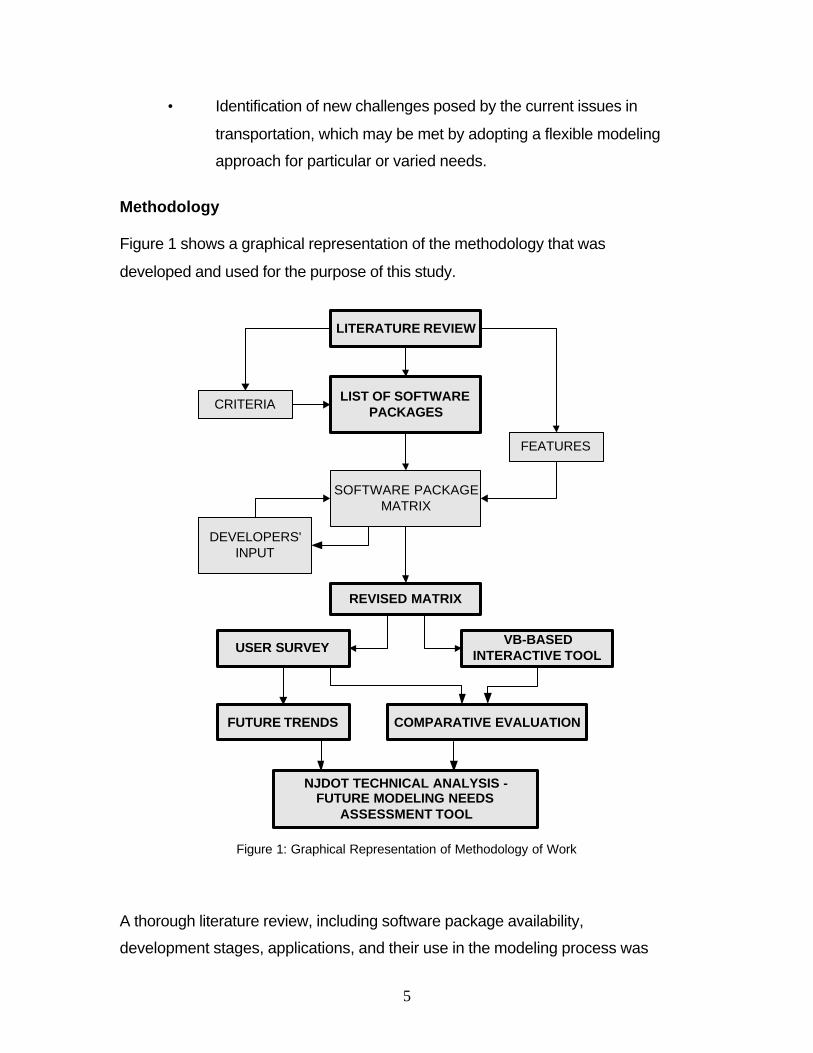
Methodology
Figure 1 shows a graphical representation of the methodology that was
developed and used for the purpose of this study.
LITERATURE REVIEW
LIST OF SOFTWAREPACKAGES
SOFTWARE PACKAGEMATRIX
CRITERIA
FEATURES
DEVELOPERS'INPUT
REVISED MATRIX
USER SURVEYVB-BASED
INTERACTIVE TOOL
FUTURE TRENDS COMPARATIVE EVALUATION
NJDOT TECHNICAL ANALYSIS -FUTURE MODELING NEEDS
ASSESSMENT TOOL
Figure 1: Graphical Representation of Methodology of Work
A thorough literature review, including software package availability,
development stages, applications, and their use in the modeling process was
6
conducted. Transportation journals, textbooks, ITE and DOT standards manuals,
and the Internet were used as sources for this information. Next, based on a set
of criteria regarding their type and application areas, a list of software packages
to be considered in this study was developed. To better organize the information
and to facilitate comparative evaluation, a set of features of the software
packages was selected. Using these features, the information collected on each
software package was organized in a matrix format. This analysis is similar to the
one presented in The Urban Transport Monitor (April 5, and April 17, 2002). The
Urban Transport Monitor study presents the results of a survey, the scope of
which is to gather information on six widely used transportation planning software
packages and present this information on an easy to read tabular form. A similar
survey was performed on traffic impact software packages and the results were
presented in the March 21, 2003 issue of The Urban Transport Monitor. In the
study presented in this report several additional software packages have been
reviewed based primarily on the features used in The Urban Transport Monitor
study and on some additional features that were considered to provide useful
information about the software packages.
The rows of the matrix are the software packages and the columns are the
features. A typical element of the matrix is the description of a particular feature
for a particular software package. The matrix was sent out to software
developers for review and comments. Each developer received the part of the
matrix that was related to his/her specific product and was asked to comment on
the content of the matrix and provide any additional information that was deemed
necessary. Based on the findings of this survey the matrix was updated. The
revised matrix was also sent out, for review and comments, to a group of
transportation experts, who comprised the advisory board for this project.
Although the content of the matrix was considered by the advisory board
members to be appropriate, the matrix seemed to be difficult to read and to be
used for comparative evaluation of selected software packages. For this reason
an interactive tool was developed using Visual Basic. Users of this tool may
7
select the software packages and the features they wish to compare or obtain
information for. A table is thus created, which provides a summary of the
selected features for the selected software packages.
A software package user survey was conducted next, to determine the users’
perspective. As part of this survey a contact list was developed, containing
primarily consulting firms in New Jersey. Some additional contacts were provided
by the NJDOT. Results from this survey regarding the extent and purpose of
usage as well as user satisfaction with specific software packages were
summarized and conclusions on future trends in transportation modeling were
drawn. The last part of this work comprises the development of a tool to be used
by the NJDOT Bureau of System Development and Analysis in assessing their
future modeling needs. This tool summarizes information on the software
packages, facilitates the comparative evaluation of various packages and
determines the set of tools that would cover a wide spectrum of applications
typical to a state DOT based on interconnectivity among various tools, costs, and
the level of usage of the software packages in the NJ transportation industry.
The following sections present the various steps of this methodology along with
findings and concluding remarks. These sections include: literature review; set of
criteria that were used to determine the list of software packages to be
considered in this study and the features that are highlighted; a summary list of
the software packages, the software matrix; the interactive tool for comparison of
the software packages; the users’ survey, summary of its findings and future
trends; the needs assessment tool; and finally a summary of the research
findings.
LITERATURE REVIEW
Transportation modeling deals with the relationship of land use to travel patterns
and travel demand, planning, design, evaluation, and programming of
transportation systems, including facilities and services for roadways, transit,
terminals, parking, pedestrian facilities, bikeways, and goods movement.
8
Transportation planners are increasingly concerned with issues such as
economic effects and environmental concerns; improving co-ordination between
land use and transportation system planning; examining interactions between
planning, design and operation of transportation services; maintaining a perfect
balance between transportation related energy use, clean air and water.
To perform these types of analyses, transportation professionals use various
models. These models may be broadly classified as conceptual, mathematical or
physical. Conceptual models are used for structuring problems; mathematical
models provide a convenient mechanism for simulating the operation of a system
and evaluating its performance under a variety of input conditions or model
constraints; physical models are a small version of a real system.
A model allows manipulation of a number of alternatives without expensive
experimentation on the real world system. Along with manipulation of various
alternatives, models assess the effects of generated alternatives on the system.
The basic uses of models include the following:
• Enable forecasts to be made.
• Evaluate alternative plans.
• Investigate the makeup of the system and the structure of
interactions within it.
• Explain the principles of operation of the system.
• Improve decision-making, which should not be based exclusively
on intuitive judgment.
Transportation systems are very complex and, typically, large scale, so use of
models is necessary in their study, design, analysis and evaluation.
Transportation modeling was first developed in the 1950’s. Since then several
models have been developed and many software packages have been
produced, to implement these models. The following sections provide an
overview of both modeling efforts and software package development and
9
availability in the US and Europe; present an overview of the transportation
planning process; discuss the interconnectivity of various subsystems in an
urban or regional environment and their relation to transportation analysis; and
the review of a study performed for the Florida DOT with a scope similar to the
work presented herein.
Overview of Transportation Modeling in the US and Europe
The US Experience
An historical overview of transportation planning in the US is presented in Reed
and Weiner(1) and is summarized here. The early emerging settlements in the
Atlantic coast of North America required a transportation infrastructure. After the
American Revolution both the state and federal government were too burned by
war debt to be able to afford a significant infrastructure program. Colonial law
largely followed the European tradition of having local governments be
responsible for road construction and maintenance. In 1971, the Society for
Promoting the Improvement of Roads and Inland Navigation submitted the first
nationwide transportation plan to the Pennsylvania legislature.
The efforts of transportation planning evolved in 1930’s and 1940’s with the
beginning of highway and transit planning activities. These activities intended to
improve the design and operation of transportation facilities and focused mainly
on upgrading and expansion. Early urban transportation planning studies were
primarily systems-oriented with a twenty-year time horizon and region-wide in
scope largely as a result of legislation for the National System of Interstate and
Defense Highways. Legislation required that major highways be designed for
traffic projected twenty years into the future. This approach continued through the
1960’s. In the early 1970's planning processes turned attention to shorter-term
time horizons and the corridor-level scale. This was a result of a realization that
long-range planning had been dominated by concern for major regional highway
and transit facilities with only minor attention being paid to lesser facilities and the
opportunity to improve the efficiency of the existing system. By the 1980's urban
10
transportation planning had become primarily short-term oriented. It shifted from
facility expansion to provision of transportation services. By early 1990’s the era
of major new highway construction was over in most urban areas but the growth
in urban travel was continuing unabated.
New approaches needed to be found to serve this travel demand since there was
only limited highway expansion possible. Traffic congestion was leading to
degradation of the urban environment. Selected application measures of
transportation system management (TSM) proved to have limited impacts on
reducing congestion. This provided the need for more comprehensive and
integrated strategies. Many transportation agencies entered into strategic
management and planning process to identify the scope and nature of changes,
develop strategies to address the new issues and to better orient their
organization to function in this new environment. Focus was shifted towards
longer-term time horizons, integrated transportation management strategies,
wider geographic applications of these strategies and renewed interest in
technological alternatives. The major issues that concerned transportation
planning during the latter half of 1960’s and 1970’s included safety, citizen
involvement, preservation of park land and natural areas, equal opportunity for
disadvantaged persons, environmental concerns like air quality, transportation for
the elderly and handicapped, energy conservation and revitalization of urban
centers, concerns for deterioration of the highway and transit infrastructure and
its effect on economic growth.
Theoretical Developments
The theoretical foundation of the modern planning models has its origin in the
1950s. Beckmann, McGuire, and Winsten(2) formulated the user equilibrium
principle as a mathematical programming problem. They used the Kuhn-Tucker
conditions to show that the solution to this problem is equivalent to the user
equilibrium conditions. A computational algorithm that may be used to solve this
problem was developed the same year by Frank and Wolfe(3). Procedures for
11
specific purposes were integrated into an urban travel forecasting process in the
early urban transportation studies in the 1950's. Through the 1960's
improvements in planning techniques were made primarily by practitioners, and
these new approaches were integrated into practice fairly easily. The FHWA and
UMTA carried out extensive activities to develop and disseminate analytical
techniques and computer programs for use by state and local governments. The
Urban Transportation Planning System (UTPS) became the standard computer
battery for urban transportation analysis by the mid 1970's, and is still used in
transportation planning practice today.
To simplify the complex planning process, the Urban Transportation Modeling
System (UTMS) is divided into four stages - trip generation, trip distribution,
modal split and traffic assignment - executed in sequence. The main shortcoming
of the four-step process is that it lacks a theoretical footing in behavioral,
economic, and systems engineering theory. The process, as developed and
used, neither recognizes nor seeks an equilibrium solution, a solution that will
satisfy both demand and supply relationships. Experienced planners try to deal
with these problems by introducing feedback loops in order to model the
interactions between network (supply) and travel volume (demand). However, as
is shown in Boyce et al.(4), using an iterative four-step procedure with feedback
does not produce the desired result. Professional practitioners need to
understand the requirements of the desired equilibrium solutions and insist that
their software developers correctly implement the algorithms required to compute
these solutions.
During the 1970's new travel forecasting techniques were developed for the most
part by the research community, largely in universities. These disaggregate travel
forecasting approaches differed from the aggregate approaches being used in
practice at the time. They used new mathematical techniques and theoretical
bases from econometrics that were difficult for practitioners to learn. Moreover,
the new techniques were not easily integrated into conventional planning
practices. Numerous mathematical formulations and efficient algorithms were
12
developed during the 1970s to model network equilibria. (See references 5,6,7,8,9 and 10)
This effort continued during the 1980s with several major contributions during this
period. (See references 11,12,13,14,15,16,17,18,19 and 20) Boyce et al.(22) presents applications
of existing theoretical models that combine O-D, mode and route choice in the
analysis of a large-scale network in the Chicago region. Boyce and Zhang(23) use
multi-level programming to derive combined models. The papers mentioned
above present models of traffic assignment, combined mode choice and traffic
assignment, or combined O-D, mode choice and traffic assignment.
The requirements of the Clean Air Act (CAA) Amendments of 1990 forced a
reevaluation of travel forecasting procedures. New approaches have been
developed and used to satisfy CAA requirements and take advantage of the
increasing computing power. These approaches, including Dynamic Traffic
Assignment and microsimulation capabilities are discussed in more detail in the
following sections.
Several transportation planning software packages have been developed and are
currently used to automate the four-step process. Examples include QRS II,
EMME/2, TRANPLAN, MINUTP, and TP+, to mention a few.
The advent of geographic information system (GIS) technology has greatly
enhanced the efficiency and accuracy of network specification and coding. Most
of the transportation planning packages has the capability to integrate with GIS
and GIS-based applications have been developed. VIPER for example, TP+’s
graphical user interface, can also read and write Environmental Systems
Research Institute (ESRI) Shape files, which have emerged as a standard cross-
platform format for GIS systems, and convert between formats. GIS based
transportation planning packages include TransCAD and UFOSNET.
To estimate the environmental impacts of traffic and meet the requirements of
CAAA, results of the above models may be used within emissions estimation
models such as MOBILE (24). This approach to estimating emissions lacks
13
precision, since the above transportation planning models use average speed
estimates and is insensitive to traffic conditions. For a more accurate estimate of
vehicle emissions, dynamic assignment models may be used.
In most of the procedures used within the above software packages, flows of
vehicles and people through the network are not explicitly represented within the
time dimension, meaning that there is no attempt to estimate when a given
vehicle will actually travel over a given link. These procedures actually assume
that each vehicle is simultaneously located on every link on its chosen routes,
and they assign all flow “simultaneously” to all links on the chosen route. This is
obviously an unrealistic assumption because each vehicle can be on only one
link at a time and each vehicle must travel through time as well as space as it
moves from its origin to its destination. (25) For many regional transportation
planning applications, the static assignment might be acceptable and, with a
properly validated network, can yield useful results. For certain applications,
however, such as detailed emissions modeling and traffic operations modeling,
the static representation of network performance is not sufficiently accurate.
Many dynamic assignment software packages are emerging at varying levels of
commercial availability. Examples include DYNASMART(26), VISTA(27),
INTEGRATION(28), PARAMICS(29), and TRANSIMS(30). As one of the
requirements of this study was to take a closer look into the relatively newly
developed program TRANSIMS, a report including a comprehensive review and
experiences from its applications is included in Appendix A. The modeling
philosophy of TRANSIMS is unique as compared to the other software packages
that are being reviewed herein. For this purpose, TRANSIMS has not been
included in the software review and summary matrix sections that follow.
Advancement in the area of freight transportation modeling is very limited
compared to passenger models. There are many similarities between passenger
and freight modeling processes, however, there are also distinct differences,
which need to be addressed in the freight planning process. Models that have
been developed for strategic planning of freight transportation are presented in
14
Guélat et al.(31) and Crainic et al.(32). The focus of the first paper is on the
representation of a multimode multiproduct network. The second paper presents
a strategic rail-modeling framework. Models presented in both papers were
implemented in an interactive-graphic system for the strategic analysis and
planning of national freight transportation systems called STAN.
There were several early developments in modeling freight network. (See references
33,34, 35, 36 and 37.) Friesz et al. presents an excellent overview of these
developments and provides the most analytically sophisticated model for
predicting freight flows. (See references 38, 39, and 40) The model called the “freight
network equilibrium model” (FNEM) explicitly treats the decisions of both
shippers and carriers for an intermodal freight network with nonlinear cost and
delay functions that vary with commodity volumes to model congestion
externalities. Harker and Friesz(41, 42) tied together the concepts of spatial price
equilibrium and shipper-carrier equilibrium in a model called the “Generalized
Spatial Price Equilibrium Model” (GSPEM). GSPEM is probably the most
complete predictive model of freight transportation.
Currently, there are no transportation modeling approaches which account for
both passenger and freight considerations. Some of the transportation planning
packages that were reviewed in this section has the flexibility to account for
freight flows. Typically, however, for these types of applications, major
modifications of the existing models are required and caution should be
exercised to develop meaningful models. Planning agencies are now required to
include freight considerations in their planning process. As the increasing
population keeps spreading out and the Gross National Product keeps growing,
there is an expected increase in commercial vehicle activity interacting with
passenger activity and this needs to be considered in transportation models.
The European Experience
The most well known early European examples of equilibrium models were the
ones developed by the UK’s TRL (Transport and Road Laboratory) starting in the
15
early 1970s with the RRLTAP suite and, for strategic studies, the CRISTAL set of
equilibrium models.
Later, efforts were directed towards two (seemingly opposing) directions:
Application in the “European conditions” of the more sophisticated disaggregate
demand models that were first developed in the US, and
“Simplifications” of the conventional models, to achieve economies in the data
required and the computer power, or simply the expertise required
In the first category, the work of the Hague Consulting Group and the Free
University of Amsterdam, as well as of the University of Karslrue’s group in
Germany, are prominent among European researchers, but a number of other
“European applications” of disaggregate demand models is also very prominent
and merit specific study.
On the other hand, the drive to produce simplified models was directed by the
Organization for Economic Co-Operation and Development (OECD) in Paris. The
national reports (Urban Traffic Models, 1974) by seven of its member countries
(Belgium, Ireland, United Kingdom, Finland, Denmark, Canada, Spain) revealed
a concentrated effort at model simplification, directed towards five types of
simplification:
• Restriction to two trip purposes (home/work, and home/other).
• Adopting a less detailed level of traffic zoning (e.g. regional rather
than more detailed).
• Adopting “once- through” tree building and loading algorithms.
• Simplifications to the model formulas in order to incorporate all the
three first steps of the four-step process into one, and
• Simplifications related to the data collection methods and the use of
models developed in other urban areas.
16
At the same time and in parallel to the above two distinct trends, national
governments encouraged researchers towards the development of special types
of models to meet national or local needs. The most prominent examples are the
German and Scandinavian efforts to produce “National” models1. The principal
characteristics of these models were that they were built around conventional
model techniques and incorporated many “simplification” features especially in
the data collection stage as well as in the “aggregation” levels used in the
modeling.
At the European Union’s (EU) level, the Directorate General for Transport and
Energy (DG TREN, former DG VII) has funded some very interesting work too,
on modeling in the field of Transport. In the 1980s most of this (EU funded) work
focused on developing models of transport demand (passenger and freight) on
all member countries. The models used were of the “conventional” four-step type,
but were based on a concentrated effort by all 12-member states (at that time)
with data collection, modeling and evaluation. A European passenger and freight
demand forecasting model framework was set up in DG VII. This framework
formed the basis for all planning and forecasting work within the Commission
through the 1980s.
In the 1990s the modeling work within the EU, has been combined with a parallel
effort to produce benchmarking indices and quality indicators in the field of
transport, especially Urban Transport. The European Commission has thus
funded a number of projects starting with its “4th Framework Program of
Research and Development” (4th FP, 1994-98) centered on modeling and
benchmarking, and focusing on both scientific and technical aspects of modeling
and benchmarking techniques. Examples include project Improved Structure and
Organization for urban Transport Operations of Passengers in Europe
1 Examples are to be found in the work promoted by the Technical University of Aachen (published in the Proceedings of the Scientific Workshops organised regularly in the 70s and 80s by the Traffic Engineering section of this University, also in the work funded by the Federal Ministry of Transport of Germany – see for example the various Schriftenreiche “Forrschung Stadtverkehr” of the BundesMinisterium fur Verkehr)
17
(ISOTOPE), comprised of the description and comparison of existing urban
transport models as well as of the organizational structures for public transport
operations in urban areas in the European countries. Another example is the
project Quality Approach in Tendering/Contracting Urban Public Transport
Operations (QUATTRO), designed to make recommendations to authorities,
operators and manufacturers in order to improve quality in public transport,
including the use of forecasting models and benchmarking.
On another level the European Committee for Standardization (Committee
Europeene de Normalization - CEN) set up its Transport Working Groups under
the general title Transport Committee 278 (TC278) which included a sub group
on modeling. Further work was funded under the 5th Framework Program (1999-
2001), which is due to finish at the end of 2001. Examples are the project State-
of-the-Art in Benchmarking of Quality in Public Transport (EQUIP), which
performed among other activities reviews of the methodologies and indicators
used for forecasting passenger transport demand and categorized the
methodologies and indicators.
A parallel effort from private enterprises has produced transportation modeling
products that are well known and used in the US transportation industry.
Examples include PARAMICS and OMNITRANS. OMNITRANS is compatible
with INTEGRATION, which is a microsimulation software package. Compatibility
between OMNITRANS and INTEGRATION makes switching back and forth
between static and dynamic models an easy operation. This capability is also
available through the integration between VISSIM and VISUM.
Similar to experiences in the U.S., freight transport has not received an equal
level of attention by European researchers as the modeling of passenger
transport demand. Examples of freight transport modeling remain scarce. A most
notable effort is the work carried out at the University of Trieste in Italy, and the
Italian Center for Research in Transport (CSST) based in Turin. A set of freight
18
transport demand models was developed and tested in Italy in the mid 90’s with
data from the Italian traffic census.
The Transportation Planning Process
Initial transportation planning studies focused on the development of a
comprehensive highway plan. Over the years the above perspective has been
changed to develop a comprehensive plan for the transportation system as a
whole. In addition to this change, which puts emphasis on the various modes of
transportation, greater emphasis has been attempted on the integration of land
use and transportation plans, and the comprehensive evaluation of policy
alternatives. Some of the major objectives of these studies include provision of
comprehensive and continuing guidance for the development, evaluation, and
implementation of future transportation in urban-rural activities; the
comprehensive evaluation of alternative planning policies, and the allocation of
priorities for future investment and development.
There is abundance of transportation planning models in existence, ranging from
regional travel demand models that are mainly concerned with the movement of
a large number of individuals in a regional system, to discrete traffic models that
are concerned with the movements of individuals in a smaller subsystem. For a
thorough review of the transportation planning process, the reader may see
Stopher and Meyburg (43), 1975 and Chang and Meyers, 1999. (44)
Regional Travel Demand Models
Regional travel demand models examine the mass movement of persons within
a study area and are an integral part of, and input to transportation investment
decisions. Regional travel demand modeling along with travel forecasting
analysis is used in:
• Conceptual engineering and planning to size facilities and estimate
capital costs.
19
• Transit operations planning to determine operating policies and
estimate operating costs.
• Financial analysis to forecast fares and toll revenues.
• Environmental analysis to examine the impacts from region wide air
quality to congestion on individual highway links.
The regional travel demand models are based on observed data, which is used
to develop, calibrate and validate the evolved models. The following section
briefly covers the data elements required for the development of any regional
travel demand model.
Inventory and Data Requirements
Inventory comprises the development of databases for evaluating existing travel
demand and existing transportation performance, and a basis for predicting
demand and future system requirements. This is crucial in establishing the base
conditions for the models that are to be developed.
Data collection includes information on zoning of the local area, land use data,
demographic and economic data, inventory of supply of transportation facilities
and travel desires and demands within the study area.
Land Use Models
Land use and transportation are closely inter-related. Transportation has a major
impact on land use and hence should be considered when a land use plan is
developed. A modeling approach to land use allocation can be used to determine
the impact of transportation facilities on growth patterns. Allocations are usually
determined based on availability of open land use and accessibility that is
provided from a proposed transportation plan. The modeling process finds a
balance between supply and demand for both land use and transportation. It
indicates how land use change is driven by changes in the transportation system.

20
Four Step Planning Process
Models are continually adapting, changing and improving with new research
advances, as well as demands placed upon them. The traditional and sequential
“four-step process” is still used in the majority of planning purposes. The steps
that are generally considered part of the four-step sequential process include: trip
generation, trip distribution, mode choice and traffic assignment. (See references 45, 46
and 47)
Discrete Models
Discrete modeling allows the analysis of individual movements of traffic at the
microscopic level, while the regional travel demand model allows analysis at a
macroscopic level. There are numerous factors that often play a significant role in
determining whether a regional transportation model should be developed or if
another analysis tool should be used, including cost and time resources and level
of detail required. A discrete model may analyze corridors in a region and provide
information down to the individual intersection level, while most regional travel
demand models use a metropolitan region as the study area. The two main types
of discrete modeling include traffic simulation and site traffic analysis. (46)
GIS and Transportation Planning Models
In recent years, efforts have been made to integrate geographic information
system (GIS) technology with transportation modeling. GIS may assist in building
transportation networks and traffic analysis zones (TAZs). GIS technology has
made it easier to perform sub-area analysis and to modify the TAZ structure.
Transportation agencies use GIS for network coding and socioeconomic data
manipulation, and to display data from travel forecasting models. GIS
applications in transportation planning are primarily in the following three areas:
preparation of input data for traffic demand modeling, establishment of an
integrated database, and displaying of modeling output. (48)
21
Emissions Models
The 1990 Clean Air Act Amendments (CAA) require analysis of transportation
programs for conformity with air quality implementation plans in regions that are
in non-compliance with clean air standards. To examine conformity of
transportation plans, Metropolitan Planning Organizations (MPOs) and other
agencies rely on computer models simulating the interaction between
transportation and land use.
EPA’s mobile source emission estimation tools and underlying emission factors
focus on the estimation of mobile source emissions based on average operating
characteristics over broad geographical areas. Other notable efforts are the
Comprehensive Modal Emissions Model (CMEM) developed by UC Riverside
under NCHRP Project 25-11; TRANSIMS, under development by Los Alamos
National Laboratory through the U.S. Department of Transportation; and
MEASURE, developed by Georgia Tech under cooperative agreement with
EPA’s Office of Research and Development. The MOBILE6 vehicle emission
factor model is a software tool for predicting gram per mile emissions of HC, CO,
NOx, PM, and toxics from cars, trucks, and motorcycles under various
conditions.
Limitations of Transportation Planning Models
Currently there are no uniform standards laid for determining model accuracy. A
thorough review of all input data is necessary before using it within a model.
Likewise, all output from any model should be reviewed for reasonableness
before officially declaring the results of the model. Furthermore, since all planning
software packages and models have their own modeling approaches and
assumptions, the user must be aware of all these assumptions and limitations of
the model.
22
Models versus Software Packages
There exists an important distinction between transportation planning models and
transportation planning software packages. (46) Models serve as analysis tools for
transportation planners and they aid decision-makers in evaluating alternative
proposals for a transportation issue. Models are basically mathematical
equations that are established by research and practical efforts. They represent
some aspects of traveler behavior or transportation system and are important
because transportation plans and investments are based on what the models say
about future travel. Model estimates are the basis for transportation plans and
are used in major investment analysis, environmental impact statements and in
setting priorities for investments. (49)
A transportation software package is a tool to implement transportation models
already developed. Usually, a transportation-planning model is made up of
several sub models (e.g., trip generation, trip distribution, mode choice, trip
assignment). (46) Mathematical models can be used to represent each of these
sub-models. These mathematical models are then implemented in various
transportation planning software packages.
Interconnectivity of Subsystems and their relation to Transportation
Analysis
The transportation infrastructure of a region is part of a complex system.
Transportation, land use patterns, the environment, the economy, and society
are all interconnected subsystems that depend on and interact with each other.
To model these interconnected subsystems independently from each other fails
to acknowledge the significant dependence of one subsystem on another.
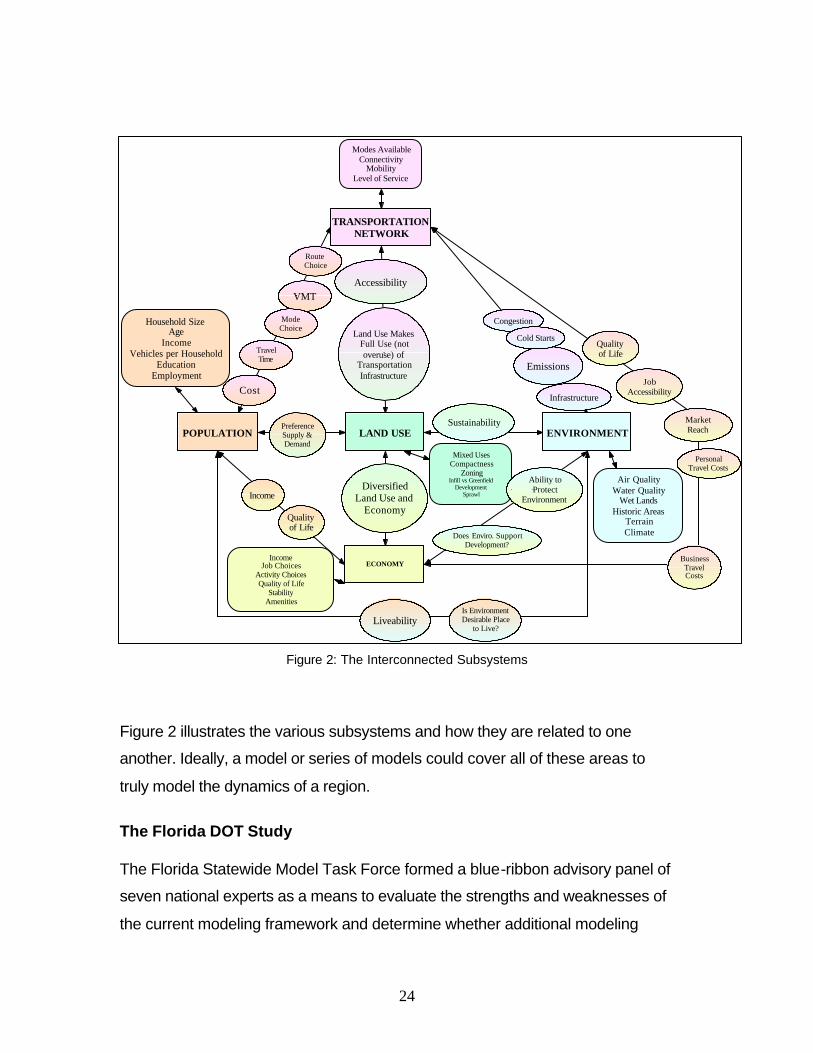
This section identifies five different models or subsystems that are to combine
together to describe the interconnectedness of each subsystem into one model.
These subsystems are the transportation network, land use patterns, population,
the environment, and the economy. The transportation network includes the
23
transportation supply provided by the multimodal network. The land use patterns
contribute to the demand placed on the land use patterns. The population
subsystem describes the social patterns of the society and also affects the
demand placed on the network. The quality of the environment is affected by
emissions and water quality. Finally, the economy is dependent on how efficient
the transportation network is in meeting the needs of the land use patterns and
population of the study area.
Due to legislation such as ISTEA and the Clean Air Act Amendments, there is
increasing pressure on state and local planning agencies to improve their
modeling abilities to include these important relationships. However, many of the
current tools available excel in modeling only one or two of the subsystems
described above. Other software programs require output from other models to
model a particular subsystem. The interconnectivity of software packages used
to model each subsystem is based on the easiness with which the output from
one model may provide input to the following one. To be able to evaluate the
interconnectivity among the various packages, one must be able to understand
the issues involved and the problems modeled within each step.
24
Figure 2: The Interconnected Subsystems
Figure 2 illustrates the various subsystems and how they are related to one
another. Ideally, a model or series of models could cover all of these areas to
truly model the dynamics of a region.
The Florida DOT Study
The Florida Statewide Model Task Force formed a blue-ribbon advisory panel of
seven national experts as a means to evaluate the strengths and weaknesses of
the current modeling framework and determine whether additional modeling
TRANSPORTATIONNETWORK
ECONOMY
ENVIRONMENTLAND USEPOPULATION
Congestion
Infrastructure
Emissions
Cold Starts
Modes AvailableConnectivity
MobilityLevel of Service
Household SizeAge
IncomeVehicles per Household
EducationEmployment
Mixed UsesCompactness
ZoningInfill vs Greenfield
DevelopmentSprawl
Air QualityWater Quality
Wet LandsHistoric Areas
TerrainClimate
IncomeJob Choices
Activity ChoicesQuality of Life
StabilityAmenities
Ability toProtect
Environment
Sustainability
Liveability
VMT
PreferenceSupply &Demand
Income
BusinessTravelCosts
MarketReach
PersonalTravel Costs
Qualityof Life
JobAccessibility
DiversifiedLand Use and
Economy
Land Use MakesFull Use (notoveruse) of
TransportationInfrastructure
RouteChoice
Cost
TravelTime
ModeChoice
Qualityof Life
Accessibility
Does Enviro. SupportDevelopment?
Is EnvironmentDesirable Place
to Live?
25
methods and tools should be added to their Florida Standard Urban
Transportation Model Structure (FSUTMS). FSUTMS is a uniform framework,
which is used to run models in all metropolitan areas in the State of Florida.
The blue ribbon panel identified transportation model functionality and software
system criteria. There are many considerations when selecting a software
platform for transportation modeling. The important questions/criteria identified by
the panel include:
• How does it interface with other software?
• How does it store data and what are the Input-Output routines?
• What is the processing speed?
• How does it build highway and transit paths?
• What are the GIS and spatial analysis capabilities it poses?
• How does it edit the network?
• How does it generate reports?
• How are different components of the model tied together?
• How are scripts customized?
• How does it calculate matrices and link flows?
• What are the component applications?
• What is the operating system?
• How is everything displayed?
• How is it tied into other Florida Models?
The project steering committee considered the following four software packages:
• TransCAD (Caliper Corporation)
• CUBE/TP+/Voyager (Citilabs)
• VISUM (ITC/PTV)
• EMME/2 (INRO Consultants)
26
Two software packages were selected for further evaluation. Both Caliper
Corporation and Citilabs provided some updated materials for TransCAD and
CUBE/Voyager. Following the receipt of all of the materials, the consultant team
of the steering committee was given specific assignments with regard to the
testing and evaluation of TransCAD and CUBE/Voyager. After the evaluation and
the national survey among the users that followed, the software packages were
even, meaning that both were good enough to be selected. Since only one could
be selected, each committee member was asked to vote for one particular
software package and from that procedure TransCAD was selected to be used in
FSUTMS.
LIST OF SOFTWARE PACKAGES
Criteria for Software Package Selection
The software packages that were considered in this research were selected
based on several criteria, including their uses, functions, dimensions and the
aims of their models. Criteria on the uses of the software packages include the
following:
• Considered to be the current state-of-the-practice for transportation
planning.
• Capable of modeling traffic operations, analysis, review, and
application of traffic data to the operation of transportation facilities.
• Capable of modeling traffic design that incorporates the
determination of travel patterns and parking characteristics of
transportation users in the planning and design of transportation
facilities.
• Consider the application of land use and economic data in the
development of policies for financing transportation improvement.
• Capable of modelling issues such as the development of toll roads,
the evaluation of measures for congestion containment, the noise
27
and pollution impact of urban traffic, the development of transit
services, and freight planning.
• Capable of interfacing with GIS database and applications.
Regarding the functions of their models, the software packages may be used for
description, prediction and forecasting. Description comprises the use of a model
in the location where it was calibrated and for circumstances that are not
changed from those that exist at the time of calibration. Prediction is the process
of estimating the changes in the performance of the system being modeled that
result from changes in the characteristics of that system. Forecasting is the use
of a model to estimate system performance for a specified time in the future,
usually for the location where the model was calibrated.
Various dimensions or categories of models are helpful in determining their
appropriate uses in the transportation planning process. Eight dimensions may
be proposed to describe, in a formalized manner, the types of models that may
be constructed. These are:
Descriptive, Predictive or Planning Models: Descriptive Models replicate relevant
features of an existing phenomenon. They give no key to future predictions, but
help generate reliable values of hard-to-measure variables from considerably
easier-to-measure variables. Predictive Models provide relationships between
the various features of a system. The Planning Models instead of just predicting
what will occur in the future incorporate an attempt to evaluate the model
outputs.
Deterministic or Probabilistic Models: Deterministic Models specify the actual
outcome of events. The outcome of the model is that an event either occurs or
does not occur. Probabilistic Models will indicate a probability of certain
outcomes, as a result of certain causes.
Analytical, Statistical or Simulation Models: An Analytical or Statistical solution
can be obtained when the system to be modeled exhibits a tight logical structure
28
and the internal functional relationships within the system are uncomplicated by
discontinuities. When a system cannot be evaluated using analytical or statistical
models, simulation is used. A Simulation Model specifies an inventory of possible
events and indicates the immediate consequences of each event for one or more
variables.
Cross Sectional or Temporal Models: In Cross-Sectional models time is not
considered as an element and it is assumed that the temporal dependence of the
phenomenon is to be determined exogenously. A Temporal Model considers time
as an essential element of the entire modeling process. For such models a set of
data over a considerable time period is required.
Aggregate or Disaggregate Models: At an Aggregate Model the collective
behavior and properties of a phenomenon (group of people, stream of vehicles
etc.) are modeled. At a Disaggregate level the actual behavior of each separate
element of the model population is considered.
Unidirectional or Multidirectional Models: A Unidirectional model considers a
single cause and effect process that acts in one consistent direction. A
Multidirectional model allows interactions to occur in any direction throughout the
system.
Analogue, Homomorphic or Isomorphic Models: In an Analogue model
mathematical techniques are employed to define a precise relationship between
an existing phenomenon and the particular system or phenomenon being
modeled. A Homomorphic model behaves like the process that is being
considered but not necessarily for the same reason. An Isomorphic form models
the process exactly by finding the causes and effects and simulating the
interactions between them.
Forward or Backward - Seeking Models: A Forward-seeking model is a goal-
seeking model that moves forward to find what alternatives may exist as a result
of present actions. It allows the planner to seek the options that will result in the
29
process of achieving desired goals. A Backward-seeking model starts with goals
and attempts to determine the methods that can be used to achieve these
desired goals.
Software Package Classification
The software packages that have been selected for the purpose of this research
may be broadly classified under the following application areas:
• Transportation Planning.
• Traffic Simulation.
• Mobile Emissions Modeling.
• Under Development Software Packages.
Furthermore, they have been selected such as to cover a wide spectrum of the
above-mentioned criteria.
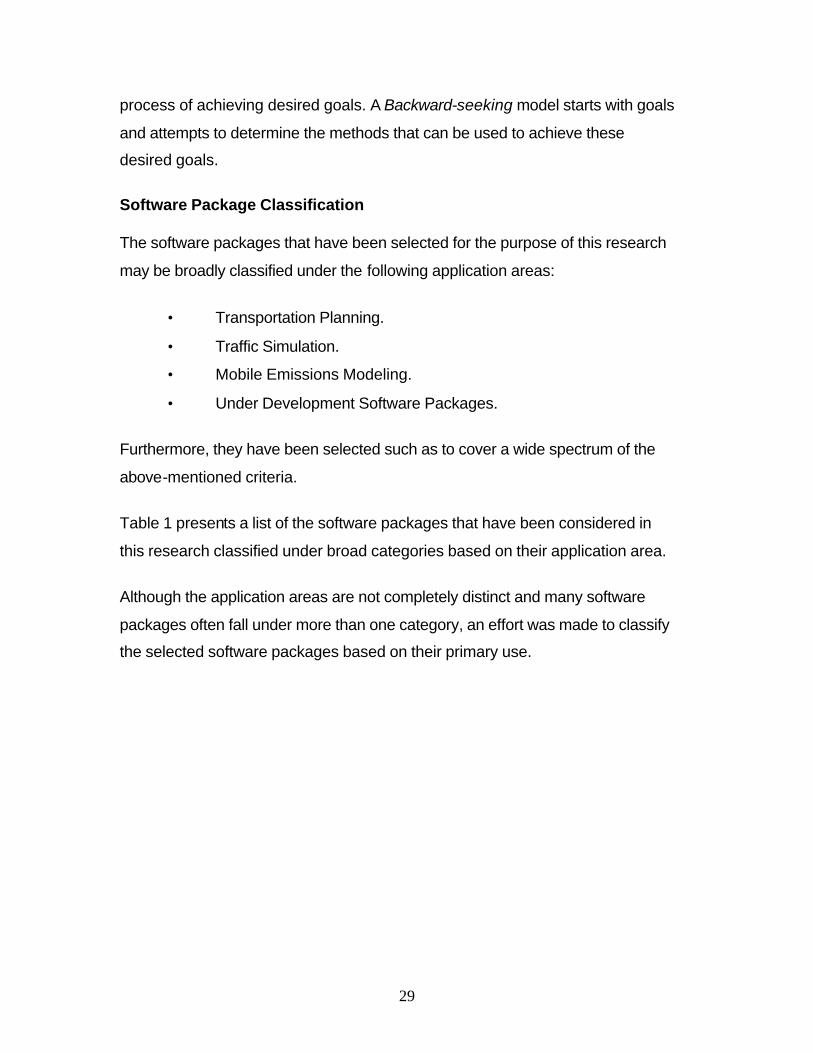
Table 1 presents a list of the software packages that have been considered in
this research classified under broad categories based on their application area.
Although the application areas are not completely distinct and many software
packages often fall under more than one category, an effort was made to classify
the selected software packages based on their primary use.
30
Table 1: List of Software Packages
Transportation Planning
Traffic Simulation
Common Features
Emissions Modeling
Under Development
CUBE INTEGRATION MOBILE 6 DynaMIT
EMME/2 CORSIM PPSUITE Dynasmart-P ESTRAUS PARAMICS CMEM Dynasmart-X MEPLAN VISSIM MEASURE VISTA
METROPILUS ROUTESIM CAL3QHC
METROSIM WATSIM
MINUTP SYNCHRO NODUS SATURN
OMNITRANS QRS II STAN
TMODEL TP+
TRANPLAN TRANSCAD
TRANUS
TRIPS
UFOSNET URBANSIM
VIPER VISUM
-Developer - Brief Description - Application Areas - Product History - Current Version / Release - Documentation - Availability and License Cost - Modeling Approach - Input Requirements - Outputs - Pre Processors - Post Processors - Maximum Dimension Limits - Strengths - Limitations - Minimum Computer and Hardware Requirements - Recommended Hardware Specifications - Operating System and Environment Requirement and Compatibility - Program Languages
List of Features
A set of features was selected to better organize the review of the software
packages and to assist in their comparative evaluation. Features that are
common for all software packages are listed in Table 1. Additional features,
which depend on the software package category, are shown in Table 2.
31
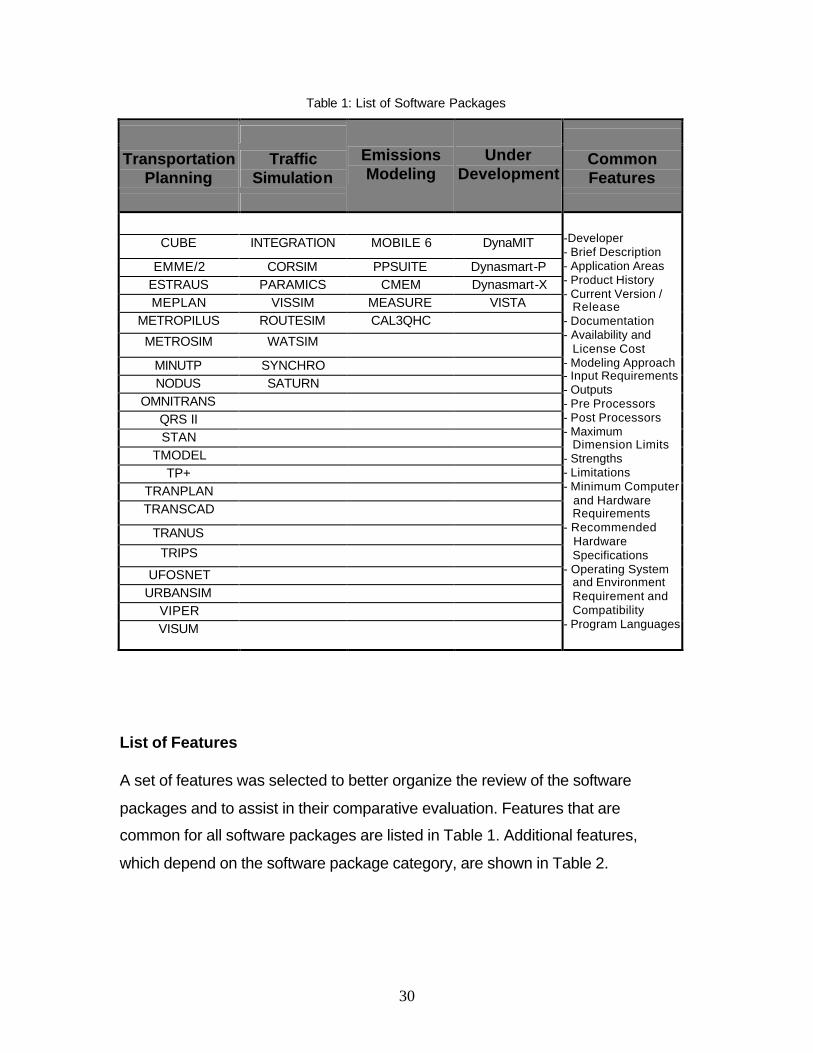
Table 2: List of Unique Features of Software Packages
UNIQUE FEATURES
TRANSPORTATION PLANNING
TRAFFIC SIMULATION
Network planning Traffic Signals
O-D matrix estimation Ramp Metering
Trip generation Incident
Management
Trip distribution Traffic Modeling/info
Mode choice Parking
Trip assignment Toll plaza modeling
Land use Congestion Pricing
Freight applications Pedestrians/cyclists
Vehicle routing/logistics Emissions modeling
Commercial vehicles Measures of effectiveness
Public transit
Carpooling
Roundabouts
Ramps
Intersections
Intermodal transportation
A comprehensive review of the selected software packages based on these
features has been performed and the information collected has been
summarized in a matrix format, as described in the following section.
SOFTWARE MATRIX
A matrix has been developed, to organize and present the information for each
software package and for each feature that was considered. This matrix,
developed in Excel, initially listed software packages in the columns and their
features in the rows of a worksheet. Because of the content and the amount of
information summarized under each feature, a workbook format was used
instead.
32
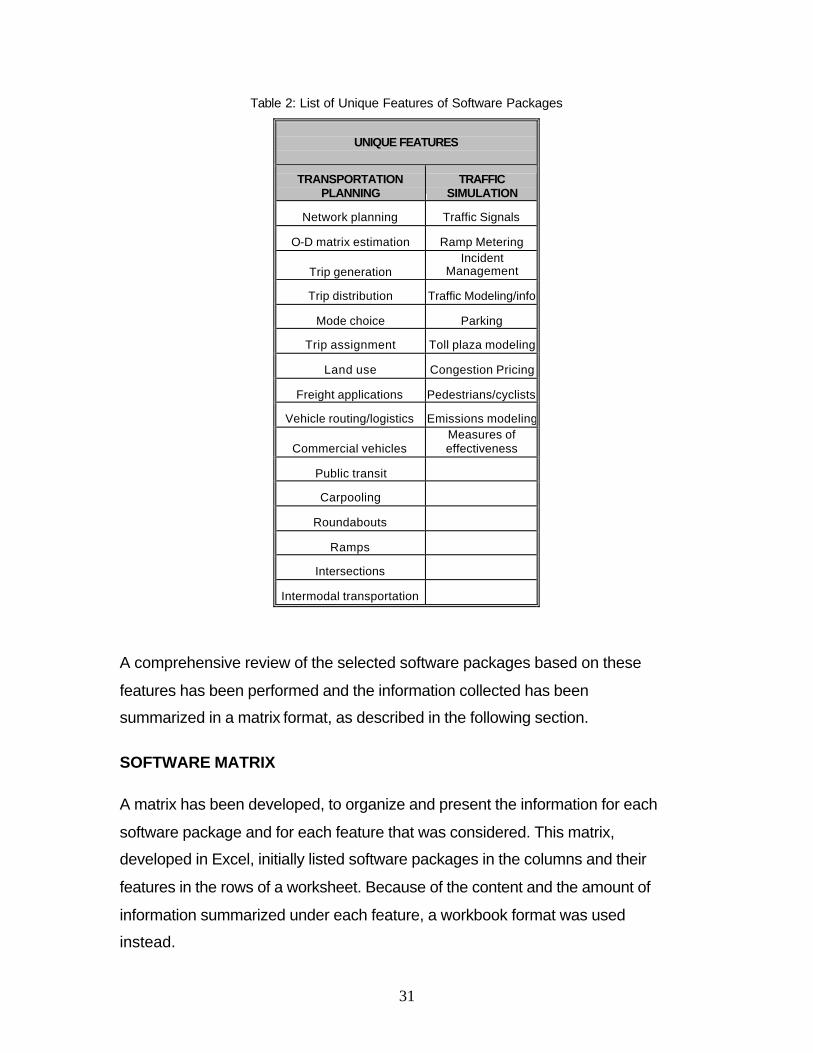
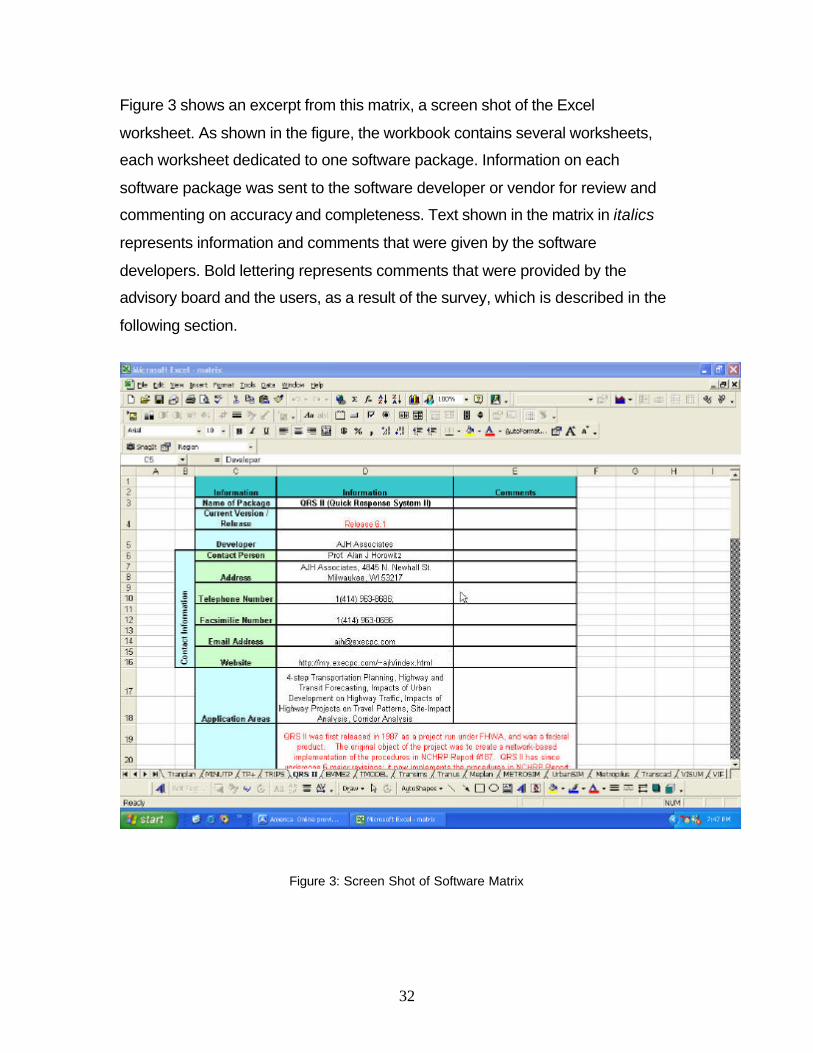
Figure 3 shows an excerpt from this matrix, a screen shot of the Excel
worksheet. As shown in the figure, the workbook contains several worksheets,
each worksheet dedicated to one software package. Information on each
software package was sent to the software developer or vendor for review and
commenting on accuracy and completeness. Text shown in the matrix in italics
represents information and comments that were given by the software
developers. Bold lettering represents comments that were provided by the
advisory board and the users, as a result of the survey, which is described in the
following section.
Figure 3: Screen Shot of Software Matrix
33
The matrix can be found in Appendix B. The Appendix summarizes information
on each software package, including history, application areas, availability and
cost, modeling approach, input, output, pre- and postprocessors, strengths,
limitations, and computer requirements.
To present this important information in a user-friendly manner and to facilitate
comparative evaluation of the software packages, an interactive tool was
developed using Visual Basic 6.0. Using this tool, user-selected data is extracted
from a Microsoft Access database and is presented in a concise form. The
Visual Basic interface serves as front end to the MS Access database. This
application is part of a Transportation Modeling Needs Assessment Tool, which
is presented at a later section in this report.
TRANSPORTATION SOFTWARE PACKAGE USER SURVEY
Introduction and Purpose of the Survey
As part of this project a survey was conducted to determine the current usage
and state-of-the-art tools in transportation modeling software. This survey intends
to determine the user’s perspective, emphasizing the strengths and limitations of
various software packages and predicting the future trends and directions of
transportation modeling. The survey analysis establishes the current use of
software packages, compares the traditional modeling processes and programs
with next generation alternatives and makes recommendations on which ones
are likely to become the next industry standard.
Survey Design
Seven questions were asked in the survey along with the name and address of
the contact person. Based upon respondents’ request, detailed contact
information is not presented in the survey analysis. The type of responding
organization, such as private consulting firms or public agencies is used instead.
Any questions in the survey that the responses of which tended to point out the
name of the responding organization were not considered in the analysis.
34
In general, questions included in the survey instrument intended to gather
information on the following aspects:
• Names of software packages used by the responding organizations
according to the categories Transportation Planning, Traffic
Simulation, Land Use, Integrated Traffic Simulation and Planning
Models, Integrated Transportation Planning and Land Use Models,
Vehicle Emissions Modeling, ITS Planning, Facilities Design Data,
and Transportation Facility / Plan Evaluations: Highway Capacity
Manual Software.
• Models developed in-house by the organization including primary
use and application area, year of development, commercial and
educational availability and license cost if commercially available.
• Additional information on the packages listed in Question 2, such
as duration of usage, latest version used and scale of use.
• Reasons for purchasing the software packages used by the
respondent. The respondent was asked if the program was
selected because it is:
• Approved/Recommended by Local/National transportation body
• Used by the respondent’s collaborators.
• Widely used or is considered to be an industry standard.
• Respondents’ experience with the software packages they are
currently using. This includes the strengths and limitations of each
package, problems encountered in its usage, familiarity with
alternative packages and willingness to use alternative packages
and which ones.
• Respondents’ awareness of any software packages that are
currently under development and their willingness to adopt them.
Specifically, this question sought to determine the respondents’
view of TRANSIMS, a new product with a very different modeling
philosophy when compared to the existing ones.
35
The survey instrument is attached in Appendix C.
Survey Distribution and Collection
The survey instrument was sent to professionals in consulting firms and
government agencies such as state DOTs, MPOs, and transit agencies. A
population of 234 contacts was initially considered. The questionnaire was sent
via email and follow up phone calls were placed.
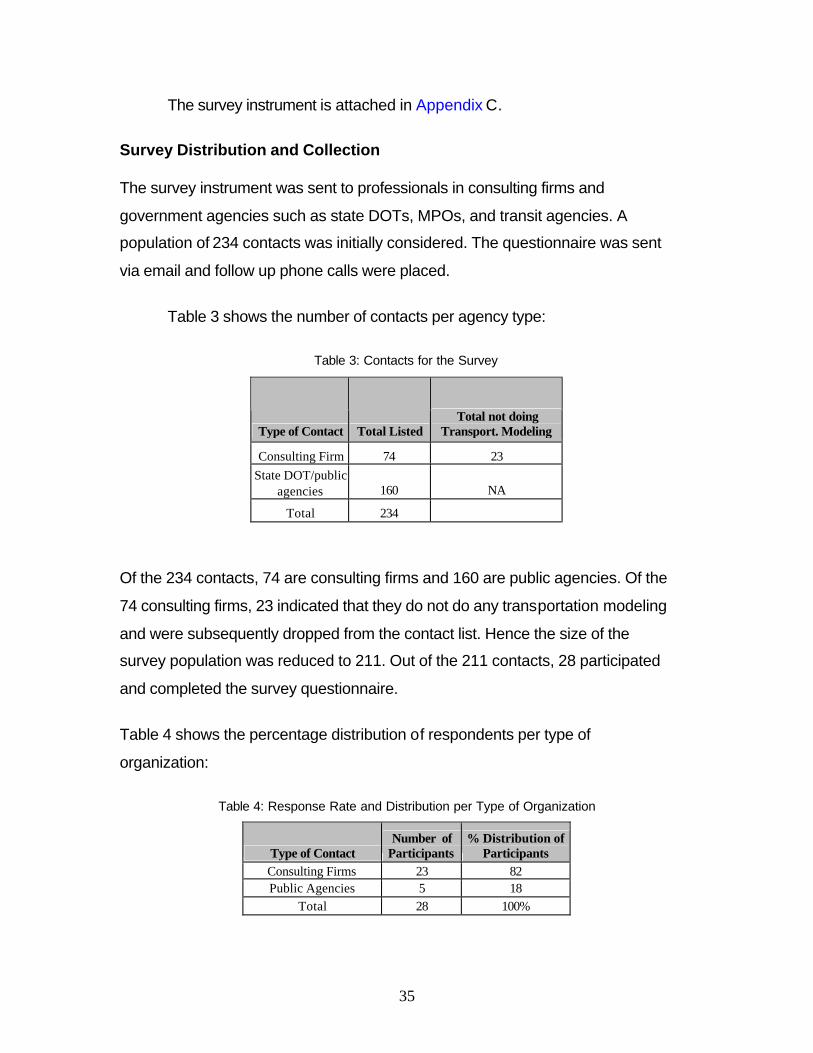
Table 3 shows the number of contacts per agency type:
Table 3: Contacts for the Survey
Type of Contact Total Listed Total not doing
Transport. Modeling
Consulting Firm 74 23 State DOT/public
agencies 160 NA
Total 234
Of the 234 contacts, 74 are consulting firms and 160 are public agencies. Of the
74 consulting firms, 23 indicated that they do not do any transportation modeling
and were subsequently dropped from the contact list. Hence the size of the
survey population was reduced to 211. Out of the 211 contacts, 28 participated
and completed the survey questionnaire.
Table 4 shows the percentage distribution of respondents per type of
organization:
Table 4: Response Rate and Distribution per Type of Organization
Type of Contact Number of
Participants % Distribution of
Participants Consulting Firms 23 82 Public Agencies 5 18
Total 28 100%
36
The total response rate is 13.2 percent. Eighty-two percent of the respondents
(23 participants) are from consulting firms while 18 percent (5 participants) are
from public agencies. Based on the above distribution, one should expect that
the survey results reflect primarily the view of private consulting firm
professionals. Furthermore, it should be noted that the vast majority of the
respondents are based in New Jersey or have activities in the state, thus, the
survey reflects primarily the views of New Jersey based professionals. Overall,
because of the small number of responses and the focus on New Jersey firms,
one should not consider the survey results to be conclusive. However, as shown
from the following analysis, the survey produced some interesting findings in
terms of general trends in transportation modeling.
Survey Analysis
Of the 28 questionnaires that were returned, two were sent by fax, one via
regular mail, and the rest via email. Response data was entered into Microsoft
Excel. Every fifth response entered was checked for data-entry accuracy. If a
respondent marked more than one choice in a survey question that asked for one
choice only, the respondent was called back to identify the single most applicable
choice. The lack of response was counted and reported as did not respond.
The small sample size should be kept in mind when using the survey results.
However, the respondents are representative of who is using the transportation
software packages in New Jersey, and the results are useful when making
decisions regarding the future of transportation modeling in New Jersey.
Level of Operation of Respondent’s Organization
The majority of the respondents operate at the national and statewide level. This
is logical as most of the respondents represent consulting firms that work at this
level. State DOT’s operate at the statewide level, while transit authorities
reported operations at the local or regional level. Finally, MPO’s operate at the
regional level.
37
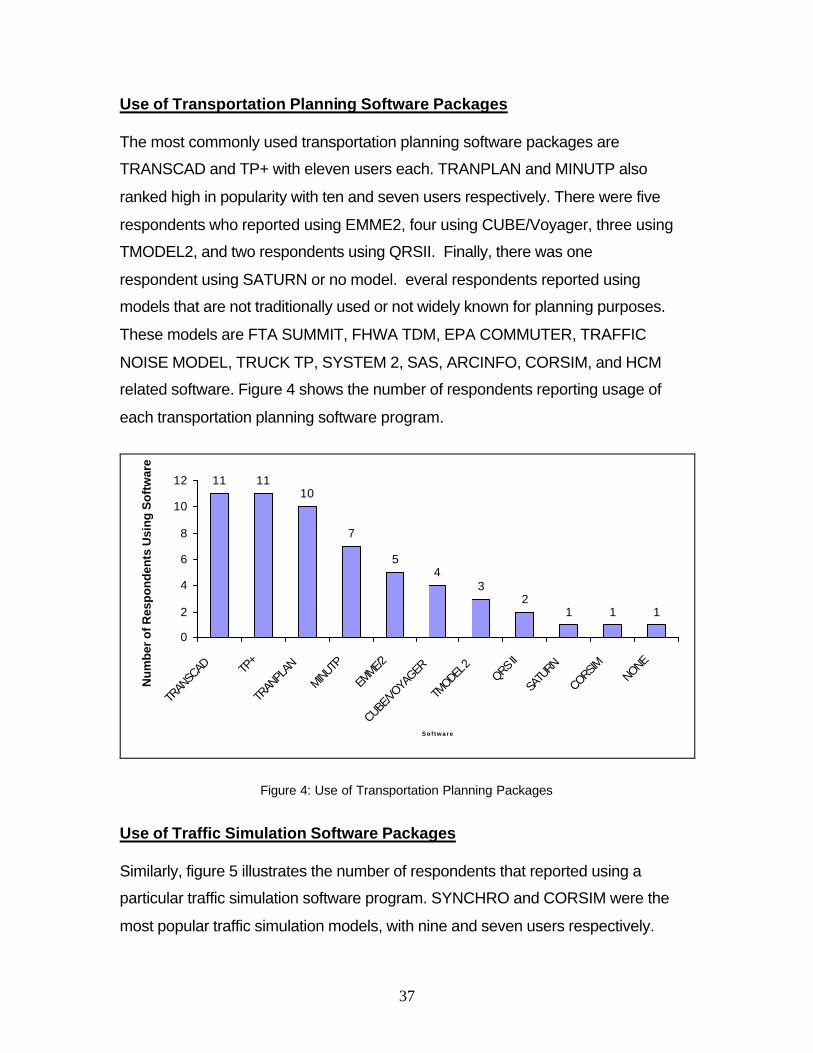
Use of Transportation Planning Software Packages
The most commonly used transportation planning software packages are
TRANSCAD and TP+ with eleven users each. TRANPLAN and MINUTP also
ranked high in popularity with ten and seven users respectively. There were five
respondents who reported using EMME2, four using CUBE/Voyager, three using
TMODEL2, and two respondents using QRSII. Finally, there was one
respondent using SATURN or no model. everal respondents reported using
models that are not traditionally used or not widely known for planning purposes.
These models are FTA SUMMIT, FHWA TDM, EPA COMMUTER, TRAFFIC
NOISE MODEL, TRUCK TP, SYSTEM 2, SAS, ARCINFO, CORSIM, and HCM
related software. Figure 4 shows the number of respondents reporting usage of
each transportation planning software program.
11 1110
7
54
32
1 1 1
0
2
4
6
8
10
12
TRAN
SCAD TP
+
TRAN
PLAN
MINUTP
EMME/2
CUBE/VO
YAGER
TMODEL
2QRS I
I
SATU
RN
CORSIM NONE
S o f t w a r e
Nu
mb
er o
f Res
po
nd
ents
Usi
ng
So
ftw
are
Figure 4: Use of Transportation Planning Packages
Use of Traffic Simulation Software Packages
Similarly, figure 5 illustrates the number of respondents that reported using a
particular traffic simulation software program. SYNCHRO and CORSIM were the
most popular traffic simulation models, with nine and seven users respectively.
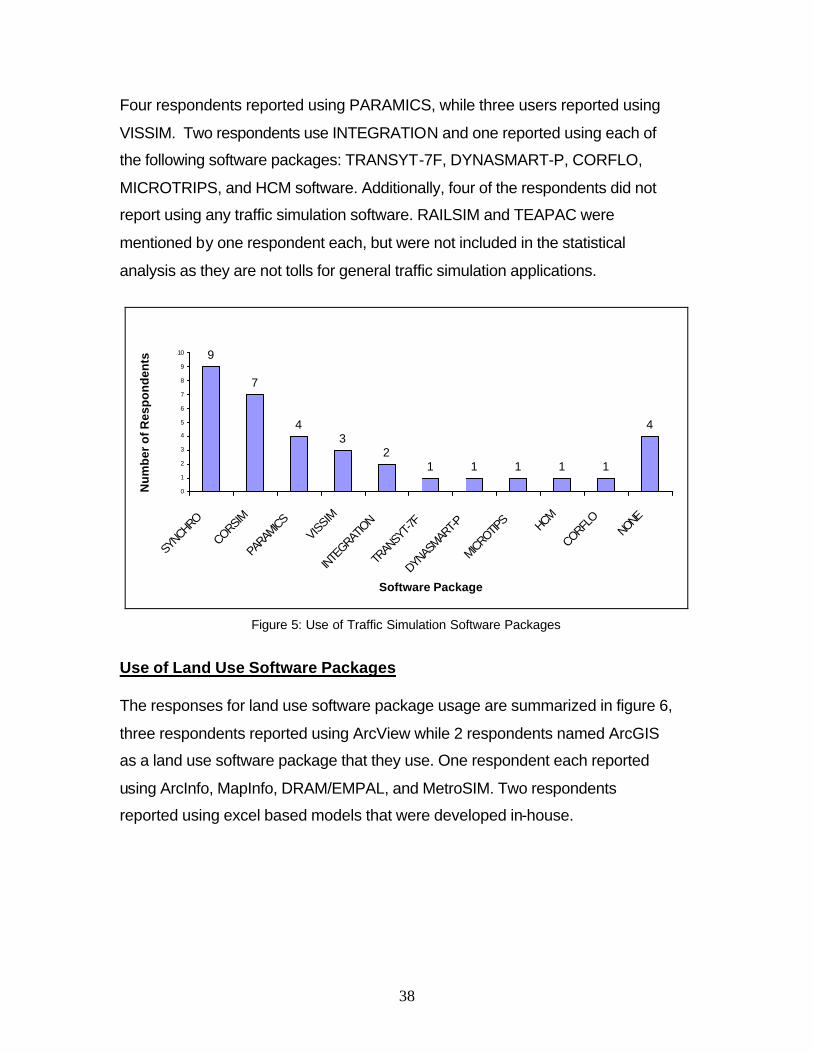
38
Four respondents reported using PARAMICS, while three users reported using
VISSIM. Two respondents use INTEGRATION and one reported using each of
the following software packages: TRANSYT-7F, DYNASMART-P, CORFLO,
MICROTRIPS, and HCM software. Additionally, four of the respondents did not
report using any traffic simulation software. RAILSIM and TEAPAC were
mentioned by one respondent each, but were not included in the statistical
analysis as they are not tolls for general traffic simulation applications.
9
7
43
21 1 1 1 1
4
0
1
2
3
4
5
6
7
8
9
10
SYNCHRO
CORSIM
PARAM
ICSVISSIM
INTEGRAT
ION
TRAN
SYT-7
F
DYNAS
MART-P
MICROTIPS HCM
CORFLO
NONE
Software Package
Nu
mb
er o
f Res
po
nd
ents
Figure 5: Use of Traffic Simulation Software Packages
Use of Land Use Software Packages
The responses for land use software package usage are summarized in figure 6,
three respondents reported using ArcView while 2 respondents named ArcGIS
as a land use software package that they use. One respondent each reported
using ArcInfo, MapInfo, DRAM/EMPAL, and MetroSIM. Two respondents
reported using excel based models that were developed in-house.
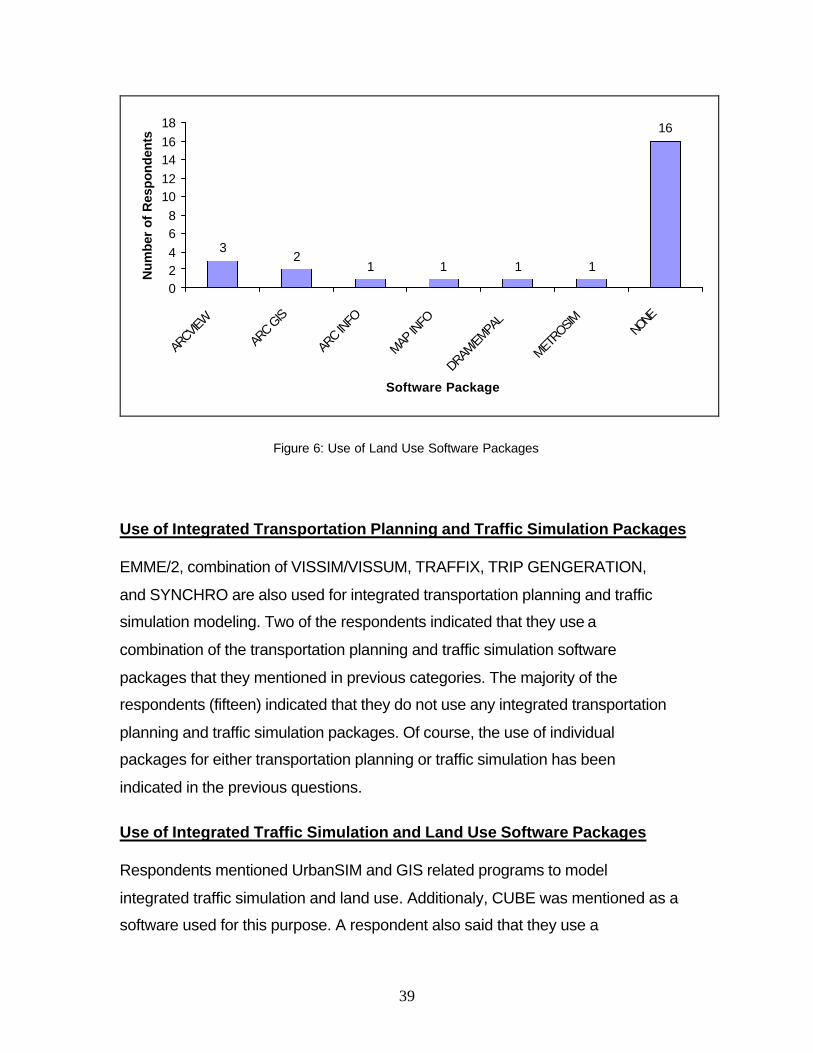
39
32
1 1 1 1
16
02468
1012141618
ARCVIE
W
ARC G
IS
ARC IN
FO
MAP IN
FO
DRAM/EM
PAL
METROSIM NO
NE
Software Package
Num
ber
of R
espo
nden
ts
Figure 6: Use of Land Use Software Packages
Use of Integrated Transportation Planning and Traffic Simulation Packages
EMME/2, combination of VISSIM/VISSUM, TRAFFIX, TRIP GENGERATION,
and SYNCHRO are also used for integrated transportation planning and traffic
simulation modeling. Two of the respondents indicated that they use a
combination of the transportation planning and traffic simulation software
packages that they mentioned in previous categories. The majority of the
respondents (fifteen) indicated that they do not use any integrated transportation
planning and traffic simulation packages. Of course, the use of individual
packages for either transportation planning or traffic simulation has been
indicated in the previous questions.
Use of Integrated Traffic Simulation and Land Use Software Packages
Respondents mentioned UrbanSIM and GIS related programs to model
integrated traffic simulation and land use. Additionaly, CUBE was mentioned as a
software used for this purpose. A respondent also said that they use a
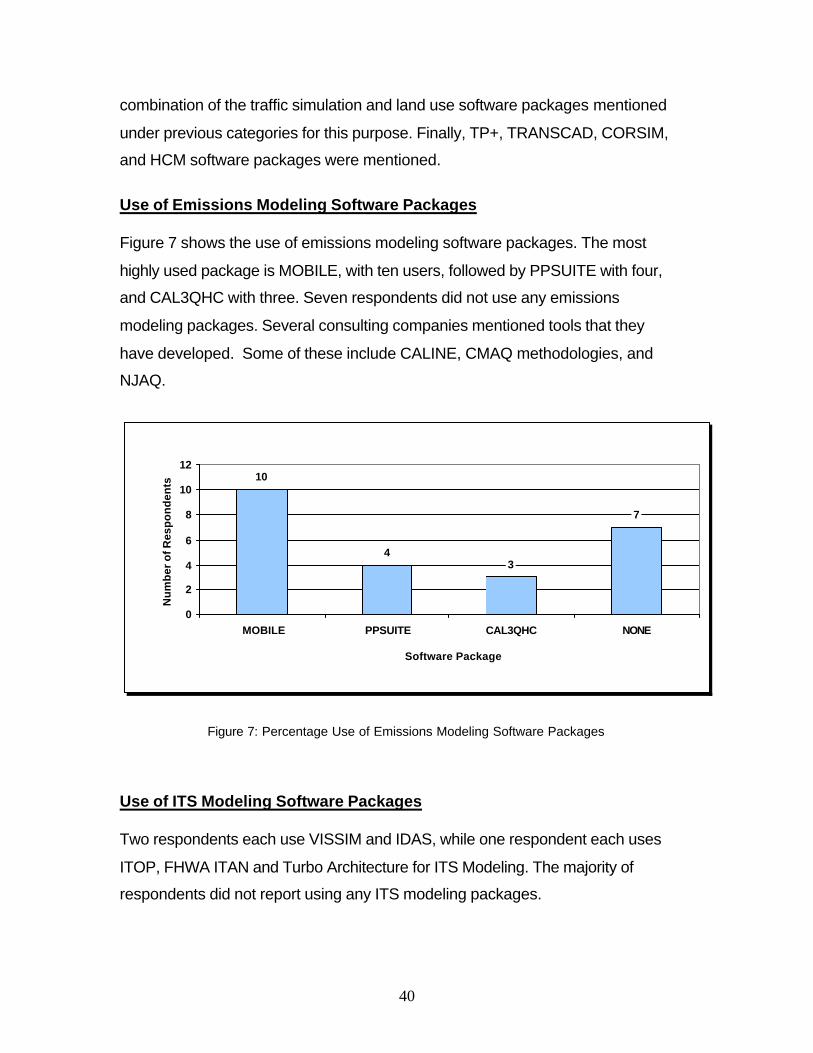
40
combination of the traffic simulation and land use software packages mentioned
under previous categories for this purpose. Finally, TP+, TRANSCAD, CORSIM,
and HCM software packages were mentioned.
Use of Emissions Modeling Software Packages
Figure 7 shows the use of emissions modeling software packages. The most
highly used package is MOBILE, with ten users, followed by PPSUITE with four,
and CAL3QHC with three. Seven respondents did not use any emissions
modeling packages. Several consulting companies mentioned tools that they
have developed. Some of these include CALINE, CMAQ methodologies, and
NJAQ.
10
43
7
0
2
4
6
8
10
12
MOBILE PPSUITE CAL3QHC NONE
Software Package
Nu
mb
er o
f Res
po
nd
ents
Figure 7: Percentage Use of Emissions Modeling Software Packages
Use of ITS Modeling Software Packages
Two respondents each use VISSIM and IDAS, while one respondent each uses
ITOP, FHWA ITAN and Turbo Architecture for ITS Modeling. The majority of
respondents did not report using any ITS modeling packages.
41
Use of Supporting Applications
Several additional software programs were listed as supporting applications.
Many of these listed were computer-programming languages such as C++ or
FORTRAN that could be used to develop interfaces between software packages.
Others were statistical analysis packages such as SAS and SPSS. Additionally,
specialized programs to model highway lighting and noise were mentioned under
this category.
Use of Software Packages in Years
Four intervals have been used to summarize the survey results on use of
software packages in years: 0 to 5 years, 6 to 10 years, 11 to 15 years, and over
15 years. Table 5 shows the number of responses indicating use of a particular
software package over a certain period of time. It should be noted that not all
software packages listed by respondents in Question 1 of the survey
questionnaire have been included in the responses related to the use of software
packages in years. If a software package is listed in those used by an
organization but the use in years has not been indicated, a NO RESPONSE
mark is assigned. In the following table, the interval with the highest response
rate is highlighted. It should also be noted that not all software packages have
been available for the over 15-year period considered in this analysis, as some of
them are newer products.
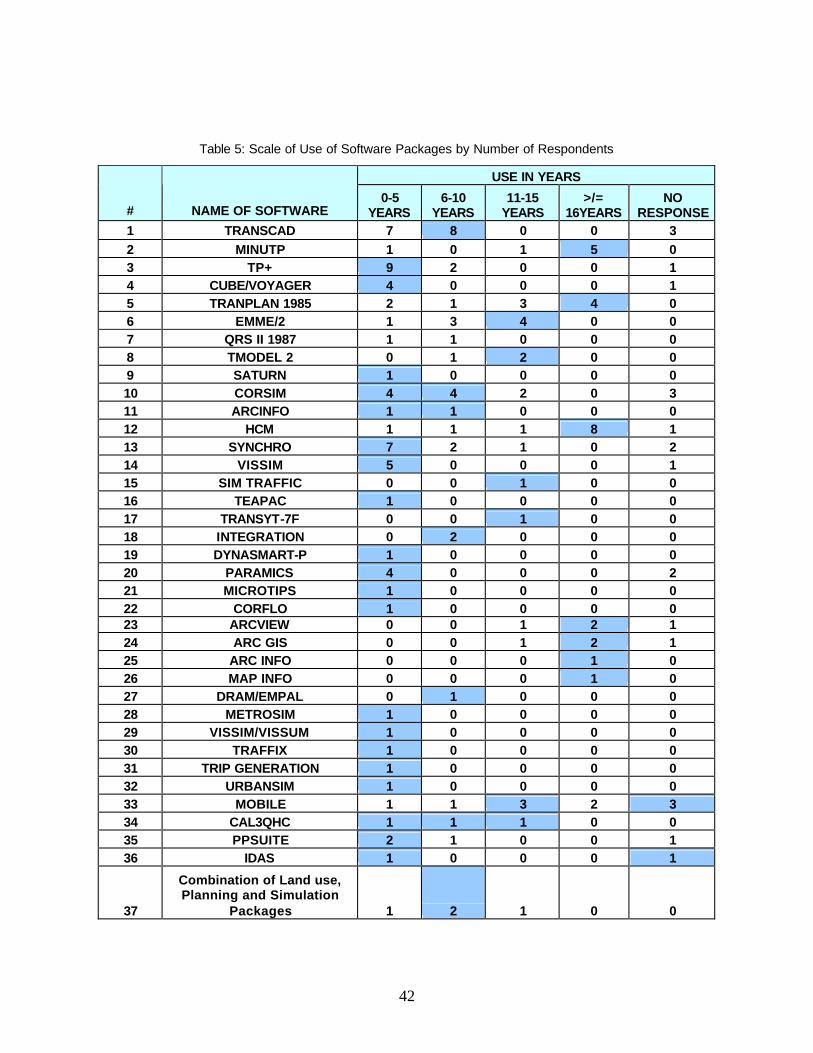
42
Table 5: Scale of Use of Software Packages by Number of Respondents
USE IN YEARS
# NAME OF SOFTWARE 0-5
YEARS 6-10
YEARS 11-15
YEARS >/=
16YEARS NO
RESPONSE 1 TRANSCAD 7 8 0 0 3 2 MINUTP 1 0 1 5 0 3 TP+ 9 2 0 0 1 4 CUBE/VOYAGER 4 0 0 0 1 5 TRANPLAN 1985 2 1 3 4 0 6 EMME/2 1 3 4 0 0 7 QRS II 1987 1 1 0 0 0 8 TMODEL 2 0 1 2 0 0 9 SATURN 1 0 0 0 0 10 CORSIM 4 4 2 0 3 11 ARCINFO 1 1 0 0 0 12 HCM 1 1 1 8 1 13 SYNCHRO 7 2 1 0 2 14 VISSIM 5 0 0 0 1 15 SIM TRAFFIC 0 0 1 0 0 16 TEAPAC 1 0 0 0 0 17 TRANSYT-7F 0 0 1 0 0 18 INTEGRATION 0 2 0 0 0 19 DYNASMART-P 1 0 0 0 0 20 PARAMICS 4 0 0 0 2 21 MICROTIPS 1 0 0 0 0 22 CORFLO 1 0 0 0 0 23 ARCVIEW 0 0 1 2 1 24 ARC GIS 0 0 1 2 1 25 ARC INFO 0 0 0 1 0 26 MAP INFO 0 0 0 1 0 27 DRAM/EMPAL 0 1 0 0 0 28 METROSIM 1 0 0 0 0 29 VISSIM/VISSUM 1 0 0 0 0 30 TRAFFIX 1 0 0 0 0 31 TRIP GENERATION 1 0 0 0 0 32 URBANSIM 1 0 0 0 0 33 MOBILE 1 1 3 2 3 34 CAL3QHC 1 1 1 0 0 35 PPSUITE 2 1 0 0 1 36 IDAS 1 0 0 0 1
37
Combination of Land use, Planning and Simulation
Packages 1 2 1 0 0
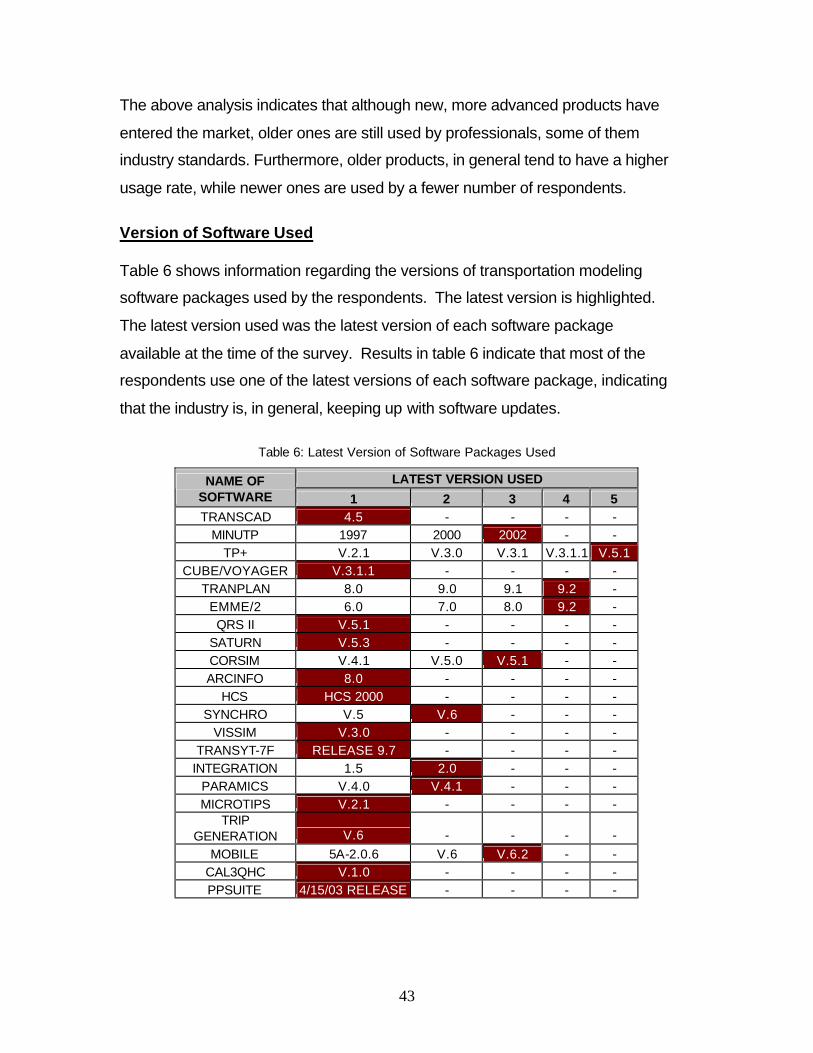
43
The above analysis indicates that although new, more advanced products have
entered the market, older ones are still used by professionals, some of them
industry standards. Furthermore, older products, in general tend to have a higher
usage rate, while newer ones are used by a fewer number of respondents.
Version of Software Used
Table 6 shows information regarding the versions of transportation modeling
software packages used by the respondents. The latest version is highlighted.
The latest version used was the latest version of each software package
available at the time of the survey. Results in table 6 indicate that most of the
respondents use one of the latest versions of each software package, indicating
that the industry is, in general, keeping up with software updates.
Table 6: Latest Version of Software Packages Used
LATEST VERSION USED NAME OF SOFTWARE 1 2 3 4 5 TRANSCAD 4.5 - - - -
MINUTP 1997 2000 2002 - - TP+ V.2.1 V.3.0 V.3.1 V.3.1.1 V.5.1
CUBE/VOYAGER V.3.1.1 - - - - TRANPLAN 8.0 9.0 9.1 9.2 -
EMME/2 6.0 7.0 8.0 9.2 - QRS II V.5.1 - - - -
SATURN V.5.3 - - - - CORSIM V.4.1 V.5.0 V.5.1 - - ARCINFO 8.0 - - - -
HCS HCS 2000 - - - - SYNCHRO V.5 V.6 - - -
VISSIM V.3.0 - - - - TRANSYT-7F RELEASE 9.7 - - - -
INTEGRATION 1.5 2.0 - - - PARAMICS V.4.0 V.4.1 - - - MICROTIPS V.2.1 - - - -
TRIP GENERATION V.6 - - - -
MOBILE 5A-2.0.6 V.6 V.6.2 - - CAL3QHC V.1.0 - - - - PPSUITE 4/15/03 RELEASE - - - -
44
Scale of Use of Software Packages by Region
Table 7 indicates the scale of use of each software package, meaning that it
determines whether the program is used for Single Road (SR), Regional (R),
Corridor (CO), Project Board (PB), Intersection (I), City (CI), State Wide (SW), or
other level of analysis. The maximum number of responses in each category is
highlighted.
The results below indicate which packages are most commonly used for what
level of analysis. This information may be used in combination with the
description of the features of the software packages when selecting a set of tools
to cover a company’s or an organization’s modeling needs.
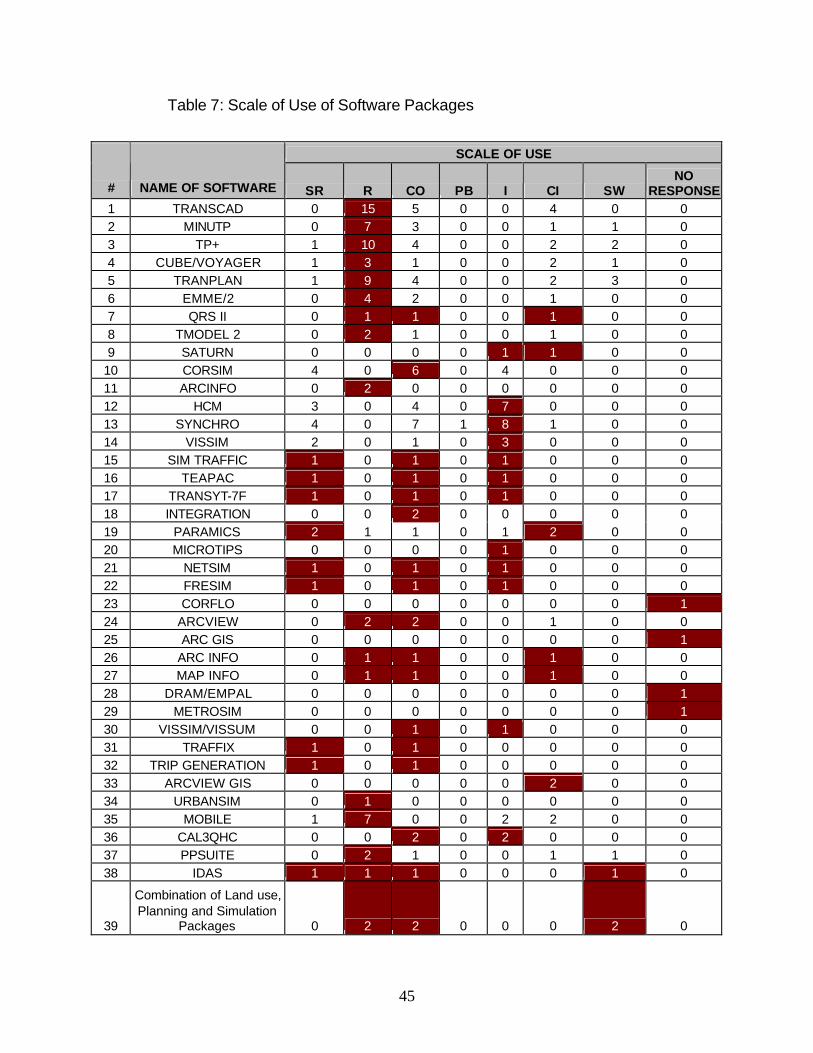
45
Table 7: Scale of Use of Software Packages
SCALE OF USE
# NAME OF SOFTWARE SR R CO PB I CI SW NO
RESPONSE 1 TRANSCAD 0 15 5 0 0 4 0 0 2 MINUTP 0 7 3 0 0 1 1 0 3 TP+ 1 10 4 0 0 2 2 0 4 CUBE/VOYAGER 1 3 1 0 0 2 1 0 5 TRANPLAN 1 9 4 0 0 2 3 0 6 EMME/2 0 4 2 0 0 1 0 0 7 QRS II 0 1 1 0 0 1 0 0 8 TMODEL 2 0 2 1 0 0 1 0 0 9 SATURN 0 0 0 0 1 1 0 0
10 CORSIM 4 0 6 0 4 0 0 0 11 ARCINFO 0 2 0 0 0 0 0 0 12 HCM 3 0 4 0 7 0 0 0 13 SYNCHRO 4 0 7 1 8 1 0 0 14 VISSIM 2 0 1 0 3 0 0 0 15 SIM TRAFFIC 1 0 1 0 1 0 0 0 16 TEAPAC 1 0 1 0 1 0 0 0 17 TRANSYT-7F 1 0 1 0 1 0 0 0 18 INTEGRATION 0 0 2 0 0 0 0 0 19 PARAMICS 2 1 1 0 1 2 0 0 20 MICROTIPS 0 0 0 0 1 0 0 0 21 NETSIM 1 0 1 0 1 0 0 0 22 FRESIM 1 0 1 0 1 0 0 0 23 CORFLO 0 0 0 0 0 0 0 1 24 ARCVIEW 0 2 2 0 0 1 0 0 25 ARC GIS 0 0 0 0 0 0 0 1 26 ARC INFO 0 1 1 0 0 1 0 0 27 MAP INFO 0 1 1 0 0 1 0 0 28 DRAM/EMPAL 0 0 0 0 0 0 0 1 29 METROSIM 0 0 0 0 0 0 0 1 30 VISSIM/VISSUM 0 0 1 0 1 0 0 0 31 TRAFFIX 1 0 1 0 0 0 0 0 32 TRIP GENERATION 1 0 1 0 0 0 0 0 33 ARCVIEW GIS 0 0 0 0 0 2 0 0 34 URBANSIM 0 1 0 0 0 0 0 0 35 MOBILE 1 7 0 0 2 2 0 0 36 CAL3QHC 0 0 2 0 2 0 0 0 37 PPSUITE 0 2 1 0 0 1 1 0 38 IDAS 1 1 1 0 0 0 1 0
39
Combination of Land use, Planning and Simulation
Packages 0 2 2 0 0 0 2 0
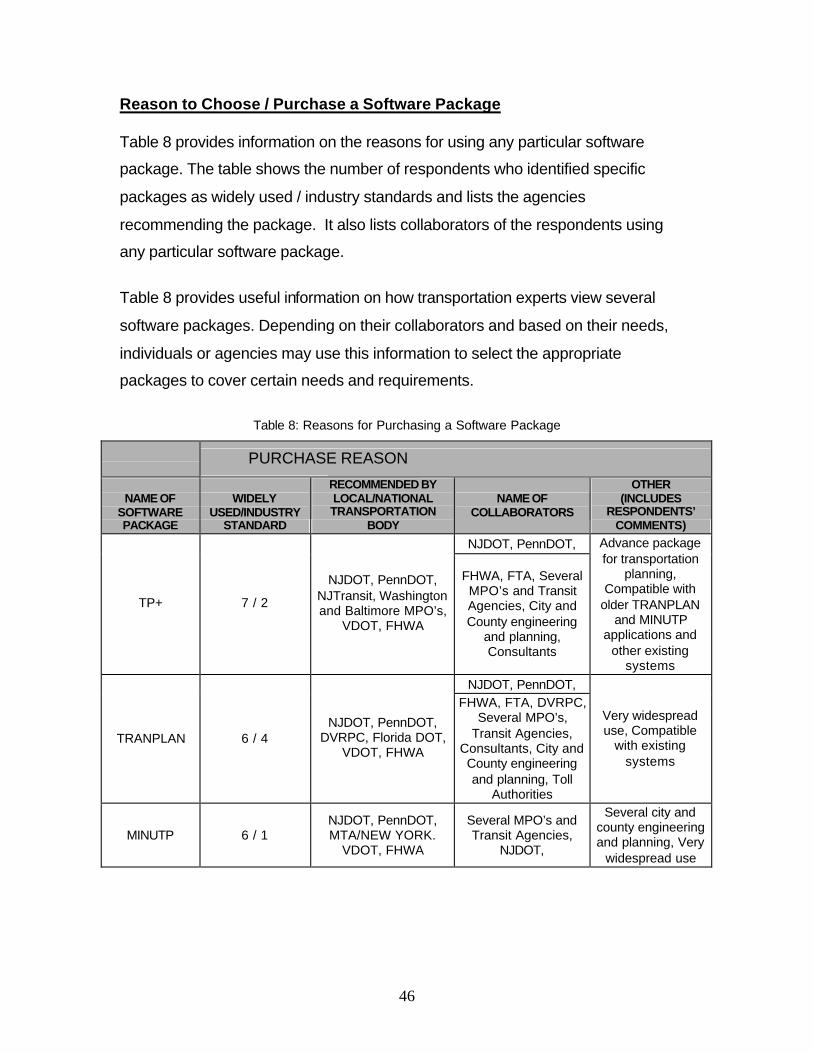
46
Reason to Choose / Purchase a Software Package
Table 8 provides information on the reasons for using any particular software
package. The table shows the number of respondents who identified specific
packages as widely used / industry standards and lists the agencies
recommending the package. It also lists collaborators of the respondents using
any particular software package.
Table 8 provides useful information on how transportation experts view several
software packages. Depending on their collaborators and based on their needs,
individuals or agencies may use this information to select the appropriate
packages to cover certain needs and requirements.
Table 8: Reasons for Purchasing a Software Package
PURCHASE REASON
NAME OF SOFTWARE PACKAGE
WIDELY USED/INDUSTRY
STANDARD
RECOMMENDED BY LOCAL/NATIONAL TRANSPORTATION
BODY
NAME OF COLLABORATORS
OTHER (INCLUDES
RESPONDENTS’ COMMENTS)
NJDOT, PennDOT,
TP+ 7 / 2
NJDOT, PennDOT, NJTransit, Washington and Baltimore MPO’s,
VDOT, FHWA
FHWA, FTA, Several MPO’s and Transit Agencies, City and County engineering
and planning, Consultants
Advance package for transportation
planning, Compatible with
older TRANPLAN and MINUTP
applications and other existing
systems NJDOT, PennDOT,
TRANPLAN 6 / 4 NJDOT, PennDOT,
DVRPC, Florida DOT, VDOT, FHWA
FHWA, FTA, DVRPC, Several MPO’s,
Transit Agencies, Consultants, City and County engineering and planning, Toll
Authorities
Very widespread use, Compatible
with existing systems
MINUTP 6 / 1 NJDOT, PennDOT, MTA/NEW YORK.
VDOT, FHWA
Several MPO’s and Transit Agencies,
NJDOT,
Several city and county engineering and planning, Very
widespread use
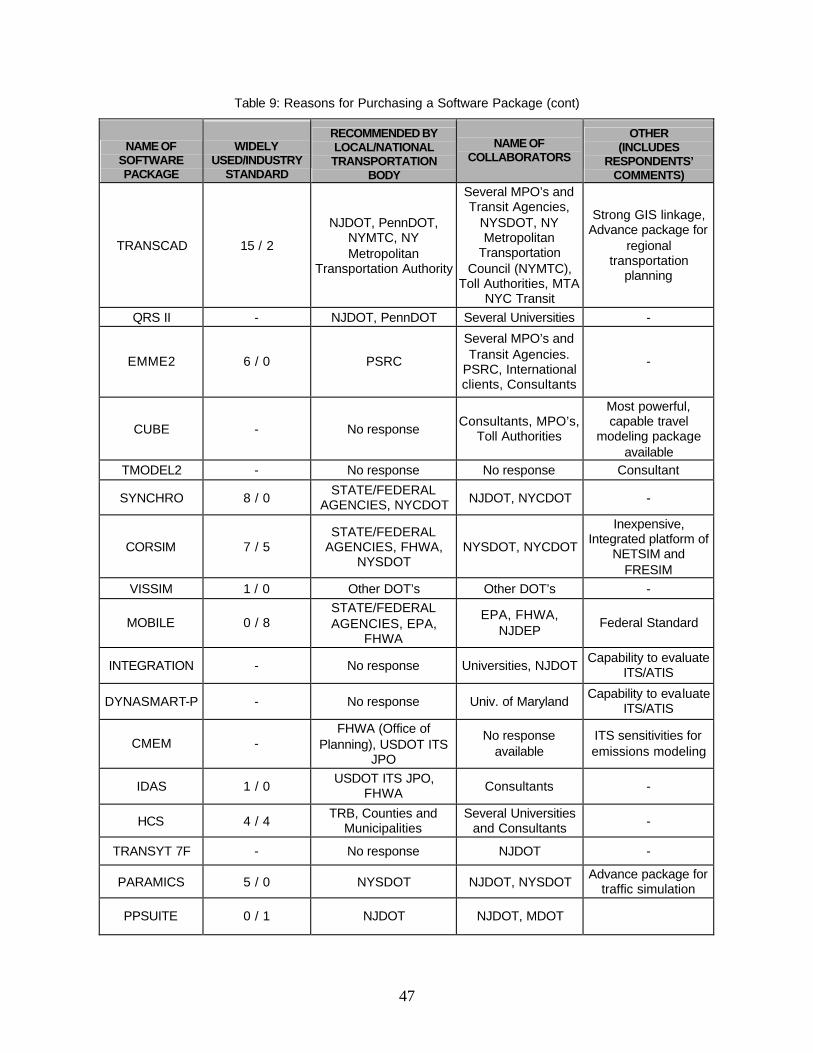
47
Table 9: Reasons for Purchasing a Software Package (cont)
NAME OF SOFTWARE PACKAGE
WIDELY USED/INDUSTRY
STANDARD
RECOMMENDED BY LOCAL/NATIONAL TRANSPORTATION
BODY
NAME OF COLLABORATORS
OTHER (INCLUDES
RESPONDENTS’ COMMENTS)
TRANSCAD 15 / 2
NJDOT, PennDOT, NYMTC, NY Metropolitan
Transportation Authority
Several MPO’s and Transit Agencies,
NYSDOT, NY Metropolitan
Transportation Council (NYMTC),
Toll Authorities, MTA NYC Transit
Strong GIS linkage, Advance package for
regional transportation
planning
QRS II - NJDOT, PennDOT Several Universities -
EMME2 6 / 0 PSRC
Several MPO’s and Transit Agencies.
PSRC, International clients, Consultants
-
CUBE - No response Consultants, MPO’s,
Toll Authorities
Most powerful, capable travel
modeling package available
TMODEL2 - No response No response Consultant
SYNCHRO 8 / 0 STATE/FEDERAL
AGENCIES, NYCDOT NJDOT, NYCDOT -
CORSIM 7 / 5 STATE/FEDERAL
AGENCIES, FHWA, NYSDOT
NYSDOT, NYCDOT
Inexpensive, Integrated platform of
NETSIM and FRESIM
VISSIM 1 / 0 Other DOT’s Other DOT’s -
MOBILE 0 / 8 STATE/FEDERAL AGENCIES, EPA,
FHWA
EPA, FHWA, NJDEP
Federal Standard
INTEGRATION - No response Universities, NJDOT Capability to evaluate
ITS/ATIS
DYNASMART-P - No response Univ. of Maryland Capability to evaluate
ITS/ATIS
CMEM - FHWA (Office of
Planning), USDOT ITS JPO
No response available
ITS sensitivities for emissions modeling
IDAS 1 / 0 USDOT ITS JPO,
FHWA Consultants -
HCS 4 / 4 TRB, Counties and
Municipalities Several Universities
and Consultants -
TRANSYT 7F - No response NJDOT -
PARAMICS 5 / 0 NYSDOT NJDOT, NYSDOT Advance package for
traffic simulation
PPSUITE 0 / 1 NJDOT NJDOT, MDOT
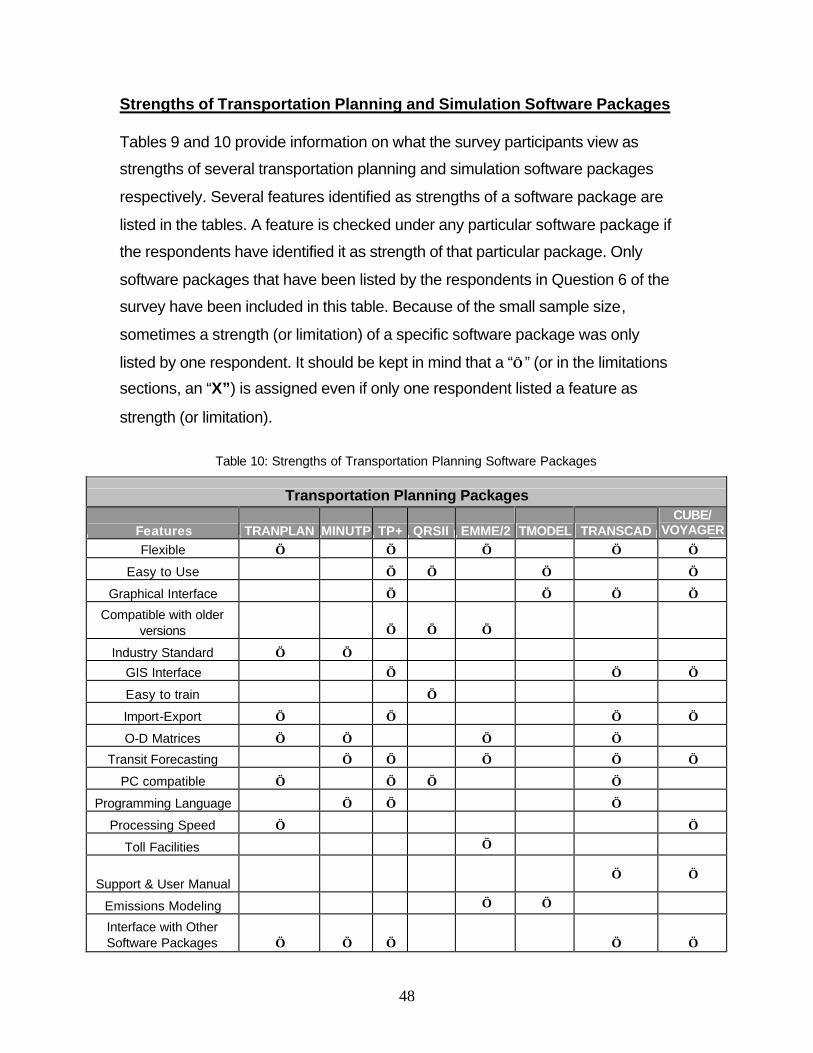
48
Strengths of Transportation Planning and Simulation Software Packages
Tables 9 and 10 provide information on what the survey participants view as
strengths of several transportation planning and simulation software packages
respectively. Several features identified as strengths of a software package are
listed in the tables. A feature is checked under any particular software package if
the respondents have identified it as strength of that particular package. Only
software packages that have been listed by the respondents in Question 6 of the
survey have been included in this table. Because of the small sample size,
sometimes a strength (or limitation) of a specific software package was only
listed by one respondent. It should be kept in mind that a “√ ” (or in the limitations
sections, an “X”) is assigned even if only one respondent listed a feature as
strength (or limitation).
Table 10: Strengths of Transportation Planning Software Packages
Transportation Planning Packages
Features TRANPLAN MINUTP TP+ QRSII EMME/2 TMODEL TRANSCAD CUBE/
VOYAGER
Flexible √ √ √ √ √
Easy to Use √ √ √ √
Graphical Interface √ √ √ √
Compatible with older versions √ √ √
Industry Standard √ √ GIS Interface √ √ √
Easy to train √ Import-Export √ √ √ √
O-D Matrices √ √ √ √ Transit Forecasting √ √ √ √ √
PC compatible √ √ √ √ Programming Language √ √ √
Processing Speed √ √
Toll Facilities √
Support & User Manual √ √
Emissions Modeling √ √
Interface with Other Software Packages √ √ √ √ √
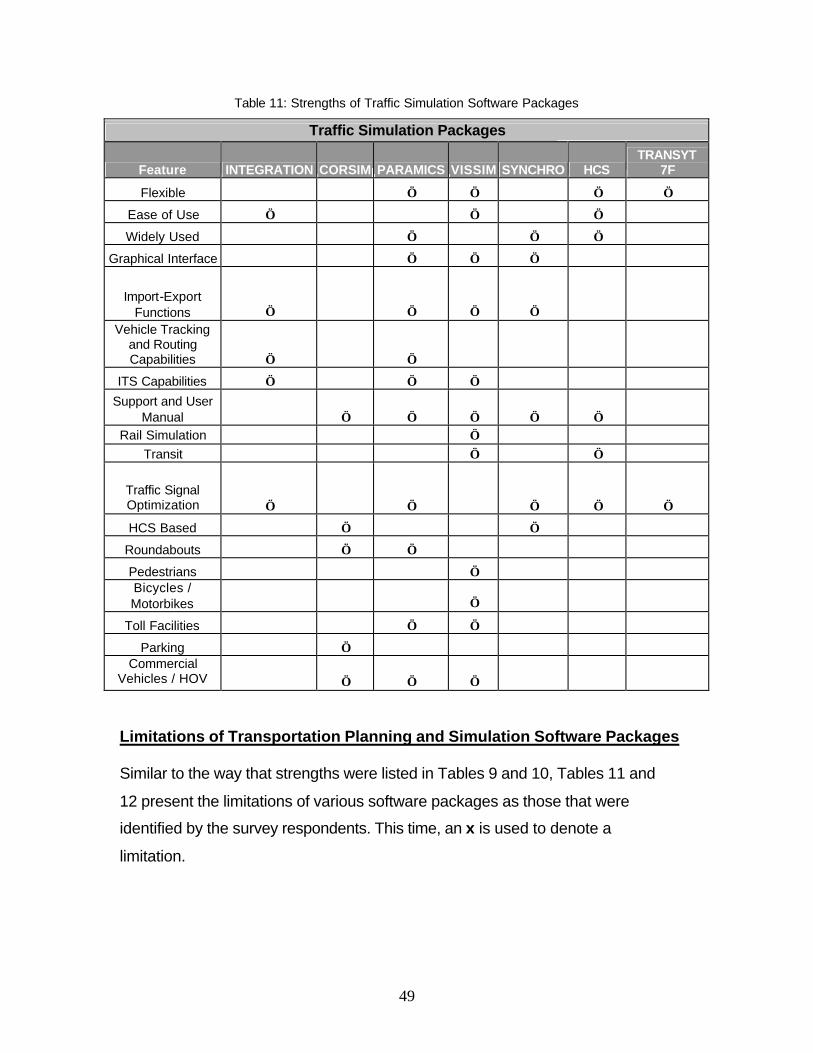
49
Table 11: Strengths of Traffic Simulation Software Packages
Traffic Simulation Packages
Feature INTEGRATION CORSIM PARAMICS VISSIM SYNCHRO HCS TRANSYT
7F
Flexible √ √ √ √
Ease of Use √ √ √
Widely Used √ √ √
Graphical Interface √ √ √
Import-Export Functions √ √ √ √
Vehicle Tracking and Routing Capabilities √ √
ITS Capabilities √ √ √
Support and User Manual √ √ √ √ √
Rail Simulation √ Transit √ √
Traffic Signal Optimization √ √ √ √ √
HCS Based √ √
Roundabouts √ √
Pedestrians √ Bicycles / Motorbikes √
Toll Facilities √ √
Parking √ Commercial
Vehicles / HOV Lanes
√ √ √ Limitations of Transportation Planning and Simulation Software Packages
Similar to the way that strengths were listed in Tables 9 and 10, Tables 11 and
12 present the limitations of various software packages as those that were
identified by the survey respondents. This time, an x is used to denote a
limitation.
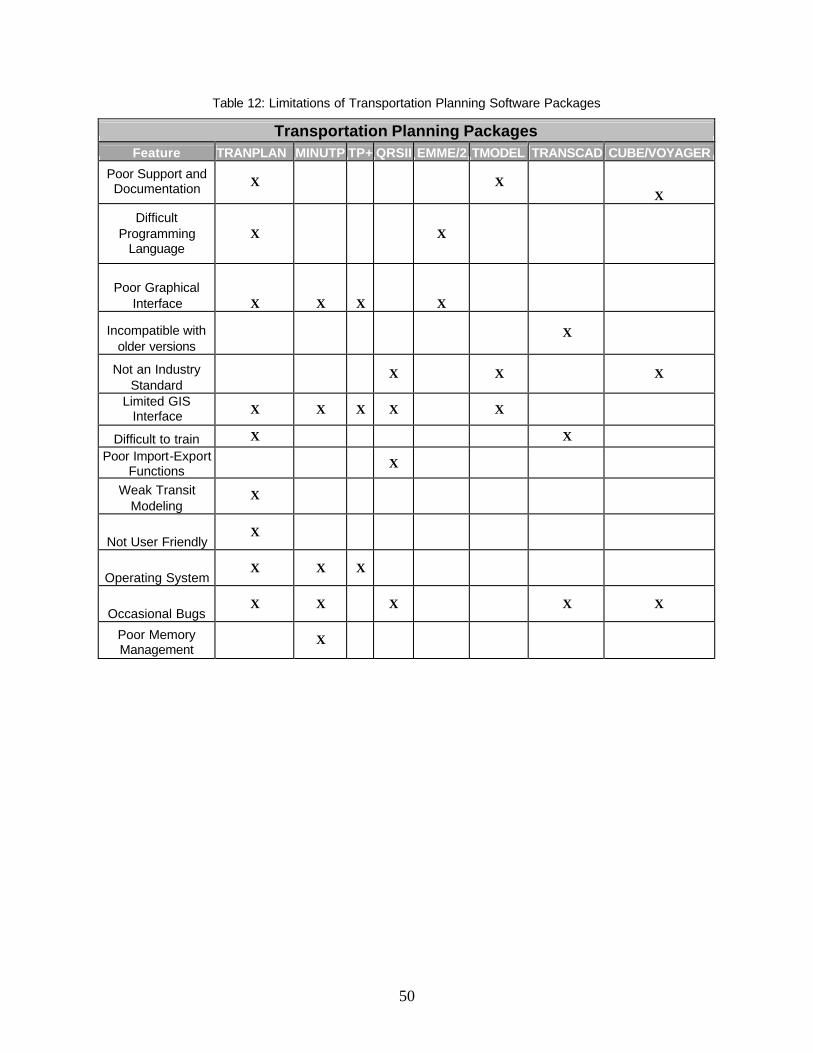
50
Table 12: Limitations of Transportation Planning Software Packages
Transportation Planning Packages Feature TRANPLAN MINUTP TP+ QRSII EMME/2 TMODEL TRANSCAD CUBE/VOYAGER
Poor Support and Documentation X X
X
Difficult Programming
Language X X
Poor Graphical Interface X X X X
Incompatible with older versions
X
Not an Industry Standard
X X X
Limited GIS Interface X X X X X
Difficult to train X X
Poor Import-Export Functions
X
Weak Transit Modeling
X
Not User Friendly X
Operating System X X X
Occasional Bugs X X X X X
Poor Memory Management
X
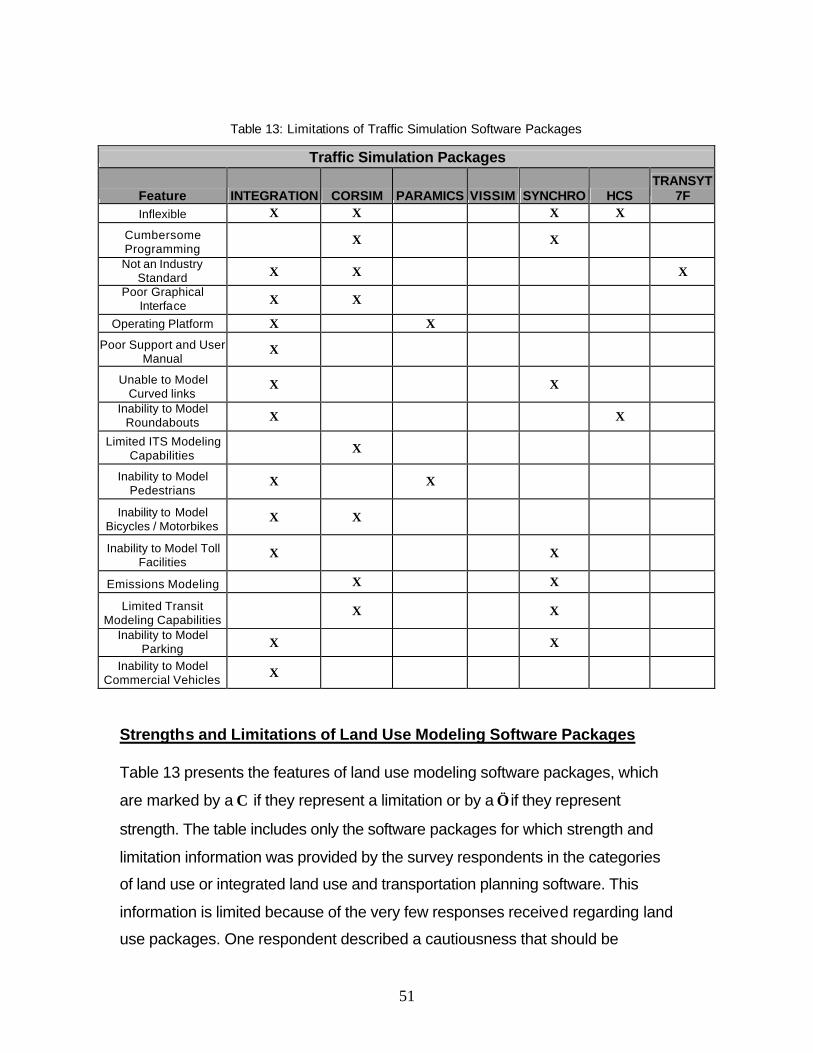
51
Table 13: Limitations of Traffic Simulation Software Packages
Traffic Simulation Packages
Feature INTEGRATION CORSIM PARAMICS VISSIM SYNCHRO HCS TRANSYT
7F Inflexible X X X X
Cumbersome Programming
X X
Not an Industry Standard X X X
Poor Graphical Interface X X
Operating Platform X X
Poor Support and User Manual
X
Unable to Model Curved links
X X
Inability to Model Roundabouts X X
Limited ITS Modeling Capabilities X
Inability to Model Pedestrians
X X
Inability to Model Bicycles / Motorbikes
X X
Inability to Model Toll Facilities
X X
Emissions Modeling X X
Limited Transit Modeling Capabilities
X X
Inability to Model Parking X X
Inability to Model Commercial Vehicles X
Strengths and Limitations of Land Use Modeling Software Packages
Table 13 presents the features of land use modeling software packages, which
are marked by a Χ if they represent a limitation or by a √ if they represent
strength. The table includes only the software packages for which strength and
limitation information was provided by the survey respondents in the categories
of land use or integrated land use and transportation planning software. This
information is limited because of the very few responses received regarding land
use packages. One respondent described a cautiousness that should be
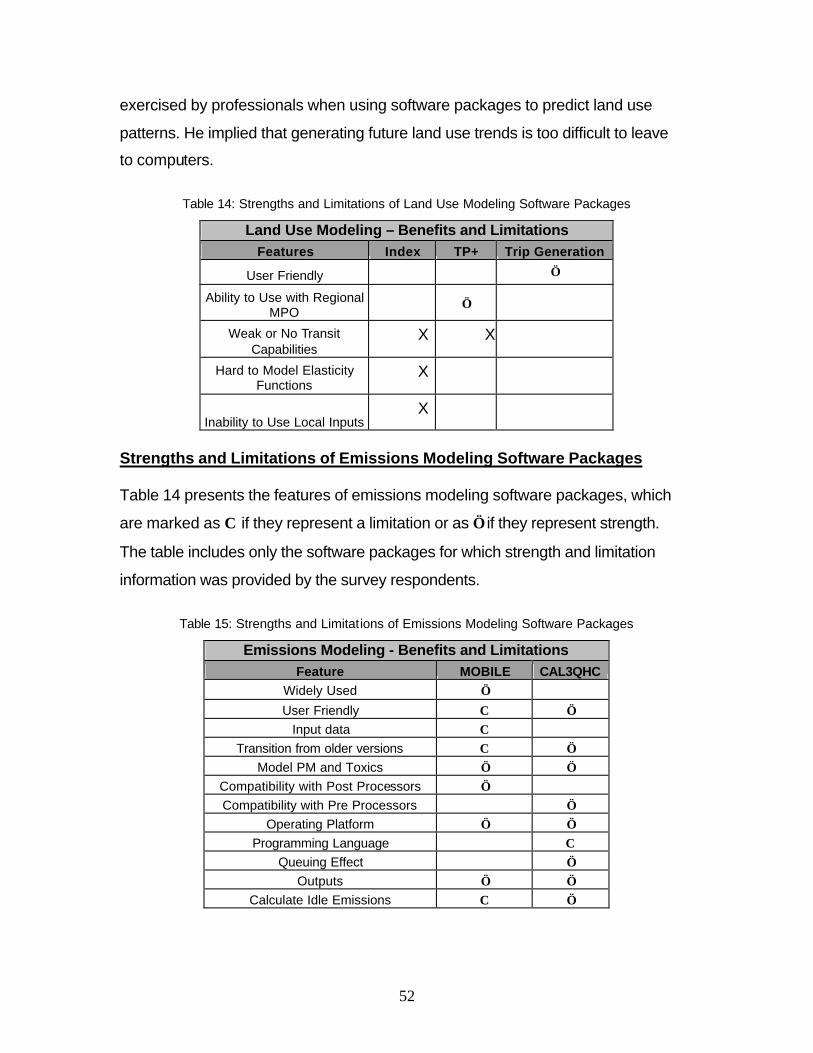
52
exercised by professionals when using software packages to predict land use
patterns. He implied that generating future land use trends is too difficult to leave
to computers.
Table 14: Strengths and Limitations of Land Use Modeling Software Packages
Land Use Modeling – Benefits and Limitations Features Index TP+ Trip Generation
User Friendly √
Ability to Use with Regional MPO
√
Weak or No Transit Capabilities
X X
Hard to Model Elasticity Functions
X
Inability to Use Local Inputs X
Strengths and Limitations of Emissions Modeling Software Packages
Table 14 presents the features of emissions modeling software packages, which
are marked as Χ if they represent a limitation or as √ if they represent strength.
The table includes only the software packages for which strength and limitation
information was provided by the survey respondents.
Table 15: Strengths and Limitations of Emissions Modeling Software Packages
Emissions Modeling - Benefits and Limitations Feature MOBILE CAL3QHC
Widely Used √
User Friendly Χ √ Input data Χ
Transition from older versions Χ √ Model PM and Toxics √ √
Compatibility with Post Processors √ Compatibility with Pre Processors √
Operating Platform √ √ Programming Language Χ
Queuing Effect √ Outputs √ √
Calculate Idle Emissions Χ √
53
Summary of Strengths and Limitations
The previous tables list strengths and limitations of the various software
packages as those that were identified by the users. The respondents were
asked to indicate the features of each software package that they were mostly
satisfied with and those that could be considered as limitations. As it was
expected, the most commonly used packages received the larger number of
comments (as either strengths or limitations). Evaluating the software packages
based on the number of items in their list of strengths and limitations would not
be appropriate. One, however, should look into the individual comments provided
by the respondents and determine the significance of a stated strength or
limitation for their individual applications or intended use of software packages.
Familiarity with Alternative Software Packages
Table 15 records the respondent’s familiarity with alternative software packages
in reference to the ones they are currently using. The first column lists a software
package that is currently used by the respondents. For each such package,
familiarity with alternatives and willingness to use them are listed in the next
columns. The last two columns of the table list the number of respondents, and
for those who indicated they are willing to use alternative packages, the name of
the package they would prefer to use. Under each question and for each
package, the answer with the highest number of responses is highlighted.
The following analysis indicates that the respondents are in general familiar with
alternative software packages. TransCAD, CUBE, and TP+ and VISSIM stand
out as the packages that respondents would like to use in place of other
packages they are currently using.
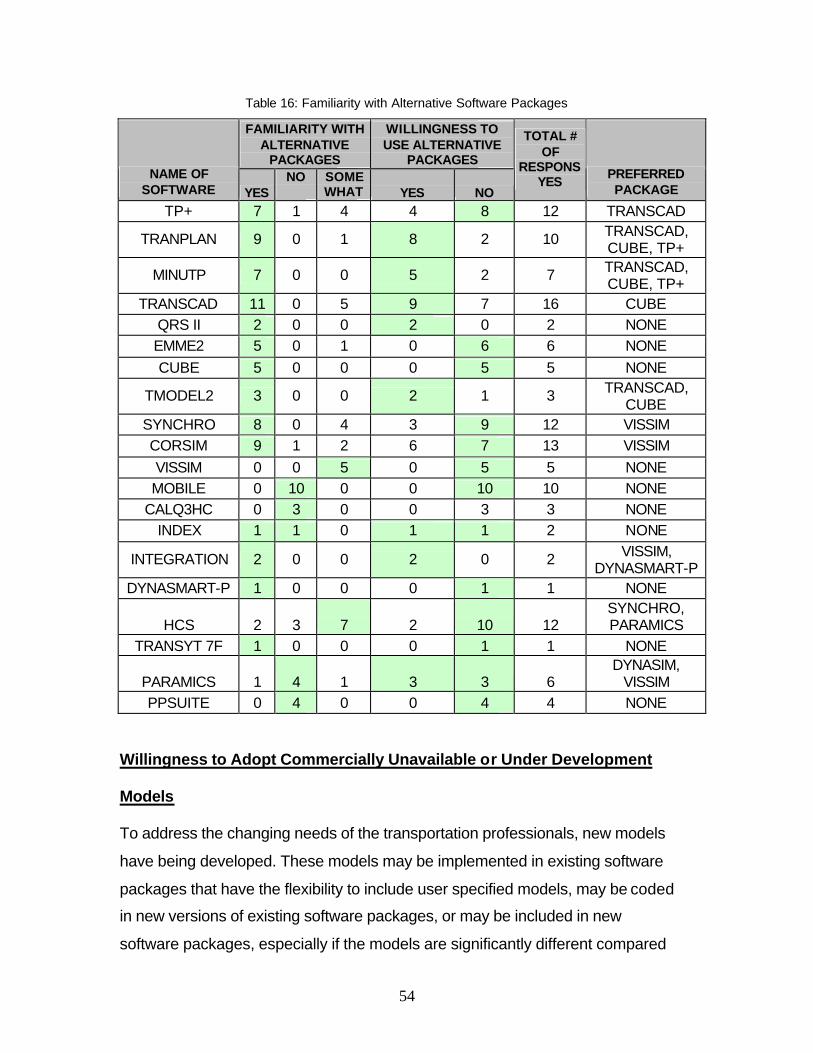
54
Table 16: Familiarity with Alternative Software Packages
FAMILIARITY WITH ALTERNATIVE
PACKAGES
WILLINGNESS TO USE ALTERNATIVE
PACKAGES NAME OF
SOFTWARE YES NO
SOMEWHAT YES NO
TOTAL # OF
RESPONS YES
PREFERRED PACKAGE
TP+ 7 1 4 4 8 12 TRANSCAD
TRANPLAN 9 0 1 8 2 10 TRANSCAD, CUBE, TP+
MINUTP 7 0 0 5 2 7 TRANSCAD, CUBE, TP+
TRANSCAD 11 0 5 9 7 16 CUBE QRS II 2 0 0 2 0 2 NONE EMME2 5 0 1 0 6 6 NONE CUBE 5 0 0 0 5 5 NONE
TMODEL2 3 0 0 2 1 3 TRANSCAD, CUBE
SYNCHRO 8 0 4 3 9 12 VISSIM CORSIM 9 1 2 6 7 13 VISSIM VISSIM 0 0 5 0 5 5 NONE MOBILE 0 10 0 0 10 10 NONE
CALQ3HC 0 3 0 0 3 3 NONE INDEX 1 1 0 1 1 2 NONE
INTEGRATION 2 0 0 2 0 2 VISSIM, DYNASMART-P
DYNASMART-P 1 0 0 0 1 1 NONE
HCS 2 3 7 2 10 12 SYNCHRO, PARAMICS
TRANSYT 7F 1 0 0 0 1 1 NONE
PARAMICS 1 4 1 3 3 6 DYNASIM,
VISSIM PPSUITE 0 4 0 0 4 4 NONE
Willingness to Adopt Commercially Unavailable or Under Development
Models
To address the changing needs of the transportation professionals, new models
have being developed. These models may be implemented in existing software
packages that have the flexibility to include user specified models, may be coded
in new versions of existing software packages, or may be included in new
software packages, especially if the models are significantly different compared
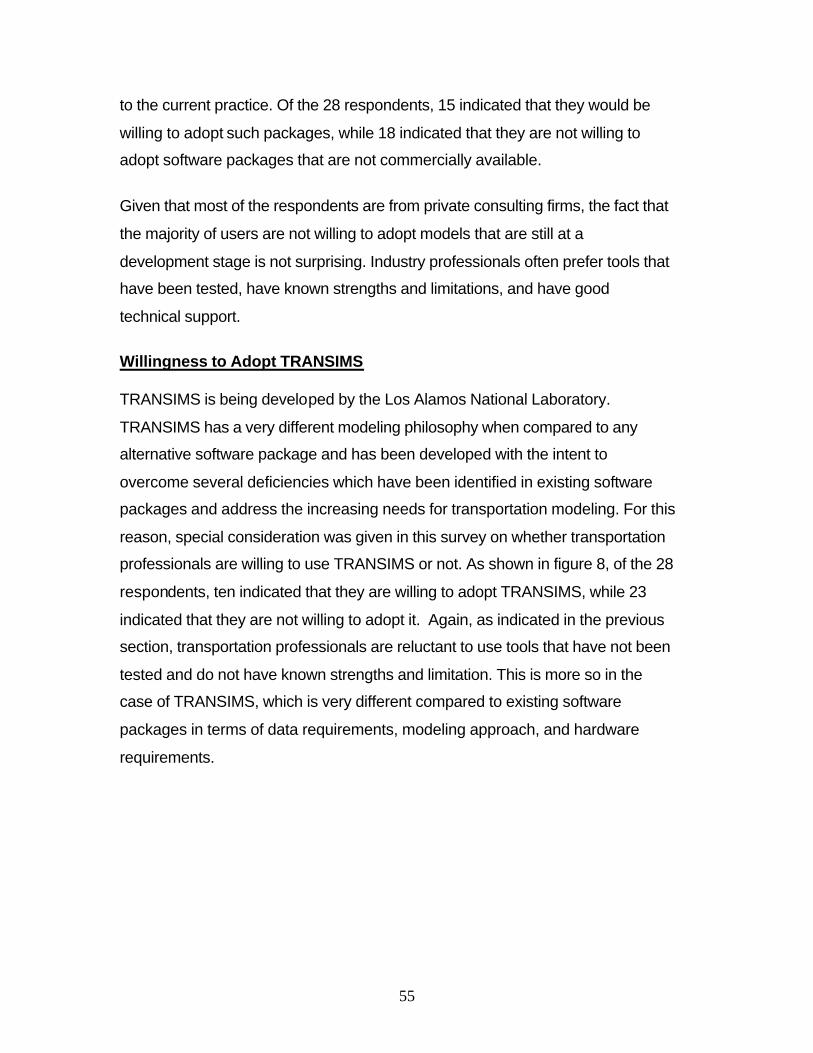
55
to the current practice. Of the 28 respondents, 15 indicated that they would be
willing to adopt such packages, while 18 indicated that they are not willing to
adopt software packages that are not commercially available.
Given that most of the respondents are from private consulting firms, the fact that
the majority of users are not willing to adopt models that are still at a
development stage is not surprising. Industry professionals often prefer tools that
have been tested, have known strengths and limitations, and have good
technical support.
Willingness to Adopt TRANSIMS
TRANSIMS is being developed by the Los Alamos National Laboratory.
TRANSIMS has a very different modeling philosophy when compared to any
alternative software package and has been developed with the intent to
overcome several deficiencies which have been identified in existing software
packages and address the increasing needs for transportation modeling. For this
reason, special consideration was given in this survey on whether transportation
professionals are willing to use TRANSIMS or not. As shown in figure 8, of the 28
respondents, ten indicated that they are willing to adopt TRANSIMS, while 23
indicated that they are not willing to adopt it. Again, as indicated in the previous
section, transportation professionals are reluctant to use tools that have not been
tested and do not have known strengths and limitation. This is more so in the
case of TRANSIMS, which is very different compared to existing software
packages in terms of data requirements, modeling approach, and hardware
requirements.
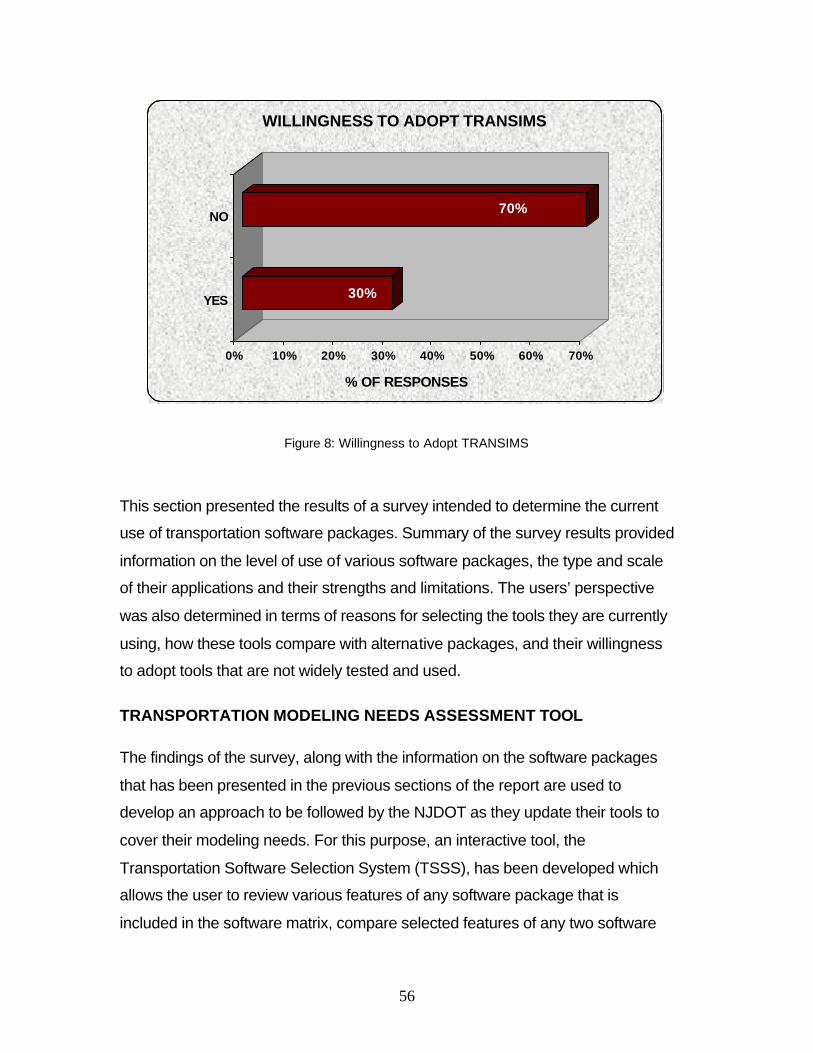
56
30%
70%
0% 10% 20% 30% 40% 50% 60% 70%
% OF RESPONSES
YES
NO
WILLINGNESS TO ADOPT TRANSIMS
Figure 8: Willingness to Adopt TRANSIMS
This section presented the results of a survey intended to determine the current
use of transportation software packages. Summary of the survey results provided
information on the level of use of various software packages, the type and scale
of their applications and their strengths and limitations. The users’ perspective
was also determined in terms of reasons for selecting the tools they are currently
using, how these tools compare with alternative packages, and their willingness
to adopt tools that are not widely tested and used.
TRANSPORTATION MODELING NEEDS ASSESSMENT TOOL
The findings of the survey, along with the information on the software packages
that has been presented in the previous sections of the report are used to
develop an approach to be followed by the NJDOT as they update their tools to
cover their modeling needs. For this purpose, an interactive tool, the
Transportation Software Selection System (TSSS), has been developed which
allows the user to review various features of any software package that is
included in the software matrix, compare selected features of any two software
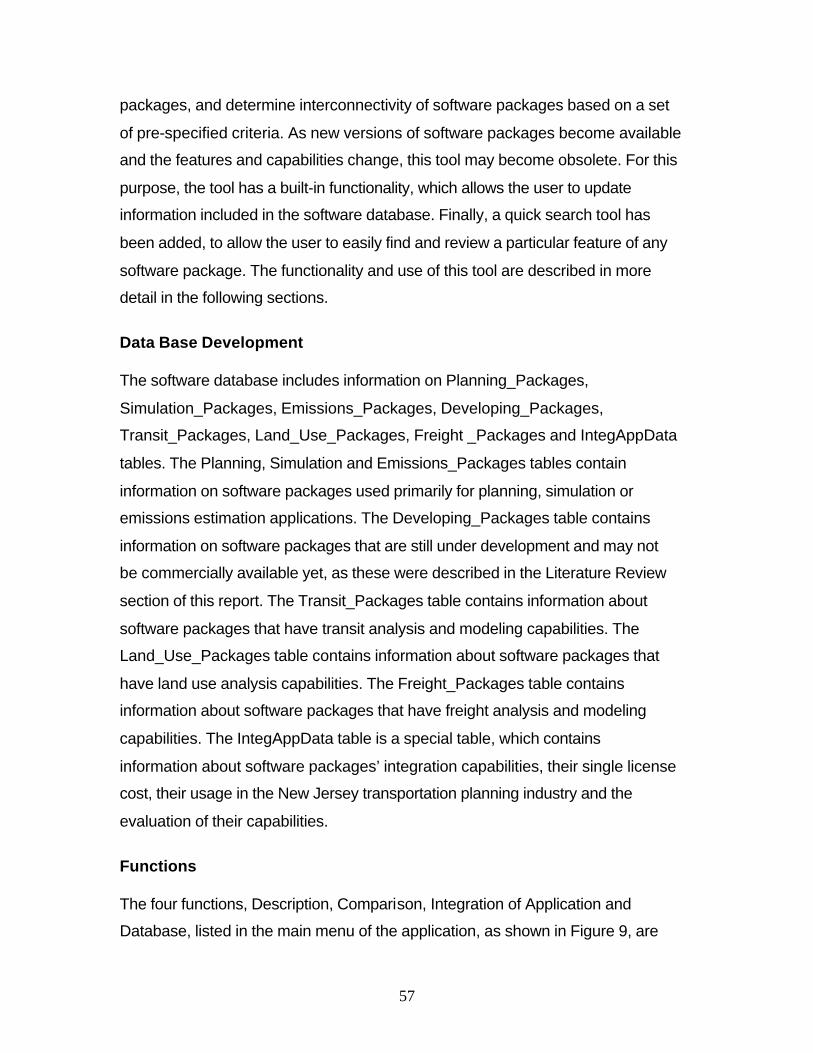
57
packages, and determine interconnectivity of software packages based on a set
of pre-specified criteria. As new versions of software packages become available
and the features and capabilities change, this tool may become obsolete. For this
purpose, the tool has a built-in functionality, which allows the user to update
information included in the software database. Finally, a quick search tool has
been added, to allow the user to easily find and review a particular feature of any
software package. The functionality and use of this tool are described in more
detail in the following sections.
Data Base Development
The software database includes information on Planning_Packages,
Simulation_Packages, Emissions_Packages, Developing_Packages,
Transit_Packages, Land_Use_Packages, Freight _Packages and IntegAppData
tables. The Planning, Simulation and Emissions_Packages tables contain
information on software packages used primarily for planning, simulation or
emissions estimation applications. The Developing_Packages table contains
information on software packages that are still under development and may not
be commercially available yet, as these were described in the Literature Review
section of this report. The Transit_Packages table contains information about
software packages that have transit analysis and modeling capabilities. The
Land_Use_Packages table contains information about software packages that
have land use analysis capabilities. The Freight_Packages table contains
information about software packages that have freight analysis and modeling
capabilities. The IntegAppData table is a special table, which contains
information about software packages’ integration capabilities, their single license
cost, their usage in the New Jersey transportation planning industry and the
evaluation of their capabilities.
Functions
The four functions, Description, Comparison, Integration of Application and
Database, listed in the main menu of the application, as shown in Figure 9, are
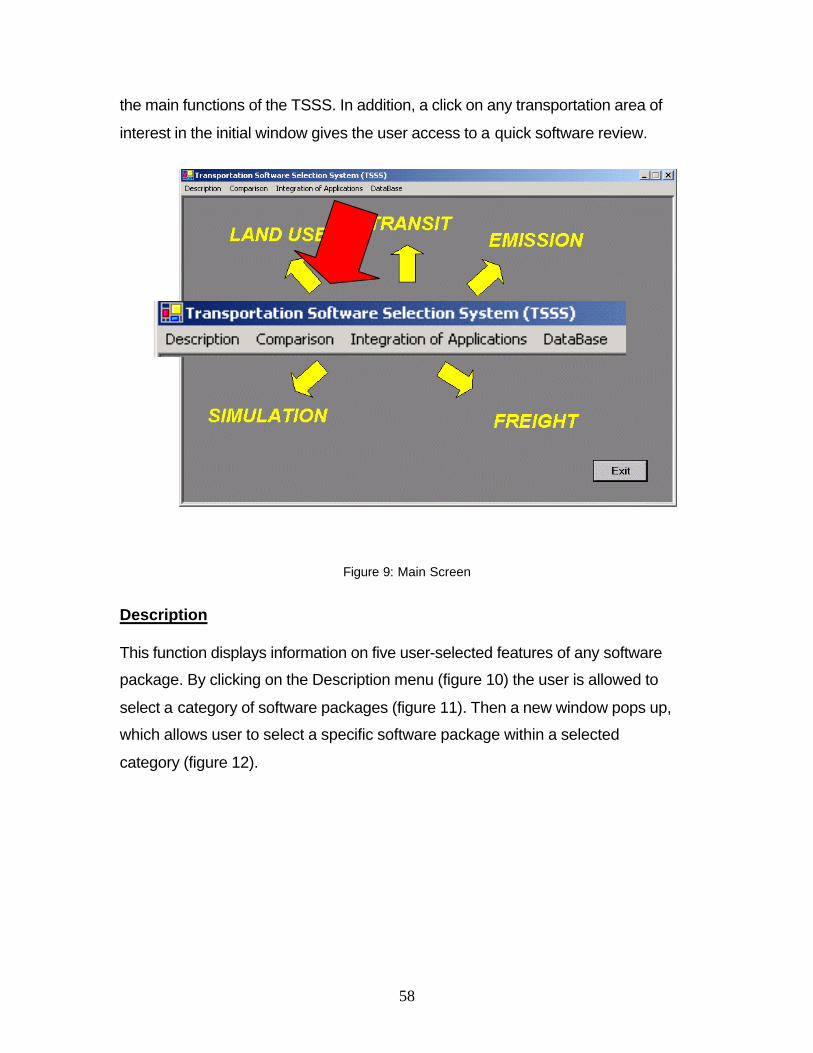
58
the main functions of the TSSS. In addition, a click on any transportation area of
interest in the initial window gives the user access to a quick software review.
Figure 9: Main Screen
Description
This function displays information on five user-selected features of any software
package. By clicking on the Description menu (figure 10) the user is allowed to
select a category of software packages (figure 11). Then a new window pops up,
which allows user to select a specific software package within a selected
category (figure 12).
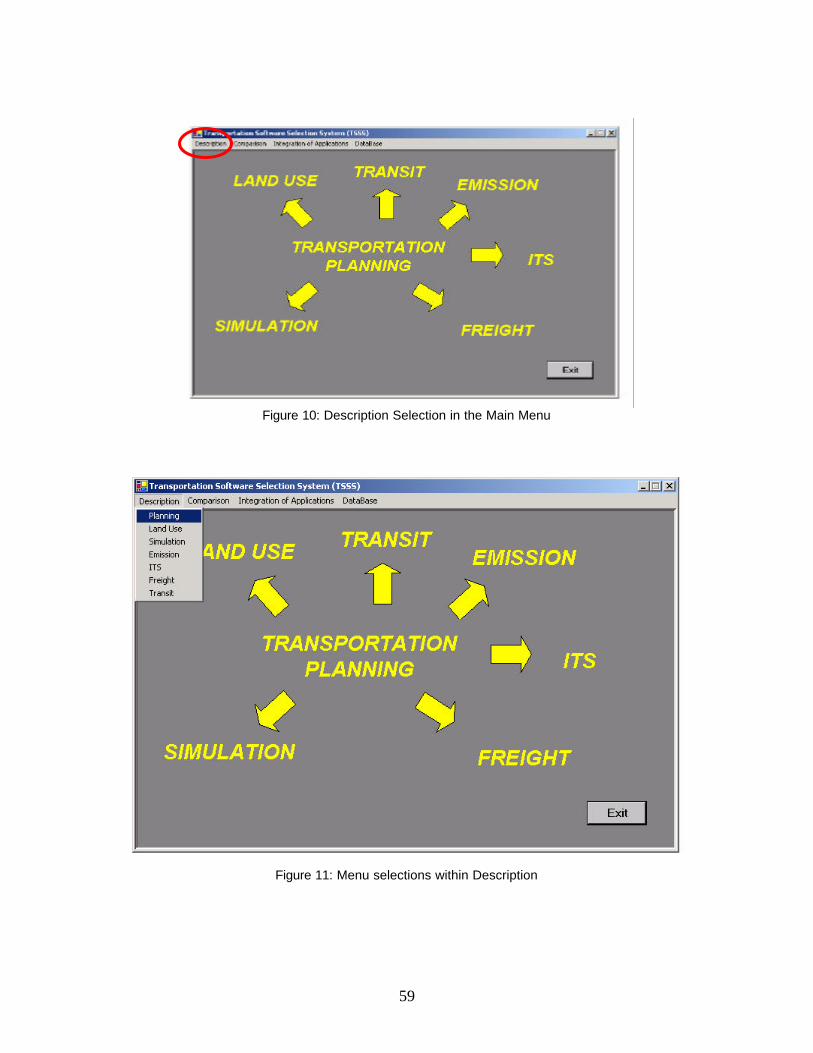
59
Figure 10: Description Selection in the Main Menu
Figure 11: Menu selections within Description
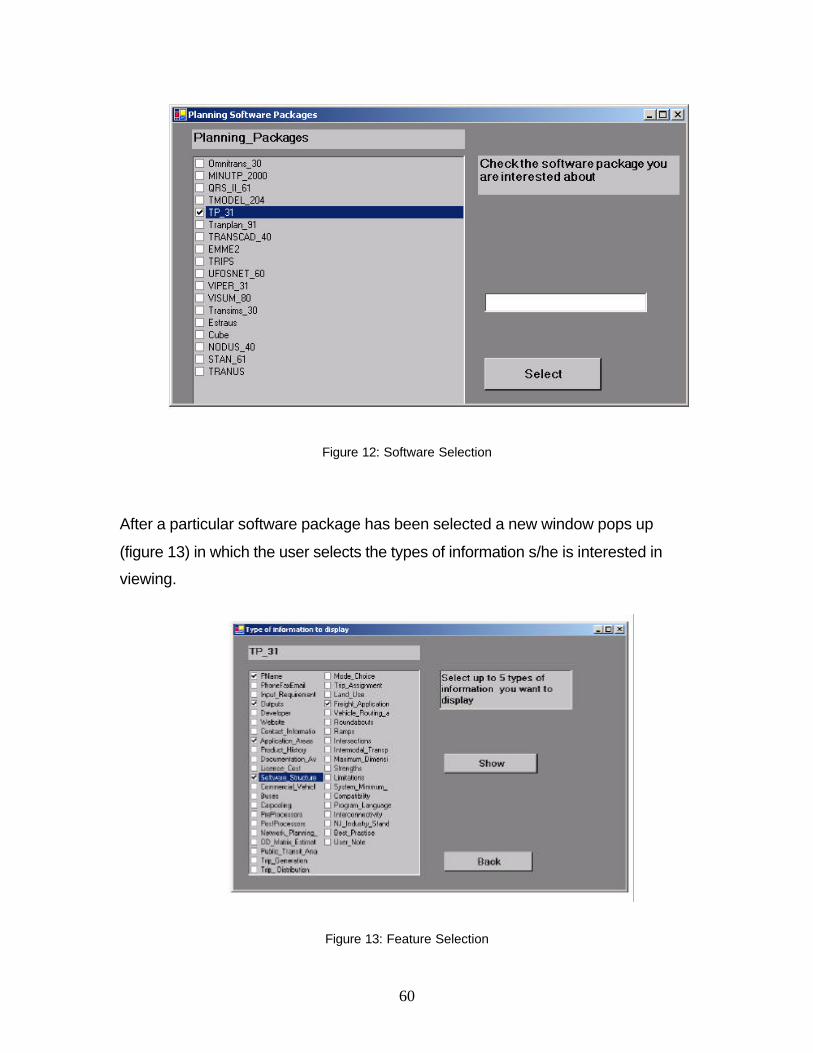
60
Figure 12: Software Selection
After a particular software package has been selected a new window pops up
(figure 13) in which the user selects the types of information s/he is interested in
viewing.
Figure 13: Feature Selection
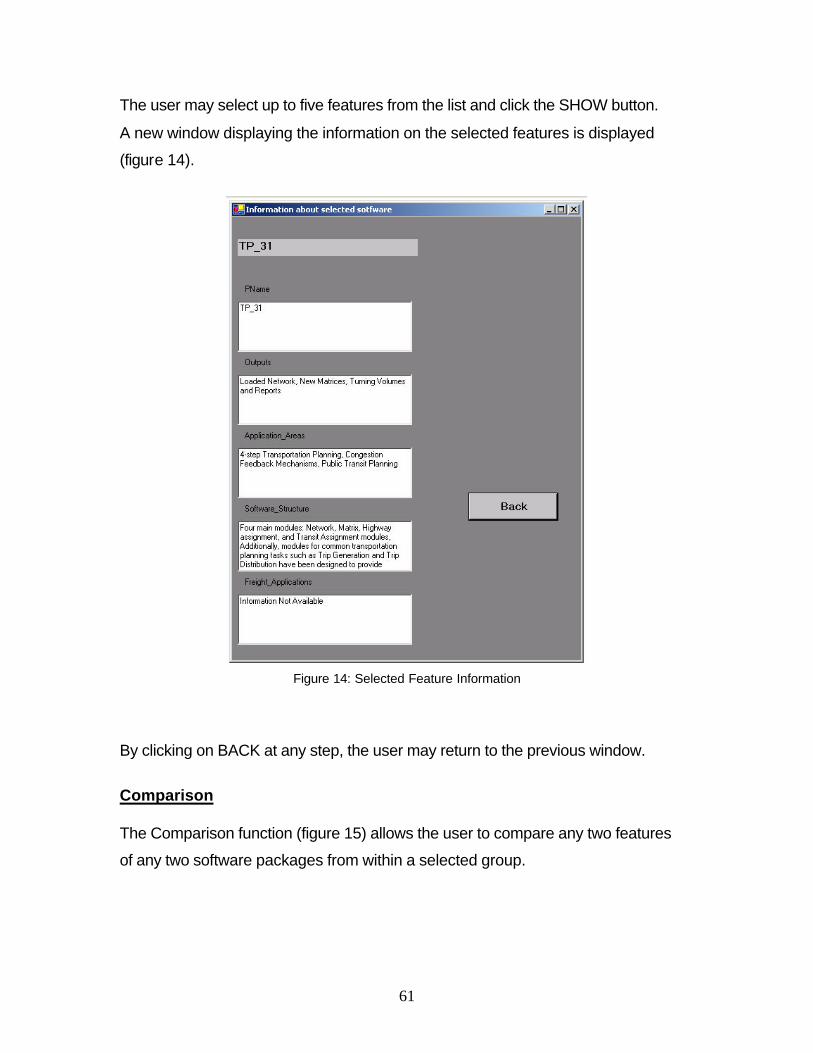
61
The user may select up to five features from the list and click the SHOW button.
A new window displaying the information on the selected features is displayed
(figure 14).
Figure 14: Selected Feature Information
By clicking on BACK at any step, the user may return to the previous window.
Comparison
The Comparison function (figure 15) allows the user to compare any two features
of any two software packages from within a selected group.
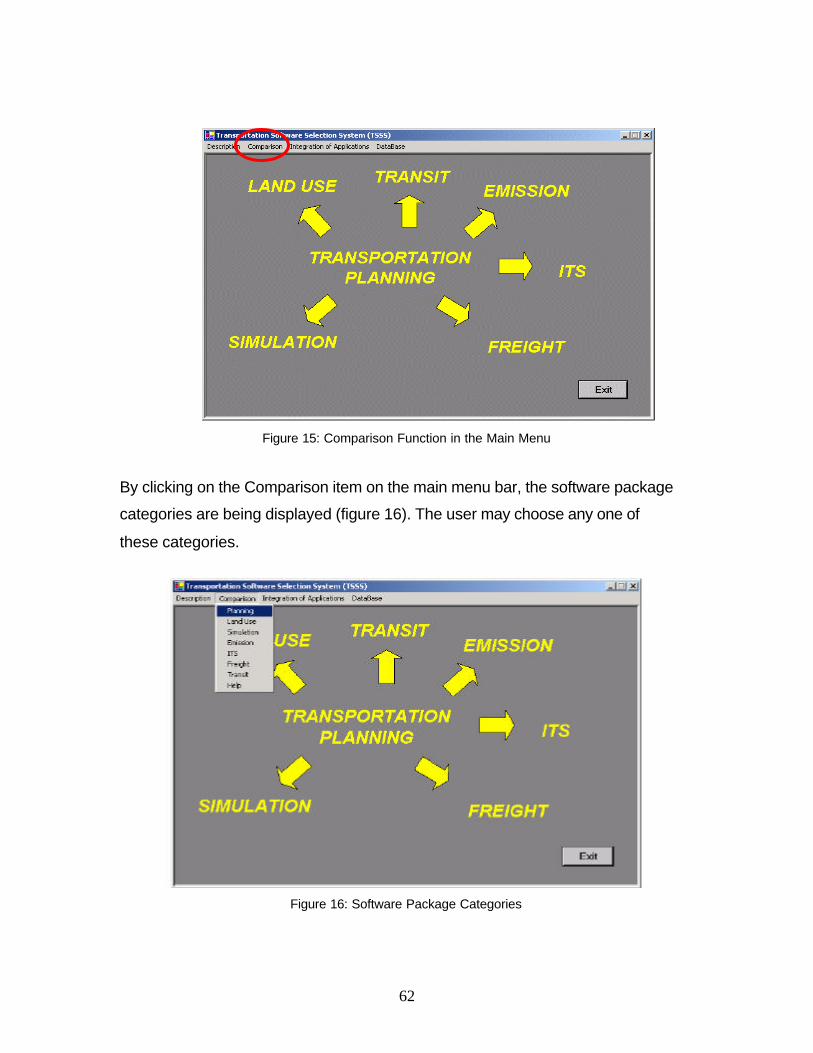
62
Figure 15: Comparison Function in the Main Menu
By clicking on the Comparison item on the main menu bar, the software package
categories are being displayed (figure 16). The user may choose any one of
these categories.
Figure 16: Software Package Categories
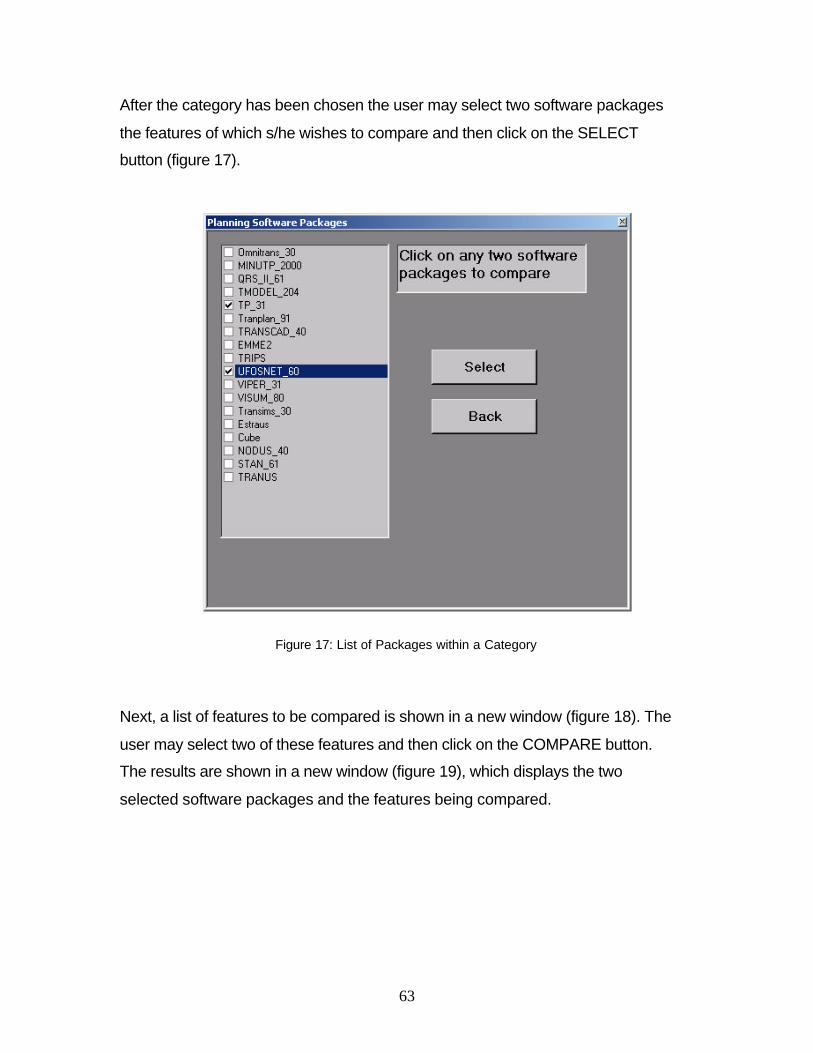
63
After the category has been chosen the user may select two software packages
the features of which s/he wishes to compare and then click on the SELECT
button (figure 17).
Figure 17: List of Packages within a Category
Next, a list of features to be compared is shown in a new window (figure 18). The
user may select two of these features and then click on the COMPARE button.
The results are shown in a new window (figure 19), which displays the two
selected software packages and the features being compared.
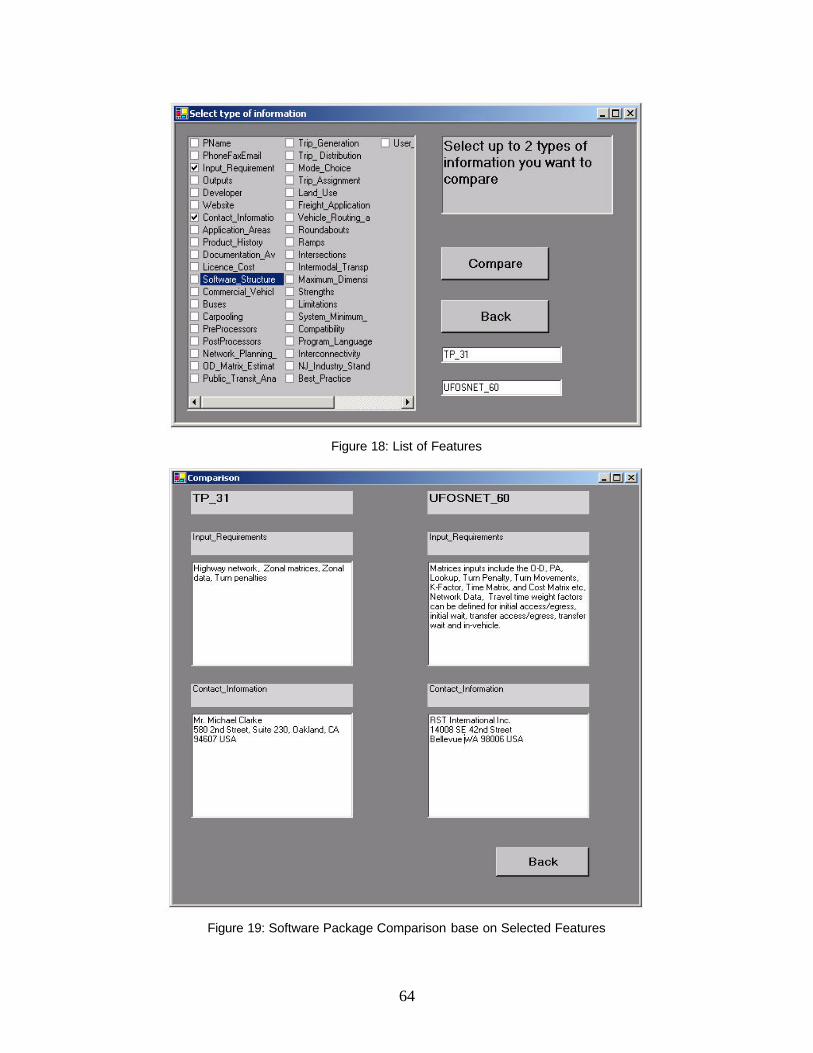
64
Figure 18: List of Features
Figure 19: Software Package Comparison base on Selected Features
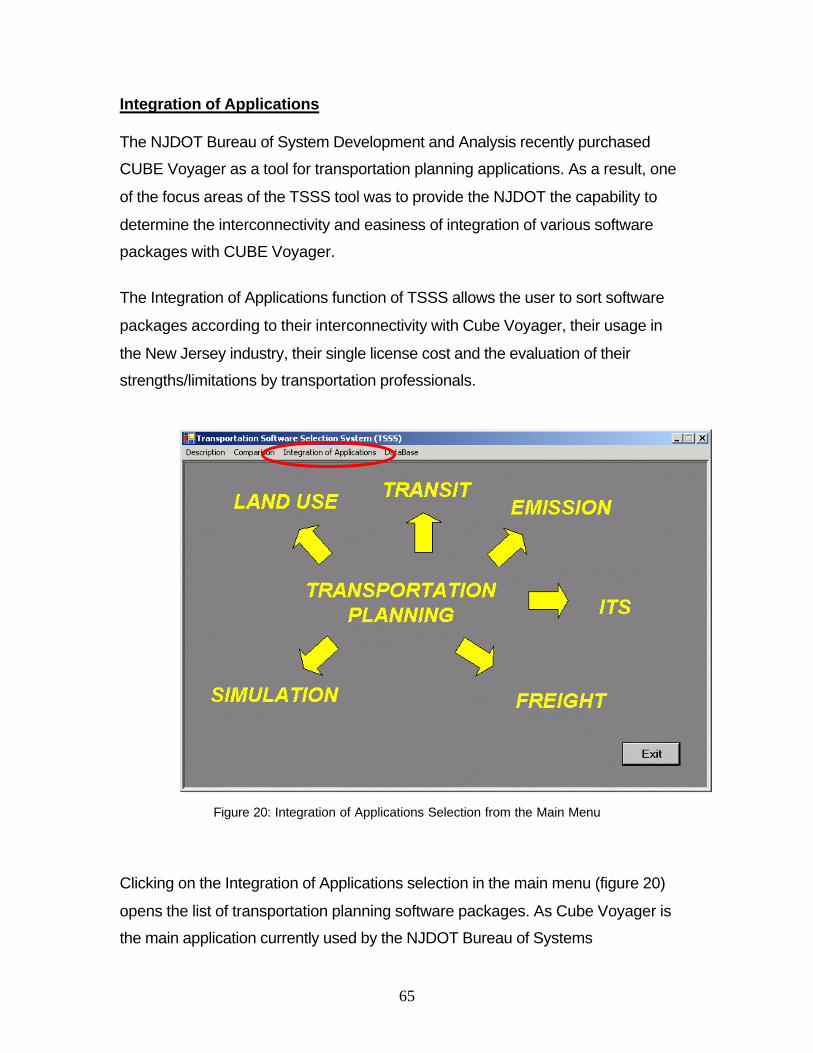
65
Integration of Applications
The NJDOT Bureau of System Development and Analysis recently purchased
CUBE Voyager as a tool for transportation planning applications. As a result, one
of the focus areas of the TSSS tool was to provide the NJDOT the capability to
determine the interconnectivity and easiness of integration of various software
packages with CUBE Voyager.
The Integration of Applications function of TSSS allows the user to sort software
packages according to their interconnectivity with Cube Voyager, their usage in
the New Jersey industry, their single license cost and the evaluation of their
strengths/limitations by transportation professionals.
Figure 20: Integration of Applications Selection from the Main Menu
Clicking on the Integration of Applications selection in the main menu (figure 20)
opens the list of transportation planning software packages. As Cube Voyager is
the main application currently used by the NJDOT Bureau of Systems
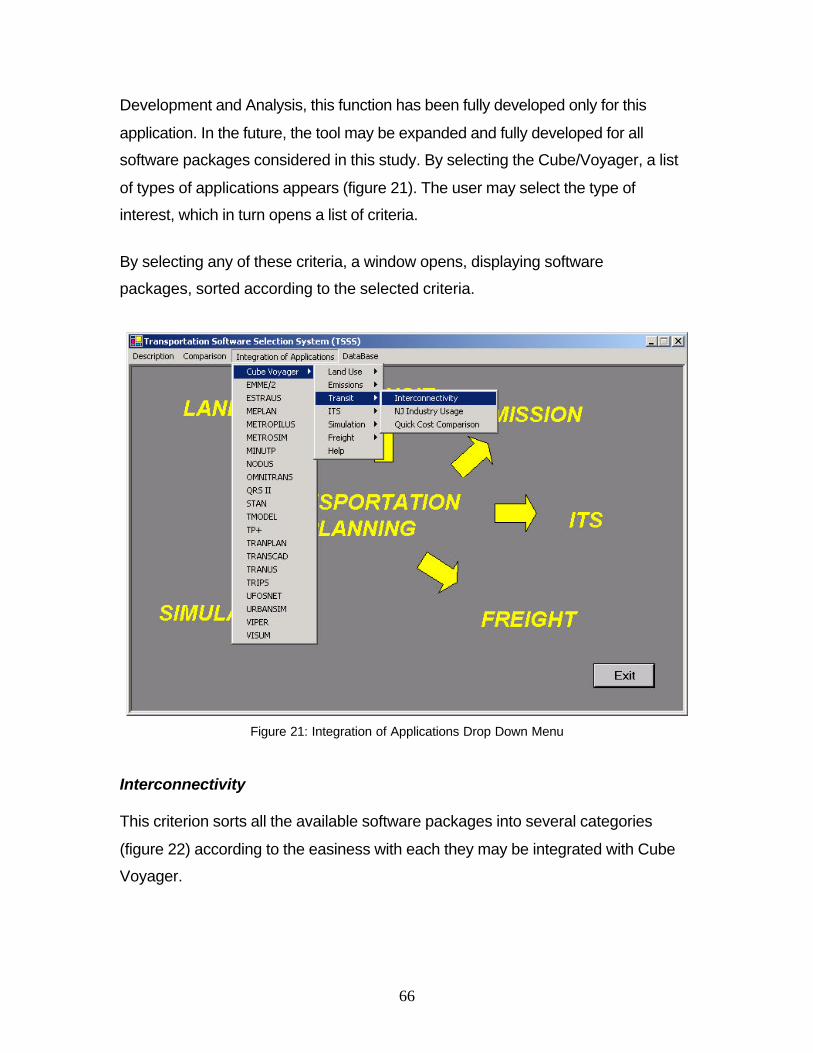
66
Development and Analysis, this function has been fully developed only for this
application. In the future, the tool may be expanded and fully developed for all
software packages considered in this study. By selecting the Cube/Voyager, a list
of types of applications appears (figure 21). The user may select the type of
interest, which in turn opens a list of criteria.
By selecting any of these criteria, a window opens, displaying software
packages, sorted according to the selected criteria.
Figure 21: Integration of Applications Drop Down Menu
Interconnectivity
This criterion sorts all the available software packages into several categories
(figure 22) according to the easiness with each they may be integrated with Cube
Voyager.
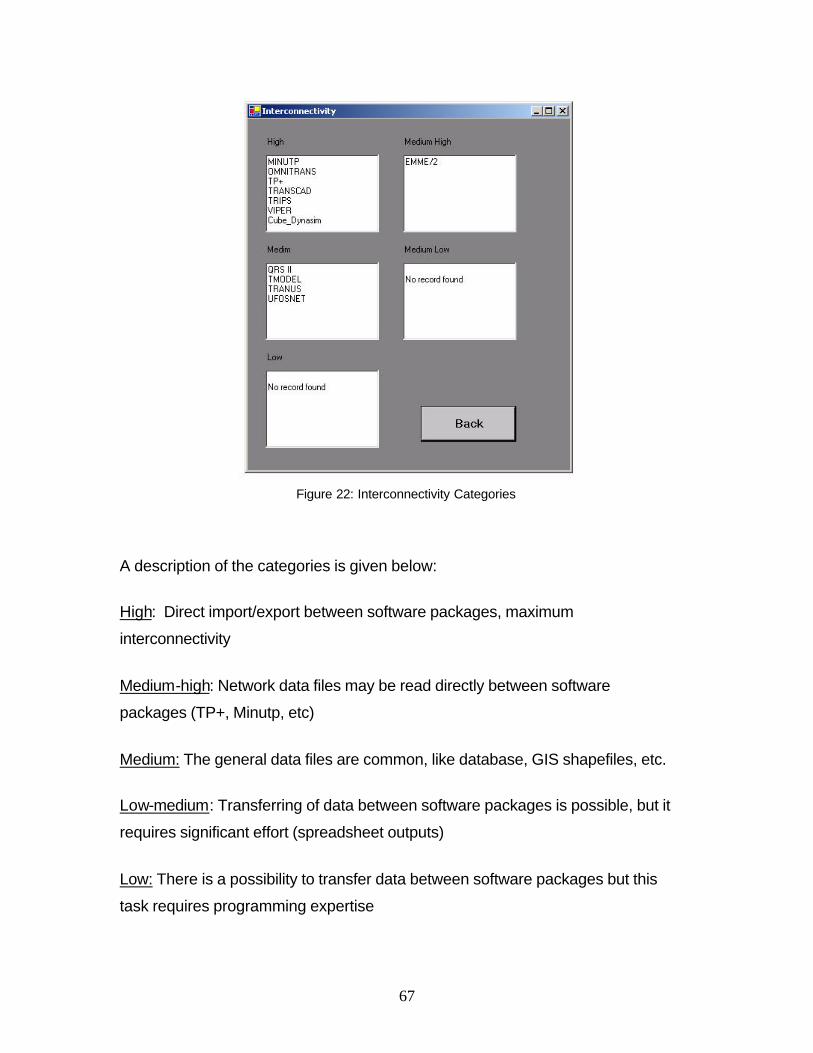
67
Figure 22: Interconnectivity Categories
A description of the categories is given below:
High: Direct import/export between software packages, maximum
interconnectivity
Medium-high: Network data files may be read directly between software
packages (TP+, Minutp, etc)
Medium: The general data files are common, like database, GIS shapefiles, etc.
Low-medium: Transferring of data between software packages is possible, but it
requires significant effort (spreadsheet outputs)
Low: There is a possibility to transfer data between software packages but this
task requires programming expertise
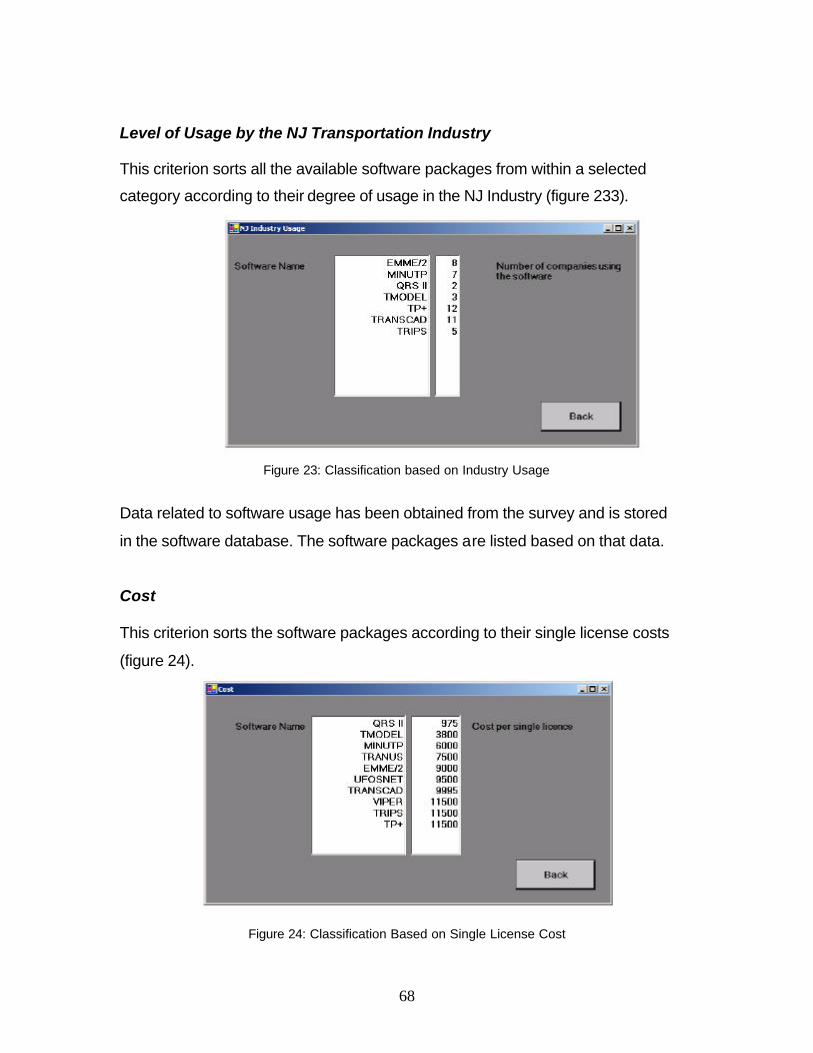
68
Level of Usage by the NJ Transportation Industry
This criterion sorts all the available software packages from within a selected
category according to their degree of usage in the NJ Industry (figure 233).
Figure 23: Classification based on Industry Usage
Data related to software usage has been obtained from the survey and is stored
in the software database. The software packages are listed based on that data.
Cost
This criterion sorts the software packages according to their single license costs
(figure 24).
Figure 24: Classification Based on Single License Cost
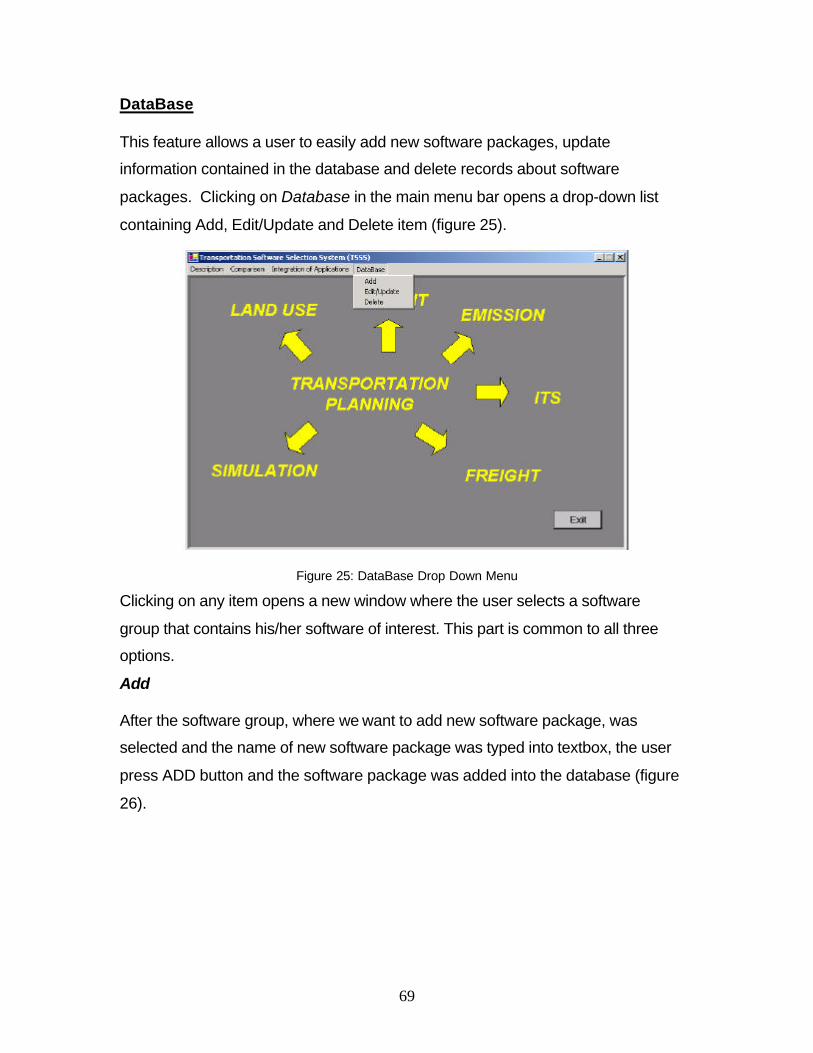
69
DataBase
This feature allows a user to easily add new software packages, update
information contained in the database and delete records about software
packages. Clicking on Database in the main menu bar opens a drop-down list
containing Add, Edit/Update and Delete item (figure 25).
Figure 25: DataBase Drop Down Menu
Clicking on any item opens a new window where the user selects a software
group that contains his/her software of interest. This part is common to all three
options.
Add
After the software group, where we want to add new software package, was
selected and the name of new software package was typed into textbox, the user
press ADD button and the software package was added into the database (figure
26).
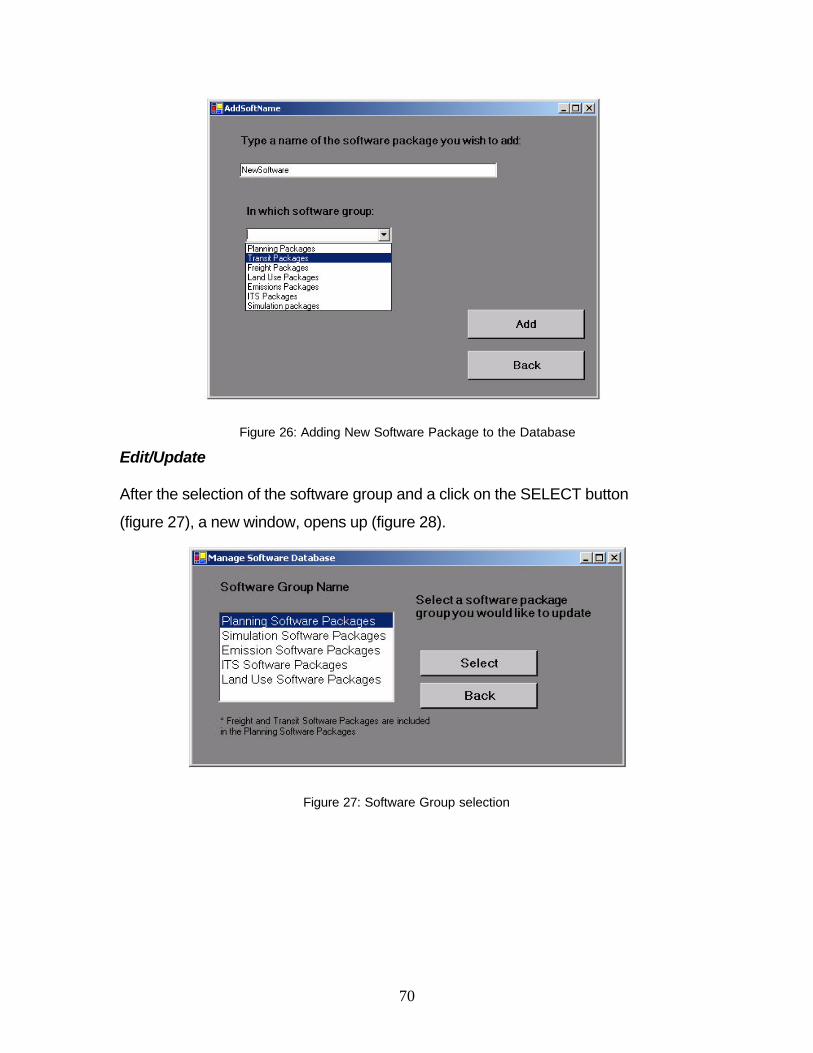
70
Figure 26: Adding New Software Package to the Database
Edit/Update
After the selection of the software group and a click on the SELECT button
(figure 27), a new window, opens up (figure 28).
Figure 27: Software Group selection
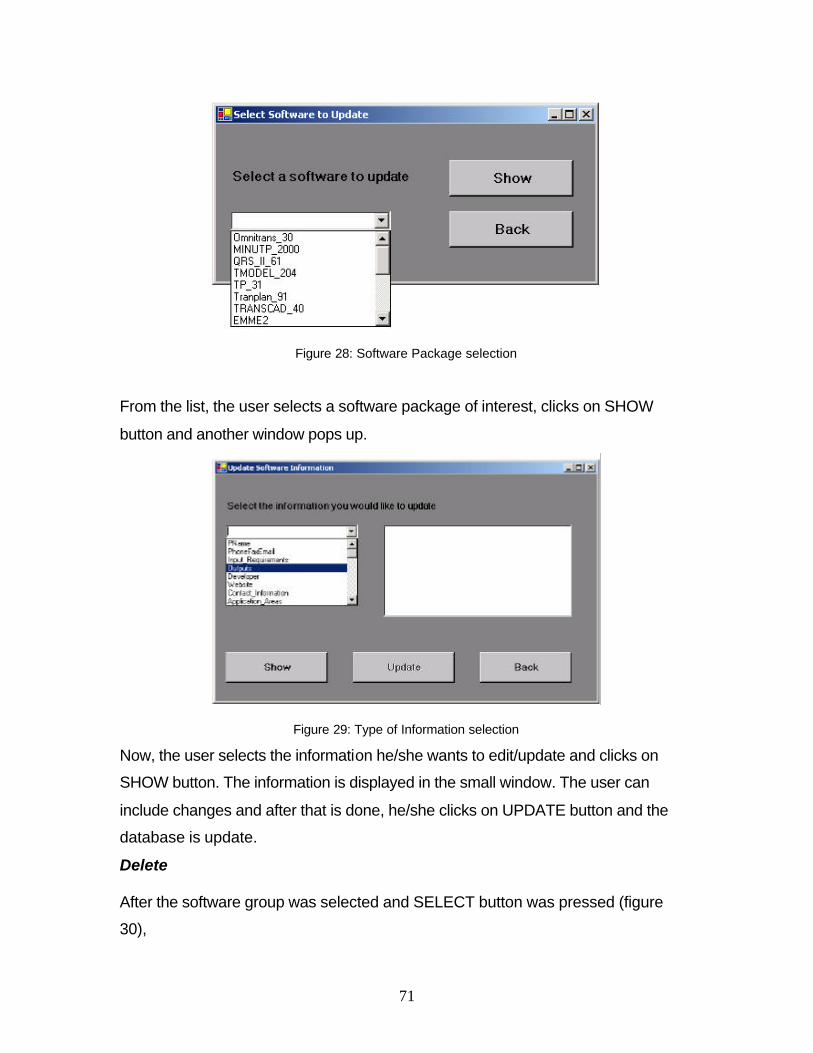
71
Figure 28: Software Package selection
From the list, the user selects a software package of interest, clicks on SHOW
button and another window pops up.
Figure 29: Type of Information selection
Now, the user selects the information he/she wants to edit/update and clicks on
SHOW button. The information is displayed in the small window. The user can
include changes and after that is done, he/she clicks on UPDATE button and the
database is update.
Delete
After the software group was selected and SELECT button was pressed (figure
30),
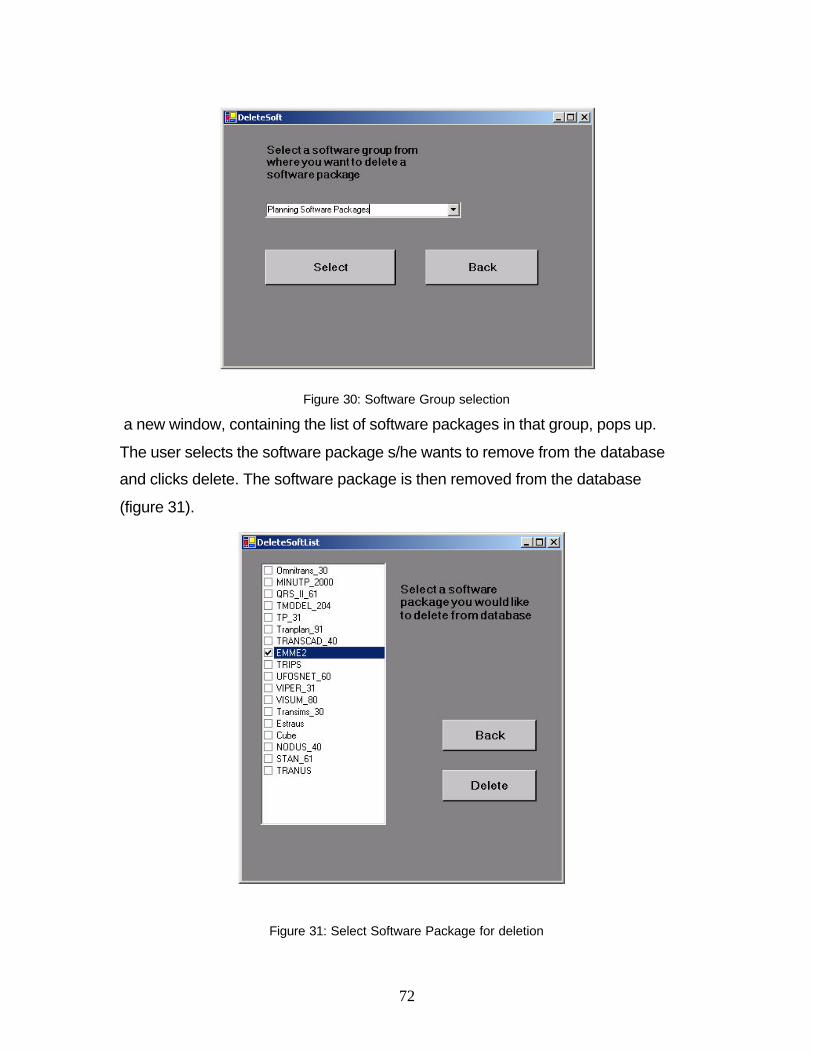
72
Figure 30: Software Group selection
a new window, containing the list of software packages in that group, pops up.
The user selects the software package s/he wants to remove from the database
and clicks delete. The software package is then removed from the database
(figure 31).
Figure 31: Select Software Package for deletion
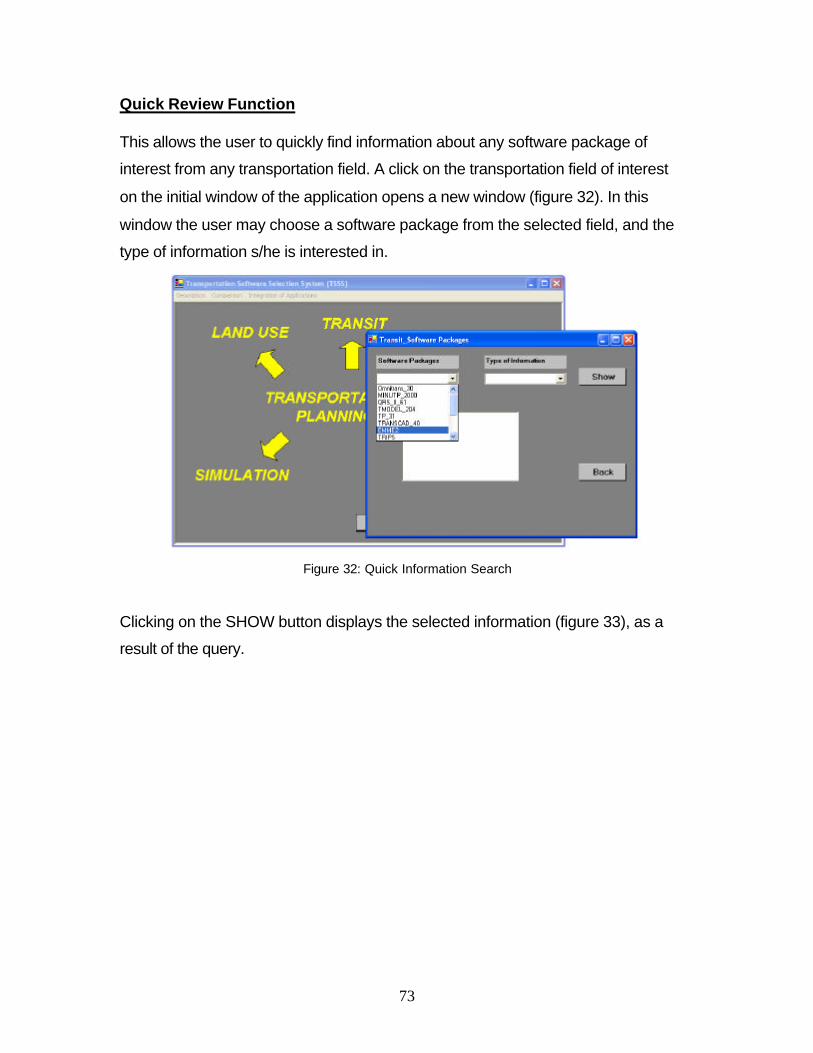
73
Quick Review Function
This allows the user to quickly find information about any software package of
interest from any transportation field. A click on the transportation field of interest
on the initial window of the application opens a new window (figure 32). In this
window the user may choose a software package from the selected field, and the
type of information s/he is interested in.
Figure 32: Quick Information Search
Clicking on the SHOW button displays the selected information (figure 33), as a
result of the query.
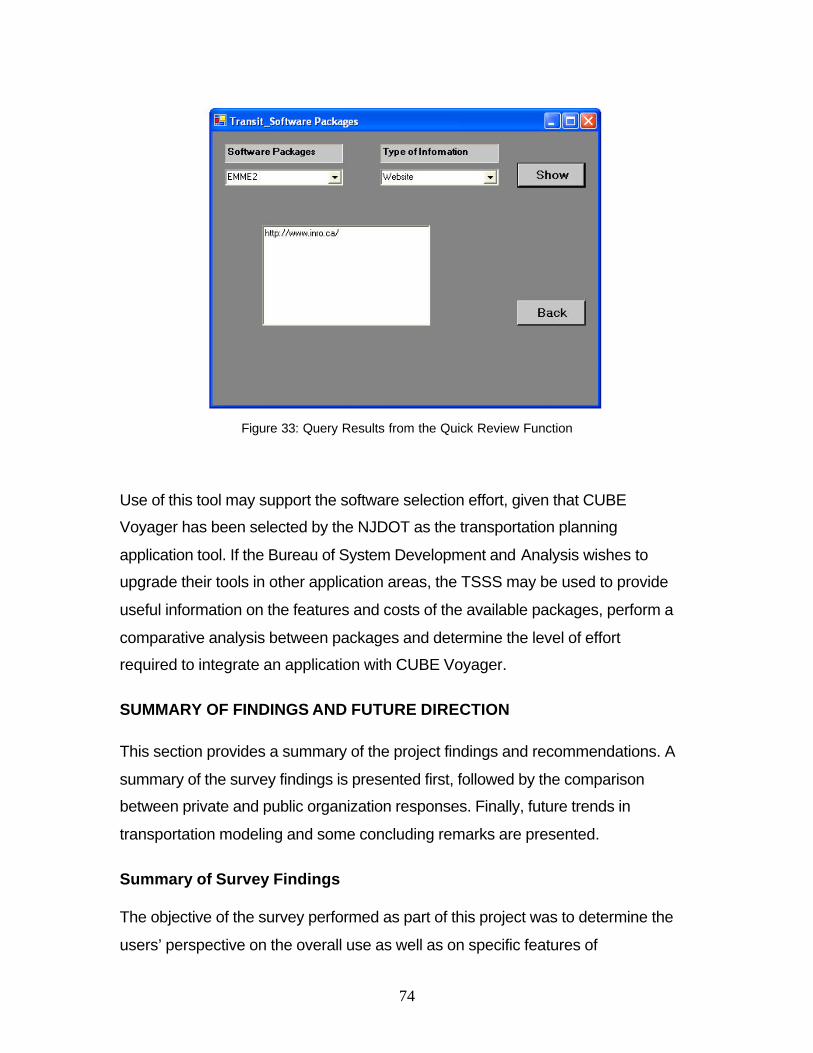
74
Figure 33: Query Results from the Quick Review Function
Use of this tool may support the software selection effort, given that CUBE
Voyager has been selected by the NJDOT as the transportation planning
application tool. If the Bureau of System Development and Analysis wishes to
upgrade their tools in other application areas, the TSSS may be used to provide
useful information on the features and costs of the available packages, perform a
comparative analysis between packages and determine the level of effort
required to integrate an application with CUBE Voyager.
SUMMARY OF FINDINGS AND FUTURE DIRECTION
This section provides a summary of the project findings and recommendations. A
summary of the survey findings is presented first, followed by the comparison
between private and public organization responses. Finally, future trends in
transportation modeling and some concluding remarks are presented.
Summary of Survey Findings
The objective of the survey performed as part of this project was to determine the
users’ perspective on the overall use as well as on specific features of
75
transportation software packages. The survey produced several significant
findings, including the following:
The majority of respondents rely on widely used transportation planning
packages like Tranplan, MINUTP and TP+. Long time tradition in using these
tools seems to be an important factor for the continued use of these packages,
even when alternatives that seem to have increased capabilities are
commercially available. Additionally, these tools are widely used, and
transportation professionals may easily relate their analyses and results to their
sponsors and collaborators who are also using the same modeling tools.
There is an increasing demand for sound graphical interface, GIS capabilities,
integration with land-use packages, sound import-export functions, modeling of
emissions, transit-forecasting capabilities and modeling of toll facilities. These
capabilities are incorporated in software packages like TransCAD, EMME/2 and
CUBE.
The majority of respondents use traffic simulation software packages like
Integration, Corsim, and Paramics. There is an increasing demand for simulation
packages with sound graphical interface, ability to model ITS facilities,
roundabouts, pedestrians, toll facilities, emissions and parking. Also, there is a
stated need to add capabilities to model commercial vehicles and Highway
Capacity Manual requirements.
Software packages like VISSIM, Synchro, Paramics, UrbanSIM and HCS 2000
are viewed as future trends in simulation modeling packages.
Since there are an abundance of available transportation planning and traffic
simulation packages the criteria to select a proper package should be project
based. However one should look for tools with a friendly user interface, network
modification and creation structure, traffic generation / distribution, vehicle / driver
classification, route selection / traffic assignment, ITS modeling capabilities,
incident simulation / traffic control and measure of effectiveness.
76
Land use modeling is mainly done using software packages like DRAM/EMPAL,
METROSIM, TransCAD, ARCVIEW GIS and UrbanSIM. New packages that can
be integrated with transportation demand modeling packages are still under
development. However packages like TransCAD, CUBE and EMME/2 are
viewed and used as integrated transportation planning and land use software
packages.
Emissions modeling packages like MOBILE, PPSUITE and CAL3QHC are
among the most widely used emissions modeling software packages. MOBILE is
the industry standard in emissions modeling.
ITS modeling is mainly done using VISSIM, IDAS and INTEGRATION. There is a
need to develop simulation packages that are capable of doing ITS modeling.
The Highway Capacity Software (HCS) is the industry standard for signalized
intersections since it is the implementation of the Highway Capacity Manual.
HCS only performs the procedures in the manual. Developers have sensed the
need for other functionality such as additional performance measures, usual
geometry and design features. Recent additions to the suite of intersection
analysis tools have tended to combine this expanded functionality with either the
HCM procedures by imbedding them directly or by linking to the HCS.
The main concern of the industry to accept any under-development software
package like TRANSIMS is that it is not yet fully tested and proved, and of course
it is not an industry standard. The selection of any software package is still
dependent on client requirements and decisions. All 28 respondents believe that
a new package can only be used if a client is ready to accept it. Twelve of the
respondents believed that any new software should be validated with real world
data before it is accepted by the industry. Requirement of proper documentation
and support to accept TRANSIMS was voted by sixteen of the respondents. The
fact that TRANSIMS cannot run on a single PC was identified as one of its
deficiencies by 11 of the respondents. All 28 respondents believe that it is not
77
very cost effective. Fourteen of the respondents believe that TRANSIMS requires
cumbersome data input and six respondents believe that outputs of TRANSIMS
are not interpretable. Eleven respondents would require TRANSIMS to have
easy integration with database and GIS capabilities. From the views of
respondents on TRANSIMS it seems that more research, testing and
documentation is still required on the development of TRANSIMS for the industry
to consider adopting it.
Private vs. Public Organization Needs
The limited number of responses from public agencies limited the comparison to
private agencies to only transportation planning software programs and
emissions models. Because there were only few public agency responses that
were analyzed, first, the general trend among private agencies was looked at.
Then, it was examined to see if the software programs used by public agencies
matched that of private agencies.
The most popular transportation planning software programs among private
consultants were CUBE (7), TRANSCAD (6), TRANPLAN (6), MINUTP (4),
EMME2 (2), TMODEL (2) and QRSII (2). Of these, three public agencies
reported using CUBE, three reported using TRANPLAN, one reported using
EMME2, and one reported using TMODEL for transportation planning. The
software programs used by public agencies were among the most popular
programs used by private agencies.
Similarly, private users named various versions of MOBILE as the most popular
tool for modeling emissions. It was also the most popular among public agencies.
Regarding their willingness to use new and developing software programs,
private consulting agencies were hesitant to use new software programs,
dependent mostly on the cost and the desires of their clients. One respondent
from a public agency reported that he would consider using a new software
78
program under certain circumstances, while another respondent said that he
would not.
Regarding their willingness to use TRANSIMS, private consulting agencies
seemed rather cautious, depending mostly on the cost compared to the improved
benefits. Of the small number of public responses, two respondents indicated
they would not be interested in using TRANSIMS.
Future Trends
One of the objectives of this research was to identify current and future trends in
the use of transportation modeling tools. As a result of the survey and the
literature review, the following observations can be made.
Although the general tendency is towards “traditional” type of planning tools,
there is a need for supporting capabilities such as microsimulation analysis and
GIS based visual support. In addition to the industry preferences and tendencies,
there are federal directions and requirements such as those for inclusion of
freight considerations in the planning process and integration of land use and
transportation modeling.
Overall, there is a need for tools that are capable of covering a wide range of
applications. Traditional package capabilities need to be complemented by other
tools or upgraded to include additional capabilities. Integrated tools seem to be
preferred by the users.
In transitioning from a current application to a new one, the level of integration
and interoperability as well as the ease of transition are major factors being
considered.
There is a strong push from the research community for tools with dynamic
network analysis capabilities. These tools seem to be more accurate in terms of
traffic flow estimations, impacts, and emissions modeling. Although an increasing
number of agencies are supporting the testing of these tools, it is not likely that
79
they will be widely adopted by the industry within the five-year time horizon of this
project.
As a next generation tool TRANSIMS has the potential to revolutionize
transportation and land use planning and modeling. TRANSIMS has the
capability to model the transportation system and the individuals who use it with
greater detail than ever before. However, such complexity comes at the price of
much greater data collection and computer resources. TRANSIMS requires
highly detailed data and road network information, and it is not as forgiving as
less complex software packages. This problem was discussed in a conversation
with a representative from the FHWA in October 2002 as it related to the
Portland Case Study. Potential TRANSIMS users need to decide if they have the
capabilities to provide such detailed data inputs, and if expending their resources
to provide such detailed input is worth the benefits of detailed microsimulation.
Still, TRANSIMS may become the best available option to accommodate
increased pressure from federal legislation such as ISTEA and the Clean Air Act
Amendments. TRANSIMS needs to be a user-friendly software program if it is to
be successful. This is expected to happen as demand for this program increases.
CONCLUSIONS
The NJDOT Bureau of Systems Development and Analysis has selected the
software package Cube Voyager as their main modeling platform. The results of
the survey that was performed as part of this study support the Bureau’s
selection of Cube Voyager. Cube Voyager, although relatively new compared to
other software packages listed in the survey is widely used by the New Jersey
Industry. Furthermore, Cube was among the software packages that survey
respondents indicated that are familiar with and which they would like to use in
place of other packages that they are currently using.
Additional tools or modeling software will be required for several applications,
which may not be performed using Cube Voyager. For these types of
applications, the Bureau of Systems Development and Analysis and other
80
Bureaus within the NJDOT would need to select the appropriate tools. In
selecting additional tools and modeling software, one should consider several
factors, including, the suitability of the software package for the particular
application and its capabilities, along with cost, and interconnectivity with other
software packages and tools currently available within the organization. The
TSSS tool that has been developed as part of this project may be used to review
the features and capabilities of various software packages, perform a
comparative evaluation of any two software packages and assist the NJDOT
personnel in selecting the additional modules and modeling software needed to
complement the capabilities of Cube Voyager and cover the Department’s
modeling needs.
81
APPENDICES
APPENDIX A.
TRANSIMS
One of the requirements of this study was to take a closer look into the newly
developed program, TRANSIMS. This appendix presents a comprehensive
review of TRANSIMS, including experiences from its applications. The modeling
philosophy of TRANSIMS is unique as compared to the other software packages
that are reviewed in previous sections. For this purpose, TRANSIMS has not
been included in the software review and summary matrix sections.
Introduction
Amendments to existing and other recent legislation created requirements that
could not be fully met with the current transportation modeling tools available.
The U.S. Department of Transportation, under TEA 21, funded the University of
California at Los Alamos National Laboratory (LANL) to design TRANSIMS to
address the requirements of the new legislation. Development of TRANSIMS has
been funded mainly by the Federal Highway Administration (FHWA) and the
Federal Transit Administration (FTA), with some additional funding through the
Environmental Protection Agency (EPA).
TRANSIMS uses a disaggregate approach to traffic modeling, providing more
accurate and comprehensive information on traffic, congestion, and pollution.
Populations are analyzed on an individual basis rather than a Travel Analysis
Zone (TAZ) as in traditional 4-step models. In addition, the entire transportation
network, including local streets, highway ramps, and transit routes are modeled.
Using survey data, a virtual population is created, representing the actual
community to be studied. Individual households and travelers with their own
activities patterns are used to create a set of travel plans, which are then
simulated in the transportation network.
82
TRANSIMS has the ability to model multiple modes of transportation, including
private auto, public transit, freight, and bicyclists and pedestrians, which interact
with each other on a second-by-second basis. Using a feedback mechanism,
travelers may change route or mode based on trip length, time, and perceived
level of service (LOS). By tracking individuals with various demographic
characteristics, TRANSIMS can also model the effect of a project on sub-
populations such as low-income or minority groups. (50)
Federal Legislation and the Need for TRANSIMS
The Intermodal Surface Transportation Efficiency Act (ISTEA) and the Clean Air
Act Amendments (CAAA) are the two most influential pieces of legislation when it
comes to TRANSIMS. Their analytical requirements exceed the capabilities of
the models that are currently being used. In their paper “TRANSIMS Model
Design Criteria as Derived from Federal Legislation”, Morrison and Loose point
the importance of addressing infrastructure, congestion, and air quality more
precisely to meet the demands of ISTEA and CAAA. (51)
ISTEA and CAAA requirements and TRANSIMS
The demands addressed by TRANSIMS are mentioned in this chapter. Title I of
ISTEA provides funding for projects that improve air quality as a result of
decreased congestion, improved safety, improved public transportation,
intermodal transportation projects, and traffic monitoring(51). Title III of ISTEA
requires the planning and management of transit programs, as well as a means
of analyzing proposed projects. ISTEA also requires that each state develops
and implements a state planning process. State Transportation Improvement
Program (STIP, created by ISTEA) requires that State Planning Organizations
and Metropolitan Planning Organizations (MPO’s) must submit plans that include
intermodal planning, a 20-year planning horizon, and coordinated state and local
plans that include congestion management strategies. A State Public
Transportation Management system is to be created to identify needs so that
cost effective strategies can be developed to maintain and improve public
83
transportation. A State Intermodal Management System is required to analyze
linkages between one or more modes of transportation. CAAA requires that
transportation planners must prepare long-range transportation demand forecast
and model air quality as a function of increased travel demand and changes in
transportation network. It also requires the development of a model that
recognizes differences in engineering design between vehicles and also requires
capabilities to model alternative fuel sources. Most of current models are not able
to fulfill these requirements to the extent that TRANSIMS is expected to.
Functional Requirements for TRANSIMS
The legislation described about requires that TRANSIMS is different from current
planning models, providing more accurate and detailed analysis. TRANSIMS
must be flexible and functional to transportation planners in numerous types of
applications, including those that necessitate intermodal applications. Other
modeling requirements according to Morrison and Loose(51) include:
• Land use and demographic characteristics of different regional
transportation domains.
• The Natural environment, including topography, meteorology, and
background pollution.
• A transportation network including minor arterials and all potential
nodes.
• Representative populations for residential, commercial, and
industrial entities.
• Unique travel decisions of individuals with a wide range of
socioeconomic characteristics.
• Detailed automobile and commercial transportation systems to
analyze the effects of different engines and fuels on air quality
emissions.
• The consequences of traffic on congestion and air quality. (51)
84
The individual level analysis associated with microsimulation will require the
representation of complicated behavior as well as choice/utility modeling that is
dependent on travel time, travel behavior, cost, and perceived quality of service.
The TRANSIMS model must consider the demographics of each individual
modeled to accurately portray their effect on fuel consumption and congestion.
Individual vehicle characteristics are also needed to model fuel consumption and
emissions. It is also necessary for TRANSIMS to accurately model land use
patterns. This is necessary to create activity zones and linking origins and
destinations.
TRANSIMS needs to accurately represent the transportation infrastructure,
including “intersection and roadway widths and lanes, grade, parking freight,
mode transfer facilities, HOV lane miles, node characteristics, roadway functional
class, and type and location of construction”. (51) Also modeled needs to be:
• Operational characteristics – channelization, traffic control, ramp
metering;
• HOV lanes;
• Public transit rights-of-way;
• Park and ride; and
• Travel cost data including tolls and congestion pricing.
Measures of Effectiveness and outputs that should be reported by TRANSIMS
include:
• Level of Service (LOS);
• Vehicle miles of travel and average daily traffic by vehicle class;
• Number of vehicles using HOV lanes;
• Proportion of vehicles congested or delayed;
• Proportion of travel time under congestion or delay;
• Nature and location of congestion and incidents;
• Average travel time per trip;
85
• Vehicle speed and acceleration;
• Vehicle, fuel, and engine characteristics; and
• Startup and idling.
Computer Requirements
A parallel computer system will decrease the time required to run the TRANSIMS
modules. A Linux cluster running RedHat Linux 6.2 with a 100-gigabyte disk
accessible from all 64 dual-processor nodes with Intel Pentium II 500 processors
was used in the Portland study. There was 1 gigabyte of memory per node and
a 100 megabit/sec Ethernet connection between the nodes. A shared memory
multi-processor system by Sun Microsystems was used for code development,
data analysis, network construction, and computations that required less than 14
processors. The system had 6 gigabytes of memory, 300 gigabytes of disk, and
a Solaris 7 operating system. (50)
The Six Modules of TRANSIMS
TRANSIMS is composed of 6 integrated modules: a Population Synthesizer, an
Activity Generator, a Router, a Microsimulator, a Selector and Iteration Database,
and an Emissions Estimator. The Population Synthesizer is based on a synthetic
population based on demographics obtained from census data and demographic
forecasts. The Activity Generator assigns activities to the synthetic travelers.
Each individual is assigned a daily list of activities including work, school, and
shopping. The Router provides travel plans for each individual by determining
the shortest route. The Microsimulator executes the travel plans created by the
Router and produces detailed information about individual vehicles and the
transportation network. Finally, the Emissions Estimator models the emissions of
nitrogen oxides, hydrocarbons, carbon monoxide, and carbon dioxide. Each
module is further described below.
86
Data Tables
A series of interconnected data tables are used in TRANSIMS. Each module
depends on the data found in some or all of these data tables. (53) These tables
include nodes, links, pocket lanes, parking locations, activity locations, process
links, transit stops and schedules, connectivity, signs, and signals and signal
phases.
The node table identifies each node as a point with X (Easting), Y (Northing), and
Z (Elevation) coordinates. Nodes do not represent intersections, but provide the
locations of all features and the anchors of link segments. The Portland Network
described in further detail later on in this report has approximately 101,000
nodes. (54)
The link table identifies all links, which connect two nodes. Links represent
roadways, walkways, and all connections between nodes by any mode of
transportation. Link tables identify the number of lanes on a link, the type of
vehicles and travel modes allowed (can be multimodal), and the speed. The
length of a link, link grade, capacity, and function class are also identified. The
Portland Network contains approximately 126,000 links. (54)
The pocket lane table identifies on which link each pocket lane lines, the starting
position, the length, the lane number, and the type of pocket lanes (turn, pull-out,
merge). The Portland Network contained approximately 4,400 pocket lanes.
Parking locations are places where vehicles may enter and exit links. This table
identifies the location of a parking entrance from the link, the capacity, the types
of vehicles permitted to park, and the type of parking place (parallel, driveway,
lot, park and ride, etc…) The Portland Network has approximately 123,000
parking locations (Henson, 2001).
Activity locations identify places from which household members travel and are
associated with the particular layer with which they are accessed from (i.e. auto,
87
walk, light rail, etc…). The link ID number that the activity is located is identified
in this table, as well as the X, Y and Z coordinates of node on which the activity
lies (Henson, 2001).
Process links are represented by process links that allow for travel between
parking, activities, and transit. These links are designated as walk links, and have
their own delays and costs. The process link table identifies the type of locations
that the link joins. The Portland Network had over 500,000 process links. (54)
Transit stops can be used by more than one transit route and can be connected
to other stops, parking, and activities with process links. The transit stop table
identifies the type of vehicles that stop at the location, the type of stop (stop or
station), the capacity of vehicles that can stop, and the node and link on which
the stop occurs. The Portland Network has approximately 8,000 transit stops. (54)
Transit routes and schedules are identified by a route ID with a departure time
and a transit stop ID. A schedule files identifies a list of stops and the time a
transit vehicle leaves the stop. (54)
A connectivity table identifies which movements are allowed at a node. The
node, incoming and outgoing links, and incoming and outgoing lanes are
identified in these tables. The traffic signal and phase’s table can be created
based on actual data. Additional tables can be created for detectors and signal
coordinators. Unsignalized nodes (stop sign, yield sign, or nothing) can also be
represented. (54)
Population Synthesizer
The Population Synthesizer creates a population identical in the number of
people and the number of households to the actual population modeled using
census summary data and Public Use Microdata Samples (PUMS) detailed
census sample. These sources provide sufficient information to assign
demographic characteristics to each household as well as determining the
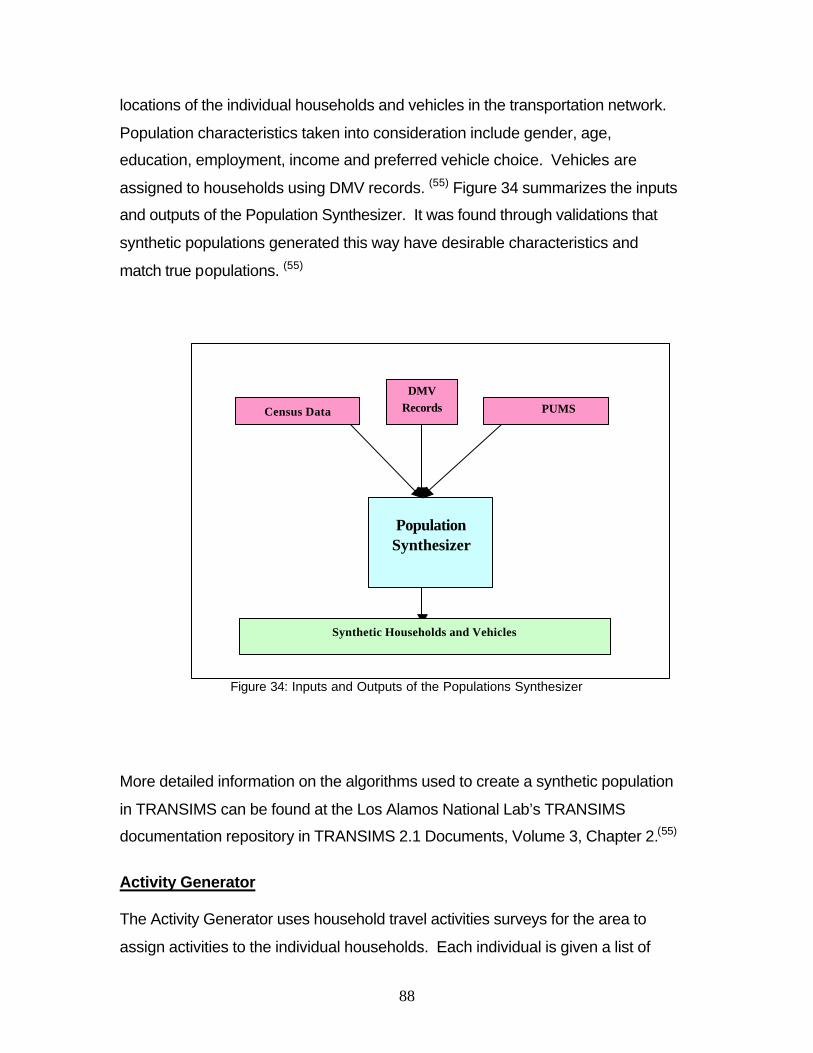
88
locations of the individual households and vehicles in the transportation network.
Population characteristics taken into consideration include gender, age,
education, employment, income and preferred vehicle choice. Vehicles are
assigned to households using DMV records. (55) Figure 34 summarizes the inputs
and outputs of the Population Synthesizer. It was found through validations that
synthetic populations generated this way have desirable characteristics and
match true populations. (55)
Figure 34: Inputs and Outputs of the Populations Synthesizer
More detailed information on the algorithms used to create a synthetic population
in TRANSIMS can be found at the Los Alamos National Lab’s TRANSIMS
documentation repository in TRANSIMS 2.1 Documents, Volume 3, Chapter 2.(55)
Activity Generator
The Activity Generator uses household travel activities surveys for the area to
assign activities to the individual households. Each individual is given a list of
Population Synthesizer
Census Data
DMV Records PUMS
Synthetic Households and Vehicles
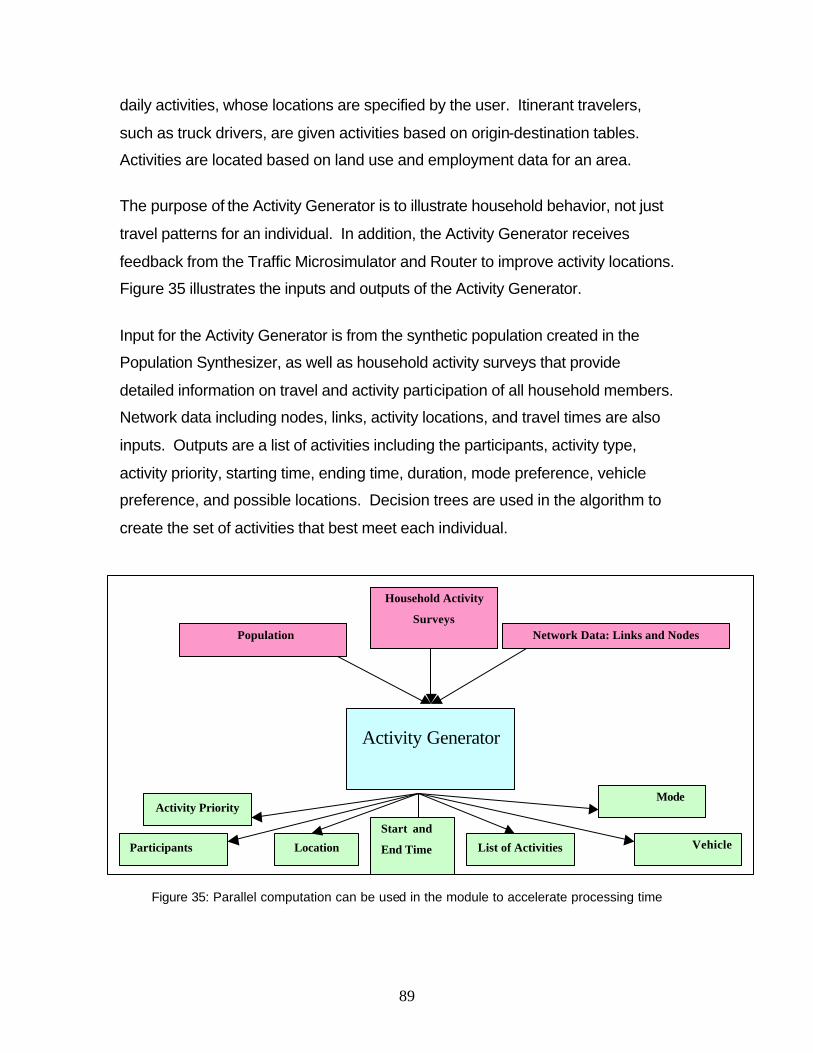
89
daily activities, whose locations are specified by the user. Itinerant travelers,
such as truck drivers, are given activities based on origin-destination tables.
Activities are located based on land use and employment data for an area.
The purpose of the Activity Generator is to illustrate household behavior, not just
travel patterns for an individual. In addition, the Activity Generator receives
feedback from the Traffic Microsimulator and Router to improve activity locations.
Figure 35 illustrates the inputs and outputs of the Activity Generator.
Input for the Activity Generator is from the synthetic population created in the
Population Synthesizer, as well as household activity surveys that provide
detailed information on travel and activity participation of all household members.
Network data including nodes, links, activity locations, and travel times are also
inputs. Outputs are a list of activities including the participants, activity type,
activity priority, starting time, ending time, duration, mode preference, vehicle
preference, and possible locations. Decision trees are used in the algorithm to
create the set of activities that best meet each individual.
Figure 35: Parallel computation can be used in the module to accelerate processing time
Activity Generator
Population
Synthesizer
Household Activity Surveys
Network Data: Links and Nodes
List of Activities
Mode
PreferenVehicle
Choice Location Participants
Activity Priority
Start and
End Time
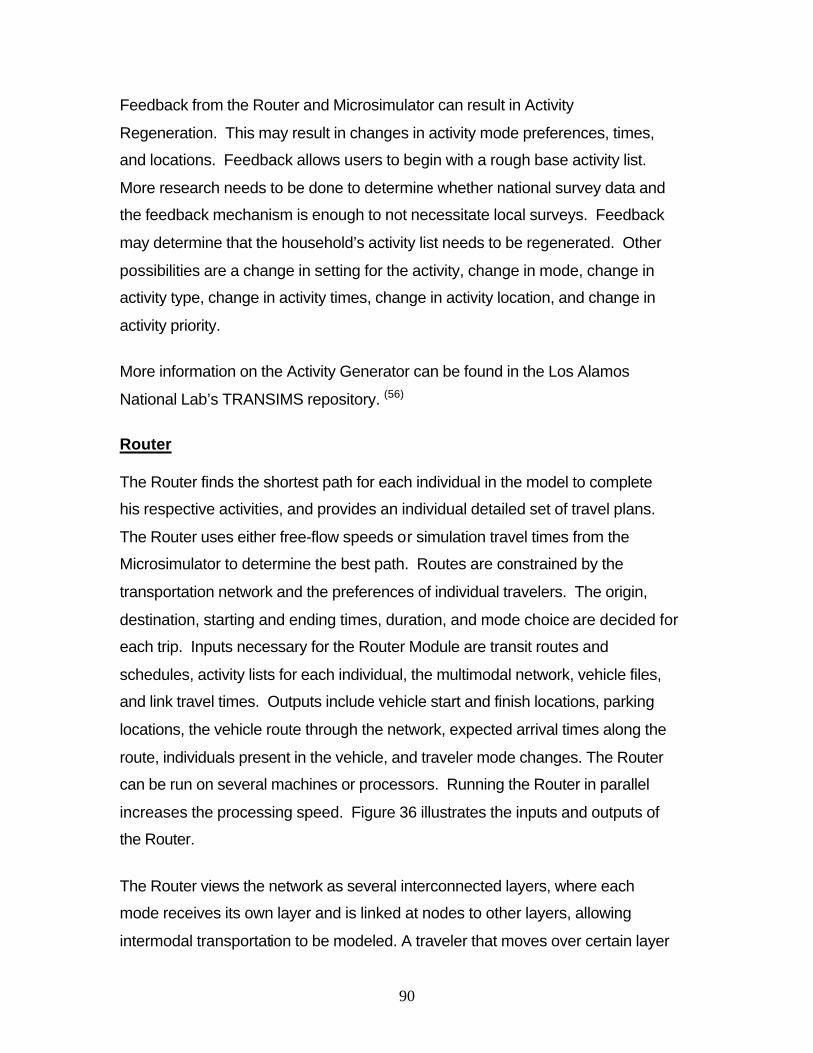
90
Feedback from the Router and Microsimulator can result in Activity
Regeneration. This may result in changes in activity mode preferences, times,
and locations. Feedback allows users to begin with a rough base activity list.
More research needs to be done to determine whether national survey data and
the feedback mechanism is enough to not necessitate local surveys. Feedback
may determine that the household’s activity list needs to be regenerated. Other
possibilities are a change in setting for the activity, change in mode, change in
activity type, change in activity times, change in activity location, and change in
activity priority.
More information on the Activity Generator can be found in the Los Alamos
National Lab’s TRANSIMS repository. (56)
Router
The Router finds the shortest path for each individual in the model to complete
his respective activities, and provides an individual detailed set of travel plans.
The Router uses either free-flow speeds or simulation travel times from the
Microsimulator to determine the best path. Routes are constrained by the
transportation network and the preferences of individual travelers. The origin,
destination, starting and ending times, duration, and mode choice are decided for
each trip. Inputs necessary for the Router Module are transit routes and
schedules, activity lists for each individual, the multimodal network, vehicle files,
and link travel times. Outputs include vehicle start and finish locations, parking
locations, the vehicle route through the network, expected arrival times along the
route, individuals present in the vehicle, and traveler mode changes. The Router
can be run on several machines or processors. Running the Router in parallel
increases the processing speed. Figure 36 illustrates the inputs and outputs of
the Router.
The Router views the network as several interconnected layers, where each
mode receives its own layer and is linked at nodes to other layers, allowing
intermodal transportation to be modeled. A traveler that moves over certain layer
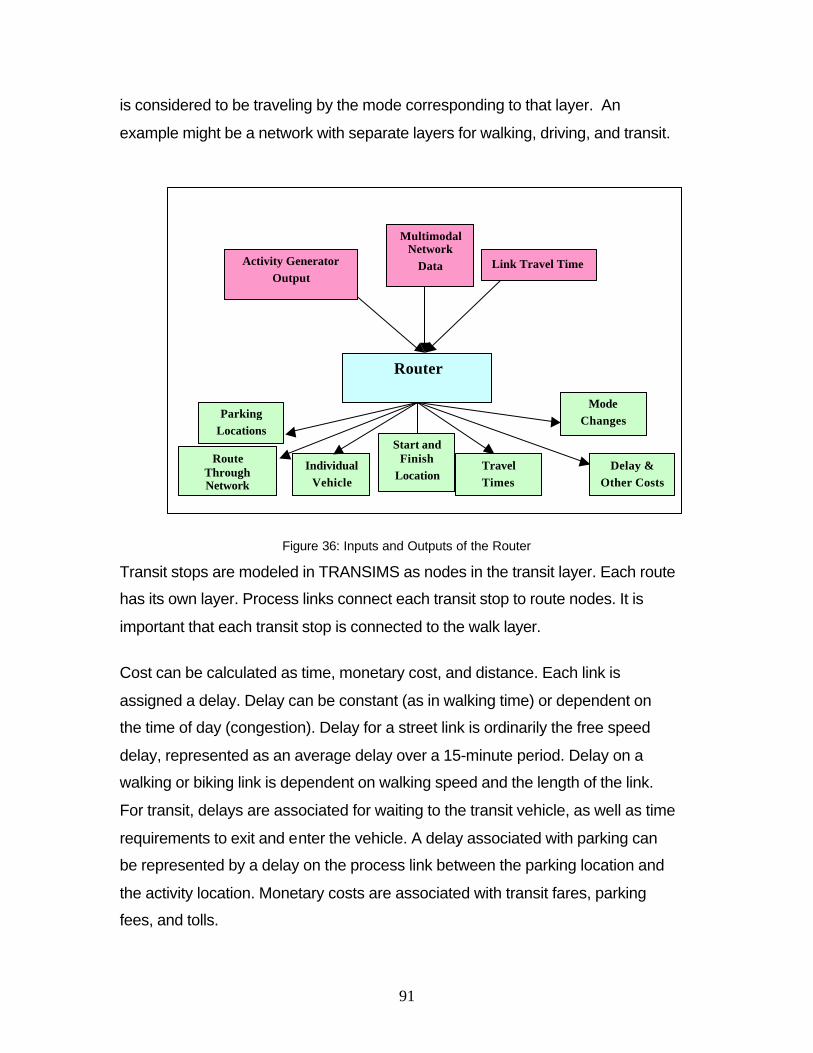
91
is considered to be traveling by the mode corresponding to that layer. An
example might be a network with separate layers for walking, driving, and transit.
Figure 36: Inputs and Outputs of the Router
Transit stops are modeled in TRANSIMS as nodes in the transit layer. Each route
has its own layer. Process links connect each transit stop to route nodes. It is
important that each transit stop is connected to the walk layer.
Cost can be calculated as time, monetary cost, and distance. Each link is
assigned a delay. Delay can be constant (as in walking time) or dependent on
the time of day (congestion). Delay for a street link is ordinarily the free speed
delay, represented as an average delay over a 15-minute period. Delay on a
walking or biking link is dependent on walking speed and the length of the link.
For transit, delays are associated for waiting to the transit vehicle, as well as time
requirements to exit and enter the vehicle. A delay associated with parking can
be represented by a delay on the process link between the parking location and
the activity location. Monetary costs are associated with transit fares, parking
fees, and tolls.
Router
Activity Generator Output
Multimodal Network
Data Link Travel Time
Travel Times
Mode Changes
Delay & Other Costs
Individual Vehicle
Route Through Network
Parking Locations
Start and Finish
Location
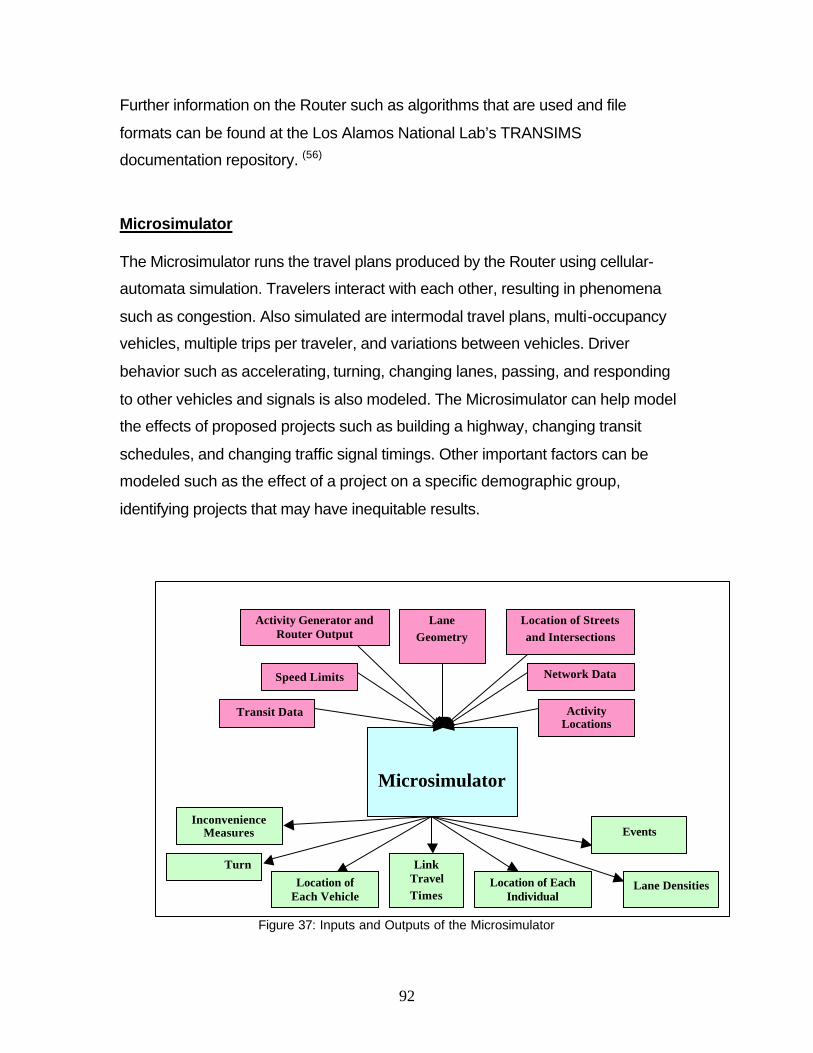
92
Microsimulator
Activity Generator and Router Output
Lane Geometry
Location of Streets and Intersections
Location of Each Individual
Events
Lane DensitiesLocation of Each Vehicle
Turn
Inconvenience Measures
Link Travel Times
Speed Limits Network Data
Activity Locations
Further information on the Router such as algorithms that are used and file
formats can be found at the Los Alamos National Lab’s TRANSIMS
documentation repository. (56)
Microsimulator
The Microsimulator runs the travel plans produced by the Router using cellular-
automata simulation. Travelers interact with each other, resulting in phenomena
such as congestion. Also simulated are intermodal travel plans, multi-occupancy
vehicles, multiple trips per traveler, and variations between vehicles. Driver
behavior such as accelerating, turning, changing lanes, passing, and responding
to other vehicles and signals is also modeled. The Microsimulator can help model
the effects of proposed projects such as building a highway, changing transit
schedules, and changing traffic signal timings. Other important factors can be
modeled such as the effect of a project on a specific demographic group,
identifying projects that may have inequitable results.
Figure 37: Inputs and Outputs of the Microsimulator
Transit Data
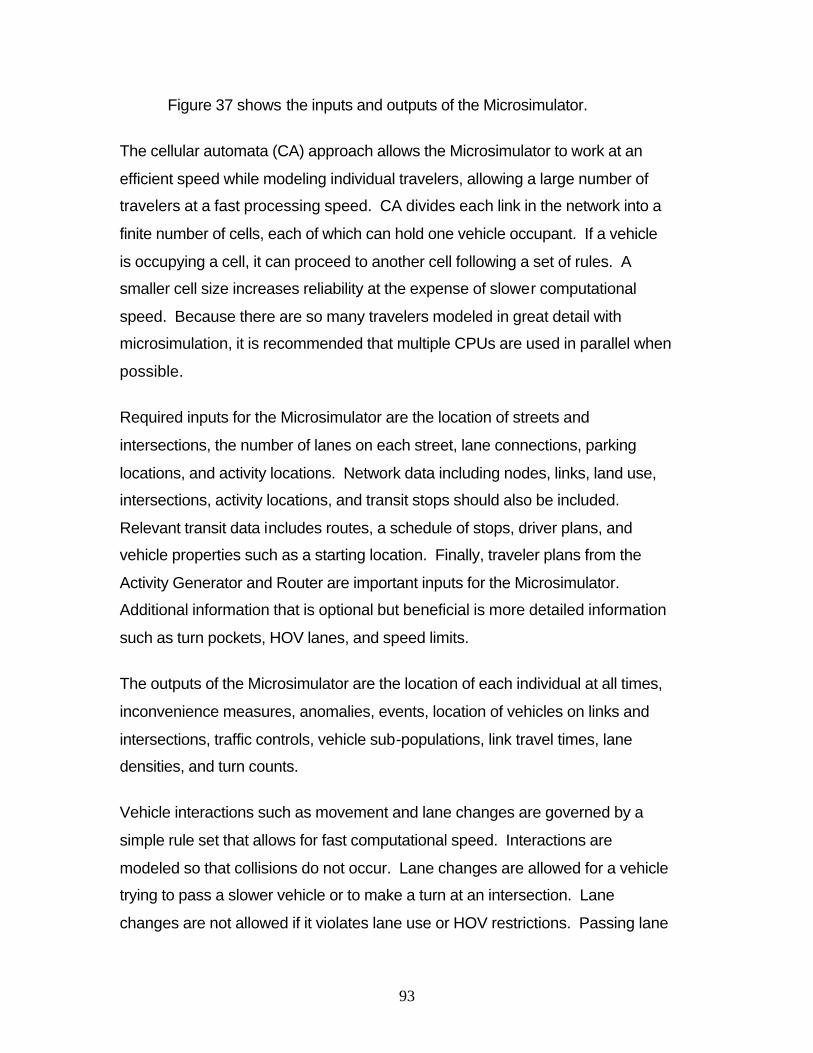
93
Figure 37 shows the inputs and outputs of the Microsimulator.
The cellular automata (CA) approach allows the Microsimulator to work at an
efficient speed while modeling individual travelers, allowing a large number of
travelers at a fast processing speed. CA divides each link in the network into a
finite number of cells, each of which can hold one vehicle occupant. If a vehicle
is occupying a cell, it can proceed to another cell following a set of rules. A
smaller cell size increases reliability at the expense of slower computational
speed. Because there are so many travelers modeled in great detail with
microsimulation, it is recommended that multiple CPUs are used in parallel when
possible.
Required inputs for the Microsimulator are the location of streets and
intersections, the number of lanes on each street, lane connections, parking
locations, and activity locations. Network data including nodes, links, land use,
intersections, activity locations, and transit stops should also be included.
Relevant transit data includes routes, a schedule of stops, driver plans, and
vehicle properties such as a starting location. Finally, traveler plans from the
Activity Generator and Router are important inputs for the Microsimulator.
Additional information that is optional but beneficial is more detailed information
such as turn pockets, HOV lanes, and speed limits.
The outputs of the Microsimulator are the location of each individual at all times,
inconvenience measures, anomalies, events, location of vehicles on links and
intersections, traffic controls, vehicle sub-populations, link travel times, lane
densities, and turn counts.
Vehicle interactions such as movement and lane changes are governed by a
simple rule set that allows for fast computational speed. Interactions are
modeled so that collisions do not occur. Lane changes are allowed for a vehicle
trying to pass a slower vehicle or to make a turn at an intersection. Lane
changes are not allowed if it violates lane use or HOV restrictions. Passing lane
94
changes calculate gaps in the current and new lanes. If the gaps satisfy
constraints, a lane change is attempted. A similar method is used to model
merging lanes.
Mass transit vehicles are given priority in lane changes. A mass transit vehicle
will enter a transit stop if it is not full and people are waiting, if a passenger
wishes to get off, or if the driver has a scheduled departure time for the stop.
Further information on the Microsimulator, including greater detail on cellular
automata theory, can be found at the Los Alamos National Lab’s TRANSIMS
documentation repository. (56)
Selector and Iteration Database
As mentioned earlier, TRANSIMS uses iterative feedback, interconnecting all
modules to each other. This feedback mechanism accounts for learned behavior
among the travelers. An important feedback example is the loop between the
Router and the Microsimulator. The Router plans routes based on free speed
travel times on the network. The Microsimulator model actual travel times which
are sent back to the router for correction for traveler interactions. The
Selector/Iteration Database chooses which travelers are to be redirected through
the Router with new travel time information.
The Iteration Database can be considered the input for the selector. It provides
information regarding the travelers, their planned activities, routes, and location
at all times, as well as experiences as derived from Microsimulation output. The
output is a list of travelers that will be reassigned activities. Figure 38 illustrates
the flow of in formation in the Selector/Iteration Module.
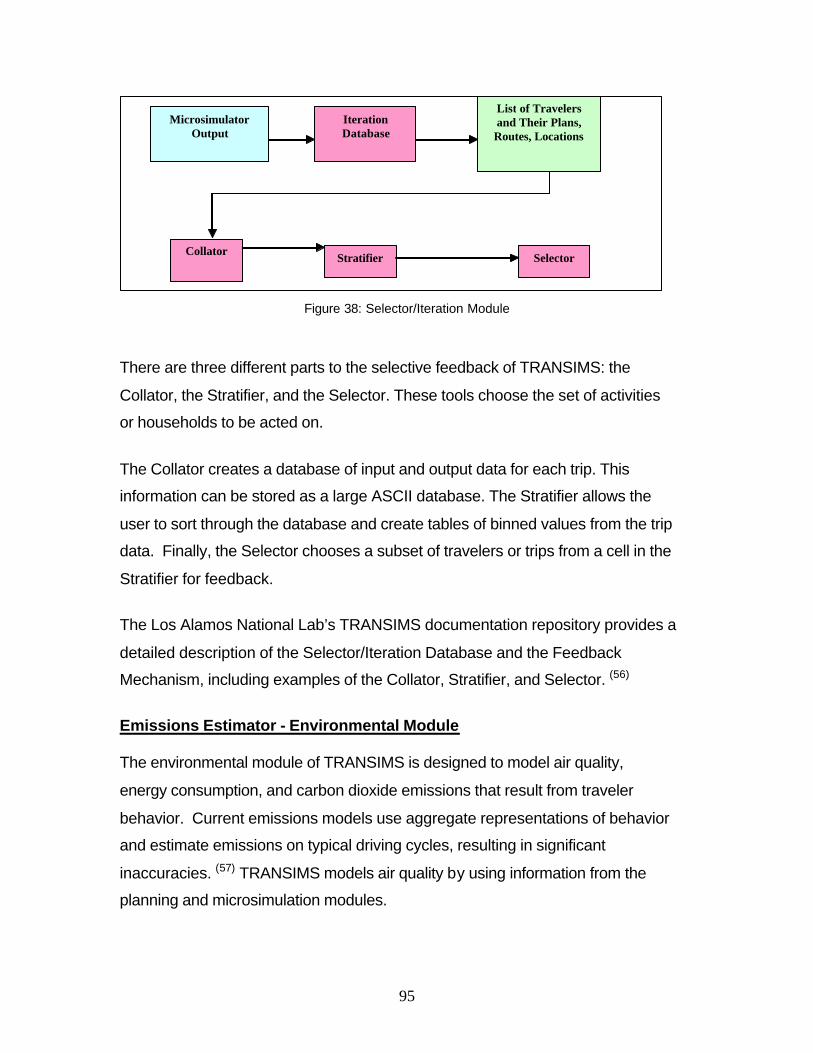
95
Figure 38: Selector/Iteration Module
There are three different parts to the selective feedback of TRANSIMS: the
Collator, the Stratifier, and the Selector. These tools choose the set of activities
or households to be acted on.
The Collator creates a database of input and output data for each trip. This
information can be stored as a large ASCII database. The Stratifier allows the
user to sort through the database and create tables of binned values from the trip
data. Finally, the Selector chooses a subset of travelers or trips from a cell in the
Stratifier for feedback.
The Los Alamos National Lab’s TRANSIMS documentation repository provides a
detailed description of the Selector/Iteration Database and the Feedback
Mechanism, including examples of the Collator, Stratifier, and Selector. (56)
Emissions Estimator - Environmental Module
The environmental module of TRANSIMS is designed to model air quality,
energy consumption, and carbon dioxide emissions that result from traveler
behavior. Current emissions models use aggregate representations of behavior
and estimate emissions on typical driving cycles, resulting in significant
inaccuracies. (57) TRANSIMS models air quality by using information from the
planning and microsimulation modules.
Stratifier Collator Selector
Iteration Database
Microsimulator Output
List of Travelers and Their Plans,
Routes, Locations
96
According to Williams et al(57), TRANSIMS must accomplish four tasks to
translate driver behavior into environmental consequences: estimate emissions;
describe the atmospheric conditions into which the contaminants are emitted;
describe the local transport and dispersion; and describe any chemical reactions
that occur during transport and dispersion. The required input for the emissions
module includes surface characteristics, large-scale meteorology, terrain, and
traveler behavior and vehicle characteristics, in the form of inputs from the
TRANSIMS planner and traffic microsimulation.
Disaggregate modeling allows TRANSIMS to account for cold-starts,
malfunctioning vehicles, evaporative emissions, variations in engine and fuel-
types among various vehicles, as well as variation in the type of driving being
done. Because cold-starting vehicles release considerably higher emissions that
one at normal temperature, a case where many vehicles are making frequent
short trips may significantly increase emissions. Similarly, it has been found that
10% of vehicles can account for most of the emissions, emphasizing the
importance of modeling malfunctioning vehicles. TRANSIMS can analyze
individual vehicles and determine if they are idle or running, leading to effective
modeling of evaporative emissions. TRANSIMS also can model the effects of
topography (steep grades) and meteorological effects (temperature and winds).
Atmospheric conditions are modeled using a meteorological module called
HOTMAC (Higher Order Turbulence Model for Atmospheric Circulation).
HOTMAC combines data for horizontal wind components, temperature, moisture,
and turbulent kinetic energy, HOTMAC models wind, heat transfer, and solar and
terrestrial radiation effects of forest and urban canopies. Using the above,
differences in urban and non-urban surfaces are modeled. Similarly, the effect of
air pollution caused by vehicle emissions becoming trapped between buildings in
urban areas, an “urban canyon”, is also demonstrated. (57)
The Transportation and Dispersion Module for the emissions module of
TRANSIMS is based on RAPTAD (Random Particle Transport and Dispersion)
97
Model. This turbulence based model shows how pseudo-particles are
transported and takes into account wind speed differences. The Air Chemistry
Module used is the Urban Airshed Model. (57)
The TRANSIMS Visualizer
The Visualizer requires Sun Solaris and Linux operating systems. Hardware
requirements are a three-dimensional capable graphics board (Sun workstations)
or an OpenGL-compatible graphics board (Linux). A three button mouse is
required for Sun Solaris systems and recommended for Linux systems. Required
software includes OpenGL or Mesa3D-graphics library and GLUT, a multi-
platform windowing system library. The Visualizer allows users to view and
manipulate 3-D objects. (56)
Dallas-Ft. Worth Case Study
Background
The purpose of the Dallas-Ft. Worth study was to demonstrate a working traffic
microsimulation. This study was meant to test features of the Interim Operational
Capacity (IOC). This IOC focuses primarily on microsimulation. Subsequent
IOC’s were to focus on activity generation, planning and routing, and the
environmental modules of TRANSIMS. Los Alamos National Laboratory and the
North Central Texas Council of Governments developed the case study. The
study investigated further areas of research necessary for future TRANSIMS
development. Also, the network detail necessary and data requirements for
TRANSIMS were studied.
A 25-square–mile microsimulation study region was selected for its mix of
residences and work places, range of roadway types, recurring and non-recurring
peak period traffic congestion, minimal transit and pedestrian activities, and a
multi-use activity center at the center of the region.
98
The Dallas-Fort Worth Network
The network coding structure consists of tables maintained in an Oracle
database. Separate tables for nodes, links, pocket lanes, parking, lane
connectivity, traffic signal phasing, and traffic signal timings are used. Several
steps needed to be taken to modify the initial 1990 travel model network.
Network geometries needed to be reviewed so that actual geometries were
depicted. Local streets needed to be added. Intersection and signal details were
also added to the network. Twenty-four hour production-attraction person trip
tables also needed to be modified for TRANSIMS.
Populations and Activities
Populations were generated using data from the National Personal
Transportation Survey (NPTS) and the PUMS data from the U.S. Census
Bureau. This information was used to create traveler demographics. Activities
were created according to production-attraction matrices from NCTCOG.
NCTOG provided production-attraction pairs for over 10 million trips for a 24-hour
period. The trip types are home-based work, home-nonwork, nonhome-based,
and other. A separate traveler was created for each activity.
Router
Individual route plans are assigned to each individual to meet their daily list of
activities. At the time of the Dallas-Fort Worth Study, TRANSIMS ran on fixed
route plans, not allowing a traveler to changed the sequence of links once
simulation has started. Microsimulation is run on an initial plan set. A certain
percentage of trips are then rerouted using travel times from the microsimulation
in an iterative fashion.
Microsimulation
Microsimulation for the Dallas-Fort Worth was run on five networked SUN
workstations. This allowed a five-hour microsimulation between 5:00 and 10:00
A.M. to run in real time.
99
Calibration
The microsimulation was calibrated with simple network such as a traffic circle,
an on-ramp, a left turn, and a signalized intersection.
Results
This study tested the results of three infrastructure projects on populations of
travelers. The three scenarios were a 1990 base case, an addition of lanes to the
LBJ Freeway, and increased capacity on the arterial roads of the local network.
Information on individual travelers allowed new analysis methods. Measures of
effectiveness for the study included total vehicle miles, total vehicle hours, travel
time, and average speed.
Dallas-Fort Worth Case Study Source
The information pertaining to the Dallas-Fort Worth Case Study was based
primarily on the 1996 Los Alamos National Laboratory document, “The Dallas-Ft.
Worth Case Study,” Barrett et al. Information needs in greater detail should be
referred to this document.(58)
Portland, Oregon Case Study
According to the Portland Study reports provided by LANL, the purpose of the
Portland study is to see how TRANSIMS works in a regional setting on “available
computers in a reasonable amount of time.” (54) In addition, the study is to show
how TRANSIMS responds to variables and conditions important to planning
organizations, such as parking costs and transit availability and further review the
IOC of activity generation, planning and routing, and the environmental modules
of TRANSIMS.
Purposes of the Portland Study
Pendyala, of Florida Department of Transportation, states, “the purpose of the
Portland Study is not to develop a complete calibrated model of 1996 Portland.
100
Rather, it allowed the developers of the system to understand transportation
planning methods and the models and data that support these methods.”(54)
Pendyala also gives three other purposes of the study. The first is to run the
software for a regional problem in a reasonable about of time (under 24 hours for
each module). Secondly, the study was to show that TRANSIMS could be
calibrated to use in forecasting and respond to changes in variables important to
planning organizations such as parking costs and household income. Finally,
TRANSIMS output needed to match traffic and transit counts for a base year.(54)
The Portland Network
No new data was collected for the Portland Study, although much work was
required to make existing data compatible with TRANSIMS. The most difficult
task associated with preparing data for TRANSIMS was developing the roadway
network to include all local streets, land-use characteristics on a block face, land
connectivity at intersections, intersection signalizations, and transit schedules,
routes, and stops. Automated procedures were used to generate lane
connectivity. Also, generic traffic signals were used in the study. The commercial
version will have a network editor to simplify network construction.
There are 475,246 nodes and 650,994 links in the TRANSIMS network. There
are 506,138 nodes, 1,104,177 links, and 3,287,972 edges in the internal Route
Planner network.
Errors associated with the network occurred because of human mistakes and
inaccuracies in network data. Some human errors included reverse lane
connectivity and inconsistent link attributes (speed limit, number of lanes). In
addition, the Portland network was based on the TIGER street data, digitized
from the U.S. Geological Survey topographic maps. These maps contain many
topological errors. Other problems are listed below.
101
Ramps and other road segments beginning and ending at the same node were
interpreted by the microsimulator to be only a point.
Because the original data was two-dimensional, intersecting overpasses and
underpasses were connected by nodes, allowing a simulated vehicle to drive off
an overpass onto an underpass. Such nodes were divided into two or more
nodes existing at different elevations. Some links that were not joined together
and needed to manually joined. Links with short lengths caused traffic problems
and needed to be merged with longer links.
All nodes in the network were given an ID and X (Easting), Y (Northing), and Z
(Elevation) coordinates from ArcView. The entire node table was approximately
3.5 MB, containing nearly 100,500 records.
Activity locations are represented as generic points for residential and work
locations. All links have activity locations except for bridges, ramps, and
freeways. Required data for activity locations includes an ID, node, link, offset,
and layer (default walk). Optional data was up to the user to define. In this case,
geographic data was used such as Traffic Analysis Zones. Other activity
locations were households, schools, colleges, number of employees, park area,
number of households per acres, distance to the nearest transit stop,
Origin/Destination data, river zones, urban zones, and parking zones. The final
activity table contained 243,400 records and was 35.6 MB.
Transit tables included information from two agencies: Tri-Met and C-Tran.
Transit stops were provided in ArcView and text format. Some transit stops were
originally placed on the wrong side of the street, which needed to be corrected by
moving the stop. Transit schedules were provided and converted into an
acceptable format for TRANSIMS. Transit routes were created by a custom
ArcView Network Analyst tool written by Metro. There were sometimes problems
with connectivity problems that frequently had to be checked.
102
Traffic control tables for Phasing Plan, Timing Plan, Signal Coordinator, and
Detector tables were generated using the Create Traffic Controls Program.
Modifications to the automatically generated controls included the removal of
signals that were generated on freeway links.
Other tables available in TRANSIMS that were not used in this study are Speed
Table, Lane Use Table, Barrier Table, and Turn Prohibition Table.
Population
Portland Metro provided a 1996 forecast to represent household size, age of
head of household, and annual household income. The 1990 STF-3A and PUMS
data for Oregon and Washington were obtained from the U.S. Census Bureau.
This provided household and demographic information.
Portland Metro forecasted 636,533 households, compared to the actual 636,389
households in the greater Portland area. Size, age, and income demographics
match closely to actual. Spatial distribution and the number of vehicles for
households also statistically match. Detailed demographic information on
households and individuals is available.
Activities
Activities were generated for each individual, as well as itinerant travelers and
freight trips. Activities are chosen based on a simple location choice model, and
mode and final location choices are made through feedback loops. Portland
Metro conducted a two-day activity survey of 5863 households.
Router
Activity input for the Router was divided into population, trucks, and itinerants.
The Router creates a plan files for each trip containing starting and ending
locations, start time, expected duration, distance traveled, and mode. Nine
transportation modes were used: auto, walk, bike, transit, light rail, school bus,
inter-household shared ride, and park and ride.
103
Microsimulation
The Microsimulator realistically modeled traffic jams, difficulty in left turns and
lane changes, delayed mass transit, full mass transit, and waiting through
multiple cycles of traffic signals.
Emissions Estimator
The Emissions Estimator requires output from the Traffic Microsimulator for input.
Fleet distribution was additional input that was required, divided into 23
subcategories of Light-Duty Vehicles and Heavy-Duty Vehicles.
A 24-hour TRANSIMS Microsimulation was run, providing the input for the
emissions estimator. Eight output files were collected as follows: 3 velocity data
files for auto, truck and bus velocities; 4 energy summary output files; and a
traveler even file.
The initial Emissions Estimator for autos took 34.5 hours to run. Velocity files
were divided to 24 files (one per timestep output), resulting in a run time of 4
hours.
Portland Study Source
The information pertaining to the Portland Case-Study was based primarily on
the 2002 Los Alamos National Laboratory document, “Portland Study Reports,”
Barrett et al. Informational needs in greater detail should be referred to this
document. (54)
Diamond Drive Local Engineering Study
Unlike the above TRANSIMS case studies that were regional planning studies,
the Los Alamos National Laboratory used TRANSIMS to perform a local
engineering study on the conversion of a local road, Diamond Drive, from four
lanes to three lanes due to safety concerns.
104
Four cases were analyzed in the study: 1) a four-lane versus a three-lane road;
2) the morning and evening peak traffic conditions; 3) the location of the merge
relative to a large intersection; and 4) potential traffic flux uncertainties up to 20%
in the morning peak.
The cellular automata were set for a speed limit of 35 mph. The Diamond Drive
Network was based on overlaying roads and parking lots on a satellite photo.
Lanes, turning movements, and signal timings were specified for each
intersection. Parking lots were created as places for vehicles to begin and end
trips, taking the place of activity locations for this study. Also modeled were turn
pockets and merges. Traveler origin-destination tables were created based on
turn counts. Start times were generated randomly. Travel time was used as a
measure of effectiveness for this study. The model was not calibrated to real
traffic data. It was determined that TRANSIMS provided reasonable results to
what was expected.
The conclusion of this study was that reducing Diamond Drive from four lanes to
three lanes would not be a problem during normal operation except for slightly
longer travel times. The morning peak hour, however, would be operating near
capacity and could experience traffic delays. (59)
APPENDIX B. SOFTWARE MATRIX
Attachment: Software Matrix.xls Included in the enclosed CD ROM. Also available through: http://www.cait.rutgers.edu/faculty/boile/index.html
APPENDIX C. USER SURVEY INSTRUMENT
The survey instrument is shown below. It can be also accessed at: Attachment: Survey Instrument.pdf http://www.cait.rutgers.edu/faculty/boile/index.html
Survey of Transportation, Land Use and Simulation Software Packages
NJDOT Project #2001-19
THE FUTURE OF TRANSPORTATION MODELING
Dear Transportation Professional: Through project #2001-19 “The future of Transportation Modeling”, NJDOT wishes to evaluate the future trends and directions of transportation modeling with an emphasis on the practical side. Traditional modeling processes and programs will be compared with next generation alternatives and recommendations will be made on which ones are likely to become the next standard. A fundamental part of this project is a survey of various organizations to determine the current use of software packages and anticipated future trends. To help us achieve the objectives of this project, we ask you to please complete the following survey and return it to us. Upon completion of the project, we will be glad to send you a copy of the survey results and a document containing a comparative review of various transportation software packages. Thank you in advance for your help. Please complete and return this survey by September 27 You may send your response electronically to: [email protected] or [email protected] or to the address above, attention Ms. Tejal Patel.
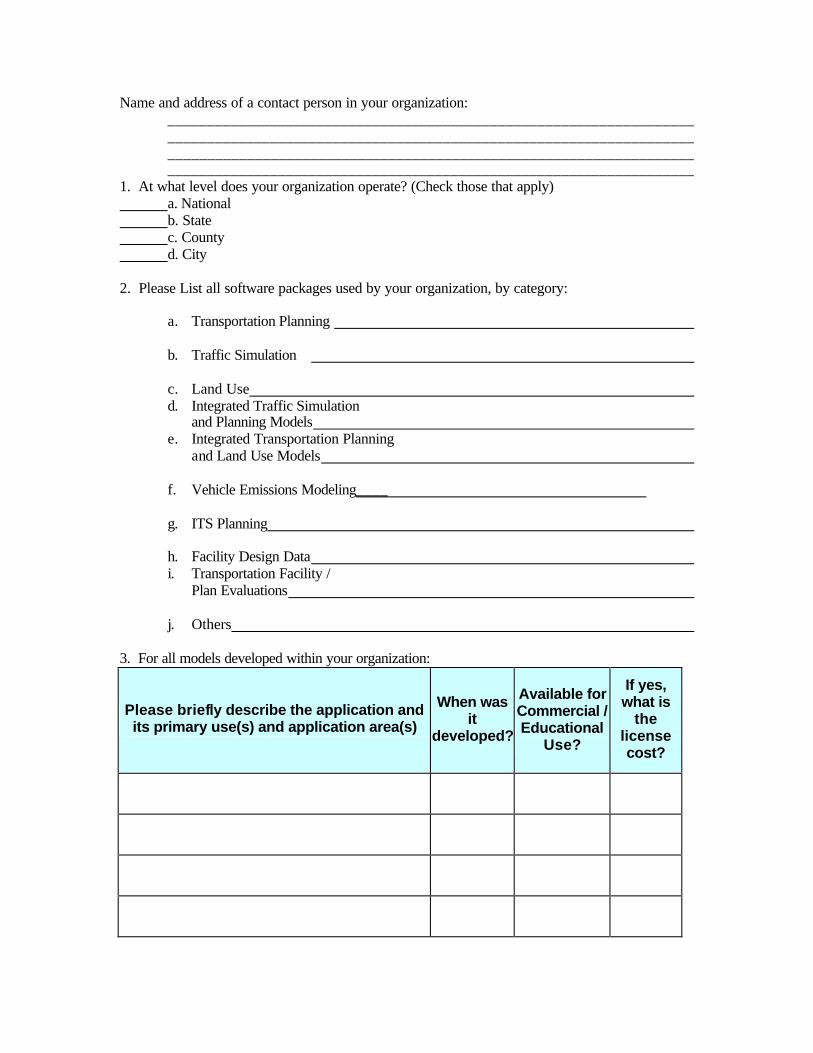
Name and address of a contact person in your organization: ___________________________________________________________________ ___________________________________________________________________ ___________________________________________________________________ ___________________________________________________________________ 1. At what level does your organization operate? (Check those that apply) a. National b. State c. County d. City 2. Please List all software packages used by your organization, by category:
a. Transportation Planning b. Traffic Simulation
c. Land Use d. Integrated Traffic Simulation
and Planning Models e. Integrated Transportation Planning
and Land Use Models
f. Vehicle Emissions Modeling____ g. ITS Planning
h. Facility Design Data i. Transportation Facility /
Plan Evaluations
j. Others
3. For all models developed within your organization:
Please briefly describe the application and its primary use(s) and application area(s)
When was it
developed?
Available for Commercial / Educational
Use?
If yes, what is
the license cost?
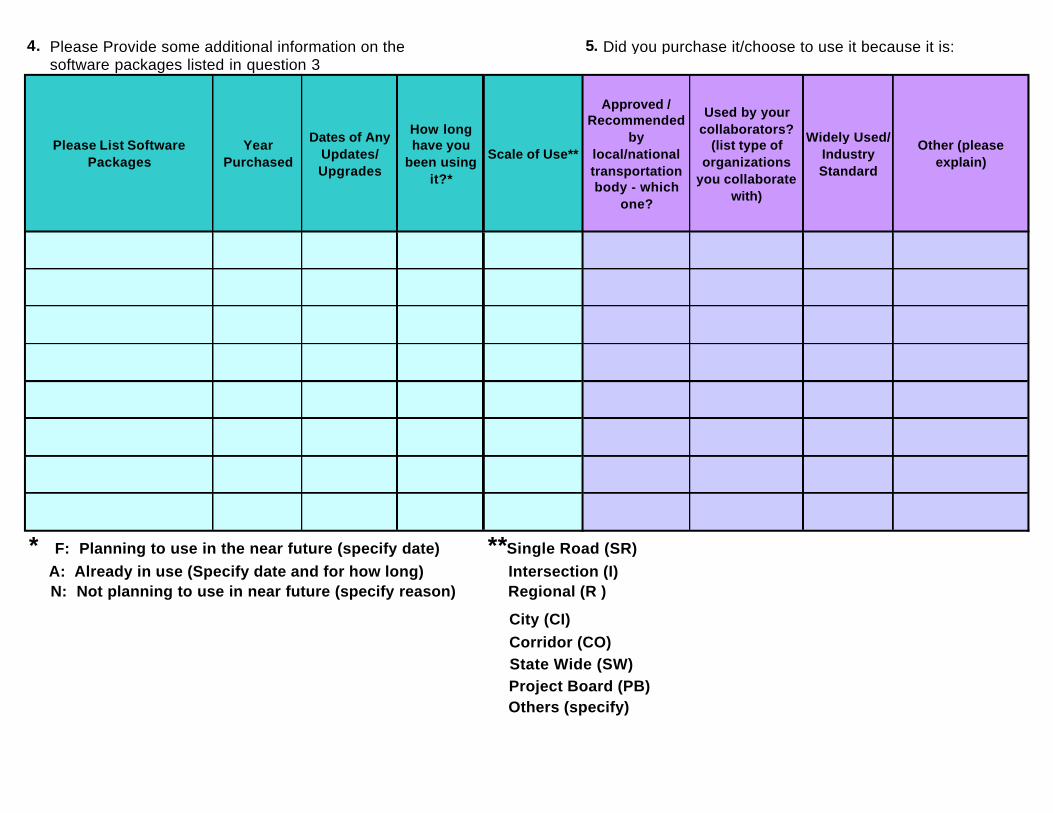
4. Please Provide some additional information on the 5. Did you purchase it/choose to use it because it is: software packages listed in question 3
Please List Software Packages
Year Purchased
Dates of Any Updates/ Upgrades
How long have you
been using it?*
Scale of Use**
Approved / Recommended
by local/national transportation body - which
one?
Used by your collaborators?
(list type of organizations
you collaborate with)
Widely Used/ Industry Standard
Other (please explain)
* F: Planning to use in the near future (specify date) **Single Road (SR) A: Already in use (Specify date and for how long) Intersection (I) N: Not planning to use in near future (specify reason) Regional (R )
City (CI) Corridor (CO) State Wide (SW) Project Board (PB) Others (specify)
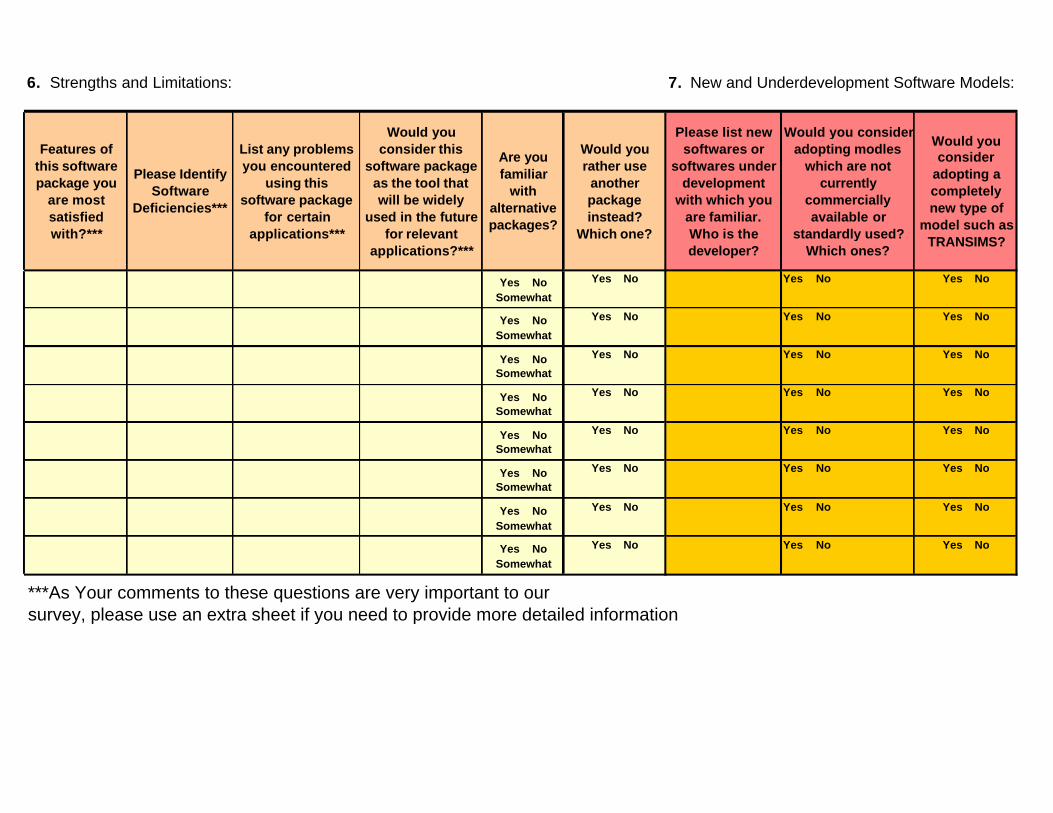
6. Strengths and Limitations: 7. New and Underdevelopment Software Models:
Features of this software package you
are most satisfied with?***
Please Identify Software
Deficiencies***
List any problems you encountered
using this software package
for certain applications***
Would you consider this
software package as the tool that will be widely
used in the future for relevant
applications?***
Are you familiar
with alternative packages?
Would you rather use
another package instead?
Which one?
Please list new softwares or
softwares under development
with which you are familiar. Who is the developer?
Would you consider adopting modles
which are not currently
commercially available or
standardly used? Which ones?
Would you consider
adopting a completely new type of
model such as TRANSIMS?
Yes No Somewhat
Yes No Yes No Yes No
Yes No Somewhat
Yes No Yes No Yes No
Yes No Somewhat
Yes No Yes No Yes No
Yes No Somewhat
Yes No Yes No Yes No
Yes No Somewhat
Yes No Yes No Yes No
Yes No Somewhat
Yes No Yes No Yes No
Yes No Somewhat
Yes No Yes No Yes No
Yes No Somewhat
Yes No Yes No Yes No
***As Your comments to these questions are very important to our survey, please use an extra sheet if you need to provide more detailed information
109
APPENDIX D. TRANSPORTATION SOFTWARE SELECTION TOOL (TSSS)
Included in the enclosed CD ROM.
Also available through: http://www.cait.rutgers.edu/faculty/boile/index.html
Installation directly from CD
Insert CD that came with the report into CD drive.
Go to My Computer and click on the CD drive icon (Usually D:\).
Enter Future of transportation Modeling-final submission. Click on TSSS file.
Follow the instructions and DO NOT change destination folder.
After the installation is done, go to C:\Program Files\CAIT_Rutgers\TSSS and
run init4.exe. That should start the applications.
Installation from your PC
Copy folder Final Report from CD or download it from
http://www.cait.rutgers.edu/faculty/boile/index.html
Go into Final Report folder and click on TSSS file.
The rest is the same as the Installation directly from CD.
110
REFERENCES
1 Harry A. Reed, Statewide and Regional Transportation Planning. ITE, © P T R Prentice-Hall, Inc.Transportation Planning Handbook, Chapter-10, 1992.
2 M. Beckman, C.B. McGuire, and C.B. Winsten. Studies in the Economies of Transportation. Yale University Press, New Haven, Connecticut,1956.
3 M. Frank and P. Wolfe. An Algorithm for Quadratic Programming Naval Research Logistics Quarterly, 13, 1956, pp. 95-110.
4 Boyce, D. E., M. R. Lupa and Y. Zhang. Introducing 'Feedback' into Four-Step Travel Forecasting Procedure vs. Equilibrium Solution of Combined Model, Transportation Research Record, 1443 (1994): 65-74.
5 M. Florian and S. Nguyen. A Method for Computing Network Equilibrium with Elastic Demands, Transportation Science Vol. 8, No 4, 1974, pp. 321-332.
6 S.P. Evans. Derivation and Analysis of Some Models for Combining Trip Distribution and Assignment, Transportation Research Vol 10, 1976, pp. 37-57.
7 M. Florian. Traffic Equilibrium Model of Travel by Car and Public Transit Modes, Transportation Science, Vol. 11, No 2, 1977, pp. 166-179.
8 M. Florian and S. Nguyen. A Combined Distribution Modal Split and Trip Assignment Model, Transportation Research, Vol. 12-B, 1978, pp. 241-246.
9 M. Abdulaal and L.J. LeBlanc. Methods for Combining Modal Split and Equilibrium Assignment Models, Transportation Science 13, 1979, pp. 292-314.
10 H.Z. Aashtiani. The Multi-Modal Traffic Assignment Problem. Ph.D. Dissertation, Operations Research Center, M.I.T., Cambridge, Massachusetts. 1979.
11 D.E. Boyce. A Framework for Constructing Network Equilibrium Models of Urban Location, Transportation Science, 14(1), 1980, pp. 77-96.
12 H.Z. Aashtiani and T.L. Magnanti. Equilibria on a Transportation Network, Algebraic Discrete Methods 4: 1981, pp. 213-216.
13 L.J. LeBlanc and K. Farhangian. Efficient Algorithms for Solving Elastic Demand Traffic Assignment Problems and Mode Split-Assignment Problems, Transportation Science, 15, No 4, 1981, pp. 306-317.
14 C. Fisk and S. Nguyen. Existence and Uniqueness Properties of an Asymmetric Two-Mode Equilibrium Model, Transportation Science 15, 1981, pp. 318-328.
111
15 L.J. LeBlanc and M. Abdulaal. Combined Mode Split-Assignment and Distribution-Mode Split-Assignment Models with Multiple Groups of Travelers, Transportation Science Vol. 16, No. 4, 1982, pp.430-442.
16 S.C. Dafermos. The General Multimodal Network Equilibrium Problem with Elastic Demand, Networks 12, 1982, pp. 57-72.
17 D.E. Boyce, K.S. Chon and R.W. Eash. Development of a Family of Sketch Planning Models, CATS Research News , Chicago, 1982.
18 M. Florian and H. Spiess. “On Binary Mode Choice/Assignment Models,” Transportation Science 17, No. 1, 1983, pp. 32-47.
19 D.E. Boyce. Urban Transportation Network Equilibrium and Design Models: Recent Achievements and Future Prospects,” Environment and Planning A, Volume 16, 1984, pp. 1445-1474.
20 C. Fisk. A Conceptual Framework for Optimal Transportation Systems Planning with Integrated Supply and Demand Models, Transportation Science, 20(1), 1986, pp. 37-47.
21 T.L. Friesz. Transportation Network Equilibrium, Design and Aggregation: Key Development and Research Opportunities, Transportation Research A, 19, pp. 413-427, 1985.
22 R. Boyce, et al. "An Experimental Examination of Intrinsic Values As a Source of the WTA-WTP Disparity." American Economic Review, December 1992, 82(5), pp. 1366-73.
23 D.E. Boyce and Y. Zhang. “Calibrating a Combined Model of Trip Distribution, Modal Split, and Traffic Assignment.” In Transportation Research Record, 1607 TRB, National Research Council, Washington, D.C., 1997, pp. 1-5.
24 US Environmental Protection Agency, MOBILE Vehicle Emission Modeling Software. http://www.epa.gov/OMSWWW/m5.htm. Accessed: March, 18, 2002.
25 M.D. Meyer and E.J. Miller. Urban Transportation Planning. Second Edition. McGraw Hill. New York, NY 10020, 2001.
26 T.Y. Hu and H.S. Mahmassani. Evolution on Network Flows Under Real-Time information: Day-to-day Dynamic Simulation Assignment Framework. Transportation Research Record 1493. Washington, D.C.: National Academy Press, 1995.
27 Visual Interactive System for Transport Algorithms http://vista.civil.northwestern.edu/ Accessed: March 20, 2003.
112
28 M. Van Aerde, and S. Yager. Dynamic Integrated Freeway/Traffic Signal Networks: Problems and Proposed Solutions Transportation Research A. Vol. 22A, No. 6, 1998.
29 Quadstone. Paramics modeler V3.0 reference manual. Edinburgh, UK: Quadstone Ltd, 1999.
30 C. Barrett et al. An Operational Description of TRANSIMS. Report LA-UR-95-2393. Los Alamos, New Mexico: Los Alamos National Laboratory, 1995.
31 J. Guelat , M. Florian and T.G. Crainic. A Multimode Multiproduct Network Assignment Model for Strategic Planning of Freight Flows. Transportation Science 24, 1990, pp. 25-39.
32 T.G. Crainic, M. Florian, and J.E. Leal. A Model for the Strategic Planning of National Freight Transportation by Rail. Transportation Science Vol. 24, No. 1., 1990.
33 M.S. Bronzini. Evolution of a Multimodal Freight Transportation Network Model. Proceedings: Transportation Research Forum 21(1), 1980, pp. 475-485.
34 T.L. Friesz and E.K. Morlok. Recent Advances in Network Modeling and their Implications for Freight Systems Planning. Proceedings. Transportation Research Forum 21(1), 1980, pp. 513-520.
35 T.L. Friesz, R.L. Tobin, T. Smith, and P.T. Harker. A Nonlinear Complementarity Formulation and Solution Procedure for the General Derived Demand Network Equilibrium Problem.J. Regional Science 23(3), 1983a, pp. 337-359.
36 J.A. Gottfried. Predictive Network Equilibrium Model for Application to Regional and National Transportation Systems. Ph.D. Dissertation, University of Pennsylvania, Philadelphia, 1983.
37 R.L. Tobin and T.L. Friesz. Formulating and Solving the Network Spatial Price Equilibrium Problem with Transshipment in Terms of Arc Variables. J. Regional Science 23(2), 1983, pp. 187-198.
38 T.L. Friesz, R.L. Tobin and P.T. Harker. Predictive Intercity Freight Network Models: The State of the Art. Transportation Research 17A, 1983b, pp. 409-417.
39 T.L. Friesz and J. Gottfried. Theory, Validation and Application of a Freight Network Equilibrium Model Monograph. ANL/ES-120, Argonne National Laboratory, Argonne, 1981.
40 T.L. Friesz, J.A. Gottfried and E.K. Morlok. A Sequential Shipper-Carrier Network Model for Predicting Freight Flows. Transportation Science 20, 1986, pp. 80-91.
113
41 P.T. Harker and T.L. Friesz. Prediction of Intercity Freight Flows, I: Theory. Transportation Research 19B No. 6, 1985a.
42 P.T. Harker and T.L. Friesz. Prediction of Intercity Freight Flows, II: Mathematical Formulations. Transportation Research 19B No. 6, 1985b.
43 Peter R. Stopher, Arnim. H. Meyburg: Urban Transportation Modeling and Planning. D.C. Heath and Company. © 1975 .
44 Cathy L. Chang, Daniel T. Meyers: Transportation Models, Transportation Planning Handbook. Chapter-6. Institute of Transportation Engineers, ISBN: 0-935403-33-7. © 1999.
45 Metropolitan Council of Governments, Department of Transportation Planning. Transportation Models and Forecasts, http://www.mwcog.org/trans/models.html. Accessed: May. 15, 2002
46 Travel Demand Forecasting, Theory and Concepts, http://www.ets.uidaho.edu/niatt_labmanual/Chapters/traveldemandforecasting/theoryandconcepts/. Accessed: April. 9, 2002.
47 Travel Demand Forecasting, Professional Practice http://www.webs1.uidaho.edu/niatt_labmanual/Chapters/traveldemandforecasting/professionalpractice/ModelCalibrationAndValidation.htm. Accessed: April 9, 2002.
48 Zaher Khatib, Yanmei Ou, and Karl Chang, GIS and Transportation Planning, http://ntl.bts.gov/data/6_conference/00780106.pdf. Accessed: April. 10, 2002.
49 E.A. Beimborn. Transportation Modeling Primer, May 1995, http://www.uwm.edu/Dept/CUTS/primer.htm. Accessed: March. 21, 2002.
50 TRANSIMS DOT Solution Center Team. “TRANSIMS Background.” www.transims.net . Accessed: March 31, 2003.
51 Jack Morrison and Verne Loose. TRANSIMS Model Design Criteria as Derived from Federal Legislation. Report LAUR 95-1909. National Transportation Library, U.S. Department of Transportation, 1995.
52 R.M. Pendyala. Operational Testing of Two Interim Products from the Travel Model Improvement Program – Final Report. Contract No. BC009. Research Center, Florida Department of Transportation, 2002.
53 K. Henson. TRANSIMS Data. Report LAUR 01-10. Los Alamos National Laboratories, 2001.
114
54 TRANSIMS Portland Study Reports. Reports LA-UR-01-5711 through LA-UR-01-16. Los Alamos, New Mexico: Los Alamos National Laboratory, 2001.
55 R. Beckman, K. Baggerly, and M. McKay. “Creating Synthetic Baseline Populations” Transportation Research A, Vol. 30 No. 6, (1996), pp. 415-429.
56 Los Alamos National Lab’s TRANSIMS documentation repository, 2002. Available online at: http://transims.tsasa.lanl.gov/TRANSIMS_2-1_docs.html. Accessed March 1, 2003.
57 M. Williams, G. Thayer, L. Smith. Development of the TRANSIMS Environmental Module. Report LAUR 97-82. Los Alamos National Laboratories, 1997.
58 C Barret et al. The Dallas-Ft. Worth Case Study. Report LA-UR-97-4502. Los Alamos, New Mexico: Los Alamos National Laboratory, 1997.
59 E. Eeckhout, L. Smith, K. Henson. Simulation of Two Traffic Options on a Heavily Traveled Road Adjacent to Los Alamos National Laboratory. Report LA-UR-01-6297. Los Alamos, New Mexico: Los Alamos National Laboratory, 2001.