future opportunities and challenges with using demand … · 2020-01-06 · future opportunities...
TRANSCRIPT

LBNL-1003951
Future Opportunities and Challenges with Using Demand Response as a Resource in Distribution System Operation and Planning Activities
Peter Cappers, Jason MacDonald, Janie Page, Jennifer Potter, Emma Stewart
Lawrence Berkeley National Laboratory
January 2016
This work described in this report was funded by the Department of Energy Office of Energy Efficiency and Renewable Energy under Contract No. DE-AC02-05CH11231.
ERNEST ORLANDO LAWRENCE BERKELEY NATIONAL LABORATORY

Disclaimer
This document was prepared as an account of work sponsored by the United States Government. While this document is believed to contain correct information, neither the United States Government nor any agency thereof, nor The Regents of the University of California, nor any of their employees, makes any warranty, express or implied, or assumes any legal responsibility for the accuracy, completeness, or usefulness of any information, apparatus, product, or process disclosed, or represents that its use would not infringe privately owned rights. Reference herein to any specific commercial product, process, or service by its trade name, trademark, manufacturer, or otherwise, does not necessarily constitute or imply its endorsement, recommendation, or favoring by the United States Government or any agency thereof, or The Regents of the University of California. The views and opinions of authors expressed herein do not necessarily state or reflect those of the United States Government or any agency thereof, or The Regents of the University of California.
Ernest Orlando Lawrence Berkeley National Laboratory is an equal opportunity employer.
ii

Future Opportunities and Challenges with Using Demand Response as a Resource in
Distribution System Operations and Planning
Peter Cappers, Jason MacDonald, Janie Page, Jennifer Potter, Emma Stewart
Lawrence Berkeley National Laboratory
This work described in this report was funded by the Department of Energy Office of Energy Efficiency and Renewable Energy under Contract No. DE-AC02-05CH11231.
iii

iv

Acknowledgments
This work described in this report was funded by the Department of Energy Office of Energy Efficiency and Renewable Energy under Contract No. DE-AC02-05CH11231. The authors are grateful to Seungwook (Ookie) Ma for his support of this research.
We gratefully acknowledge a number of individuals who provided technical assistance, constructive advice, and/or encouragement at various points during this project: Joseph Eto and Charles Goldman (LBNL), Rolf Bienert (Open ADR Alliance), Josh Bode (Nexant), Vaibhav Donde (Pacific Gas and Electric), Mark Dyson (Rocky Mountain Institute), Seungwook (Ookie) Ma (DOE), and Bernie Neenan (Electric Power Research Institute). We thank Danielle Callaghan (LBNL) for her assistance with formatting the final version of the report and disseminating the results to interested stakeholders.
v

Table of Contents
Acknowledgments ......................................................................................................................................... v
Table of Contents ......................................................................................................................................... vi
List of Tables and Figures ............................................................................................................................ vii
Acronyms and Abbreviations ..................................................................................................................... viii
1. Introduction .............................................................................................................................................. 1
2. Anticipated Distribution System Operations Now and in the Future ....................................................... 4
2.1 A Historical Look at Distribution Systems ........................................................................................... 4
2.2 Distributed Energy Resource—Grid Interactions ................................................................................ 6
2.3 Distribution System Management—Current and Future ................................................................... 8
3. Intersection of Demand Response Opportunities and Distribution System Needs ............................... 10
3.1 Demand Response Opportunities ..................................................................................................... 10
3.2 Current Designs ................................................................................................................................. 10
3.3 Intersection of Distribution System Services and Current DR opportunities ................................... 15
Regulatory/Administrative Limitations of Current DR Opportunities ................................................ 16
Introduce Greater Geographic Specificity in the DR Signal ................................................................ 17
Invest in Sensing and Customer Inverter Load Controls ..................................................................... 19
4. Issues at the Intersection of Bulk and Distribution Power Systems ....................................................... 21
4.1 Distribution Level Issues with Bulk Power Oriented DR Opportunities ............................................ 21
4.2 Bulk Power Level Issues with Distribution Oriented DR Opportunities ............................................ 22
4.3 Other Coordination Issues ................................................................................................................ 22
5. Conclusions ............................................................................................................................................. 25
References .................................................................................................................................................. 27
vi

List of Tables and Figures
Table 1: Distribution system management requirements ............................................................................ 4
Figure 1: Projected growth in solar PV and commercial storage.................................................................. 6
Table 2: Characteristics of response services to manage distribution system challenges ........................... 9
Table 3: Current retail DR opportunities..................................................................................................... 13
Table 4: Characteristics of DR opportunities .............................................................................................. 14
Table 5: Characterization of current suite of DR opportunities.................................................................. 15
Table 6: Ability of current suite of DR opportunities to affect distribution system operations ................. 17
Table 7: Ability of DR opportunities with greater geographic specificity in the signal to affect distribution system operations ....................................................................................................................................... 18
Table 8: Ability of DR opportunities with sensing and invertor load controls to affect distribution system operations ................................................................................................................................................... 20
vii

Acronyms and Abbreviations
AMI advanced metering infrastructure
ARC aggregators of retail customers
CPP critical peak pricing
DA-RTP day-ahead real time pricing
DER distributed energy resource
DR demand response
DU distribution utilities
ISO independent system operator
PCT programmable communicating thermostat
PV photovoltaic
RTO regional transmission operator
RT-RTP real-time real time pricing
TOU time of use pricing
viii

1. Introduction
The design and operation of the electric distribution system in the United States has been relatively constant and stable for many decades. Its simple radial “hub-and-spoke” design has effectively and efficiently transported electricity from the bulk power system to end-use customers. However, factors are at play that may fundamentally change the design and operation of the electric distribution system in the coming decade.
The very foundation upon which the distribution system has been designed is beginning to shift. Although distributed generation technologies have been commercially available for decades, major recent cost reductions in, for example, solar photovoltaic (PV) systems (Barbose et al., 2015), coupled with net-energy metering and associated compensation policies are prompting increased investment in distributed energy resource (DER) technologies. National forecasts for the next five years suggest compound annual growth rates of 25% for solar PV (KEMA, 2012). As penetration levels increase on the distribution system, these DERs will substantially alter net load shapes in two key ways (EPRI, 2014):
1. Power flow will be more variable (i.e., changes in magnitude over time); and 2. Power flow will be two-way (i.e., ability to export power onto the grid from the distribution
side).
Each of these factors can adversely impact the operation of the distribution system as it is currently designed and implemented. At low penetration levels, the impact can readily be managed by current control and protection schemes. But as penetration approaches the physical hosting capacity of the system (unique to each circuit and system, dependent on the network conditions, installed equipment, and physical line parameters), increasing numbers of locations on the distribution grid will be challenged to accommodate the influx of such distributed energy resources (EPRI, 2012; Stewart et al., 2013). Problems caused by distributed energy resources can be exacerbated due to the limited visibility many system operators currently have into lower levels of the distribution system.
In addition, the U.S. electric grid infrastructure is aging. For example, approximately 75% of the transformers in the United States and Canada are over 25 years old, yet are assumed to have a useful lifetime of only 20 years (Harris Williams & Co., 2014); while 60% of the distribution poles are 30 to 50 years old, relative to useful lives of 50 years (Harris Williams & Co., 2014). Investor-owned utilities, in a recent survey, acknowledged that 35-48% of their transmission and distribution assets either currently need or will soon be replaced (Harris Williams & Co., 2014).
The confluence of these two issues, an aging grid that both needs to be modernized and in some places may experience DER penetration levels in the near future that will significantly alter distribution system operations, requires a reassessment of historical planning and operation practices for the distribution system.
1

In the late 1970s, properly designed demand response (DR) opportunities1 (i.e., incentive-based programs, time-based rates) were identified as one of several resources well suited to help manage distribution system operations at the primary and secondary voltage levels (Ma et al., 1978). More recently, DR has been further acknowledged as a viable tool to help mitigate the impacts on the distribution system of high penetrations of distributed energy resources (e.g., Markushevich and Chan, 2009; Mohagheghi et al., 2010; Tyagi and Black, 2010; Mohagheghi et al., 2011). Researchers over the last 40 years have simulated a small subset of DR opportunities to better understand how they can support very specific aspects of distribution system operations (e.g., Ma et al., 1978; Davis et al., 1983; EPRI, 1991a; Schneider et al., 2011; Kumar Nunna and Doolla, 2012; Venkatesan et al., 2012; Williams et al., 2013; Zakariazadeh et al., 2014; Narimani et al., 2015). Since the early 1980s, a handful of utilities have successfully experimented with DR opportunities in this fashion (e.g., Mekolites and Gursky, 1981; Gellings et al., 1982; Conant and Levett, 1985; Heffner and Kaufman, 1985; Yau et al., 1990). Yet, presently relatively few utilities in the United States have designed and implemented demand response opportunities to utilize customer resources in this fashion, almost exclusively to defer or avoid costly upgrades in distribution system infrastructure due to load or peak demand growth.2 Instead, where demand response is used to help manage power system planning and operation activities, it is overwhelmingly at the bulk power (i.e., transmission) level in direct response to reliability and/or economic factors (FERC, 2014).
One recent development that may further encourage broader consideration of time-based rates and incentive-based programs deployed to address distribution system issues is widespread utility investment in smart meters and advanced metering infrastructure (AMI). According to the most recent estimates by the Institute for Electric Innovation (2014), 50 million smart meters have been installed by utilities, covering over 43% of U.S. homes. These homes and small businesses connect to the grid at levels of the distribution system where they could potentially act as a resource to meet grid needs. As such, AMI investment has the potential to expand the resource pool that could participate in DR opportunities which could help address distribution system issues.
This scoping study focuses on identifying the ability for current and future DR opportunities to contribute to distribution system management. To do so, this scoping study will:
• Identify the needs of a distribution system to operate efficiently, safely and reliably; • Summarize both benefits and challenges for the operation of the distribution system with high
penetration levels of distributed energy resources; • Define a suite of services based on those changing operational needs that could be provided by
resources;
1 Behind-the-meter dispatchable generation (e.g., backup diesel generators) has historically been used to enable demand response. This is in contrast to non-dispatchable generation (e.g., solar photovoltaic) which as noted above and will be discussed in more detail below can create problems that demand response can seek to mitigate. 2 Consolidated Edison of New York is the only utility the authors are aware of that has had a Distribution Load Relief program in place since 2007. It became the model for the other New York investor-owned utilities who were recently ordered by the New York Public Service Commission to file distribution-level demand response programs for the summer of 2015 (NYPSC, 2014).
2

• Identify existing DR opportunities sponsored by distribution utilities (DU) and/or aggregators of retail customers (ARC) 3;
• Assess the extent to which distribution system services can be provided via DR opportunities both in their current form and with alterations to their design; and
• Provide a qualitative assessment of coordination issues that bulk power and distribution system providers of DR opportunities will need to address.
This study is organized as follows. In Section 2, we identify and briefly describe the major attributes of the distribution system and how distributed energy resource may affect the planning and operation of that system. In Section 3, we characterize the current generation of demand response opportunities available to customers, the time scales over which these rates/programs are expected to produce changes in the electricity consumption of end-use customers and how such changes could be harnessed to provide distribution system services. In Section 4, we identify how expanding the scope of DR opportunities that can offer value and be useful for both bulk power and distribution system planning and operations will require greater coordination between program providers (i.e., distribution utilities, aggregators of retail customers) and system operators/planners. In Section 5, we summarize conclusions from this scoping study and identify areas for future research.
3 ARCs were first introduced in the early part of the last decade as entities that could enroll customers into ISO/RTO (i.e., bulk power) incentive-based programs (Cappers et al., 2010). Since then, regulators in some states have begun to consider them viable marketers or even administrators of distribution utility incentive-based programs (Cappers and Satchwell, 2015).
3
2. Anticipated Distribution System Operations Now and in the Future
2.1 A Historical Look at Distribution Systems Historically, the distribution electricity system has been relatively simple. Power flows in a single direction from the transmission system interconnection (substation) to end use loads. The simplicity of operation was well suited to a radial architecture design; all branches or feeders extend from substations to a terminal load center, with additional customer loads and smaller branches being pulled from the main feeder prior to the terminal point. Further, this simple structure allowed for a basic monitoring scheme: simply monitor the system at the substation level because all infrastructure beyond that was designed to be robust to any anticipated variations in the system or end-use loads.
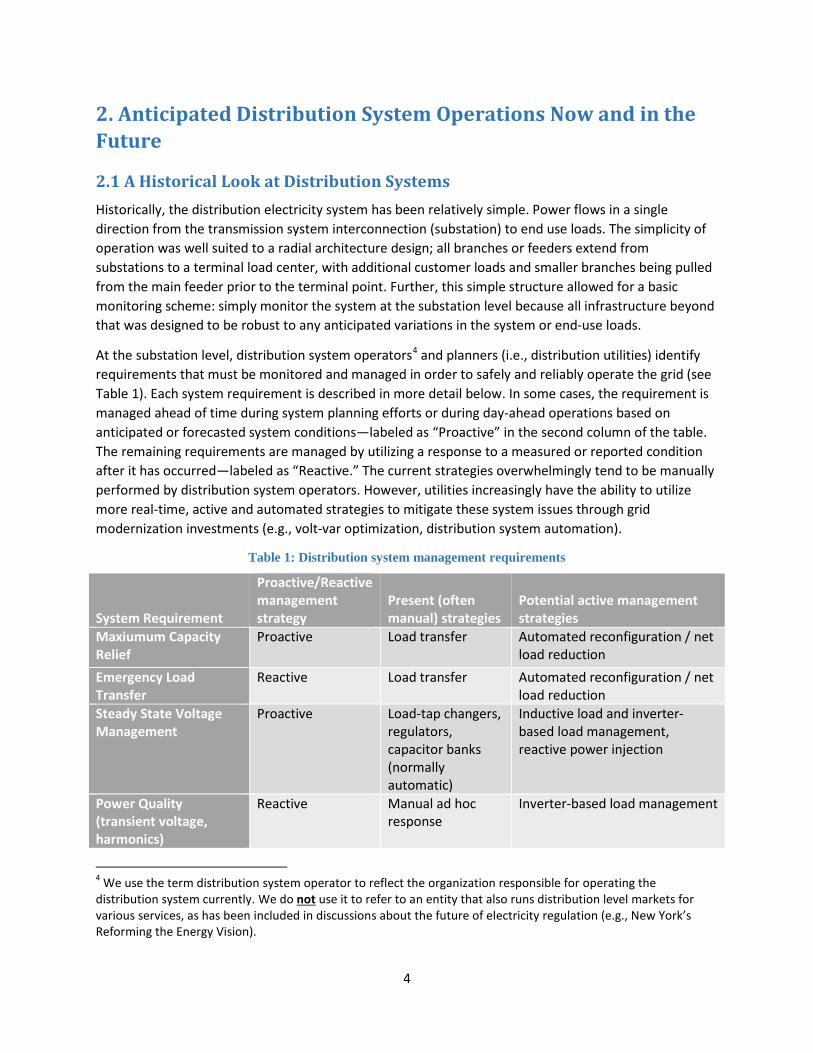
At the substation level, distribution system operators4 and planners (i.e., distribution utilities) identify requirements that must be monitored and managed in order to safely and reliably operate the grid (see Table 1). Each system requirement is described in more detail below. In some cases, the requirement is managed ahead of time during system planning efforts or during day-ahead operations based on anticipated or forecasted system conditions—labeled as “Proactive” in the second column of the table. The remaining requirements are managed by utilizing a response to a measured or reported condition after it has occurred—labeled as “Reactive.” The current strategies overwhelmingly tend to be manually performed by distribution system operators. However, utilities increasingly have the ability to utilize more real-time, active and automated strategies to mitigate these system issues through grid modernization investments (e.g., volt-var optimization, distribution system automation).
Table 1: Distribution system management requirements
System Requirement
Proactive/Reactive management strategy
Present (often manual) strategies
Potential active management strategies
Maxiumum Capacity Relief
Proactive Load transfer Automated reconfiguration / net load reduction
Emergency Load Transfer
Reactive Load transfer Automated reconfiguration / net load reduction
Steady State Voltage Management
Proactive Load-tap changers, regulators, capacitor banks (normally automatic)
Inductive load and inverter-based load management, reactive power injection
Power Quality (transient voltage, harmonics)
Reactive Manual ad hoc response
Inverter-based load management
4 We use the term distribution system operator to reflect the organization responsible for operating the distribution system currently. We do not use it to refer to an entity that also runs distribution level markets for various services, as has been included in discussions about the future of electricity regulation (e.g., New York’s Reforming the Energy Vision).
4

Phase Balancing Proactive Manual redistribution
Reducing or increasing phase loading
Outage Recovery Reactive Manual reconfiguration and load recovery
Automated reconfiguration, Managing through staggered load pickup
The electricity distribution grid is designed to safely and reliably manage power flows up to its design capacity. System planners forecast maximum electricity demand at different parts of the distribution system a year or more in advance and then build the system to maintain reliability assuming some variation around these forecasts.
During operation, as the distribution grid approaches this forecasted maximum demand level, system operators have limited tools at their disposal to manage the grid to ensure equipment does not become overloaded. In some cases, such as hot weather days, system operators can accurately predict the day before such an overloaded or peak condition will occur and can execute relief mechanisms (Maximum Capacity Relief). In other cases, un-forecasted peak conditions may unexpectedly arise or be signaled from faulting equipment requiring more immediate mitigation efforts (Emergency Load Transfer). In both cases, system operators may undertake activities to reduce loading on an identified piece of the distribution system equipment by either dispatching field service personnel to manually transfer the load from one feeder to another, or by using an advanced system that automates the reconfiguration remotely. Such actions, in addition to maintaining reliability, can help to defer future investments by extending the useful life of the distribution system equipment before replacement is required (Stewart and Kiliccote, 2014)
The grid is also designed and operated to maintain consistent voltage at each level of the distribution system. Voltage magnitude is monitored at the substation and managed autonomously by preprogrammed equipment (such as load-tap changers and regulators) installed throughout the distribution line (Steady State Voltage Management). In some cases, however, current monitoring and management efforts are insufficient to identify and/or rectify problems. These typical measurement techniques do not capture information (i.e., sample) frequently enough to observe power quality issues. For example, brief load changes arising from large loads with rapidly changing active and reactive power demands (e.g., large motor starts) may become apparent in nearby customer lighting systems. Thus, these issues are typically identified by customer complaints as the flicker impacts their equipment adversely (ranging from lighting changes to detrimental impacts on some electronic equipment). Correcting such problems usually requires ad hoc but direct intervention, for example by the installation of a capacitor or other compensation equipment, or installing metering solutions after the event in an attempt to find and correct the source. In addition, voltage phases, which are balanced through planning efforts and periodic reconfiguration to the grid, are often only measured at the substation level (Phase Balancing). Smart meters and utility meter data management systems do not often report customer phasing or electrical path of connection. In the case of residential load, which is on a single phase, large increases or decreases in demand can create a burden on the system and disrupt the balance of three phase delivery. More generally, changes in the level and type of end-use customer electricity loads over time may result in these phases becoming significantly out of balance. Such imbalance can result in overloading parts of the circuit, increased losses, and mis-regulated voltage. Manual reconfiguration of the interconnections among the phases is the primary remedy when the imbalance is identified, but such a diagnosis and correction is rarely undertaken.
5

In spite of utility planners’ and operators’ best efforts, distribution system outages can and do occur with a median frequency of about 1.2 times per year and in total lasting about 100 minutes per year when not accounting for major reliability events like hurricanes, tornadoes or ice storms (Larsen et al., 2015). Often times recovery efforts require the dispatch of field crews to identify and then fix the root cause of the outage. Once fixed, the system operator must reconnect that part of the distribution system with the rest that is already up and running. A challenge occurs if the reconnection results in abnormally high loading in the part of the system affected by the outage due to the coincidence of previously non-coincident load. This can result in overloading the distribution system equipment, thereby prolonging the outage. To resolve such a situation, system operators and repair crews may manage the reconnection process more directly through coordinated, responsive load restoration.
2.2 Distributed Energy Resource—Grid Interactions For decades, the U.S. distribution system has worked reliably with little change to this basic design. However, customer interactions with the grid are becoming more complex as a result of social, environmental and economic factors, challenging the viability of this historically simple design.
Specifically, customer-sited generation, storage, and controllable grid-interactive loads (collectively referred to as Distributed Energy Resources) are increasing.5 As depicted in Figure 1, it is anticipated that between 2015 and 2020 investment in solar PV systems will see upwards of a 25% compound annual growth rate in certain segments of the customer population (Solar Energy Industries Association, 2015). Although such capacity additions represents less than one tenth of one percent of national non-coincident peak demand (EIA, 2014), this rapid deployment of DER may be uncontrolled and unmanaged in many parts of the United States, and when heavily concentrated on specific parts of the distribution system can be problematic.
Figure 1: Projected growth in solar PV and commercial storage
5 DER technology can include solar photovoltaics, distributed wind turbines, demand response, energy storage, electric vehicles, combined heat and power, and other distributed generators.
1,8372,862 2,411
3,1474,037
5,2421,454
2,0841,562
1,971
2,512
3,221
0
1,000
2,000
3,000
4,000
5,000
6,000
7,000
8,000
9,000
2015 2016 2017 2018 2019 2020
Incr
emen
tal U
S Ad
ditio
ns (M
W)
Res PV Non-Res PVSource: (Solar Energy Industries Association, 2015)
6

At low penetration levels of DERs, current operational practices and distribution system equipment are adequate to maintain the reliability and stability of the local distribution system. However, as their penetration approaches the hosting capacity of the network or circuit, DERs can cause a myriad of distribution grid management challenges for system planners and operators (EPRI, 2012). For example, increasing DER in distribution systems modifies and can reverse the power flow in the distribution network (DNV-GL, 2014). This becomes an issue because much of the protection schemes in distribution systems today were designed with unidirectional power flow in mind. While this can be mitigated in part by changes in system protection schemes, another feature of distributed energy resources is the stochastic nature of their output. While the diurnal variability is predictable, momentary fluctuations in output are generally not. When the power produced by these variable sources is exported to the distribution grid, any sudden changes in feeder loading arising from the stochastic input can cause increased actuation and wear of distribution equipment and exacerbate phase imbalances that may lead to ineffective voltage regulation and loading of the neutral.6 Less prominent, but still of concern are the impacts on power quality (e.g. voltage flicker and harmonics) arising from rapid changes in real power output from DER and the increased proliferation of power electronics. The diurnal variability of DERs (particularly solar photovoltaic systems and electric vehicles) also creates new loading patterns for equipment that may result in conditions for which they were not designed. For example, transformers may be unable to use the lower evening and overnight temperatures to adequately cool down if they are still loaded for electric vehicle battery charging well after dark. Further, both the variability and uncertainty of DER output contributes to challenges in load forecasting that may lead to more unexpected overloading conditions (Arghandeh et al., 2014). Operationally, these issues are currently handled by inefficient processes, such as a dispatching field crews to manually reconfigure the system or reset protection equipment. When the specter of all of these challenges is coupled with the limited visibility into the aging U.S. distribution system, the allowable capacity of DER in distribution systems may be overly limited (Reno et al., 2013; Stewart et al., 2013). Up until recently, simple heuristics were used to identify constraints to the allowable DER capacity on a feeder, such as California’s Rule 21 which requires exhaustive interconnection studies if DER capacity is 15% of feeder capacity. However, California IOU’s are now addressing the variability in hosting capacity of feeders and are performing comprehensive distribution resource planning analyses of DER integration capacity for feeders in their systems (Shlatz et al., 2013).
In spite of these challenges, the electricity system can benefit from deeper penetration of DER. Locational benefits inure due to the reduction of system losses as the DER reduces the need to deliver power from generators that are miles away (DNV-GL, 2014). Further, the emergence of interconnected “microgrids” with controllable DER may ensure grid functionality in specific locations despite outage conditions elsewhere. Finally, if through planning efforts, these resources can be incentivized to be located in the right place in the distribution grid, then they may defer or replace conventional infrastructure build-out (NYPSC, 2014). Even uncoordinated deployment of these resources, that happen
6 If the loading is balanced and the phases are at the correct angle in a typical three phase AC system with four wires, then each phase's return current on the common neutral wire is canceled out by the sum of the current of the other two phases. This allows the neutral conductor to be much smaller than the other conductors. As a result, imbalanced loading of the phases can cause significant losses on the undersized neutral and, in extreme cases, faults due to overloading.
7

to be co-located where needed, may reduce the forecasts of effective loading on distribution system infrastructure that could delay investment to replace or upgrade aging equipment.
2.3 Distribution System Management—Current and Future If the benefits associated with increased penetrations of distributed energy resources are to be achieved, then the challenges associated with them must be managed and ultimately mitigated. A necessary, but not sufficient condition, to do so will increasingly include investment in new distribution system operation sensing and monitoring equipment. This can be accomplished, in part, with investment in advanced metering infrastructure which makes voltage, power quality and other information at a highly granular geographic level (i.e., meter) available to system operators, thereby giving them increased visibility into the operating state of different levels of the system. However, without some way to link the geographic location of a meter with its position electrically on the grid, the value of the AMI investment for distribution visibility is substantially limited.
If such complimentary investments are made, distribution system operators will also need the capability and mechanisms to coordinate and potentially manage both DER and distribution system operations. The management of distribution systems with high penetration of DERs could be achieved by creating a set of services which could be provided by a variety of distribution-level resources, procured via a request for proposal or some other contracting arrangements, but in the extreme an auction mechanism by the distribution system operator, to manage that part of the grid more efficiently and effectively.
Table 2 describes the temporal and spatial characteristics that would be required of resources to satisfy the necessary distribution system management issues identified in Table 1. The first column, “Procurement/Schedule,” identifies the time at which a distribution utility would need to procure the resource. For example, both Emergency Load Transfer and Outage Recovery could be procured well ahead of time (e.g., months to years) from resources that are then on call for a period of time to provide the services should it be needed. The second column, “Advanced Notice,” describes the notification time that a resource may have before it is asked to respond to a service request. In the case of a continuous service like Voltage Management, the notification may be either considered the procurement horizon (e.g., typically on the order of a day ahead) or the time between dispatches (e.g., less than one minute), but the distinction may be arbitrary since the requirement is constant although the exact value of the need will vary on different time scales. “Response Time,” the third column, is a rough measure of the period in which a resource would be expected to achieve the desired response. For many of these services almost instantaneous response is preferred or required. The fourth column, “Duration of Response,” indicates the length of time that a resource might expect a dispatch request to last. Only three services (Maximum Capacity Relief, Emergency Load Transfer and Outage Recovery) would require a response that is four hours or less (i.e., not continuous). The fifth column, “Frequency,” gives a rough idea of how often these types of service needs occur in the distribution system. The actual value will vary from region to region, depending on grid operation philosophies, so general guidelines are provided. “Geographic Specificity,” the last column, attempts to characterize the locational requirement of response on the system, which may be clarified by the distribution topology described in Table 2. For example, Maximum Capacity Relief may be provided by any resource that is located on a branch that is fed by the equipment that will be overloaded.
8

Table 2: Characteristics of response services to manage distribution system challenges
System Requirement
Procurement or Schedule
Advanced Notice
Response Time
Duration of Response
Frequency Geographic Specificity
Max. Capacity Relief
Years (planning) or Day-ahead (operation)
Day-ahead
10-30 mins
<4 hrs Seasonal but potentially multiple times per day
One level below overloaded equipment
Emergency Load Transfer
Years (planning)
0.5 to 4 hours
Up to 30 mins
<4 hrs Infrequent Substation to transformer
Steady State Voltage Mgmnt
Years (planning)
<1 min Secs to mins
Continuous Continuous Close proximity to affected area
Power Quality
Years (planning)
<1 min <1 sec Continuous Continuous Substation to transformer
Phase Balancing
Years (planning) or Day-ahead (operation)
Day-ahead
Secs to mins
Continuous Continuous Substation to secondary feeder
Outage Recovery
Years (planning)
<1 min Secs to mins
<1 hour Infrequent Substation to transformer
9

3. Intersection of Demand Response Opportunities and Distribution System Needs
3.1 Demand Response Opportunities In this section, we identify and describe the current designs of DR opportunities sponsored by a distribution utility (DU) and/or offered by aggregators of retail customers (ARC). Specifically, we characterize the time scales over which these time-based retail rates or incentive-based programs are expected to produce changes in the electricity consumption of end-use customers, which in most cases have historically supported bulk power system planning and operations. We then identify the distribution system services that the current generation of DU-sponsored and ARC-offered DR opportunities could possibly provide based on these rate and program design characteristics as well as those that could be supplied in the future if the designs of these rates and programs are altered.7
3.2 Current Designs Although the benefits of charging customers differentially based on when they consume electricity has been well understood since the start of the last century (Hausman and Neufeld, 1984), rate designs that accomplish this goal have expanded and evolved since then.8 At present, there are four general types of time-based retail rates:
• Time of use pricing (TOU) rates provide different but pre-determined prices over broadly defined pre-specified periods (e.g., summer weekdays between 12 noon and 6 PM). This type of rate design is commonly the default for commercial and industrial customers, but is almost exclusively a voluntary rate offered to residential customers usually with very low enrollment (less than 2% nationally) rates (FERC, 2012).
• Critical peak pricing (CPP) rates generally institute a single pre-determined price or sometimes variable price schedules during a narrowly defined period (e.g., summer weekday between 12 noon and 6 PM) that is only applied during specific system operating or market conditions (e.g., 30-minute operating reserve shortages, wholesale prices exceed $250/MWh). According to FERC (2012), eleven utilities across the country offer this type of rate to residential and small commercial customers on a voluntary basis but penetration has been quite low (less than 1% nationally).
• Real time pricing (RTP) represents a rate schedule where the price can differ by hour of the day. There are two common forms of RTP: one that provides the twenty-four hour price schedule a day in advance (DA-RTP) and another that provides the hourly price within 60 minutes after
7 The determination by regulators, policymakers and providers of these DR opportunities to pursue those capable of supporting distribution system planning and operation activities is dependent on a myriad of issues that are largely outside of this report. 8 In this characterization, we do not include demand charges. Although they have been applied by utilities to commercial and industrial customers for decades, they have only recently begun to be considered for residential customers. Clearly, such elements of rate design can accomplish coincident and non-coincident peak demand reductions. However, for simplicity of the discussion, we have chosen to not assess their capability within this scoping study.
10

consumption has already occurred (RT-RTP).9 In several states (e.g., Maryland, New Jersey, New York, Pennsylvania and Illinois), RTP is the default rate design for medium to large commercial and industrial customers (Barbose et al., 2005; Barbose et al., 2006). Many more utilities offer this rate as an option for such customers (Barbose et al., 2005; Goldman et al., 2006). However, only investor-owned utilities in Illinois offer RTP to their residential customers on a voluntary basis, where uptake has been less than 2% (Elevate Energy, 2015b, a).
Utilities in the 1950s and 1960s realized that they could pursue alternatives to retail rates in order to induce customers to reduce their consumption of electricity at particular times as a way for utilities to meet and manage the high electrical growth of that era. Since then, utilities have expanded the scope of such offerings to include all of its customers, not just the largest ones who were exclusively pursued initially. At present, there are four types of incentive-based programs:
• Disconnectable programs provide a distribution utility with the opportunity to directly control via radio, internet or other remote means various customers’ electricity consuming devices (e.g., electric water heaters, pool pumps) or some portions of their load deemed by the customer to be “non-firm” which could be physically disconnected from the grid with little to no notice. For example, large industrial customers in Texas have under-frequency relays that historically could be tripped by the utility or more recently controlled by ERCOT, the system operator, if bulk power system conditions warrant a rapid reduction in electricity demand (Zarnikau, 2010). These programs provide a substantial share of the nation’s potential peak reductions (FERC, 2012).
• Configurable programs are similar to Disconnectable programs in that the utility has the ability to control the electricity consumption of one or more customer devices for a specified period of time but the customer can configure the control technology to override whatever DR signals are received under certain conditions. For example, residential customers can be provided with a programmable communicating thermostat (PCT) that will automatically increase the temperature set point during a declared event, but the customer has the ability to turn the temperature back down at their discretion. At the residential level, these programs have historically been the most popular with investor-owned utilities and produce the greatest amount of peak load reductions of any DR opportunity (FERC, 2012).
• Manual programs do not provide any automated control technology to participating customers, leaving them to alter their electricity consumption through purely manual changes in response to a discrete event signal in exchange for a defined financial payment. For example, at the larger customer level, Curtailable programs would generally fall into this category, provided they have no accompanying automated control technology. Critical Peak Rebate programs are usually offered to residential and small commercial customers without any form of automated control technology, like a PCT. In a few jurisdictions across the U.S., residential customers are defaulted
9 Although there are additional variants to RTP rate designs, we focus on these two because they have the most impact on customer consumption decisions. Other RTP designs provide the appropriate marginal price of electricity, but may do so within a hedged instrument (two-part RTP) or with a price adder to represent scarcity pricing. In the future, the design of DA-RTP or RT-RTP tariffs may change if the hourly granularity of pricing is altered (e.g., 5 to 15 minutes).
11

onto this program but otherwise they comprise a relatively limited amount of the national potential peak load reductions (FERC, 2012).
• Behavioral programs also rely on behavioral changes to produce a change in electricity consumption, but are voluntary and do not provide any explicit performance payments. For example, Opower has a behavioral demand response program where they provide information to program participants both before and after a declared curtailment event to drive measurable peak reductions without a price signal or a device to control load in the home. This is a relatively new offering that is only available in a very limited number of jurisdictions, while many U.S. electric utilities offer home-energy reports to their customers which is another form of this type of program.
In addition to the preceding retail DR programs, there are three DR programs commonly offered in wholesale markets (i.e., Independent System Operator or Regional Transmission Operator - ISO/RTO) that DU or ARC may subscribe customers to. These are:
• Capacity bidding programs are dispatched to provide load reductions to the bulk power system when grid operations are expected to deteriorate beyond acceptable reserve margins. They usually provide an up-front payment in exchange for a requirement to reduce the agreed-upon amount of electricity when an event is called (typically including financial penalties if customers or aggregators do not meet their subscribed load curtailment commitment). Of the three wholesale market DR programs, the largest share of customers participate in this one providing over 5.9 GW of potential peak load reduction (FERC, 2012).
• Energy bidding programs provide end-use customers the opportunity to participate directly or indirectly in wholesale electricity markets by being paid for altering their consumption of electricity relative to some determination of what they would have consumed absent the DR event signal (i.e., baseline). Although these programs saw modest participation levels during the last decade (Cappers et al., 2010), of late very few customers have enrolled (FERC, 2012).
• Ancillary service bidding programs also provide end-use customers access to wholesale markets, but in this case to provide operating reserves (and regulation services in a limited number of cases) in exchange for a payment at the wholesale market price for that service. These programs largely came into being in the later part of the last decade and as of 2012 were able to provide 370 MW of spinning reserves (FERC, 2012) at a national level.
Given the fact that this scoping study is concerned with the distribution system, retail DR opportunities will be the focus from this point forward. Error! Reference source not found. includes a list of the current retail demand response opportunities organized by the type of DR signal (i.e., price level charged to retail customers for electric commodity purchases vs. system state indicator10 or incentive level11) used to elicit a change in a customer’s consumption of electricity.12
10 This system state indicator can either be used to control actuation in a device or system, or for real power dispatch. 11 Given current designs of all DR opportunities, most if not all of the incentive levels provided to customers participating in DR programs are pre-determined and set well ahead of time. However, if distribution system markets become a reality as some have proposed (De Martini, 2014; Tong and Wellinghoff, 2014), then incentive
12

Table 3: Current retail DR opportunities
Time-Based Retail Rates DR Signal: Price Level
Incentive-Based Programs: DR Signal: System State or Incentive Level
Time of Use Pricing (TOU) Disconnectable Critical Peak Pricing (CPP) Configurable
Day-Ahead Real-Time Pricing (DA-RTP) Manual Real-Time Real-Time Pricing (RT-RTP) Behavioral
All forms of demand response anticipate that either the program provider will directly control end uses or the customer will manually or automatically alter their consumption of electricity over some time period based on a DR signal. The ability for the DR signal to change (e.g., static or dynamic) to reflect differences in temporal or geographic value, maximum number of times the DR signal may change during a year (e.g., ten times per year), the time interval between DR signal changes (e.g., daily, multiple times within a day, no more than 3 days in a row), the advance notification period (e.g., <5 minute, 10-30 minutes, 2 hours) of a DR signal change, and the maximum duration of that DR signal change will all dictate the ability of the DU or ARC to direct the commencement and duration of changes in end-use customer electricity consumption. For simplicity, all of these various aspects of the current design of DR opportunities can be categorized into six characteristics as follows:
1. Targeted Geographic Specificity: Does the DR opportunity allow for variability in the DR signal in order to target geographical areas in the distribution system?13
2. Signal Variability: Does the DR opportunity provide a DR signal whose level changes? 3. Temporal Variability: Does the DR opportunity provide a DR signal that changes over time? 4. Availability: Does the DR opportunity have limits placed on the frequency with which the DR
signal can change? 5. Advanced Notice: Does the DR opportunity require advanced notice of a change in the DR
signal? 6. Automation: Does the DR opportunity incorporate automated control technology at the
participating customer’s premise?
Each of these characteristics can have one of three levels that range from a high to low (see Table 4).
levels to provide specific distribution system services via DR programs may change as demand for those services changes. 12 Error! Reference source not found. portrays the different demand response opportunities as independent. However, in theory and practice, DU (and ARC) may combine different DR opportunities (e.g., day-ahead RTP with a CPP price overlay). For ease of exposition, we will retain the singular nature of each time-based rate and incentive-based program when discussing the various DR opportunities. It should also be noted that the definitions provided correspond with those most frequently observed in the industry at present. More dynamic rate designs than those cited are certainly possible (e.g., price changes every 15 minutes) and may be offered by DU in the future. 13 We use the term “geographic specificity” to not just refer to a location on a map but also to the electrical location on the grid.
13

Table 4: Characteristics of DR opportunities
Characteristic High Moderate Low Targeted Geographic Specificity
DR Signal set at primary feeder
DR Signal set at secondary feeder
DR Signal set system wide
Signal Variability DR Signal level is able to adjust dynamically to reflect system or market outcomes
DR Signal level is able to adjust according to pre-assigned level(s)
DR Signal level is static
Temporal Variability DR Signal level is able to adjust at any time
DR Signal able to adjust only over pre-defined periods
DR Signal is always constant
Availability Frequency of DR Signal change is unlimited
N/A Frequency of DR signal change is limited
Advanced Notice Five minutes or less notice required of a DR signal change
Four hours to 5 minutes of a DR signal change
More than 4 hour notice of a DR signal change
Automation Response to DR Signal change relies on technology without customer override
Response to DR Signal change relies on technology with customer override
Response to DR Signal change may or may not rely on technology
Using these characteristics it is possible to establish a framework to assess the value of each DR opportunity and its place in the distribution system. Table 5 summarizes each type of DR opportunity using these six characteristics and described at high, medium, or low level for each feature. For example, a TOU rate relies on a price signal that differs by period of hours of the day (column 4) to induce customers to alter their consumption of electricity. The level of the price signals (column 3) in each of the periods is pre-determined and hence static. TOU rates are usually designed at the service territory level by the DU, not based on where a customer is located on the distribution system (column 2). DU does not require any automation or control technology (column 7) to take service under the rate, although customers may choose to invest in them to better manage their own bills. Conversely, incentive-based programs generally have some form of DU-sponsored or customer-provided automation technology (column 6), more dynamic DR signals (column 2), and greater temporal delineation in those DR signals (column 3) than time-based rates.
Some of the limits imposed on time-based rates that are not mirrored in the incentive-based programs reflect the regulatory compact. For example, utilities are rarely able to differentiate prices for electricity at anything other than a temporal level within a customer service class because to do otherwise would be viewed as price discrimination.14 Additionally, time-based rates must go through an infrequent
14 Price discrimination is the ability for an entity selling the same product to charge different prices to different buyers. Utility regulators have historically been willing to differentiate prices based on customer class (e.g., residential, commercial, industrial), customer size (e.g., monthly usage or peak demand) as well as the timing of consumption (e.g., on-peak vs. off-peak period) as these can all be linked back to differences in the cost to serve (Gellhorn and Pierce, 1999). However, regulators have not been historically willing to differentiate prices based on other factors such as where a customer is located in the distribution system.
14

ratemaking process to be changed. As such, utilities often lack the flexibility to alter the rate level to reflect highly dynamic system needs. Incentive-based programs, on the other hand, can be altered more rapidly in response to system needs and generally do not need a rate action for modification to incentive levels, although they would require regulatory approval of a tariff change. Additionally, there are currently no regulations that constrain a utility’s ability to offer different incentive levels within a customer class for different incentive-based programs nor in marketing the DR program to customers located in a specific part of the distribution system.
Table 5: Characterization of current suite of DR opportunities
DR Opportunity
(1)
Targeted Geographic Specificity
(2)
Signal Variability
(3)
Temporal Variability
(4) Availability
(5)
Advanced Notice
(6) Automation
(7) TOU CPP
DA-RTP RT-RTP
Disconnectable Configurable
Manual Behavioral
Ratings Legend
=System, =Secondary feeder, =Primary feeder
=Static, =Pre-set, =Dynamic
=None, =Set of hours, =Any time
=Limited, =Unlimited
=More than 4 hours = 6 min – 4 hours = 5 min. or less
=Manual, =Automation with customer override, =Automation without customer override
3.3 Intersection of Distribution System Services and Current DR opportunities In this section, we provide an overview and assessment of the services that DR opportunities could provide to the distribution power system, both under their current designs as well as those that might be considered in the near future.15
Targeted changes in the consumption of electricity can affect the operating characteristics of the distribution power system. If the changes are geographically (e.g., substation, transformer) and
15 The following assessment of the distribution system services that DR opportunities are capable of providing is stylized. Currently there are very limited opportunities for demand response to provide distribution system services (e.g., Consolidated Edison is the only DU currently offering such programs that the authors are aware of). As such, we focus our initial assessment on the vast majority of DR opportunities and their current designs that do not allow the DR signal to differ by location on the grid and/or do not allow enrollment to be restricted to customers located on certain parts of the distribution system.
15

temporally (e.g., 5 minute, 2 hour) dispatchable, dependable and predictable, such modifications can transform demand response into a resource capable of providing a subset of distribution system services or meeting a subset of distribution system operational needs.
Using the prior characterizations of distribution system needs (Table 2) and retail DR opportunities (Table 5), we can cross-reference those characteristics against each other. This enables us to readily identify those DR opportunities that could be most effective at addressing distribution system operational needs.
Regulatory/Administrative Limitations of Current DR Opportunities
Although many types of retail incentive-based programs are designed to provide reductions in demand, dispatch of these DR opportunities are usually done with little to no regard to more specific and localized geographic need on the distribution system. For example, load relief may only be needed in one part of a utility’s service territory to address a reliability concern (e.g., one feeder) but program rules often don’t allow for partial dispatch of the program that targets participants in a specific geographic region. Such partial dispatch by a distribution utility could be construed as discriminatory if all participants are being paid the same amount (e.g., up-front payment) but not being asked to perform identically. However, such an “all-or-nothing” dispatch requirement is inefficient as all resources are being asked to respond when only a subset is creating significant value. Such concerns are exacerbated if currently designed program rules and rate levels are set at a service territory level, but the resulting changes in consumption are intended to address issues at the distribution system level.
Furthermore, a variety of different incentive-based programs (e.g., Disconnectable, Configurable, Manual) as well as time-based rate designs (e.g., Critical Peak Pricing) are employed to reduce electricity consumption coincident with the bulk power system maximum demand or high priced periods. Given the nature of electricity demand at the distribution level of the system vis-à-vis the bulk power system, it is not necessarily the case that load relief provided by currently designed DR opportunities will be coincident with the timing of primary or secondary feeder maximum demand. Furthermore, time-based rates usually have a fixed period over which the price level can change (e.g., event hours of 2 PM to 6 PM summer weekdays). Therefore, current practice concerning the timing of event dispatch or price signal increases is unlikely to result in reliable and dependable demand reductions when it is needed to address maximum capacity relief in the locations on the distribution system it is needed (see Table 6).
In some cases, classic large industrial customer Interruptible tariff rates (classified as Disconnectable programs) may be designed so as to afford utilities the opportunity to declare events whenever the utility needs substantial load relief. However, these large industrial customers may not be located on parts of the distribution system that would need such relief. Instead, they often times take service at the transmission, sub-transmission level or primary service level (i.e., have their own transformer, three phase feed), thereby substantially limiting their ability to provide load relief further down in the distribution system.
Many other distribution system issues, such as phase balancing or power quality are often even more highly localized problems, occur at the primary feeder or lower level of the distribution system. Thus, absent any ability to set prices or event dispatch signals at this granular geographic level, currently
16

designed time-based rates and incentive-based programs have little to no ability to meaningfully address distribution system needs.16
Table 6: Ability of current suite of DR opportunities to affect distribution system operations
Max Capacity
Relief
Emergency Load
Transfer Voltage
Management Outage
Recovery Power Quality
Phase Balancing
TOU CPP
DA-RTP RT-RTP
Disconnectable Configurable
Manual Behavioral
Demand Bidding
Capacity Bidding
Ancillary Services Bidding
Legend Ineffective at providing distribution system service Minimally effective at providing distribution system service Reasonably effective at providing distribution system service Highly effective at providing distribution system service
Introduce Greater Geographic Specificity in the DR Signal
The ability for time-based rates and incentive-based programs to contribute to distribution system service needs would require them to look different than they usually do today. Design enhancements that allow for greater geographic specificity of the DR signal would enable a subset of rates and programs to have the ability to provide a subset of services to the distribution system (see Table 7).17
If existing retail rate design for CPP and RTP (in either form) could be altered to reflect a differential cost of electricity based on where a customer is located in the distribution system, they would be capable of
16 Although currently designed time-based rates and incentive-based program may serendipitously induce changes in customers’ electricity consumption, who are located at a point on the distribution system that would benefit from such a change, these DR opportunities are not explicitly designed to address such issues and thus system operators and planners are unlikely to rely on them. 17 In addition to the incremental changes discussed in this paper, new and different DR opportunities may be considered to address these distribution system issues (e.g., transactive energy).
17

providing maximum capacity relief to the distribution system. However, the lack of required automation to take service under these types of rates coupled with the potential for highly frequent events (e.g., multiple times per day) would limit the efficacy of these rate designs to provide other distribution system services. All in all, in spite of such changes to all time-based rate designs, customers would still be unable to provide the majority of distribution system service effectively.
If incentive-based programs could likewise incorporate an ability to alter the DR signal (i.e., dispatch events) on a more geographically targeted basis, then participating customers could potentially provide a number of distribution system services. Such design changes could manifest as a limitation on event dispatch only to participating customers in specific parts of the distribution system, providing a differential incentive payment for customers located on parts of the distribution system needing more or less support18, and/or limitations on enrollment based on where a customer is located on the distribution system19. By changing this one general design characteristic, the automation capabilities of Disconnectable DR opportunities, such as direct load control switches, that cannot be overridden by participating customers could become highly effective in efficiently addressing maximum capacity challenges on the primary and secondary levels of the distribution system, and could be reasonably effective in addressing other distribution system needs, such as emergency load transfer, voltage management, and outage recovery. Configurable DR programs also emerge as a viable resource for providing maximum capacity relief, in that those resources can be dispatched at a specific feeder where load response would be automated with some ability for customer override.
Table 7: Ability of DR opportunities with greater geographic specificity in the signal to affect distribution system operations
Max Capacity
Relief
Emergency Load
Transfer Voltage
Management Outage
Recovery Power Quality
Phase Balancing
TOU CPP
DA-RTP RT-RTP
Disconnectable Configurable
Manual Behavioral
Demand Bidding
Capacity Bidding
18 Orange & Rockland took this approach in 2015 (Orange & Rockland, 2015) while Central Hudson Gas & Electric as well as Orange & Rockland distribution utilities are considering augmenting a subset of their distribution load management programs to include this approach in 2016 (Central Hudson Gas & Electric, 2015; Orange & Rockland, 2015). 19 This approach was taken by several New York distribution utilities (i.e., Consolidated Edison, National Grid, New York State Electric & Gas, Rochester Gas & Electric) when they designed and implemented their distribution load management programs in 2015 (Ibedrola, 2015; National Grid, 2015).
18

Ancillary Services Bidding
Legend Ineffective at providing distribution system service Minimally effective at providing distribution system service Reasonably effective at providing distribution system service Highly effective at providing distribution system service
Allowing greater geographic delineations in prices and event dispatch or incentive payments is not the only roadblock for successful use of DR opportunities to meet distribution system needs. Many utilities have very limited visibility into the current operating state at various points on their distribution system. Without this visibility, it is difficult to identify the location of specific operational challenges and then to assess what resources might be locally able to meet those challenges. Although some utilities have begun to invest in distribution system automation and sensing technologies, sometimes paired with AMI, to afford them greater visibility into the lower parts of their distribution system, the ability to identify certain grid conditions within a locality have not yet been developed to fully optimize operations with DR resources. In order to fully integrate these adjusted DR opportunities into the distribution grid to provide relief services, greater transparency, automation and ability to identify where each DR resource is electrically located on the grid will also be required. Distribution system upgrades and substantially more complex operational analytics in the form of advanced distribution management and demand response management systems available to operators in the DU control center will help provide a more dynamic grid that could more fully utilize these altered DR opportunities.
Invest in Sensing and Customer Inverter Load Controls
Managing the distribution system has become increasingly challenging with the increased penetration of DER coupled with aging infrastructure. Unfortunately, several of these challenges (i.e., power quality management and phase balancing) cannot be addressed with modest changes to current DR opportunities, as discussed in the previous section. In order for DR opportunities to help manage these two distribution system challenges, DU will need to do more than alter program designs—they will need to invest in technology (see Table 8).
As previously described, power quality includes issues associated with harmonics and voltage flicker that may benefit from continuous monitoring and efforts to address at a sub-second level. However, if DU has a sufficient value proposition to invest in the necessary sensing technology that is location specific and couple that investment with controls of inverter-based loads, then Disconnectable or Configurable incentive-based programs of the future could provide such a service. Research and development efforts could also be undertaken to better understand what other types of technology could be invested to provide this type of service.
Likewise, phase balancing is another operational challenge that future DR opportunities could be considered to address. If DUs invested in greater visibility into the grid so they could monitor phases in (near) real-time and know what customers took service on which phase, DR opportunities with high
19

degrees of automation (i.e., Disconnectable, Configurable) could be designed to be reasonably effective at providing this distribution system service.
Table 8: Ability of DR opportunities with sensing and invertor load controls to affect distribution system operations
Max Capacity
Relief
Emergency Load
Transfer Voltage
Management Outage
Recovery Power Quality
Phase Balancing
TOU CPP
RTP-DA RTP-RT
Disconnectable Configurable
Manual Behavioral
Demand Bidding
Capacity Bidding
Ancillary Services Bidding
Legend Ineffective at providing distribution system service Minimally effective at providing distribution system service Reasonably effective at providing distribution system service Highly effective at providing distribution system service
20

4. Issues at the Intersection of Bulk and Distribution Power Systems
In this section we focus on coordination and other challenges that arise when customers are relied on to provide both distribution and bulk power system services via demand response opportunities.
Demand response opportunities have historically and predominantly been designed to address bulk power system issues. By expanding the use of or creating new DR opportunities, it is conceivable that the DR signal change intended to address issues at sub-transmission or distribution levels of the electrical grid may, in some cases, support the alleviation of issues at the transmission level of the grid; while in other cases may exacerbate existing challenges. Conversely, DR opportunities designed to support bulk power system operation may adversely impact or support distribution system operation. Identifying conditions under which DR opportunities are designed to resolve problems on one level of the grid but have an adverse or beneficial effect on other parts of the grid should help program designers and system operators anticipate unintended consequences.
4.1 Distribution Level Issues with Bulk Power System Oriented DR Opportunities DR opportunities designed to help address bulk power system balancing, reliability and/or economic problems generally result in relatively sizable changes in consumption as measured at the bulk power system level. This reflects the net effect of a significant number of demand-side resources that alter their electricity consumption at different levels and locations throughout the distribution system.
Suppose participants are largely concentrated in a certain part of a utility’s distribution system and are associated with a DR opportunity designed to support bulk power system operations. It is possible that a change in the DR signal called at the bulk power system level could reduce load at times when certain parts of the distribution system actually need increased consumption of electricity (e.g., to alleviate excess DER production at a distribution feeder). Such a need for decreased demand via the DR opportunity could exacerbate the distribution system problem. The reverse is also true; whereby DR resources dispatched to increase load on the bulk power system, say to alleviate a large up-ramp of variable generation resources (e.g., flexibility service), coincides with a distribution system need for decreased consumption, say to alleviate a distribution feeder overload, resulting in a situation that exacerbates the problem at the distribution system level. Lastly, changes in the DR signal across resources heavily concentrated in one isolated area of the distribution system could themselves create a local imbalance problem. For example, the release of DR resources back to their normal state may result in greater load returning to the certain parts of the distribution system than was shed (i.e., cold load pickup) which may result in unanticipated overloading or unbalanced conditions on distribution feeders or phases (Medina et al., 2010).
In order to potentially alleviate these issues, greater coordination between system planners and operators of the two parts of the grid will be increasingly required (De Martini, 2014; De Martini and Kristov, 2015). Specifically, distribution system planners should identify maximum thresholds where load changes under certain conditions could detrimentally impact the operation of the distribution system. Those operating and/or offering the DR programs would therefore need to provide greater transparency to those distribution system operators who might be affected by changes in the DR signal. For example,
21

aggregators of retail customers or bulk power system operators (e.g., RTO/ISO) who have subscribed customer load to a wholesale DR program would need to inform the distribution system operator where those customers reside on the distribution system and how much they have offered up to the DR program. It may even be necessary for the distribution system operator to know which particular phase of a feeder those participating customers are on for reliability purposes. This may require both entities (DSO and bulk power operator) to have more advanced computing capabilities in order to successfully develop and incorporate this data into operational and planning activities.
4.2 Bulk Power Level Issues with Distribution System Oriented DR Opportunities In the future DR opportunities will likely be developed to specifically address different distribution system needs (see Section 3). Because these needs are so locational in nature, the concentration of end-use customer loads subscribing to such DR opportunities and altering their consumption of electricity is likely to be relatively small, at least in terms of their impact on the transmission system. In the event DR opportunities are used throughout enough of the distribution system at the same time or a large enough concentration of customers have their DR signal changed in the same part of the distribution system, it is possible their change in load could affect the bulk power system.
Such impacts could reflect either load increases or decreases at the distribution system. In the former case, dispatch of distribution system load reductions (e.g., to alleviate distribution feeder, substation or transformer overloads) could coincide with a bulk power system need for increased consumption (e.g., to alleviate a large down ramp in variable generation production). Alternatively, the distribution-system DR opportunity could call for load increases to alleviate excess DER production on a specific distribution line that coincides with a bulk power system need for decreased consumption due to a reliability event. In either case, large enough changes in electricity consumption called for in response to a distribution system need could exacerbate existing bulk power system problems.
These conditions also illustrate the need for increased coordination between distribution and bulk power system operators and those running and managing DR resources. However, in this case, bulk power system operators will be responsible for identifying a minimum threshold for which they will need to be notified of impending or active changes to the DR signal associated with distribution system DR opportunities that result in sizable load impacts that could affect the bulk power system.
4.3 Other Coordination Issues A host of other issues arise when end-use customer demand response is increasingly used to address both distribution and bulk power system needs. These issues relate to joint participation of customers in more than one DR opportunity.
Suppose there are a set of customers subscribed separately to a distribution Dispatchable DR opportunity to provide Emergency Load Transfer service as well as a bulk power system Capacity Bidding program to provide coincident peak demand reductions. Assume that each customer nominated 100 kW of load response to each program. It is possible that these customers are nominating the same set of activities to generate the load response to both programs. If both system operators simultaneously call for load reductions from that set of customers via a change in the DR signal, then a customer may be obligated to respond to both requests. Depending upon how each program calculates the baseline, it is
22

possible that the customer could qualify as appropriately responding to both 100 kW requests (e.g., 100 kW reduction for distribution system DR opportunity and 100 kW reduction for bulk power system DR opportunity) by only reducing 100 kW from their baseline. Meter data would be sent to both program providers illustrating the customer appropriately responded to the single request to drop load by 100 kW. However, neither system operator nor program provider is aware that the same load reduction was called for by someone else at the same time. Some might consider this a double payment for the same level of load response, while others would view payment for each service as justified.
Alternatively, this same set of customers participating in the same two DR opportunities could be dispatched in opposite directions: the DU asking for a load increase in response to a voltage problem and the ISO/RTO asking for a load reduction in response to peak load conditions. Each of these participating customers would need to determine which DR signal to follow and bear the responsibility for their failure to abide by the other one. This may include financial penalties for any lack of performance when the DR signal changed and in the extreme case may have implications for the reliability of distribution and/or bulk power system (again depending upon the size of the resources).
Each of these scenarios raises a number of different concerns. In some cases, program providers (i.e., DU, ARC, ISO/RTO) may not want to worry about such complications and simply require participants to personally certify they have not enrolled in any other DR opportunity that might directly conflict with an ability to participate in their DR opportunity. Such a rigorous requirement would likely reduce the potential size of the resource pool available for any given DR opportunity. This would especially be true for DR opportunities without much history (e.g., those providing distribution-system services) that would likely be competing to draw customers away from pre-existing programs (e.g., those providing bulk power system services).
An approach that would afford more program providers’ the ability to retain access to a larger pool of DR resources would be for increased coordination between program providers and system operators. Simplistically, the different providers could work together to develop clear rules for coordinating multi-program participation, especially if those DR opportunities target different parts of the electric power system and if different program providers have different rules for similar services. Rules concerning load response nomination, setting of a hierarchy of DR signal changes that participants are expected to respond to (e.g., reliability vs. pricing vs. future capital deferral; bulk power system vs. distribution system), application of payments and penalties under coincident DR signal changes, etc. will all need to be worked out to ensure both types of system operators are getting the value out of these DR resources they are anticipating.20 In the extreme, a central authority could be deemed responsible for coordinating DR opportunities, including rule making and even the dissemination of dispatch instructions to participating end-use customers, provided they had clear lines of communication with bulk and distribution system power operators who initially institute a DR signal change. This central authority would be responsible for managing the interactions between bulk and distribution system operators as well as providers of different DR resources (e.g., ARCs vs. DUs) such that the total capacity under management could be far greater and more accessible than what a large collection of disparate and uncoordinated program providers could achieve.
20 The New York Independent System Operator developed a series of market rules to integrate and coordinate the state’s distribution utilities’ load management programs (NYISO, 2013).
23

As program providers gain more experience with these new types of DR opportunities intended to help manage and maintain reliability on the distribution system, synergies between legacy and new DR opportunities should become more readily apparent. It is possible that certain DR opportunities that provide different bulk and distribution power system services may be found that nicely complement each other and rarely if ever compete for resources. Under such circumstances, increased coordination across a myriad of different market actors may not be required at all.
24

5. Conclusions
The U.S. electric industry is entering a new phase in its existence, which may necessitate fundamental changes in its distribution network design and operation, due to increased penetration of distributed energy resources and the need for grid modernization investments. As a way to mitigate the cost of this transformation, utilities and policymakers should consider options as alternatives to or augment specific distribution system investments made by distribution utilities. One such option is demand response.
However, as this scoping study has illustrated, DR opportunities as currently designed have no ability to directly and reliably affect distribution system operational requirements. Although, executing a change in the DR signal in response to bulk power system needs may serendipitously coincide with and help alleviate a distribution system need. With modest changes to their design that allow for geographic targeting of the DR signal at levels below the bulk power system, a small subset of DR opportunities (e.g., Disconnectable incentive-based programs) can be effective at helping distribution system operators manage a number of grid needs (e.g., maximum capacity relief, emergency load transfer, voltage management and outage recovery) but not all of them. With heavy investment in very specific types of customer automation and control technology as well as distribution system sensing and visibility technology, a limited number of future demand response opportunities can more substantively support the operation of the distribution system, while a number of others can be marginally supportive.
This screening effort suggest that certain DR opportunities, if deemed cost effective in relation to other solutions, should be considered by policy makers, regulators and utilities as an option for meeting specific distribution system operational and planning requirements provided they meet circuit-specific needs to remedy an identified or anticipated problem. Given the myriad of resources that are increasingly becoming viable to help manage the distribution system, regulators and policymakers should consider directing utilities to take a more integrated approach to distribution system planning in order to assess the least cost solutions to reliably and safely operate the grid of the future (De Martini, 2014; De Martini and Kristov, 2015).21 This will likely require the development of more time-based and stochastic distribution system planning tools than are currently available, and that can effectively model various types of demand response resources. Most utilities don’t perform such integrated resource planning activities at the distribution level (i.e., primary and secondary voltage) as is now the standard for transmission system planning. Such a dramatic change in the planning process will require utility investment in staff and technology solutions to effectively make this transition. In addition, a desire for greater coordination of DR opportunities will likely engender a need to consider analyzing a more closely coupled transmission and distribution system during system planning as well as during operations. This will likely require investment in stronger and more flexible computing platforms and more robust data analytics packages to ensure during both the planning and operation phases conflicting DR actions are not exercised.
Furthermore, if DR opportunities are identified as a cost-effective solution to provide distribution system services, this will increase the number and diversity of options for customers to capture value
21 See EPRI (1991b) for one of the earliest applications of a planning methodology that shows how DSM can be targeted to most effectively capture T&D capacity-deferral benefits.
25

from altering their consumption of electricity. This in turn may increase the demand for more sophisticated control and automation technology that could enable even broader participation. To be successful, though, distribution utilities and ARCs will need to effectively design and market such rates and programs in order to achieve participation levels deemed valuable. Some of these redesigned DR opportunities may be used under conditions (e.g., weather) consistent with more traditional DR opportunities (e.g., Disconnectable or Configurable direct A/C load control programs). This may make transition of such DR opportunities easy and facilitate broader customer adoption. However, if DR opportunities are redesigned to primarily be more amenable to customers at the expense of flexibility to address distribution system needs (e.g., limited availability by time of day or number of events) then their value to distribution system operators and planners may be substantially eroded. Assessing the degree of tradeoff between customer acceptance/retention and the value of their response under different designs will be important in discerning the types of DR opportunities put forward and ultimately whether DR is a viable alternative to other potential solutions (Corneli and Kihm, 2015).
Lastly, regulators and policymakers have a critical role to play in encouraging DUs (and indirectly ARCs) to vigorously pursue cost-effective DR opportunities. For example, New York State regulators ordered their distribution utilities, as part of their broader vision for a transformed electricity sector, to file and implement incentive-based DR programs in 2015 to help defer or avoid investments in distribution system infrastructure (NYPSC, 2014). An alternative approach is for regulators to adopt enabling and supportive policies (e.g., shareholder incentives, third-party enrollment agents, lost revenue mechanisms, integrated resource planning of T&D systems) that better align utility incentives with the achievement of successful DR opportunities that can help manage the distribution system. Ultimately each state will determine what the most appropriate path forward looks like, but this scoping study will hopefully help each understand the capabilities and limitations of various DR opportunities to support distribution system operations and planning activities.
26

References
Arghandeh, R., Brown, M., Del Rosso, A., Ghatikar, G., Stewart, E., Voidani, A. and Von Meier, A. (2014) The Local Team: Leveraging Distributed Resources to Improve Resilience. IEEE Power and Energy Magazine. 12(5).
Barbose, G., Dargouth, N., Millstein, D., Spears, M., Wiser, R., Buckley, M., Widiss, R. and Grue, N. (2015) Tracking the Sun VII: The Installed Price of Residential and Non-Residential Photovoltaic Systems in the United States. Lawrence Berkeley National Laboratory, Berkeley, CA. August 2015.
Barbose, G., Goldman, C., Bharvirkar, R., Hopper, N., Ting, M. and Neenan, B. (2005) Real Time Pricing as a Default or Optional Service for C&I Customers: A Comparative Analysis of Eight Case Studies. Lawrence Berkeley National Laboratory, Berkeley, CA. Prepared for California Energy Commission. August, 2005. 106 pages. LBNL-57661.
Barbose, G., Goldman, C. and Neenan, B. (2006) The Role of Demand Response in Default Service Pricing. The Electricity Journal. 19(3): 64-74.
Cappers, P., Goldman, C. and Kathan, D. (2010) Demand response in US electricity markets: Empirical evidence. Energy. 35(4): 1526-1535.
Cappers, P. and Satchwell, A. (2015) Considerations for State Regulators and Policymakers in a Post-FERC Order 745 World. Lawrence Berkeley National Laboratory, Berkeley, CA. February 2015. LBNL-6977E.
Central Hudson Gas & Electric (2015) Central Hudson Gas & Electric Report on Program Performance and Cost Effectiveness of Dynamic Load Management Programs. December 2015.
Conant, D. A. and Levett, J. L. (1985) Load Management for Transmission and Distribution Deferral. Public Utilities Fortnightly. 115(8): 34-39.
Corneli, S. and Kihm, S. (2015) Electric Industry Structure and Regulatory Responses in a High Distributed Energy Resources Future. Future of Electric Utility Regulation. L. Schwartz. Prepared for Lawrence Berkeley National Laboratory. November 2015. LBNL-1003823.
Davis, M. W., Krupa, T. J. and Diedzic, M. J. (1983) The Economics of Direct Control of Residential Loads on the Design and Operation of the Distribution System. IEEE Transactions on Power Apparatus and Systems. PAS-102(3): 666-674.
De Martini, P. (2014) More Than Smart: A Framework to Make the Distribution Grid More Open. Resnick Sustainability Institute at the California Institute of Technology, Pasadena, CA. 32 pages.
De Martini, P. and Kristov, L. (2015) Distribution Systems In A High Distributed Energy Resource Future. Future of Electric Utility Regulation. L. Schwartz. Prepared for Lawrence Berkeley National Laboratory. October 2015. LBNL-100397.
DNV-GL (2014) A Review of Distributed Energy Resources. Prepared for New York Independent System Operator,. September 2014.
EIA (2014) Annual Energy Outlook 2014 with Projections to 2040. Energy Information Administration, Washington, D.C. DOE/EIA-0383.
Elevate Energy (2015a) Ameren Illinois Power Smart Pricing: 2014 Annual Report. April 1, 2015. Elevate Energy (2015b) ComEd Residential Real-Time Pricing (RRTP) Program: 2014 Annual Report. April
1, 2015. EPRI (1991a) DSM and the T&D System: A Complicated Interaction. July 1991. CU-7394. EPRI (1991b) Targetting DSM for T&D Benefits: A Case Study of PG&E's Delta District. May 1991. TR-
100487. EPRI (2012) Stochastic Analysis to Determine Feeder Hosting Capacity for Distributed Solar PV.
December 2012. 1026640.
27

EPRI (2014) The Integrated Grid: Realizing the Full Value of Central and Distributed Energy Resources. Electric Power Research Institute. February. 44 pages. Report # 3002002733.
FERC (2012) 2012 Assessment of Demand Response & Advanced Metering: Staff Report. Federal Energy Regulatory Commission, Washington, D.C. December 2012.
FERC (2014) 2014 Assessment of Demand Response & Advanced Metering: Staff Report. Federal Energy Regulatory Commission, Washington, D.C. December 2014.
Gellhorn, E. and Pierce, R. J. (1999) Regulated industries in a nutshell. West Group. Gellings, C. W., Redmon, J. R., Stovall, J. P. and Reddoch, T. W. (1982) Electric System Impacts of Storage
Heating and Storage Water Heating - Part II of Two Parts. IEEE Transactions on Power Apparatus and Systems. PAS-101(7): 2077-2085.
Goldman, C., Barbose, G. and Neenan, B. (2006) RTP as an Optional Service: It's Alive, But Is It Well? The Electricity Journal. 19(1): 18-29.
Harris Williams & Co. (2014) Transmission and Distribution Infrastructure: White Paper. June 2014. Hausman, W. J. and Neufeld, J. L. (1984) Time-of-day Pricing in the U.S. Electric Power Industry at the
Turn of the Century. The Rand Journal of Economics. 15(1): 116-126. Heffner, G. C. and Kaufman, D. A. (1985) Distribution Substation Load Impacts of Residential Air
Conditioner Load Control. IEEE Transactions on Power Apparatus and Systems. PAS-104(7): 1602-1608.
Ibedrola (2015) 2015 NYSEG and RG&E Distribution Level Demand Response Annual Report. December 2015.
Institute for Electric Innovation (2014) Utility-Scale Smart Meter Deployments: Building Block of the Evolving Power Grid. The Edison Foundation. September 2014.
KEMA (2012) Market Evaluation for Energy Storage in the United States. Prepared for Copper Development Association, Inc. February 2012.
Kumar Nunna, H. S. V. S. and Doolla, S. (2012) Demand response in smart distribution system with multiple microgrids. IEEE Transactions on Smart Grid. 3(4): 1641-1649.
Larsen, P. H., LaCommare, K. H., Eto, J. E. and Sweeney, J. L. (2015) Assessing Changes in the Reliability of the U.S. Electric Power System. Prepared for Lawrence Berkeley National Laboratory,. August 2015. LBNL-188741.
Ma, F. S., Lee, S. T., Carver, M. B. and Hamza, M. H. (1978). Transmission and Distribution Credits of Load Management. Presented at from the International Symposium on Simulation, Modeling and Decision in Energy Systems
Markushevich, N. and Chan, E. (2009). Integrated voltage, var control and demand response in distribution systems. Presented at 2009 IEEE/PES Power Systems Conference and Exposition, Seattle, WA. March 15-18, 2009.
Medina, J., Muller, N. and Roytelman, I. (2010) Demand response and distribution grid operations: Opportunities and challenges. IEEE Transactions on Smart Grid. 1(2): 193-198.
Mekolites, W. E. and Gursky, R. J. (1981) American Electric Power System Electric Thermal Storage Program: An Evaluation of the Impact on the Transmission and Distribution Systems. IEEE Transactions on Power Apparatus and Systems. PAS-100(12): 4733-4740.
Mohagheghi, S., Stoupis, J., Wang, Z., Li, Z. and Kazemzadeh, H. (2010). Demand response architecture: Integration into distribution management system. Presented at 2010 First IEEE International Conference on Smart Grid Communications, Gaithersburg, MD. October 4-6, 2010.
Mohagheghi, S., Yang, F. and Falahati, B. (2011). Impact of demand response on distribution system reliability. Presented at 2011 IEEE Power and Energy Society General Meeting, San Diego, CA. July 24-29, 2011.
28

Narimani, M. R., Joo, J.-Y. and Crow, M. L. (2015). The effect of demand response on distribution system operations. Presented at 2015 IEEE Power and Energy Conference at Illinois, Champaign, IL. February 20-21, 2015.
National Grid (2015) Niagara Mohawk Power Corporation d/b/a National Grid - Report on Program Performance and Cost Effectiveness Dynamic Load Management Programs. December 2015.
NYISO (2013) Manual 7 - NYISO Emergency Demand Response Program Manual.Rensselaer, NY. October 2013.
NYPSC (2014) Dynamic Load Management Programs: Order Instituting Proceeding Regarding Dynamic Load Management and Directing Tariff Filings, State of New York Public Service Commission, Case 14-E-0423, Issued December 15, 2014.
Orange & Rockland (2015) Orange & Rockland Utilities, Inc. Annual Report on Program Performance and Cost Effectiveness Dynamic Load Management Programs. December 2015.
Reno, M. J., Broderick, R. J. and Grijalva, S. (2013). Smart Inverter Capabilitites for Mitigating over-Voltage on Distribution Systems with High Penetrations of PV. Presented at IEEE 39th Photovoltaic Specialists Conference (PVSC).
Schneider, K. P., Fuller, J. C. and Chassin, D. P. (2011). Analysis of distribution level residential demand response. Presented at 2011 IEEE/PES Power Systems Conference and Exposition, Phoenix, AZ. March 20-23, 2011.
Shlatz, E., Buch, N. and Chan, M. (2013) Distributed Generation Integration Cost Study: Analytical Framework. Navigant Consulting, Burlington, MA. Prepared for California Energy Commission. November 2013. CEC-200-2013-007.
Solar Energy Industries Association (2015) U.S. Solar Industry year in Review 2014.Washington, D.C. June 2015.
Stewart, E. and Kiliccote, S. (2014). Software Based Barriers to Integration of Renewables to the Future Distribution Grid. Presented at ASME 2014 Power Conference.
Stewart, E., McPherson, J., Vasilic, S., Nakafuji, D. and Aukai, T. (2013) Analysis of High-Penetration Levels of Photovoltaics into the Distribution Grid on Oaho, Hawaii. May 2013. NREL/SR-5500-54494.
Tong, J. and Wellinghoff, J. (2014) Rooftop Parity: Solar for Everyone Including Utilities. Public Utilities Fortnightly. 152(8): 18-23.
Tyagi, R. and Black, J. W. (2010). Emergency demand response for distribution system contingencies. Presented at 2010 IEEE PES Transmission and Distribution Conference and Exposition, New Orleans, LA. April 19-22, 2010.
Venkatesan, N., Solanki, J. and Solanki, S. K. (2012) Residential demand response model and impact on voltage profile and losses of an electric distribution network. Applied Energy. 96(2012): 84-91.
Williams, T., Want, D., Crawford, C. and Djilali, N. (2013) Integrating renewable energy using a smart distribution system: Potential of self-regulating demand response. Renewable Energy. 52(2013): 46-56.
Yau, T. S., Smith, W. M., Huff, R. G., Vogt, L. J. and Willis, H. L. (1990) Demand-Side Management Impact on the Transmission and Distribution System. IEEE Transactions on Power Systems. 5(2): 506-512.
Zakariazadeh, A., Homaee, O., Jadid, S. and Siano, P. (2014) A new approach for real time voltage control using demand response in an automated distribution system. Applied Energy. 117(2014): 157-166.
Zarnikau, J. W. (2010) Demand participation in the restructured Electric Reliability Council of Texas market. Energy. 35(4): 1536-1543.
29