future prospects for the labour market - fundación …€œthe future of the work and its impact on...
TRANSCRIPT

“The future of the work and its impact on vulnerable people:
10 years of the Incorpora Program”
Future Prospects for the Labour Market
Inaugural session of the cycle of seminars in the Palau Macaya
Date: 24th February (09:15 – 12:30) Palau Macaya, Conference Hall (Passeig de Sant Joan, 108,
08037 Barcelona)
Professor Rob Wilson, Institute for Employment Research,
University of Warwick, United Kingdom

OVERVIEW
1. WHY produce employment forecasts? The value of skills projections and their limitations - What skills forecasts can and cannot achieve
2. HOW do we go about it? 3. RESULTS: Key messages from the Cedefop
Projections for the whole of the EU and for Spain

1. WHY FORECAST?
Forecasting is impossible Forecasting is unnecessary Forecasts are inaccurate and based on invalid assumptions (They are illegal ………. (at least in the UK!))
Why Not?

Act Against Conjuration, Witchcraft and Dealing with Evil Spirits
First enacted during the reign of James I, partially repealed in 1736, but nevertheless:
“prediction of the future is illegal as are any pretence to such arts and powers whereby ignorant people are frequently deluded and defrauded”
However, practitioners were no longer condemned to death:
“shall for every such offence suffer imprisonment for the space of one whole year without bail, and once every quarter of the said year shall stand openly in the pillory for the space of one hour”

However……
Fortunately for UK forecasters at least this was further amended more recently in: the Fraudulent Mediums Act, 1951
in which such activities are excused if:
“done solely for the purposes of entertainment”

Is systematic anticipation possible?
Nobody can predict the future with certainty or precision – “All forecasts are wrong!”
Everybody can prepare or plan for the future - Government, employers, educational institutions & individuals
These plans and related decision help to determine actual outcomes – such planning involves some element of forecasting: either implicitly or explicitly
In this sense not only is forecasting possible it is inevitable Comprehensive, systematic, consistent projections, based
on explicit and transparent assumptions provide useful information for all labour market participants, helping to inform all those making choices & decisions

Is Forecasting Necessary?
Rapid change, uncertainty & evidence of market failure Long lead times on investment decisions such as education
and training choices Need for a regular and systematic assessment of future
prospects to: guide & inform policy formation;
guide & inform individual decision making;
avoid future imbalances & mismatches;
need for a counterfactual to assess policy or different choices
The only meaningful questions are therefore how, by whom and with what end in mind?

So, Forecasts: Who Needs Them?
A Variety of audiences The State - planners/policy makers Education and training providers Companies/Employers
labour market pressures other reasons
Individuals: career choices Careers advisors

Aims & objectives Understanding past trends Future employment prospects:
Numbers employed by sector & occupation -job openings Education and training requirements - qualifications and skills
needed Supply/demand balances (including terms and conditions of
employment (pay)
Caveats: Implicit assumptions about the labour market Not mechanistic manpower planning Focus on the formal economy The Future is not fixed or predetermined
Ostrich approach to planning
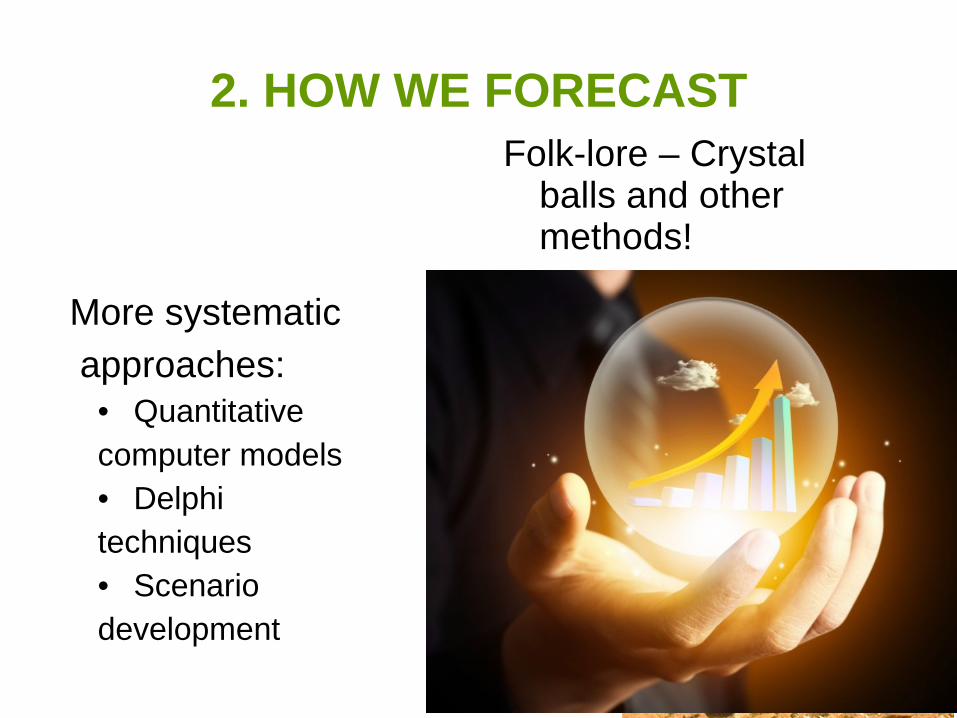
2. HOW WE FORECAST
More systematic approaches:
• Quantitative computer models • Delphi techniques • Scenario development
Folk-lore – Crystal balls and other methods!

How to Forecast / Anticipate
Formal, quantitative models: • Extrapolation of past trends • Time series methods • Need for behavioural content
Other approaches: • quantitative & qualitative • surveys • scenario development
Key elements: • Where are we now? • What happens next?

Advantages of quantitative modelling
Natural desire to quantify, measure and evaluate: • Benefits of a formal model • Value of benchmark forecasts Technological progress and statistical infrastructure International best practice - Quantitative modelling
approaches, based on macroeconomic, multi-sectoral models

The CEDEFOP framework for skills forecasting in Europe
Developments in the labour market are crucially dependent on what happens to the economy more generally
The typical quantitative modelling approach therefore involves two key elements:
• Multi-sectoral macroeconomic model • Modules to translate the results into
implications for skills demand and supply

Overall approach – modelling framework
Module 1: Multi-sectoral macroeconomic model (E3ME)
Employment (labour demand)
Labour market participation rates
Benefit rates
Economic activity
Active labour force by age and gender
Working age population by age and gender (exogenous)
Unemployment
Wage rates
Job openings by Occupation (ISCO 2 digit) Job openings by
Qualification (ISCED category)
Module 2: Employment levels and Expansion Demand by occupation (EDMOD)
Module 3: Employment levels and Expansion Demand by qualification (QUALMOD)
Module 5: Stocks of people by qualifications, 3 ISCED levels & by economic status (QUALMOD)
Numbers in the labour force by qualification ISCED category
Demand for skills
Module 6: Flows and graduate numbers by ISCED category (FLOWMOD)
Numbers in the population by Qualification ISCED category
Module 7: Imbalances & Mismatches (Supply-Demand), ISCED levels (BALMOD)
Module 4: Replacement demand by occupation / qualification (RDMOD)
Supply of skills

Role of the E3ME multi-sectoral macroeconomic model
Model the links between the labour market and the wider economy
Provide a consistent modelling framework for projecting skills demand and supply together allows analysis of imbalances (unemployment)
Take key drivers into account e.g. the impacts of the financial crisis and demographic change
Include analyses of key uncertainties develop alternative scenarios to see how these will impact on
skills in the future

3. KEY RESULTS
The future of employment – the rise of the Professionals

Key issues and drivers
Driver Demand: employment trends
Supply: labour force trends
Government spending
GDP forecast
Competitiveness & trade
Technology & innovation
Ageing population
Higher statutory retirement age
Migration
Education policy
Gender equality

Macroeconomic Impact of the 2008 financial crisis (EU)
205
210
215
220
225
230
235
240
245
2000 2005 2010 2015 2020 2025
Million jobs
No crisis scenario2010 baseline2011 baseline

Employment prospects, 2005-2030: Spain (ES)
0.00
5.00
10.00
15.00
20.00
25.00
2005 2010 2015 2020 2025 2030
Millions

Demographics, 2015-2025 (ES)
-60%
-40%
-20%
0%
20%
40%
60%
15-19 20-24 25-29 30-34 35-39 40-44 45-49 50-54 55-59 60-64 65+
Population change Labour force change

Declining labour force (falling population) but increasingly well qualified (ES)
0.00
5.00
10.00
15.00
20.00
25.00
2005 2010 2015 2020 2025 2030
Millions Low Medium High

Slow, but significant and inexorable sectoral change (ES)
0
1,000
2,000
3,000
4,000
5,000
6,000
7,000
2005 2010 2015 2020 2025 2030
thousands
Primary sector& utilities
Manufacturing
Construction
Distribution &transport
Business &other services
Non-marketedservices
The Service Sector will continue to provide the main source of job growth

-10 -5 0 5
All industries
[Construction]
Rest of manufacturingEngineering
Food, drink & tobacco[Manufacturing]
Electricity, gas & waterMining & quarrying
Agriculture etc[Primary sector & utilities]
2015-2025
2005-2015
% per annum
Sectoral details, 2015-25 (ES) Continuing job losses in Primary
and manufacturing sectors
-1.5 -1 -0.5 0 0.5 1 1.5 2 2.5 3
All industries
Health and social workEducation
Public admin and defence[Non-marketed services]
Miscellaneous servicesOther business services
Banking & insurance[Business & other services]
Transport & telecommunicationsHotels and catering
Distribution[Distribution & transport]
% per annum
Austerity measures will curb employment growth in the public sector

In many countries unemployment will remain higher than pre-recession rates (EU)
Note(s): Scandinavia is Denmark, Finland, Sweden and Norway; Benelux is Belgium, Luxembourg and the Netherlands; Southern Europe is Spain, Italy, Portugal, Greece, Malta and Cyprus; CEEC is Czech Republic, Slovakia, Poland, Hungary, Latvia, Lithuania, Estonia, Bulgaria, Romania and Slovenia.

Measurement of skills supply and demand
• Skills measured by occupation (ISCO) and qualification (ISCED)
• Demand proxied by employment • Supply - economically active by
highest qualification (HQ,MQ, LQ)

0
500
1,000
1,500
2,000
2,500
3,000
3,500
4,000
4,500
2005 2010 2015 2020 2025 2030
thousands
Legislators, seniorofficials and managersProfessionals
Technicians andassociate professionalsClerks
Service workers and shopand market sales workersSkilled agricultural andfishery workersCraft and related tradesworkersPlant and machineoperators and assemblersElementary occupations
Significant structural change by Occupation too - but few big surprises (ES)
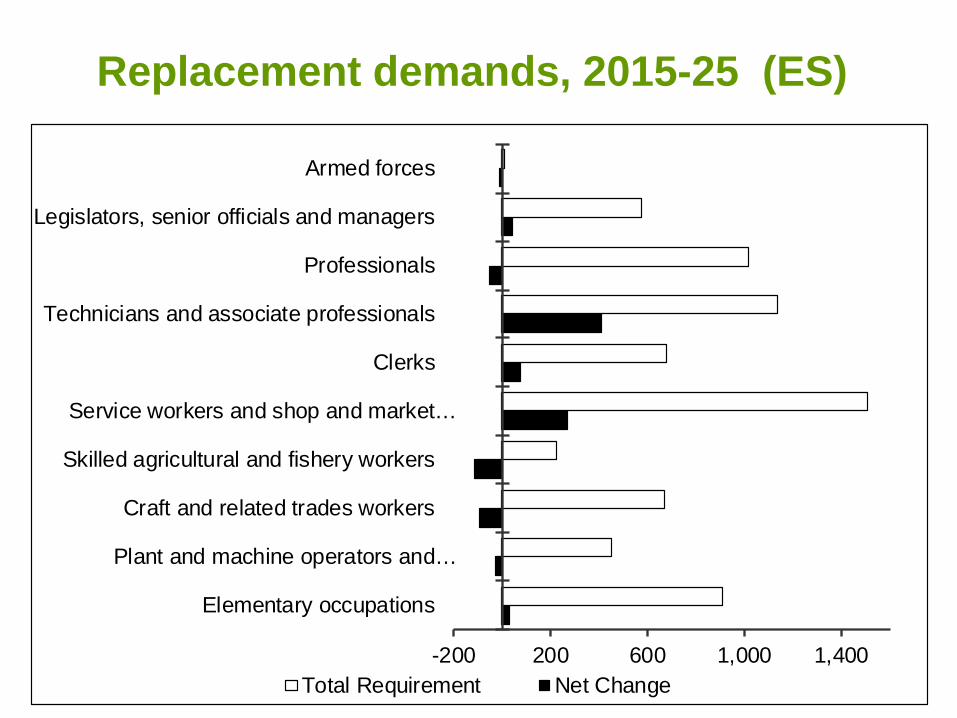
Replacement demands, 2015-25 (ES)
-200 200 600 1,000 1,400
Elementary occupations
Plant and machine operators and…
Craft and related trades workers
Skilled agricultural and fishery workers
Service workers and shop and market…
Clerks
Technicians and associate professionals
Professionals
Legislators, senior officials and managers
Armed forces
Total Requirement Net Change

0.02.04.06.08.0
10.012.014.016.018.020.0
Legislators, senior officials and managers
Professionals
Technicians and associate professionals
Clerks
Service workers and shop and market sales workers
Skilled agricultural and fishery workers
Craft and related trades workers
Plant and machine operators and assemblers
Elementary occupations
% of total employment
2020
2010
2000
Knowledge- and skills-intensive jobs on the increase (EU28)

And also by qualifications held, net changes 2015-2025 (ES)
-2,000 -1,000 0 1,000 2,000 3,000 4,000 5,000
Low qualification
Medium qualification
High qualification
Total job openings Replacement needs Expansion demand

…… a greater % share of jobs for the better qualified (ES)
0
5
10
15
20
25
30
35
40
45
50
2005 2010 2015 2020 2025 2030
Low
Medium
High
%Spain

Driven in no small part by supply side trends (numbers economically active, ES)
0.00
5.00
10.00
15.00
20.00
25.00
2005 2010 2015 2020 2025 2030
Low Medium HighLabour Force, Millions

0
2,000
4,000
6,000
8,000
10,000
12,000
2005 2010 2015 2020 2025 2030
thousands Spain
Low (LabourForce)
Medium (LabourForce)
High (LabourForce)
Low (DemUnconstrained)
Medium (DemUnconstrained)
High (DemUnconstrained)
Low (DemConstrained)
Medium (DemConstrained)
High (DemConstrained)
Comparison of supply and demand trends - BUT Imbalances not easy to measure

Increasing diversity, imbalances, mismatches & risks of over qualification
Increasing diversity of Higher & Further Education (HE) HE no longer a “minority sport” (participation rates >>50%) Demand for skills: crisis has accelerated changes
Fewer job opportunities for the low-qualified (but some growth) Some better qualified may need to accept lower level jobs Science, Technology, Engineering & Mathematics is a key area But Quality more important than Quantity
Skills mismatches and imbalances are a persistent phenomenon, we need to develop the right skill mix to: manage transitions & adjustments in the labour market match & anticipate knowledge- & skills-intensive jobs

On the right track ? Europe is on track to raise its qualifications profile more Europeans acquiring better qualifications fewer low-qualified Europeans younger cohorts the best qualified ever
Rising supply mirrors projected growth in demand BUT Concerns about over- qualification & mismatch: High level qualifications may no longer guarantee success Results suggest some polarisation in skills demand - many
graduates may need to find jobs in non-traditional areas Looking beyond formal qualifications – need “T-shaped”
individuals with general as well as specific core technical skills

Conclusions & Key results
Labour supply: expanding but also ageing Employment: rising slowly, constrained by supply Unemployment: falling slowly but persistent Macroeconomic uncertainties: Brexit & Trump Sectoral change: significant change (relentless shift
from primary and manufacturing towards services) Skill Supply: increasing number formally qualified Skill demands: rising demand but polarisation Replacement needs: Even where employment is falling Imbalances and mismatches: problems remain but
markets will adjust if allowed to operate freely

Contact details for further information:
Rob Wilson Institute for Employment Research, University of Warwick [email protected] Cedefop Pan-European projections: www.cedefop.europa.eu/skillsnet