future workforce trends in nsw: emerging technologies … · future workforce trends in nsw:...
TRANSCRIPT
Future workforce trends in NSW: Emerging technologies and their potential impact
Briefing Paper No 13/2015 by Chris Angus
RELATED PUBLICATIONS
• NSW Economic Update: Spring 2015. Statistical Indicators No
5/2015 by Andrew Haylen.
• Western Sydney: an economic profile. Briefing Paper No 10/2015 by Daniel Montoya.
• Uber and Airbnb: the legal and policy debate in NSW. e-brief No 6/2015 by Andrew Haylen.
ACKNOWLEDGEMENT
The author would like to thank Professor Hugh Durrant-Whyte and CEDA for providing the NSW Parliamentary Research Service with their probability of computerisation data. Any errors are the author’s responsibility.
ISSN 1325-5142
ISBN 978-0-7313-1932-9
December 2015
© 2015
Except to the extent of the uses permitted under the Copyright Act 1968, no part of this document may be reproduced or transmitted in any form or by any means including information storage and retrieval systems, without the prior consent from the Manager, NSW Parliamentary Research Service, other than by Members of the New South Wales Parliament in the course of their official duties.
Future workforce trends in NSW: Emerging technologies
and their potential impact
by
Chris Angus
NSW PARLIAMENTARY RESEARCH SERVICE
Gareth Griffith (BSc (Econ) (Hons), LLB (Hons), PhD), Manager, Politics & Government/Law .......................................... (02) 9230 2356 Daniel Montoya (BEnvSc (Hons), PhD), Senior Research Officer, Environment/Planning ......................... (02) 9230 2003 Lenny Roth (BCom, LLB), Senior Research Officer, Law ....................................................... (02) 9230 2768 Christopher Angus (BA(Media&Comm), LLM(Juris Doctor)), Research Officer, Law .................................................................. (02) 9230 2906 Tom Gotsis (BA, LLB, Dip Ed, Grad Dip Soc Sci) Research Officer, Law .................................................................. (02) 9230 3085 Andrew Haylen (BResEc (Hons)), Research Officer, Public Policy/Statistical Indicators .................. (02) 9230 2484 John Wilkinson (MA, PhD), Research Officer, Economics ...................................................... (02) 9230 2006
Should Members or their staff require further information about this publication please contact the author.
Information about Research Publications can be found on the Internet at:
http://www.parliament.nsw.gov.au/prod/parlment/publications.nsf/V3LIstRPSubject
Advice on legislation or legal policy issues contained in this paper is provided for use in parliamentary debate and for related parliamentary purposes. This paper is not professional legal opinion.
CONTENTS 1. INTRODUCTION ......................................................................................... 5
2. PAST AND ONGOING COMPUTERISATION OF THE WORKFORCE ..... 6
2.1 Previous changes to the NSW workforce .............................................. 6
2.2 Computerisation and its impact on NSW jobs ..................................... 12
3. CHARACTERISTICS OF FUTURE WORK .............................................. 14
3.1 Increasing demand for particular skills ................................................ 14
3.2 Emerging technologies ........................................................................ 15
4. OPPORTUNITIES AND RISKS IN THE FUTURE WORKFORCE ........... 19
4.1 Future work opportunities .................................................................... 19
4.2 Emerging risks in the future workforce ................................................ 21
5. PREDICTED FUTURE IMPACTS OF COMPUTERISATION ................... 24
5.1 The limitations to prediction ................................................................. 24
5.2 Computerisation’s predicted impact on global workforces ................... 24
5.3 Computerisation’s predicted impact on the Australian workforce ........ 28
6. THE POTENTIAL IMPACT OF COMPUTERISATION IN NSW ............... 30
6.1 Computerisation of jobs in NSW ......................................................... 31
6.2 Computerisation by NSW electorate ................................................... 35
6.3 Characteristics of different NSW electorates ....................................... 40
7. POLICIES TO TRANSITION TO A FUTURE WORK ENVIRONMENT .... 42
7.1 Embracing and managing change ....................................................... 42
7.2 Examples of current policies ............................................................... 43
7.3 Improving education in Australia ......................................................... 47
7.4 Other policy proposals......................................................................... 50
8. CONCLUSION .......................................................................................... 55
APPENDIX A: METHODOLOGY FOR ASSESSING COMPUTERISATION IMPACT ON NSW ............................................................................................ 56
APPENDIX B: JOBS AT RISK OF COMPUTERISATION BY NSW STATE ELECTORATE ................................................................................................. 58
APPENDIX C: OCCUPATIONS AT RISK OF COMPUTERISATION IN NSW 62

Future workforce trends in NSW: Emerging technologies and their potential impact
1
EXECUTIVE SUMMARY
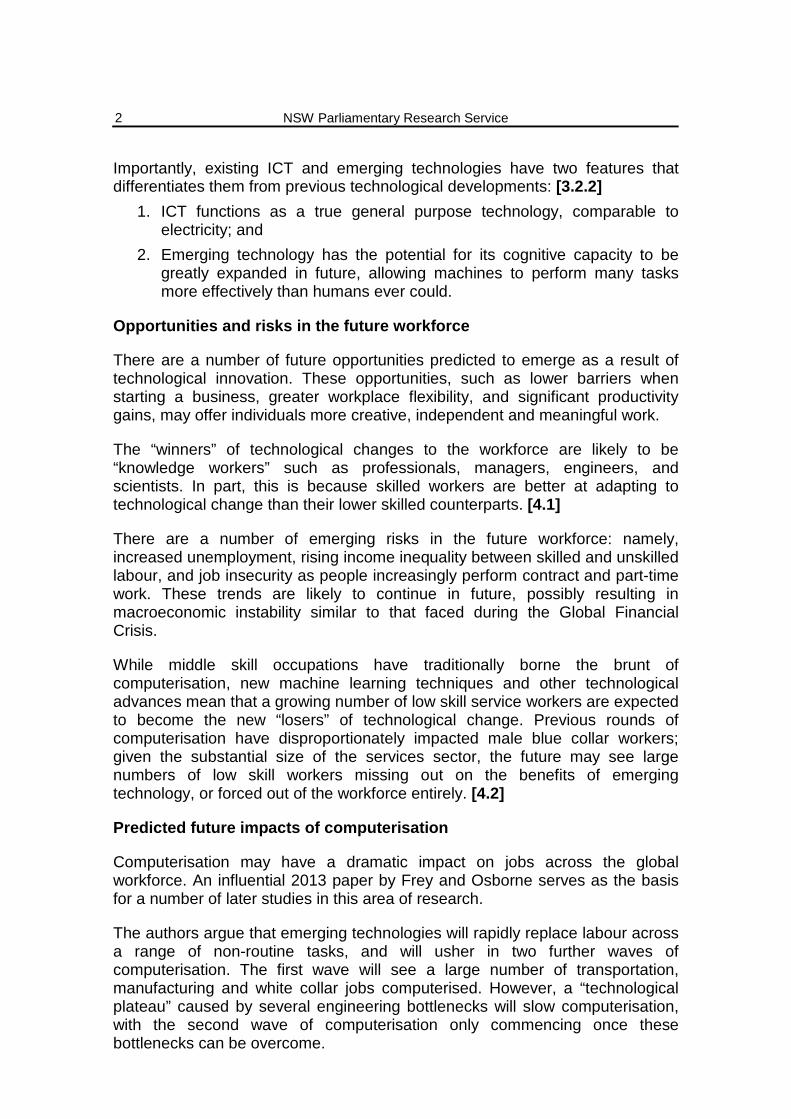
With the advent of the digital age, the pace of change and the scope and capacity for innovation have increased exponentially. Experts predict that emerging information and communication technologies, such as cloud computing and advanced machine learning techniques, will have a dramatic impact on the labour force, which will see both growing demand for new skills and occupations, and job losses in a number of more vulnerable industries.
Past and ongoing computerisation of the workforce
Since the 1970s Australia has pivoted away from goods producing sectors such as agriculture, mining and manufacturing towards the services industry. As of 2015, the Australian services sector is responsible for almost 80% of Australia’s $1.6 trillion economy, and employs over 10 million people (86.7% of the workforce).
Australia’s shift towards a services-dominated economy has much to do with the phenomenon known as computerisation; job automation using computer-controlled equipment. The ongoing computerisation of work in Australia has resulted in job polarisation: a decrease in middle skill jobs and increase in the share of high and low skill jobs. [2.1]
In NSW, as elsewhere, the emergence of low cost computers over the past few decades that can quickly and reliably perform routine tasks has resulted in substantial growth in non-routine occupations; primarily low and high income jobs in the services sector. In contrast, occupations characterised by routine tasks, such as bookkeepers or manufacturing workers, have seen very limited growth during this period. [2.2]
Characteristics of future work
Technology is expected to bring net benefits to a workforce that will largely, but not entirely, adapt to change. A number of skills will become increasingly sought after by employers, including science, technology, engineering and mathematics (STEM) skills, or hybrid skillsets such as project management and nanotechnology. [3.1]
Experts have identified five overarching technological developments in the field of information and communications technology (ICT) that are predicted to have the most profound impact on the Australian workforce: [3.2]
• Cloud services; • The “Internet of Things”; • “Big Data”; • Machine learning and robots; and • Immersive communications.
NSW Parliamentary Research Service
2
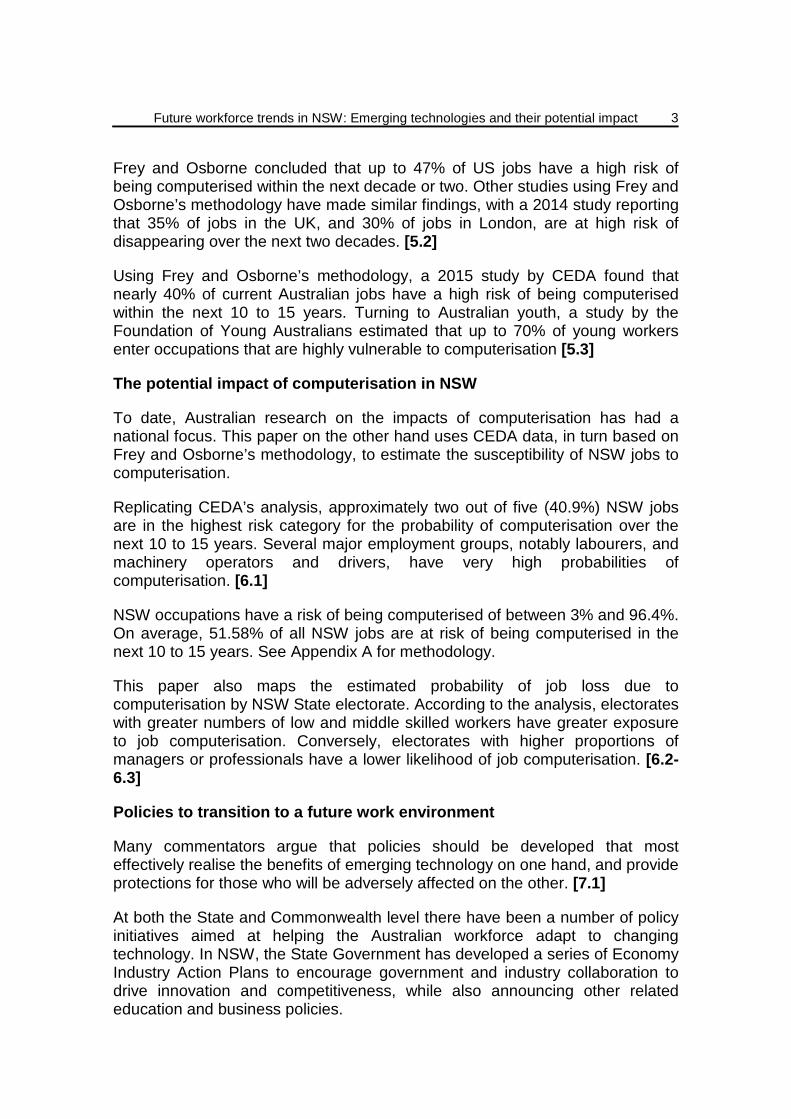
Importantly, existing ICT and emerging technologies have two features that differentiates them from previous technological developments: [3.2.2]
1. ICT functions as a true general purpose technology, comparable to electricity; and
2. Emerging technology has the potential for its cognitive capacity to be greatly expanded in future, allowing machines to perform many tasks more effectively than humans ever could.
Opportunities and risks in the future workforce
There are a number of future opportunities predicted to emerge as a result of technological innovation. These opportunities, such as lower barriers when starting a business, greater workplace flexibility, and significant productivity gains, may offer individuals more creative, independent and meaningful work.
The “winners” of technological changes to the workforce are likely to be “knowledge workers” such as professionals, managers, engineers, and scientists. In part, this is because skilled workers are better at adapting to technological change than their lower skilled counterparts. [4.1]
There are a number of emerging risks in the future workforce: namely, increased unemployment, rising income inequality between skilled and unskilled labour, and job insecurity as people increasingly perform contract and part-time work. These trends are likely to continue in future, possibly resulting in macroeconomic instability similar to that faced during the Global Financial Crisis.
While middle skill occupations have traditionally borne the brunt of computerisation, new machine learning techniques and other technological advances mean that a growing number of low skill service workers are expected to become the new “losers” of technological change. Previous rounds of computerisation have disproportionately impacted male blue collar workers; given the substantial size of the services sector, the future may see large numbers of low skill workers missing out on the benefits of emerging technology, or forced out of the workforce entirely. [4.2]
Predicted future impacts of computerisation
Computerisation may have a dramatic impact on jobs across the global workforce. An influential 2013 paper by Frey and Osborne serves as the basis for a number of later studies in this area of research.
The authors argue that emerging technologies will rapidly replace labour across a range of non-routine tasks, and will usher in two further waves of computerisation. The first wave will see a large number of transportation, manufacturing and white collar jobs computerised. However, a “technological plateau” caused by several engineering bottlenecks will slow computerisation, with the second wave of computerisation only commencing once these bottlenecks can be overcome.
Future workforce trends in NSW: Emerging technologies and their potential impact
3
Frey and Osborne concluded that up to 47% of US jobs have a high risk of being computerised within the next decade or two. Other studies using Frey and Osborne’s methodology have made similar findings, with a 2014 study reporting that 35% of jobs in the UK, and 30% of jobs in London, are at high risk of disappearing over the next two decades. [5.2]
Using Frey and Osborne’s methodology, a 2015 study by CEDA found that nearly 40% of current Australian jobs have a high risk of being computerised within the next 10 to 15 years. Turning to Australian youth, a study by the Foundation of Young Australians estimated that up to 70% of young workers enter occupations that are highly vulnerable to computerisation [5.3]
The potential impact of computerisation in NSW
To date, Australian research on the impacts of computerisation has had a national focus. This paper on the other hand uses CEDA data, in turn based on Frey and Osborne’s methodology, to estimate the susceptibility of NSW jobs to computerisation.
Replicating CEDA’s analysis, approximately two out of five (40.9%) NSW jobs are in the highest risk category for the probability of computerisation over the next 10 to 15 years. Several major employment groups, notably labourers, and machinery operators and drivers, have very high probabilities of computerisation. [6.1]
NSW occupations have a risk of being computerised of between 3% and 96.4%. On average, 51.58% of all NSW jobs are at risk of being computerised in the next 10 to 15 years. See Appendix A for methodology.
This paper also maps the estimated probability of job loss due to computerisation by NSW State electorate. According to the analysis, electorates with greater numbers of low and middle skilled workers have greater exposure to job computerisation. Conversely, electorates with higher proportions of managers or professionals have a lower likelihood of job computerisation. [6.2-6.3]
Policies to transition to a future work environment
Many commentators argue that policies should be developed that most effectively realise the benefits of emerging technology on one hand, and provide protections for those who will be adversely affected on the other. [7.1]
At both the State and Commonwealth level there have been a number of policy initiatives aimed at helping the Australian workforce adapt to changing technology. In NSW, the State Government has developed a series of Economy Industry Action Plans to encourage government and industry collaboration to drive innovation and competitiveness, while also announcing other related education and business policies.
NSW Parliamentary Research Service
4
Elsewhere in Australia, both the Victorian and Queensland Governments have established funds designed to support industry sectors with the potential for high economic growth and the capacity to create high skill, high wage jobs. Additionally, the Commonwealth Government has committed funding for STEM and computer coding courses in Australian schools. [7.2]
Of the many policy proposals in response to changing workforces, an increased focus on high quality and specialised education is the most widely supported. Increased STEM education has been strongly advocated by experts, as these skills not only benefit individuals but also have flow-on benefits to the community as a whole.
However, the Office of the Chief Scientist has criticised the existing state of STEM in Australia, citing a lack of coordination, misdirected effort, instability and duplication between Australian governments. In response, the Office of the Chief Scientist outlined several strategies to try and mitigate these issues at both the State and Commonwealth level. [7.3]
In addition to improving education, a range of other policies are worth noting, these being either currently in use overseas or advocated by policymakers: [7.4]
• “Flexicurity” and Active Labour Market Policies: An industrial relations policy used in European countries such as Denmark, whereby employers are given the ‘flexibility’ to hire and fire workers, and employees granted ‘security’ through generous unemployment benefits and comprehensive training programs helping them gain new job skills;
• Initiatives for startup companies: A number of policies that can be implemented at the State level include increased funding avenues, entrepreneurship leave, and steps to reduce a systemic fear of failure that is a major impediment to startup activity in Australia;
• Inclusive growth: A series of policies that invest investment in human capital, which can subsequently produce a range of economic benefits. Examples include tax reform to shift tax burdens from labour towards consumption, and ongoing and increased investment in skills and training for workers.
Future workforce trends in NSW: Emerging technologies and their potential impact
5
1. INTRODUCTION
In the industrial era the world of work, and the way society functions more generally, has been shaped and reshaped by technological innovation. With the advent of the digital age, the pace of change and the scope and capacity for innovation have increased exponentially. It is now the case that even seemingly minor developments can bring about rapid and significant change in our day-to-day lives. Two recent examples are the impact of the app-based platforms Uber and Airbnb on the traditional taxi and hotel industries respectively.1
Experts have long predicted that emerging information and communication technologies (referred to as “emerging technology” in this paper) will have a dramatic impact on global societies. These trends have occurred for a number of decades, with positive and negative consequences for communities across the world.
The focus of this paper is on the future implications of emerging technology for the labour force; namely, how new technology, such as cloud computing, “Big Data”, and advances in machine learning techniques, may drive the creation of new skills and jobs while simultaneously rendering obsolete other forms of work, even entire industries.
This briefing paper outlines the key emerging technologies expected to affect the Australian (and the world’s) workforce, with particular emphasis on advanced machine learning techniques that will allow computers to take over jobs currently performed only by humans. The paper lists the possible characteristics of future workplaces and workers, and the opportunities and risks that are likely to arise in the coming decades. The “computerisation” of the workforce, both now and into the future, is discussed, with a summary of existing research showing the predicted impact of this phenomenon on global workforces.
Focusing on NSW, the briefing paper then applies existing research to State electorates in order to determine which workforces in which areas of NSW are most, and least, likely to be affected by computerisation. The paper concludes with a snapshot of existing and proposed policy ideas which may assist NSW, and Australia more broadly, to transition into the new world of work.
1 For further information on these platforms and their impact in NSW, see A Haylen, Uber and
Airbnb: the legal and policy debate in NSW, NSW Parliamentary Research Service, e-brief 6/2015.
NSW Parliamentary Research Service
6
2. PAST AND ONGOING COMPUTERISATION OF THE WORKFORCE
The ability of technology to reshape the workforce is not a new phenomenon. During the 19th century the Industrial Revolution ushered in a radical shift from artisan work to the factory system, increasing productivity, demand for low skill workers, and ultimately benefiting ordinary people as producers. Similarly, the switch to electricity and the displacement of the steam engine in the early 20th century saw a rise in demand for high school-educated workers, leading to what has been described as “the race between technology and education”.2
This chapter briefly outlines the most recent reshaping of the NSW workforce; namely, the shift towards a predominantly service-based economy, accompanied by a disproportionate reduction in middle skill jobs. It then discusses the computerisation of jobs – an ongoing process that has radically altered how we work.
2.1 Previous changes to the NSW workforce
2.1.1 The rise of the services industry
Since the 1970s the declining cost of computers, along with reduced industry protection and the increasing productivity and sophistication of manufacturing in Asian countries, has seen Australia’s industry mix change dramatically. Between 1975 and 2014, manufacturing’s share of total employment has more than halved, while employment in the utilities, construction and communication sectors has also declined. 3
In contrast, services industries, particularly areas such as health, finance, retail and education, have seen substantial rises in their share of the Australian workforce. As of 2015, the Australian services sector is responsible for almost 80% of Australia’s $1.6 trillion economy, and employs over 10 million people (86.7% of the nation’s workforce).4
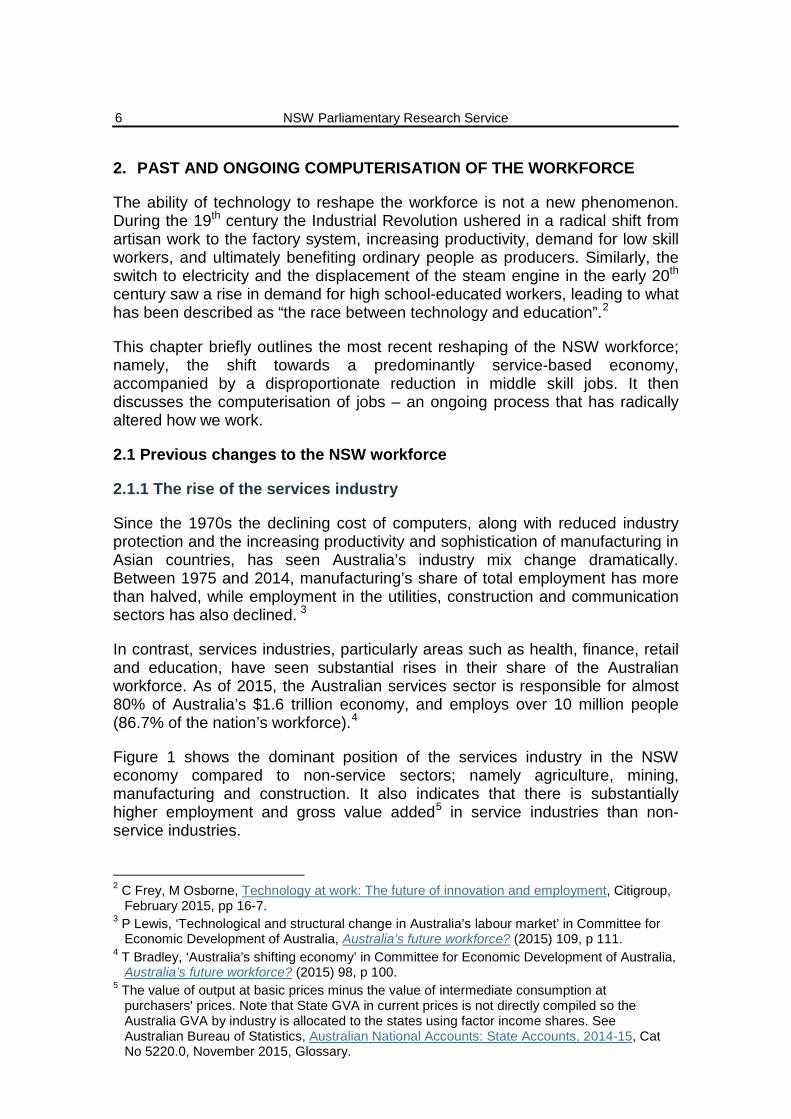
Figure 1 shows the dominant position of the services industry in the NSW economy compared to non-service sectors; namely agriculture, mining, manufacturing and construction. It also indicates that there is substantially higher employment and gross value added5 in service industries than non-service industries.
2 C Frey, M Osborne, Technology at work: The future of innovation and employment, Citigroup,
February 2015, pp 16-7. 3 P Lewis, ‘Technological and structural change in Australia’s labour market’ in Committee for
Economic Development of Australia, Australia’s future workforce? (2015) 109, p 111. 4 T Bradley, ‘Australia’s shifting economy’ in Committee for Economic Development of Australia,
Australia’s future workforce? (2015) 98, p 100. 5 The value of output at basic prices minus the value of intermediate consumption at
purchasers' prices. Note that State GVA in current prices is not directly compiled so the Australia GVA by industry is allocated to the states using factor income shares. See Australian Bureau of Statistics, Australian National Accounts: State Accounts, 2014-15, Cat No 5220.0, November 2015, Glossary.
Future workforce trends in NSW: Emerging technologies and their potential impact
7
Figure 1: Gross value added and employment by NSW industry, 2014-156
Various factors have impacted Australian industry over the past few decades, with some drivers affecting particular industries more than others. For example, as discussed in the Committee for Economic Development of Australia’s 2015 report Australia’s future workforce? (CEDA Report), the partial deregulation and privatisation of the utilities sector in the 1990s and 2000s resulted in substantial restructuring and labour shedding. Similarly, tariff reductions and the ability to outsource work to Asian nations have disproportionately impacted the manufacturing sector.7
However, these factors alone have not brought about the changes to Australia’s industry mix. As discussed below, many studies have concluded that technological change has played a key role in bringing systematic change to the Australian (and the world’s) workforce.
2.1.2 Computerisation and the routinisation hypothesis
Australia’s shift towards a services-dominated economy has much to do with the phenomenon known as “computerisation”. Computerisation—also referred to as “automation”, “computerisation and automation”, or “computerisation and technology”—is defined as “job automation by means of computer-controlled equipment.”8
6 Ibid Table 2. 7 Lewis, note 3, p 111. 8 C Frey, M Osborne, The future of employment: how susceptible are jobs to computerisation?,
0 10 20 30 40 50 60 70
0 100 200 300 400 500 600 700
Other servicesArts and recreation services
Health care and social assistanceEducation and training
Accommodation and food servicesRetail trade
Administrative and support servicesPublic administration and safety
Rental, hiring and real estate servicesInformation media and telecommunications
Professional, scientific and technical servicesFinancial and insurance services
Wholesale tradeTransport, postal and warehousing
Electricity, gas, water and waste servicesConstruction
ManufacturingMining
Agriculture, forestry and fishing
Industry gross value added ($ billions)
Employment ('000)
Employment
Industry grossvalue added
NSW Parliamentary Research Service
8
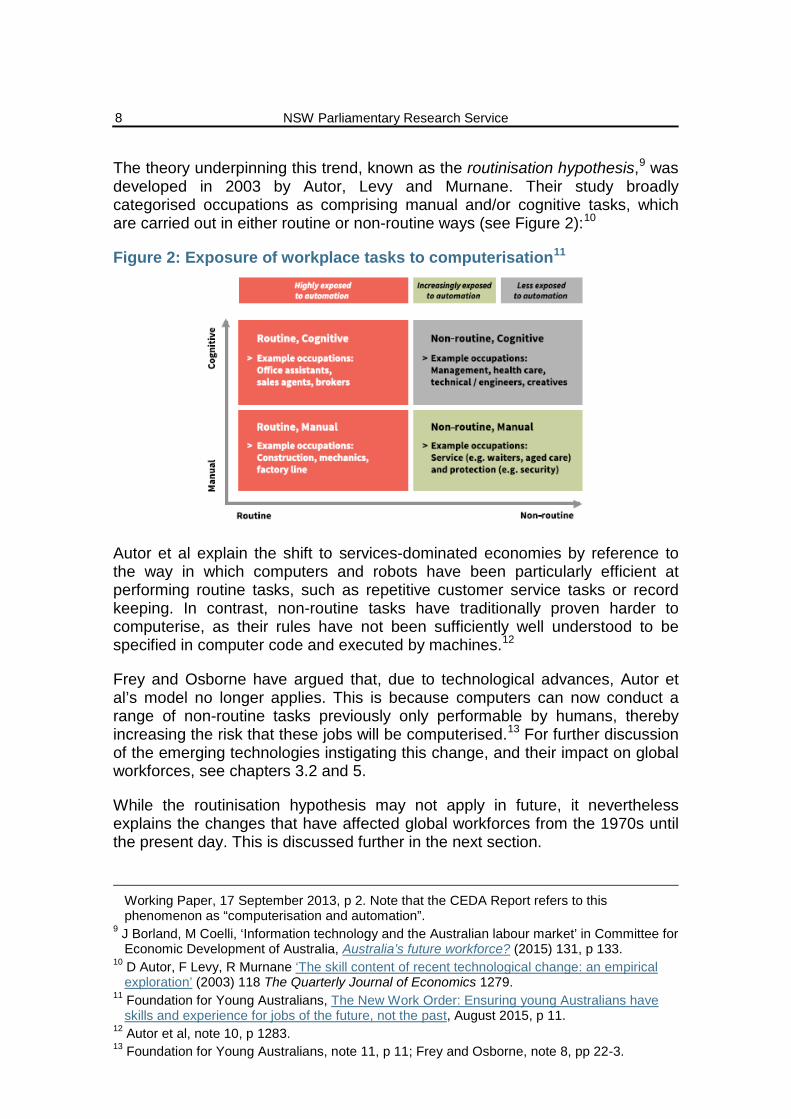
The theory underpinning this trend, known as the routinisation hypothesis,9 was developed in 2003 by Autor, Levy and Murnane. Their study broadly categorised occupations as comprising manual and/or cognitive tasks, which are carried out in either routine or non-routine ways (see Figure 2):10
Figure 2: Exposure of workplace tasks to computerisation11
Autor et al explain the shift to services-dominated economies by reference to the way in which computers and robots have been particularly efficient at performing routine tasks, such as repetitive customer service tasks or record keeping. In contrast, non-routine tasks have traditionally proven harder to computerise, as their rules have not been sufficiently well understood to be specified in computer code and executed by machines.12
Frey and Osborne have argued that, due to technological advances, Autor et al’s model no longer applies. This is because computers can now conduct a range of non-routine tasks previously only performable by humans, thereby increasing the risk that these jobs will be computerised.13 For further discussion of the emerging technologies instigating this change, and their impact on global workforces, see chapters 3.2 and 5.
While the routinisation hypothesis may not apply in future, it nevertheless explains the changes that have affected global workforces from the 1970s until the present day. This is discussed further in the next section.
Working Paper, 17 September 2013, p 2. Note that the CEDA Report refers to this phenomenon as “computerisation and automation”.
9 J Borland, M Coelli, ‘Information technology and the Australian labour market’ in Committee for Economic Development of Australia, Australia’s future workforce? (2015) 131, p 133.
10 D Autor, F Levy, R Murnane ‘The skill content of recent technological change: an empirical exploration’ (2003) 118 The Quarterly Journal of Economics 1279.
11 Foundation for Young Australians, The New Work Order: Ensuring young Australians have skills and experience for jobs of the future, not the past, August 2015, p 11.
12 Autor et al, note 10, p 1283. 13 Foundation for Young Australians, note 11, p 11; Frey and Osborne, note 8, pp 22-3.
Future workforce trends in NSW: Emerging technologies and their potential impact
9
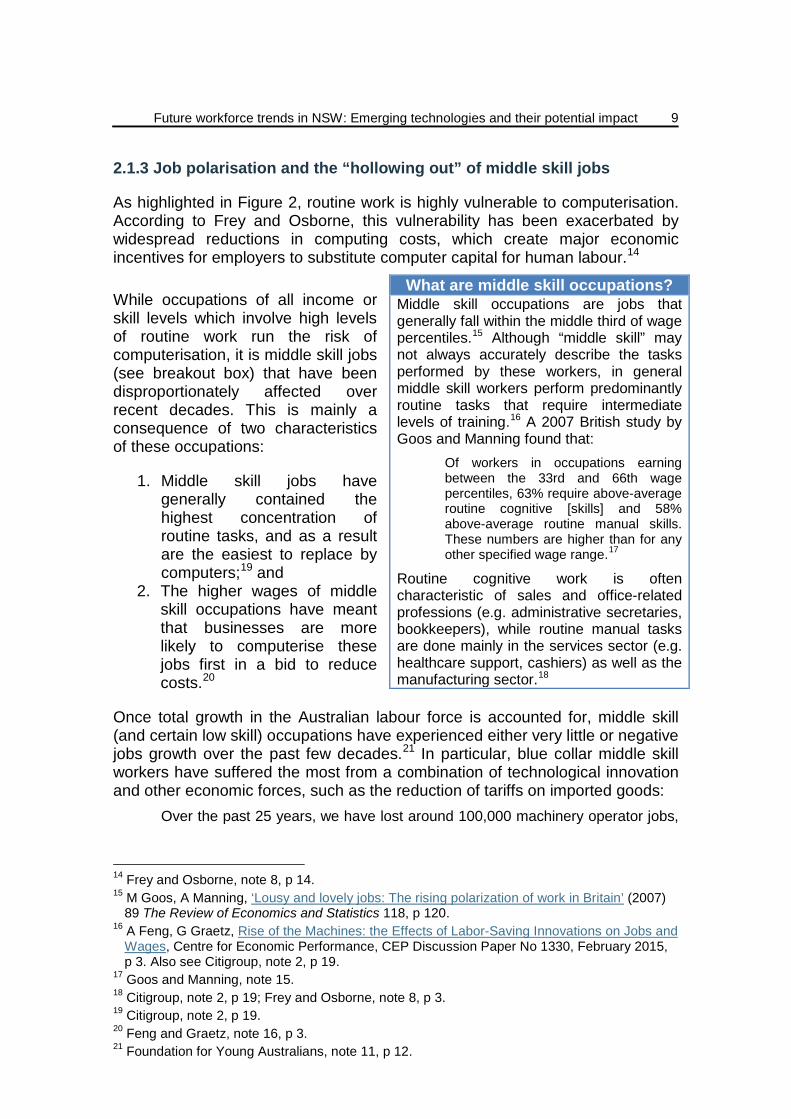
2.1.3 Job polarisation and the “hollowing out” of middle skill jobs
As highlighted in Figure 2, routine work is highly vulnerable to computerisation. According to Frey and Osborne, this vulnerability has been exacerbated by widespread reductions in computing costs, which create major economic incentives for employers to substitute computer capital for human labour.14
While occupations of all income or skill levels which involve high levels of routine work run the risk of computerisation, it is middle skill jobs (see breakout box) that have been disproportionately affected over recent decades. This is mainly a consequence of two characteristics of these occupations:
1. Middle skill jobs have generally contained the highest concentration of routine tasks, and as a result are the easiest to replace by computers;19 and
2. The higher wages of middle skill occupations have meant that businesses are more likely to computerise these jobs first in a bid to reduce costs.20
Once total growth in the Australian labour force is accounted for, middle skill (and certain low skill) occupations have experienced either very little or negative jobs growth over the past few decades.21 In particular, blue collar middle skill workers have suffered the most from a combination of technological innovation and other economic forces, such as the reduction of tariffs on imported goods:
Over the past 25 years, we have lost around 100,000 machinery operator jobs,
14 Frey and Osborne, note 8, p 14. 15 M Goos, A Manning, ‘Lousy and lovely jobs: The rising polarization of work in Britain’ (2007)
89 The Review of Economics and Statistics 118, p 120. 16 A Feng, G Graetz, Rise of the Machines: the Effects of Labor-Saving Innovations on Jobs and
Wages, Centre for Economic Performance, CEP Discussion Paper No 1330, February 2015, p 3. Also see Citigroup, note 2, p 19.
17 Goos and Manning, note 15. 18 Citigroup, note 2, p 19; Frey and Osborne, note 8, p 3. 19 Citigroup, note 2, p 19. 20 Feng and Graetz, note 16, p 3. 21 Foundation for Young Australians, note 11, p 12.
What are middle skill occupations? Middle skill occupations are jobs that generally fall within the middle third of wage percentiles.15 Although “middle skill” may not always accurately describe the tasks performed by these workers, in general middle skill workers perform predominantly routine tasks that require intermediate levels of training.16 A 2007 British study by Goos and Manning found that:
Of workers in occupations earning between the 33rd and 66th wage percentiles, 63% require above-average routine cognitive [skills] and 58% above-average routine manual skills. These numbers are higher than for any other specified wage range.17
Routine cognitive work is often characteristic of sales and office-related professions (e.g. administrative secretaries, bookkeepers), while routine manual tasks are done mainly in the services sector (e.g. healthcare support, cashiers) as well as the manufacturing sector.18
NSW Parliamentary Research Service
10
nearly 400,000 labourers, and nearly 250,000 jobs from the technicians and trades. … nearly one in ten unskilled men lost their jobs and did not return to the labour force. Today, more than one in four unskilled men don’t participate. Big economic shifts are not costless for everyone.22
In contrast, both high and low skill occupations have been less affected by computerisation. According to a 2015 report by Citigroup, this is because many jobs within these two groups involve non-routine tasks, requiring either cognitive capacity or manual labour to complete them:
At the high end, these include jobs in managerial and professional occupations, such as those in law, architecture and design, and finance; at the low end, jobs requiring manual labour are found in the construction sector, in installation and maintenance, and in the transportation and shipping sectors (e.g. truck drivers), to name a few.23
Feng and Graetz have argued that low skill occupations are shielded from computerisation not only because many tasks they perform are highly complex in engineering terms (and are therefore difficult to computerise), but also because these workers are cheaper to hire than middle or high skill workers.24
While high skill occupations attract higher wages, these workers perform tasks that are both highly complex and that require a large amount of training, rendering them less susceptible to computerisation.25 In fact, technological advances have predominantly favoured skilled workers; computers can complement skilled workers in completing tasks,26 while individuals entering newly created, high skill industries receive substantial wage premiums.27
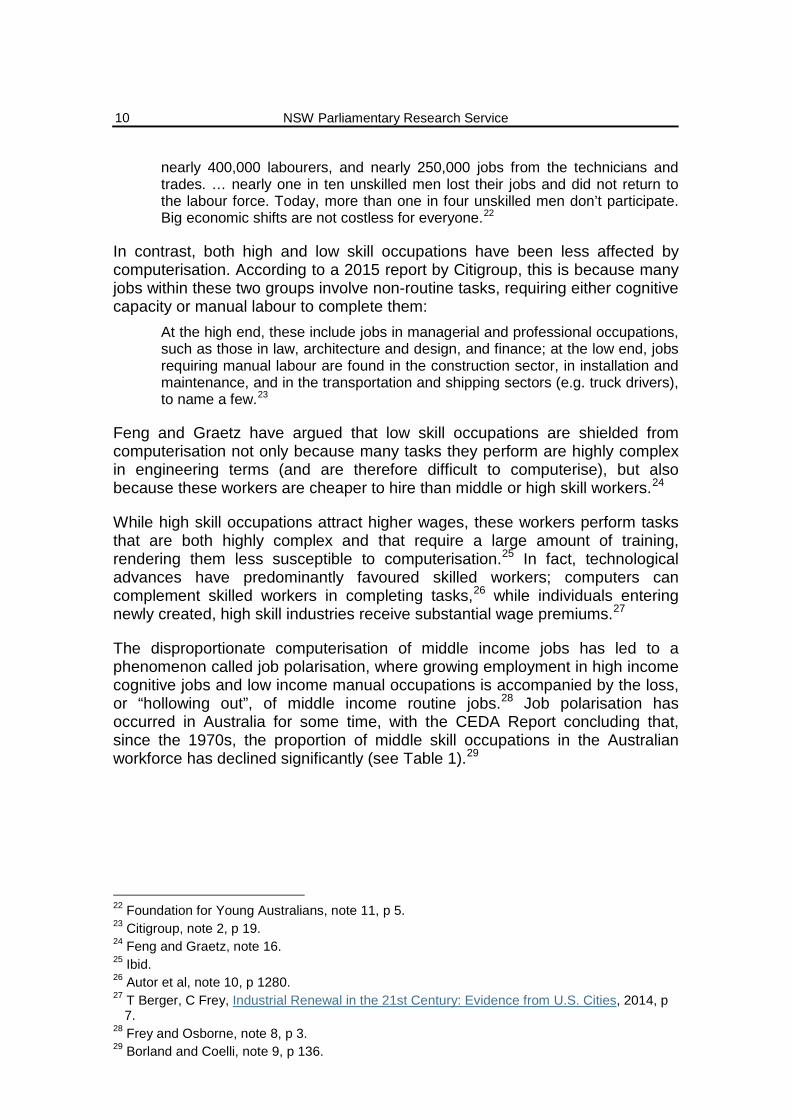
The disproportionate computerisation of middle income jobs has led to a phenomenon called job polarisation, where growing employment in high income cognitive jobs and low income manual occupations is accompanied by the loss, or “hollowing out”, of middle income routine jobs.28 Job polarisation has occurred in Australia for some time, with the CEDA Report concluding that, since the 1970s, the proportion of middle skill occupations in the Australian workforce has declined significantly (see Table 1).29
22 Foundation for Young Australians, note 11, p 5. 23 Citigroup, note 2, p 19. 24 Feng and Graetz, note 16. 25 Ibid. 26 Autor et al, note 10, p 1280. 27 T Berger, C Frey, Industrial Renewal in the 21st Century: Evidence from U.S. Cities, 2014, p
7. 28 Frey and Osborne, note 8, p 3. 29 Borland and Coelli, note 9, p 136.
Future workforce trends in NSW: Emerging technologies and their potential impact
11
Table 1: Change in employment shares by occupational skill level30
Job polarisation is also prevalent in other developed countries. In the United States for example, Autor et al commented that, due to computerisation, there has been a decline in routine cognitive and manual work and an increase in non-routine analytic and interactive work over the past few decades. According to the study, other possible reasons for the change, such as increased educational attainment, did not explain the shift away from routine work towards non-routine work.31
By reducing middle skill employment’s share of the market, job polarisation has exacerbated the wage gap between high and low income jobs. As explained by Citigroup, this is because former middle skill workers find it easier to “skill down” to find a low skill job than to “skill up” into a high skill occupation. This results in an oversupply of low income workers that in turn reduces wage increases in these occupations:
To skill up requires increased cognitive capacity, which tends to come about from education and job training – both slow moving processes. Indeed, this is why some have dubbed our era as a ‘race between technology and education.’ The former occurs rapidly and disruptively; the latter very slowly. The end result is that additional labour supply keeps wage growth relatively muted at the bottom, while its absence causes wages to accelerate quickly at the top.32
While some observers believe that computerisation will continue to polarise labour markets in the long term,33 other experts have argued that job polarisation will not continue indefinitely. This is because, although many middle skill tasks are susceptible to automation, many remaining middle skill jobs require both routine technical tasks and non-routine tasks that are not easily computerised, such as interpersonal interaction, flexibility, adaptability and problem-solving skills.34
30 Ibid p 136. 31 Autor et al, note 10, p 1281. 32 Citigroup, note 2, p 21. 33 Feng and Graetz, note 16. 34 D Autor, Polanyi’s Paradox and the Shape of Employment Growth, National Bureau of
Economic Research, NBER Working Paper No 20485, September 2014, pp 39-40.
NSW Parliamentary Research Service
12
2.2 Computerisation and its impact on NSW jobs
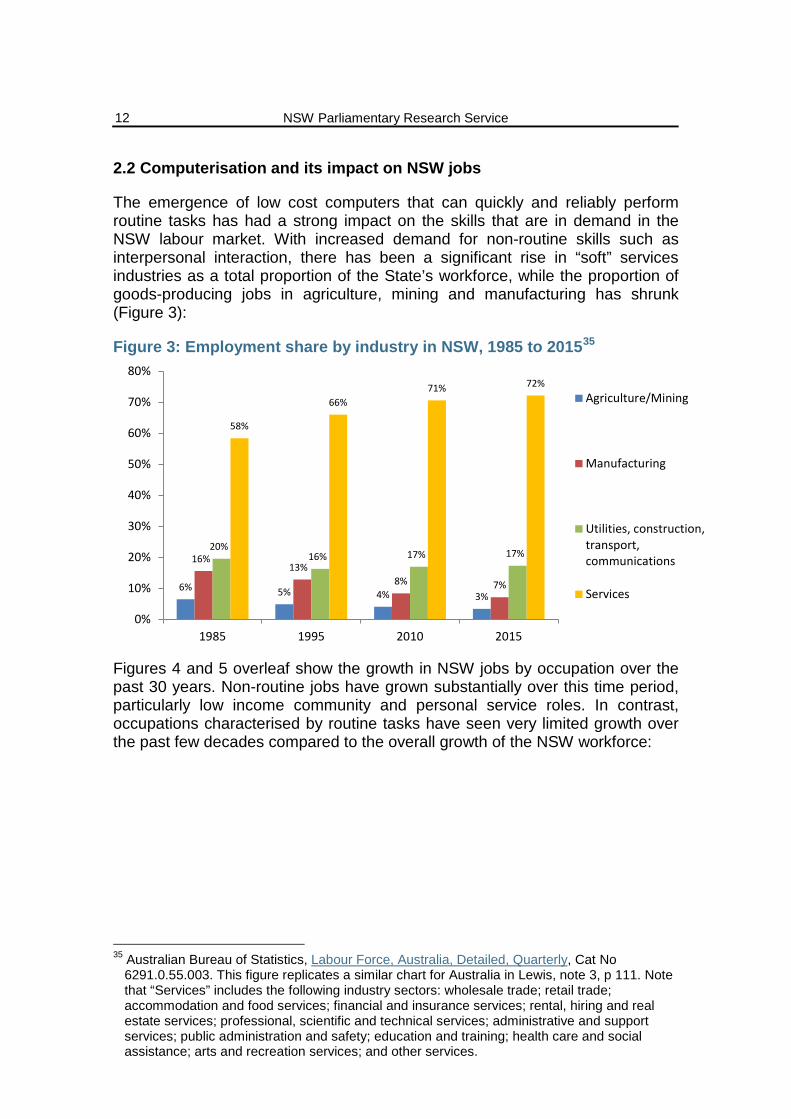
The emergence of low cost computers that can quickly and reliably perform routine tasks has had a strong impact on the skills that are in demand in the NSW labour market. With increased demand for non-routine skills such as interpersonal interaction, there has been a significant rise in “soft” services industries as a total proportion of the State’s workforce, while the proportion of goods-producing jobs in agriculture, mining and manufacturing has shrunk (Figure 3):
Figure 3: Employment share by industry in NSW, 1985 to 201535
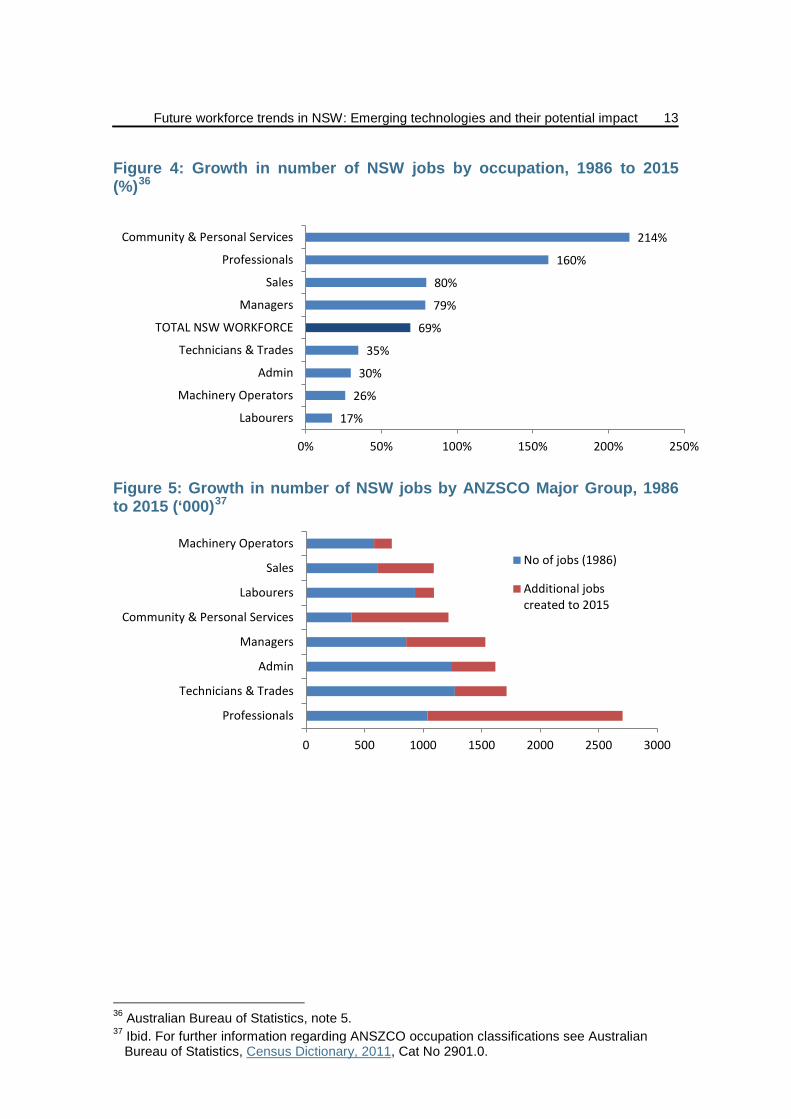
Figures 4 and 5 overleaf show the growth in NSW jobs by occupation over the past 30 years. Non-routine jobs have grown substantially over this time period, particularly low income community and personal service roles. In contrast, occupations characterised by routine tasks have seen very limited growth over the past few decades compared to the overall growth of the NSW workforce:
35 Australian Bureau of Statistics, Labour Force, Australia, Detailed, Quarterly, Cat No
6291.0.55.003. This figure replicates a similar chart for Australia in Lewis, note 3, p 111. Note that “Services” includes the following industry sectors: wholesale trade; retail trade; accommodation and food services; financial and insurance services; rental, hiring and real estate services; professional, scientific and technical services; administrative and support services; public administration and safety; education and training; health care and social assistance; arts and recreation services; and other services.
6% 5% 4% 3%
16% 13%
8% 7%
20% 16% 17% 17%
58%
66% 71% 72%
0%
10%
20%
30%
40%
50%
60%
70%
80%
1985 1995 2010 2015
Agriculture/Mining
Manufacturing
Utilities, construction,transport,communications
Services
Future workforce trends in NSW: Emerging technologies and their potential impact
13
Figure 4: Growth in number of NSW jobs by occupation, 1986 to 2015 (%)36
Figure 5: Growth in number of NSW jobs by ANZSCO Major Group, 1986 to 2015 (‘000)37
36 Australian Bureau of Statistics, note 5. 37 Ibid. For further information regarding ANSZCO occupation classifications see Australian
Bureau of Statistics, Census Dictionary, 2011, Cat No 2901.0.
17%
26%
30%
35%
69%
79%
80%
160%
214%
0% 50% 100% 150% 200% 250%
Labourers
Machinery Operators
Admin
Technicians & Trades
TOTAL NSW WORKFORCE
Managers
Sales
Professionals
Community & Personal Services
0 500 1000 1500 2000 2500 3000
Professionals
Technicians & Trades
Admin
Managers
Community & Personal Services
Labourers
Sales
Machinery OperatorsNo of jobs (1986)
Additional jobscreated to 2015
NSW Parliamentary Research Service
14
3. CHARACTERISTICS OF FUTURE WORK
Although predictions of job computerisation may appear grim, very few (if any) experts expect widespread catastrophe to ensue as a result of technological innovation. Instead, many believe that technology will bring a net benefit to the workforce, which will largely (but not entirely) adapt to change.
This chapter outlines the likely characteristics of the future workforce, including the skills likely to be of value to the labour market, key emerging technologies, and how these new technologies differ from earlier innovations.
3.1 Increasing demand for particular skills
A 2014 paper by the UK Commission for Employment and Skills summarised what it believes will be the key aspects of the UK labour market in 2030:
• Technological growth and expansion: resulting in changing skills needs across all sectors. For example, new construction technologies will require people with specialised building and maintenance skills.
• Interconnectivity and collaboration: work will become increasingly virtual and collaborative, requiring excellent people and project management skills.
• Convergence of innovation: innovative breakthroughs will result from cross-disciplinary working and the exploitation of novel materials and technologies. Businesses will increasingly seek people with hybrid skillsets, such as project management and nanotechnology.
• Increased individual responsibility for skills development. 38
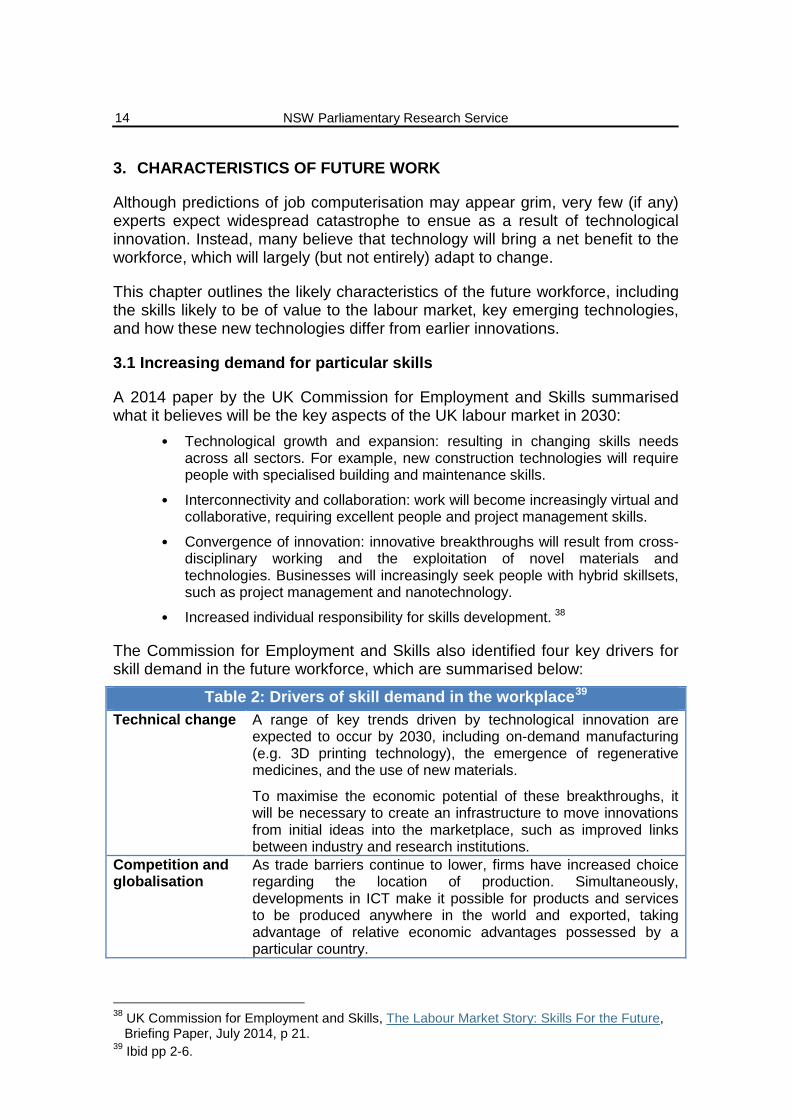
The Commission for Employment and Skills also identified four key drivers for skill demand in the future workforce, which are summarised below:
Table 2: Drivers of skill demand in the workplace39 Technical change A range of key trends driven by technological innovation are
expected to occur by 2030, including on-demand manufacturing (e.g. 3D printing technology), the emergence of regenerative medicines, and the use of new materials.
To maximise the economic potential of these breakthroughs, it will be necessary to create an infrastructure to move innovations from initial ideas into the marketplace, such as improved links between industry and research institutions.
Competition and globalisation
As trade barriers continue to lower, firms have increased choice regarding the location of production. Simultaneously, developments in ICT make it possible for products and services to be produced anywhere in the world and exported, taking advantage of relative economic advantages possessed by a particular country.
38 UK Commission for Employment and Skills, The Labour Market Story: Skills For the Future,
Briefing Paper, July 2014, p 21. 39 Ibid pp 2-6.
Future workforce trends in NSW: Emerging technologies and their potential impact
15
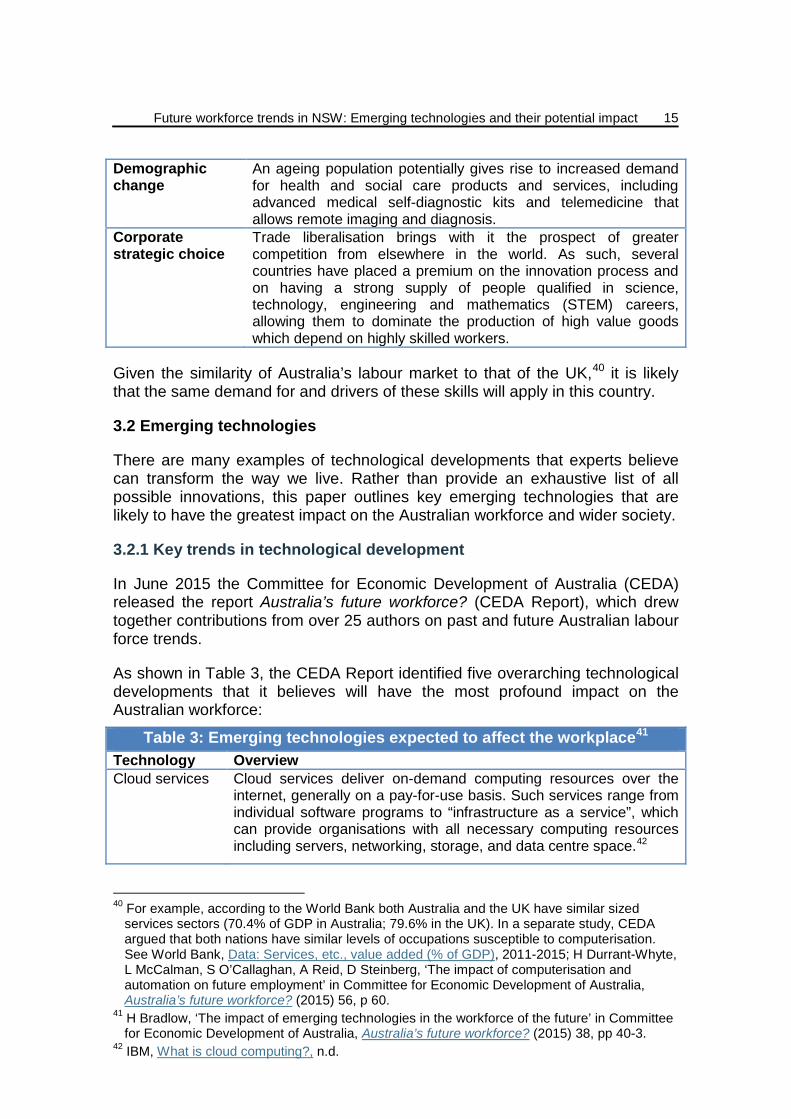
Demographic change
An ageing population potentially gives rise to increased demand for health and social care products and services, including advanced medical self-diagnostic kits and telemedicine that allows remote imaging and diagnosis.
Corporate strategic choice
Trade liberalisation brings with it the prospect of greater competition from elsewhere in the world. As such, several countries have placed a premium on the innovation process and on having a strong supply of people qualified in science, technology, engineering and mathematics (STEM) careers, allowing them to dominate the production of high value goods which depend on highly skilled workers.
Given the similarity of Australia’s labour market to that of the UK,40 it is likely that the same demand for and drivers of these skills will apply in this country.
3.2 Emerging technologies
There are many examples of technological developments that experts believe can transform the way we live. Rather than provide an exhaustive list of all possible innovations, this paper outlines key emerging technologies that are likely to have the greatest impact on the Australian workforce and wider society.
3.2.1 Key trends in technological development
In June 2015 the Committee for Economic Development of Australia (CEDA) released the report Australia’s future workforce? (CEDA Report), which drew together contributions from over 25 authors on past and future Australian labour force trends.
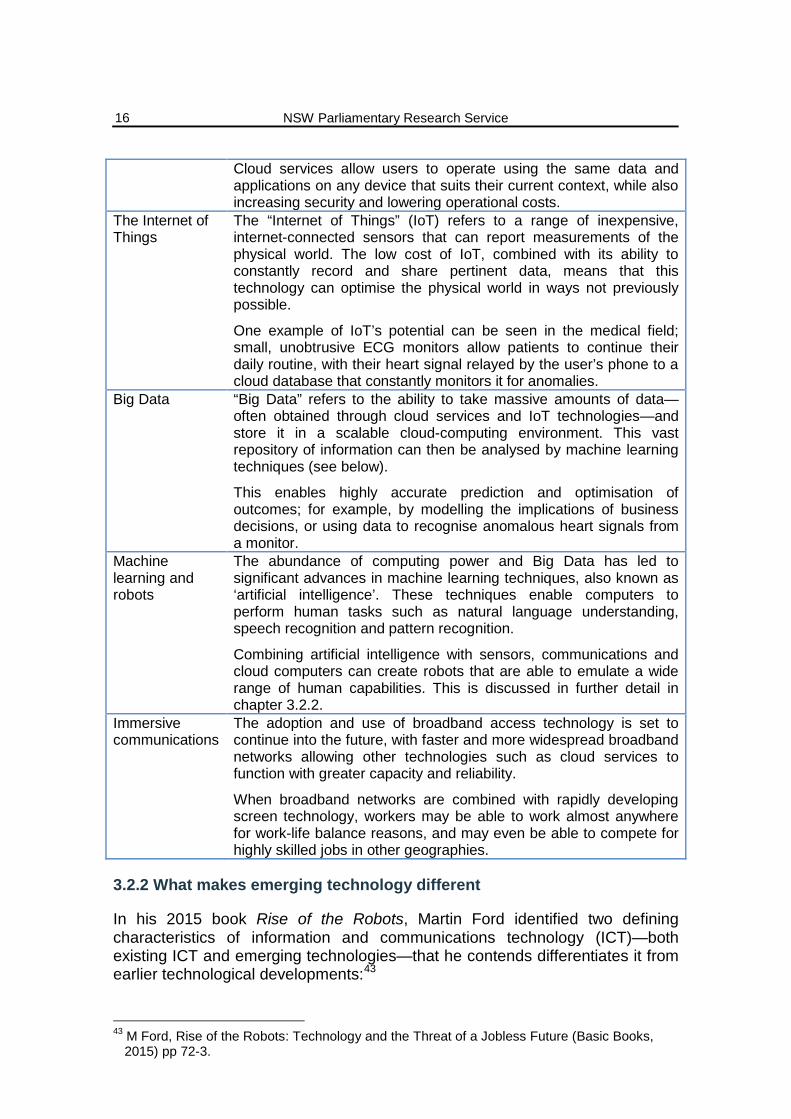
As shown in Table 3, the CEDA Report identified five overarching technological developments that it believes will have the most profound impact on the Australian workforce:
Table 3: Emerging technologies expected to affect the workplace41 Technology Overview Cloud services Cloud services deliver on-demand computing resources over the
internet, generally on a pay-for-use basis. Such services range from individual software programs to “infrastructure as a service”, which can provide organisations with all necessary computing resources including servers, networking, storage, and data centre space.42
40 For example, according to the World Bank both Australia and the UK have similar sized
services sectors (70.4% of GDP in Australia; 79.6% in the UK). In a separate study, CEDA argued that both nations have similar levels of occupations susceptible to computerisation. See World Bank, Data: Services, etc., value added (% of GDP), 2011-2015; H Durrant-Whyte, L McCalman, S O’Callaghan, A Reid, D Steinberg, ‘The impact of computerisation and automation on future employment’ in Committee for Economic Development of Australia, Australia’s future workforce? (2015) 56, p 60.
41 H Bradlow, ‘The impact of emerging technologies in the workforce of the future’ in Committee for Economic Development of Australia, Australia’s future workforce? (2015) 38, pp 40-3.
42 IBM, What is cloud computing?, n.d.
NSW Parliamentary Research Service
16
Cloud services allow users to operate using the same data and applications on any device that suits their current context, while also increasing security and lowering operational costs.
The Internet of Things
The “Internet of Things” (IoT) refers to a range of inexpensive, internet-connected sensors that can report measurements of the physical world. The low cost of IoT, combined with its ability to constantly record and share pertinent data, means that this technology can optimise the physical world in ways not previously possible.
One example of IoT’s potential can be seen in the medical field; small, unobtrusive ECG monitors allow patients to continue their daily routine, with their heart signal relayed by the user’s phone to a cloud database that constantly monitors it for anomalies.
Big Data “Big Data” refers to the ability to take massive amounts of data—often obtained through cloud services and IoT technologies—and store it in a scalable cloud-computing environment. This vast repository of information can then be analysed by machine learning techniques (see below).
This enables highly accurate prediction and optimisation of outcomes; for example, by modelling the implications of business decisions, or using data to recognise anomalous heart signals from a monitor.
Machine learning and robots
The abundance of computing power and Big Data has led to significant advances in machine learning techniques, also known as ‘artificial intelligence’. These techniques enable computers to perform human tasks such as natural language understanding, speech recognition and pattern recognition.
Combining artificial intelligence with sensors, communications and cloud computers can create robots that are able to emulate a wide range of human capabilities. This is discussed in further detail in chapter 3.2.2.
Immersive communications
The adoption and use of broadband access technology is set to continue into the future, with faster and more widespread broadband networks allowing other technologies such as cloud services to function with greater capacity and reliability.
When broadband networks are combined with rapidly developing screen technology, workers may be able to work almost anywhere for work-life balance reasons, and may even be able to compete for highly skilled jobs in other geographies.
3.2.2 What makes emerging technology different
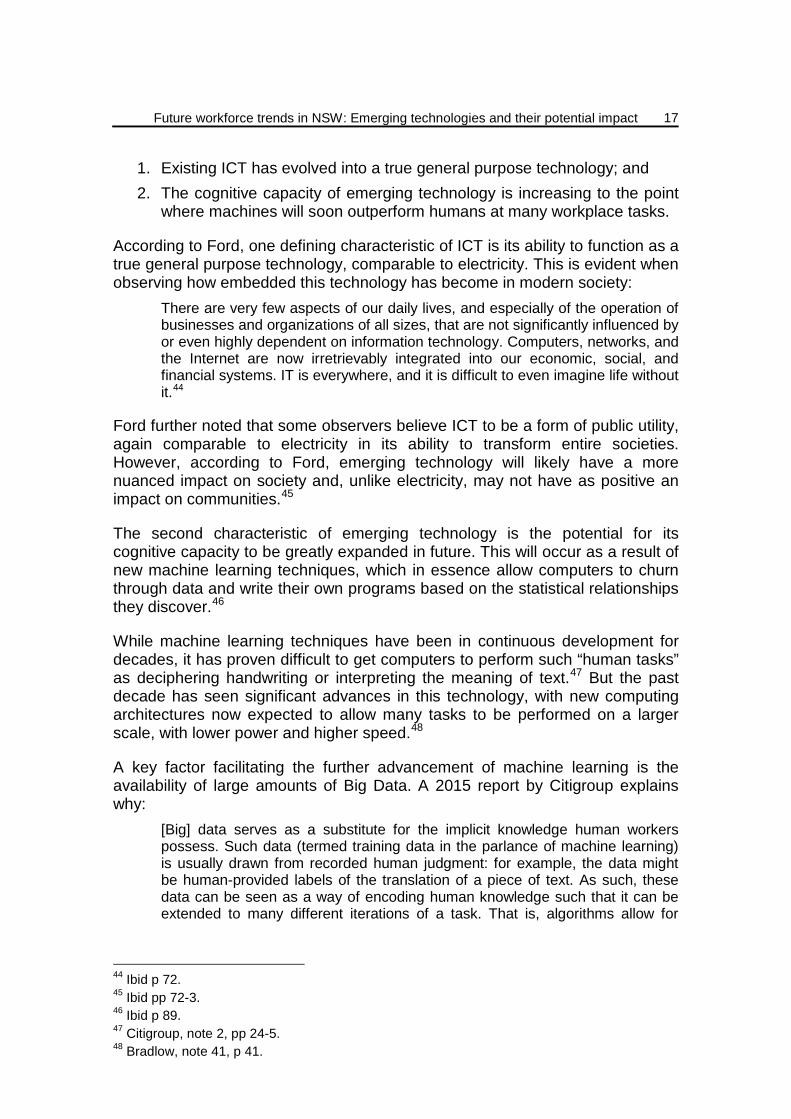
In his 2015 book Rise of the Robots, Martin Ford identified two defining characteristics of information and communications technology (ICT)—both existing ICT and emerging technologies—that he contends differentiates it from earlier technological developments:43
43 M Ford, Rise of the Robots: Technology and the Threat of a Jobless Future (Basic Books,
2015) pp 72-3.
Future workforce trends in NSW: Emerging technologies and their potential impact
17
1. Existing ICT has evolved into a true general purpose technology; and 2. The cognitive capacity of emerging technology is increasing to the point
where machines will soon outperform humans at many workplace tasks.
According to Ford, one defining characteristic of ICT is its ability to function as a true general purpose technology, comparable to electricity. This is evident when observing how embedded this technology has become in modern society:
There are very few aspects of our daily lives, and especially of the operation of businesses and organizations of all sizes, that are not significantly influenced by or even highly dependent on information technology. Computers, networks, and the Internet are now irretrievably integrated into our economic, social, and financial systems. IT is everywhere, and it is difficult to even imagine life without it.44
Ford further noted that some observers believe ICT to be a form of public utility, again comparable to electricity in its ability to transform entire societies. However, according to Ford, emerging technology will likely have a more nuanced impact on society and, unlike electricity, may not have as positive an impact on communities.45
The second characteristic of emerging technology is the potential for its cognitive capacity to be greatly expanded in future. This will occur as a result of new machine learning techniques, which in essence allow computers to churn through data and write their own programs based on the statistical relationships they discover.46
While machine learning techniques have been in continuous development for decades, it has proven difficult to get computers to perform such “human tasks” as deciphering handwriting or interpreting the meaning of text.47 But the past decade has seen significant advances in this technology, with new computing architectures now expected to allow many tasks to be performed on a larger scale, with lower power and higher speed.48
A key factor facilitating the further advancement of machine learning is the availability of large amounts of Big Data. A 2015 report by Citigroup explains why:
[Big] data serves as a substitute for the implicit knowledge human workers possess. Such data (termed training data in the parlance of machine learning) is usually drawn from recorded human judgment: for example, the data might be human-provided labels of the translation of a piece of text. As such, these data can be seen as a way of encoding human knowledge such that it can be extended to many different iterations of a task. That is, algorithms allow for
44 Ibid p 72. 45 Ibid pp 72-3. 46 Ibid p 89. 47 Citigroup, note 2, pp 24-5. 48 Bradlow, note 41, p 41.
NSW Parliamentary Research Service
18
scaling beyond the human: a single dataset of human judgments might be drawn upon to make decisions many times a second for years. As a result, computerisation is no longer confined to tasks that can be written as rule-based procedures a priori, but is spreading to any task where big data becomes available.49
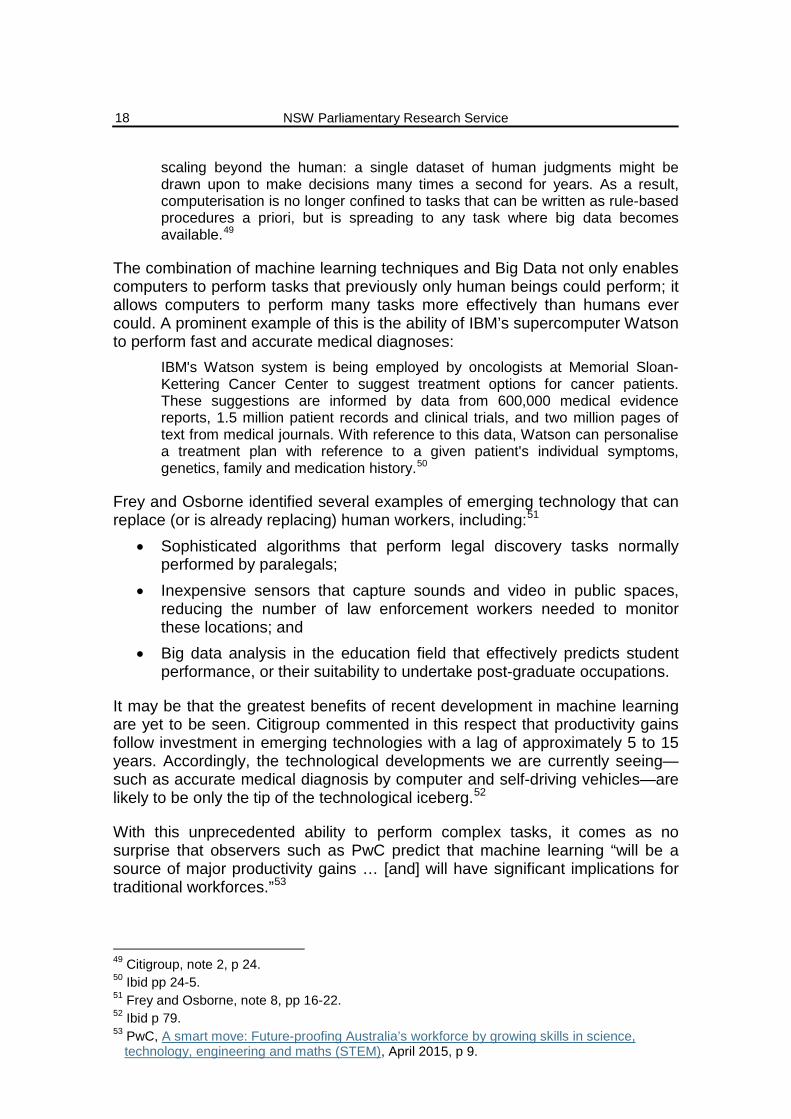
The combination of machine learning techniques and Big Data not only enables computers to perform tasks that previously only human beings could perform; it allows computers to perform many tasks more effectively than humans ever could. A prominent example of this is the ability of IBM’s supercomputer Watson to perform fast and accurate medical diagnoses:
IBM's Watson system is being employed by oncologists at Memorial Sloan-Kettering Cancer Center to suggest treatment options for cancer patients. These suggestions are informed by data from 600,000 medical evidence reports, 1.5 million patient records and clinical trials, and two million pages of text from medical journals. With reference to this data, Watson can personalise a treatment plan with reference to a given patient's individual symptoms, genetics, family and medication history.50
Frey and Osborne identified several examples of emerging technology that can replace (or is already replacing) human workers, including:51
• Sophisticated algorithms that perform legal discovery tasks normally performed by paralegals;
• Inexpensive sensors that capture sounds and video in public spaces, reducing the number of law enforcement workers needed to monitor these locations; and
• Big data analysis in the education field that effectively predicts student performance, or their suitability to undertake post-graduate occupations.
It may be that the greatest benefits of recent development in machine learning are yet to be seen. Citigroup commented in this respect that productivity gains follow investment in emerging technologies with a lag of approximately 5 to 15 years. Accordingly, the technological developments we are currently seeing—such as accurate medical diagnosis by computer and self-driving vehicles—are likely to be only the tip of the technological iceberg.52
With this unprecedented ability to perform complex tasks, it comes as no surprise that observers such as PwC predict that machine learning “will be a source of major productivity gains … [and] will have significant implications for traditional workforces.”53
49 Citigroup, note 2, p 24. 50 Ibid pp 24-5. 51 Frey and Osborne, note 8, pp 16-22. 52 Ibid p 79. 53 PwC, A smart move: Future-proofing Australia’s workforce by growing skills in science,
technology, engineering and maths (STEM), April 2015, p 9.
Future workforce trends in NSW: Emerging technologies and their potential impact
19
4. OPPORTUNITIES AND RISKS IN THE FUTURE WORKFORCE
This chapter discusses the opportunities that are predicted to emerge through technological innovation, and the risks and challenges faced by parts of the workforce as a result of emerging technology.
4.1 Future work opportunities
4.1.1 Positive trends
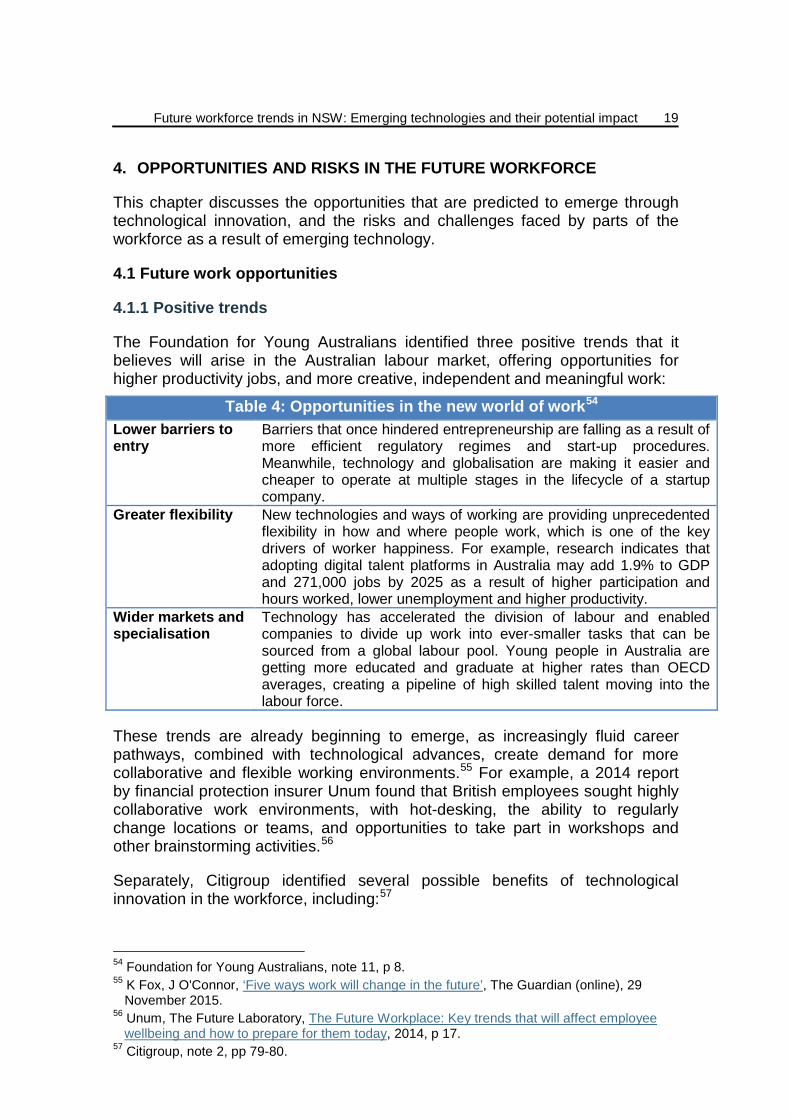
The Foundation for Young Australians identified three positive trends that it believes will arise in the Australian labour market, offering opportunities for higher productivity jobs, and more creative, independent and meaningful work:
Table 4: Opportunities in the new world of work54 Lower barriers to entry
Barriers that once hindered entrepreneurship are falling as a result of more efficient regulatory regimes and start-up procedures. Meanwhile, technology and globalisation are making it easier and cheaper to operate at multiple stages in the lifecycle of a startup company.
Greater flexibility New technologies and ways of working are providing unprecedented flexibility in how and where people work, which is one of the key drivers of worker happiness. For example, research indicates that adopting digital talent platforms in Australia may add 1.9% to GDP and 271,000 jobs by 2025 as a result of higher participation and hours worked, lower unemployment and higher productivity.
Wider markets and specialisation
Technology has accelerated the division of labour and enabled companies to divide up work into ever-smaller tasks that can be sourced from a global labour pool. Young people in Australia are getting more educated and graduate at higher rates than OECD averages, creating a pipeline of high skilled talent moving into the labour force.
These trends are already beginning to emerge, as increasingly fluid career pathways, combined with technological advances, create demand for more collaborative and flexible working environments.55 For example, a 2014 report by financial protection insurer Unum found that British employees sought highly collaborative work environments, with hot-desking, the ability to regularly change locations or teams, and opportunities to take part in workshops and other brainstorming activities.56
Separately, Citigroup identified several possible benefits of technological innovation in the workforce, including:57
54 Foundation for Young Australians, note 11, p 8. 55 K Fox, J O'Connor, ‘Five ways work will change in the future’, The Guardian (online), 29
November 2015. 56 Unum, The Future Laboratory, The Future Workplace: Key trends that will affect employee
wellbeing and how to prepare for them today, 2014, p 17. 57 Citigroup, note 2, pp 79-80.
NSW Parliamentary Research Service
20
• The potential for significant productivity gains, particularly in traditionally low productivity sectors that experience wage growth without corresponding productivity increases (e.g. healthcare and education); and
• Benefits accruing from the “sharing economy”, whereby a range of online services enable people to share goods and services, reducing supply and demand costs. Example services include Uber and Airbnb.58
Additionally, new technology can help foster what experts have labelled “innovation jobs”: highly skilled employment that makes intensive use of human capital and human ingenuity.59 Although only constituting a small proportion of the labour force,60 innovation jobs may serve as a catalyst for economic growth, with each innovation job indirectly creating up to five additional jobs outside the innovation sector.61
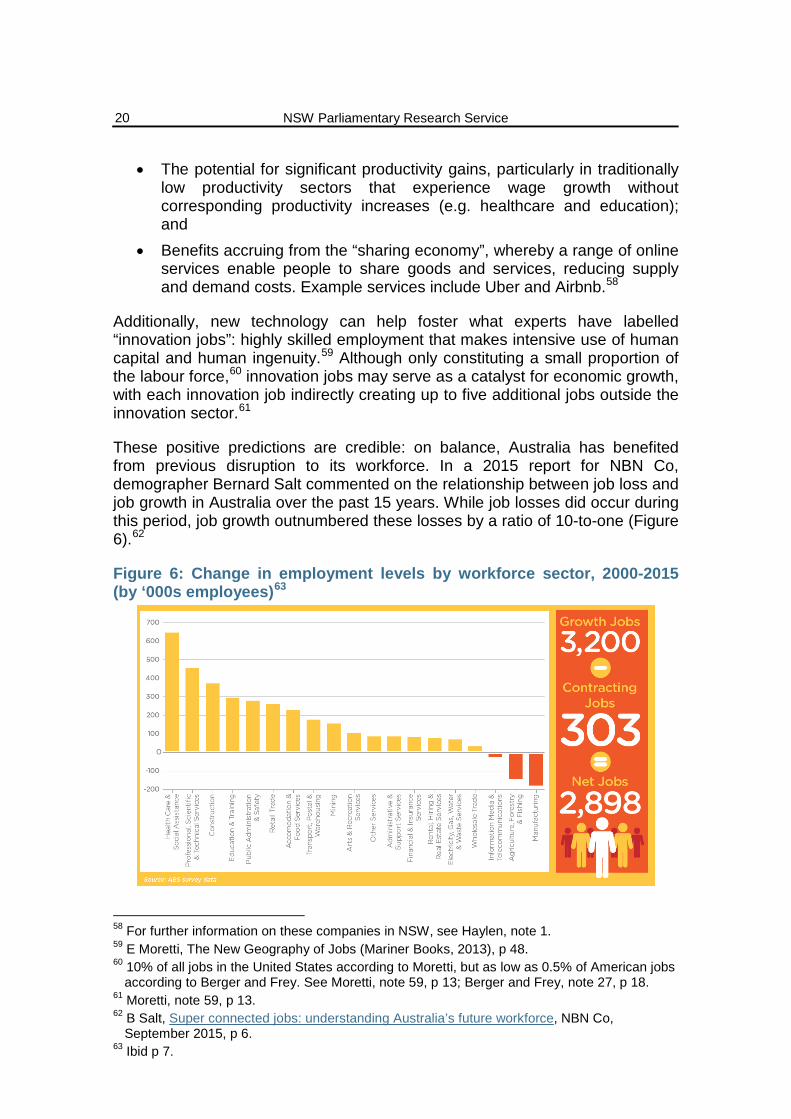
These positive predictions are credible: on balance, Australia has benefited from previous disruption to its workforce. In a 2015 report for NBN Co, demographer Bernard Salt commented on the relationship between job loss and job growth in Australia over the past 15 years. While job losses did occur during this period, job growth outnumbered these losses by a ratio of 10-to-one (Figure 6).62
Figure 6: Change in employment levels by workforce sector, 2000-2015 (by ‘000s employees)63
58 For further information on these companies in NSW, see Haylen, note 1. 59 E Moretti, The New Geography of Jobs (Mariner Books, 2013), p 48. 60 10% of all jobs in the United States according to Moretti, but as low as 0.5% of American jobs
according to Berger and Frey. See Moretti, note 59, p 13; Berger and Frey, note 27, p 18. 61 Moretti, note 59, p 13. 62 B Salt, Super connected jobs: understanding Australia’s future workforce, NBN Co,
September 2015, p 6. 63 Ibid p 7.
Future workforce trends in NSW: Emerging technologies and their potential impact
21
4.1.2 The “winners” of the future workforce
Salt has argued that, as the Australian economy continues to shift away from manufacturing and agriculture to services, there will be increased demand for “knowledge workers” such as professionals, managers, engineers, computer programmers, law graduates, and scientists.64 This view is shared by PwC, which commented that technology and innovation are key to solving both workforce and growth challenges:
Modelling shows that the jobs most likely to endure over the next couple of decades are ones that require high levels of social intelligence, technical ability and creative intelligence. This includes doctors and nurses, teachers, engineers, and information communication and technology (ICT) professionals, and managers.65
Ultimately though, technological development has historically benefited, and will continue to benefit, skilled workers. As noted by Berger and Frey, this is because skilled workers are better at adapting to technological change than their lower skilled counterparts:
[Skilled workers] are better at implementing new ideas, adopt new technologies faster, and are more likely to reallocate to the firms with the most promising innovations. Furthermore, consistent with the evidence presented above, showing that educated workers are more likely to shift into new industries, skilled workers are also more frequently observed in new types of occupations.66 [references omitted]
4.2 Emerging risks in the future workforce
4.2.1 Risks and challenges of future work
Even if the benefits of technology outweigh its drawbacks, negative consequences can still affect individuals and communities. One illustrative example arises from the increasing use of mobile devices for work purposes. As explained by the University of South Australia’s Centre for Work + Life, while increased use of mobile email devices has benefited professional workers by allowing them to work “anywhere, anytime”:
… it also created undesirable consequences by contributing to shared expectations (a collective norm) of being constantly available and responsive, with participants feeling a compulsion to remain continually connected to incoming emails on their device.67
According to The Future Workplace report, being “always on” for work purposes significantly increases stress levels and the likelihood that they will leave their
64 Ibid p 6. 65 PwC, note 53, p 12. 66 Berger and Frey, note 27, p 10. 67 B Pocock, N Skinner, Morning, noon and night: The infiltration of work email into personal and
family life, Centre for Work+ Life, University of South Australia, May 2013, p 3.
NSW Parliamentary Research Service
22
job, which could cost British businesses up to £101 billion.68
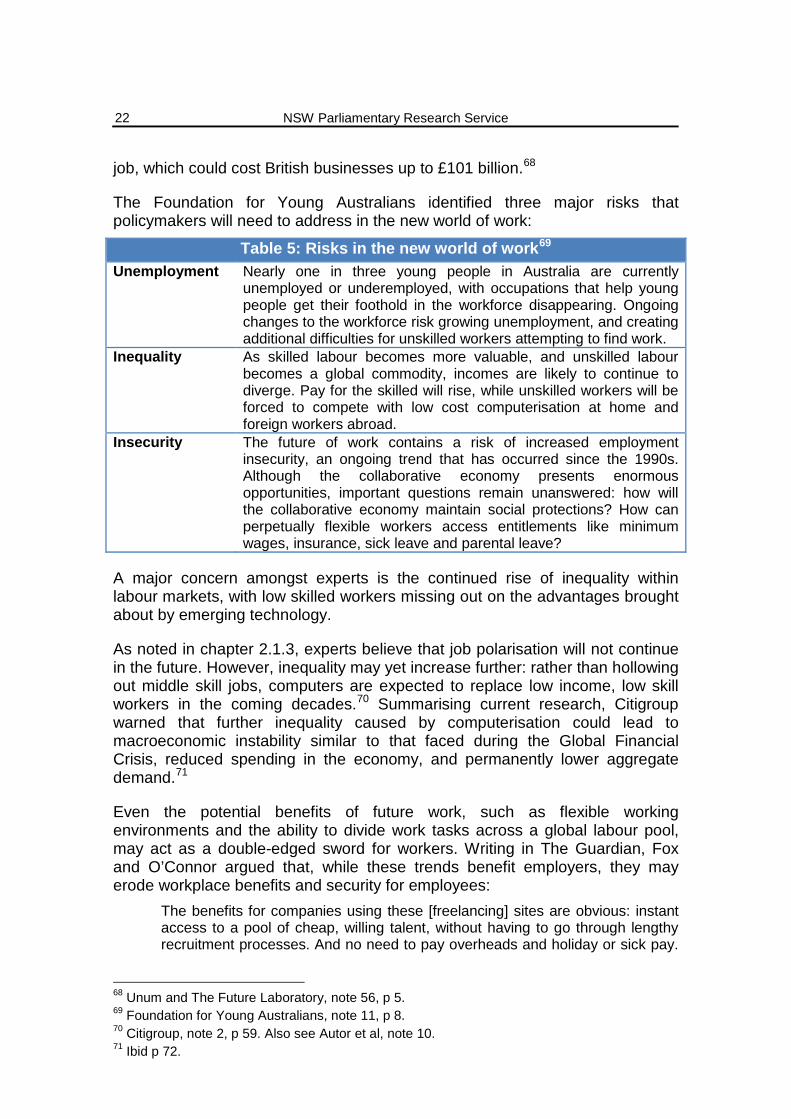
The Foundation for Young Australians identified three major risks that policymakers will need to address in the new world of work:
Table 5: Risks in the new world of work69 Unemployment Nearly one in three young people in Australia are currently
unemployed or underemployed, with occupations that help young people get their foothold in the workforce disappearing. Ongoing changes to the workforce risk growing unemployment, and creating additional difficulties for unskilled workers attempting to find work.
Inequality As skilled labour becomes more valuable, and unskilled labour becomes a global commodity, incomes are likely to continue to diverge. Pay for the skilled will rise, while unskilled workers will be forced to compete with low cost computerisation at home and foreign workers abroad.
Insecurity The future of work contains a risk of increased employment insecurity, an ongoing trend that has occurred since the 1990s. Although the collaborative economy presents enormous opportunities, important questions remain unanswered: how will the collaborative economy maintain social protections? How can perpetually flexible workers access entitlements like minimum wages, insurance, sick leave and parental leave?
A major concern amongst experts is the continued rise of inequality within labour markets, with low skilled workers missing out on the advantages brought about by emerging technology.
As noted in chapter 2.1.3, experts believe that job polarisation will not continue in the future. However, inequality may yet increase further: rather than hollowing out middle skill jobs, computers are expected to replace low income, low skill workers in the coming decades.70 Summarising current research, Citigroup warned that further inequality caused by computerisation could lead to macroeconomic instability similar to that faced during the Global Financial Crisis, reduced spending in the economy, and permanently lower aggregate demand.71
Even the potential benefits of future work, such as flexible working environments and the ability to divide work tasks across a global labour pool, may act as a double-edged sword for workers. Writing in The Guardian, Fox and O’Connor argued that, while these trends benefit employers, they may erode workplace benefits and security for employees:
The benefits for companies using these [freelancing] sites are obvious: instant access to a pool of cheap, willing talent, without having to go through lengthy recruitment processes. And no need to pay overheads and holiday or sick pay.
68 Unum and The Future Laboratory, note 56, p 5. 69 Foundation for Young Australians, note 11, p 8. 70 Citigroup, note 2, p 59. Also see Autor et al, note 10. 71 Ibid p 72.
Future workforce trends in NSW: Emerging technologies and their potential impact
23
… By inviting people to bid for work, sites such as Upwork inevitably trigger a “race to the bottom”, with workers in Mumbai or Manila able to undercut their peers in Geneva or London thanks to their lower living costs.72
4.2.2 The “losers” in the new world of work
As discussed in chapter 2.1.3, middle skill occupations characterised by routine tasks have borne the brunt of computerisation over the past 30 to 40 years. Male blue collar workers in industries such as manufacturing and utilities have faced the greatest difficulty remaining in, or returning to, work. The CEDA Report explained some of the challenges that these workers face when attempting to re-enter the labour force:
To become employed again, many of the people need to become skilled in other jobs. Until these people are retrained they are unemployed. Others have been unable to find alternative work, particularly older men, since the skills in new jobs that have been created, mainly in the service sector, do not match theirs. Economists consider these people structurally unemployed. There is a persistent mismatch between the job skills or attributes of workers and the requirements of jobs. Structural unemployment can last for long periods because workers need time to learn new skills and some may never acquire these. Some workers lack even basic skills, such as literacy or people skills, making it difficult for them to adequately perform the duties of almost any job available.73
In future, a growing number of workers in non-routine occupations may also face similar issues due to new machine learning techniques and other technological advances. Assessing the US labour market, Citigroup reported that the majority of service occupations, where most US job growth has occurred over the past decades, are now at risk of computerisation. In particular, “[as] machines get better at performing tasks involving mobility and dexterity, the pace of displacement in service occupations is likely to increase even further.”74
Should these predictions come to fruition, the challenges faced by blue collar workers in manufacturing and the utilities sector may soon be faced by workers in services industries such as accommodation and food services or retail trade.75 Given the significant number of people employed in the services industry, the number of workers that may miss out on the benefits of emerging technology, or even struggle to remain in the workforce, could be enormous.
72 Fox and O’Connor, note 55. 73 Lewis, note 3, p 123. 74 Citigroup, note 2, p 59. 75 Ibid p 60.
NSW Parliamentary Research Service
24
5. PREDICTED FUTURE IMPACTS OF COMPUTERISATION
5.1 The limitations to prediction
Danish physicist and Nobel laureate Niels Bohr was once attributed as saying “prediction is very difficult, especially if it's about the future”.
If accurate predictions are hard to make, there remains a clear need for policymakers to consider possible and potential futures based on a range of factors, from demographic trends to changes in lifestyles and technologies. This is as true of the potential developments in the world of work as of other areas of life, where it is necessary for policymakers to craft long term plans to assist the community to transition to new work and social environments. There are sure to be missteps and wrong turns, but that does not obviate the value of thinking creatively about possible future scenarios based on known trends and foreseeable observations.
One example of this mode of thinking is found in Hajkowicz’s 2015 book Global Megatrends. There, the author shares his vision of the retail sector in 2040:
So what might a shop look like in 2040? If we sign up to the bricks and clicks models of retail – which seems to be the most successful – physical shops will still exist. But they will be very different. The customer has no need to visit a shop so they’re not going to be there unless that shop delivers on the all-important experience factor. The shop will become a place primarily to interact with trained and knowledgeable people who can help a customer navigate their way through the many options and buy a product that meets their budget and needs. Shops will become places where people can experience the product they’re contemplating buying and what it means for their lifestyle. When a customer does make a purchase, a background supply chain will be triggered and the lawnmower, tweed jacket or binoculars will be waiting on their doorstep before they get home. Probably the main reason to visit a shop is to interact with a human being to learn and experience the product before making a purchase.76
We can view Hajkowicz’s prediction as a possible scenario based on current trends such as the widespread use of self-checkouts77 and the creation of concept stores in the US that use robots and other new technology.78
5.2 Computerisation’s predicted impact on global workforces
As discussed in chapter 3.2, the computerisation of jobs has until recently been limited to routine tasks. This is no longer the case, as ongoing advances in machine learning and the accumulation of more and more pertinent data mean
76 S Hajkowicz, Global megatrends: Seven patterns of change shaping our future (CSIRO
Publishing, 2015), pp 112-13. 77 E Wynne, Self-service checkouts risking consumer loyalty: marketing expert, ABC News
(online), 22 July 2015. 78 P Wahba, Target wants to turn Minneapolis into a mini Silicon Valley, Fortune (online), 20
September 2015.
Future workforce trends in NSW: Emerging technologies and their potential impact
25
that many non-routine tasks increasingly face the possibility of computerisation.79
5.2.1 The Frey and Osborne study
An influential 2013 paper by Oxford University academics Frey and Osborne estimated the probability of computerisation of occupations in the United States. Their paper serves as the basis for a number of later studies in this area of research, including those in Australia. Chapter 6 of this paper applies their work to NSW and its electorates.
Autor et al explain the shift to services-dominated economies by reference to the computerisation of routine tasks (see chapter 2.1). Frey and Osborne argue that this model does not apply to the potential impacts of computerisation on 21st century employment because new machine learning techniques enable computers to rapidly substitute for labour across a wide range of non-routine tasks, both cognitive and manual.80 Instead of the job polarisation that has characterised previous shifts in the composition of employment, the authors predict that the following will occur:
Rather than reducing the demand for middle-income occupations, which has been the pattern over the past decades, our model predicts that computerisation will mainly substitute for low-skill and low-wage jobs in the near future. By contrast, high-skill and high-wage occupations are the least susceptible to computer capital.81
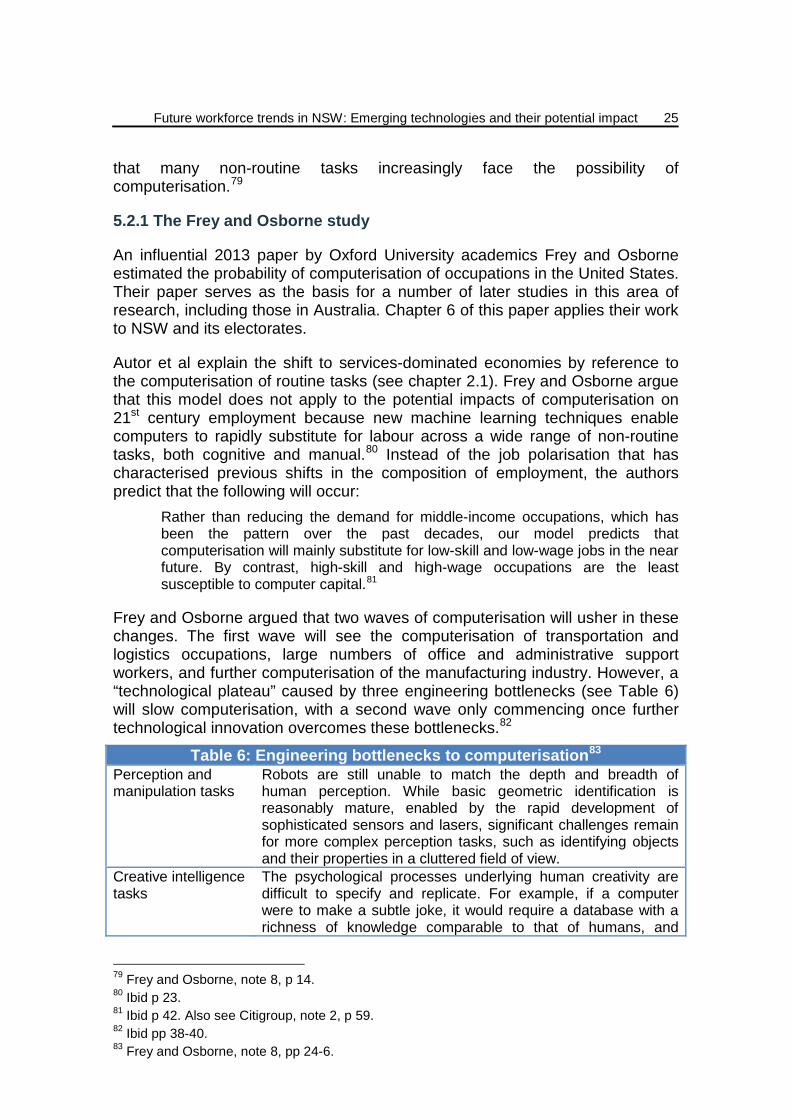
Frey and Osborne argued that two waves of computerisation will usher in these changes. The first wave will see the computerisation of transportation and logistics occupations, large numbers of office and administrative support workers, and further computerisation of the manufacturing industry. However, a “technological plateau” caused by three engineering bottlenecks (see Table 6) will slow computerisation, with a second wave only commencing once further technological innovation overcomes these bottlenecks.82
Table 6: Engineering bottlenecks to computerisation83 Perception and manipulation tasks
Robots are still unable to match the depth and breadth of human perception. While basic geometric identification is reasonably mature, enabled by the rapid development of sophisticated sensors and lasers, significant challenges remain for more complex perception tasks, such as identifying objects and their properties in a cluttered field of view.
Creative intelligence tasks
The psychological processes underlying human creativity are difficult to specify and replicate. For example, if a computer were to make a subtle joke, it would require a database with a richness of knowledge comparable to that of humans, and
79 Frey and Osborne, note 8, p 14. 80 Ibid p 23. 81 Ibid p 42. Also see Citigroup, note 2, p 59. 82 Ibid pp 38-40. 83 Frey and Osborne, note 8, pp 24-6.
NSW Parliamentary Research Service
26
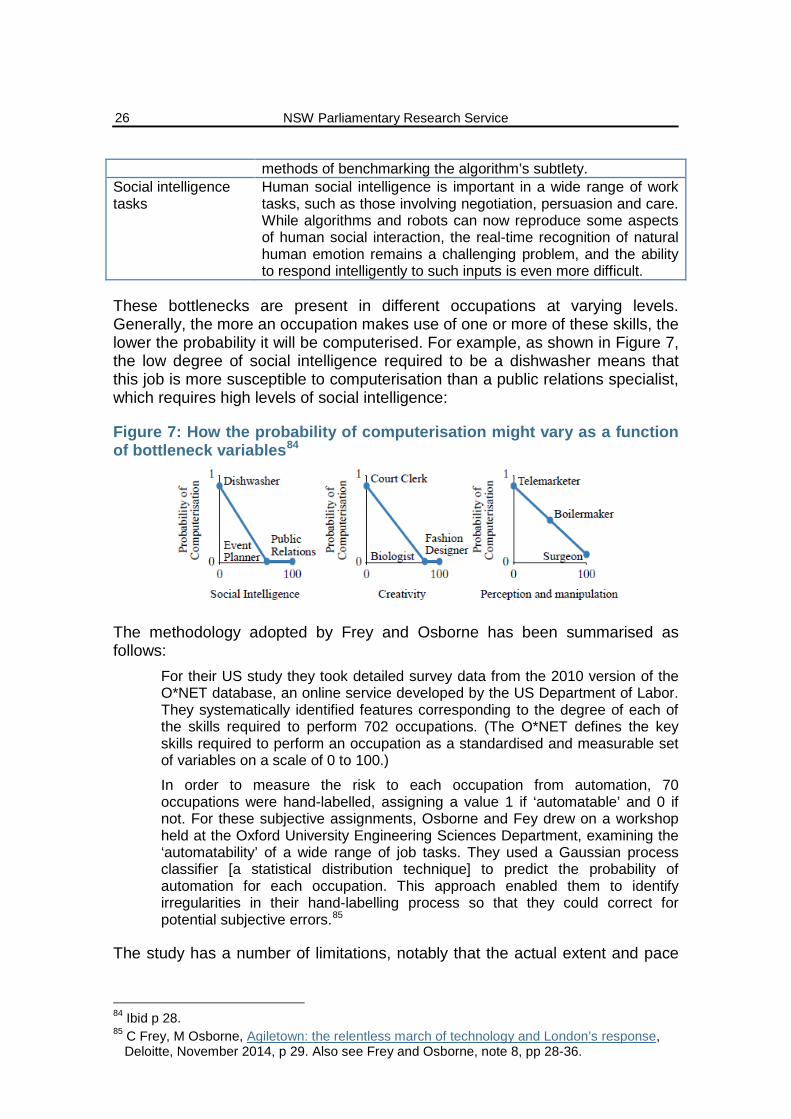
methods of benchmarking the algorithm’s subtlety. Social intelligence tasks
Human social intelligence is important in a wide range of work tasks, such as those involving negotiation, persuasion and care. While algorithms and robots can now reproduce some aspects of human social interaction, the real-time recognition of natural human emotion remains a challenging problem, and the ability to respond intelligently to such inputs is even more difficult.
These bottlenecks are present in different occupations at varying levels. Generally, the more an occupation makes use of one or more of these skills, the lower the probability it will be computerised. For example, as shown in Figure 7, the low degree of social intelligence required to be a dishwasher means that this job is more susceptible to computerisation than a public relations specialist, which requires high levels of social intelligence:
Figure 7: How the probability of computerisation might vary as a function of bottleneck variables84
The methodology adopted by Frey and Osborne has been summarised as follows:
For their US study they took detailed survey data from the 2010 version of the O*NET database, an online service developed by the US Department of Labor. They systematically identified features corresponding to the degree of each of the skills required to perform 702 occupations. (The O*NET defines the key skills required to perform an occupation as a standardised and measurable set of variables on a scale of 0 to 100.)
In order to measure the risk to each occupation from automation, 70 occupations were hand-labelled, assigning a value 1 if ‘automatable’ and 0 if not. For these subjective assignments, Osborne and Fey drew on a workshop held at the Oxford University Engineering Sciences Department, examining the ‘automatability’ of a wide range of job tasks. They used a Gaussian process classifier [a statistical distribution technique] to predict the probability of automation for each occupation. This approach enabled them to identify irregularities in their hand-labelling process so that they could correct for potential subjective errors.85
The study has a number of limitations, notably that the actual extent and pace
84 Ibid p 28. 85 C Frey, M Osborne, Agiletown: the relentless march of technology and London’s response,
Deloitte, November 2014, p 29. Also see Frey and Osborne, note 8, pp 28-36.
Future workforce trends in NSW: Emerging technologies and their potential impact
27
of computerisation will depend on several additional factors that were not taken into account in the study. These include:86
• Future wage levels, capital prices or labour shortages; • The impact of regulatory concerns and political activism; and • Uncertainty over how long it will take to overcome existing engineering
bottlenecks.
5.2.2 Research findings into the impact of computerisation
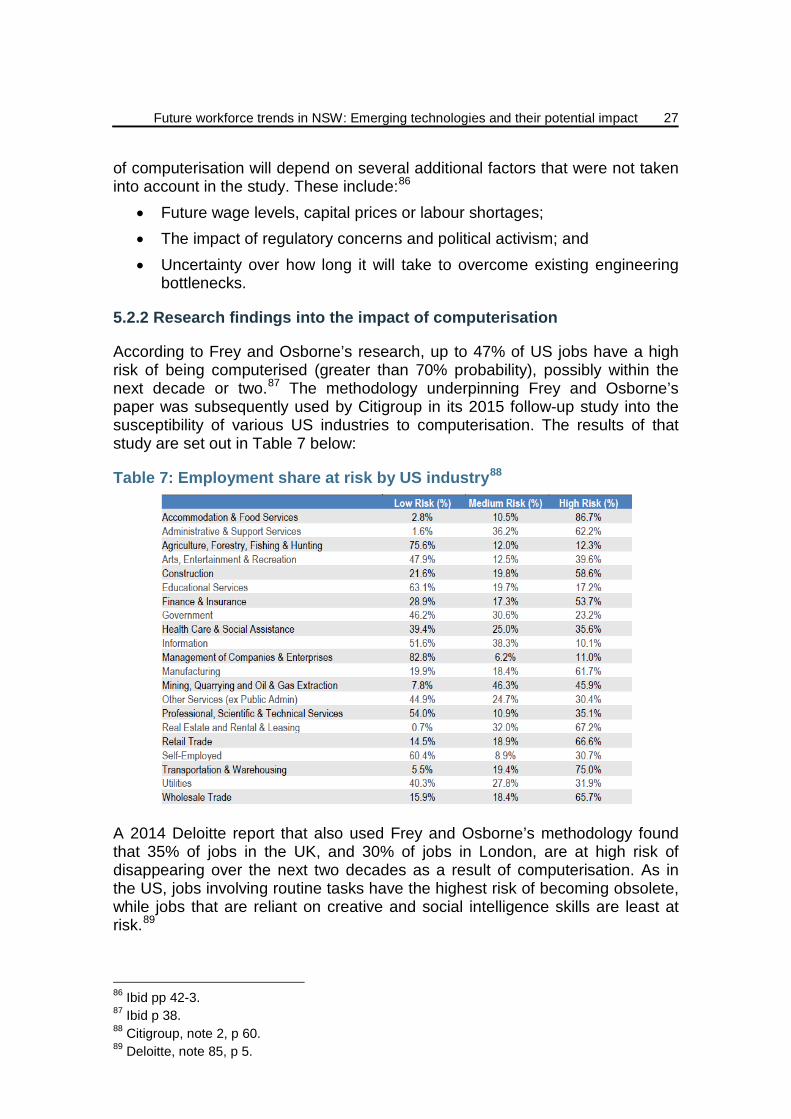
According to Frey and Osborne’s research, up to 47% of US jobs have a high risk of being computerised (greater than 70% probability), possibly within the next decade or two.87 The methodology underpinning Frey and Osborne’s paper was subsequently used by Citigroup in its 2015 follow-up study into the susceptibility of various US industries to computerisation. The results of that study are set out in Table 7 below:
Table 7: Employment share at risk by US industry88
A 2014 Deloitte report that also used Frey and Osborne’s methodology found that 35% of jobs in the UK, and 30% of jobs in London, are at high risk of disappearing over the next two decades as a result of computerisation. As in the US, jobs involving routine tasks have the highest risk of becoming obsolete, while jobs that are reliant on creative and social intelligence skills are least at risk.89
86 Ibid pp 42-3. 87 Ibid p 38. 88 Citigroup, note 2, p 60. 89 Deloitte, note 85, p 5.
NSW Parliamentary Research Service
28
Other studies highlight the fact that computerisation is a worldwide phenomenon. A 2010 discussion paper by the Centre for Economic Performance reported that OECD countries with a high uptake of information and communication technologies (ICT) experienced the fastest growth in demand for the most educated workers. In contrast, the paper also found that the fastest falls in demand were for workers with intermediate levels of education that performed largely routine tasks, such as bank clerks and paralegals.90
5.3 Computerisation’s predicted impact on the Australian workforce
Using Frey and Osborne’s methodology as a base for further research, several Australian studies arrived at findings, consistent to those from overseas, as to the predicted impact of computerisation on the number and types of jobs at risk.
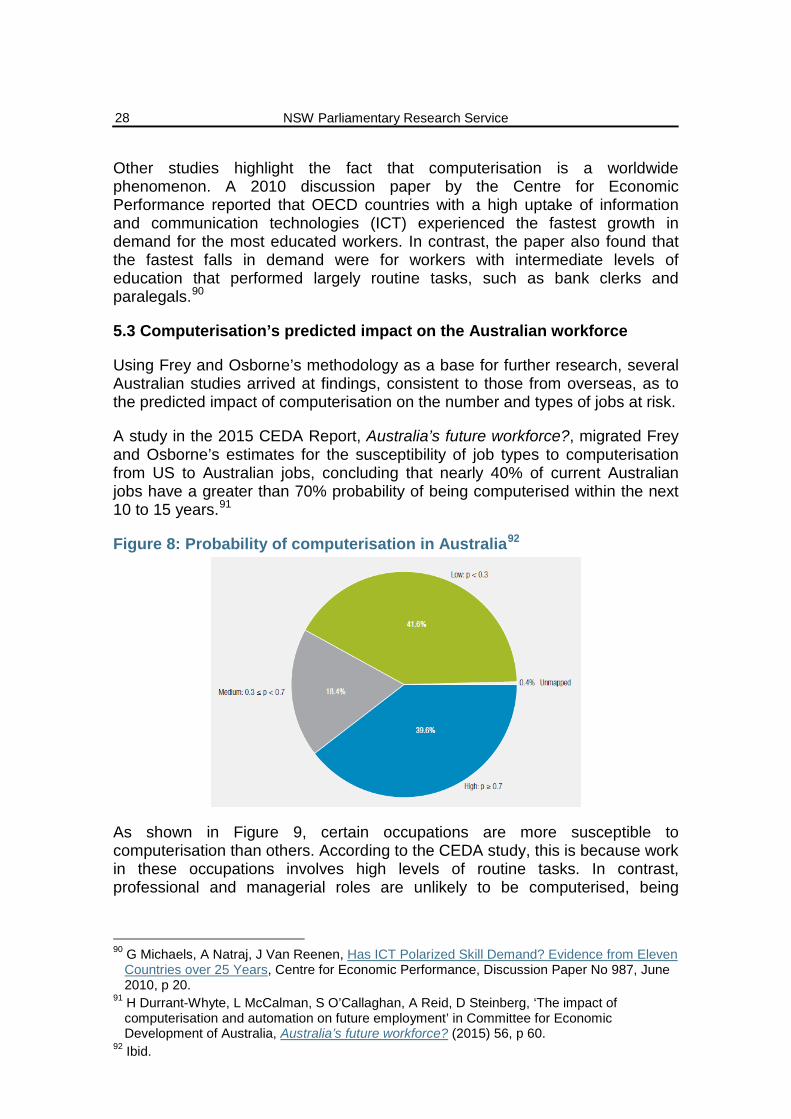
A study in the 2015 CEDA Report, Australia’s future workforce?, migrated Frey and Osborne’s estimates for the susceptibility of job types to computerisation from US to Australian jobs, concluding that nearly 40% of current Australian jobs have a greater than 70% probability of being computerised within the next 10 to 15 years.91
Figure 8: Probability of computerisation in Australia92
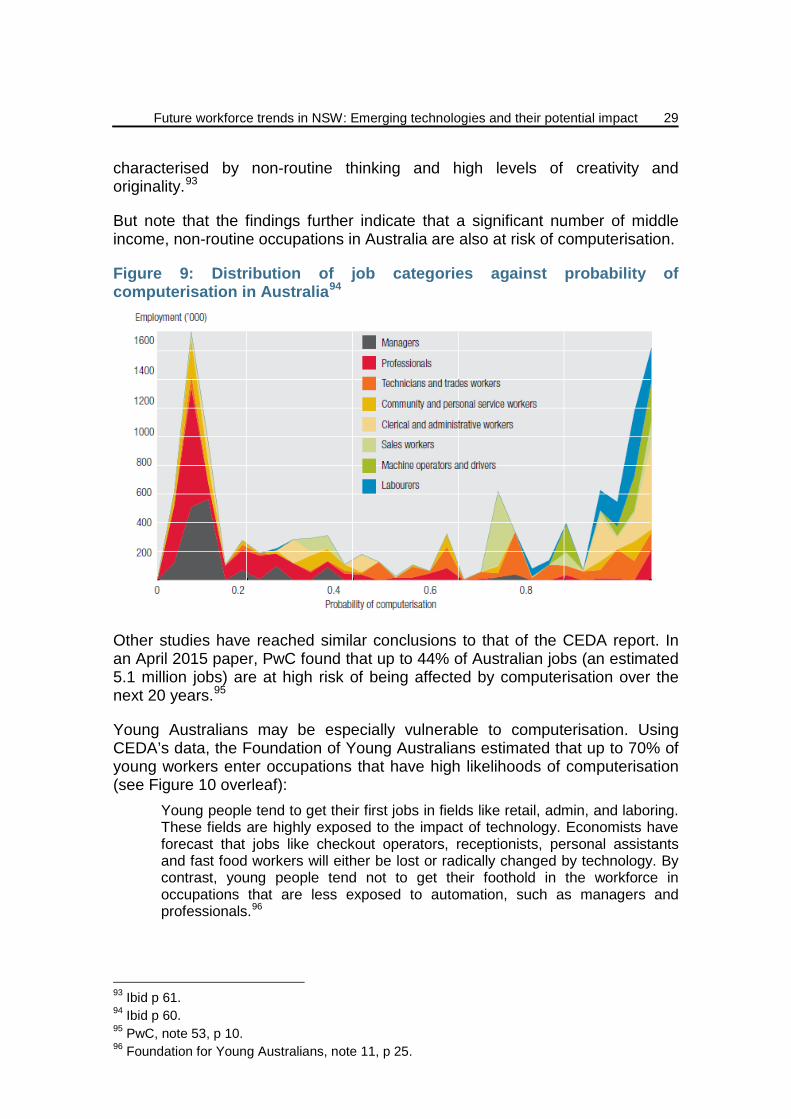
As shown in Figure 9, certain occupations are more susceptible to computerisation than others. According to the CEDA study, this is because work in these occupations involves high levels of routine tasks. In contrast, professional and managerial roles are unlikely to be computerised, being
90 G Michaels, A Natraj, J Van Reenen, Has ICT Polarized Skill Demand? Evidence from Eleven
Countries over 25 Years, Centre for Economic Performance, Discussion Paper No 987, June 2010, p 20.
91 H Durrant-Whyte, L McCalman, S O’Callaghan, A Reid, D Steinberg, ‘The impact of computerisation and automation on future employment’ in Committee for Economic Development of Australia, Australia’s future workforce? (2015) 56, p 60.
92 Ibid.
Future workforce trends in NSW: Emerging technologies and their potential impact
29
characterised by non-routine thinking and high levels of creativity and originality.93
But note that the findings further indicate that a significant number of middle income, non-routine occupations in Australia are also at risk of computerisation.
Figure 9: Distribution of job categories against probability of computerisation in Australia94
Other studies have reached similar conclusions to that of the CEDA report. In an April 2015 paper, PwC found that up to 44% of Australian jobs (an estimated 5.1 million jobs) are at high risk of being affected by computerisation over the next 20 years.95
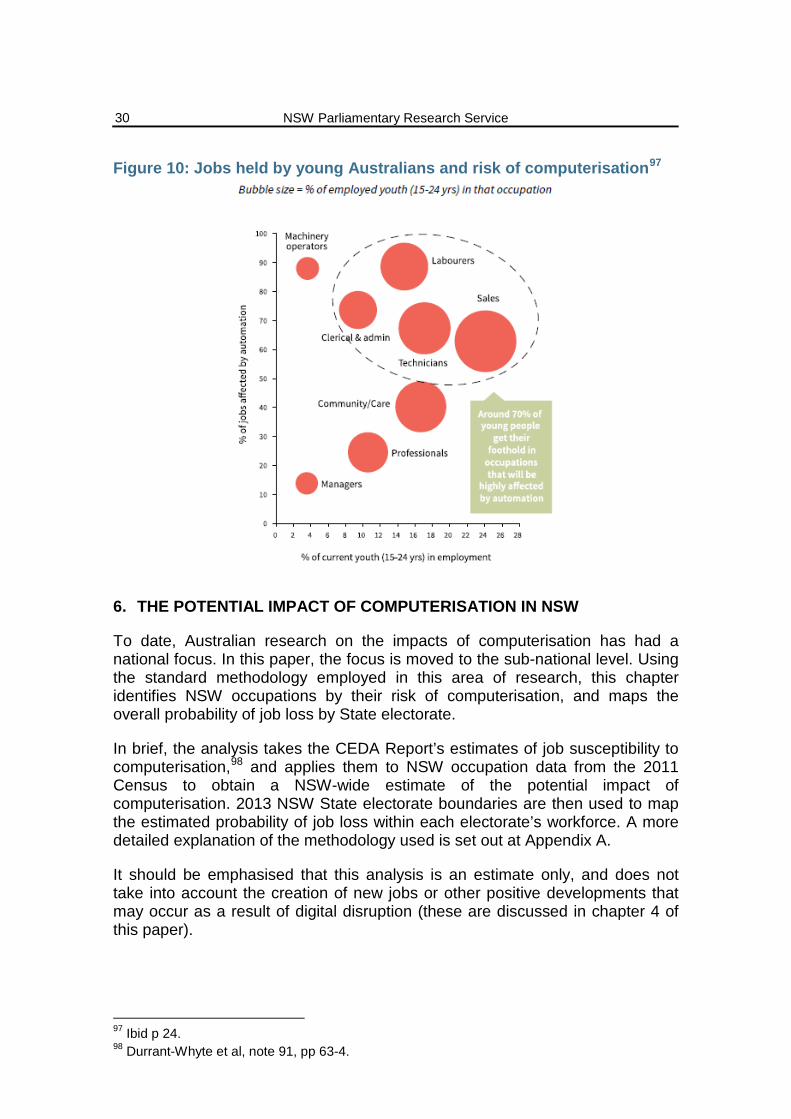
Young Australians may be especially vulnerable to computerisation. Using CEDA’s data, the Foundation of Young Australians estimated that up to 70% of young workers enter occupations that have high likelihoods of computerisation (see Figure 10 overleaf):
Young people tend to get their first jobs in fields like retail, admin, and laboring. These fields are highly exposed to the impact of technology. Economists have forecast that jobs like checkout operators, receptionists, personal assistants and fast food workers will either be lost or radically changed by technology. By contrast, young people tend not to get their foothold in the workforce in occupations that are less exposed to automation, such as managers and professionals.96
93 Ibid p 61. 94 Ibid p 60. 95 PwC, note 53, p 10. 96 Foundation for Young Australians, note 11, p 25.
NSW Parliamentary Research Service
30
Figure 10: Jobs held by young Australians and risk of computerisation97
6. THE POTENTIAL IMPACT OF COMPUTERISATION IN NSW
To date, Australian research on the impacts of computerisation has had a national focus. In this paper, the focus is moved to the sub-national level. Using the standard methodology employed in this area of research, this chapter identifies NSW occupations by their risk of computerisation, and maps the overall probability of job loss by State electorate.
In brief, the analysis takes the CEDA Report’s estimates of job susceptibility to computerisation,98 and applies them to NSW occupation data from the 2011 Census to obtain a NSW-wide estimate of the potential impact of computerisation. 2013 NSW State electorate boundaries are then used to map the estimated probability of job loss within each electorate’s workforce. A more detailed explanation of the methodology used is set out at Appendix A.
It should be emphasised that this analysis is an estimate only, and does not take into account the creation of new jobs or other positive developments that may occur as a result of digital disruption (these are discussed in chapter 4 of this paper).
97 Ibid p 24. 98 Durrant-Whyte et al, note 91, pp 63-4.
Future workforce trends in NSW: Emerging technologies and their potential impact
31
6.1 Computerisation of jobs in NSW
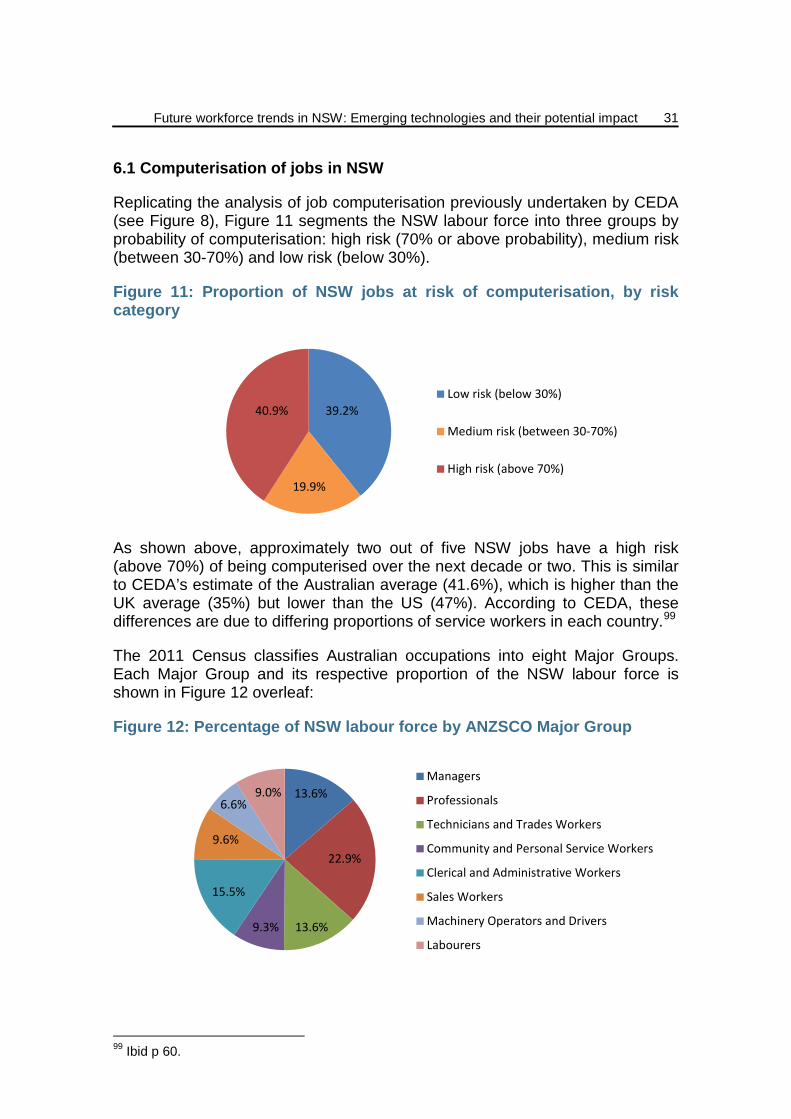
Replicating the analysis of job computerisation previously undertaken by CEDA (see Figure 8), Figure 11 segments the NSW labour force into three groups by probability of computerisation: high risk (70% or above probability), medium risk (between 30-70%) and low risk (below 30%).
Figure 11: Proportion of NSW jobs at risk of computerisation, by risk category
As shown above, approximately two out of five NSW jobs have a high risk (above 70%) of being computerised over the next decade or two. This is similar to CEDA’s estimate of the Australian average (41.6%), which is higher than the UK average (35%) but lower than the US (47%). According to CEDA, these differences are due to differing proportions of service workers in each country.99
The 2011 Census classifies Australian occupations into eight Major Groups. Each Major Group and its respective proportion of the NSW labour force is shown in Figure 12 overleaf:
Figure 12: Percentage of NSW labour force by ANZSCO Major Group
99 Ibid p 60.
39.2%
19.9%
40.9% Low risk (below 30%)
Medium risk (between 30-70%)
High risk (above 70%)
13.6%
22.9%
13.6% 9.3%
15.5%
9.6%
6.6% 9.0%
Managers
Professionals
Technicians and Trades Workers
Community and Personal Service Workers
Clerical and Administrative Workers
Sales Workers
Machinery Operators and Drivers
Labourers
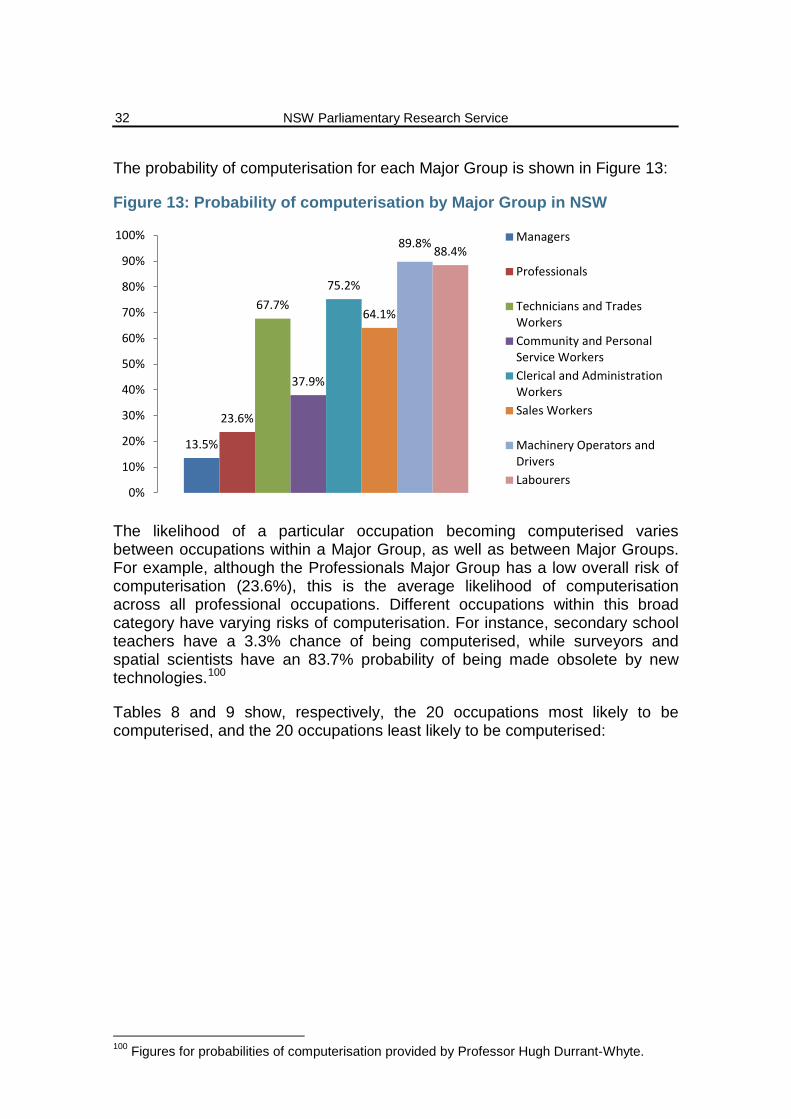
NSW Parliamentary Research Service
32
The probability of computerisation for each Major Group is shown in Figure 13:
Figure 13: Probability of computerisation by Major Group in NSW
The likelihood of a particular occupation becoming computerised varies between occupations within a Major Group, as well as between Major Groups. For example, although the Professionals Major Group has a low overall risk of computerisation (23.6%), this is the average likelihood of computerisation across all professional occupations. Different occupations within this broad category have varying risks of computerisation. For instance, secondary school teachers have a 3.3% chance of being computerised, while surveyors and spatial scientists have an 83.7% probability of being made obsolete by new technologies.100
Tables 8 and 9 show, respectively, the 20 occupations most likely to be computerised, and the 20 occupations least likely to be computerised:
100 Figures for probabilities of computerisation provided by Professor Hugh Durrant-Whyte.
13.5%
23.6%
67.7%
37.9%
75.2%
64.1%
89.8% 88.4%
0%
10%
20%
30%
40%
50%
60%
70%
80%
90%
100% Managers
Professionals
Technicians and TradesWorkersCommunity and PersonalService WorkersClerical and AdministrationWorkersSales Workers
Machinery Operators andDriversLabourers
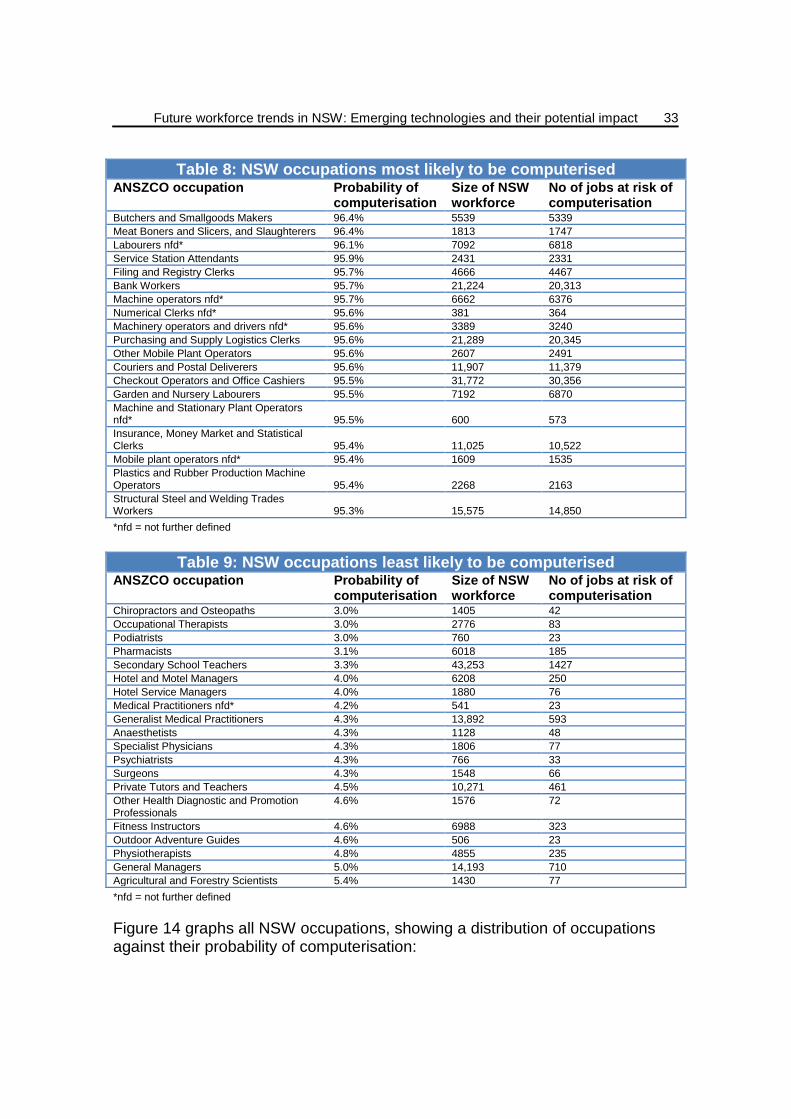
Future workforce trends in NSW: Emerging technologies and their potential impact
33
Table 8: NSW occupations most likely to be computerised ANSZCO occupation Probability of
computerisation Size of NSW workforce
No of jobs at risk of computerisation
Butchers and Smallgoods Makers 96.4% 5539 5339 Meat Boners and Slicers, and Slaughterers 96.4% 1813 1747 Labourers nfd* 96.1% 7092 6818 Service Station Attendants 95.9% 2431 2331 Filing and Registry Clerks 95.7% 4666 4467 Bank Workers 95.7% 21,224 20,313 Machine operators nfd* 95.7% 6662 6376 Numerical Clerks nfd* 95.6% 381 364 Machinery operators and drivers nfd* 95.6% 3389 3240 Purchasing and Supply Logistics Clerks 95.6% 21,289 20,345 Other Mobile Plant Operators 95.6% 2607 2491 Couriers and Postal Deliverers 95.6% 11,907 11,379 Checkout Operators and Office Cashiers 95.5% 31,772 30,356 Garden and Nursery Labourers 95.5% 7192 6870 Machine and Stationary Plant Operators nfd* 95.5% 600 573 Insurance, Money Market and Statistical Clerks 95.4% 11,025 10,522 Mobile plant operators nfd* 95.4% 1609 1535 Plastics and Rubber Production Machine Operators 95.4% 2268 2163 Structural Steel and Welding Trades Workers 95.3% 15,575 14,850 *nfd = not further defined
Table 9: NSW occupations least likely to be computerised ANSZCO occupation Probability of
computerisation Size of NSW workforce
No of jobs at risk of computerisation
Chiropractors and Osteopaths 3.0% 1405 42 Occupational Therapists 3.0% 2776 83 Podiatrists 3.0% 760 23 Pharmacists 3.1% 6018 185 Secondary School Teachers 3.3% 43,253 1427 Hotel and Motel Managers 4.0% 6208 250 Hotel Service Managers 4.0% 1880 76 Medical Practitioners nfd* 4.2% 541 23 Generalist Medical Practitioners 4.3% 13,892 593 Anaesthetists 4.3% 1128 48 Specialist Physicians 4.3% 1806 77 Psychiatrists 4.3% 766 33 Surgeons 4.3% 1548 66 Private Tutors and Teachers 4.5% 10,271 461 Other Health Diagnostic and Promotion Professionals
4.6% 1576 72
Fitness Instructors 4.6% 6988 323 Outdoor Adventure Guides 4.6% 506 23 Physiotherapists 4.8% 4855 235 General Managers 5.0% 14,193 710 Agricultural and Forestry Scientists 5.4% 1430 77 *nfd = not further defined
Figure 14 graphs all NSW occupations, showing a distribution of occupations against their probability of computerisation:
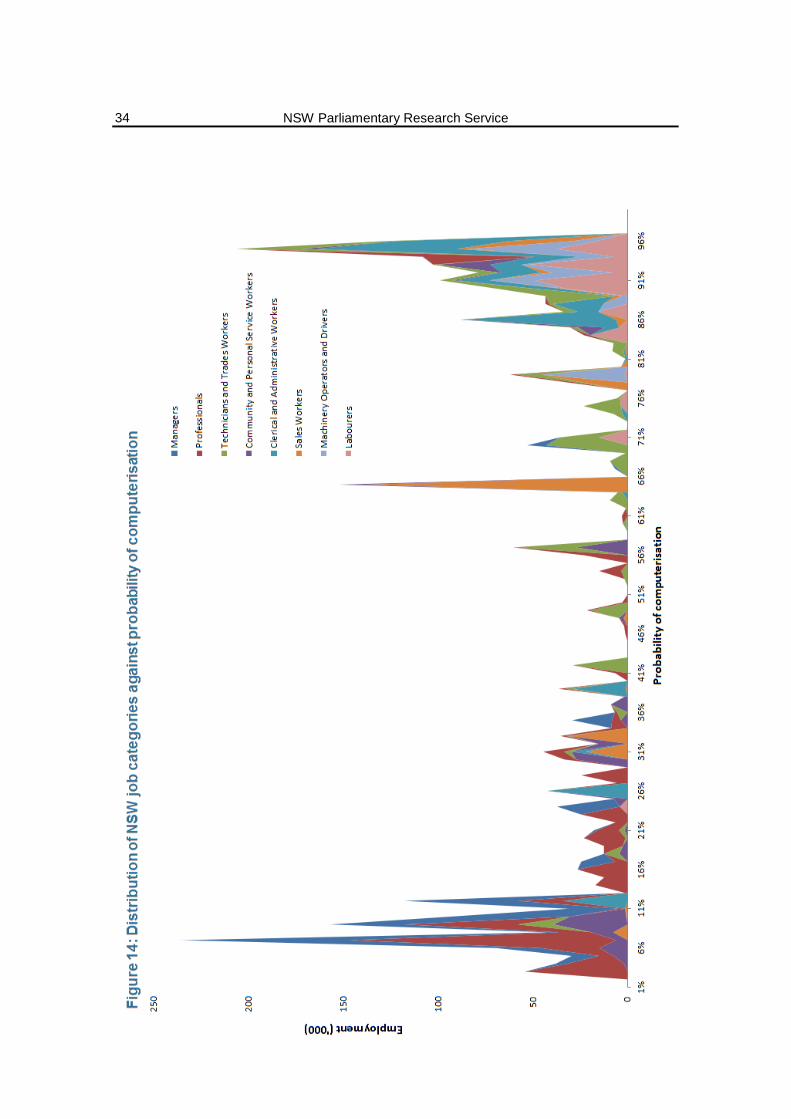
NSW Parliamentary Research Service
34
Future workforce trends in NSW: Emerging technologies and their potential impact
35
Figures 13 and 14 suggest that several major employment groups, notably labourers, and machinery operators and drivers, have very high probabilities of computerisation. An explanation for this at the national level was given in the CEDA Report:
First, potential job losses are polarised: Jobs in administration and sales (and many service areas) will disappear, while jobs in the technical professions and personal services will remain. Second, many of those jobs remaining are characterised by non-routine thinking and especially high levels of originality and creativity.101
6.2 Computerisation by NSW electorate
51.58% (1.57 million) of all NSW jobs are at risk of being computerised in the next 10 to 15 years.102 However, this figure does not apply evenly throughout NSW. This is because some State regions have particularly high numbers of managers or professionals, while other parts have greater numbers of lower skilled workers.
Figures 15 to 18 map the estimated probability of job loss through computerisation for the employed residents of each NSW State electorate. As acknowledged in the CEDA Report, these findings are preliminary and do not factor in information such as population levels. Accordingly, the following figures should not be over-analysed.103
Note that, as explained further in Appendix A, for technical reasons the electoral boundaries in the following maps do not correspond in all cases to the exact boundaries as drawn by the NSW Electoral Commission. Some maps are generated using an approximation of the electoral boundaries using SA1s, not the exact electoral boundaries as made by the Commission. The data used to create these maps is available in Appendix B of this paper.
101 Ibid p 61. 102 If anything, this may be an underestimate due to (i) the undercount in Census data, and (ii)
the exclusion of a small number of occupations from the analysis. See further Appendix A. 103 Durrant-Whyte et al, note 91, p 61.
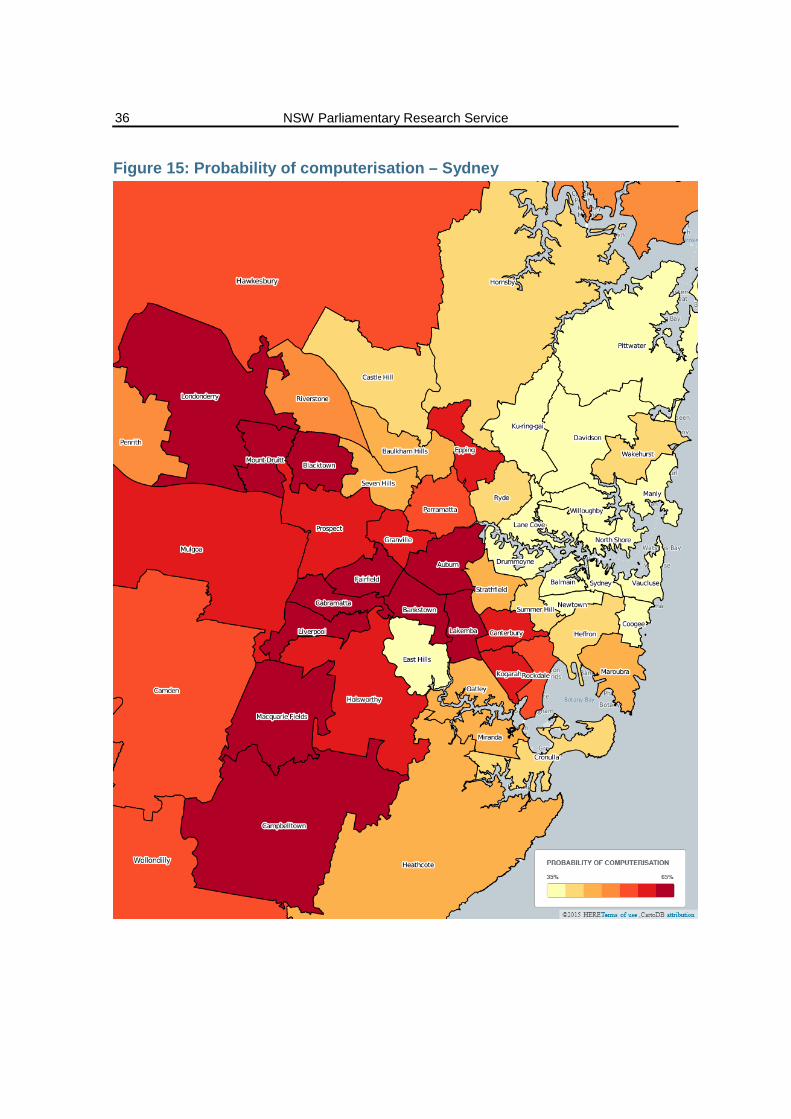
NSW Parliamentary Research Service
36
Figure 15: Probability of computerisation – Sydney
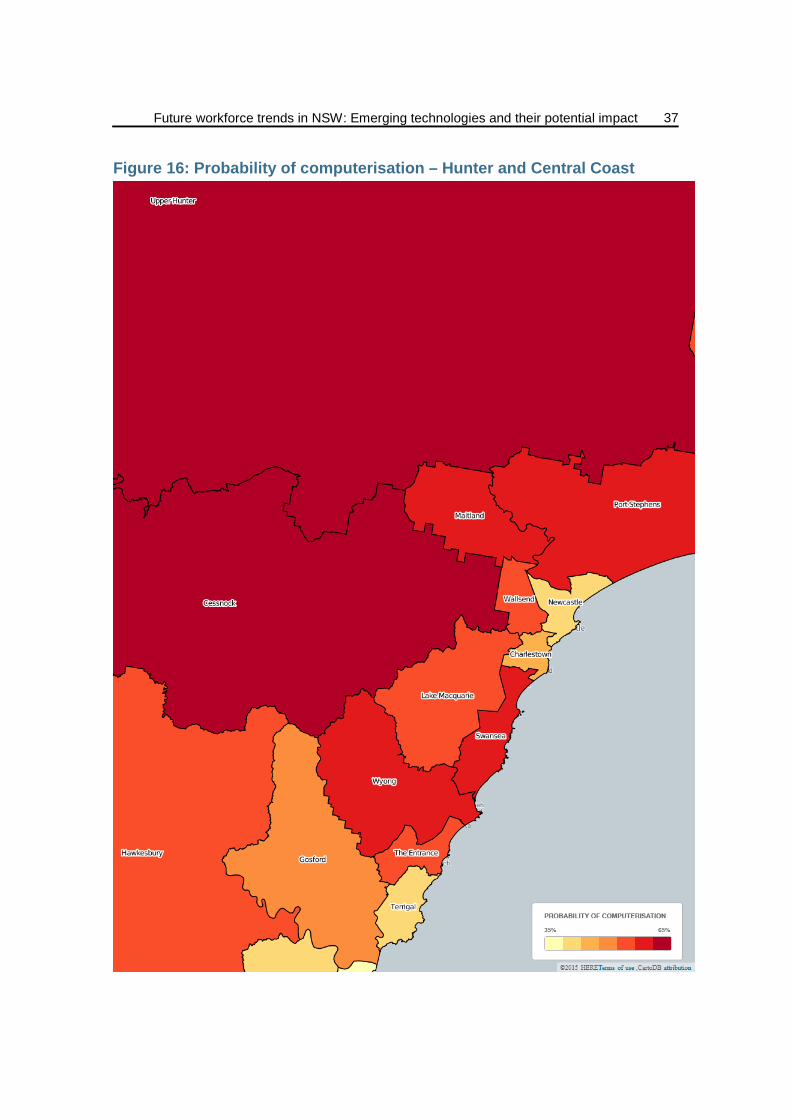
Future workforce trends in NSW: Emerging technologies and their potential impact
37
Figure 16: Probability of computerisation – Hunter and Central Coast
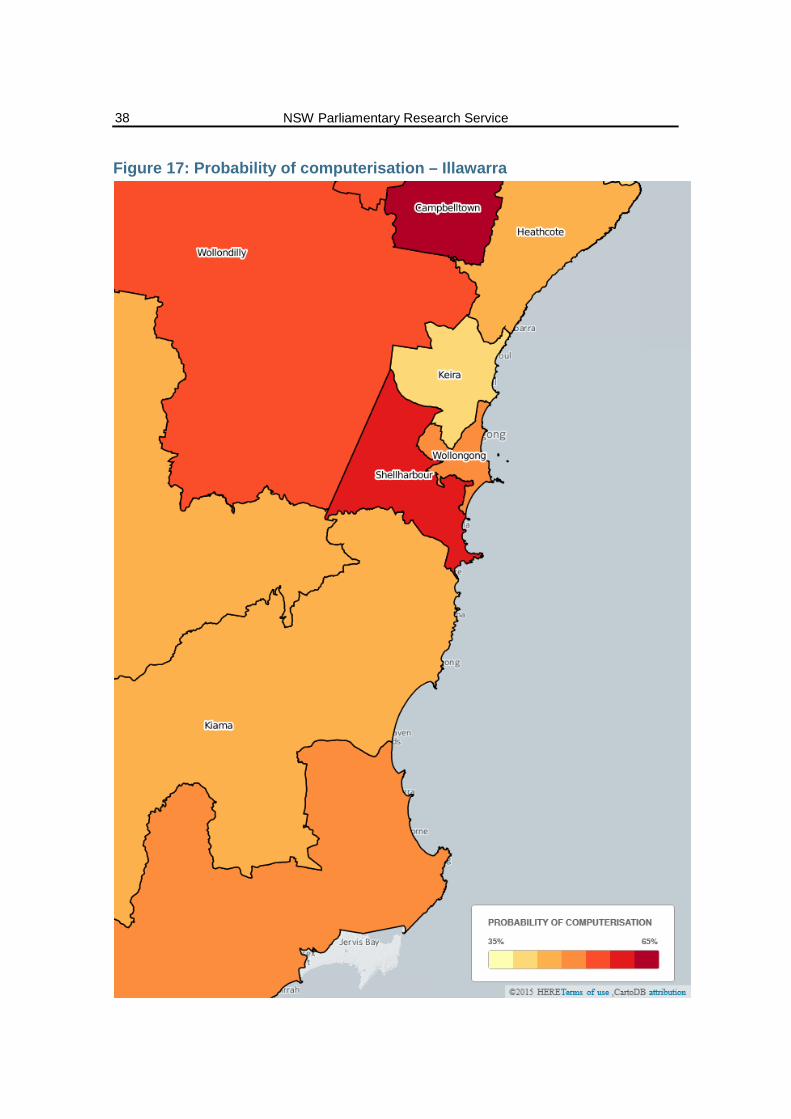
NSW Parliamentary Research Service
38
Figure 17: Probability of computerisation – Illawarra
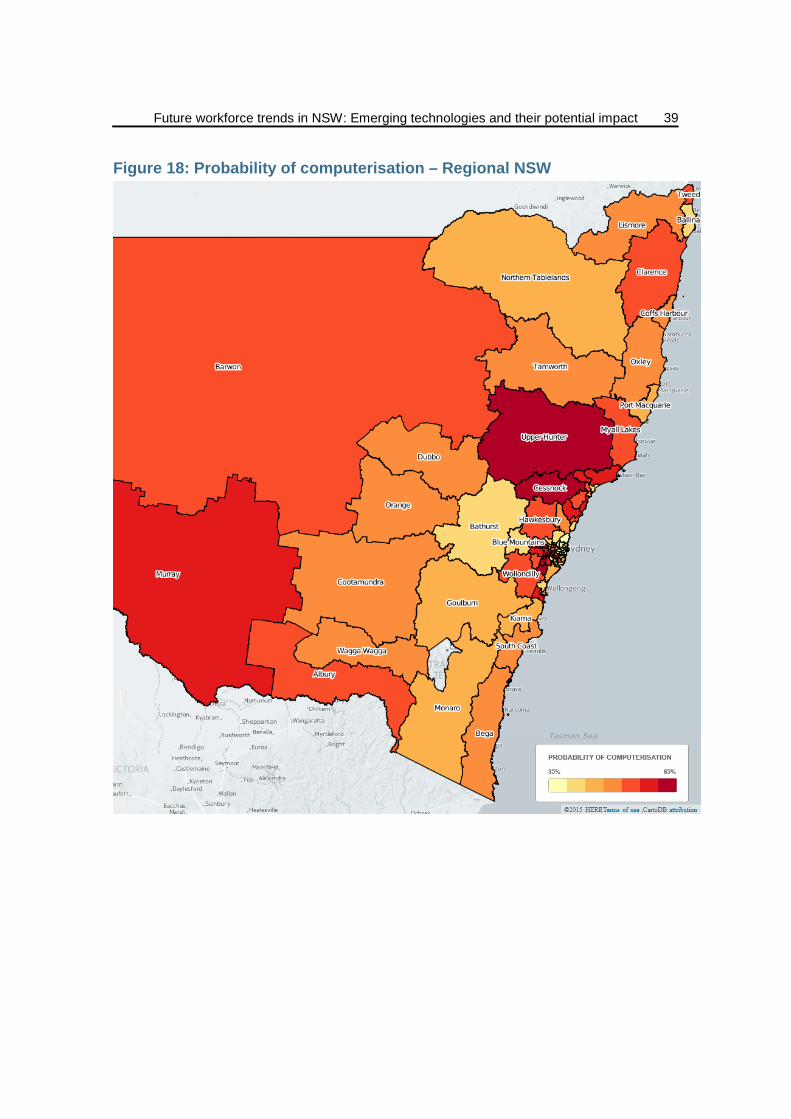
Future workforce trends in NSW: Emerging technologies and their potential impact
39
Figure 18: Probability of computerisation – Regional NSW
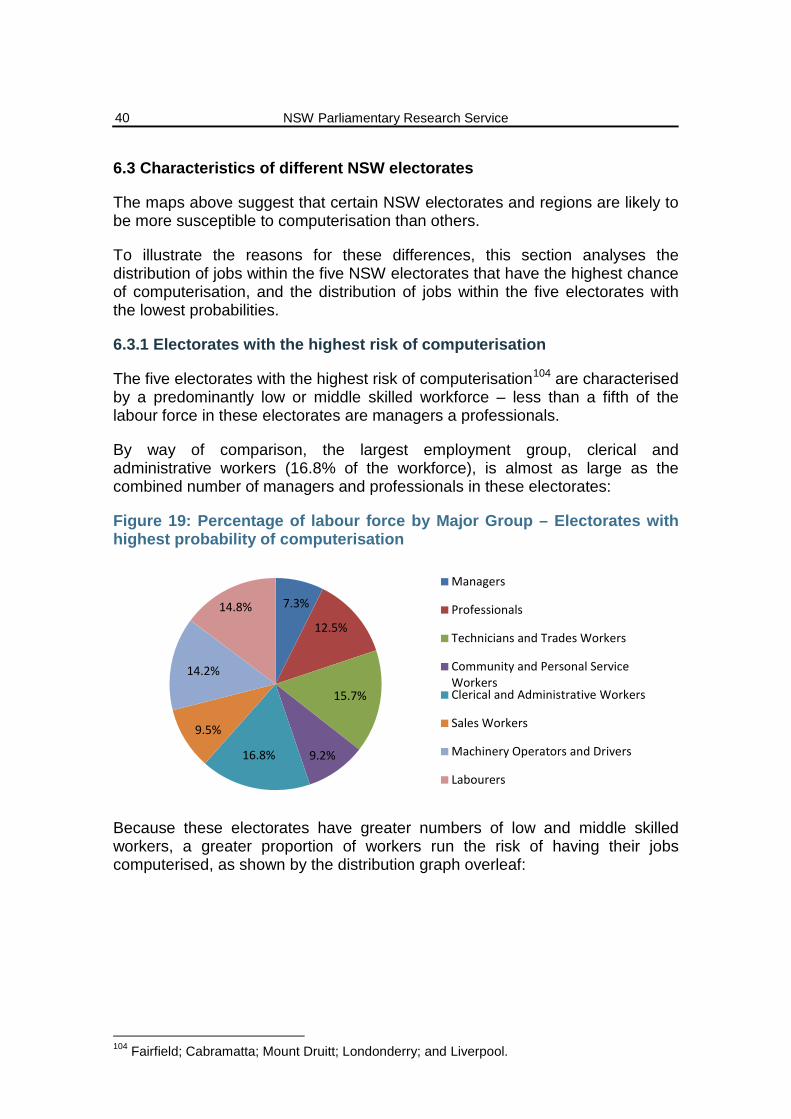
NSW Parliamentary Research Service
40
6.3 Characteristics of different NSW electorates
The maps above suggest that certain NSW electorates and regions are likely to be more susceptible to computerisation than others.
To illustrate the reasons for these differences, this section analyses the distribution of jobs within the five NSW electorates that have the highest chance of computerisation, and the distribution of jobs within the five electorates with the lowest probabilities.
6.3.1 Electorates with the highest risk of computerisation
The five electorates with the highest risk of computerisation104 are characterised by a predominantly low or middle skilled workforce – less than a fifth of the labour force in these electorates are managers a professionals.
By way of comparison, the largest employment group, clerical and administrative workers (16.8% of the workforce), is almost as large as the combined number of managers and professionals in these electorates:
Figure 19: Percentage of labour force by Major Group – Electorates with highest probability of computerisation
Because these electorates have greater numbers of low and middle skilled workers, a greater proportion of workers run the risk of having their jobs computerised, as shown by the distribution graph overleaf:
104 Fairfield; Cabramatta; Mount Druitt; Londonderry; and Liverpool.
7.3%
12.5%
15.7%
9.2% 16.8%
9.5%
14.2%
14.8%
Managers
Professionals
Technicians and Trades Workers
Community and Personal ServiceWorkersClerical and Administrative Workers
Sales Workers
Machinery Operators and Drivers
Labourers
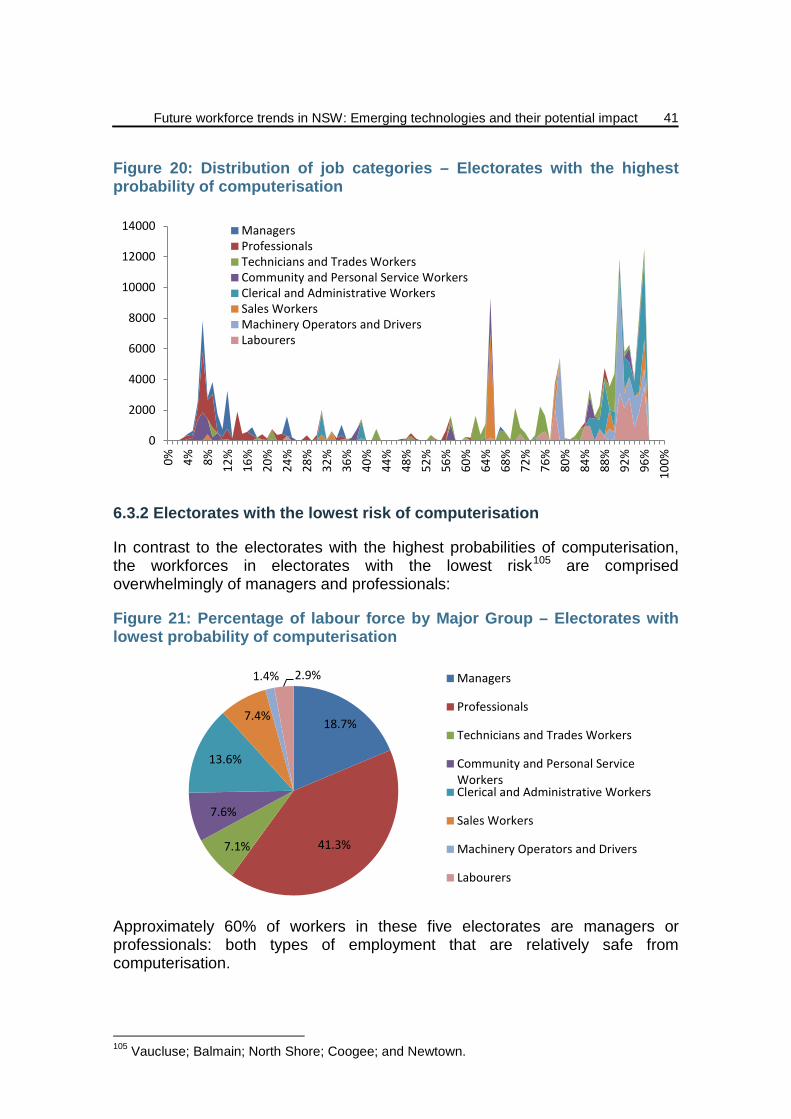
Future workforce trends in NSW: Emerging technologies and their potential impact
41
Figure 20: Distribution of job categories – Electorates with the highest probability of computerisation
6.3.2 Electorates with the lowest risk of computerisation
In contrast to the electorates with the highest probabilities of computerisation, the workforces in electorates with the lowest risk105 are comprised overwhelmingly of managers and professionals:
Figure 21: Percentage of labour force by Major Group – Electorates with lowest probability of computerisation
Approximately 60% of workers in these five electorates are managers or professionals: both types of employment that are relatively safe from computerisation.
105 Vaucluse; Balmain; North Shore; Coogee; and Newtown.
0
2000
4000
6000
8000
10000
12000
14000
0% 4% 8% 12%
16%
20%
24%
28%
32%
36%
40%
44%
48%
52%
56%
60%
64%
68%
72%
76%
80%
84%
88%
92%
96%
100%
ManagersProfessionalsTechnicians and Trades WorkersCommunity and Personal Service WorkersClerical and Administrative WorkersSales WorkersMachinery Operators and DriversLabourers
18.7%
41.3% 7.1%
7.6%
13.6%
7.4%
1.4% 2.9% Managers
Professionals
Technicians and Trades Workers
Community and Personal ServiceWorkersClerical and Administrative Workers
Sales Workers
Machinery Operators and Drivers
Labourers
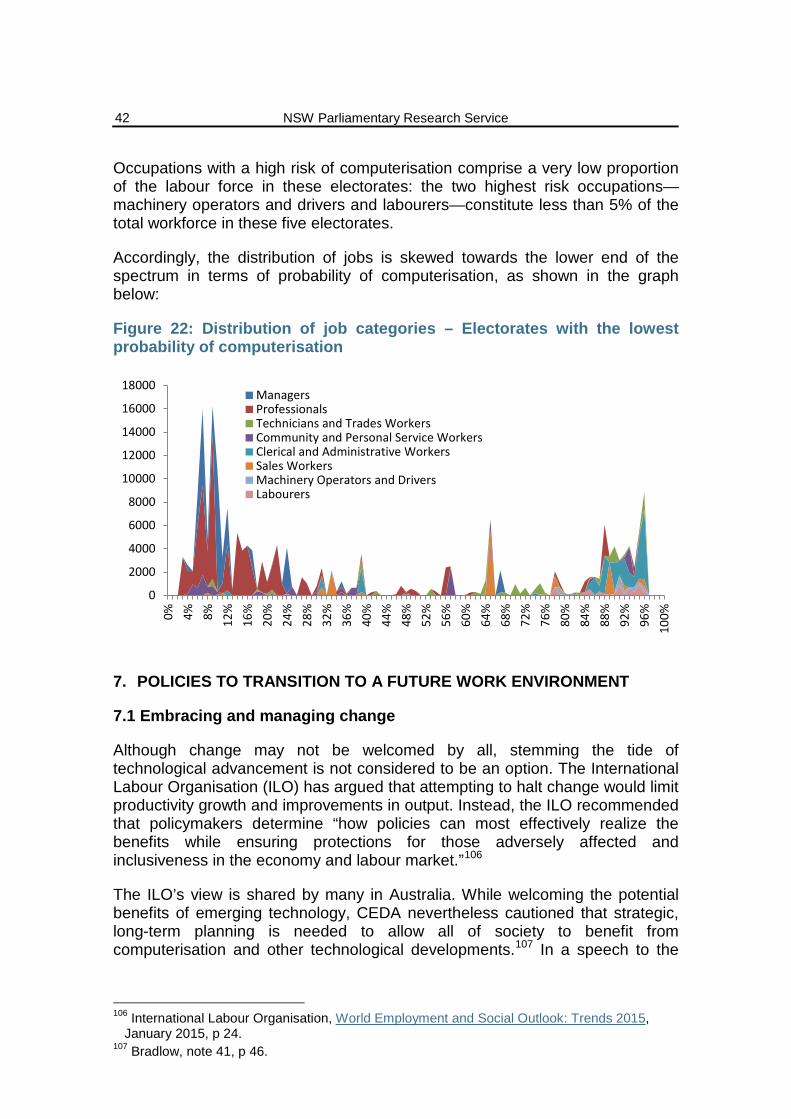
NSW Parliamentary Research Service
42
Occupations with a high risk of computerisation comprise a very low proportion of the labour force in these electorates: the two highest risk occupations—machinery operators and drivers and labourers—constitute less than 5% of the total workforce in these five electorates.
Accordingly, the distribution of jobs is skewed towards the lower end of the spectrum in terms of probability of computerisation, as shown in the graph below:
Figure 22: Distribution of job categories – Electorates with the lowest probability of computerisation
7. POLICIES TO TRANSITION TO A FUTURE WORK ENVIRONMENT
7.1 Embracing and managing change
Although change may not be welcomed by all, stemming the tide of technological advancement is not considered to be an option. The International Labour Organisation (ILO) has argued that attempting to halt change would limit productivity growth and improvements in output. Instead, the ILO recommended that policymakers determine “how policies can most effectively realize the benefits while ensuring protections for those adversely affected and inclusiveness in the economy and labour market.”106
The ILO’s view is shared by many in Australia. While welcoming the potential benefits of emerging technology, CEDA nevertheless cautioned that strategic, long-term planning is needed to allow all of society to benefit from computerisation and other technological developments.107 In a speech to the
106 International Labour Organisation, World Employment and Social Outlook: Trends 2015,
January 2015, p 24. 107 Bradlow, note 41, p 46.
0
2000
4000
6000
8000
10000
12000
14000
16000
18000
0% 4% 8% 12%
16%
20%
24%
28%
32%
36%
40%
44%
48%
52%
56%
60%
64%
68%
72%
76%
80%
84%
88%
92%
96%
100%
ManagersProfessionalsTechnicians and Trades WorkersCommunity and Personal Service WorkersClerical and Administrative WorkersSales WorkersMachinery Operators and DriversLabourers
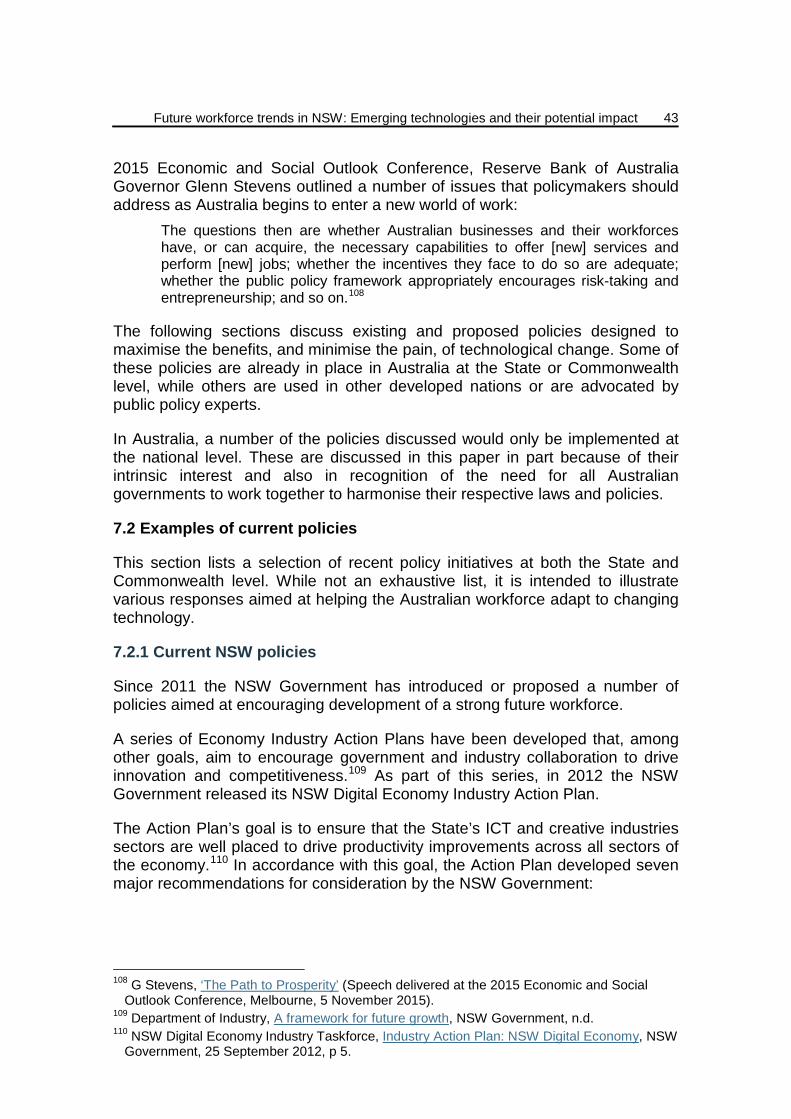
Future workforce trends in NSW: Emerging technologies and their potential impact
43
2015 Economic and Social Outlook Conference, Reserve Bank of Australia Governor Glenn Stevens outlined a number of issues that policymakers should address as Australia begins to enter a new world of work:
The questions then are whether Australian businesses and their workforces have, or can acquire, the necessary capabilities to offer [new] services and perform [new] jobs; whether the incentives they face to do so are adequate; whether the public policy framework appropriately encourages risk-taking and entrepreneurship; and so on.108
The following sections discuss existing and proposed policies designed to maximise the benefits, and minimise the pain, of technological change. Some of these policies are already in place in Australia at the State or Commonwealth level, while others are used in other developed nations or are advocated by public policy experts.
In Australia, a number of the policies discussed would only be implemented at the national level. These are discussed in this paper in part because of their intrinsic interest and also in recognition of the need for all Australian governments to work together to harmonise their respective laws and policies.
7.2 Examples of current policies
This section lists a selection of recent policy initiatives at both the State and Commonwealth level. While not an exhaustive list, it is intended to illustrate various responses aimed at helping the Australian workforce adapt to changing technology.
7.2.1 Current NSW policies
Since 2011 the NSW Government has introduced or proposed a number of policies aimed at encouraging development of a strong future workforce.
A series of Economy Industry Action Plans have been developed that, among other goals, aim to encourage government and industry collaboration to drive innovation and competitiveness.109 As part of this series, in 2012 the NSW Government released its NSW Digital Economy Industry Action Plan.
The Action Plan’s goal is to ensure that the State’s ICT and creative industries sectors are well placed to drive productivity improvements across all sectors of the economy.110 In accordance with this goal, the Action Plan developed seven major recommendations for consideration by the NSW Government:
108 G Stevens, ‘The Path to Prosperity’ (Speech delivered at the 2015 Economic and Social
Outlook Conference, Melbourne, 5 November 2015). 109 Department of Industry, A framework for future growth, NSW Government, n.d. 110 NSW Digital Economy Industry Taskforce, Industry Action Plan: NSW Digital Economy, NSW
Government, 25 September 2012, p 5.
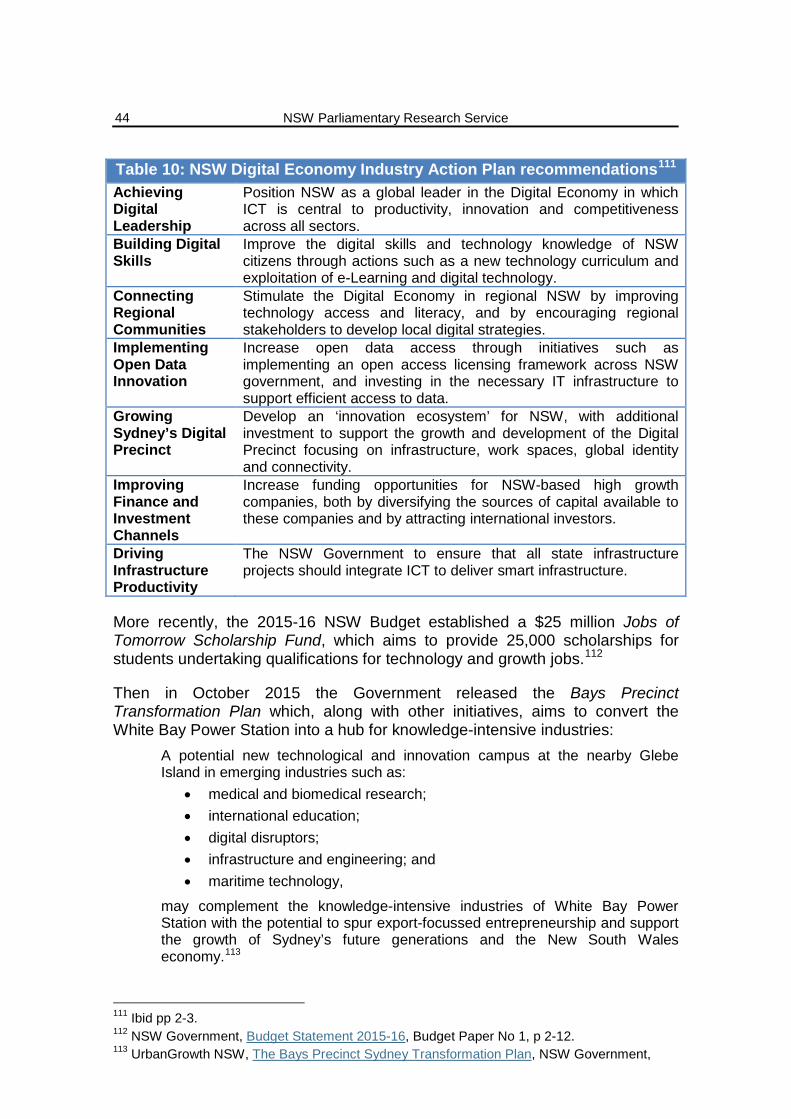
NSW Parliamentary Research Service
44
Table 10: NSW Digital Economy Industry Action Plan recommendations111 Achieving Digital Leadership
Position NSW as a global leader in the Digital Economy in which ICT is central to productivity, innovation and competitiveness across all sectors.
Building Digital Skills
Improve the digital skills and technology knowledge of NSW citizens through actions such as a new technology curriculum and exploitation of e-Learning and digital technology.
Connecting Regional Communities
Stimulate the Digital Economy in regional NSW by improving technology access and literacy, and by encouraging regional stakeholders to develop local digital strategies.
Implementing Open Data Innovation
Increase open data access through initiatives such as implementing an open access licensing framework across NSW government, and investing in the necessary IT infrastructure to support efficient access to data.
Growing Sydney’s Digital Precinct
Develop an ‘innovation ecosystem’ for NSW, with additional investment to support the growth and development of the Digital Precinct focusing on infrastructure, work spaces, global identity and connectivity.
Improving Finance and Investment Channels
Increase funding opportunities for NSW-based high growth companies, both by diversifying the sources of capital available to these companies and by attracting international investors.
Driving Infrastructure Productivity
The NSW Government to ensure that all state infrastructure projects should integrate ICT to deliver smart infrastructure.
More recently, the 2015-16 NSW Budget established a $25 million Jobs of Tomorrow Scholarship Fund, which aims to provide 25,000 scholarships for students undertaking qualifications for technology and growth jobs.112
Then in October 2015 the Government released the Bays Precinct Transformation Plan which, along with other initiatives, aims to convert the White Bay Power Station into a hub for knowledge-intensive industries:
A potential new technological and innovation campus at the nearby Glebe Island in emerging industries such as:
• medical and biomedical research; • international education; • digital disruptors; • infrastructure and engineering; and • maritime technology,
may complement the knowledge-intensive industries of White Bay Power Station with the potential to spur export-focussed entrepreneurship and support the growth of Sydney’s future generations and the New South Wales economy.113
111 Ibid pp 2-3. 112 NSW Government, Budget Statement 2015-16, Budget Paper No 1, p 2-12. 113 UrbanGrowth NSW, The Bays Precinct Sydney Transformation Plan, NSW Government,
Future workforce trends in NSW: Emerging technologies and their potential impact
45
Further, the 2014 Plan for Growing Sydney proposed the expansion of the “Global Economic Corridor”; a section of Sydney stretching from Macquarie Park through the Sydney CBD to Port Botany and Sydney Airport that generates over 41% of Gross State Product:
This economic cluster is unique in Australia due to the extent, diversity and concentration of globally competitive industries.
Sydney’s knowledge jobs are heavily concentrated within the Global Economic Corridor, including sectors such as education, financial and other business services, communications, high-tech manufacturing and emerging industries such as biotechnology. These sectors are at the forefront of innovation in Sydney’s economy.114
7.2.2 Other recent Australian policies
Other Australian jurisdictions have released or announced their own policies designed to increase technological education and support innovative businesses.
In the education field, the Commonwealth Government has committed $12 million to increase student uptake of science, technology, engineering and mathematics (STEM) courses in primary and secondary schools, along with other initiatives such as $3.5 million in funding for computer coding programs in Australian schools.115 In Victoria, the Andrews Government recently provided $27 million in extra funding for primary mathematics and science specialists in disadvantaged primary schools from 2016.116
As part of its 2015-16 Budget, the Victorian Government established the $200 million Future Industries Fund, which will support six priority sectors with the potential for high economic growth and the capacity to create high skill, high wage jobs within the State. These priority sectors include medical technologies and pharmaceuticals; new energy technologies; and transport, defence and construction technologies.117
Similarly, in 2015 the Queensland Government established a $40 million Business Development Fund. The Fund will invest between $125,000 and $2.5 million in Queensland businesses that are commercialising research, or innovative ideas, products or services, with the aim of promoting angel and venture capital investment in Queensland.118 Furthermore, Queensland’s 2015-
October 2015, p 27.
114 NSW Planning & Environment, A Plan for Growing Sydney, NSW Government, 2014, p 44. 115 Department of Education and Training, Restoring the focus on STEM in schools initiative,
Australian Government, 21 October 2015. 116 J Merlino, Education State: $27 Million Maths And Science Boost For Kids Who Need It Most
(Media Release, 15 September 2015). 117 Business Victoria, Future Industries: Building a Stronger Victoria, Victorian Government, 2
November 2015. 118 Advance Queensland, Business Development Fund, Queensland Government, 4 November
2015.
NSW Parliamentary Research Service
46
16 Budget, which featured a suite of policies for start-up businesses and STEM education, was widely praised by industry groups as encouraging a “thriving start-up culture” in the State.119
In March 2015, the Abbott Government acknowledged that government bureaucracies must adapt to technological innovation, discussing the aims of the Digital Transformation Office (DTO) in the 2015 Intergenerational Report:
The DTO will focus on end-user needs in developing digital services, so that government services can be delivered digitally from start to finish and better serve the needs of citizens and businesses. … Government policy development is heavily reliant on available data. There is huge potential to modernise and better manage Australia’s national data infrastructure, with appropriate data sharing and access arrangements that take advantage of new technologies, and make the best use of existing data and scarce resources. Improved data quality and the ability to respond more quickly to emerging trends and issues will better inform policies for the benefit of all Australians.120
On 7 December 2015, Prime Minister Malcolm Turnbull released the Commonwealth Government’s National Innovation and Science Agenda.121 The Agenda contains 24 measures, with key measures including:122
• Tax incentives for early-stage investors, including a 20% non-refundable tax offset and a capital gains tax exemption. These incentives are closely modelled on the United Kingdom’s Seed Enterprise Investment Scheme (SEIS);123
• A $200 million innovation fund to co-invest in businesses that develop technology from the CSIRO and Australian universities; and
• $48m for a STEM literacy program, $14m to encourage women and girls into the STEM sector, and $51m to promote digital literacy.
However, the Federal Labor Opposition has criticised earlier Commonwealth spending cuts to research, technology and innovation,124 and announced its own Future Smart policy suite, designed to:125
• Create HECS-style loans of up to $10,440 per annum for fledgling
119 D Swan, Tech-friendly Queensland budget lauded, The Australian (online), 15 July 2015. 120 Australian Treasury, 2015 Intergenerational Report: Australia in 2055, Australian
Government, March 2015, p 91. 121 Australian Government, National Innovation and Science Agenda, 2015. 122 D Hurst, Malcolm Turnbull's innovation package offers tax breaks and school focus, The
Guardian (online), 7 December 2015; E Borrello, F Keany, Innovation statement: PM Malcolm Turnbull calls for 'ideas boom' as he unveils $1b vision for Australia's future, ABC News (online), 7 December 2015.
123 For an overview of the UK scheme see: HM Revenue and Customs, Business tax – guidance: Seed Enterprise Investment Scheme, UK Government, 22 October 2013.
124 For example, see K Carr, Time for Turnbull to reverse cuts to all science agencies (Media Release, 12 November 2015).
125 Australian Labor Party, Future Smart: Educating for the jobs of tomorrow, 2015; Labor Herald, Entrepreneurs, higher learning and a plan for more start-up businesses, 25 September 2015.
Future workforce trends in NSW: Emerging technologies and their potential impact
47
business ideas from university graduates, as well as access to mentoring and professional development;
• Create a STEM teacher training fund to support 25,000 primary and secondary school teachers to undertake professional development in STEM disciplines over five years;
• Establish a $500 million Smart Investment Fund to co-invest in early stage companies, with a Commonwealth investment of up to 50% of the start-up capital to commercialise innovations.
7.3 Improving education in Australia
Of the many policy proposals in response to changing workforces, an increased focus on high quality and specialised education is the most prominent and widely supported. The CEDA Report identified three key educational goals needed to manage the challenges of a complex and ambiguous future:126
1. There must be greater numbers of Australians with a grounding in STEM skills;
2. Universities must forge deeper relationships with industry and employers in order to improve the employability of graduates; and
3. Rather than merely accumulate facts, individuals must gain the ability to deal nimbly with complex and often ambiguous knowledge.
The focus of this section is on the role of governments at all levels in enhancing STEM education. However, future workforces will require education beyond these fields, as well as beyond primary and secondary studies, with CEDA emphasising the importance of lifelong learning in order to adjust to a world changing in unknown ways.127 In relation to low skilled workers, Berger and Frey have argued that educational efforts should aim to provide workers with integrated skill-sets of technical, creative and social skills, these being areas where human workers are likely to retain a comparative advantage despite ongoing technological advances.128
It is also recognised that individuals themselves must share responsibility for their ongoing education and development.129
7.3.1 Increasing STEM knowledge and skills
The benefits of STEM education have been advocated by many observers,130
126 J den Hollander, ‘A brave new world of higher education’ in Committee for Economic
Development of Australia, Australia’s future workforce? (2015) 225, p 231. 127 S Beitz, ‘Developing the capacity to adapt to industry transformation’ in Committee for
Economic Development of Australia, Australia’s future workforce? (2015) 156, pp 163-4. 128 T Berger, C Frey, ‘Bridging the skills gap’ in T Dolphin (ed), Technology, Globalisation and
the Future of Work in Europe (March 2015) 75, p 77. 129 P Glover, H Hope, ‘Preparing for tomorrow’s world of work’ in T Dolphin (ed), Technology,
Globalisation and the Future of Work in Europe (March 2015) 42, pp 45-6. 130 For example, see Glover and Hope, note 129; Office of the Chief Scientist, Science,
technology, engineering and mathematics: Australia’s future, Australian Government,
NSW Parliamentary Research Service
48
and have been the subject of significant attention by policymakers. According to Deloitte, STEM graduates have a range of vital workplace skills, including the ability to generate, understand and analyse empirical data; perform systematic and critical assessments of complex problems; and effectively communicate scientific issues.131
Crucially, STEM skills have flow-on benefits to the community as a whole. In its 2015 STEM Report, PwC commented that countries that lead in STEM education also rank high in innovation. Turning to Australia, PwC modelling found that developing a STEM workforce in line with other leading countries could generate an additional $57.4 billion in GDP over the next 20 years.132
Several Australian governments have recognised the need for better STEM education and have implemented policies in pursuit of this goal. However, Australia faces major shortfalls in STEM knowledge and education.
In late 2014 the Commonwealth Office of the Chief Scientist sharply criticised the existing state of affairs, noting that STEM investment and policies at all levels of Australian Government suffer from a lack of coordination, misdirected effort, instability and duplication.133 Citing international research, which concluded that 75% of the fastest growing occupations require STEM skills and knowledge, the Chief Scientist argued that greater investment in these fields were needed to enhance competitiveness and grow the Australian economy.134
This view is shared by the Foundation for Young Australians, who recently reported that 42% of Australian 15 year olds are not proficient in mathematics, 35% are not proficient in science; and 35% are not proficient in technology.135
In response, the Office of the Chief Scientist outlined several strategies, with recommendations ranging from accelerating the integration of STEM experts into industry, business and public sectors; increasing recognition of STEM education and careers as a public good; and promoting inquiry-based STEM teaching in vocational education in consultation with States and Territories.136
7.3.2 The limits of education
Despite broad support for increased education, particularly STEM knowledge, experts have cautioned against treating education as a panacea for labour market challenges. The propensity of higher education to produce ever-
September 2014; PwC, note 53.
131 Deloitte, note 85, p 19. 132 PwC, note 53, pp 15, 19. 133 Office of the Chief Scientist, Science, technology, engineering and mathematics: Australia’s
future, Australian Government, September 2014, pp 10-11. 134 Ibid pp 6-7. 135 Foundation for Young Australians, Report Card 2015: How are young people faring in the
transition from school to work?, November 2015, p 1. 136 Ibid pp 18, 23-4.
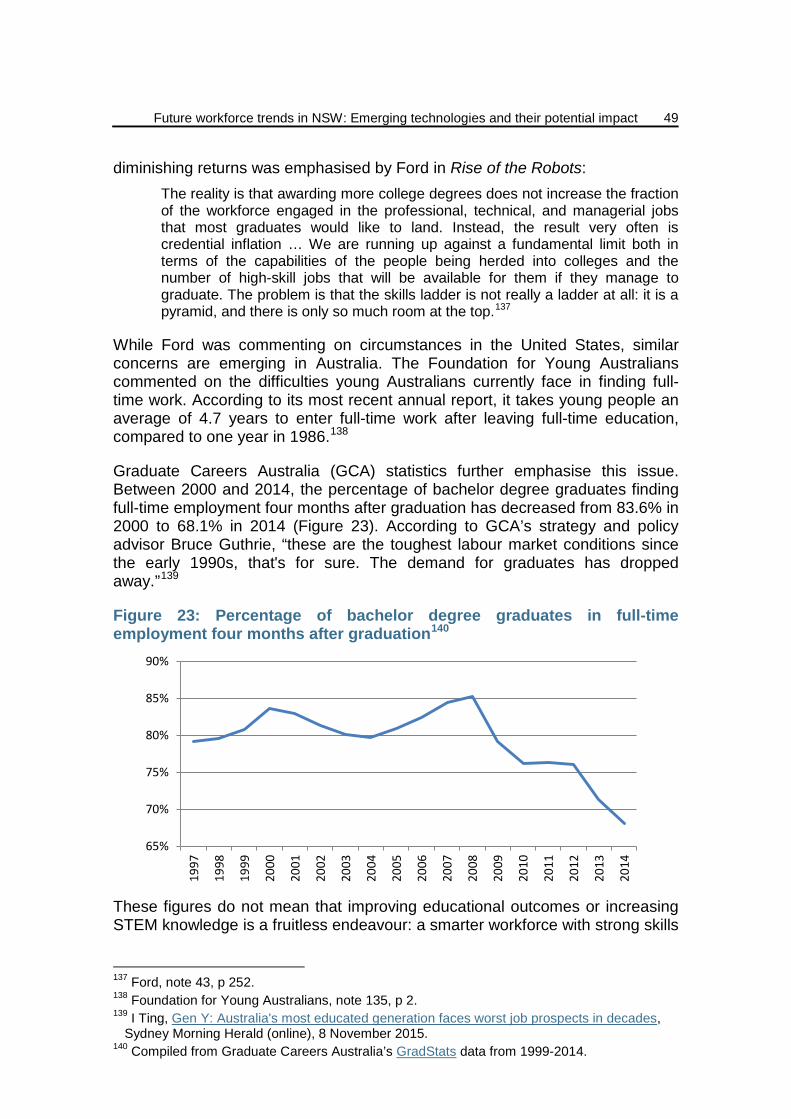
Future workforce trends in NSW: Emerging technologies and their potential impact
49
diminishing returns was emphasised by Ford in Rise of the Robots: The reality is that awarding more college degrees does not increase the fraction of the workforce engaged in the professional, technical, and managerial jobs that most graduates would like to land. Instead, the result very often is credential inflation … We are running up against a fundamental limit both in terms of the capabilities of the people being herded into colleges and the number of high-skill jobs that will be available for them if they manage to graduate. The problem is that the skills ladder is not really a ladder at all: it is a pyramid, and there is only so much room at the top.137
While Ford was commenting on circumstances in the United States, similar concerns are emerging in Australia. The Foundation for Young Australians commented on the difficulties young Australians currently face in finding full-time work. According to its most recent annual report, it takes young people an average of 4.7 years to enter full-time work after leaving full-time education, compared to one year in 1986.138
Graduate Careers Australia (GCA) statistics further emphasise this issue. Between 2000 and 2014, the percentage of bachelor degree graduates finding full-time employment four months after graduation has decreased from 83.6% in 2000 to 68.1% in 2014 (Figure 23). According to GCA’s strategy and policy advisor Bruce Guthrie, “these are the toughest labour market conditions since the early 1990s, that's for sure. The demand for graduates has dropped away.”139
Figure 23: Percentage of bachelor degree graduates in full-time employment four months after graduation140
These figures do not mean that improving educational outcomes or increasing STEM knowledge is a fruitless endeavour: a smarter workforce with strong skills
137 Ford, note 43, p 252. 138 Foundation for Young Australians, note 135, p 2. 139 I Ting, Gen Y: Australia's most educated generation faces worst job prospects in decades,
Sydney Morning Herald (online), 8 November 2015. 140 Compiled from Graduate Careers Australia’s GradStats data from 1999-2014.
65%
70%
75%
80%
85%
90%
1997
1998
1999
2000
2001
2002
2003
2004
2005
2006
2007
2008
2009
2010
2011
2012
2013
2014

NSW Parliamentary Research Service
50
in these fields will undoubtedly benefit both individuals and the wider Australian economy. Nevertheless, there are limits to what education alone can do to address the coming challenges in the Australian workforce, limits which policymakers will need to take into account.
7.4 Other policy proposals
In addition to improving education, a range of other policies, either currently in use overseas or advocated by policymakers, have been recommended. A selection of these policy ideas are outlined below.
7.4.1 “Flexicurity” and Active Labour Market Policies
A number of European countries, notably Denmark, have implemented an industrial relations system known as the “flexicurity model”. The Danish Government provides a summary of this three-pronged model:
Flexicurity is a compound of flexibility and security. The Danish model has a third element - active labour market policy - and together these elements comprise the golden triangle of flexicurity.
One side of the triangle is flexible rules for hiring and firing, which make it easy for the employers to dismiss employees during downturns and hire new staff when things improve. About 25% of Danish private sector workers change jobs each year.
The second side of the triangle is unemployment security in the form of a guarantee for a legally specified unemployment benefit at a relatively high level - up to 90% for the lowest paid workers.
The third side of the triangle is the active labour market policy. An effective system is in place to offer guidance, a job or education to all unemployed. Denmark spends approx. 1.5% of its GDP on active labour market policy.141
Essentially, the flexicurity model provides employers with ‘flexibility’ by making it easier for them to hire and fire workers, and employees with ‘security’ by providing generous unemployment benefits and comprehensive Active Labour Market Programs (ALMPs) to help unemployed people gain new skills for jobs.142 This three-pronged approach has had significant success in Denmark and other European nations. According to the 2014 book Northern Lights:
The unemployment rate in Denmark, with its high investment in ALMPs, was lower in all but one of the 14 years of economic upswing from the early 1990s, until the effects of the GFC were felt in 2009, than the unemployment rate in Australia, with its non-investment in ALMPS. The Danish policy approach was clearly superior at channelling economic growth into jobs growth.143
Other studies have found that the flexicurity model does more than reduce the
141 Danish Government, Flexicurity, 2015. 142 A Scott, Northern Lights: The positive policy example of Sweden, Finland, Denmark and
Norway (Monash University Publishing, 2014) p 135. 143 Ibid p 140.
Future workforce trends in NSW: Emerging technologies and their potential impact
51
headline unemployment rate. According to Belchamber, flexicurity policies in Scandinavian countries have helped keep macroeconomic indicators144 strong, job satisfaction high, and have helped produce a 5% reduction in structural unemployment levels since the early 1990s.145
To what extent the European flexicurity model can or should be implemented in Australia is unclear, given the many legal and cultural differences between these jurisdictions.146 Nevertheless, experts believe that Australia can learn from this model, particularly in relation to skills enhancement through ALMPs.
For example, ALMPs may be of particular benefit to older Australians, who currently face barriers to participation such as health conditions and discrimination. According to a 2015 paper by Perrier:
[ALMPs] that integrate skill-retraining and job-placement with healthcare needs should be considered a priority and must be designed in a way that takes into account their mixed record of success internationally.147
Because of the mixed success of international ALMPs, Perrier recommended that a comprehensive review should first be undertaken into the development of ALMP programs.148
7.4.2 Initiatives for startup companies
As discussed in chapter 4.1.1, innovation jobs have the potential to greatly benefit economic growth despite constituting a small proportion of the workforce. However, StartupAUS has criticised Australian governments for relying disproportionately on resource sector exports to maintain economic prosperity:
One of Australia’s challenges is to shift away from being a derivative economy and to create high labour productivity jobs that are not susceptible to being usurped by lower cost-of-labour locations, as has been seen in the case of car manufacturing, and at the same time to avoid the fate of resource-rich Argentina which has suffered massive economic downturn as a consequence of government failure to alter the composition of its economy.149
144 Including GDP growth, employment growth, employment and unemployment rates, inflation,
external balance and business investment. 145 G Belchamber, ‘Flexicurity: What is it? Can it work Down Under?’ (2010) 36 Australian
Bulletin of Labour 278, p 286. 146 For example, the relationship between employers and unions in many European countries
are far more collaborative than in Australia, while union membership is substantially higher in these nations than in Australia. See M Dimick, ‘Labor law, new governance, and the Ghent system’ (2012) 90 North Carolina Law Review 319; J Lind, ‘A Nordic Saga? The Ghent System and Trade Unions’ (2007) 15 International Journal of Employment Studies 49.
147 E Perrier, Positive Disruption: Healthcare, Ageing & Participation in the Age of Technology, McKell Institute, September 2015 p 17.
148 Ibid p 45. 149 StartupAUS, Crossroads 2015: An action plan to develop a vibrant tech startup ecosystem in
Australia, April 2015, p 20.

NSW Parliamentary Research Service
52
While the Commonwealth Government is responsible for the majority of policies aimed at creating an effective startup ecosystem (e.g. change the tax treatment of Employee Share Schemes, implement a national program of entrepreneurship education),150 there are a number of proposals that could be implemented at the State level. Note in this respect that NSW is home to nearly two-thirds of Australia’s startup community.151
Increased funding for startup companies is one such initiative. While some Australian States have funding initiatives for startups, the United Kingdom has several funding initiatives for UK start-ups in addition to the SEIS, including:
• The Angel CoFund: A £100m investment fund that makes initial investments of between £100,000 and £1 million alongside syndicates of business angels;152 and
• The StartUp Loans Scheme: A government funded scheme that allows individuals to borrow up to £25,000 set at a 6% p.a. fixed rate of interest, as well as providing access to mentors who can offer free support and advice.153 According to a House of Commons Library briefing paper, as of September 2014 20,400 loans were made and £102.8 million loaned under the scheme.154
Support for entrepreneurs can extend beyond funding. For example, PwC commented on entrepreneurship leave in France in a 2013 report:
In France, an innovative law fosters entrepreneurship by allowing employees to take up to two years of leave from their company to start their own business or work in another job part-time. At the end of the ‘entrepreneurship leave’, the employee can choose to return to their previous job or if all goes well, continue with their own business.155
From an Australian State perspective, implementation of such a scheme would only apply to the public sector.
PwC also commented on the need to create a strong cultural environment that would allow entrepreneurs to thrive. While the NSW Government is taking steps to create such an environment, PwC nevertheless noted that systemic fear of failure is a major impediment to startup activity in Australia, despite the nation having one of the best regulatory environments for entrepreneurship, along with an engaged and strengthening culture of inclusion and openness.156
150 Ibid pp 30-1. 151 PwC, The Startup Economy, April 2013, p 5. 152 AngelCoFund, n.d. 153 Startup Loans, FAQs, 2013. 154 House of Commons Library, Business support schemes – statistics, 4 September 2014, p 2. 155 PwC, note 151, p 19. 156 Ibid p 13.
Future workforce trends in NSW: Emerging technologies and their potential impact
53
7.4.3 Inclusive growth
Concern over the polarisation of global workforces has led to calls for inclusive growth, a concept that “emphasises the importance of the interdependence of social inclusion and economic growth”.157
According to Smyth, inclusive growth considers expenditure on key social services to be an investment in human capital, which subsequently produces a range of economic benefits, such as increased productivity and participation.158
There are many policy proposals that can be included within an inclusive growth framework.159 Citigroup has summarised a selection of key policy proposals intended to facilitate inclusive growth in developed countries:160
• Undertaking tax reform to shift tax burdens from labour towards consumption. Proposed reforms include reductions in income and payroll taxes to make it cheaper to hire workers, or the implementation of a luxury tax on positional goods161;
• Encouraging entrepreneurial risk-taking by reducing red tape and promoting self-employment, but also building welfare systems that cap the downside to entrepreneurial failure;
• Ongoing and increased investment in skills and training for workers; and • Public investment in promising technologies for the future, which could
help facilitate new job creation in a range of industries.
Many of these policies are being considered by both State and Commonwealth Governments,162 and some have already been announced (for example, the Bays Precinct redevelopment in NSW).
For an inclusive growth framework to be successful, all stakeholders must play a role in its implementation. In its 2015 report on inclusive growth, the OECD summarises the challenges that lie ahead:
For Inclusive Growth to work well, appropriate institutions are needed, and citizens must feel that they can trust them. New technologies can play an important role in strengthening inclusiveness in policy making and implementation, by enabling new forms of collaborative and participatory
157 P Smyth, J Buchanan, Inclusive growth in Australia: Social policy as economic investment
(Allen & Unwin, 2013) p xiv. 158 P Smyth, ‘Social investment, inclusive growth and the Australian way’ in P Smyth, J
Buchanan, Inclusive growth in Australia: Social policy as economic investment (Allen & Unwin, 2013) 19.
159 For a full list of inclusive growth policy proposals for Australia, see Smyth and Buchanan, note 157.
160 Citigroup, note 2, pp 88-9. 161 Goods that function as status symbols, signalling their owners' high relative standing within
society. See Investopedia, Positional Goods, n.d. 162 For example, see K Murphy, ‘Turnbull pledges 'no disadvantage' for most vulnerable in tax
overhaul’, The Guardian Australia (online), 2 November 2015.

NSW Parliamentary Research Service
54
governance. Inclusive policy making and service delivery requires an effective decentralisation of policies which allows for better targeted, place-based approaches.
An inclusive policy process should be inclusive across the policy cycle, requiring effective and representative citizen participation and mechanisms to curb the undue influence of money and power.163
163 OECD, All on Board: Making Inclusive Growth Happen, May 2015, p 13.
Future workforce trends in NSW: Emerging technologies and their potential impact
55
8. CONCLUSION
Such technological trends as cloud computing, Big Data and advanced machine learning techniques have the potential to transform not only entire occupations, but whole industries. In particular, the combination of machine learning innovations with massive amounts of relevant data from almost any possible source could provide computers with the capacity to replace human workers in occupations that were hitherto considered beyond the scope of machines.
Research suggests that the potential impact of emerging technology is substantial, with two out of every five workers in both NSW and Australia employed in a job with a high risk of being computerised. Low skilled workers are most vulnerable to these radical changes, but many middle skill workers who perform predominantly routine tasks may also be caught up in the technological disruption.
This paper’s analysis of computerisation by NSW electorate highlights the regions of the State most vulnerable to computerisation: namely, areas with large numbers of workers that perform either routine or certain types of non-routine tasks as part of their jobs. In contrast, workers in areas least vulnerable to computerisation work predominantly in jobs where perception and manipulation, creative intelligence and/or social intelligence tasks are key elements of their work.
Despite these seemingly grim findings, it is unlikely that two-fifths of the NSW workforce will become unemployed within a decade or two. As has happened in the past, new technologies bring many positive developments to society, including economic prosperity, new types of work, and an increasingly educated (and potentially happier) workforce. On balance, the net gain from technology is likely to outweigh the negative consequences of change.
Australian governments, businesses and other stakeholders recognise the need to implement policies that help smooth the transition into the new world of work. Although a number of policies are already being implemented in Australia at both the State and Commonwealth levels, there have also been calls for more far-reaching reforms to manage this transition. Increased education, particularly in the STEM fields, has been strongly advocated by many experts; other policies addressing unemployment, taxation for startup companies, and inclusive growth have also been proposed.
It is unclear exactly what will occur in NSW, Australia and the wider world as new technologies transform workplaces and workforces. Nevertheless, current trends signal dramatic changes on the horizon. If the benefits are to be maximised and the potential pain minimised, policymakers will need to address these challenges, thinking creatively, drawing on present trends and future possibilities.
NSW Parliamentary Research Service
56
APPENDIX A: METHODOLOGY FOR ASSESSING COMPUTERISATION IMPACT ON NSW
This section outlines the methodology used to assess the predicted impact of computerisation on NSW. The author wishes to acknowledge Professor Hugh Durrant-Whyte and CEDA for providing the NSW Parliamentary Research Service with some of the data.
The analysis uses CEDA estimates for the susceptibility of Australian occupations to computerisation. CEDA determined the probability of susceptibility for 391 ANZSCO occupation codes, the lowest aggregation level for occupations.164 In turn, CEDA’s estimates were based on the methodology and initial data used in the 2013 paper by Frey and Osborne.165
1) Determining the probability of computerisation of NSW jobs by ANSZCO occupation code
To create a distribution graph showing each NSW occupation by probability of computerisation, CEDA’s probability of computerisation per ANZSCO occupation code was multiplied by the total number of NSW workers in the corresponding occupation. Employment data was derived from the 2011 Census, counting persons by place of usual residence.
Note that total workforce figures used in this analysis differ from the total NSW workforce figures in the 2011 Census. This is because CEDA was unable to map a number of US job codes to Australian ANSZCO occupation codes; these jobs have not been included in either the CEDA study or this analysis. Additionally, the Census occupation categories “Inadequately described” and “Not stated” were not included in this paper’s analysis.
This gave an approximate number of jobs within each occupation that may face computerisation. This data was then charted in Figure 14, and used as a base for the subsequent analysis of computerisation by Major Group (step 2a). A similar process was used to determine the probability of computerisation for NSW State Electorates (step 2b).
2a) Determining the probability of computerisation of NSW jobs by ANSZCO Major Group
Following step 1, the number of jobs facing computerisation within each occupation was aggregated into their relevant ANZSCO Major Group. The total for each Major Group was then divided by the total number of jobs within that Major Group in NSW, creating a weighted probability of computerisation. These probabilities were then used to chart Figures 12 and 13.
164 ANZSCO uses codes classified into the following aggregation levels: Major; Sub-major;
Minor; Unit and Occupation. For further information see Australian Bureau of Statistics, Census Dictionary, 2011, Cat No 2901.0.
165 See chapter 5.2 of this paper.
Future workforce trends in NSW: Emerging technologies and their potential impact
57
To determine a weighted probability for the whole of NSW (see chapter 6.2), the number of jobs facing computerisation within each occupation was aggregated together to create a total for the whole State workforce. This total was then divided by the total number of jobs in NSW, creating a weighted probability of computerisation for the State.
2b) Determining the probability of computerisation of jobs by NSW State Electoral Division and ANSZCO Major Group
For each NSW State Electoral Division (SED), CEDA’s probability of computerisation per ANZSCO occupation code was multiplied by the number of people employed in the corresponding occupation. This total was then divided by the total number of jobs in the SED, creating a weighted probability of computerisation for the SED. The data for all 93 SEDs (the probability dataset) was used to create the maps depicted in Figures 15-18 (see chapter 6.2). The process of mapping the probability dataset is explained in step 3.
3) Mapping the probability of computerisation jobs by NSW State Electoral Division
The predicted impact of computerisation for each SED was represented on a map of NSW using the CartoDB web mapping platform, as follows:
1. The CartoDB platform allows custom datasets to be overlaid on pre-existing maps. The following datasets were uploaded in order to map job computerisation by SED:
a. The weighted probabilities of computerisation by SED (probability dataset);
b. Two electoral boundary datasets: i. The official NSW Electoral Commission SED boundaries (SED
dataset) using the 2013 redistribution. The SED dataset incorporates waterways, making it difficult to identify individual electorates in relation to geographic features. This is particularly noticeable in Greater Sydney, with a number of electorates bordering each other across Port Jackson or Botany Bay;
ii. An approximation of the NSW SED boundaries based on ABS Statistical Areas Level 1 (SA1 dataset). The SA1 dataset bears a close, but not exact, correspondence to the official boundaries. It does not include waterways, making it easier to identify electorates relative to geographic features like Port Jackson.
2. Each boundary dataset was combined with the probability dataset, and each combined dataset was used to create maps showing an approximate representation of job computerisation in each SED.
a. The SA1 dataset was used to create the Greater Sydney electorate map (Figure 15);
b. The SED dataset was used to create maps for the Hunter & Central Coast, Illawarra, and Regional NSW (Figure 16-18).
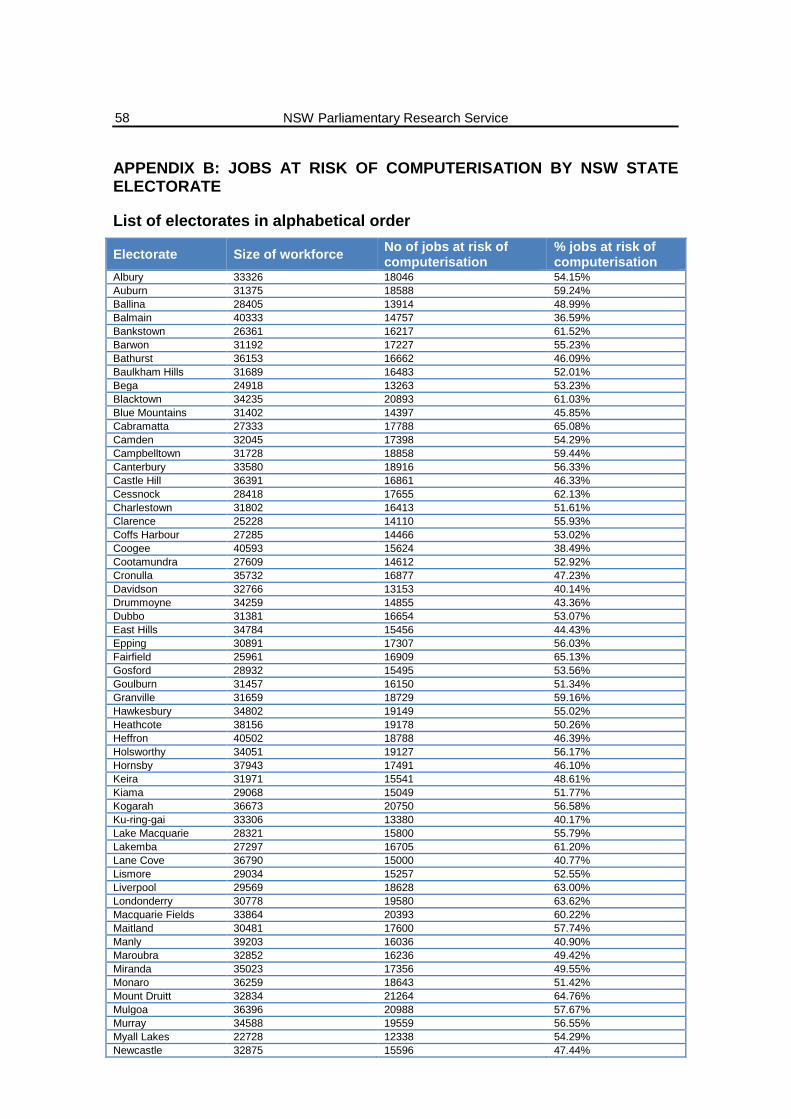
NSW Parliamentary Research Service
58
APPENDIX B: JOBS AT RISK OF COMPUTERISATION BY NSW STATE ELECTORATE
List of electorates in alphabetical order
Electorate Size of workforce No of jobs at risk of computerisation
% jobs at risk of computerisation
Albury 33326 18046 54.15% Auburn 31375 18588 59.24% Ballina 28405 13914 48.99% Balmain 40333 14757 36.59% Bankstown 26361 16217 61.52% Barwon 31192 17227 55.23% Bathurst 36153 16662 46.09% Baulkham Hills 31689 16483 52.01% Bega 24918 13263 53.23% Blacktown 34235 20893 61.03% Blue Mountains 31402 14397 45.85% Cabramatta 27333 17788 65.08% Camden 32045 17398 54.29% Campbelltown 31728 18858 59.44% Canterbury 33580 18916 56.33% Castle Hill 36391 16861 46.33% Cessnock 28418 17655 62.13% Charlestown 31802 16413 51.61% Clarence 25228 14110 55.93% Coffs Harbour 27285 14466 53.02% Coogee 40593 15624 38.49% Cootamundra 27609 14612 52.92% Cronulla 35732 16877 47.23% Davidson 32766 13153 40.14% Drummoyne 34259 14855 43.36% Dubbo 31381 16654 53.07% East Hills 34784 15456 44.43% Epping 30891 17307 56.03% Fairfield 25961 16909 65.13% Gosford 28932 15495 53.56% Goulburn 31457 16150 51.34% Granville 31659 18729 59.16% Hawkesbury 34802 19149 55.02% Heathcote 38156 19178 50.26% Heffron 40502 18788 46.39% Holsworthy 34051 19127 56.17% Hornsby 37943 17491 46.10% Keira 31971 15541 48.61% Kiama 29068 15049 51.77% Kogarah 36673 20750 56.58% Ku-ring-gai 33306 13380 40.17% Lake Macquarie 28321 15800 55.79% Lakemba 27297 16705 61.20% Lane Cove 36790 15000 40.77% Lismore 29034 15257 52.55% Liverpool 29569 18628 63.00% Londonderry 30778 19580 63.62% Macquarie Fields 33864 20393 60.22% Maitland 30481 17600 57.74% Manly 39203 16036 40.90% Maroubra 32852 16236 49.42% Miranda 35023 17356 49.55% Monaro 36259 18643 51.42% Mount Druitt 32834 21264 64.76% Mulgoa 36396 20988 57.67% Murray 34588 19559 56.55% Myall Lakes 22728 12338 54.29% Newcastle 32875 15596 47.44%
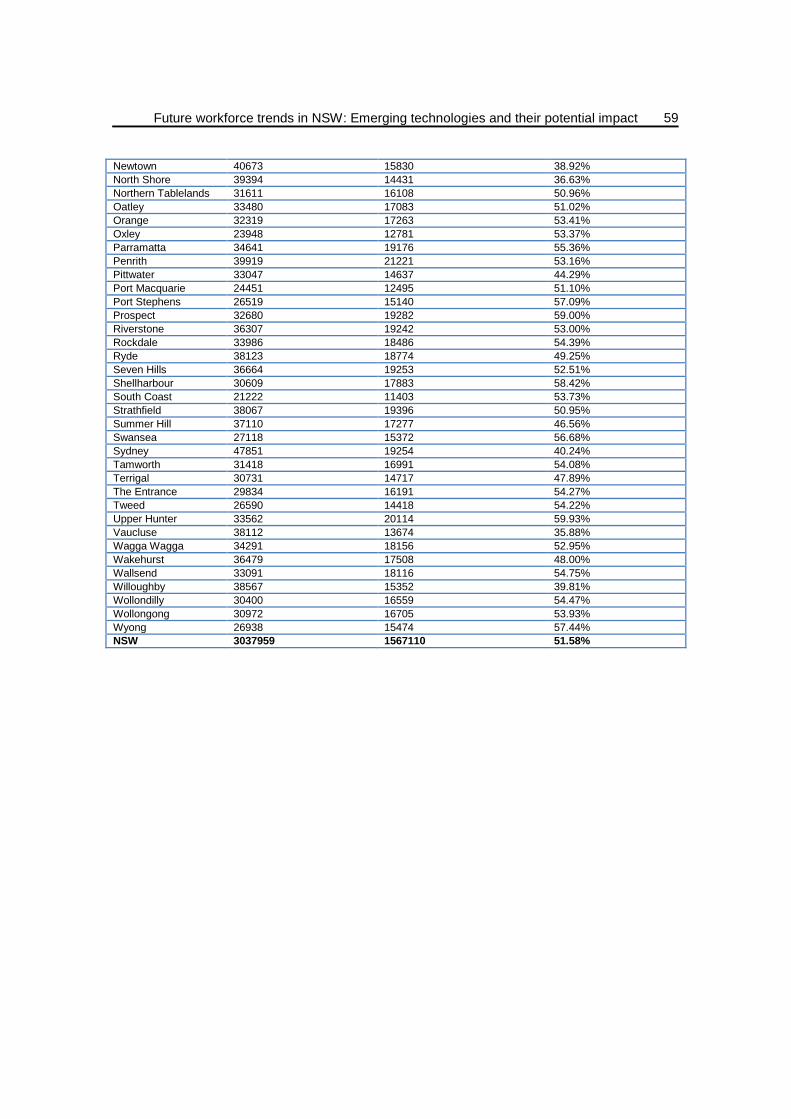
Future workforce trends in NSW: Emerging technologies and their potential impact
59
Newtown 40673 15830 38.92% North Shore 39394 14431 36.63% Northern Tablelands 31611 16108 50.96% Oatley 33480 17083 51.02% Orange 32319 17263 53.41% Oxley 23948 12781 53.37% Parramatta 34641 19176 55.36% Penrith 39919 21221 53.16% Pittwater 33047 14637 44.29% Port Macquarie 24451 12495 51.10% Port Stephens 26519 15140 57.09% Prospect 32680 19282 59.00% Riverstone 36307 19242 53.00% Rockdale 33986 18486 54.39% Ryde 38123 18774 49.25% Seven Hills 36664 19253 52.51% Shellharbour 30609 17883 58.42% South Coast 21222 11403 53.73% Strathfield 38067 19396 50.95% Summer Hill 37110 17277 46.56% Swansea 27118 15372 56.68% Sydney 47851 19254 40.24% Tamworth 31418 16991 54.08% Terrigal 30731 14717 47.89% The Entrance 29834 16191 54.27% Tweed 26590 14418 54.22% Upper Hunter 33562 20114 59.93% Vaucluse 38112 13674 35.88% Wagga Wagga 34291 18156 52.95% Wakehurst 36479 17508 48.00% Wallsend 33091 18116 54.75% Willoughby 38567 15352 39.81% Wollondilly 30400 16559 54.47% Wollongong 30972 16705 53.93% Wyong 26938 15474 57.44% NSW 3037959 1567110 51.58%
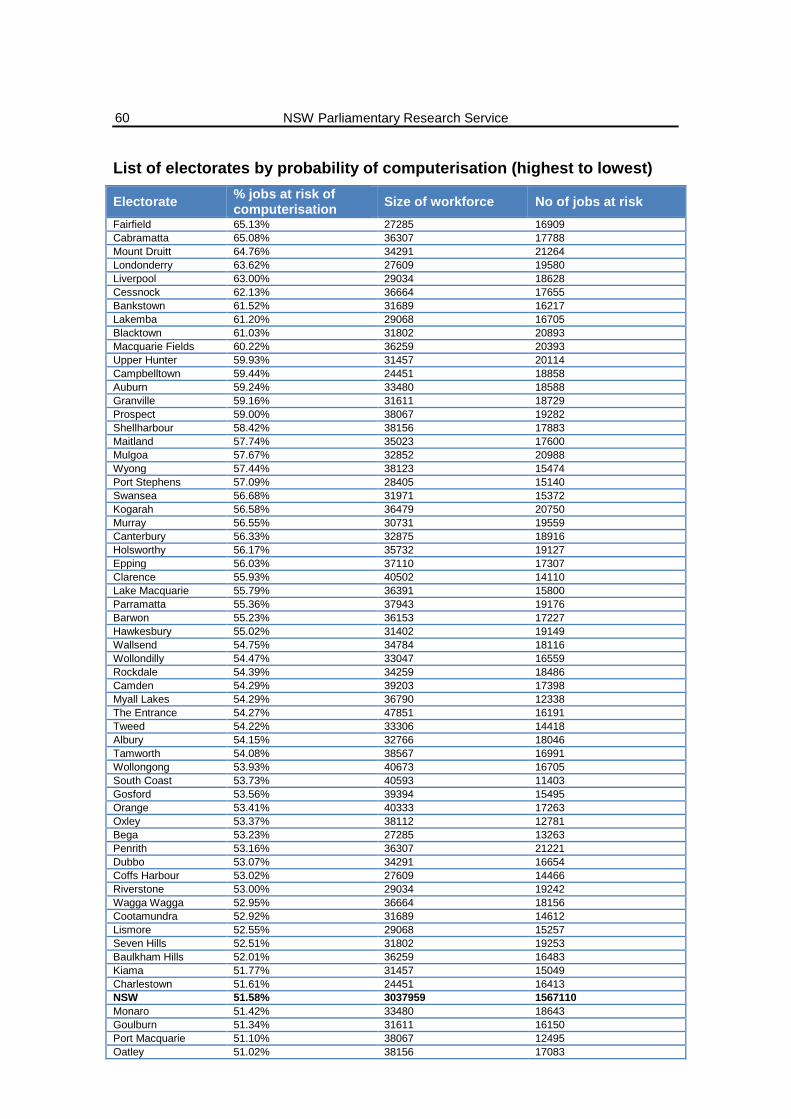
NSW Parliamentary Research Service
60
List of electorates by probability of computerisation (highest to lowest)
Electorate % jobs at risk of computerisation Size of workforce No of jobs at risk
Fairfield 65.13% 27285 16909 Cabramatta 65.08% 36307 17788 Mount Druitt 64.76% 34291 21264 Londonderry 63.62% 27609 19580 Liverpool 63.00% 29034 18628 Cessnock 62.13% 36664 17655 Bankstown 61.52% 31689 16217 Lakemba 61.20% 29068 16705 Blacktown 61.03% 31802 20893 Macquarie Fields 60.22% 36259 20393 Upper Hunter 59.93% 31457 20114 Campbelltown 59.44% 24451 18858 Auburn 59.24% 33480 18588 Granville 59.16% 31611 18729 Prospect 59.00% 38067 19282 Shellharbour 58.42% 38156 17883 Maitland 57.74% 35023 17600 Mulgoa 57.67% 32852 20988 Wyong 57.44% 38123 15474 Port Stephens 57.09% 28405 15140 Swansea 56.68% 31971 15372 Kogarah 56.58% 36479 20750 Murray 56.55% 30731 19559 Canterbury 56.33% 32875 18916 Holsworthy 56.17% 35732 19127 Epping 56.03% 37110 17307 Clarence 55.93% 40502 14110 Lake Macquarie 55.79% 36391 15800 Parramatta 55.36% 37943 19176 Barwon 55.23% 36153 17227 Hawkesbury 55.02% 31402 19149 Wallsend 54.75% 34784 18116 Wollondilly 54.47% 33047 16559 Rockdale 54.39% 34259 18486 Camden 54.29% 39203 17398 Myall Lakes 54.29% 36790 12338 The Entrance 54.27% 47851 16191 Tweed 54.22% 33306 14418 Albury 54.15% 32766 18046 Tamworth 54.08% 38567 16991 Wollongong 53.93% 40673 16705 South Coast 53.73% 40593 11403 Gosford 53.56% 39394 15495 Orange 53.41% 40333 17263 Oxley 53.37% 38112 12781 Bega 53.23% 27285 13263 Penrith 53.16% 36307 21221 Dubbo 53.07% 34291 16654 Coffs Harbour 53.02% 27609 14466 Riverstone 53.00% 29034 19242 Wagga Wagga 52.95% 36664 18156 Cootamundra 52.92% 31689 14612 Lismore 52.55% 29068 15257 Seven Hills 52.51% 31802 19253 Baulkham Hills 52.01% 36259 16483 Kiama 51.77% 31457 15049 Charlestown 51.61% 24451 16413 NSW 51.58% 3037959 1567110 Monaro 51.42% 33480 18643 Goulburn 51.34% 31611 16150 Port Macquarie 51.10% 38067 12495 Oatley 51.02% 38156 17083
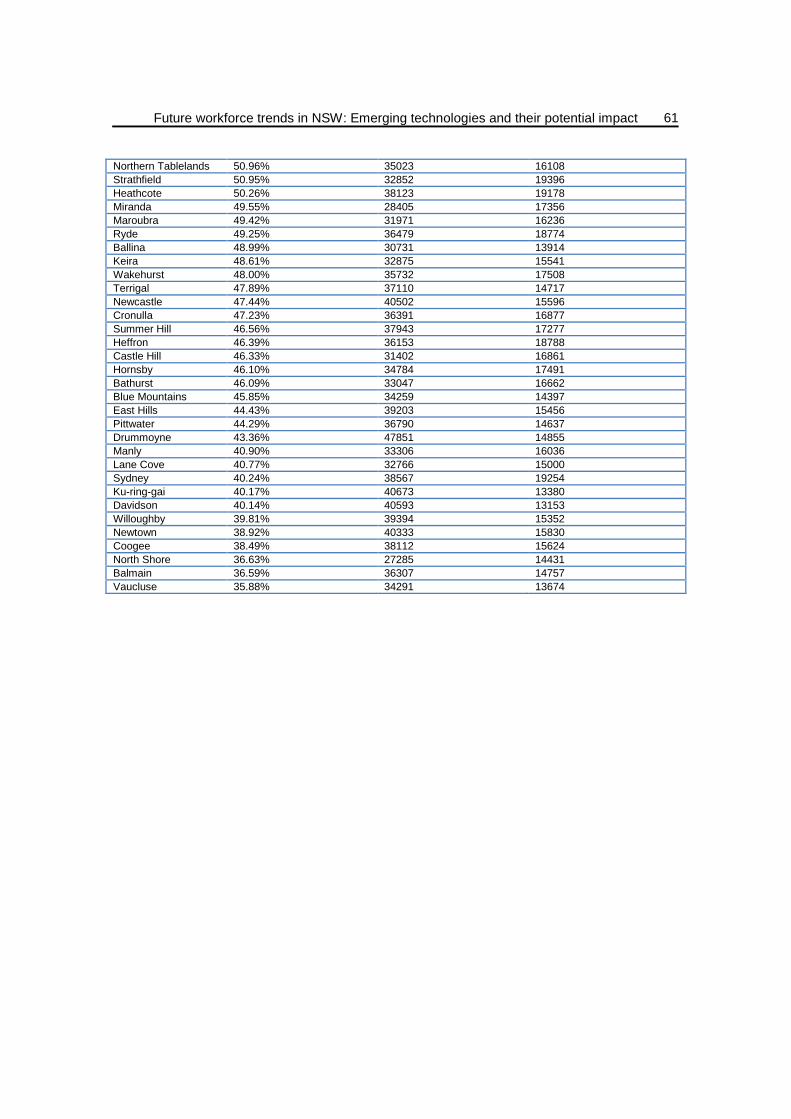
Future workforce trends in NSW: Emerging technologies and their potential impact
61
Northern Tablelands 50.96% 35023 16108 Strathfield 50.95% 32852 19396 Heathcote 50.26% 38123 19178 Miranda 49.55% 28405 17356 Maroubra 49.42% 31971 16236 Ryde 49.25% 36479 18774 Ballina 48.99% 30731 13914 Keira 48.61% 32875 15541 Wakehurst 48.00% 35732 17508 Terrigal 47.89% 37110 14717 Newcastle 47.44% 40502 15596 Cronulla 47.23% 36391 16877 Summer Hill 46.56% 37943 17277 Heffron 46.39% 36153 18788 Castle Hill 46.33% 31402 16861 Hornsby 46.10% 34784 17491 Bathurst 46.09% 33047 16662 Blue Mountains 45.85% 34259 14397 East Hills 44.43% 39203 15456 Pittwater 44.29% 36790 14637 Drummoyne 43.36% 47851 14855 Manly 40.90% 33306 16036 Lane Cove 40.77% 32766 15000 Sydney 40.24% 38567 19254 Ku-ring-gai 40.17% 40673 13380 Davidson 40.14% 40593 13153 Willoughby 39.81% 39394 15352 Newtown 38.92% 40333 15830 Coogee 38.49% 38112 15624 North Shore 36.63% 27285 14431 Balmain 36.59% 36307 14757 Vaucluse 35.88% 34291 13674
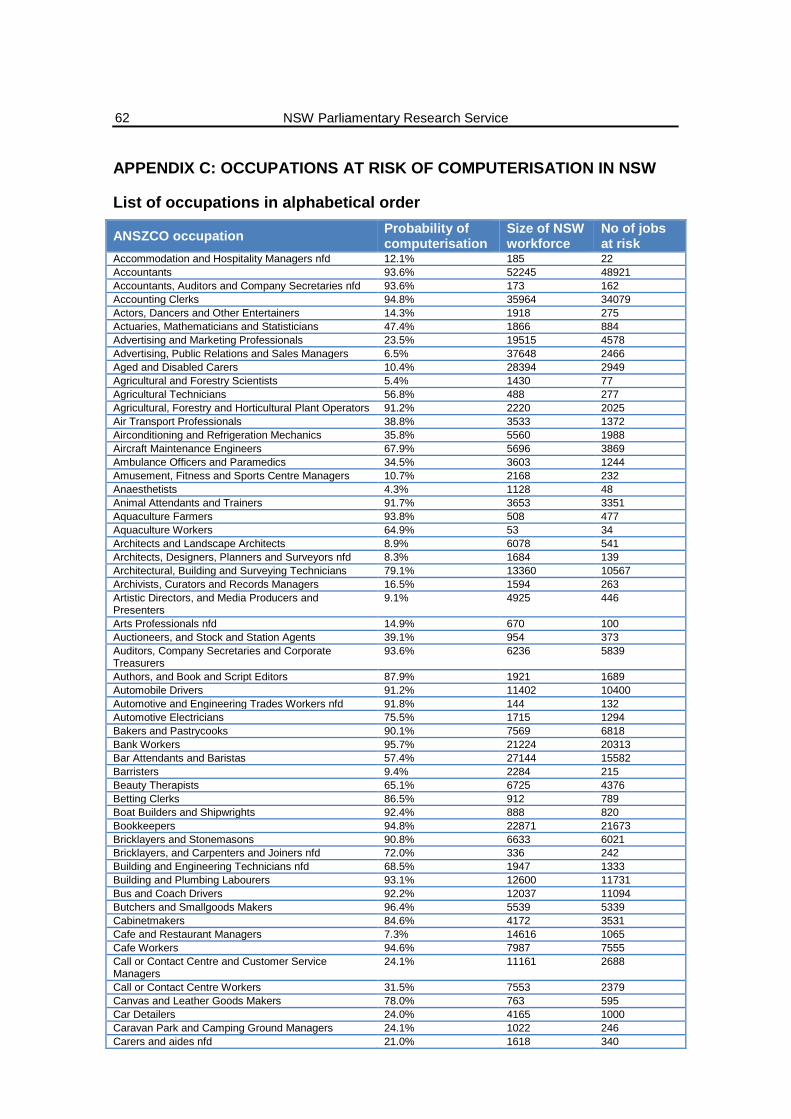
NSW Parliamentary Research Service
62
APPENDIX C: OCCUPATIONS AT RISK OF COMPUTERISATION IN NSW
List of occupations in alphabetical order
ANSZCO occupation Probability of computerisation
Size of NSW workforce
No of jobs at risk
Accommodation and Hospitality Managers nfd 12.1% 185 22 Accountants 93.6% 52245 48921 Accountants, Auditors and Company Secretaries nfd 93.6% 173 162 Accounting Clerks 94.8% 35964 34079 Actors, Dancers and Other Entertainers 14.3% 1918 275 Actuaries, Mathematicians and Statisticians 47.4% 1866 884 Advertising and Marketing Professionals 23.5% 19515 4578 Advertising, Public Relations and Sales Managers 6.5% 37648 2466 Aged and Disabled Carers 10.4% 28394 2949 Agricultural and Forestry Scientists 5.4% 1430 77 Agricultural Technicians 56.8% 488 277 Agricultural, Forestry and Horticultural Plant Operators 91.2% 2220 2025 Air Transport Professionals 38.8% 3533 1372 Airconditioning and Refrigeration Mechanics 35.8% 5560 1988 Aircraft Maintenance Engineers 67.9% 5696 3869 Ambulance Officers and Paramedics 34.5% 3603 1244 Amusement, Fitness and Sports Centre Managers 10.7% 2168 232 Anaesthetists 4.3% 1128 48 Animal Attendants and Trainers 91.7% 3653 3351 Aquaculture Farmers 93.8% 508 477 Aquaculture Workers 64.9% 53 34 Architects and Landscape Architects 8.9% 6078 541 Architects, Designers, Planners and Surveyors nfd 8.3% 1684 139 Architectural, Building and Surveying Technicians 79.1% 13360 10567 Archivists, Curators and Records Managers 16.5% 1594 263 Artistic Directors, and Media Producers and Presenters
9.1% 4925 446
Arts Professionals nfd 14.9% 670 100 Auctioneers, and Stock and Station Agents 39.1% 954 373 Auditors, Company Secretaries and Corporate Treasurers
93.6% 6236 5839
Authors, and Book and Script Editors 87.9% 1921 1689 Automobile Drivers 91.2% 11402 10400 Automotive and Engineering Trades Workers nfd 91.8% 144 132 Automotive Electricians 75.5% 1715 1294 Bakers and Pastrycooks 90.1% 7569 6818 Bank Workers 95.7% 21224 20313 Bar Attendants and Baristas 57.4% 27144 15582 Barristers 9.4% 2284 215 Beauty Therapists 65.1% 6725 4376 Betting Clerks 86.5% 912 789 Boat Builders and Shipwrights 92.4% 888 820 Bookkeepers 94.8% 22871 21673 Bricklayers and Stonemasons 90.8% 6633 6021 Bricklayers, and Carpenters and Joiners nfd 72.0% 336 242 Building and Engineering Technicians nfd 68.5% 1947 1333 Building and Plumbing Labourers 93.1% 12600 11731 Bus and Coach Drivers 92.2% 12037 11094 Butchers and Smallgoods Makers 96.4% 5539 5339 Cabinetmakers 84.6% 4172 3531 Cafe and Restaurant Managers 7.3% 14616 1065 Cafe Workers 94.6% 7987 7555 Call or Contact Centre and Customer Service Managers
24.1% 11161 2688
Call or Contact Centre Workers 31.5% 7553 2379 Canvas and Leather Goods Makers 78.0% 763 595 Car Detailers 24.0% 4165 1000 Caravan Park and Camping Ground Managers 24.1% 1022 246 Carers and aides nfd 21.0% 1618 340
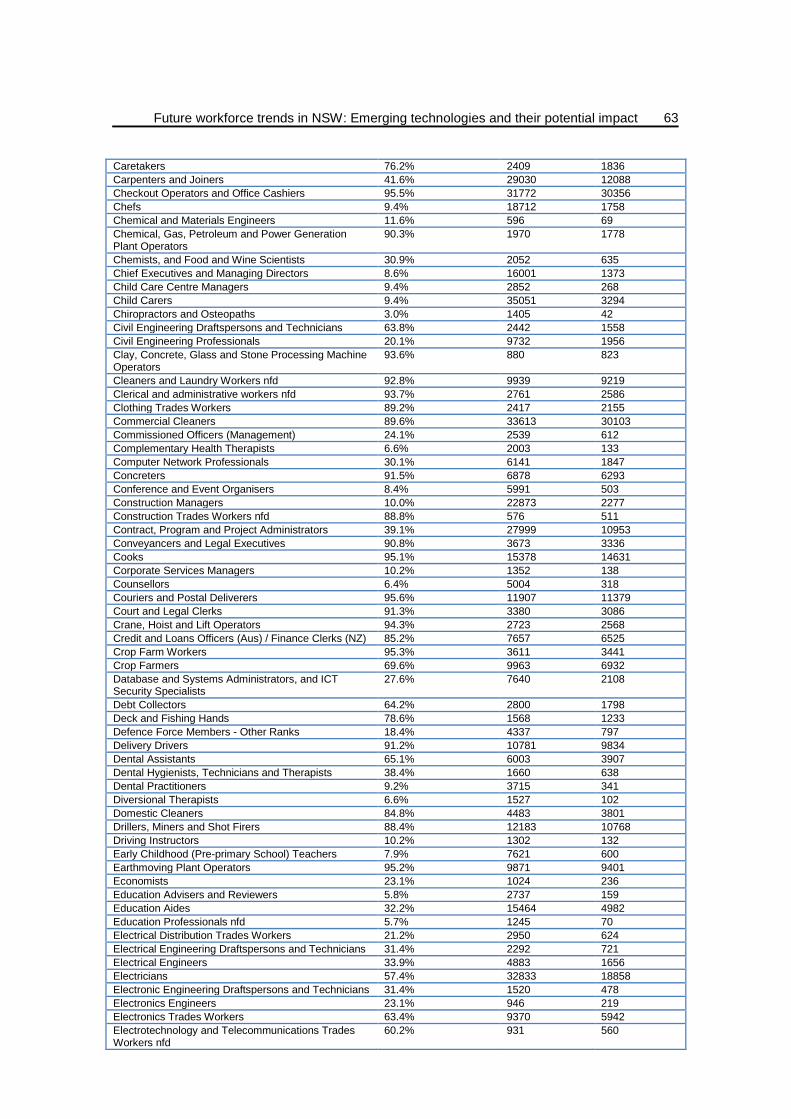
Future workforce trends in NSW: Emerging technologies and their potential impact
63
Caretakers 76.2% 2409 1836 Carpenters and Joiners 41.6% 29030 12088 Checkout Operators and Office Cashiers 95.5% 31772 30356 Chefs 9.4% 18712 1758 Chemical and Materials Engineers 11.6% 596 69 Chemical, Gas, Petroleum and Power Generation Plant Operators
90.3% 1970 1778
Chemists, and Food and Wine Scientists 30.9% 2052 635 Chief Executives and Managing Directors 8.6% 16001 1373 Child Care Centre Managers 9.4% 2852 268 Child Carers 9.4% 35051 3294 Chiropractors and Osteopaths 3.0% 1405 42 Civil Engineering Draftspersons and Technicians 63.8% 2442 1558 Civil Engineering Professionals 20.1% 9732 1956 Clay, Concrete, Glass and Stone Processing Machine Operators
93.6% 880 823
Cleaners and Laundry Workers nfd 92.8% 9939 9219 Clerical and administrative workers nfd 93.7% 2761 2586 Clothing Trades Workers 89.2% 2417 2155 Commercial Cleaners 89.6% 33613 30103 Commissioned Officers (Management) 24.1% 2539 612 Complementary Health Therapists 6.6% 2003 133 Computer Network Professionals 30.1% 6141 1847 Concreters 91.5% 6878 6293 Conference and Event Organisers 8.4% 5991 503 Construction Managers 10.0% 22873 2277 Construction Trades Workers nfd 88.8% 576 511 Contract, Program and Project Administrators 39.1% 27999 10953 Conveyancers and Legal Executives 90.8% 3673 3336 Cooks 95.1% 15378 14631 Corporate Services Managers 10.2% 1352 138 Counsellors 6.4% 5004 318 Couriers and Postal Deliverers 95.6% 11907 11379 Court and Legal Clerks 91.3% 3380 3086 Crane, Hoist and Lift Operators 94.3% 2723 2568 Credit and Loans Officers (Aus) / Finance Clerks (NZ) 85.2% 7657 6525 Crop Farm Workers 95.3% 3611 3441 Crop Farmers 69.6% 9963 6932 Database and Systems Administrators, and ICT Security Specialists
27.6% 7640 2108
Debt Collectors 64.2% 2800 1798 Deck and Fishing Hands 78.6% 1568 1233 Defence Force Members - Other Ranks 18.4% 4337 797 Delivery Drivers 91.2% 10781 9834 Dental Assistants 65.1% 6003 3907 Dental Hygienists, Technicians and Therapists 38.4% 1660 638 Dental Practitioners 9.2% 3715 341 Diversional Therapists 6.6% 1527 102 Domestic Cleaners 84.8% 4483 3801 Drillers, Miners and Shot Firers 88.4% 12183 10768 Driving Instructors 10.2% 1302 132 Early Childhood (Pre-primary School) Teachers 7.9% 7621 600 Earthmoving Plant Operators 95.2% 9871 9401 Economists 23.1% 1024 236 Education Advisers and Reviewers 5.8% 2737 159 Education Aides 32.2% 15464 4982 Education Professionals nfd 5.7% 1245 70 Electrical Distribution Trades Workers 21.2% 2950 624 Electrical Engineering Draftspersons and Technicians 31.4% 2292 721 Electrical Engineers 33.9% 4883 1656 Electricians 57.4% 32833 18858 Electronic Engineering Draftspersons and Technicians 31.4% 1520 478 Electronics Engineers 23.1% 946 219 Electronics Trades Workers 63.4% 9370 5942 Electrotechnology and Telecommunications Trades Workers nfd
60.2% 931 560
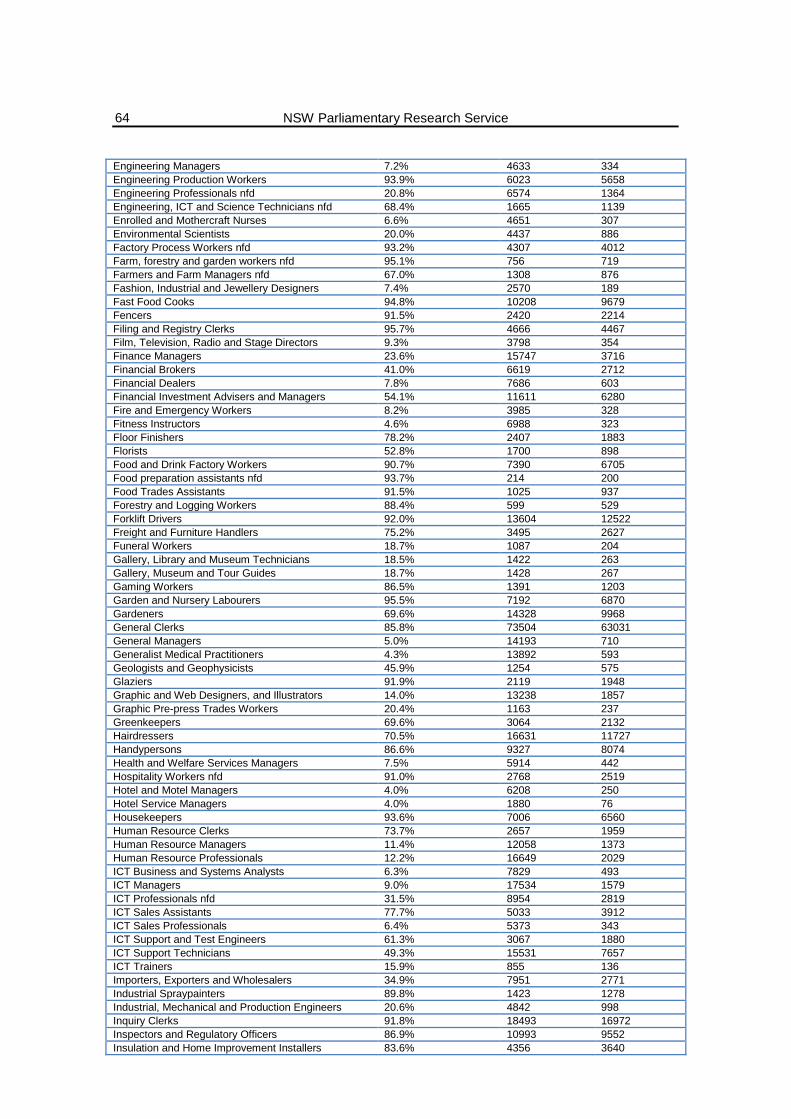
NSW Parliamentary Research Service
64
Engineering Managers 7.2% 4633 334 Engineering Production Workers 93.9% 6023 5658 Engineering Professionals nfd 20.8% 6574 1364 Engineering, ICT and Science Technicians nfd 68.4% 1665 1139 Enrolled and Mothercraft Nurses 6.6% 4651 307 Environmental Scientists 20.0% 4437 886 Factory Process Workers nfd 93.2% 4307 4012 Farm, forestry and garden workers nfd 95.1% 756 719 Farmers and Farm Managers nfd 67.0% 1308 876 Fashion, Industrial and Jewellery Designers 7.4% 2570 189 Fast Food Cooks 94.8% 10208 9679 Fencers 91.5% 2420 2214 Filing and Registry Clerks 95.7% 4666 4467 Film, Television, Radio and Stage Directors 9.3% 3798 354 Finance Managers 23.6% 15747 3716 Financial Brokers 41.0% 6619 2712 Financial Dealers 7.8% 7686 603 Financial Investment Advisers and Managers 54.1% 11611 6280 Fire and Emergency Workers 8.2% 3985 328 Fitness Instructors 4.6% 6988 323 Floor Finishers 78.2% 2407 1883 Florists 52.8% 1700 898 Food and Drink Factory Workers 90.7% 7390 6705 Food preparation assistants nfd 93.7% 214 200 Food Trades Assistants 91.5% 1025 937 Forestry and Logging Workers 88.4% 599 529 Forklift Drivers 92.0% 13604 12522 Freight and Furniture Handlers 75.2% 3495 2627 Funeral Workers 18.7% 1087 204 Gallery, Library and Museum Technicians 18.5% 1422 263 Gallery, Museum and Tour Guides 18.7% 1428 267 Gaming Workers 86.5% 1391 1203 Garden and Nursery Labourers 95.5% 7192 6870 Gardeners 69.6% 14328 9968 General Clerks 85.8% 73504 63031 General Managers 5.0% 14193 710 Generalist Medical Practitioners 4.3% 13892 593 Geologists and Geophysicists 45.9% 1254 575 Glaziers 91.9% 2119 1948 Graphic and Web Designers, and Illustrators 14.0% 13238 1857 Graphic Pre-press Trades Workers 20.4% 1163 237 Greenkeepers 69.6% 3064 2132 Hairdressers 70.5% 16631 11727 Handypersons 86.6% 9327 8074 Health and Welfare Services Managers 7.5% 5914 442 Hospitality Workers nfd 91.0% 2768 2519 Hotel and Motel Managers 4.0% 6208 250 Hotel Service Managers 4.0% 1880 76 Housekeepers 93.6% 7006 6560 Human Resource Clerks 73.7% 2657 1959 Human Resource Managers 11.4% 12058 1373 Human Resource Professionals 12.2% 16649 2029 ICT Business and Systems Analysts 6.3% 7829 493 ICT Managers 9.0% 17534 1579 ICT Professionals nfd 31.5% 8954 2819 ICT Sales Assistants 77.7% 5033 3912 ICT Sales Professionals 6.4% 5373 343 ICT Support and Test Engineers 61.3% 3067 1880 ICT Support Technicians 49.3% 15531 7657 ICT Trainers 15.9% 855 136 Importers, Exporters and Wholesalers 34.9% 7951 2771 Industrial Spraypainters 89.8% 1423 1278 Industrial, Mechanical and Production Engineers 20.6% 4842 998 Inquiry Clerks 91.8% 18493 16972 Inspectors and Regulatory Officers 86.9% 10993 9552 Insulation and Home Improvement Installers 83.6% 4356 3640
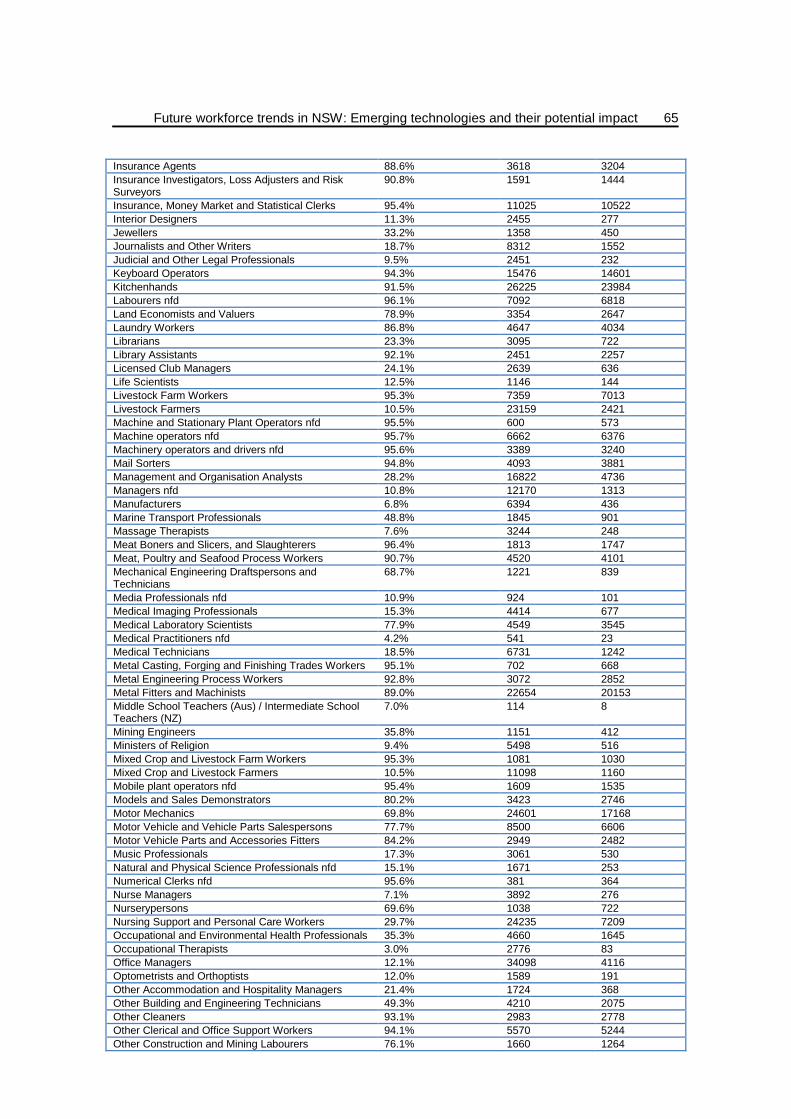
Future workforce trends in NSW: Emerging technologies and their potential impact
65
Insurance Agents 88.6% 3618 3204 Insurance Investigators, Loss Adjusters and Risk Surveyors
90.8% 1591 1444
Insurance, Money Market and Statistical Clerks 95.4% 11025 10522 Interior Designers 11.3% 2455 277 Jewellers 33.2% 1358 450 Journalists and Other Writers 18.7% 8312 1552 Judicial and Other Legal Professionals 9.5% 2451 232 Keyboard Operators 94.3% 15476 14601 Kitchenhands 91.5% 26225 23984 Labourers nfd 96.1% 7092 6818 Land Economists and Valuers 78.9% 3354 2647 Laundry Workers 86.8% 4647 4034 Librarians 23.3% 3095 722 Library Assistants 92.1% 2451 2257 Licensed Club Managers 24.1% 2639 636 Life Scientists 12.5% 1146 144 Livestock Farm Workers 95.3% 7359 7013 Livestock Farmers 10.5% 23159 2421 Machine and Stationary Plant Operators nfd 95.5% 600 573 Machine operators nfd 95.7% 6662 6376 Machinery operators and drivers nfd 95.6% 3389 3240 Mail Sorters 94.8% 4093 3881 Management and Organisation Analysts 28.2% 16822 4736 Managers nfd 10.8% 12170 1313 Manufacturers 6.8% 6394 436 Marine Transport Professionals 48.8% 1845 901 Massage Therapists 7.6% 3244 248 Meat Boners and Slicers, and Slaughterers 96.4% 1813 1747 Meat, Poultry and Seafood Process Workers 90.7% 4520 4101 Mechanical Engineering Draftspersons and Technicians
68.7% 1221 839
Media Professionals nfd 10.9% 924 101 Medical Imaging Professionals 15.3% 4414 677 Medical Laboratory Scientists 77.9% 4549 3545 Medical Practitioners nfd 4.2% 541 23 Medical Technicians 18.5% 6731 1242 Metal Casting, Forging and Finishing Trades Workers 95.1% 702 668 Metal Engineering Process Workers 92.8% 3072 2852 Metal Fitters and Machinists 89.0% 22654 20153 Middle School Teachers (Aus) / Intermediate School Teachers (NZ)
7.0% 114 8
Mining Engineers 35.8% 1151 412 Ministers of Religion 9.4% 5498 516 Mixed Crop and Livestock Farm Workers 95.3% 1081 1030 Mixed Crop and Livestock Farmers 10.5% 11098 1160 Mobile plant operators nfd 95.4% 1609 1535 Models and Sales Demonstrators 80.2% 3423 2746 Motor Mechanics 69.8% 24601 17168 Motor Vehicle and Vehicle Parts Salespersons 77.7% 8500 6606 Motor Vehicle Parts and Accessories Fitters 84.2% 2949 2482 Music Professionals 17.3% 3061 530 Natural and Physical Science Professionals nfd 15.1% 1671 253 Numerical Clerks nfd 95.6% 381 364 Nurse Managers 7.1% 3892 276 Nurserypersons 69.6% 1038 722 Nursing Support and Personal Care Workers 29.7% 24235 7209 Occupational and Environmental Health Professionals 35.3% 4660 1645 Occupational Therapists 3.0% 2776 83 Office Managers 12.1% 34098 4116 Optometrists and Orthoptists 12.0% 1589 191 Other Accommodation and Hospitality Managers 21.4% 1724 368 Other Building and Engineering Technicians 49.3% 4210 2075 Other Cleaners 93.1% 2983 2778 Other Clerical and Office Support Workers 94.1% 5570 5244 Other Construction and Mining Labourers 76.1% 1660 1264
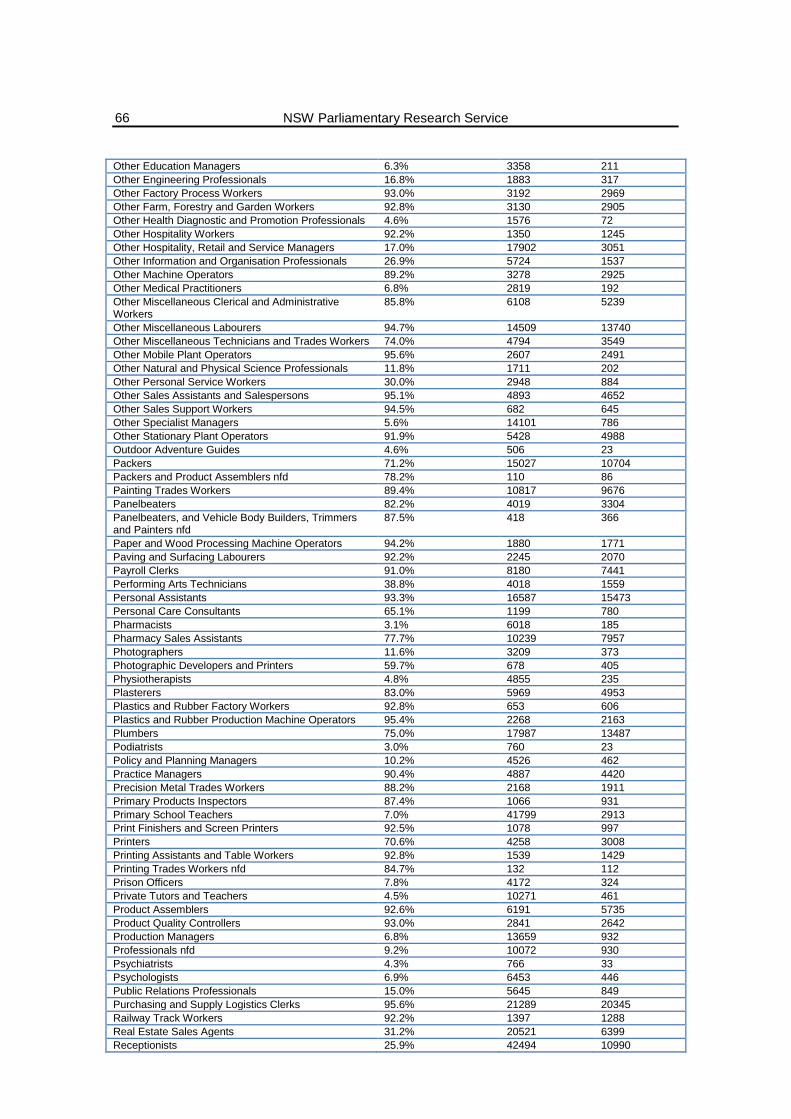
NSW Parliamentary Research Service
66
Other Education Managers 6.3% 3358 211 Other Engineering Professionals 16.8% 1883 317 Other Factory Process Workers 93.0% 3192 2969 Other Farm, Forestry and Garden Workers 92.8% 3130 2905 Other Health Diagnostic and Promotion Professionals 4.6% 1576 72 Other Hospitality Workers 92.2% 1350 1245 Other Hospitality, Retail and Service Managers 17.0% 17902 3051 Other Information and Organisation Professionals 26.9% 5724 1537 Other Machine Operators 89.2% 3278 2925 Other Medical Practitioners 6.8% 2819 192 Other Miscellaneous Clerical and Administrative Workers
85.8% 6108 5239
Other Miscellaneous Labourers 94.7% 14509 13740 Other Miscellaneous Technicians and Trades Workers 74.0% 4794 3549 Other Mobile Plant Operators 95.6% 2607 2491 Other Natural and Physical Science Professionals 11.8% 1711 202 Other Personal Service Workers 30.0% 2948 884 Other Sales Assistants and Salespersons 95.1% 4893 4652 Other Sales Support Workers 94.5% 682 645 Other Specialist Managers 5.6% 14101 786 Other Stationary Plant Operators 91.9% 5428 4988 Outdoor Adventure Guides 4.6% 506 23 Packers 71.2% 15027 10704 Packers and Product Assemblers nfd 78.2% 110 86 Painting Trades Workers 89.4% 10817 9676 Panelbeaters 82.2% 4019 3304 Panelbeaters, and Vehicle Body Builders, Trimmers and Painters nfd
87.5% 418 366
Paper and Wood Processing Machine Operators 94.2% 1880 1771 Paving and Surfacing Labourers 92.2% 2245 2070 Payroll Clerks 91.0% 8180 7441 Performing Arts Technicians 38.8% 4018 1559 Personal Assistants 93.3% 16587 15473 Personal Care Consultants 65.1% 1199 780 Pharmacists 3.1% 6018 185 Pharmacy Sales Assistants 77.7% 10239 7957 Photographers 11.6% 3209 373 Photographic Developers and Printers 59.7% 678 405 Physiotherapists 4.8% 4855 235 Plasterers 83.0% 5969 4953 Plastics and Rubber Factory Workers 92.8% 653 606 Plastics and Rubber Production Machine Operators 95.4% 2268 2163 Plumbers 75.0% 17987 13487 Podiatrists 3.0% 760 23 Policy and Planning Managers 10.2% 4526 462 Practice Managers 90.4% 4887 4420 Precision Metal Trades Workers 88.2% 2168 1911 Primary Products Inspectors 87.4% 1066 931 Primary School Teachers 7.0% 41799 2913 Print Finishers and Screen Printers 92.5% 1078 997 Printers 70.6% 4258 3008 Printing Assistants and Table Workers 92.8% 1539 1429 Printing Trades Workers nfd 84.7% 132 112 Prison Officers 7.8% 4172 324 Private Tutors and Teachers 4.5% 10271 461 Product Assemblers 92.6% 6191 5735 Product Quality Controllers 93.0% 2841 2642 Production Managers 6.8% 13659 932 Professionals nfd 9.2% 10072 930 Psychiatrists 4.3% 766 33 Psychologists 6.9% 6453 446 Public Relations Professionals 15.0% 5645 849 Purchasing and Supply Logistics Clerks 95.6% 21289 20345 Railway Track Workers 92.2% 1397 1288 Real Estate Sales Agents 31.2% 20521 6399 Receptionists 25.9% 42494 10990
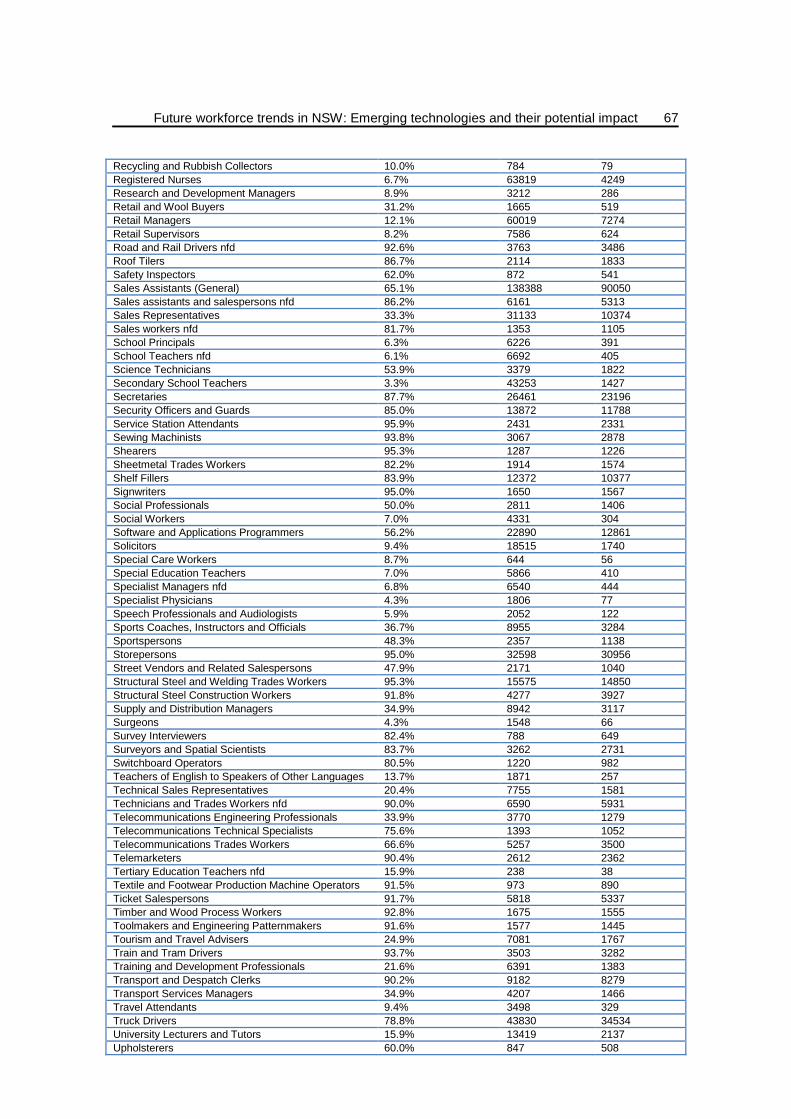
Future workforce trends in NSW: Emerging technologies and their potential impact
67
Recycling and Rubbish Collectors 10.0% 784 79 Registered Nurses 6.7% 63819 4249 Research and Development Managers 8.9% 3212 286 Retail and Wool Buyers 31.2% 1665 519 Retail Managers 12.1% 60019 7274 Retail Supervisors 8.2% 7586 624 Road and Rail Drivers nfd 92.6% 3763 3486 Roof Tilers 86.7% 2114 1833 Safety Inspectors 62.0% 872 541 Sales Assistants (General) 65.1% 138388 90050 Sales assistants and salespersons nfd 86.2% 6161 5313 Sales Representatives 33.3% 31133 10374 Sales workers nfd 81.7% 1353 1105 School Principals 6.3% 6226 391 School Teachers nfd 6.1% 6692 405 Science Technicians 53.9% 3379 1822 Secondary School Teachers 3.3% 43253 1427 Secretaries 87.7% 26461 23196 Security Officers and Guards 85.0% 13872 11788 Service Station Attendants 95.9% 2431 2331 Sewing Machinists 93.8% 3067 2878 Shearers 95.3% 1287 1226 Sheetmetal Trades Workers 82.2% 1914 1574 Shelf Fillers 83.9% 12372 10377 Signwriters 95.0% 1650 1567 Social Professionals 50.0% 2811 1406 Social Workers 7.0% 4331 304 Software and Applications Programmers 56.2% 22890 12861 Solicitors 9.4% 18515 1740 Special Care Workers 8.7% 644 56 Special Education Teachers 7.0% 5866 410 Specialist Managers nfd 6.8% 6540 444 Specialist Physicians 4.3% 1806 77 Speech Professionals and Audiologists 5.9% 2052 122 Sports Coaches, Instructors and Officials 36.7% 8955 3284 Sportspersons 48.3% 2357 1138 Storepersons 95.0% 32598 30956 Street Vendors and Related Salespersons 47.9% 2171 1040 Structural Steel and Welding Trades Workers 95.3% 15575 14850 Structural Steel Construction Workers 91.8% 4277 3927 Supply and Distribution Managers 34.9% 8942 3117 Surgeons 4.3% 1548 66 Survey Interviewers 82.4% 788 649 Surveyors and Spatial Scientists 83.7% 3262 2731 Switchboard Operators 80.5% 1220 982 Teachers of English to Speakers of Other Languages 13.7% 1871 257 Technical Sales Representatives 20.4% 7755 1581 Technicians and Trades Workers nfd 90.0% 6590 5931 Telecommunications Engineering Professionals 33.9% 3770 1279 Telecommunications Technical Specialists 75.6% 1393 1052 Telecommunications Trades Workers 66.6% 5257 3500 Telemarketers 90.4% 2612 2362 Tertiary Education Teachers nfd 15.9% 238 38 Textile and Footwear Production Machine Operators 91.5% 973 890 Ticket Salespersons 91.7% 5818 5337 Timber and Wood Process Workers 92.8% 1675 1555 Toolmakers and Engineering Patternmakers 91.6% 1577 1445 Tourism and Travel Advisers 24.9% 7081 1767 Train and Tram Drivers 93.7% 3503 3282 Training and Development Professionals 21.6% 6391 1383 Transport and Despatch Clerks 90.2% 9182 8279 Transport Services Managers 34.9% 4207 1466 Travel Attendants 9.4% 3498 329 Truck Drivers 78.8% 43830 34534 University Lecturers and Tutors 15.9% 13419 2137 Upholsterers 60.0% 847 508
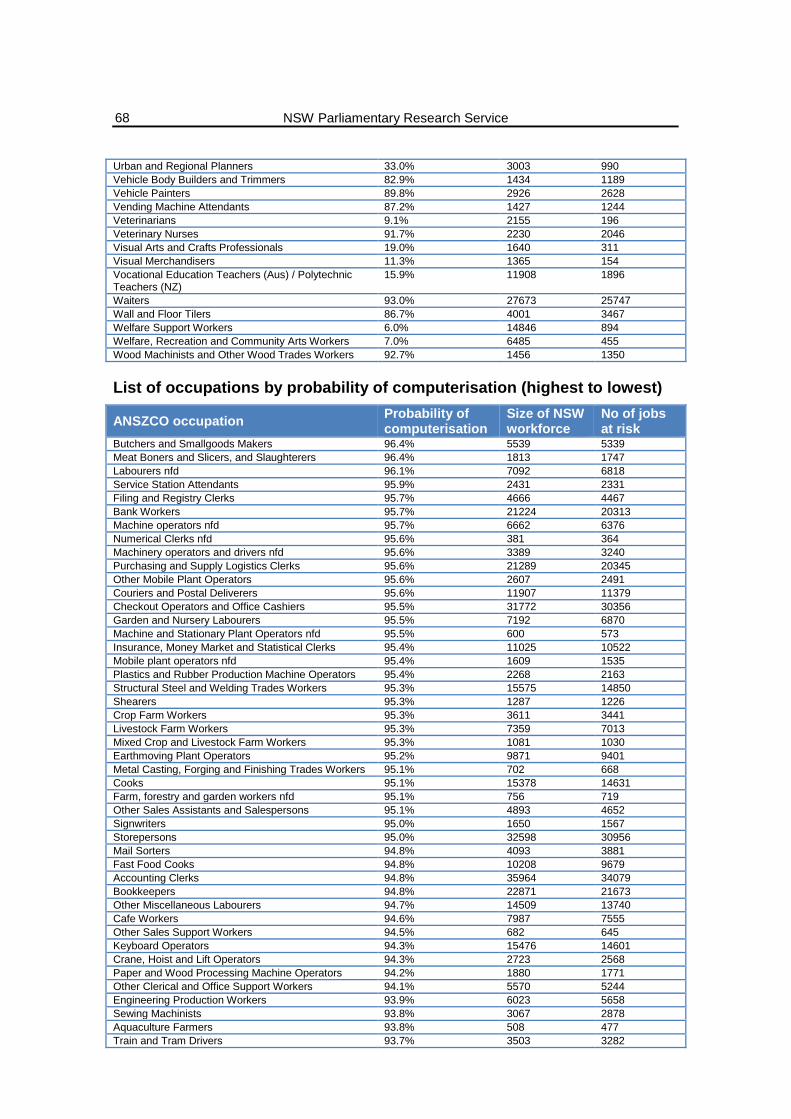
NSW Parliamentary Research Service
68
Urban and Regional Planners 33.0% 3003 990 Vehicle Body Builders and Trimmers 82.9% 1434 1189 Vehicle Painters 89.8% 2926 2628 Vending Machine Attendants 87.2% 1427 1244 Veterinarians 9.1% 2155 196 Veterinary Nurses 91.7% 2230 2046 Visual Arts and Crafts Professionals 19.0% 1640 311 Visual Merchandisers 11.3% 1365 154 Vocational Education Teachers (Aus) / Polytechnic Teachers (NZ)
15.9% 11908 1896
Waiters 93.0% 27673 25747 Wall and Floor Tilers 86.7% 4001 3467 Welfare Support Workers 6.0% 14846 894 Welfare, Recreation and Community Arts Workers 7.0% 6485 455 Wood Machinists and Other Wood Trades Workers 92.7% 1456 1350
List of occupations by probability of computerisation (highest to lowest)
ANSZCO occupation Probability of computerisation
Size of NSW workforce
No of jobs at risk
Butchers and Smallgoods Makers 96.4% 5539 5339 Meat Boners and Slicers, and Slaughterers 96.4% 1813 1747 Labourers nfd 96.1% 7092 6818 Service Station Attendants 95.9% 2431 2331 Filing and Registry Clerks 95.7% 4666 4467 Bank Workers 95.7% 21224 20313 Machine operators nfd 95.7% 6662 6376 Numerical Clerks nfd 95.6% 381 364 Machinery operators and drivers nfd 95.6% 3389 3240 Purchasing and Supply Logistics Clerks 95.6% 21289 20345 Other Mobile Plant Operators 95.6% 2607 2491 Couriers and Postal Deliverers 95.6% 11907 11379 Checkout Operators and Office Cashiers 95.5% 31772 30356 Garden and Nursery Labourers 95.5% 7192 6870 Machine and Stationary Plant Operators nfd 95.5% 600 573 Insurance, Money Market and Statistical Clerks 95.4% 11025 10522 Mobile plant operators nfd 95.4% 1609 1535 Plastics and Rubber Production Machine Operators 95.4% 2268 2163 Structural Steel and Welding Trades Workers 95.3% 15575 14850 Shearers 95.3% 1287 1226 Crop Farm Workers 95.3% 3611 3441 Livestock Farm Workers 95.3% 7359 7013 Mixed Crop and Livestock Farm Workers 95.3% 1081 1030 Earthmoving Plant Operators 95.2% 9871 9401 Metal Casting, Forging and Finishing Trades Workers 95.1% 702 668 Cooks 95.1% 15378 14631 Farm, forestry and garden workers nfd 95.1% 756 719 Other Sales Assistants and Salespersons 95.1% 4893 4652 Signwriters 95.0% 1650 1567 Storepersons 95.0% 32598 30956 Mail Sorters 94.8% 4093 3881 Fast Food Cooks 94.8% 10208 9679 Accounting Clerks 94.8% 35964 34079 Bookkeepers 94.8% 22871 21673 Other Miscellaneous Labourers 94.7% 14509 13740 Cafe Workers 94.6% 7987 7555 Other Sales Support Workers 94.5% 682 645 Keyboard Operators 94.3% 15476 14601 Crane, Hoist and Lift Operators 94.3% 2723 2568 Paper and Wood Processing Machine Operators 94.2% 1880 1771 Other Clerical and Office Support Workers 94.1% 5570 5244 Engineering Production Workers 93.9% 6023 5658 Sewing Machinists 93.8% 3067 2878 Aquaculture Farmers 93.8% 508 477 Train and Tram Drivers 93.7% 3503 3282
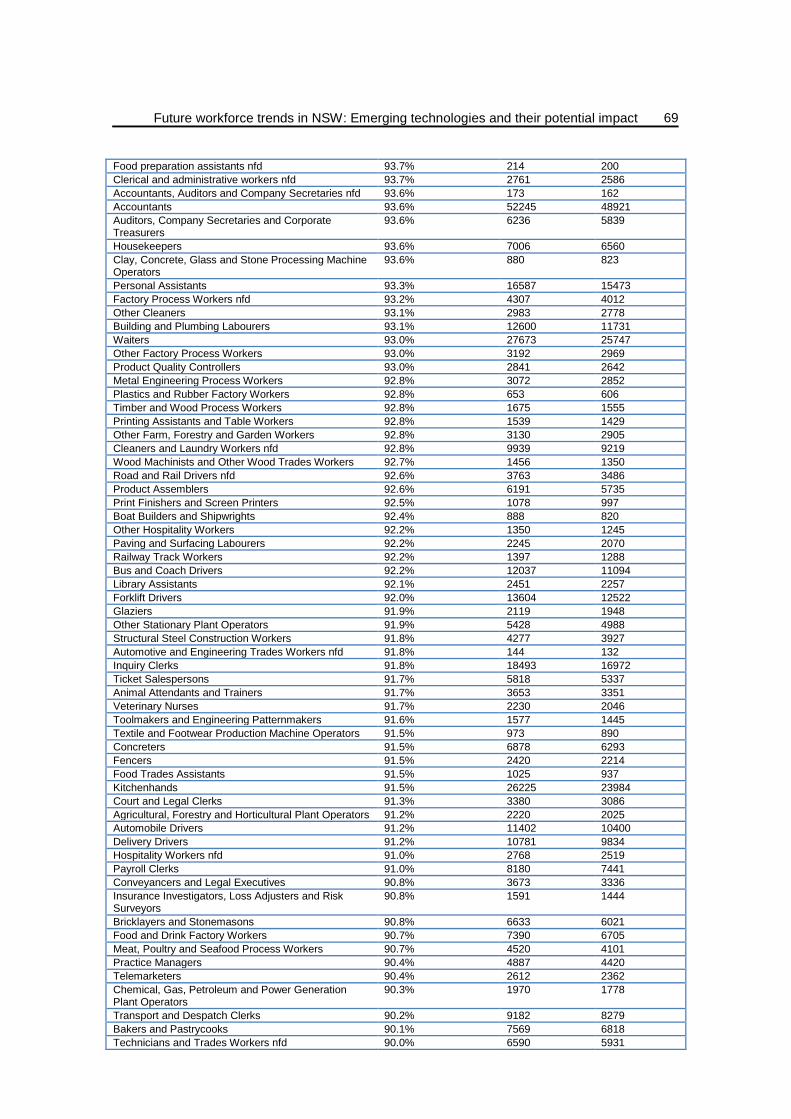
Future workforce trends in NSW: Emerging technologies and their potential impact
69
Food preparation assistants nfd 93.7% 214 200 Clerical and administrative workers nfd 93.7% 2761 2586 Accountants, Auditors and Company Secretaries nfd 93.6% 173 162 Accountants 93.6% 52245 48921 Auditors, Company Secretaries and Corporate Treasurers
93.6% 6236 5839
Housekeepers 93.6% 7006 6560 Clay, Concrete, Glass and Stone Processing Machine Operators
93.6% 880 823
Personal Assistants 93.3% 16587 15473 Factory Process Workers nfd 93.2% 4307 4012 Other Cleaners 93.1% 2983 2778 Building and Plumbing Labourers 93.1% 12600 11731 Waiters 93.0% 27673 25747 Other Factory Process Workers 93.0% 3192 2969 Product Quality Controllers 93.0% 2841 2642 Metal Engineering Process Workers 92.8% 3072 2852 Plastics and Rubber Factory Workers 92.8% 653 606 Timber and Wood Process Workers 92.8% 1675 1555 Printing Assistants and Table Workers 92.8% 1539 1429 Other Farm, Forestry and Garden Workers 92.8% 3130 2905 Cleaners and Laundry Workers nfd 92.8% 9939 9219 Wood Machinists and Other Wood Trades Workers 92.7% 1456 1350 Road and Rail Drivers nfd 92.6% 3763 3486 Product Assemblers 92.6% 6191 5735 Print Finishers and Screen Printers 92.5% 1078 997 Boat Builders and Shipwrights 92.4% 888 820 Other Hospitality Workers 92.2% 1350 1245 Paving and Surfacing Labourers 92.2% 2245 2070 Railway Track Workers 92.2% 1397 1288 Bus and Coach Drivers 92.2% 12037 11094 Library Assistants 92.1% 2451 2257 Forklift Drivers 92.0% 13604 12522 Glaziers 91.9% 2119 1948 Other Stationary Plant Operators 91.9% 5428 4988 Structural Steel Construction Workers 91.8% 4277 3927 Automotive and Engineering Trades Workers nfd 91.8% 144 132 Inquiry Clerks 91.8% 18493 16972 Ticket Salespersons 91.7% 5818 5337 Animal Attendants and Trainers 91.7% 3653 3351 Veterinary Nurses 91.7% 2230 2046 Toolmakers and Engineering Patternmakers 91.6% 1577 1445 Textile and Footwear Production Machine Operators 91.5% 973 890 Concreters 91.5% 6878 6293 Fencers 91.5% 2420 2214 Food Trades Assistants 91.5% 1025 937 Kitchenhands 91.5% 26225 23984 Court and Legal Clerks 91.3% 3380 3086 Agricultural, Forestry and Horticultural Plant Operators 91.2% 2220 2025 Automobile Drivers 91.2% 11402 10400 Delivery Drivers 91.2% 10781 9834 Hospitality Workers nfd 91.0% 2768 2519 Payroll Clerks 91.0% 8180 7441 Conveyancers and Legal Executives 90.8% 3673 3336 Insurance Investigators, Loss Adjusters and Risk Surveyors
90.8% 1591 1444
Bricklayers and Stonemasons 90.8% 6633 6021 Food and Drink Factory Workers 90.7% 7390 6705 Meat, Poultry and Seafood Process Workers 90.7% 4520 4101 Practice Managers 90.4% 4887 4420 Telemarketers 90.4% 2612 2362 Chemical, Gas, Petroleum and Power Generation Plant Operators
90.3% 1970 1778
Transport and Despatch Clerks 90.2% 9182 8279 Bakers and Pastrycooks 90.1% 7569 6818 Technicians and Trades Workers nfd 90.0% 6590 5931
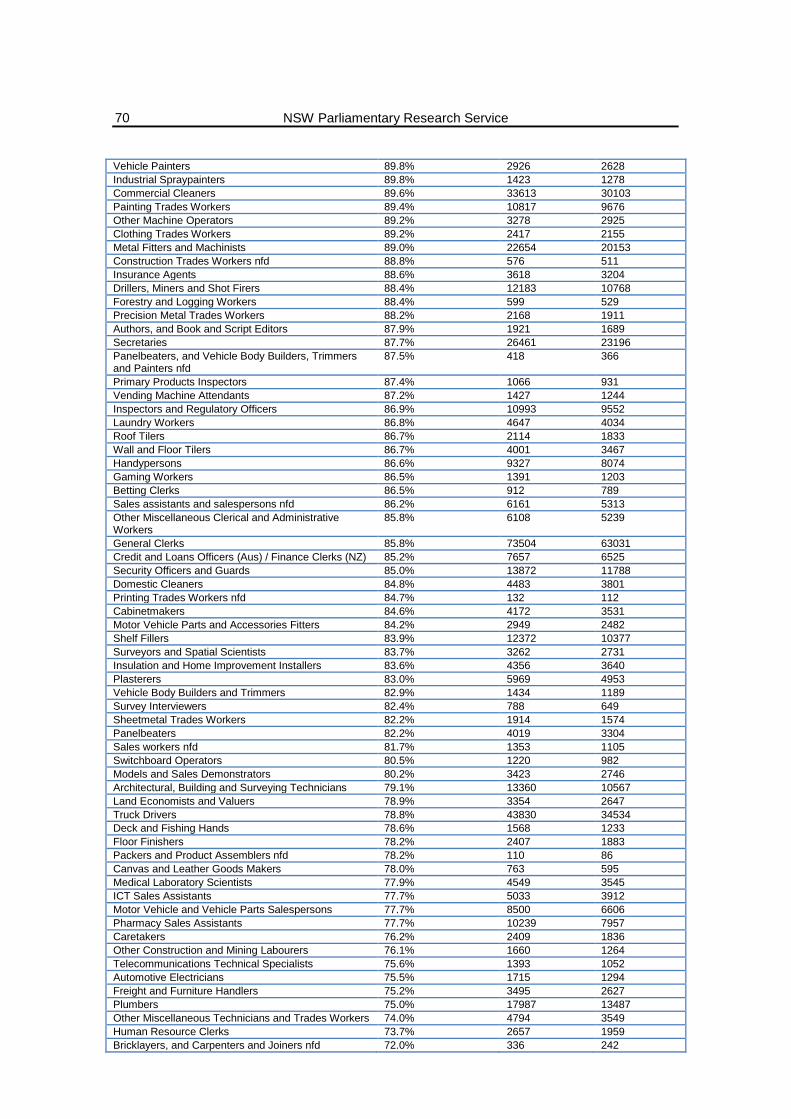
NSW Parliamentary Research Service
70
Vehicle Painters 89.8% 2926 2628 Industrial Spraypainters 89.8% 1423 1278 Commercial Cleaners 89.6% 33613 30103 Painting Trades Workers 89.4% 10817 9676 Other Machine Operators 89.2% 3278 2925 Clothing Trades Workers 89.2% 2417 2155 Metal Fitters and Machinists 89.0% 22654 20153 Construction Trades Workers nfd 88.8% 576 511 Insurance Agents 88.6% 3618 3204 Drillers, Miners and Shot Firers 88.4% 12183 10768 Forestry and Logging Workers 88.4% 599 529 Precision Metal Trades Workers 88.2% 2168 1911 Authors, and Book and Script Editors 87.9% 1921 1689 Secretaries 87.7% 26461 23196 Panelbeaters, and Vehicle Body Builders, Trimmers and Painters nfd
87.5% 418 366
Primary Products Inspectors 87.4% 1066 931 Vending Machine Attendants 87.2% 1427 1244 Inspectors and Regulatory Officers 86.9% 10993 9552 Laundry Workers 86.8% 4647 4034 Roof Tilers 86.7% 2114 1833 Wall and Floor Tilers 86.7% 4001 3467 Handypersons 86.6% 9327 8074 Gaming Workers 86.5% 1391 1203 Betting Clerks 86.5% 912 789 Sales assistants and salespersons nfd 86.2% 6161 5313 Other Miscellaneous Clerical and Administrative Workers
85.8% 6108 5239
General Clerks 85.8% 73504 63031 Credit and Loans Officers (Aus) / Finance Clerks (NZ) 85.2% 7657 6525 Security Officers and Guards 85.0% 13872 11788 Domestic Cleaners 84.8% 4483 3801 Printing Trades Workers nfd 84.7% 132 112 Cabinetmakers 84.6% 4172 3531 Motor Vehicle Parts and Accessories Fitters 84.2% 2949 2482 Shelf Fillers 83.9% 12372 10377 Surveyors and Spatial Scientists 83.7% 3262 2731 Insulation and Home Improvement Installers 83.6% 4356 3640 Plasterers 83.0% 5969 4953 Vehicle Body Builders and Trimmers 82.9% 1434 1189 Survey Interviewers 82.4% 788 649 Sheetmetal Trades Workers 82.2% 1914 1574 Panelbeaters 82.2% 4019 3304 Sales workers nfd 81.7% 1353 1105 Switchboard Operators 80.5% 1220 982 Models and Sales Demonstrators 80.2% 3423 2746 Architectural, Building and Surveying Technicians 79.1% 13360 10567 Land Economists and Valuers 78.9% 3354 2647 Truck Drivers 78.8% 43830 34534 Deck and Fishing Hands 78.6% 1568 1233 Floor Finishers 78.2% 2407 1883 Packers and Product Assemblers nfd 78.2% 110 86 Canvas and Leather Goods Makers 78.0% 763 595 Medical Laboratory Scientists 77.9% 4549 3545 ICT Sales Assistants 77.7% 5033 3912 Motor Vehicle and Vehicle Parts Salespersons 77.7% 8500 6606 Pharmacy Sales Assistants 77.7% 10239 7957 Caretakers 76.2% 2409 1836 Other Construction and Mining Labourers 76.1% 1660 1264 Telecommunications Technical Specialists 75.6% 1393 1052 Automotive Electricians 75.5% 1715 1294 Freight and Furniture Handlers 75.2% 3495 2627 Plumbers 75.0% 17987 13487 Other Miscellaneous Technicians and Trades Workers 74.0% 4794 3549 Human Resource Clerks 73.7% 2657 1959 Bricklayers, and Carpenters and Joiners nfd 72.0% 336 242
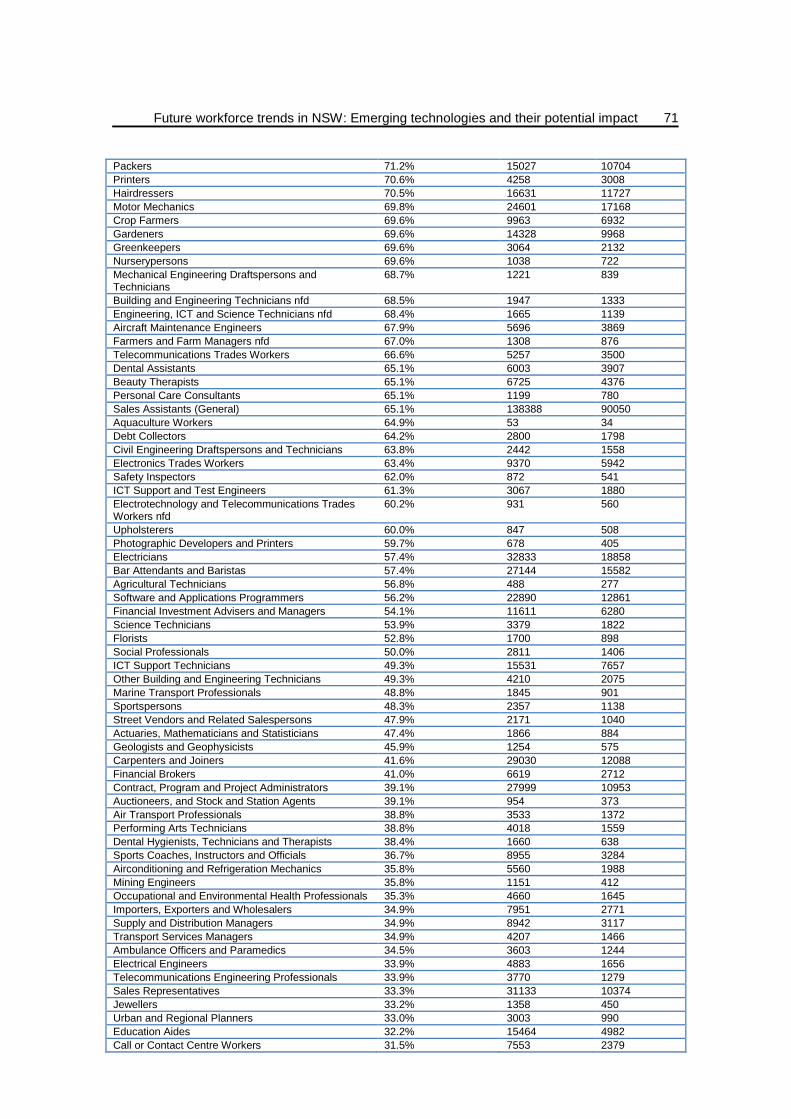
Future workforce trends in NSW: Emerging technologies and their potential impact
71
Packers 71.2% 15027 10704 Printers 70.6% 4258 3008 Hairdressers 70.5% 16631 11727 Motor Mechanics 69.8% 24601 17168 Crop Farmers 69.6% 9963 6932 Gardeners 69.6% 14328 9968 Greenkeepers 69.6% 3064 2132 Nurserypersons 69.6% 1038 722 Mechanical Engineering Draftspersons and Technicians
68.7% 1221 839
Building and Engineering Technicians nfd 68.5% 1947 1333 Engineering, ICT and Science Technicians nfd 68.4% 1665 1139 Aircraft Maintenance Engineers 67.9% 5696 3869 Farmers and Farm Managers nfd 67.0% 1308 876 Telecommunications Trades Workers 66.6% 5257 3500 Dental Assistants 65.1% 6003 3907 Beauty Therapists 65.1% 6725 4376 Personal Care Consultants 65.1% 1199 780 Sales Assistants (General) 65.1% 138388 90050 Aquaculture Workers 64.9% 53 34 Debt Collectors 64.2% 2800 1798 Civil Engineering Draftspersons and Technicians 63.8% 2442 1558 Electronics Trades Workers 63.4% 9370 5942 Safety Inspectors 62.0% 872 541 ICT Support and Test Engineers 61.3% 3067 1880 Electrotechnology and Telecommunications Trades Workers nfd
60.2% 931 560
Upholsterers 60.0% 847 508 Photographic Developers and Printers 59.7% 678 405 Electricians 57.4% 32833 18858 Bar Attendants and Baristas 57.4% 27144 15582 Agricultural Technicians 56.8% 488 277 Software and Applications Programmers 56.2% 22890 12861 Financial Investment Advisers and Managers 54.1% 11611 6280 Science Technicians 53.9% 3379 1822 Florists 52.8% 1700 898 Social Professionals 50.0% 2811 1406 ICT Support Technicians 49.3% 15531 7657 Other Building and Engineering Technicians 49.3% 4210 2075 Marine Transport Professionals 48.8% 1845 901 Sportspersons 48.3% 2357 1138 Street Vendors and Related Salespersons 47.9% 2171 1040 Actuaries, Mathematicians and Statisticians 47.4% 1866 884 Geologists and Geophysicists 45.9% 1254 575 Carpenters and Joiners 41.6% 29030 12088 Financial Brokers 41.0% 6619 2712 Contract, Program and Project Administrators 39.1% 27999 10953 Auctioneers, and Stock and Station Agents 39.1% 954 373 Air Transport Professionals 38.8% 3533 1372 Performing Arts Technicians 38.8% 4018 1559 Dental Hygienists, Technicians and Therapists 38.4% 1660 638 Sports Coaches, Instructors and Officials 36.7% 8955 3284 Airconditioning and Refrigeration Mechanics 35.8% 5560 1988 Mining Engineers 35.8% 1151 412 Occupational and Environmental Health Professionals 35.3% 4660 1645 Importers, Exporters and Wholesalers 34.9% 7951 2771 Supply and Distribution Managers 34.9% 8942 3117 Transport Services Managers 34.9% 4207 1466 Ambulance Officers and Paramedics 34.5% 3603 1244 Electrical Engineers 33.9% 4883 1656 Telecommunications Engineering Professionals 33.9% 3770 1279 Sales Representatives 33.3% 31133 10374 Jewellers 33.2% 1358 450 Urban and Regional Planners 33.0% 3003 990 Education Aides 32.2% 15464 4982 Call or Contact Centre Workers 31.5% 7553 2379
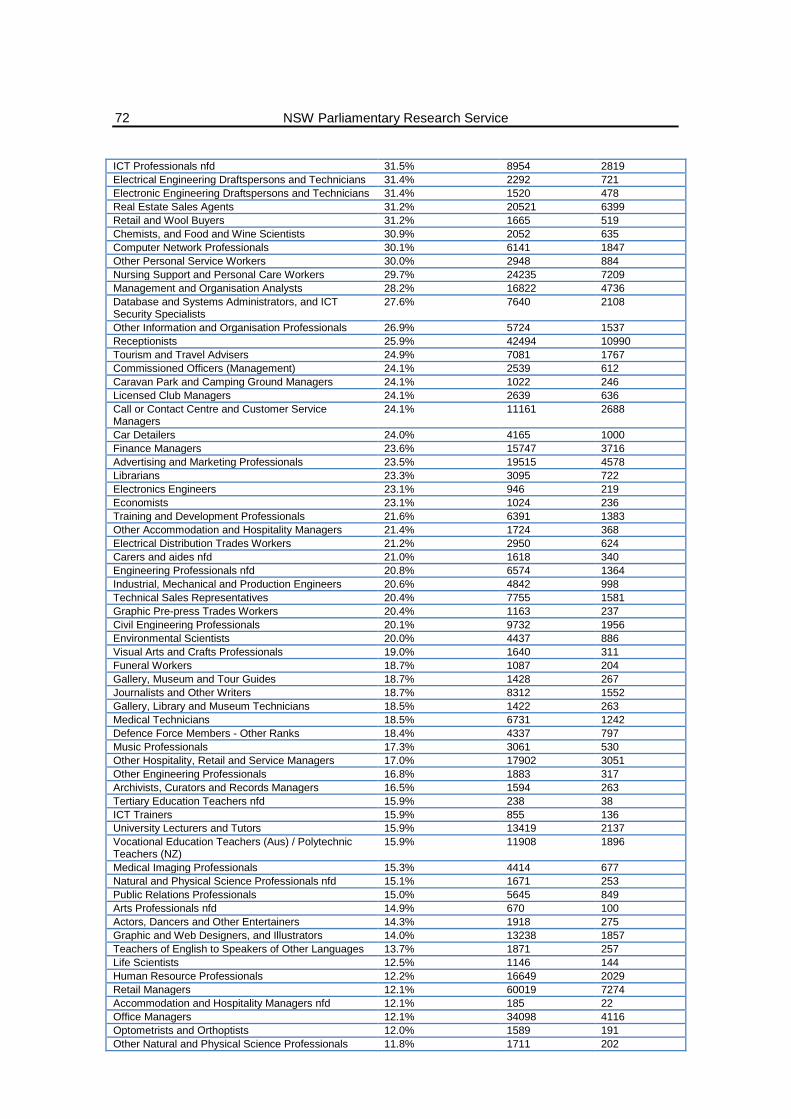
NSW Parliamentary Research Service
72
ICT Professionals nfd 31.5% 8954 2819 Electrical Engineering Draftspersons and Technicians 31.4% 2292 721 Electronic Engineering Draftspersons and Technicians 31.4% 1520 478 Real Estate Sales Agents 31.2% 20521 6399 Retail and Wool Buyers 31.2% 1665 519 Chemists, and Food and Wine Scientists 30.9% 2052 635 Computer Network Professionals 30.1% 6141 1847 Other Personal Service Workers 30.0% 2948 884 Nursing Support and Personal Care Workers 29.7% 24235 7209 Management and Organisation Analysts 28.2% 16822 4736 Database and Systems Administrators, and ICT Security Specialists
27.6% 7640 2108
Other Information and Organisation Professionals 26.9% 5724 1537 Receptionists 25.9% 42494 10990 Tourism and Travel Advisers 24.9% 7081 1767 Commissioned Officers (Management) 24.1% 2539 612 Caravan Park and Camping Ground Managers 24.1% 1022 246 Licensed Club Managers 24.1% 2639 636 Call or Contact Centre and Customer Service Managers
24.1% 11161 2688
Car Detailers 24.0% 4165 1000 Finance Managers 23.6% 15747 3716 Advertising and Marketing Professionals 23.5% 19515 4578 Librarians 23.3% 3095 722 Electronics Engineers 23.1% 946 219 Economists 23.1% 1024 236 Training and Development Professionals 21.6% 6391 1383 Other Accommodation and Hospitality Managers 21.4% 1724 368 Electrical Distribution Trades Workers 21.2% 2950 624 Carers and aides nfd 21.0% 1618 340 Engineering Professionals nfd 20.8% 6574 1364 Industrial, Mechanical and Production Engineers 20.6% 4842 998 Technical Sales Representatives 20.4% 7755 1581 Graphic Pre-press Trades Workers 20.4% 1163 237 Civil Engineering Professionals 20.1% 9732 1956 Environmental Scientists 20.0% 4437 886 Visual Arts and Crafts Professionals 19.0% 1640 311 Funeral Workers 18.7% 1087 204 Gallery, Museum and Tour Guides 18.7% 1428 267 Journalists and Other Writers 18.7% 8312 1552 Gallery, Library and Museum Technicians 18.5% 1422 263 Medical Technicians 18.5% 6731 1242 Defence Force Members - Other Ranks 18.4% 4337 797 Music Professionals 17.3% 3061 530 Other Hospitality, Retail and Service Managers 17.0% 17902 3051 Other Engineering Professionals 16.8% 1883 317 Archivists, Curators and Records Managers 16.5% 1594 263 Tertiary Education Teachers nfd 15.9% 238 38 ICT Trainers 15.9% 855 136 University Lecturers and Tutors 15.9% 13419 2137 Vocational Education Teachers (Aus) / Polytechnic Teachers (NZ)
15.9% 11908 1896
Medical Imaging Professionals 15.3% 4414 677 Natural and Physical Science Professionals nfd 15.1% 1671 253 Public Relations Professionals 15.0% 5645 849 Arts Professionals nfd 14.9% 670 100 Actors, Dancers and Other Entertainers 14.3% 1918 275 Graphic and Web Designers, and Illustrators 14.0% 13238 1857 Teachers of English to Speakers of Other Languages 13.7% 1871 257 Life Scientists 12.5% 1146 144 Human Resource Professionals 12.2% 16649 2029 Retail Managers 12.1% 60019 7274 Accommodation and Hospitality Managers nfd 12.1% 185 22 Office Managers 12.1% 34098 4116 Optometrists and Orthoptists 12.0% 1589 191 Other Natural and Physical Science Professionals 11.8% 1711 202

Future workforce trends in NSW: Emerging technologies and their potential impact
73
Chemical and Materials Engineers 11.6% 596 69 Photographers 11.6% 3209 373 Human Resource Managers 11.4% 12058 1373 Interior Designers 11.3% 2455 277 Visual Merchandisers 11.3% 1365 154 Media Professionals nfd 10.9% 924 101 Managers nfd 10.8% 12170 1313 Amusement, Fitness and Sports Centre Managers 10.7% 2168 232 Livestock Farmers 10.5% 23159 2421 Mixed Crop and Livestock Farmers 10.5% 11098 1160 Aged and Disabled Carers 10.4% 28394 2949 Corporate Services Managers 10.2% 1352 138 Policy and Planning Managers 10.2% 4526 462 Driving Instructors 10.2% 1302 132 Recycling and Rubbish Collectors 10.0% 784 79 Construction Managers 10.0% 22873 2277 Judicial and Other Legal Professionals 9.5% 2451 232 Child Care Centre Managers 9.4% 2852 268 Travel Attendants 9.4% 3498 329 Child Carers 9.4% 35051 3294 Chefs 9.4% 18712 1758 Barristers 9.4% 2284 215 Solicitors 9.4% 18515 1740 Ministers of Religion 9.4% 5498 516 Film, Television, Radio and Stage Directors 9.3% 3798 354 Professionals nfd 9.2% 10072 930 Dental Practitioners 9.2% 3715 341 Veterinarians 9.1% 2155 196 Artistic Directors, and Media Producers and Presenters
9.1% 4925 446
ICT Managers 9.0% 17534 1579 Research and Development Managers 8.9% 3212 286 Architects and Landscape Architects 8.9% 6078 541 Special Care Workers 8.7% 644 56 Chief Executives and Managing Directors 8.6% 16001 1373 Conference and Event Organisers 8.4% 5991 503 Architects, Designers, Planners and Surveyors nfd 8.3% 1684 139 Fire and Emergency Workers 8.2% 3985 328 Retail Supervisors 8.2% 7586 624 Early Childhood (Pre-primary School) Teachers 7.9% 7621 600 Financial Dealers 7.8% 7686 603 Prison Officers 7.8% 4172 324 Massage Therapists 7.6% 3244 248 Health and Welfare Services Managers 7.5% 5914 442 Fashion, Industrial and Jewellery Designers 7.4% 2570 189 Cafe and Restaurant Managers 7.3% 14616 1065 Engineering Managers 7.2% 4633 334 Nurse Managers 7.1% 3892 276 Social Workers 7.0% 4331 304 Welfare, Recreation and Community Arts Workers 7.0% 6485 455 Special Education Teachers 7.0% 5866 410 Primary School Teachers 7.0% 41799 2913 Middle School Teachers (Aus) / Intermediate School Teachers (NZ)
7.0% 114 8
Psychologists 6.9% 6453 446 Manufacturers 6.8% 6394 436 Production Managers 6.8% 13659 932 Other Medical Practitioners 6.8% 2819 192 Specialist Managers nfd 6.8% 6540 444 Registered Nurses 6.7% 63819 4249 Complementary Health Therapists 6.6% 2003 133 Diversional Therapists 6.6% 1527 102 Enrolled and Mothercraft Nurses 6.6% 4651 307 Advertising, Public Relations and Sales Managers 6.5% 37648 2466 ICT Sales Professionals 6.4% 5373 343 Counsellors 6.4% 5004 318
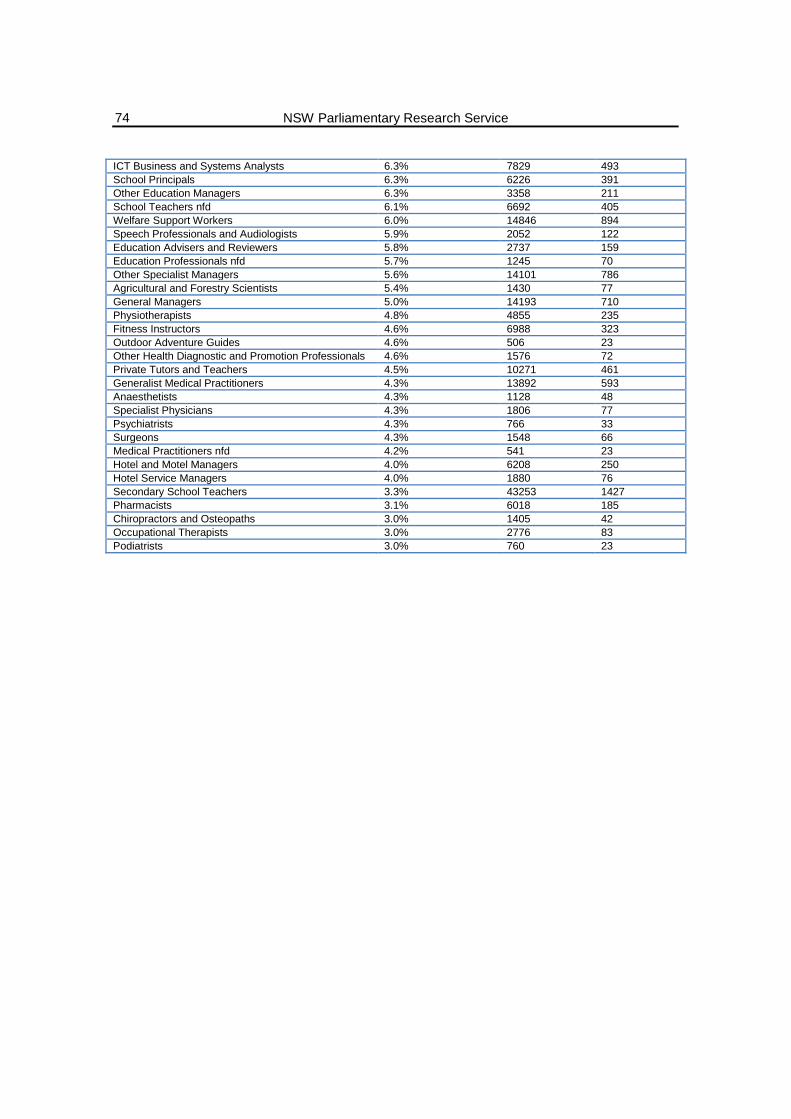
NSW Parliamentary Research Service
74
ICT Business and Systems Analysts 6.3% 7829 493 School Principals 6.3% 6226 391 Other Education Managers 6.3% 3358 211 School Teachers nfd 6.1% 6692 405 Welfare Support Workers 6.0% 14846 894 Speech Professionals and Audiologists 5.9% 2052 122 Education Advisers and Reviewers 5.8% 2737 159 Education Professionals nfd 5.7% 1245 70 Other Specialist Managers 5.6% 14101 786 Agricultural and Forestry Scientists 5.4% 1430 77 General Managers 5.0% 14193 710 Physiotherapists 4.8% 4855 235 Fitness Instructors 4.6% 6988 323 Outdoor Adventure Guides 4.6% 506 23 Other Health Diagnostic and Promotion Professionals 4.6% 1576 72 Private Tutors and Teachers 4.5% 10271 461 Generalist Medical Practitioners 4.3% 13892 593 Anaesthetists 4.3% 1128 48 Specialist Physicians 4.3% 1806 77 Psychiatrists 4.3% 766 33 Surgeons 4.3% 1548 66 Medical Practitioners nfd 4.2% 541 23 Hotel and Motel Managers 4.0% 6208 250 Hotel Service Managers 4.0% 1880 76 Secondary School Teachers 3.3% 43253 1427 Pharmacists 3.1% 6018 185 Chiropractors and Osteopaths 3.0% 1405 42 Occupational Therapists 3.0% 2776 83 Podiatrists 3.0% 760 23