futuristic trends in auto industry - · pdf file800 1000 1200 1984-85 1988-89 1993-94 1998-99...
TRANSCRIPT

Futuristic Trends in Auto Futuristic Trends in Auto IndustryIndustry

Contents
Auto Industry• Current scenario in India• Trends in Maruti Suzuki• Futuristic Trends• Alignment with Global markets
Plastic Industry• Current trend in plastic Industry• Future Perspective

Indian Automotive Space
India plans to become the Global Small Car Hub.
NORTH
EAST
WEST
SOUTH
MAN
New Hub : Uttarakhand
Bangalore
Sanand

Automotive Mission Plan 2016
Automotive Industry viewed as “Locomotive for Growth”
Turnover
$ 35 Billion to
$145 billion
Automotive Plan 2016
Will contribute 10% of the Country’s GDP and 30~35% of the Industry GDP
Document prepared by Government of Indiain consultation with
ACMA & SIAM
Export
$ 4.1 Billion to
$35 billion
Employment
+ 25 million

Automotive Mission Plan 2016
9X
3X2X
5X
0
5
10
Industry Revenue GDP Share Employment Exports

Automotive Growth Pattern
CAGR 16% CAGR 24%
CAGR 12%
Passenger Car (Mn Units)
0.75
1.7
0.0
0.5
1.0
1.5
2.0
2002 2003 2004 2005 2006 2007
Commercial Vehicles (Mn units)
0.15
0.50
00.1
0.2
0.3
0.4
0.5
0.6
2002 2003 2004 2005 2006 2007
Two Wheelers (Mn units)
4.3
8.5
0.0
2.0
4.0
6.0
8.0
10.0
2002 2003 2004 2005 2006 2007
6Robust growth
Total production 11 Mn vehicles

Automobile Demand Drivers
Car Market Demand Drivers
Favourable govt policies
Availability of Consumer Finance
Household Income Trends
Traffic & InfrastructureVehicle Prices
Product Availability /Access

RAPIDLY EXPANDING CONSUMER BASE
“Rich”CAGR: 15%
“Upper Middle”CAGR: 10%
“Middle Income”CAGR: 2%
“Lower Income”CAGR: -8%
Household Income Class 1995-96 2001-02 2009 (E)
1.2 (7) 2.6 (15) 7.0 (40)
91 (525)46.4 (265)32.5 (186)
85 (490)74.4 (429)54.1 (312.2)
30 (177)57.2 (332)77.0 (444.3)
Number of households** (population), millionsSource : NCAER Upward shift towards affluence

Auto Growth Drivers-Redn Tariff RatesNet Custom Duty
41.26
36.03
30.80
20.00
15.6813.11
10.84 10.84
15
5.445.445.445.44
0.00
10.00
20.00
30.00
40.00
50.00
Mar-01
Mar-02
Mar-03
Mar-04
Mar-05
Mar-06
Mar'07
Mar'08
Auto-Components Steel
Excise Duty on Cars
40
32
24 24 24 24 24 2420
8
1614
12
0
10
20
30
40
50
2001
2002
2003
2004
2005
2006
2007
2008
2009
%
Big Car Small Car
Supportive Trend of Duty Structure

Product Availability – Models in market
16 2025
3035
73
01020304050607080
1999 2001 2003 2004 2005 2007
Passenger Car Models

RISING INDIA: INFRASTRUCTURE GROWTH
Source: N H A I
Seaports
Road Development
NHDP Planned length – 23,646 km
Golden Quadrilateral – Completed 94.77%
Railway East-West Freight Corridor
Total Investment USD 5.5billion.
Total Length 7700km
Two New Deep Ports with special emphasis to Auto Industry
Dhamra , Orissa : USD565 Miln
Sutrapada, Gujrat : USD156 Miln
Up gradation of Major Airports
Total Investment :USD11billion
Delhi-Mumbai Industrial Corridor to attract $90bn, will cover Six states and 450,000sq km(1483kmX300km )area.
Delhi-Mumbai Corridor
Delhi-Mumbai Corridor

AVAILABILITY OF EASY FINANCE AT AFFORDABLE RATESAVAILABILITY OF EASY FINANCE AT AFFORDABLE RATES
Rate of Interest on Car Loans26
2219
15 1412 11 10 9.5 9 8.5 9.5
12.5
0
5
10
15
20
25
30
FY96 FY97 FY98 FY99 FY00 FY01 FY02 FY03 FY04 FY05 FY06 FY07 FY08
(%)

FAVOURABLE GOVERNMENT POLICIESFAVOURABLE GOVERNMENT POLICIES
WTO compliant policies
No restrictions on import
Tariff levels are being progressively reduced every
year
Conditions of import – to comply with emission and
safety norms as applicable to domestic companies
Increased engagements in Free Trade Agreements
Robust legal system

Passenger Vehicles In India
723,330
989,560
1,209,8761,309,300
1,545,223
1,762,131
0
200,000
400,000
600,000
800,000
1,000,000
1,200,000
1,400,000
1,600,000
1,800,000
2,000,000
2002-03 2003-04 2004-05 2005-06 2006-07 2007-08
CAGR @ 16.35 %
Source: SIAM

Maruti Production Trend Maruti Production Trend -- ConsistentConsistent
22106
158
333 360473
540 572
>1000
667778
0
200
400
600
800
1000
1200
1984-85
1988-89
1993-94
1998-99
2002-03
2003-04
2004-05
2005-06
2006-07
2007-08
2010-11
Year (Apr-Mar)
Nos
('00
0)
Total Production (in ‘000)
CAGR – 15.75%
CAGR – 16.67%

Indian Auto Component industry trendsIndian Auto Component industry trendsGreat opportunities for organic growth
Increasing domestic demand from all vehicle segments (as well as replacement market)Opportunities for exports increasing manifolds
Global OEMs sourcing from LCCsBig T-1s establishing supplier base in LCCsIndian cos venturing out for acquisitionsInternational Trade liberalization
Global giants gaining ground in India Greenfield ventures e.g., Saint Gobain, Magna Donnely, NTNPartnerships/acquisitions of local players e.g., Bosch(KBX), Mahle (Purolator)
OEMs venturing into components businessTACO, SYSTEC
Component suppliers shifting to module/system suppliers.Focus on design and development capability is continuously increasing.Local sourcing giving way to global sourcing as tariff barriers come down.

MSIL New Model Development Trend
IndiaManufacturing
Market
Design
India Specific & Re-designed
India Manufactured & designed
ab-initio
Globally Manufactured &
designed ab-initio
India
Global
Global
India Global
Suzuki existing model,
modified to suit India
New design,
new/existing platform
New design,
new/existing platform

TECHNOLOGY TRENDS
Fuel efficient cars Light weight constructionLower CO2 emissionsHigher accelerationIncreasing emphasis on safetyNVH isolationMore attractive upholsteryMore & more environment regulation compliant (ELV, Asbestos free)Alternate fuels (CNG, LPG, E-10)

GLOBAL TECHNOLOGY TRENDS
Hybrid propulsionPlug in electric vehiclesMove towards Euro – 5 emission normsDrive by wireVoice controlGPS NavigationNight VisionHeads up display

Pre 2000 2001 2003 2005 2006 2007 2008 2009 Future
Car AltoZen MC
Wagon-R MC
Alto MCCar MCEsteem MC
Swift Wagon-R Minor
Zen Estilo SX4 A StarTECHNOLOGY
TRENDS IN MSIL VEHICLES
ABS NON ABS OPTION
AIR BAGS NA DAB/PAB CAB/SAB ADDED
IMMOBILISERS NA ALL MODELS
INTERIORS NEW RM TO MEET SAFETY REGULATION
HIGH MOUNT STOP LAMPS NA ALL MODELS
Safety
HEAD LAMP LEVELIING NA ALL MODELS
POWER STEERING MANUAL ELECTRONIC
ComfortTRANSMISIION ROD TYPE CABLE TYPE
INTERIORS NEW COLORS
AESTHTICLIGHTING PRISM LENS CLEAR LENS HEAD LIGHTS
BEZEL ADDITION
LONG LIFE BULBS
HID HEAD LIGHTSLED TAIL LAMPS
ENGINE BLOCK FERROUS ALUMINUM
SHEET METAL CRCA HI TENSILE COATED(GA)
FUEL EFFCY
INTAKE SYSYTEM ALUMINUM PLASTIC IMA
PLASTIC CHCPLASTIC OIL PANSFUEL RAILS
BSIV CATALYST (400 CPSI) 600 CPSI 900 CPSIENVIRONMENT
ELV HEXAVALENT CHROME TRIVALENT CHROME

Role of Plastics in Automobiles

Plastic Penetration in Passenger Vehicle (Forecast)
60 6777
8697
105
0
20
40
60
80
100
120
.07-08 .08-09 .09-10 .10-11 .11-12 .12-13
Plastic Consumption/Veh (Kg)
Indian Plastics Penetration (Avg) : 60 kg/veh. Global Plastics (Avg) : 120 Kg/veh.
22Increasing Plastic penetration by virtue of metal & other plastic replacement

Performance In Certain Growth Sectors - Last Five Years(Injection Molding)
0
50
100
150
200
250
300
350
400
450
App
lianc
es
Hou
sew
are
Aut
omob
iles
Cap
s &
Clo
sure
s
Writ
ing
Inst
rum
ents
No o
f Mcs
03-04 04-05 05-06 06-07 07-08
Downstream Machinery Addition
23

Recent Developments in Plastic RM DevelopmentRecent Developments in Plastic RM Development
Higher Productivity• Use of high MFI materials reduces cycle time• Allows lower thickness there by reducing part wt• Developing materials for wide range of applications
Development of Environment Friendly Materials• Using greener production processes (Solvent less,
Primer less painting process)• Reduced noise levels
Increased stiffness and durability• Replacement of metal even at high temperatures• Increased fatigue & wear resistance reduces service
needs and warranty costs

Application trendsApplication trends
metal substition under the hoodinterior
roof module
structural inserts in thebody in white
FE concepts
functional polymers, mechatronic
outer body parts
Auto Electrical

Recent Developments Exteriors
Paint Free Body Paint Free Body PanelsPanels
Fenders and Tail GatesWindow glazing panoramic roofs, side windows and backlights

Recent Developments Advance Safety
Energy AbsorbersEnergy Absorbers Front End Module

Recent Developments in Power Train
Air intake manifold Fuel Rails
Throttle bodyStabilizer clamps

CO2 emissions of OEMs in EuropeCO2 emissions of OEMs in Europe
100 kg weight reduction means approx. 0.5 l/100 km less fuel consumption or approx. 13 g/km less CO2 emissions
CO2 emissions g/km
Current average for all cars
0 50 100 150 200
Failed proposal from EU Commissioner Stavros Dimas
EU directive by 2012
Source: Polymotive

Use of material in modern carsUse of material in modern cars
Plastics approx. 15-18 %
Materials breakdown for the Modern Cars
5%4%3%
53%
6%
14%
13%
2%
Steel
PlasticsTotal 1,429 kg Others
Aluminum
Glass
Elastomers
Fluids
Cast Iron
Source: Polymotive

Technology life cycle (Engineering Plastics)
Brackets
Oil Modules
Manifold Modules
Valve Intake Cover
Engine Cover
Radiator Tanks
Belt Cover
Thermostatic Housing
HybridCross Car Beam
Oil Pan Engine
GIT- Cooling Ducts
Sound Silencer
Cooling Frame
Air Filter Housing
Pulleys
WIT-Cooling Ducts
Air Ducts
Oil Filter
Oil Pan Gear Box
Valve Cover
Hybrid Pedal,Pedalbox
Structural Inserts Direct metallized Headlamp Bezel
Fuel Cells
Development Introduction Growth Saturation

Future Challenges for Raw Material SuppliersFuture Challenges for Raw Material Suppliers
1. Response to a globalized auto industryDemand from developing world (footprints required)RM suppliers shall be able to respond globallyMarket specific solution and shorter timing
2. Challenges for improved performance at competitive cost levels in emerging markets.
3. Lower environmental impact and responsible use of energy
Government regulationEmission reductionsEnvironmentally friendlier processesCompliance with ELV & NVH standards

How to face the future
Partnership between all stakeholders involved in the supply chain.Proliferation of knowledge to all stakeholders in the chain.Recruiting and training of more plastic engineers to enhance capabilities.Standardization and availability of engineering data to design engineersMore cost effective solutions for tooling, processing, raw materials etc.
OEM
MOULDER
RM Supplier

Thanks

Automotive Growth DriversAutomotive Growth Drivers
Low vehicle penetrationLow vehicle penetration
Infrastructure Development (Highways) Infrastructure Development (Highways)
Growing middle class buyers (30Growing middle class buyers (30--40million every year)40million every year)
Increased investment by Global PlayersIncreased investment by Global Players
Vehicle & Component Export emerged as a Vehicle & Component Export emerged as a
key factor for growthkey factor for growth
India : A growing Automotive market 35

Learning and Future DirectionLearning and Future Direction
1.1. Future outlook Future outlook •• India: PromisingIndia: Promising•• Global: WeakGlobal: Weak
2. Focus on low cost, fuel efficient cars2. Focus on low cost, fuel efficient cars
3. Stricter environment norms3. Stricter environment norms
4. Advance navigation and safety features4. Advance navigation and safety features
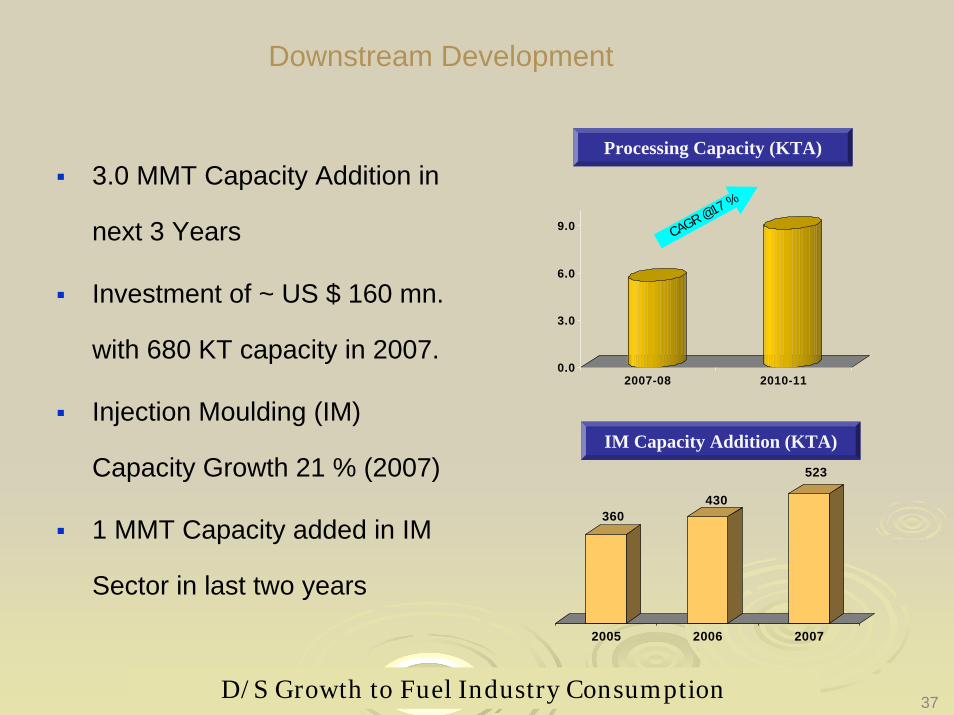
Downstream Development
Processing Capacity (KTA)3.0 MMT Capacity Addition in
next 3 Years
Investment of ~ US $ 160 mn.
with 680 KT capacity in 2007.
Injection Moulding (IM)
Capacity Growth 21 % (2007)
1 MMT Capacity added in IM
Sector in last two years
0.0
3.0
6.0
9.0
2007-08 2010-11
CAGR @17 %
360430
523
2005 2006 2007
IM Capacity Addition (KTA)IM Capacity Addition (KTA)
D/S Growth to Fuel Industry Consumption 37

Future Direction: How to Buck the Current TrendFuture Direction: How to Buck the Current Trend
ProcessReview of legacy systemsFlexible
Multi VariantsOptimization of production capacities
Infrastructure investment in LCC
Collaboration with Tier-1 & Tier-2Improving the value chain
PeopleAttracting & retaining talent
TrainingCost competitivenessOwnership
CFTs and new initiatives to innovate on cost & sales front.(1-1-1 initiative)
ProductProduct
Fuel Efficient Fuel Efficient Alternate FuelsAlternate FuelsGreen CarsGreen Cars
Indigenization of Indigenization of TechnologyTechnology
Optimisation of Optimisation of features features
Adding features Adding features as per the market as per the market demandsdemands
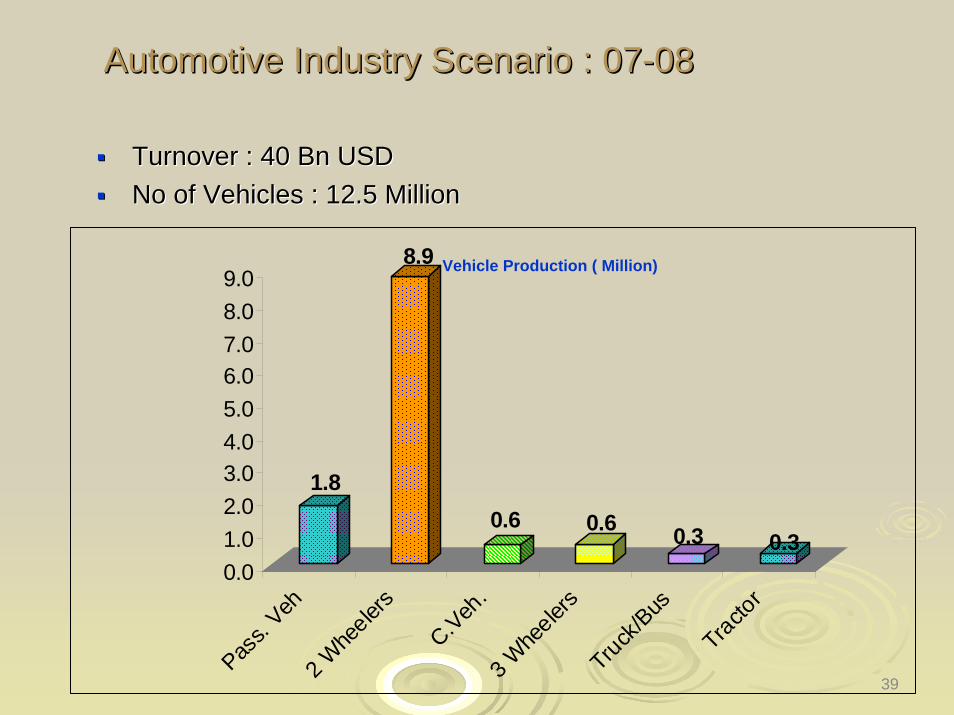
Automotive Industry Scenario : 07Automotive Industry Scenario : 07--0808
Turnover : 40 Bn USD Turnover : 40 Bn USD No of Vehicles : 12.5 MillionNo of Vehicles : 12.5 Million
39
1.8
8.9
0.6 0.6 0.3 0.30.01.02.03.04.05.06.07.08.09.0
Pass.
Veh2 W
heeler
s
C.Veh.
3 Whe
elers
Truck/Bus
Tractor
Vehicle Production ( Million)

Income trends : To become 3Income trends : To become 3rdrd Largest Economy, Largest Economy, BUT WITH RELATIVELY LOW PER CAPITA INCOMEBUT WITH RELATIVELY LOW PER CAPITA INCOMEPattern of Growth Not Witnessed By Any Other CountryPattern of Growth Not Witnessed By Any Other Country
GDP vs GDP per capita in 2050GDP vs GDP per capita in 2002GDP (US$ Bn)
GDP per capita (US$)
0
2000
4000
6000
8000
10000
12000
14000
0 10000 20000 30000 40000 50000
GDP (US$ Bn)
GDP per capita (US$)
0
10000
20000
30000
40000
50000
60000
0 20000 40000 60000 80000 100000
US
Japan
ChinaIndia
UK
Germany
ItalyFrance
BrazilRussia
China
US
Brazil
Italy Germany France
Russia
UK
Japan
India
Bubble size corresponds to GDP sizeSource: Goldman Sachs, BCG