fuzzy-logic-based mean time to failure (mttf) analysis of ...mean time to failure (mttf), as a...
TRANSCRIPT
Aalborg Universitet
Fuzzy-Logic-Based Mean Time to Failure (MTTF) Analysis of Interleaved Dc-DcConverters Equipped with Redundant-Switch Configuration
Rahimi, Tohid; Khoun Jahan, Hossein; Blaabjerg, Frede; Bahman, Amir Sajjad; Hosseini,Seyed HosseinPublished in:Applied Sciences
DOI (link to publication from Publisher):10.3390/app9010088
Creative Commons LicenseCC BY 4.0
Publication date:2018
Document VersionPublisher's PDF, also known as Version of record
Link to publication from Aalborg University
Citation for published version (APA):Rahimi, T., Khoun Jahan, H., Blaabjerg, F., Bahman, A. S., & Hosseini, S. H. (2018). Fuzzy-Logic-Based MeanTime to Failure (MTTF) Analysis of Interleaved Dc-Dc Converters Equipped with Redundant-SwitchConfiguration. Applied Sciences, 9(1), 1-17. [88]. https://doi.org/10.3390/app9010088
General rightsCopyright and moral rights for the publications made accessible in the public portal are retained by the authors and/or other copyright ownersand it is a condition of accessing publications that users recognise and abide by the legal requirements associated with these rights.
? Users may download and print one copy of any publication from the public portal for the purpose of private study or research. ? You may not further distribute the material or use it for any profit-making activity or commercial gain ? You may freely distribute the URL identifying the publication in the public portal ?
Take down policyIf you believe that this document breaches copyright please contact us at [email protected] providing details, and we will remove access tothe work immediately and investigate your claim.

applied sciences
Article
Fuzzy-Logic-Based Mean Time to Failure (MTTF)Analysis of Interleaved Dc-Dc Converters Equippedwith Redundant-Switch Configuration
Tohid Rahimi 1,* , Hossein Khoun Jahan 2, Frede Blaabjerg 3 , Amir Sajjad Bahman 3 andSeyed Hossein Hosseini 1,4
1 Electrical and Computer Engineering Faculty, University of Tabriz; Tabriz 51666, Iran;[email protected]
2 Azerbaijan Regional Electric Company; Tabriz 57734, Iran; [email protected] Department of Energy Technology, Aalborg University, DK-9220 Aalborg, Denmark; [email protected] (F.B.);
[email protected] (A.S.B.)4 Engineering Faculty, Near East University, Nicosia 99138, North Cyprus, Mersin 10, Turkey* Correspondence: [email protected]; Tel.:+98-936-199-6335
Received: 29 November 2018; Accepted: 21 December 2018; Published: 27 December 2018 �����������������
Abstract: Interleaved dc-dc converters in sensitive applications necessitate an enhanced reliability.An interleaved converter equipped with redundant components can fulfill the reliability requirements.Mean Time to Failure (MTTF), as a reliability index, can be used to evaluate the expected life spanof the mentioned converters. The Markov model is a helpful tool to calculate the MTTF in suchsystems. Different scientific reports denote different failure rates with different weight for powerelements. Also, in reliability reports, failure rates of active and passive components are uncertainvalues. In order to approximate the failure rates fuzzy-logic-based Markov models are proposedin this paper. Then it is used to evaluate the MTTF of an interleaved multi-phase dc-dc converter,which is equipped with parallel and standby switch configurations. For the first time, fuzzy curvesfor MTTFs of the converters and 3D reliability function are derived in this paper. The reliabilityanalyses give an insight to find the appropriate redundant-switch configurations for interleaveddc-dc converters under different conditions. Simulation and experimental results are provided tolend credence to the viability of the studied redundant-switch configurations in interleaved dc-dcboost converter.
Keywords: reliability; interleaved dc-dc converters; Markov model; MTTF; fuzzy logic
1. Introduction
Power electronic converters have major roles in renewable energy resources, energy storagesystems, electric or hybrid electric vehicles (HEVs), and aerospace application [1–4]. Isolated GateBipolar Transistors (IGBTs) and Metal-Oxide-semiconductor Field-Effect Transistors (MOSFETs) aretwo well-known power switches, which are the main active components in power converters. TheIGBT stands out for high power density which makes it practical in high power applications suchas wind energy generation systems, electric rail transportation systems, etc. [5–7]. On the otherhand, MOSFETs offer high frequency switching which improve the dynamics of the converters [8,9].Nevertheless, the high switching frequency leads to high dv/dt and increases power loss andelectromagnetic emissions [10]. Despite their features, the two mentioned power switches sufferfrom a high failure rate. The high failure rate of switches decreases the reliability of converters.Regarding the essential role of converters in the critical applications, reliability of the converters,
Appl. Sci. 2019, 9, 88; doi:10.3390/app9010088 www.mdpi.com/journal/applsci

Appl. Sci. 2019, 9, 88 2 of 17
which are considered the main parts of the system, becomes an important challenge [11–13]. Hence,the issue is gaining more attention and is considered as a major step in design and operation ofsystems [14].
In [15,16], some fault tolerant cascaded multilevel inverters are suggested; the suggested structuresuse certain relays to isolate the failure parts. Similarly, in [17] the relays are used to isolate the failedbranches of the interleaved dc-dc converter. Since relays have an insignificant failure rate, these devicescould improve the reliability. On the contrary, relays are pretty slow and the converter task will beinterrupted for some milliseconds when the relays act to remove the failure parts. Another strategyto enhance the expected life span of power electronic devices is to use redundant configurations andreconfiguration strategies, as investigated in [18]. The researchers in [18] focus on the effect of theredundancy of a Power Distribution Unit (PDU)-reliant system and prove that any failure in thePDU, which uses no redundancy, can cause the whole system to fail. According to [19], by adding aredundant switch to a silicon carbide (SIC)-based three-phase inverter, the MTTF of the inverter canbe increased by approximately five times. Furthermore, [19] suggests making a trade-off betweenthe efficiency and reliability in the studied high-power inverter. In [20], the reliability of the dc-dcconverter utilized in a solar farm is studied, where the converters in solar farms deal with differentpower ranges, and thereby having different MTTF, are associated. In order to obtain an overall MTTFfor such a system, [20] suggests an average MTTF which is given by MTTFtotal = ∑n
j=1 MTTFj (n isthe number of operation conditions). The failure rate and MTTF obtained in this reference are basedon MIL-HDBK-217 F military handbook [21]. In certain applications, the system interruption may leadto immense economic losses and/or life-threatening conditions. [22] makes use of a special switchingmethod to control the main and redundant power switches to the end of reducing the ElectromagneticInterface (EMI) which is produced by the converter, so that a safe condition is provided for the othercomponents of the system. Thus, in turn, the overall high reliability of the system is achieved.
Reliability evaluation methods are needed to evaluate the reliability of the systems. These methodscan provide a valuable guideline to manage the system performance in its mission profile. Some studieshave evaluated the availability and reliability of power electronic based systems and their componentsthrough conventional reliability analyzing methods, such as fault tree and Markov models [23].The Markov model is based on a graphical representation of the operation states of the system.The operation states, which are related to system configuration, are obtained by assuming the possiblesequence of elemental faults and the system reconfiguration steps. [24] exemplifies the Markovchain method in the reliability field and the probability-based reliability theory is used to studythe lifetime of large solar Photovoltaic (PV) arrays. Due to the fact that different power electronicdevices have different failure rates, the MTTF of a converter must be calculated based on a static value.As reported in literature, the reliability of a component is associated with uncertainties that originatefrom manufacturing technology, design uncertainty and lack of sufficient knowledge of physics offailure [25–27]. Regarding the mentioned fact and knowing that the failure rates of components andfault-coverage-mechanism probability are not pre-defined values, fuzzy-based reliability analysis canbe a suitable technique in common systems architecture [28–31].
In light of the above, the fuzzy mathematics theory can be combined with a Markov model as analternative method to calculate the MTTF of power-electronic-based converters. This paper focuses onthe application of fuzzy logic in the reliability evaluation of a fault-tolerant multi-phase interleaveddc-dc converter (hereinafter is called converter for brevity). In this regard, fuzzy-based Markov chainsare developed to analyze the MTTF of the considered converter. In order to enhance the reliabilityof the considered converter, redundant-phase and redundant-switch configurations are considered.Then by using fuzzy logic theory, the fuzzy functions of the MTTF for the single-phase, two-phaseand three-phase modes, in the presence of the redundant-switch configurations, are extracted.The considered redundant-switch configurations are termed as parallel-switch and standby-switchconfigurations. Moreover, assuming different conditions, the junction temperature and the thermalfactors of the switches are calculated. The obtained fuzzy results of the MTTFs are translated into

Appl. Sci. 2019, 9, 88 3 of 17
certain indexes to provide a fair comparison between the reliability of the converters equipped withdifferent redundant configurations. The whole work is converged to approach to a suitable defuzziationmethod to enhance the reliability of the interleaved dc-dc converter. To sum up, this paper is aimedat investigating the fuzzy reliability of interleaved converter with redundant switch configuration.To best of the authors’ knowledge, there is no research to investigate the reliability of fault-tolerantinterleaved converters from the fuzzy concept point of view. This research presents a systematicprocess to evaluate the reliability of the interleaved dc-dc converters through fuzzy functions of switchbase-failure and probability of successful operation of the fault managing system. The presentedprocess consists of three analysis tools, i.e., failure rates calculation, Markov chains and fuzzy theoryapplication in MTTF functions derivation. Contrary to expectation, the results show that under certainconditions, an n-phase converter is not more reliable than a (n-1)-phase converter. Moreover, for ann-phase converter, the suitability of each switch configuration should be assessed to determine thebest configuration.
The MTTF analyses simulation result obtained in Matlab/Simulink and experimental resultsextracted from a lab-scale prototype are provided to analyze the performance of the converter equippedwith the studied redundant-switch configurations.
2. The Studied Dc-Dc Converters
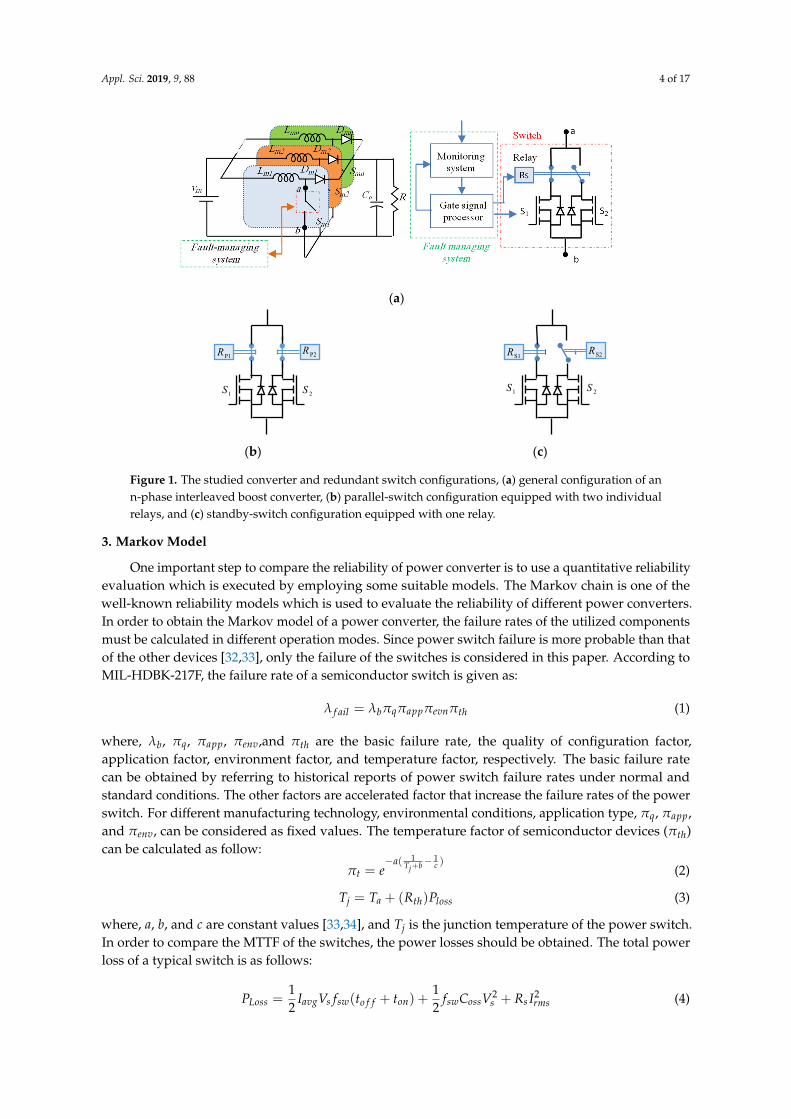
Figure 1a shows the general configuration of an n-phase interleaved boost converter in whicheach phase operates with a phase-shift of 2π/n. This converter features high efficiency, compact size,easy thermal management and low input current ripple. The converter is also equipped with afault managing system to detect the fault and isolate it by reconfiguring the converter through somerelays. In order to enhance the reliability of the converter, a hybrid-redundant structure is employed.This structure is combined with redundant-phase and redundant-switch configurations. As shownin Figure 1b,c, two common redundant structures for power switches, which are termed as paralleland standby switch configurations, can be considered to fend off the fault effect [32]. In this strategy,the mentioned redundant-switch configurations are replaced with the single switch in each phase.In the parallel-switch configuration, which is shown in Figure 1b, two relays with a normally-closedcontactor are used. However, in the standby-switch configurations, only one relay is used. The relayin this configuration has one normally-closed and one normally-opened contactor. Figure 1c showsthe standby-switch configuration. The relays get excited individually by the fault managing systemunder faulty conditions. In parallel-switch configuration, when one of the switches (Sj) fails the faultmanaging system detects the faulty switch and opens the related contactor (Rpj). Therefore, the healthyswitch conducts the total branch current. Once the second fault happens, the other contactor isopened to remove the faulty phase, thus the converter proceeds to function with the remaining phases.As shown in Figure 1c in the standby-switch configuration, the switch S2 is a reserve switch. Hence asthe main switch (S1) fails, the relay isolates it through contactor RS1 and the reserve switch is replacedwith the faulty switch by closing the contactor RS2. When the reserve switch fails, the related phase istotally removed and the converter proceeds to operate with the healthy phases.
Appl. Sci. 2019, 9, 88 4 of 17
Appl. Sci. 2018, 8, x FOR PEER REVIEW 4 of 17
(a)
(b) (c)
Figure 1. The studied converter and redundant switch configurations, (a) general configuration of an n-phase interleaved boost converter, (b) parallel-switch configuration equipped with two individual relays, and (c) standby-switch configuration equipped with one relay.
3. Markov Model
One important step to compare the reliability of power converter is to use a quantitative reliability evaluation which is executed by employing some suitable models. The Markov chain is one of the well-known reliability models which is used to evaluate the reliability of different power converters. In order to obtain the Markov model of a power converter, the failure rates of the utilized components must be calculated in different operation modes. Since power switch failure is more probable than that of the other devices [32, 33], only the failure of the switches is considered in this paper. According to MIL-HDBK-217F, the failure rate of a semiconductor switch is given as:
fail b q app evn thλ λ π π π π= (1)
where, bλ , qπ , appπ , envπ ,and thπ are the basic failure rate, the quality of configuration factor, application factor, environment factor, and temperature factor, respectively. The basic failure rate can be obtained by referring to historical reports of power switch failure rates under normal and standard conditions. The other factors are accelerated factor that increase the failure rates of the power switch. For different manufacturing technology, environmental conditions, application type,qπ , appπ , and envπ ,can be considered as fixed values. The temperature factor of semiconductor
devices ( thπ ) can be calculated as follow:
1 1( )j
aT b c
t eπ− −
+= (2)
( )j a th lossT T R P= + (3)
where, a , b , and c are constant values [33,34], and 𝑇 is the junction temperature of the power switch. In order to compare the MTTF of the switches, the power losses should be obtained. The total power loss of a typical switch is as follows:
2 21 1( )2 2Loss avg s sw off on sw oss s s rmsP I V f t t f C V R I= + + + (4)
1S 2S
S1R S2R
1S 2S
P1R P2R
Figure 1. The studied converter and redundant switch configurations, (a) general configuration of ann-phase interleaved boost converter, (b) parallel-switch configuration equipped with two individualrelays, and (c) standby-switch configuration equipped with one relay.
3. Markov Model
One important step to compare the reliability of power converter is to use a quantitative reliabilityevaluation which is executed by employing some suitable models. The Markov chain is one of thewell-known reliability models which is used to evaluate the reliability of different power converters.In order to obtain the Markov model of a power converter, the failure rates of the utilized componentsmust be calculated in different operation modes. Since power switch failure is more probable than thatof the other devices [32,33], only the failure of the switches is considered in this paper. According toMIL-HDBK-217F, the failure rate of a semiconductor switch is given as:
λ f ail = λbπqπappπevnπth (1)
where, λb, πq, πapp, πenv,and πth are the basic failure rate, the quality of configuration factor,application factor, environment factor, and temperature factor, respectively. The basic failure ratecan be obtained by referring to historical reports of power switch failure rates under normal andstandard conditions. The other factors are accelerated factor that increase the failure rates of the powerswitch. For different manufacturing technology, environmental conditions, application type, πq, πapp,and πenv, can be considered as fixed values. The temperature factor of semiconductor devices (πth)can be calculated as follow:
πt = e−a( 1
Tj+b−1c ) (2)
Tj = Ta + (Rth)Ploss (3)
where, a, b, and c are constant values [33,34], and Tj is the junction temperature of the power switch.In order to compare the MTTF of the switches, the power losses should be obtained. The total powerloss of a typical switch is as follows:
PLoss =12
IavgVs fsw(to f f + ton) +12
fswCossV2s + Rs I2
rms (4)
Appl. Sci. 2019, 9, 88 5 of 17
where Iavg, Vs, fsw, and Coss are average current of switch, voltage across the switch, switchingfrequency, and parasitic drain-source capacitor, respectively. Also, ton, to f f , Irms, and Rs are the turn onand off switching times of the switch, Root Mean Squire (RMS) current passing through the switchand on-state resistance of the switch, respectively. Having the failure rates (λ) in different modes,the Markov chain is used to determine the total MTTF of the system. Figure 2 exemplifies a typicalMarkov chain, which is a stochastic process of λ(t).
Appl. Sci. 2018, 8, x FOR PEER REVIEW 5 of 17
where I , V , f , and C are average current of switch, voltage across the switch, switching frequency, and parasitic drain-source capacitor, respectively. Also, 𝑡 , 𝑡 , 𝐼 , and 𝑅 are the turn on and off switching times of the switch, Root Mean Squire (RMS) current passing through the switch and on-state resistance of the switch, respectively. Having the failure rates (λ) in different modes, the Markov chain is used to determine the total MTTF of the system. Figure 2 exemplifies a typical Markov chain, which is a stochastic process of λ(t).
Figure 2. A typical Markov chain.
According to Figure 2, the probability that the system is in the mth state at t moment (Pm(t)), is given by the following equation:
dP (t) ( ) ( )dtm
mj i jm jm j j m
P t P tλ λ≠ ≠
= − + (5)
As stated in reference [35], the reliability is the probability of a device performing its purpose adequately for the period of time intended under the operating conditions encountered. The MTTF is the average time during which the system successfully operates before it fails. This index is given by:
0( )MTTF R t dt
∞= (6)
where ( )R t is the reliability of the system.
4. Triangular Fuzzy Numbers and Fuzzy Operation
According to Fuzzy theory, a typical fuzzy reliability set can be written in the form of R and its triangular membership function expressed by ( )R xμ . The triangular membership is a function of xvector, and depends on three constant parameters (a, b, and c), as given by Equation (7). To simplify the analysis, Equation (7) can be replaced by R , that is denoted by Equation (8). In this work, the failure rates of the components and fault coverage probability are considered as the fuzzy sets.
(x a)
( )( )
0
R
a x bb ac xx b x cc b
otherwise
λ
λμ
− ≤ ≤ −−= ≤ ≤ −
(7)
( , , )R a b c= (8)
Figure 2. A typical Markov chain.
According to Figure 2, the probability that the system is in the mth state at t moment (Pm(t)),is given by the following equation:
dPm(t)dt
= −∑m 6=j
λmjPi(t) + ∑j 6=m
λjmPj(t) (5)
As stated in reference [35], the reliability is the probability of a device performing its purposeadequately for the period of time intended under the operating conditions encountered. The MTTF isthe average time during which the system successfully operates before it fails. This index is given by:
MTTF =
∞∫0
R(t)dt (6)
where R(t) is the reliability of the system.
4. Triangular Fuzzy Numbers and Fuzzy Operation
According to Fuzzy theory, a typical fuzzy reliability set can be written in the form of R̃ and itstriangular membership function expressed by µR̃(x). The triangular membership is a function of xvector, and depends on three constant parameters (a, b, and c), as given by Equation (7). To simplify theanalysis, Equation (7) can be replaced by R̃, that is denoted by Equation (8). In this work, the failurerates of the components and fault coverage probability are considered as the fuzzy sets.
µR̃(x) =
λ(x−a)
b−a a ≤ x ≤ bλ(c−x)
c−b b ≤ x ≤ c
0 otherwise
(7)
R̃ = (a, b, c) (8)
In fuzzy theory, algebraic operations have their own special rules. The addition, subtraction,multiplication and division arithmetic operations on closed intervals are used in the following analysis.Since these operators are popular in fuzzy theory, they are not discussed in this section.
Appl. Sci. 2019, 9, 88 6 of 17
5. MTTF Analysis
In this paper, the single-phase, two-phase and three-phase interleaved boost converters areevaluated from the MTTF point of view. Also, the redundant-switch configurations are applied tothe single-phase, two-phase and three-phase interleaved dc-dc converters. Four steps for the MTTFanalysis are considered as follow:
• Step 1: The MTTF curves for the parallel-switch-based and standby-switch-based single-phaseconverter are extracted. The obtained curves are illustrated as triangular fuzzy memberships.
• Step 2: The fuzzy curves related to the parallel-switch-based and standby-switch-based two-phaseconverter are traced based on the obtained fuzzy-MTTF functions.
• Step 3: With respect to the results obtained from the two previous steps and the three-phaseoperation condition, fuzzy-based MTTF curves are extracted.
• Step 4: The fuzzy results are defuzzied to real values. This step provides a fair comparison toanalyse the reliability of the considered converters in different modes.
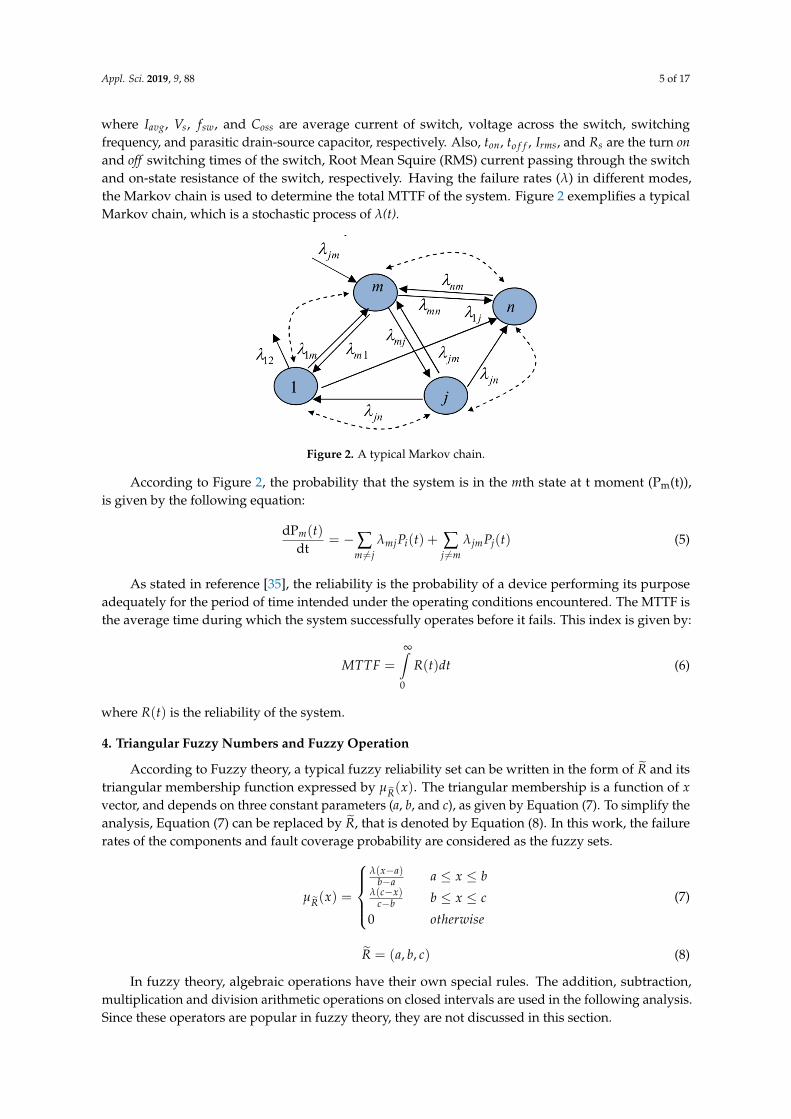
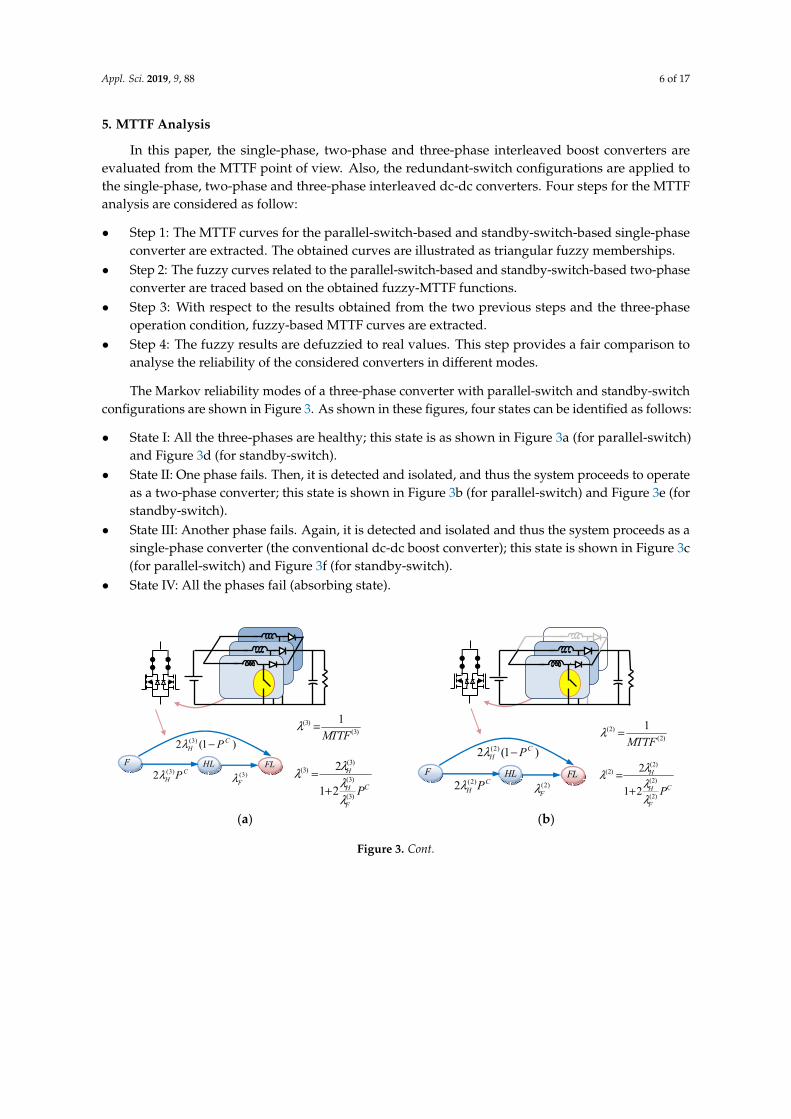
The Markov reliability modes of a three-phase converter with parallel-switch and standby-switchconfigurations are shown in Figure 3. As shown in these figures, four states can be identified as follows:
• State I: All the three-phases are healthy; this state is as shown in Figure 3a (for parallel-switch)and Figure 3d (for standby-switch).
• State II: One phase fails. Then, it is detected and isolated, and thus the system proceeds to operateas a two-phase converter; this state is shown in Figure 3b (for parallel-switch) and Figure 3e (forstandby-switch).
• State III: Another phase fails. Again, it is detected and isolated and thus the system proceeds as asingle-phase converter (the conventional dc-dc boost converter); this state is shown in Figure 3c(for parallel-switch) and Figure 3f (for standby-switch).
• State IV: All the phases fail (absorbing state).
Appl. Sci. 2018, 8, x FOR PEER REVIEW 6 of 17
In fuzzy theory, algebraic operations have their own special rules. The addition, subtraction, multiplication and division arithmetic operations on closed intervals are used in the following analysis. Since these operators are popular in fuzzy theory, they are not discussed in this section.
5. MTTF Analysis
In this paper, the single-phase, two-phase and three-phase interleaved boost converters are evaluated from the MTTF point of view. Also, the redundant-switch configurations are applied to the single-phase, two-phase and three-phase interleaved dc-dc converters. Four steps for the MTTF analysis are considered as follow:
• Step 1: The MTTF curves for the parallel-switch-based and standby-switch-based single-phase converter are extracted. The obtained curves are illustrated as triangular fuzzy memberships.
• Step 2: The fuzzy curves related to the parallel-switch-based and standby-switch-based two-phase converter are traced based on the obtained fuzzy-MTTF functions.
• Step 3: With respect to the results obtained from the two previous steps and the three-phase operation condition, fuzzy-based MTTF curves are extracted.
• Step 4: The fuzzy results are defuzzied to real values. This step provides a fair comparison to analyse the reliability of the considered converters in different modes.
The Markov reliability modes of a three-phase converter with parallel-switch and standby-switch configurations are shown in Figure 3. As shown in these figures, four states can be identified as follows:
• State I: All the three-phases are healthy; this state is as shown in Figure 3a (for parallel-switch) and Figure 3d (for standby-switch).
• State II: One phase fails. Then, it is detected and isolated, and thus the system proceeds to operate as a two-phase converter; this state is shown in Figure 3b (for parallel-switch) and Figure 3e (for standby-switch).
• State III: Another phase fails. Again, it is detected and isolated and thus the system proceeds as a single-phase converter (the conventional dc-dc boost converter); this state is shown in Figure 3c (for parallel-switch) and Figure 3f (for standby-switch).
• State IV: All the phases fail (absorbing state).
(a) (b)
HL FLF(2)2 CH Pλ (2)
Fλ
(2)2 (1 )CH Pλ −
(2)(2)
1MTTF
λ =
(2)(2)
(2)
(2)
2
1 2
H
CH
F
P
λλλλ
=+
HL FLF(3)2 CH Pλ (3)
Fλ
(3)2 (1 )CH Pλ −
(3)(3)
1MTTF
λ =
(3)(3)
(3)
(3)
2
1 2
H
CH
F
P
λλλλ
=+
Figure 3. Cont.
Appl. Sci. 2019, 9, 88 7 of 17
Appl. Sci. 2018, 8, x FOR PEER REVIEW 7 of 17
(c) (d)
(e) (f)
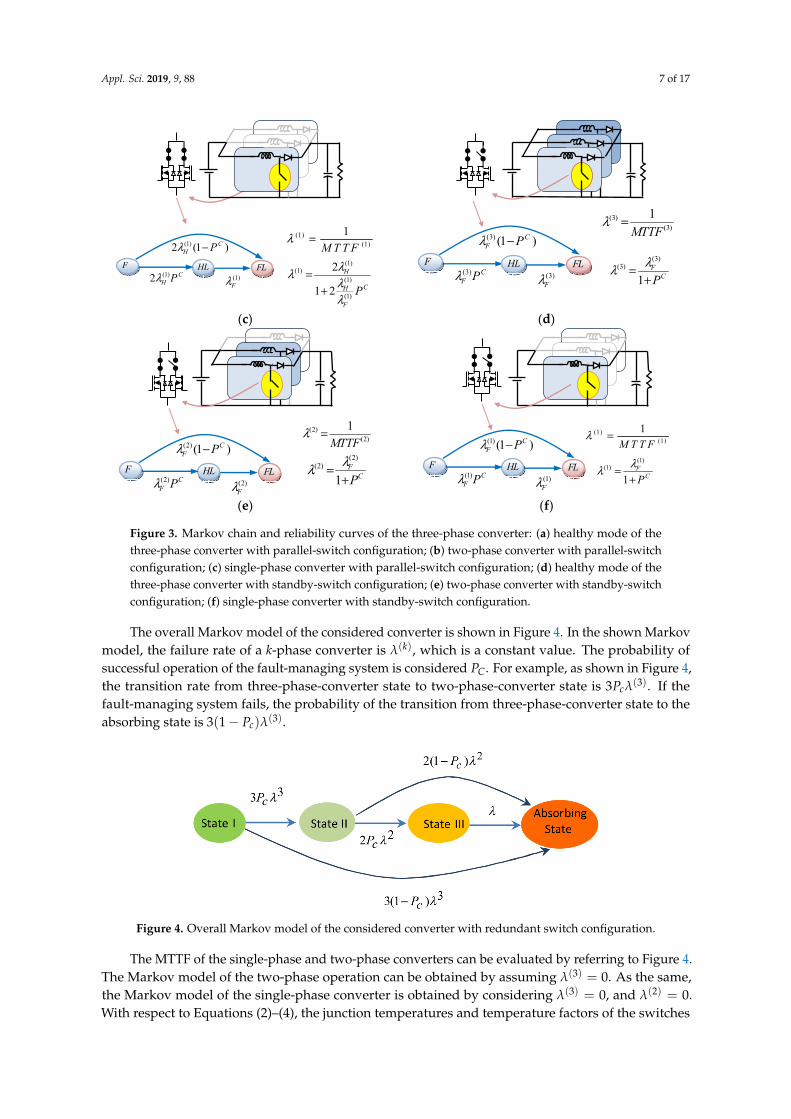
Figure 3. Markov chain and reliability curves of the three-phase converter: (a) healthy mode of the three-phase converter with parallel-switch configuration; (b) two-phase converter with parallel-switch configuration; (c) single-phase converter with parallel-switch configuration; (d) healthy mode of the three-phase converter with standby-switch configuration; (e) two-phase converter with standby-switch configuration; (f) single-phase converter with standby-switch configuration.
The overall Markov model of the considered converter is shown in Figure 4. In the shown Markov model, the failure rate of a k-phase converter is ( )kλ , which is a constant value. The probability of successful operation of the fault-managing system is considered CP . For example, as shown in Figure 4, the transition rate from three-phase-converter state to two-phase-converter state is (3)3 cP λ . If the fault-managing system fails, the probability of the transition from three-phase-converter state to the absorbing state is (3 )3(1 )cP λ− .
Figure 4. Overall Markov model of the considered converter with redundant switch configuration.
The MTTF of the single-phase and two-phase converters can be evaluated by referring to Figure 4. The Markov model of the two-phase operation can be obtained by assuming (3) 0λ = . As the same, the Markov model of the single-phase converter is obtained by considering (3) 0λ = , and (2) 0λ = . With respect to Equations (2)–(4), the junction temperatures and temperature factors of the switches
(1)(1)
1M T T F
λ =
(1)(1)
1FCP
λλ =+
HL FLF(1) CF Pλ (1)
Fλ
(1) (1 )CF Pλ −
HL FLF(2) CF Pλ (2)
Fλ
(2) (1 )CF Pλ −
(2)(2)
1MTTF
λ =
(2)(2)
1FCP
λλ =+
(3)(3)
1MTTF
λ =
(3)(3)
1FCP
λλ =+
(3) (1 )CF Pλ −
HL FLF(3) CF Pλ (3)
FλHL FLF
(1)2 CH Pλ (1)
Fλ
(1)2 (1 )CH Pλ −(1)
(1)1
MTTFλ =
(1)(1)
(1)
(1)
2
1 2
H
CH
F
P
λλλλ
=+
Figure 3. Markov chain and reliability curves of the three-phase converter: (a) healthy mode of thethree-phase converter with parallel-switch configuration; (b) two-phase converter with parallel-switchconfiguration; (c) single-phase converter with parallel-switch configuration; (d) healthy mode of thethree-phase converter with standby-switch configuration; (e) two-phase converter with standby-switchconfiguration; (f) single-phase converter with standby-switch configuration.
The overall Markov model of the considered converter is shown in Figure 4. In the shown Markovmodel, the failure rate of a k-phase converter is λ(k), which is a constant value. The probability ofsuccessful operation of the fault-managing system is considered PC. For example, as shown in Figure 4,the transition rate from three-phase-converter state to two-phase-converter state is 3Pcλ(3). If thefault-managing system fails, the probability of the transition from three-phase-converter state to theabsorbing state is 3(1− Pc)λ(3).
Appl. Sci. 2018, 8, x FOR PEER REVIEW 7 of 17
(c) (d)
(e) (f)
Figure 3. Markov chain and reliability curves of the three-phase converter: (a) healthy mode of the three-phase converter with parallel-switch configuration; (b) two-phase converter with parallel-switch configuration; (c) single-phase converter with parallel-switch configuration; (d) healthy mode of the three-phase converter with standby-switch configuration; (e) two-phase converter with standby-switch configuration; (f) single-phase converter with standby-switch configuration.
The overall Markov model of the considered converter is shown in Figure 4. In the shown Markov model, the failure rate of a k-phase converter is ( )kλ , which is a constant value. The probability of successful operation of the fault-managing system is considered CP . For example, as shown in Figure 4, the transition rate from three-phase-converter state to two-phase-converter state is (3)3 cP λ . If the fault-managing system fails, the probability of the transition from three-phase-converter state to the absorbing state is (3 )3(1 )cP λ− .
Figure 4. Overall Markov model of the considered converter with redundant switch configuration.
The MTTF of the single-phase and two-phase converters can be evaluated by referring to Figure 4. The Markov model of the two-phase operation can be obtained by assuming (3) 0λ = . As the same, the Markov model of the single-phase converter is obtained by considering (3) 0λ = , and (2) 0λ = . With respect to Equations (2)–(4), the junction temperatures and temperature factors of the switches
(1)(1)
1M T T F
λ =
(1)(1)
1FCP
λλ =+
HL FLF(1) CF Pλ (1)
Fλ
(1) (1 )CF Pλ −
HL FLF(2) CF Pλ (2)
Fλ
(2) (1 )CF Pλ −
(2)(2)
1MTTF
λ =
(2)(2)
1FCP
λλ =+
(3)(3)
1MTTF
λ =
(3)(3)
1FCP
λλ =+
(3) (1 )CF Pλ −
HL FLF(3) CF Pλ (3)
FλHL FLF
(1)2 CH Pλ (1)
Fλ
(1)2 (1 )CH Pλ −(1)
(1)1
MTTFλ =
(1)(1)
(1)
(1)
2
1 2
H
CH
F
P
λλλλ
=+
Figure 4. Overall Markov model of the considered converter with redundant switch configuration.
The MTTF of the single-phase and two-phase converters can be evaluated by referring to Figure 4.The Markov model of the two-phase operation can be obtained by assuming λ(3) = 0. As the same,the Markov model of the single-phase converter is obtained by considering λ(3) = 0, and λ(2) = 0.With respect to Equations (2)–(4), the junction temperatures and temperature factors of the switches
Appl. Sci. 2019, 9, 88 8 of 17
in the studied converters are listed in Table 1. By using these values, the MTTFs of the phases can beeasily calculated. In general, three failure rates, which are seen in Figure 3, are described as follows:
λ(k)H : Failure rate of a switch when the converter operates in k-phase mode, and the two
parallel-switches conduct the phase current in parallel state;λ(k)F : Failure rate of a switch when the converter operates in k-phase mode and only one of the
standby-switches conducts the phase current;PC: Probability of successful operation of the fault-managing system.
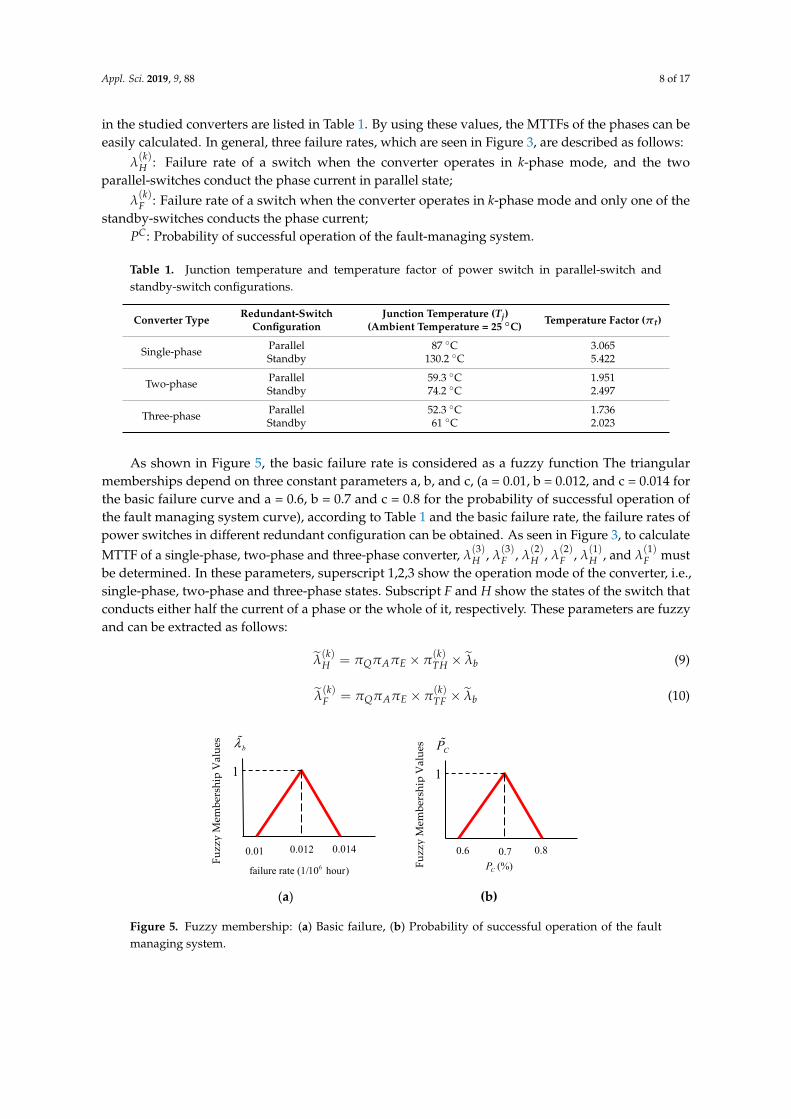
Table 1. Junction temperature and temperature factor of power switch in parallel-switch andstandby-switch configurations.
Converter Type Redundant-SwitchConfiguration
Junction Temperature (Tj)(Ambient Temperature = 25 ◦C) Temperature Factor (πt)
Single-phase Parallel 87 ◦C 3.065Standby 130.2 ◦C 5.422
Two-phase Parallel 59.3 ◦C 1.951Standby 74.2 ◦C 2.497
Three-phase Parallel 52.3 ◦C 1.736Standby 61 ◦C 2.023
As shown in Figure 5, the basic failure rate is considered as a fuzzy function The triangularmemberships depend on three constant parameters a, b, and c, (a = 0.01, b = 0.012, and c = 0.014 forthe basic failure curve and a = 0.6, b = 0.7 and c = 0.8 for the probability of successful operation ofthe fault managing system curve), according to Table 1 and the basic failure rate, the failure rates ofpower switches in different redundant configuration can be obtained. As seen in Figure 3, to calculateMTTF of a single-phase, two-phase and three-phase converter, λ
(3)H , λ
(3)F , λ
(2)H , λ
(2)F , λ
(1)H , and λ
(1)F must
be determined. In these parameters, superscript 1,2,3 show the operation mode of the converter, i.e.,single-phase, two-phase and three-phase states. Subscript F and H show the states of the switch thatconducts either half the current of a phase or the whole of it, respectively. These parameters are fuzzyand can be extracted as follows:
λ̃(k)H = πQπAπE × π
(k)TH × λ̃b (9)
λ̃(k)F = πQπAπE × π
(k)TF × λ̃b (10)
Appl. Sci. 2018, 8, x FOR PEER REVIEW 8 of 17
in the studied converters are listed in Table I. By using these values, the MTTFs of the phases can be easily calculated. In general, three failure rates, which are seen in Figure 3, are described as follows:
( )kHλ : Failure rate of a switch when the converter operates in k-phase mode, and the two
parallel-switches conduct the phase current in parallel state; ( )kFλ : Failure rate of a switch when the converter operates in k-phase mode and only one of the
standby-switches conducts the phase current; CP : Probability of successful operation of the fault-managing system.
Table 1. Junction temperature and temperature factor of power switch in parallel-switch and standby-switch configurations.
Converter type
Redundant-Switch Configuration
Junction Temperature ( jT ) (Ambient Temperature=25 °C)
Temperature factor ( tπ )
Single-phase Parallel 87 °C 3.065 Standby 130.2 °C 5.422
Two-phase Parallel 59.3 °C 1.951 Standby 74.2 °C 2.497
Three-phase Parallel 52.3 °C 1.736 Standby 61 °C 2.023
Figure 5. Fuzzy membership: (a) Basic failure, (b) Probability of successful operation of the fault managing system.
As shown in Figure 5, the basic failure rate is considered as a fuzzy function The triangular memberships depend on three constant parameters a, b, and c, (a=0.01, b=0.012, and c=0.014 for the basic failure curve and a=0.6, b=0.7 and c=0.8 for the probability of successful operation of the fault managing system curve), according to Table 1 and the basic failure rate, the failure rates of power switches in different redundant configuration can be obtained. As seen in Figure 3, to calculate MTTF of a single-phase, two-phase and three-phase converter, (3 )
Hλ , (3 )Fλ , (2)
Hλ , (2)Fλ , (1)
Hλ , and (1)Fλ must
be determined. In these parameters, superscript 1,2,3 show the operation mode of the converter, i.e. single-phase, two-phase and three-phase states. Subscript F and H show the states of the switch that conducts either half the current of a phase or the whole of it, respectively. These parameters are fuzzy and can be extracted as follows:
( ) ( )k kH Q A E TH bλ π π π π λ= × × (9)
( ) ( )k kF Q A E TF bλ π π π π λ= × × (10)
In order to calculate the MTTF of the single-phase, two-phase and three-phase converter, referring to Figure 3, the probability of successful operation of the fault-managing system is defined in Table 2 where the differential equations for reliability analysis are given as follow:
(a) (b)
CP
1
0.80.70.6
Fuzz
y M
embe
rshi
p V
alue
s
(%)CP
bλ
1
0.0140.0120.01
Fuzz
y M
embe
rshi
p V
alue
s 6failure rate (1/10 hour)
Figure 5. Fuzzy membership: (a) Basic failure, (b) Probability of successful operation of the faultmanaging system.
Appl. Sci. 2019, 9, 88 9 of 17
In order to calculate the MTTF of the single-phase, two-phase and three-phase converter, referringto Figure 3, the probability of successful operation of the fault-managing system is defined in Table 2where the differential equations for reliability analysis are given as follow:
ddt
P3(t)P2(t)P1(t)
Pf ault(t)
=
−3λ̃(3) 0 0 03P̃cλ̃(3) −2λ̃(2) 0 0
0 2P̃cλ̃(2) −λ̃(1) 03(1− P̃c)λTh 2(1− P̃c)λ̃(2) λ̃(1) 0
P3(t)P2(t)P1(t)
Pf ault(t)
(11)
The reliability functions of the three-phase converters can be obtained as follows:
1− Pf ault(t) = R(t) (12)
Regarding Equation (5), (11), and (12), the MTTF of the three-phase converter is given by:
∼MTTF(3) =
13λ̃(3)
+P̃c
λ̃(2)+
P̃2c
λ̃(1)(13)
Similarly, the MTTF functions of the two-phase and single-phase converters are extracted byEquation (14) and (15), respectively.
∼MTTF(2) =
1 + 2λ̃(2)
λ̃(1) P̃c
2λ̃(2)(14)
∼MTTF(1) =
12λ̃(1)
(15)
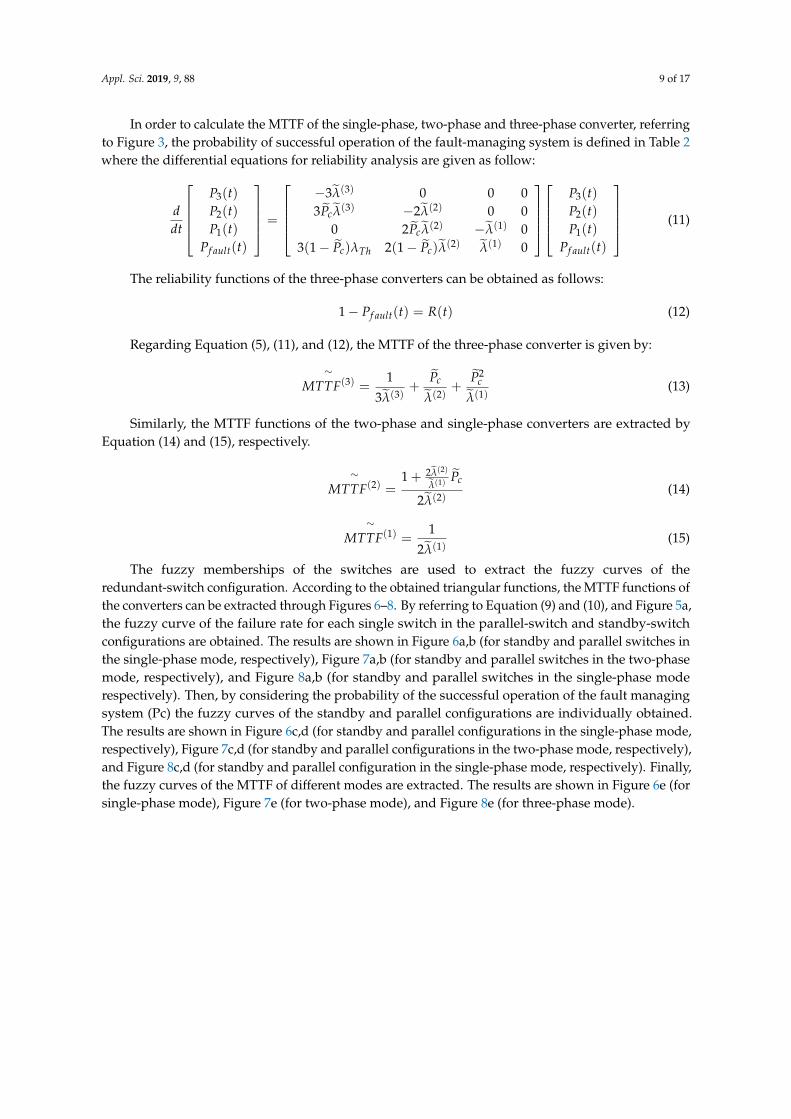
The fuzzy memberships of the switches are used to extract the fuzzy curves of theredundant-switch configuration. According to the obtained triangular functions, the MTTF functions ofthe converters can be extracted through Figures 6–8. By referring to Equation (9) and (10), and Figure 5a,the fuzzy curve of the failure rate for each single switch in the parallel-switch and standby-switchconfigurations are obtained. The results are shown in Figure 6a,b (for standby and parallel switches inthe single-phase mode, respectively), Figure 7a,b (for standby and parallel switches in the two-phasemode, respectively), and Figure 8a,b (for standby and parallel switches in the single-phase moderespectively). Then, by considering the probability of the successful operation of the fault managingsystem (Pc) the fuzzy curves of the standby and parallel configurations are individually obtained.The results are shown in Figure 6c,d (for standby and parallel configurations in the single-phase mode,respectively), Figure 7c,d (for standby and parallel configurations in the two-phase mode, respectively),and Figure 8c,d (for standby and parallel configuration in the single-phase mode, respectively). Finally,the fuzzy curves of the MTTF of different modes are extracted. The results are shown in Figure 6e (forsingle-phase mode), Figure 7e (for two-phase mode), and Figure 8e (for three-phase mode).
Appl. Sci. 2019, 9, 88 10 of 17Appl. Sci. 2018, 8, x FOR PEER REVIEW 10 of 17
(a) (b) (c) (d)
(e)
Figure 6. Fuzzy curves related to single-phase converter (a) failure rate of a switch in the parallel-switch configuration, (b) failure rate of a switch rate in the standby-switch configuration, (c) failure rate of parallel-switch configuration, (d) failure rate of standby-switch configuration, and (e) Mean Time to Failure (MTTF) of single-phase converter with parallel-switch and standby-switch modules.
(a) (b) (c) (d)
(e)
Figure 7. Fuzzy curves related to two-phase converter (a) failure rate of a switch in parallel-switch configuration, (b) failure rate of a switch in standby-switch configuration, (c) failure rate of parallel-switch configuration, (d) failure rate of standby-switch configuration, and (e) MTTF of two-phase converter with parallel-switch and standby-switch modules.
(2)PMTTF
(2)sbMTTF
0.0681 0.1140
1
0.1191 0.2985 0.7120.0212Fuzz
y M
embe
rshi
p V
alue
s
6MTTF (10 hour)
(2)sbλ
4.581 5.817 7.211
1
Fuzz
y M
embe
rshi
p V
alue
s
6failure rate (1/10 hour)
(2)Pλ
4.13 7.378 13.01
1
Fuzz
y M
embe
rshi
p V
alue
s
6failure rate (1/10 hour)6failure rate (1/10 hour)
(2)Fλ
8.24 9.89 11.53
1
Fuzz
y M
embe
rshi
p V
alue
s
6failure rate (1/10 hour)
(2)Hλ
6.435 7.722 9.009
1
Fuzz
yM
embe
rshi
pV
alue
s
6MTTF (10 hour)
(1)PMTTF
(1)sbMTTF
0 .042 0.0639 0.0738
1
0.0791 0.101 0.132Fuzz
y M
embe
rshi
p V
alue
s 6failure rate (1/10 hour)
(1)sbλ
9.941 12.63 15.65
1
Fuzz
y M
embe
rshi
p V
alue
s
6failure rate (1/10 hour)
(1)Pλ
7.58 13.54 23.614
1
Fuzz
y M
embe
rshi
p V
alue
s
6failure rate (1/10 hour)
(1)Fλ
17.89 21.47 25.05
1
Fuzz
y M
embe
rshi
p V
alue
s 6failure rate (1/10 hour)
(1)Hλ
10.11 12.13 14.16
1
Fuzz
y M
embe
rshi
p V
alue
s
Figure 6. Fuzzy curves related to single-phase converter (a) failure rate of a switch in the parallel-switchconfiguration, (b) failure rate of a switch rate in the standby-switch configuration, (c) failure rate ofparallel-switch configuration, (d) failure rate of standby-switch configuration, and (e) Mean Time toFailure (MTTF) of single-phase converter with parallel-switch and standby-switch modules.
Appl. Sci. 2018, 8, x FOR PEER REVIEW 10 of 17
(a) (b) (c) (d)
(e)
Figure 6. Fuzzy curves related to single-phase converter (a) failure rate of a switch in the parallel-switch configuration, (b) failure rate of a switch rate in the standby-switch configuration, (c) failure rate of parallel-switch configuration, (d) failure rate of standby-switch configuration, and (e) Mean Time to Failure (MTTF) of single-phase converter with parallel-switch and standby-switch modules.
(a) (b) (c) (d)
(e)
Figure 7. Fuzzy curves related to two-phase converter (a) failure rate of a switch in parallel-switch configuration, (b) failure rate of a switch in standby-switch configuration, (c) failure rate of parallel-switch configuration, (d) failure rate of standby-switch configuration, and (e) MTTF of two-phase converter with parallel-switch and standby-switch modules.
(2)PMTTF
(2)sbMTTF
0.0681 0.1140
1
0.1191 0.2985 0.7120.0212Fuzz
y M
embe
rshi
p V
alue
s
6MTTF (10 hour)
(2)sbλ
4.581 5.817 7.211
1
Fuzz
y M
embe
rshi
p V
alue
s
6failure rate (1/10 hour)
(2)Pλ
4.13 7.378 13.01
1
Fuzz
y M
embe
rshi
p V
alue
s
6failure rate (1/10 hour)6failure rate (1/10 hour)
(2)Fλ
8.24 9.89 11.53
1
Fuzz
y M
embe
rshi
p V
alue
s
6failure rate (1/10 hour)
(2)Hλ
6.435 7.722 9.009
1
Fuzz
yM
embe
rshi
pV
alue
s
6MTTF (10 hour)
(1)PMTTF
(1)sbMTTF
0 .042 0.0639 0.0738
1
0.0791 0.101 0.132Fuzz
y M
embe
rshi
p V
alue
s
6failure rate (1/10 hour)
(1)sbλ
9.941 12.63 15.65
1
Fuzz
y M
embe
rshi
p V
alue
s
6failure rate (1/10 hour)
(1)Pλ
7.58 13.54 23.614
1
Fuzz
y M
embe
rshi
p V
alue
s
6failure rate (1/10 hour)
(1)Fλ
17.89 21.47 25.05
1
Fuzz
y M
embe
rshi
p V
alue
s
6failure rate (1/10 hour)
(1)Hλ
10.11 12.13 14.16
1
Fuzz
y M
embe
rshi
p V
alue
s
Figure 7. Fuzzy curves related to two-phase converter (a) failure rate of a switch in parallel-switchconfiguration, (b) failure rate of a switch in standby-switch configuration, (c) failure rate ofparallel-switch configuration, (d) failure rate of standby-switch configuration, and (e) MTTF oftwo-phase converter with parallel-switch and standby-switch modules.
Appl. Sci. 2019, 9, 88 11 of 17Appl. Sci. 2018, 8, x FOR PEER REVIEW 11 of 17
(a) (b) (c) (d)
(e)
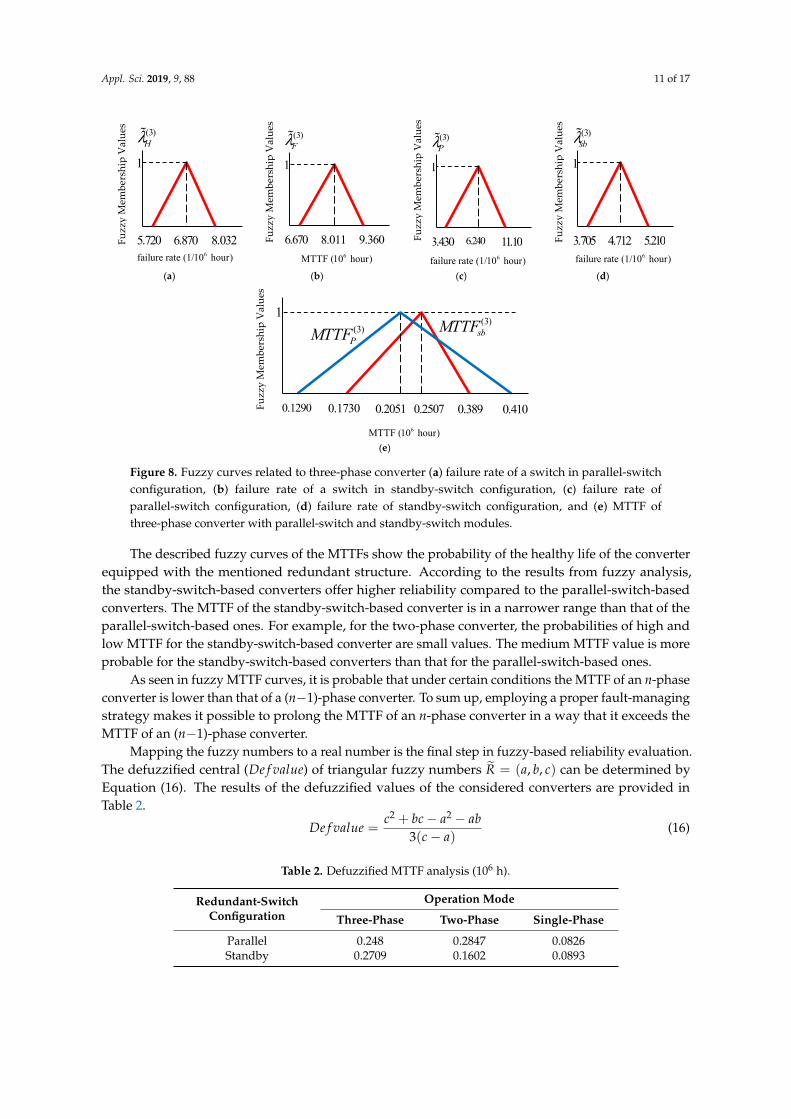
Figure 8. Fuzzy curves related to three-phase converter (a) failure rate of a switch in parallel-switch configuration, (b) failure rate of a switch in standby-switch configuration, (c) failure rate of parallel-switch configuration, (d) failure rate of standby-switch configuration, and (e) MTTF of three-phase converter with parallel-switch and standby-switch modules.
The described fuzzy curves of the MTTFs show the probability of the healthy life of the converter equipped with the mentioned redundant structure. According to the results from fuzzy analysis, the standby-switch-based converters offer higher reliability compared to the parallel-switch-based converters. The MTTF of the standby-switch-based converter is in a narrower range than that of the parallel-switch-based ones. For example, for the two-phase converter, the probabilities of high and low MTTF for the standby-switch-based converter are small values. The medium MTTF value is more probable for the standby-switch-based converters than that for the parallel-switch-based ones.
As seen in fuzzy MTTF curves, it is probable that under certain conditions the MTTF of an n-phase converter is lower than that of a (n-1)-phase converter. To sum up, employing a proper fault-managing strategy makes it possible to prolong the MTTF of an n-phase converter in a way that it exceeds the MTTF of an (n-1)-phase converter.
Mapping the fuzzy numbers to a real number is the final step in fuzzy-based reliability evaluation. The defuzzified central ( Defvalue ) of triangular fuzzy numbers ( , , )R a b c= can be determined by equation (16). The results of the defuzzified values of the considered converters are provided in Table 2.
2 2
3( )c bc a abDefvalue
c a+ − −=
− (16)
Table 2. Defuzzified MTTF analysis (106 hour).
Redundant-Switch Configuration
Operation Mode
Three-phase Two-phase Single-phase
Parallel 0.248 0.2847 0.0826
6MTTF (10 hour)
(3)sbMTTF(3)
PMTTF
0.1290 0.1730 0.2051
1
0.2507 0.389 0.410Fuzz
y M
embe
rshi
p V
alue
s
(3)sbλ
3.705 4.712 5.210
1
Fuzz
y M
embe
rshi
p V
alue
s
6failure rate (1/10 hour)
(3)Pλ
3.430 6.240 11.10
1
Fuzz
y M
embe
rshi
p V
alue
s
6failure rate (1/10 hour)6MTTF (10 hour)
(3)Fλ
6.670 8.011 9.360
1
Fuzz
y M
embe
rshi
p V
alue
s
(3)Hλ
5.720 6.870 8.032
1
Fuzz
y M
embe
rshi
p V
alue
s
6failure rate (1/10 hour)
Figure 8. Fuzzy curves related to three-phase converter (a) failure rate of a switch in parallel-switchconfiguration, (b) failure rate of a switch in standby-switch configuration, (c) failure rate ofparallel-switch configuration, (d) failure rate of standby-switch configuration, and (e) MTTF ofthree-phase converter with parallel-switch and standby-switch modules.
The described fuzzy curves of the MTTFs show the probability of the healthy life of the converterequipped with the mentioned redundant structure. According to the results from fuzzy analysis,the standby-switch-based converters offer higher reliability compared to the parallel-switch-basedconverters. The MTTF of the standby-switch-based converter is in a narrower range than that of theparallel-switch-based ones. For example, for the two-phase converter, the probabilities of high andlow MTTF for the standby-switch-based converter are small values. The medium MTTF value is moreprobable for the standby-switch-based converters than that for the parallel-switch-based ones.
As seen in fuzzy MTTF curves, it is probable that under certain conditions the MTTF of an n-phaseconverter is lower than that of a (n−1)-phase converter. To sum up, employing a proper fault-managingstrategy makes it possible to prolong the MTTF of an n-phase converter in a way that it exceeds theMTTF of an (n−1)-phase converter.
Mapping the fuzzy numbers to a real number is the final step in fuzzy-based reliability evaluation.The defuzzified central (De f value) of triangular fuzzy numbers R̃ = (a, b, c) can be determined byEquation (16). The results of the defuzzified values of the considered converters are provided inTable 2.
De f value =c2 + bc− a2 − ab
3(c− a)(16)
Table 2. Defuzzified MTTF analysis (106 h).
Redundant-SwitchConfiguration
Operation Mode
Three-Phase Two-Phase Single-Phase
Parallel 0.248 0.2847 0.0826Standby 0.2709 0.1602 0.0893
Appl. Sci. 2019, 9, 88 12 of 17
According to Table 2, it can be concluded that:
• Standby-switch-based converter is suitable for three-phase and single-phase operation mode.• The MTTF of the three-phase converter is lower than that of the parallel-switch-based two-phase
converter. Hence, the parallel-switch-based two-phase converter offers the highest reliability level.
For instance, the overall MTTF of the standby-switch-based converter in three-phase operationmode is 0.279 (106 h). This means that, regarding all the uncertainties, the mean life span of theconverter in this operation mode is approximately 32 years ((0.297 × 10⁶)/(365 × 2)).
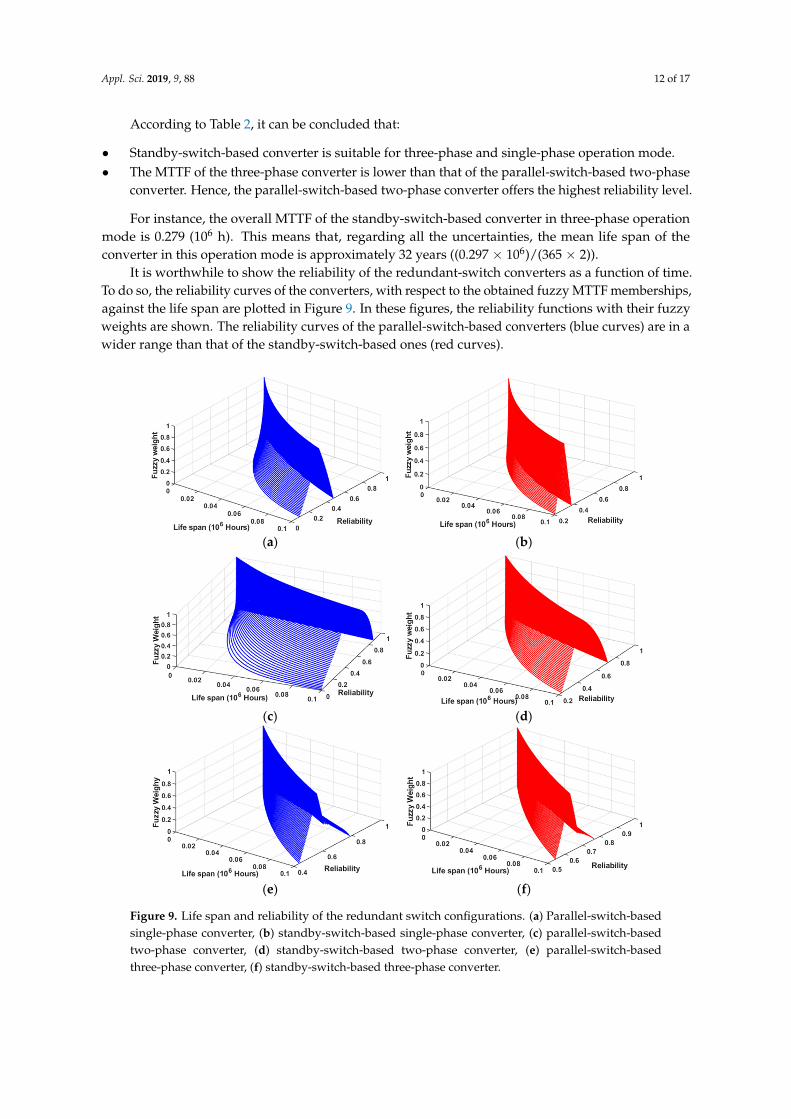
It is worthwhile to show the reliability of the redundant-switch converters as a function of time.To do so, the reliability curves of the converters, with respect to the obtained fuzzy MTTF memberships,against the life span are plotted in Figure 9. In these figures, the reliability functions with their fuzzyweights are shown. The reliability curves of the parallel-switch-based converters (blue curves) are in awider range than that of the standby-switch-based ones (red curves).
Appl. Sci. 2018, 8, x FOR PEER REVIEW 12 of 17
Standby 0.2709 0.1602 0.0893
According to Table 2, it can be concluded that:
• Standby-switch-based converter is suitable for three-phase and single-phase operation mode. • The MTTF of the three-phase converter is lower than that of the parallel-switch-based
two-phase converter. Hence, the parallel-switch-based two-phase converter offers the highest reliability level.
For instance, the overall MTTF of the standby-switch-based converter in three-phase operation mode is 0.279 (106 hours). This means that, regarding all the uncertainties, the mean life span of the converter in this operation mode is approximately 32 years ((0.297×10⁶)/(365×2)).
It is worthwhile to show the reliability of the redundant-switch converters as a function of time. To do so, the reliability curves of the converters, with respect to the obtained fuzzy MTTF memberships, against the life span are plotted in Figure 9. In these figures, the reliability functions with their fuzzy weights are shown. The reliability curves of the parallel-switch-based converters (blue curves) are in a wider range than that of the standby-switch-based ones (red curves).
(a) (b)
(c) (d)
(e) (f)
Figure 9. Life span and reliability of the redundant switch configurations. (a) Parallel-switch-based single-phase converter, (b) standby-switch-based single-phase converter, (c) parallel-switch-based two-phase converter, (d) standby-switch-based two-phase converter, (e) parallel-switch-based three-phase converter, (f) standby-switch-based three-phase converter.
Figure 9. Life span and reliability of the redundant switch configurations. (a) Parallel-switch-basedsingle-phase converter, (b) standby-switch-based single-phase converter, (c) parallel-switch-basedtwo-phase converter, (d) standby-switch-based two-phase converter, (e) parallel-switch-basedthree-phase converter, (f) standby-switch-based three-phase converter.
Appl. Sci. 2019, 9, 88 13 of 17
6. Simulation and Experimental Results
In this section, simulation results, obtained in Matlab/Simulink, and the experimental results,extracted from a lab-scaled prototype, are provided to verify the performance of the redundant-switchbased converter. The characteristics of the employed elements are listed in Table 3. For brevity onlythe commercial name of the components are listed in this table; however, the detail information can befound in the datasheets.
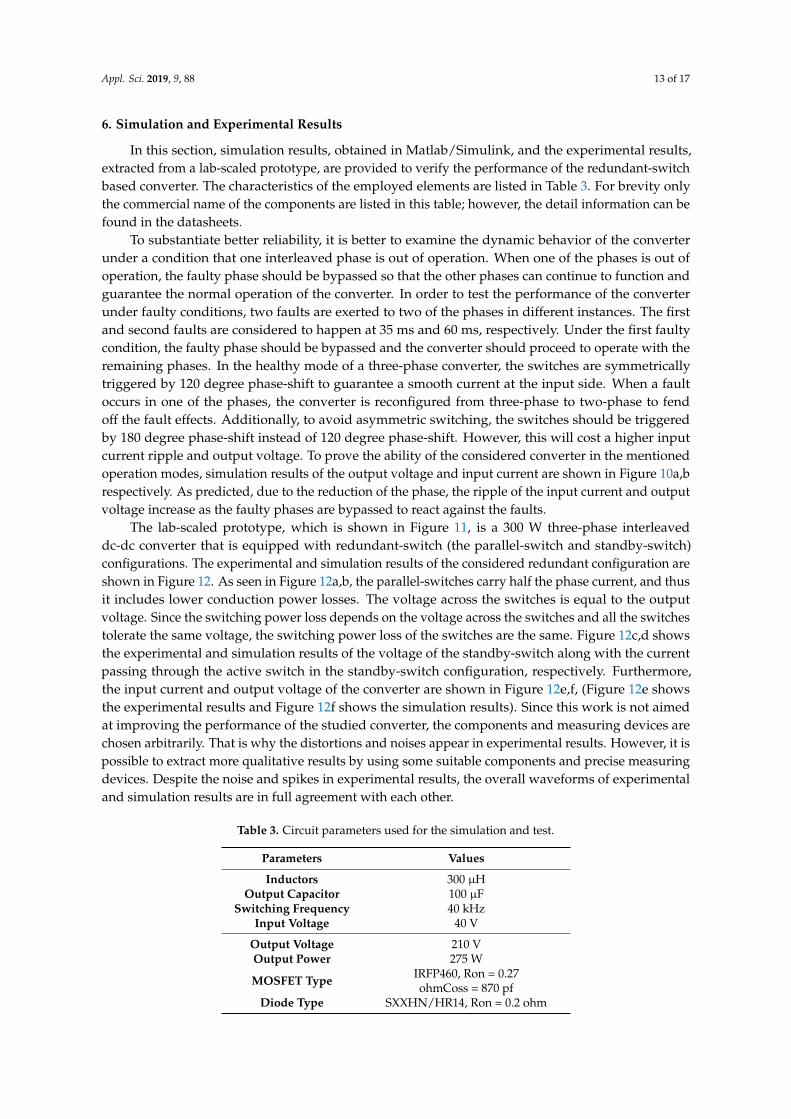
To substantiate better reliability, it is better to examine the dynamic behavior of the converterunder a condition that one interleaved phase is out of operation. When one of the phases is out ofoperation, the faulty phase should be bypassed so that the other phases can continue to function andguarantee the normal operation of the converter. In order to test the performance of the converterunder faulty conditions, two faults are exerted to two of the phases in different instances. The firstand second faults are considered to happen at 35 ms and 60 ms, respectively. Under the first faultycondition, the faulty phase should be bypassed and the converter should proceed to operate with theremaining phases. In the healthy mode of a three-phase converter, the switches are symmetricallytriggered by 120 degree phase-shift to guarantee a smooth current at the input side. When a faultoccurs in one of the phases, the converter is reconfigured from three-phase to two-phase to fendoff the fault effects. Additionally, to avoid asymmetric switching, the switches should be triggeredby 180 degree phase-shift instead of 120 degree phase-shift. However, this will cost a higher inputcurrent ripple and output voltage. To prove the ability of the considered converter in the mentionedoperation modes, simulation results of the output voltage and input current are shown in Figure 10a,brespectively. As predicted, due to the reduction of the phase, the ripple of the input current and outputvoltage increase as the faulty phases are bypassed to react against the faults.
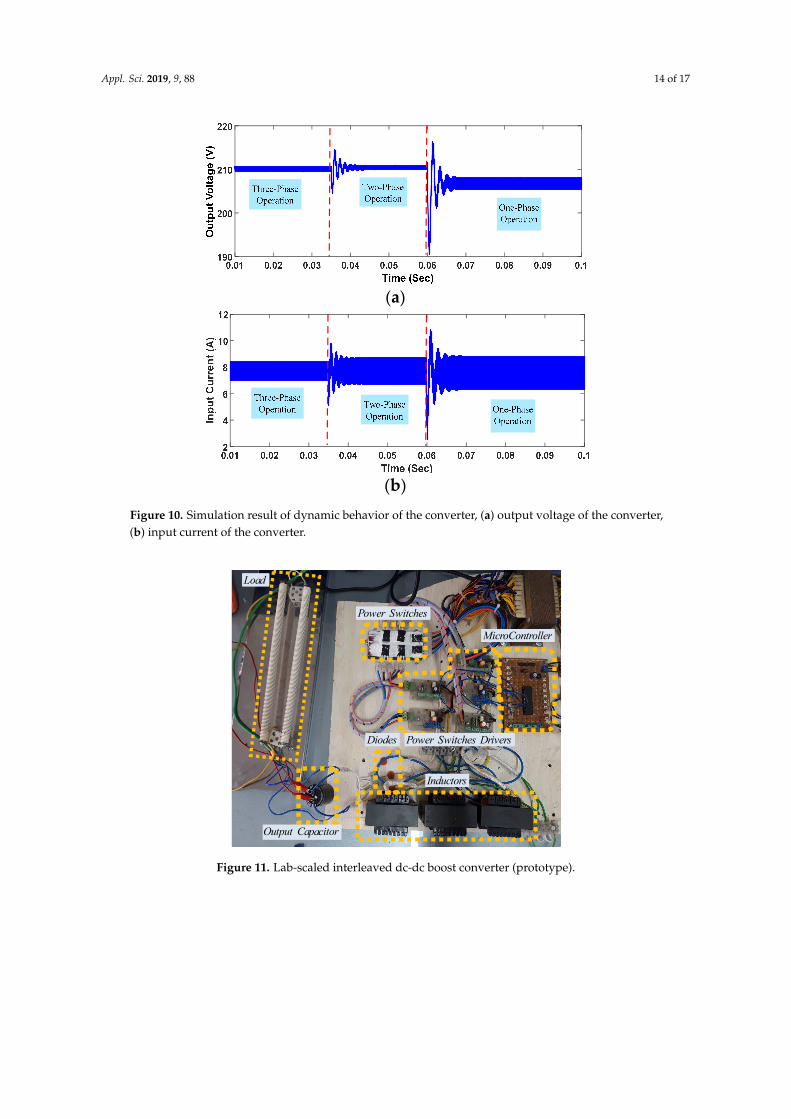
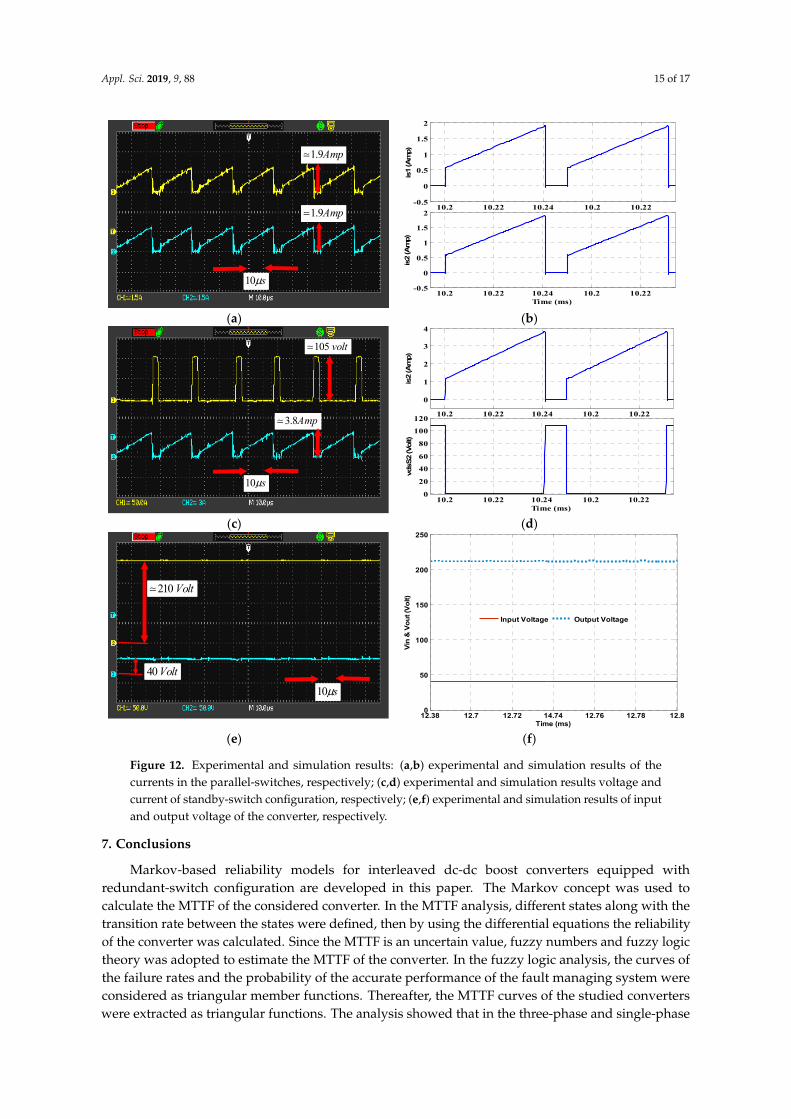
The lab-scaled prototype, which is shown in Figure 11, is a 300 W three-phase interleaveddc-dc converter that is equipped with redundant-switch (the parallel-switch and standby-switch)configurations. The experimental and simulation results of the considered redundant configuration areshown in Figure 12. As seen in Figure 12a,b, the parallel-switches carry half the phase current, and thusit includes lower conduction power losses. The voltage across the switches is equal to the outputvoltage. Since the switching power loss depends on the voltage across the switches and all the switchestolerate the same voltage, the switching power loss of the switches are the same. Figure 12c,d showsthe experimental and simulation results of the voltage of the standby-switch along with the currentpassing through the active switch in the standby-switch configuration, respectively. Furthermore,the input current and output voltage of the converter are shown in Figure 12e,f, (Figure 12e showsthe experimental results and Figure 12f shows the simulation results). Since this work is not aimedat improving the performance of the studied converter, the components and measuring devices arechosen arbitrarily. That is why the distortions and noises appear in experimental results. However, it ispossible to extract more qualitative results by using some suitable components and precise measuringdevices. Despite the noise and spikes in experimental results, the overall waveforms of experimentaland simulation results are in full agreement with each other.
Table 3. Circuit parameters used for the simulation and test.
Parameters Values
Inductors 300 µHOutput Capacitor 100 µF
Switching Frequency 40 kHzInput Voltage 40 V
Output Voltage 210 VOutput Power 275 W
MOSFET Type IRFP460, Ron = 0.27ohmCoss = 870 pf
Diode Type SXXHN/HR14, Ron = 0.2 ohm
Appl. Sci. 2019, 9, 88 14 of 17Appl. Sci. 2018, 8, x FOR PEER REVIEW 14 of 17
(a)
(b)
Figure 10. Simulation result of dynamic behavior of the converter, (a) output voltage of the converter, (b) input current of the converter.
Table 3. Circuit parameters used for the simulation and test.
Figure 11. Lab-scaled interleaved dc-dc boost converter (prototype).
Parameters Values
Inductors 300 µH Output Capacitor 100 µF
Switching Frequency 40k Hz Input Voltage 40 V
Output Voltage 210 V Output Power 275 W
MOSFET Type
IRFP460, Ron=0.27 ohm Coss=870 pf
Diode Type SXXHN/HR14, Ron=0.2 ohm
Load
Power Switches
Power Switches Drivers
MicroController
Inductors
Diodes
Output Capacitor
Figure 10. Simulation result of dynamic behavior of the converter, (a) output voltage of the converter,(b) input current of the converter.
Appl. Sci. 2018, 8, x FOR PEER REVIEW 14 of 17
(a)
(b)
Figure 10. Simulation result of dynamic behavior of the converter, (a) output voltage of the converter, (b) input current of the converter.
Table 3. Circuit parameters used for the simulation and test.
Figure 11. Lab-scaled interleaved dc-dc boost converter (prototype).
Parameters Values
Inductors 300 µH Output Capacitor 100 µF
Switching Frequency 40k Hz Input Voltage 40 V
Output Voltage 210 V Output Power 275 W
MOSFET Type
IRFP460, Ron=0.27 ohm Coss=870 pf
Diode Type SXXHN/HR14, Ron=0.2 ohm
Load
Power Switches
Power Switches Drivers
MicroController
Inductors
Diodes
Output Capacitor
Figure 11. Lab-scaled interleaved dc-dc boost converter (prototype).
Appl. Sci. 2019, 9, 88 15 of 17
Appl. Sci. 2018, 8, x FOR PEER REVIEW 15 of 17
(a) (b)
(c) (d)
(e) (f)
Figure 12. Experimental and simulation results: (a) and (b) experimental and simulation results of the currents in the parallel-switches, respectively; (c) and (d) experimental and simulation results voltage and current of standby-switch configuration, respectively; (e) and (f) experimental and simulation results of input and output voltage of the converter, respectively.
7. Conclusion
Markov-based reliability models for interleaved dc-dc boost converters equipped with redundant-switch configuration are developed in this paper. The Markov concept was used to calculate the MTTF of the considered converter. In the MTTF analysis, different states along with the transition rate between the states were defined, then by using the differential equations the reliability of the converter was calculated. Since the MTTF is an uncertain value, fuzzy numbers and fuzzy logic theory was adopted to estimate the MTTF of the converter. In the fuzzy logic analysis,
10.2 10.22 10.24 10.2 10.22-0.5
0
0.5
1
1.5
2
Time (ms)
is2
(Am
p)
10.2 10.22 10.24 10.2 10.22-0.5
0
0.5
1
1.5
2
is1
(Am
p)
10.2 10.22 10.24 10.2 10.220
20
4060
80
100120
Time (ms)
vdsS
2 (V
olt)
10.2 10.22 10.24 10.2 10.22
0
1
2
3
4
is2
(Am
p)
12.38 12.7 12.72 14.74 12.76 12.78 12.80
50
100
150
200
250
Time (ms)
Vin
& V
out (
Volt)
Input Voltage Output Voltage
10 sμ
210 Volt
40 Volt
10 sμ
105 volt
3.8Amp
1.9Amp
1.9Amp
10 sμ
Figure 12. Experimental and simulation results: (a,b) experimental and simulation results of thecurrents in the parallel-switches, respectively; (c,d) experimental and simulation results voltage andcurrent of standby-switch configuration, respectively; (e,f) experimental and simulation results of inputand output voltage of the converter, respectively.
7. Conclusions
Markov-based reliability models for interleaved dc-dc boost converters equipped withredundant-switch configuration are developed in this paper. The Markov concept was used tocalculate the MTTF of the considered converter. In the MTTF analysis, different states along with thetransition rate between the states were defined, then by using the differential equations the reliabilityof the converter was calculated. Since the MTTF is an uncertain value, fuzzy numbers and fuzzy logictheory was adopted to estimate the MTTF of the converter. In the fuzzy logic analysis, the curves ofthe failure rates and the probability of the accurate performance of the fault managing system wereconsidered as triangular member functions. Thereafter, the MTTF curves of the studied converterswere extracted as triangular functions. The analysis showed that in the three-phase and single-phase
Appl. Sci. 2019, 9, 88 16 of 17
configuration the standby-switch configuration offers higher reliability, but in two-phase configurationthe parallel-switch configuration has the highest reliability. In order to prove the feasibility of theconsidered system, it was both studied through the simulation and experimental tests. However,a long time interval (several years) would be needed to prove the accuracy of the analyzed MTTF.For this reason, in the simulation and experimental tests only the performance of the suggestedredundant-switch configurations was considered.
Author Contributions: Conceptualization, T.R.; Project administration, A.S.B.; Supervision, S.H.H.; Validation,F.B.; Writing—original draft, H.K.J.
Funding: This research received no external funding.
Conflicts of Interest: The authors declare no conflict of interest.
References
1. Blaabjerg, F.; Ma, K. Future on power electronics for wind turbine systems. IEEE J. Emerg. Sel. Top.Power Electron. 2013, 1, 139–152. [CrossRef]
2. Bahman, A.S.; Iannuzzo, F.; Blaabjerg, F. Mission-profile-based stress analysis of bond-wires in SiC powermodules. Microelectron. Reliab. 2016, 64, 419–424. [CrossRef]
3. Rahimi, T.; Hosseini, S.H.; Sabahi, M.; Abapour, M.; Gharehpetian, G.B. Three-phase soft-switching-basedinterleaved boost converter with high reliability. IET Power Electron. 2017, 10, 377–386. [CrossRef]
4. Ma, K.; Bahman, A.S.; Beczkowski, S.; Blaabjerg, F. Complete loss and thermal model of powersemiconductors including device rating information. IEEE Trans. Power Electron. 2015, 30, 2556–2569.[CrossRef]
5. Silveira, G.C.; Tofoli, F.L.; Bezerra, L.D.; Torrico-Bascopé, R.P. A nonisolated DC–DC boost converter withhigh voltage gain and balanced output voltage. IEEE Trans. Ind. Electron. 2014, 61, 6739–6746. [CrossRef]
6. Lee, F.C.; Barbosa, P. The state-of-the-art power electronics technologies and future trends. In Proceedingsof the Transmission and Distribution Conference and Exposition, 2001 IEEE/PES, Atlanta, GA, USA,28 October–2 November 2001; Volume 2, pp. 1188–1193.
7. Blaabjerg, F.; Chen, Z.; Kjaer, S.B. Power electronics as efficient interface in dispersed power generationsystems. IEEE Trans. Power Electron. 2004, 19, 1184–1194. [CrossRef]
8. Burress, T.; Campbell, S. Benchmarking EV and HEV power electronics and electric machines.In Proceedings of the Transportation Electrification Conference and Expo (ITEC), Dearborn/Detroit, MI,USA, 16–19 June 2013; pp. 1–6.
9. Song, Y.; Wang, B. Evaluation methodology and control strategies for improving reliability of HEV powerelectronic system. IEEE Trans. Veh. Technol. 2014, 63, 3661–3676. [CrossRef]
10. Rahimi, T.; Hosseini, S.H.; Sabahi, M.; Shalchi Alishah, R. EMI Consideration of High Reliability DC-DCConverter: In Aerospace Based Electric Transport System Charger Application. Prog. Electromagn. Res. 2016,46, 125–133. [CrossRef]
11. Ghimire, P.; de Vega, A.R.; Beczkowski, S.; Rannestad, B.; Munk-Nielsen, S.; Thogersen, P. Improving powerconverter reliability: Online monitoring of high-power IGBT modules. IEEE Ind. Electron. Mag. 2014, 8,40–50. [CrossRef]
12. Emadi, K.; Ehsani, M. Aircraft power systems: Technology, state of the art, and future trends. IEEE Aerosp.Electron. Syst. Mag. 2000, 15, 28–32. [CrossRef]
13. Zhou, D.; Blaabjerg, F.; Franke, T.; Tønnes, M.; Lau, M. Comparison of wind power converter reliability withlow-speed and medium-speed permanent-magnet synchronous generators. IEEE Trans. Ind. Electron. 2015,62, 6575–6584. [CrossRef]
14. Wang, H.; Liserre, M.; Blaabjerg, F. Toward reliable power electronics: Challenges, design tools,and opportunities. IEEE Ind. Electron. Mag. 2013, 7, 17–26. [CrossRef]
15. Bunker, K.; Cook, M.; Weaver, W.; Parker, G. Multidimensional Optimal Droop Control for DC Microgrids inMilitary Applications. Appl. Sci. 2018, 8, 1966. [CrossRef]
16. Jahan, H.K.; Panahandeh, F.; Abapour, M.; Tohidi, S. Reconfigurable Multilevel Inverter with Fault-TolerantAbility. IEEE Trans. Power Electron. 2018, 33, 7880–7893. [CrossRef]
Appl. Sci. 2019, 9, 88 17 of 17
17. Khosroshahi, A.; Abapour, M.; Sabahi, M. Reliability evaluation of conventional and interleaved DC–DCboost converters. IEEE Trans. Power Electron. 2015, 30, 5821–5828. [CrossRef]
18. Zarghany, M.; Parvari, R.; Kaboli, S. Fault-tolerant dc power distribution unit based on nonexclusiveredundant modules. IEEE Trans. Ind. Electron. 2016, 63, 6801–6811. [CrossRef]
19. Colmenares, J.; Sadik, D.P.; Hilber, P.; Nee, H.P. Reliability analysis of a high-efficiency SiC three-phaseinverter. IEEE J. Emerg. Sel. Top. 2016, 4, 996–1006. [CrossRef]
20. Sakly, J.; Abdelghani, A.B.; Slama-Belkhodja, I.; Sammoud, H. Reconfigurable DC/DC converter for efficiencyand reliability optimization. IEEE J. Emerg. Sel. Top. Power Electron. 2017, 5, 1216–1224. [CrossRef]
21. MIL-HDBK-217F Notice 2, Military Handbook-Reliability Prediction of Electronic Equipment; Department of USDefense: Washington, DC, USA, 1995.
22. Rahimi, T.; Hosseini, S.H. EMI consideration of high reliability electrical power subsystem (EPS) of satellite.In Proceedings of the Power Electronics, Drives Systems & Technologies Conference (PEDSTC), Tehran, Iran,3–4 February 2015; pp. 412–417.
23. Gautam, N.K.; Kaushika, N.D. Reliability evaluation of solar photovoltaic arrays. Sol. Energy 2002, 72,129–141. [CrossRef]
24. Sangwongwanich, A.; Yang, Y.; Sera, D.; Blaabjerg, F. Lifetime evaluation of grid-connected PV invertersconsidering panel degradation rates and installation sites. IEEE Trans. Power Electron. 2018, 33, 1225–1236.[CrossRef]
25. Muhuri, P.K.; Ashraf, Z.; Lohani, Q.D. Multiobjective Reliability Redundancy Allocation Problem withInterval Type-2 Fuzzy Uncertainty. IEEE Trans. Fuzzy Syst. 2018, 26, 1339–1355.
26. Li, L.L.; Lv, C.M.; Tseng, M.L.; Sun, J. Reliability measure model for electromechanical products undermultiple types of uncertainties. Appl. Soft Comput. 2018, 65, 69–78. [CrossRef]
27. Aikhuele, D.O. Intuitionistic Fuzzy Model for Reliability Management in Wind Turbine System.Appl. Comput. Inform. 2018. [CrossRef]
28. Fuh, C.F.; Jea, R.; Su, J.S. Fuzzy system reliability analysis based on level (λ, 1) interval-valued fuzzy numbers.Inf. Sci. 2014, 272, 185–197. [CrossRef]
29. Gonzalez-Gonzalez, D.S.; Alejo, R.J.; Cantú-Sifuentes, M.; Torres-Treviño, L.M.; Méndez, G.M. A non-linearfuzzy regression for estimating reliability in a degradation process. Appl. Soft Comput. 2014, 16, 137–147.[CrossRef]
30. Wang, Z.; Li, Y.; Huang, H.Z.; Liu, Y. Reliability analysis of structure for fuzzy safety state. Intell. Autom.Soft Comput. 2012, 18, 215–224. [CrossRef]
31. Rahimi, T.; Hosseini, S.H.; Sabahi, M.; Gharehpetian, G.B.; Abapour, M. Reliability evaluation of afault-tolerant three-phase interleaved DC-DC boost converter. Trans. Inst. Meas. Control. 2018, accepted.[CrossRef]
32. Behjati, H.; Davoudi, A. Reliability analysis framework for structural redundancy in power semiconductors.IEEE Trans. Ind. Electron. 2013, 60, 4376–4386. [CrossRef]
33. Abdi, B.; Ranjbar, A.H.; Gharehpetian, G.B.; Milimonfared, J. Reliability considerations for parallelperformance of semiconductor switches in high-power switching power supplies. IEEE Trans. Ind. Electron.2009, 56, 2133–2139. [CrossRef]
34. Alferidi, A.; Karki, R. Development of Probabilistic Reliability Models of Photovoltaic System Topologies forSystem Adequacy Evaluation. Appl. Sci. 2017, 7, 176. [CrossRef]
35. Billinton, R.; Allan, R.N. Reliability Evaluation of Engineering Systems; Plenum Press: New York, NY, USA, 1992.
© 2018 by the authors. Licensee MDPI, Basel, Switzerland. This article is an open accessarticle distributed under the terms and conditions of the Creative Commons Attribution(CC BY) license (http://creativecommons.org/licenses/by/4.0/).