fuzzy logic expert system for automated damage detection...
TRANSCRIPT
FUZZY LOGIC EXPERT SYSTEM FOR AUTOMATEDDAMAGE DETECTION FROM CHANGES IN STRAIN
ENERGY MODE SHAPES
EDWARD S. SAZONOVa, POWSIRI KLINKHACHORNa, HOTA V.S. GANGARAOb and
UDAYA B. HALABEb,*
aLane Department of Computer Science and Electrical Engineering, West Virginia University,Morgantown, WV 26506, USA; bDepartment of Civil and Environmental Engineering, Constructed
Facilities Center, West Virginia University, Morgantown, WV 26506 USA
(Received 8 June 2001; In final form 25 September 2001)
In recent years, researchers have developed several methods for damage detection in structures employing strainenergy or curvature mode shapes. Experience shows that mode shape methods are highly sensitive to measurementnoise. Such sensitivity is a direct result of the second derivative applied to the displacement mode shapes, whichproduces curvature mode shapes. Calculation of strain energy mode shapes includes calculation of curvature as well.Consequently, the artifact false peaks (normally an indicator of damage) appear on the strain energy mode shapes,reducing accuracy of damage recognition. Combined with the intrinsic variance in damage peak shapes andamplitudes dependent upon magnitude and location of damage, the false peaks create a major problem for automateddetection of damage location. Most often, a highly qualified expert is required to analyze the data and to identify andlocate damage. In an attempt to replace the human expert with a computer, this paper describes a fuzzy logic expertsystem designed to mimic the human decision process. An expert system allows for easy encoding of expertknowledge as a set of rules. “Fuzziness” of the expert system allows better treatment of the uncertainties of theproblem and to simplify the expert system itself. The fuzzy expert system has been designed based on a finite element(FE) model of a simple beam and has provided reliable detection of damage for every tested damage scenario (100%recognition). The same system recognized damages with 100% accuracy, and no false positives or negatives on modeshapes acquired by impact testing and/or non-contact laser vibrometer techniques.
Keywords: Automated damage detection; Strain energy mode shapes; Curvature mode shapes; Fuzzy logic; Expertsystem
INTRODUCTION
Several non-destructive methods are being explored for structural damage detection based on
curvature mode shapes and strain energy mode shapes [1–9]. All these methods have
approximately the same damage detection procedure. For example, the procedure developed
at the Constructed Facilities Center, West Virginia University [3,4] is shown in Fig. 1. The
process of strain energy calculations is exemplified on the first mode of vibration, although
several modes are usually used. Dynamic data from experiments or finite element (FE)
ISSN 1058-9759 q 2002 Taylor & Francis Ltd
DOI: 10.1080/10589750290026556
*Corresponding author.
Nondestructive Testing and Evaluation, 2002 Vol. 18 (1), pp. 1–20

models of a structure provide initial data in the form of displacement mode shapes (DMS).
Strain energy mode shapes are computed from DMS through the application of the strain
energy formula (Fig. 1); the process includes calculation of the curvature mode shapes [3],
thus the strain energy mode shapes share all of the problems associated with the curvature
mode shapes. These problems are described further in this section.
Usually, strain energy mode shapes are computed for the structure with no damage
(baseline strain energy mode shapes or BSEMS) and for the structure under test, which may
have damage (test strain energy mode shapes or TSEMS). Then, the BSEMS are subtracted
from the TSEMS in order to obtain the so-called difference strain energy mode shapes
(DSEMS). The DSEMS indicate damage as changes in curvature at damaged locations,
observable as peaks on DSEMS. The strain energy method has a second derivative
(calculation of curvature) applied to the DMS in order to calculate both BSEMS and TSEMS.
Due to the nature of the second derivative, instrumentation and measurement noise is
significantly amplified on BSEMS and TSEMS and, consequently, on DSEMS. Visually,
such noise appears as peaks, which sometimes closely resemble damage peaks. The noise
problem stipulates the fact that DSEMS derived from several modes have to be considered
together in order to reject false peaks and to supply a reliable detection result. There are
several other problems (described in the section, “Building an Automated Damage Detection
System”) that significantly influence the complexity and quality of the damage detection
process. Routinely, a human expert is necessary to analyze mode shape information and
estimate damage location in a structure. Automated detection of damage using simple
FIGURE 1 Illustration of a damage detection method employing curvature calculations. First bending mode isshown.
E.S. SAZONOV et al.2
measures like magnitude of peaks (thresholding) proved less reliable, both in regard to noise
and multiple damage scenarios [10]. The purpose of this paper is to discuss an approach for
automated damage detection using strain energy mode shapes. Given DMS, the automated
system provides suspected damage locations as its output. This software system was
designed as a proof-of-a-principle using a FE model of a free–free beam. Given the
assumption that the behavior of the FE model very closely resembles the behavior of the real
beam and the fact that FE data do not have instrumentation and measurement noise present,
the FE model provides a valuable tool for studying damage peak behavior. The software
system was later successfully tested on experimental data acquired using impact testing and
non-contact scanning laser vibrometer.
INITIAL DATA
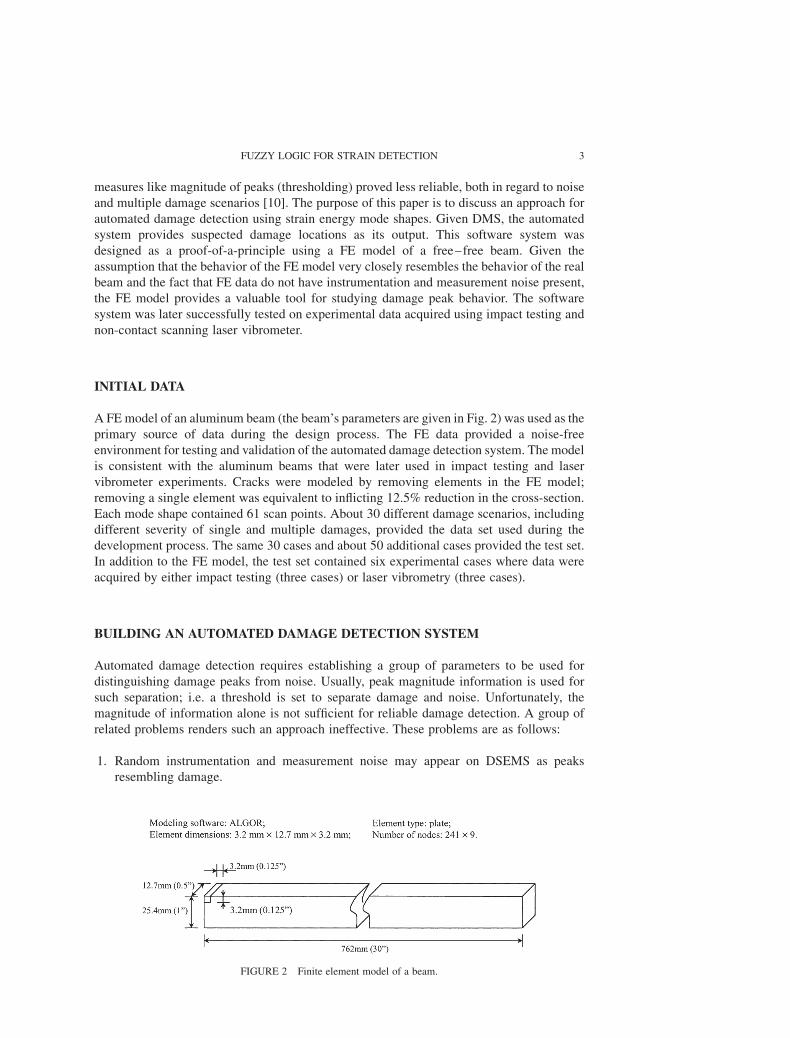
A FE model of an aluminum beam (the beam’s parameters are given in Fig. 2) was used as the
primary source of data during the design process. The FE data provided a noise-free
environment for testing and validation of the automated damage detection system. The model
is consistent with the aluminum beams that were later used in impact testing and laser
vibrometer experiments. Cracks were modeled by removing elements in the FE model;
removing a single element was equivalent to inflicting 12.5% reduction in the cross-section.
Each mode shape contained 61 scan points. About 30 different damage scenarios, including
different severity of single and multiple damages, provided the data set used during the
development process. The same 30 cases and about 50 additional cases provided the test set.
In addition to the FE model, the test set contained six experimental cases where data were
acquired by either impact testing (three cases) or laser vibrometry (three cases).
BUILDING AN AUTOMATED DAMAGE DETECTION SYSTEM
Automated damage detection requires establishing a group of parameters to be used for
distinguishing damage peaks from noise. Usually, peak magnitude information is used for
such separation; i.e. a threshold is set to separate damage and noise. Unfortunately, the
magnitude of information alone is not sufficient for reliable damage detection. A group of
related problems renders such an approach ineffective. These problems are as follows:
1. Random instrumentation and measurement noise may appear on DSEMS as peaks
resembling damage.
FIGURE 2 Finite element model of a beam.
FUZZY LOGIC FOR STRAIN DETECTION 3
2. Subtracting BSEMS from TSEMS may not completely cancel mode shape information
for undamaged locations. Incomplete cancellation of mode shape information is related
to the processes occurring in a damaged structure and may lead to the appearance of so-
called distortion peaks.
2.1. Both the amplitude of damage and distortion peaks depend on the severity of damage.
If a threshold is used for automated damage detection, the thresholding
algorithm should be able to set the threshold value adaptively to compensate
for this property.
2.2. Since neither damage location nor severity of damage is known a priori, it would be
difficult to develop a procedure for adaptive thresholding and, if used, such a
procedure would most probably introduce some additional error in the
interpretation of results for damage detection.
2.3. Amplitude of damage peaks also depends on damage location and order of the mode.
Observing a curvature mode shape, one can easily understand the reason for
this behavior. Curvature is related to the amount of bending energy at a
particular location [1,3]. There is no bending moment at the places where
strain energy is equal to zero. Therefore, a peak indicating damage either will
not appear at these locations or its amplitude will be very low. If damage is
located at such a place, amplitude of the peak might be much lower than the
amplitude of distortion or noise.
3. Damage peak shapes vary significantly depending on the peak’s location and noise
conditions.
4. Thresholding becomes further complicated if two or more damaged areas are present in
the structure. One of the closely spaced damages may completely mask another.
5. It is not always clear how to conduct the analysis across several modes. If a suspected
damage peak is found on some of the modes and is not found on the others, what
rules should be used to decide if it is an actual damage or not? Common sense rules
such as selecting the majority do not always work in situations like this. At the same
time, a human expert does not experience many of the problems associated with
thresholding.
An example, Fig. 3 shows the differences between the thresholding and the human
approach. The FE model simulates a rectangular aluminum beam that has two damaged
areas, the one at location 15 is equivalent to 25% depth cut, and another at location 20 is
equivalent to 12.5% depth cut. If thresholding at 50% of the maximum peak amplitude is
used for the detection of damage peaks, one could possibly find only one mode (mode 4) out
of the first five modes, where damage at location 20 can be detected. Thresholding with the
given threshold parameters does not detect this damage. Lowering the threshold could cause
the missing damage to appear on other mode shapes, but it would be difficult to establish a
procedure that could set the threshold at the optimal level. In addition, even if such a
procedure could be developed, it would not eliminate all the problems associated with the
thresholding. On the other hand, experience shows that a human expert easily detects this
type of damage.
A possible solution to this problem would be to create a system that has enough
“intelligence” to imitate the expert’s way of analyzing the mode shapes. One of the possible
implementations of such “intelligent” system is an expert system—a computer application
that allows explicit coding of the rules for making decisions. Expert knowledge may be
stored as a set of rules; the decision process analyzed and compared against the expert’s way
E.S. SAZONOV et al.4

of thinking; the set of rules can be changed without redesigning the whole system [11]. These
features could provide a convenient way to solve the present problem.
Logical reasoning performed using fuzzy logic allows operations with the concept of
partial truth. A fuzzy variable can take values anywhere in the range from “absolutely false”
to “absolutely true”, therefore fuzzy logic represents a superset of the conventional “crisp”
logic. The notion of partial truth makes fuzzy logic a very good means to model the natural
uncertainty of language, and consequently, expert knowledge that can be expressed in natural
language. The apparatus of fuzzy logic has been accommodated to allow easy manipulation
with verbal descriptions of numeric variables [12]. A linguistic variable is “a variable whose
values are words or sentences in a natural or artificial language” [13]. Each linguistic variable
may be assigned one or more linguistic values, which are in turn connected to a numeric
FIGURE 3 DSEMS of a multiple damage case (locations 15 and 20, FE model).
FUZZY LOGIC FOR STRAIN DETECTION 5
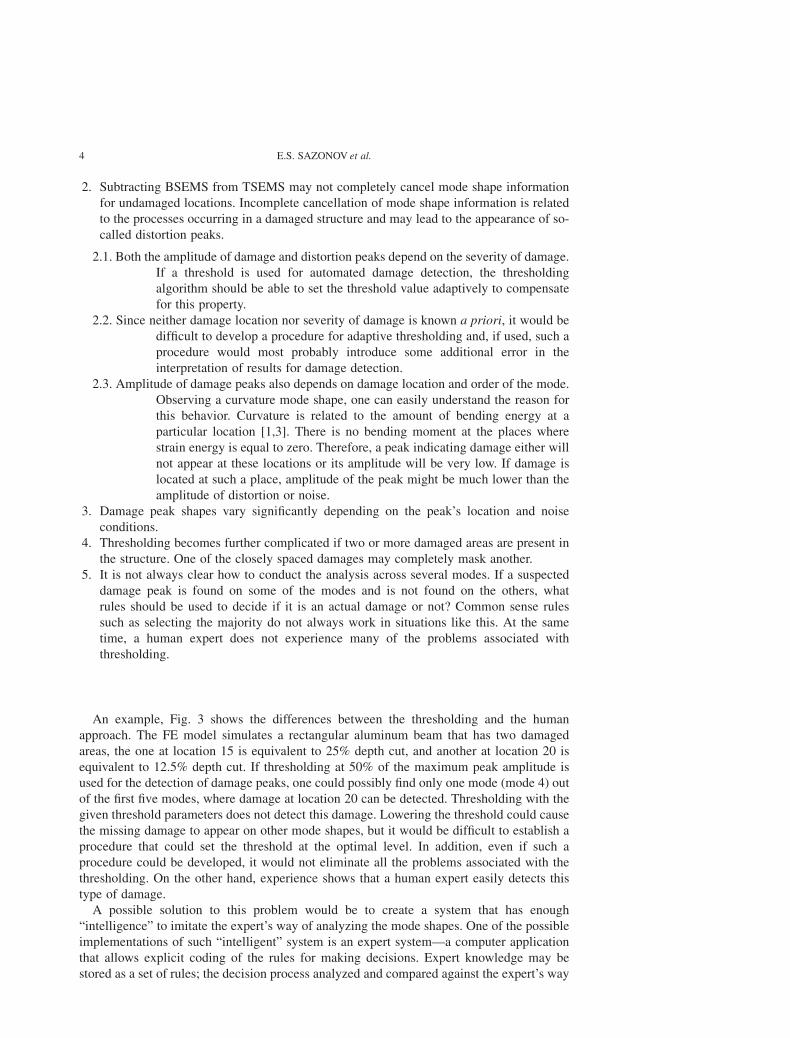
value through the mechanism of membership functions. For example (Fig. 4), a reading from
a measuring device may be connected to a linguistic variable “width” through membership
functions “narrow”, “normal” and “wide”. For the sensor reading of 2.75 cm, the linguistic
variable width can be characterized as having 0.25 membership in the fuzzy set narrow, 0.75
membership in the fuzzy set normal and 0.0 membership in the fuzzy set wide. Fuzzy
reasoning is conducted by utilizing linguistic variables and fuzzy sets represented by their
membership functions in rules, usually having the form of expression “if . . . then . . .” For the
given example, a rule may be something like: “if beam’s width is narrow then maximum load
is low.”
An expert system that operates on a collection of fuzzy variables and rules, according to
the principles of fuzzy logic is a fuzzy expert system [14]. Reasoning about data in a fuzzy
manner has many advantages. For example, fuzzy logic has a natural way of dealing with
paradoxes, which are inherent to traditional logic; for instance, a peak may be classified both
as “damage” and as “false” at the same time without creating a contradiction [15]. Another
important feature is that fuzzy behavior is shown to produce good results, even in cases with
incompletely defined dependencies [16,17]. Finally, an important advantage of a fuzzy
system over a “classic” expert system is that a fuzzy system usually has significantly fewer
rules [18]. Thus, a fuzzy expert system should provide a convenient tool for creating an
automated damage detection system.
For this project, a custom fuzzy inference engine was designed and implemented in
JAVA programming language. The fuzzy engine allows evaluation of the fuzzy constructs
of arbitrary complexity expressed as text strings, that significantly simplifies human–
computer interface. For example, fuzzy rules in this paper can be directly parsed by the
fuzzy inference engine. Implementation of the fuzzy engine in JAVA allows cross-
platform portability and easy incorporation into Internet-based applications. Interested
readers can find a sample applet and the fuzzy engine source code at http://www.csee.
wvu.edu/~esazonov/.
Testing on classical fuzzy logic examples validated the performance of the fuzzy inference
engine. Validation of the fuzzy expert system performance was carried out by testing on the
mode shapes with known damage locations. Validation and design processes were closely
connected, each modification to the fuzzy expert system being exhaustively tested. The
linguistic variables and the rule base of the fuzzy expert system were compiled by
questioning three persons casually dealing with evaluation of strain energy shapes. Most
important characteristics (by the experts’ opinion) of the strain energy mode shapes such as
width, height, location of peaks, etc. were associated with appropriate linguistic variables.
The experts’ way of reasoning was encoded as several sets of fuzzy rules, each set
performing a logically separate part of the damage detection procedure. Fine tuning of the
rule base was performed by the expert evaluation of the fuzzy system’s reasoning: additional
rules were introduced for situations, where the system could not find an appropriate rule;
some rules were modified to eliminate undesirable effects. The final result is presented in the
subsequent sections of this paper.
FIGURE 4 An example of a fuzzy linguistic variable and membership functions.
E.S. SAZONOV et al.6
DEFINING THE LINGUISTIC VARIABLES AND FUZZY RULES
Consider how a human expert approaches the problem of damage detection on strain energy
mode shapes:
. each mode shape is studied for the peaks present;
. a peak can “look like” or “not look like” a damage peak;
. for every “likely” peak, each mode shape in the set is studied for peaks at the same
location;
. perception of a peak as “likely or not” can either be further improved or worsened by
knowing such factors as magnitude of level of strain energy at a given location, peak
width and amplitude, presence of similarly located peaks on other modes, etc.;
. a decision is made based upon the assessment of peak characteristics and cross-mode
analysis.
The proposed fuzzy expert system simulates a human approach to search for the damage
location. Thresholding is eliminated completely. The automated system performs a damage
peak search in three stages as described below. These stages approximately correspond to
tasks normally performed by a human expert: estimation of parameters, evaluation of peaks
and matching peaks across modes.
Peak Analysis Stage
The first stage, “peak analysis”, aims at determining the metrics of every peak on the DSEMS
and preparing the data for fuzzy processing. Only peaks directed into the positive semiplane
(“upward”) are taken into consideration; due to the properties of the strain energy
computation, any peak directed into the negative semiplane (“downward”) can be classified
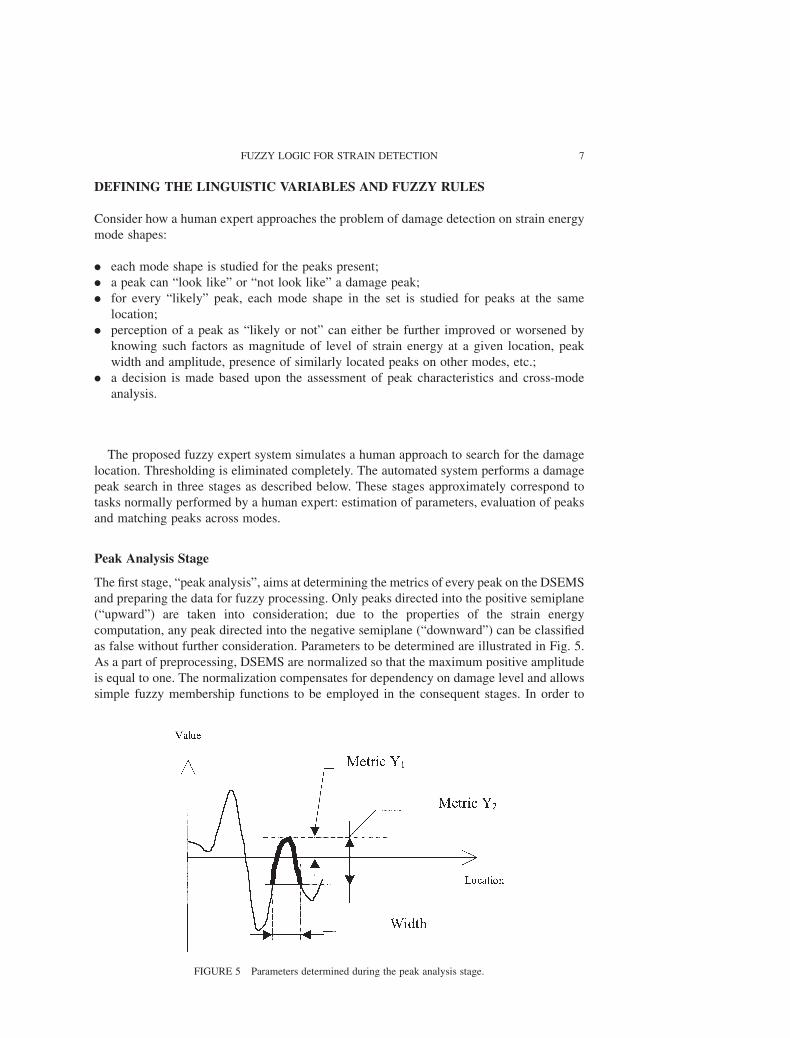
as false without further consideration. Parameters to be determined are illustrated in Fig. 5.
As a part of preprocessing, DSEMS are normalized so that the maximum positive amplitude
is equal to one. The normalization compensates for dependency on damage level and allows
simple fuzzy membership functions to be employed in the consequent stages. In order to
FIGURE 5 Parameters determined during the peak analysis stage.
FUZZY LOGIC FOR STRAIN DETECTION 7

locate peaks and determine their metrics, first derivative of DSEMS is computed and
analyzed for zero crossings. Any zero crossing from a positive to a negative value
indicates a peak of interest. Two metrics of magnitude are determined for each peak.
Metric Y1 is measured from the zero to the highest point of a peak. Metric Y2 is measured
from the base of a peak (i.e. at locations where the first derivative of the peak’s shape is
maximal for the left slope and minimal for the right slope) to its highest point. Besides Y1
and Y2, measurement of width is taken for each peak at its base. All these metrics along
with the peak’s location are stored for further processing. The average value of BSEMS
over the peak’s width is calculated and stored; this value is later used to characterize the
method’s sensitivity at that location. A flowchart for the peak analysis algorithm is given
in Fig. 6.
Peak Evaluation Stage
As the first step of the second stage (“peak evaluation”), all peaks found in the first stage
(peak analysis) are evaluated for likelihood to be a damage peak. This evaluation includes
consideration of the peak’s width, the values of metrics Y1 and Y2, and location and is
performed by applying fuzzy rules individually to each of the peaks. The main purpose of
this stage is to eliminate all peaks that do not satisfy the description of a damage peak and
establish a numerical measure of likelihood for all other peaks. The output of this stage is so-
called confidence mode shapes, where each peak has amplitude equal to the assigned
confidence. A flowchart of the algorithm for peak evaluation is given in Fig. 7. As in any
fuzzy system, linguistic variables and membership functions should be defined for every
parameter involved in decision-making. All membership functions for this fuzzy system
have been produced by empirical observation.
Membership functions were defined for the linguistic variables of width, metrics Y1 and Y2
of a peak, strain energy level for a given location and confidence (evaluation result). Graphs
of the membership functions for the peak evaluation stage are given in Fig. 8.
. Width has been defined as taking values of narrow, normal or wide. Experience shows
that for the given FE model, the normal width of a damage peak varies within 3–5 points
FIGURE. 6 Flowchart of the algorithm for the peak analysis stage.
E.S. SAZONOV et al.8

FIGURE 8 Linguistic variables and membership functions for the peak evaluation stage.
FIGURE 7 Flowchart of the algorithm for the peak evaluation stage.
FUZZY LOGIC FOR STRAIN DETECTION 9

on location axis. Therefore, any peak narrower or wider than a given range does not
qualify to be a damage peak.
. Metric Y1 could be assigned as one of the following categories: “negative”, “low”,
“moderate” or “high”. Negative covers all peaks with the Y1 value below zero. Three
other categories cover three degrees of the metric’s values. The range of Y1 is between 0
and 1 due to normalization described in the section “Peak Analysis Stage”.
. Metric Y2 of a peak has been defined as “very low”, “low”, “moderate” or “high.” “Very
low” covers peaks with very low amplitudes that are not distinguishable from noise. All
other categories cover three degrees of the metric’s values. Unlike metric Y1, metric Y2 for
DSEMS may be greater than one because a peak’s base may lie below the zero axis (Fig.
5).
. Average value of BSEMS or “sensitivity” linguistic variable has four categories: “zero”, “
low”, “moderate”, and “high.” Parameters of a peak are compared against this value to
weigh the truthfulness of an evaluation. Zero sensitivity occurs at both ends of a beam due
to the properties of the numeric algorithm used to compute strain energy. This is a zone
where detection is impossible. Low, moderate and high represent three degrees of
sensitivity for a given location.
. The categories for the confidence of evaluation result are identified as: “reject”, “low”,
“moderate”, “high” and “very high.” The result of evaluation is a value between 0 and 1,
representing the system’s confidence whether this peak may or may not represent a
damage location. Reject is a category for peaks to be excluded from further consideration
because some of the peak’s properties do not fit a damage peak description. Four other
categories show different degrees of confidence.
Step two of the peak evaluation stage is performed by a rule-based fuzzy expert system.
Observation of damage peak behavior and expert knowledge served as the basis for
FIGURE 9 Rules for the peak evaluation stage (in notation used by the fuzzy engine).
E.S. SAZONOV et al.10

producing evaluation rules. The rules reflect damage peak properties such as certain width
ranges, dependencies between values of metrics Y1 and Y2 and location. Rules used for
evaluation are illustrated in Fig. 9.
The given set of rules is invoked for every peak found during the peak analysis stage.
Results are stored for future use in the form of confidence mode shapes that will be processed
in the next stage.
Damage Search Stage
Stage three, “damage search stage”, takes the confidence mode shapes and performs a cross-
mode damage peak search. Each peak is compared to other peaks located approximately at
the same point in other modes (if such peaks exist), in addition to which, each mode is
evaluated for reliability. For example, if a given mode contains just one peak, the chances are
high that it is a damage peak. If a given mode contains 20 peaks, it is either a really bad
structure, which is not very likely, or a noisy mode where the damage peak is “masked” by
distortion and many false peaks are present. The reliability of such a mode should not be
high. Establishing reliability of a mode is a subjective matter that depends upon the utilized
data acquisition method (for example, impact testing generates more noise than laser
vibrometry) and an expected number of damaged areas. The corresponding linguistic
variables were produced based on experts’ “feeling” of mode shapes acquired by impact
testing with an expectation to see no more than two or three damages. The procedure for
cross-mode damage peak search is given in Fig. 10.
FIGURE 10 Procedure for the cross-mode damage peak search.
FUZZY LOGIC FOR STRAIN DETECTION 11

The output of this procedure is a single vector, carrying the “probability” of damage for
each location along the length. (The probability in this case is a fuzzy estimate rather than a
statistical term.) This vector identifies damage for every location. The search is performed by
employing several fuzzy evaluations. The following linguistic variables and membership
functions have been defined (Fig. 11):
. Mode reliability has been defined as “unreliable”, “low”, “moderate” and “high.” An
unreliable mode shape is a mode shape with no peaks. If a mode is unreliable, it should not
participate in decision-making. The other categories are three degrees of reliability.
. The number of peaks in a mode has categories identified as: “no peaks”, “low”,
“moderate” and “high.” These four categories depict the number of peaks in a mode shape
after peak evaluation.
. Distance between two points is used in judging the alignment of two peaks. The
categories have been set as “close” and “far.”
. Peak alignment has two categories, “aligned” and “not aligned”, which have been used for
evaluating whether two peaks are well aligned or not.
. Sensitivity has the following categories, identified as “very low”, “low”, “moderate” and
“high.” This linguistic variable has been redefined in comparison to the peak evaluation
stage.
FIGURE 11 Linguistic variables and membership functions for the damage search stage.
E.S. SAZONOV et al.12

FIGURE 12 Rules for evaluating mode reliability (in notation used by the fuzzy engine).
FIGURE 13 Rules for evaluating peak alignment (in notation used by the fuzzy engine).
FIGURE 14 Rules for changing damage probability (in notation used by the fuzzy engine).
FUZZY LOGIC FOR STRAIN DETECTION 13

. Damage probability has been assigned categories of “decreased”, “decreased somewhat,”
“the same,” “increased somewhat” and “increased”. This linguistic variable represents a
decision after each peak-to-peak comparison. After all rules have been evaluated, this
variable is responsible for providing a decision to change damage probability for a given
location.
A damage peak search includes three separate fuzzy evaluations; each performed by its
own set of rules. Rules for evaluating mode reliability are given in Fig. 12. Rules for
evaluating peak alignment are given in Fig. 13. Left and right edge distances refer to the
distance between left and right edges of the two peaks, respectively. Using these left and right
edge distances rather than peak locations is more meaningful for peaks with different widths,
FIGURE 15 Results of the peak analysis stage.
E.S. SAZONOV et al.14

which may or may not be symmetrical. Rules for changing damage probability are given in
Fig. 14.
After the fuzzy engine has evaluated every peak in every mode, so-called damage
probability vector contains information about detected damage. Negative values indicate
locations with false peaks due to the noise or distortion. Zero values indicate locations where
no damage-like peaks were present at all. Finally, the positive values indicate damage peaks.
TESTING AND RESULTS
Figures 15–21 show all stages of processing in which the damages from Fig. 3 are found.
Figure 15 contains peaks identified by the peak analysis stage. Figure 16 contains results of
the peak evaluation stage. Note that the number of peaks decreased due to elimination of
unlikely peaks and peak values changed according to the assigned confidence, through the
FIGURE 16 Results of the peak evaluation stage.
FUZZY LOGIC FOR STRAIN DETECTION 15
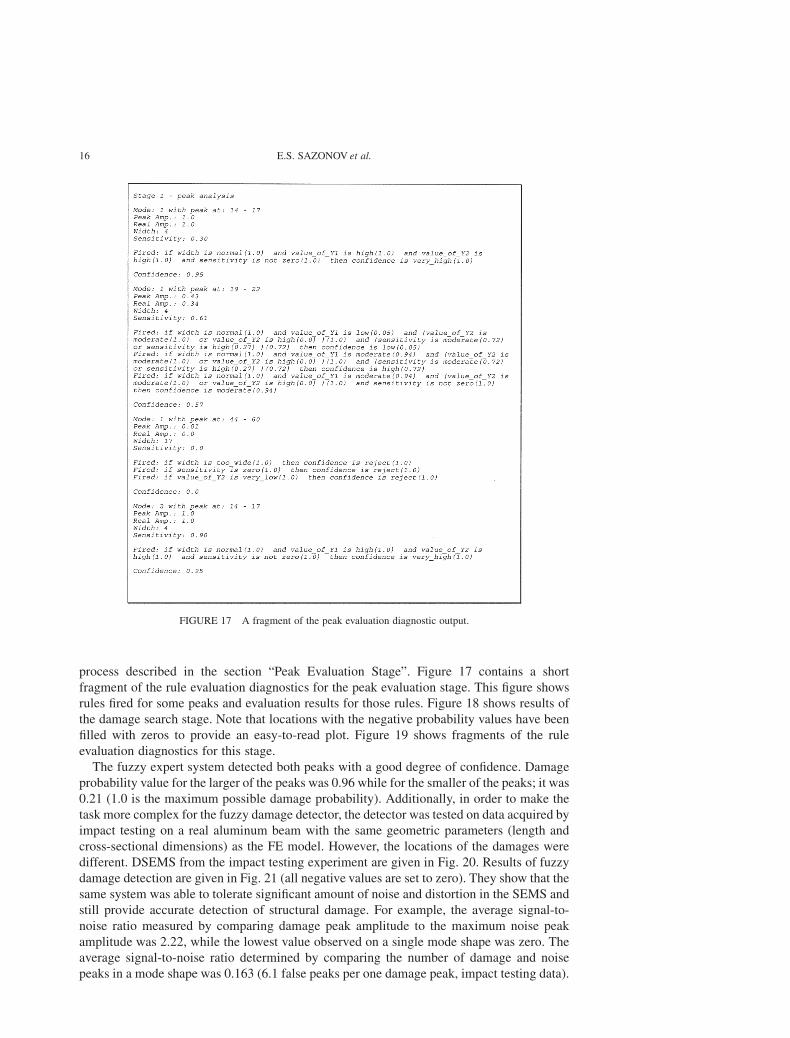
process described in the section “Peak Evaluation Stage”. Figure 17 contains a short
fragment of the rule evaluation diagnostics for the peak evaluation stage. This figure shows
rules fired for some peaks and evaluation results for those rules. Figure 18 shows results of
the damage search stage. Note that locations with the negative probability values have been
filled with zeros to provide an easy-to-read plot. Figure 19 shows fragments of the rule
evaluation diagnostics for this stage.
The fuzzy expert system detected both peaks with a good degree of confidence. Damage
probability value for the larger of the peaks was 0.96 while for the smaller of the peaks; it was
0.21 (1.0 is the maximum possible damage probability). Additionally, in order to make the
task more complex for the fuzzy damage detector, the detector was tested on data acquired by
impact testing on a real aluminum beam with the same geometric parameters (length and
cross-sectional dimensions) as the FE model. However, the locations of the damages were
different. DSEMS from the impact testing experiment are given in Fig. 20. Results of fuzzy
damage detection are given in Fig. 21 (all negative values are set to zero). They show that the
same system was able to tolerate significant amount of noise and distortion in the SEMS and
still provide accurate detection of structural damage. For example, the average signal-to-
noise ratio measured by comparing damage peak amplitude to the maximum noise peak
amplitude was 2.22, while the lowest value observed on a single mode shape was zero. The
average signal-to-noise ratio determined by comparing the number of damage and noise
peaks in a mode shape was 0.163 (6.1 false peaks per one damage peak, impact testing data).
FIGURE 17 A fragment of the peak evaluation diagnostic output.
E.S. SAZONOV et al.16

The FE data provided a reliable base for teaching the system to distinguish between noise and
damage. Several other experiments using different damage scenarios provided by the FE
model (about 80 cases), impact testing (three cases) and non-contact laser vibrometer (three
cases) proved the reliability and robustness of the suggested approach [10]. For all of the test
cases, the system provided 100% detection of the damage without false positives, which is
equivalent to the expert performance on the same data set.
CONCLUSIONS
The results showed that the fuzzy expert system presented in this paper provided a reliable
and accurate outcome in recognition of different damage cases. Performance of this system
was superior to the performance of thresholding-based methods, especially in multiple
damage cases. In the example presented in this paper, the thresholding-based method was
able to detect only one of the two damaged areas, whereas the proposed fuzzy expert system
detected both of the damaged areas. Implementing the damage detection system as an expert
system allowed easy access to the decision process. Application of fuzzy logic allowed for
easy resolution of the uncertainties and contradictions within the set of rules and during
decision-making. Overall, the quality of damage detection was equal to an expert’s judgment,
thus accomplishing the set goals. A significant advantage of this system is its high noise
tolerance that was mainly achieved through utilization of the expert knowledge in the
problem domain of the strain energy mode shape analysis. When ordinary threshold-
ing/majority vote system treats all the peaks equally, without attempting to differentiate
FIGURE 18 Screenshot of the damage search stage.
FUZZY LOGIC FOR STRAIN DETECTION 17

between noise peaks and damage peaks, the fuzzy expert system takes into account whether a
peak is shaped like a damage peak, if peak’s parameters correspond to the peak’s location, if
the mode shape itself is reliable or highly contaminated by noise, etc. This “embedded
intelligence” makes all the difference in the damage detection results. The principles
employed here can be applied to building an expert system for automated detection of
structural damage in complex structures. Namely, employment of fuzzy logic within the
expert system framework with problem domain knowledge governing the damage detection
process would allow better coping with the complexity of strain energy mode shapes and
intricate behavior of damage peaks.
Future work in this area will be focused on making the system’s behavior adaptive. Such a
system would have self-learning capabilities and offer refinement of the rules and
membership functions during its operation. The basic expert knowledge in this case will be
adapted to operating conditions of the system.
Acknowledgments
The authors wish to acknowledge the financial support provided by the US Army (contract #
DAAE07-96-C-X226).
FIGURE 19 A fragment of the damage search stage diagnostic output.
E.S. SAZONOV et al.18

FIGURE 20 DSEMS for damage at locations 38 and 47 (impact testing).
FIG. 21 Results of the automated damage detection (impact testing, damage at locations 38 and 47).
FUZZY LOGIC FOR STRAIN DETECTION 19

References
[1] Pandey, A.K., Biswas, M. and Samman, M.M. (1991) “Damage detection from changes in curvature modeshapes”, J. Sound Vib. 145(2), 321–332.
[2] Ratcliffe, C.P. (1997) “Damage detection using a modified Laplacian operator on mode shape data”, J. SoundVib. 204(3), 505–517.
[3] Petro, S.H., Chen, S.E. and GangaRao, H.V.S. (1997) “Damage detection using vibration measurements”, Proc.15th IMAC, Orlando FL, 113–127.
[4] Venkatappa, S., “Damage detection using vibration measurements” M.S. Thesis, West Virginia University(WV, USA).
[5] Osegueda, R.A., Carrasco, C.J. and Meza, R. (1997) “A modal strain energy distribution method to localize andquantify damage”, Proc. Int. Modal Anal. Conf. (IMAC-XV), Orlando, FL, 1298–1304.
[6] Shi, Z.Y. and Law, S.S. (1998) “Structural damage localization from modal strain energy change”, J. Sound Vib.218(5), 825–844.
[7] Cornwell, P., Doebling, S. and Farrar, C. (1999) “Application of the strain energy damage detection method toplate-like structures”, J. Sound Vib. 224(2), 359–374.
[8] Yan, P. and Deng, Y. (2000) “Nondestructive damage detection of bridges based on strain mode”, Proc. Int.Modal Anal. Conf. (IMAC-XVIII), San-Antonio, Texas, 1825–1830.
[9] Wahab, A. and Roeck, G. (1999) “Damage detection in bridges using modal curvatures: application to a realdamage scenario”, J. Sound Vib. 226(2), 217–235.
[10] Sazonov, E.S., “A case study for building an automated damage detection system” M.S. Thesis, West VirginiaUniversity (WV, USA).
[11] Jackson, P. (1999) Introduction to Expert Systems International Computer Science Series, (Addison-Wesley,Reading).
[12] Eberhart, R., Simpson, P. and Dobbins, R. (1996) “Computational Intelligence PC Tools”, AP Professional.[13] Zadeh, L.A. (1975) “The concept of a linguistic variable and its application to approximate reasoning, Parts 1
and 2”, Inf. Sci. 8, 199–249, 301–357.[14] Kandel, A., (1991) Fuzzy Expert Systems (CRC Press, Boca Raton).[15] Hajek, P., Paris, J. and Shepherdson, J. (2000) “The liar paradox and fuzzy logic”, J. Symb. Logic 65, 339–346.[16] Raju, K. and Majumdar, A. (1988) “Fuzzy functional dependencies and lossless join decomposition of fuzzy
relational database systems”, ACM Trans. Database Syst. 13(32), 129–166.[17] Hajek, P., Havranek, T. and Jirousek, R. (1992) Processing Uncertain Information in Expert Systems (CRC
Press, Boca Raton).[18] Juuso, Esko K. (1999) “Intelligent systems design with linguistic equations”, 9th Workshop Fuzzy Control des
GMA-FA 5.22 am 4/5.11.1999, Dortmund, Germany. Forschungsberict Nr. 0449 (Universitnt Dortmund,Facultat fur Electrotechnik, Dortmund), pp 177–196.
E.S. SAZONOV et al.20