fy ‘11 port everglades proposed budget 1. vision statement economic opportunities are endless...
TRANSCRIPT

FY ‘11 Port Everglades Proposed Budget
1

Vision Statement
Economic Opportunities are EndlessBoard of County Commission Goal Statement Number 3:
Sustain the economic viability of Port Everglades
2Cruise Terminal 18

3
Port Everglades Mission

Key Outcomes FY ‘08 and FY ‘09
4
FY ’08 FY ‘09
Value of economic activity statewide $17.9 billion $13.9 billion
Direct regional jobs 11,188 9,948 -Port Everglades Department (including SE&C) 249 246
-BSO/EMS/Fire Rescue 222 222
Total Florida jobs impacted by Port 185,000 143,185

Key Comparative PerformanceData FY ‘08 and FY ‘09
MeasurePort
Everglades Jacksonville Miami Tampa Savannah Charleston L.A.
TEU’s (containers) FY ‘09 796,160 754,352 807,069 48,788 2,404,965 1,368,000 7,261,539
FY ‘08 985,095 697,494 828,349 44,496 2,687,584 1,695,000 8,081,361
National Container Ranking FY ‘09 12 15 11 31 4 9 1
FY ‘08 11 19 12 30 4 8 1
Tons of Cargo (millions) FY ‘09 21.3 7.3 6.8 37.8 22.1 9.2 142.8
F Y ‘08 23.7 24.5 7.4 42.6 25.4 12.8 170.0
# of Cruise Passengers FY ‘09 2,836,954 185,434 4,110,100 802,937 0 0 1,191,449
F Y ‘08 2,636,711 152,411 4,137,231 767,760 0 116,707 1,195,897
World Cruise Ranking FY ‘08 3 21 1 15 - 26 5
5

6
MeasurePort
Everglades Jacksonville Miami Tampa Savannah
Charleston
L.A.
Operating Revenues (in millions) FY ‘09
$109.6 $47.3 $100.1 $39.8 $227.8 $136.2 $402.2
FY ‘08 117.4 42.3 94.7 39.2 236.9 165.1 426.3
Operating Expenses (in millions) FY ’09
73.2 54.8 69.0 22.9 168.5 80.9 254.1
FY ‘08 73.1 46.6 61.6 22.5 171.5 81.9 221.8
Change in Net Assets (in millions) FY ‘09
21.1 7.8 4.2 13.3 64.1 28.9 46.0
FY ‘08 21.9 8.4 1.7 26.9 85.1 77.0 139.2
Debt Service Coverage FY ‘09
1.76 1.84 1.35 1.51 N/A 6.43 2.8
FY ‘08 1.85 3.48 1.50 1.60 N/A 10.24 4.0
Ad Valorem Tax Support or other shared revenue from primary government (in millions) FY ‘09
- $2.7 - $15.7 - - -
FY ‘08 - 2.3 - 16.8 - - -
Revenue Bonds - Moody’s Rating FY ‘09
A2 A2 A2 A2 N/A A1 Aa2
FY ‘08 A2 A2 A2 A2 N/A A1 Aa2
Key Comparative PerformanceData FY ‘08 and FY ‘09

FY ‘11 Budgeted Revenues
7
Operating Revenues ($6.8M over FY ‘10 projected) $ 119.1
Interest Income 3.9
State Grants 3.3
Less Five Percent ( 6.3)
Transfer from Convention Center (Bypass Road) 1.0
Fund Balance 81.4
Total $ 202.4
(in millions)

8
Budgeted, Projected & Historical Petroleum Cargo ActivityPetroleum in Barrels (in Thousands) FY 2002-2011
Projected
Budget

9
-
200,000
400,000
600,000
800,000
1,000,000
1,200,000
2002 2003 2004 2005 2006 2007 2008 2009 2010 2011
TEUs
Budgeted, Projected & Historical TEU ActivityFiscal Years 2002-2011
Projected
Budget

10
Budgeted, Projected & Historical Multi-Day Passenger Activity Fiscal Years 2002-2011
Projected
Budget

11
2006 2010 +/-
Miami 1,8600,00 2,050,000 +190,000
Port Everglades 1,250,000 1,720,000 +470,000
Port Canaveral 1,370,000 1,490,000 +110,000
Tampa 910,000 800,000 -110,000
Puerto Rico 510,000 480,000 -30,000
Galveston 620,000 430,000 -190,000
New York City NA 210,000
Cruise Homeport Trends
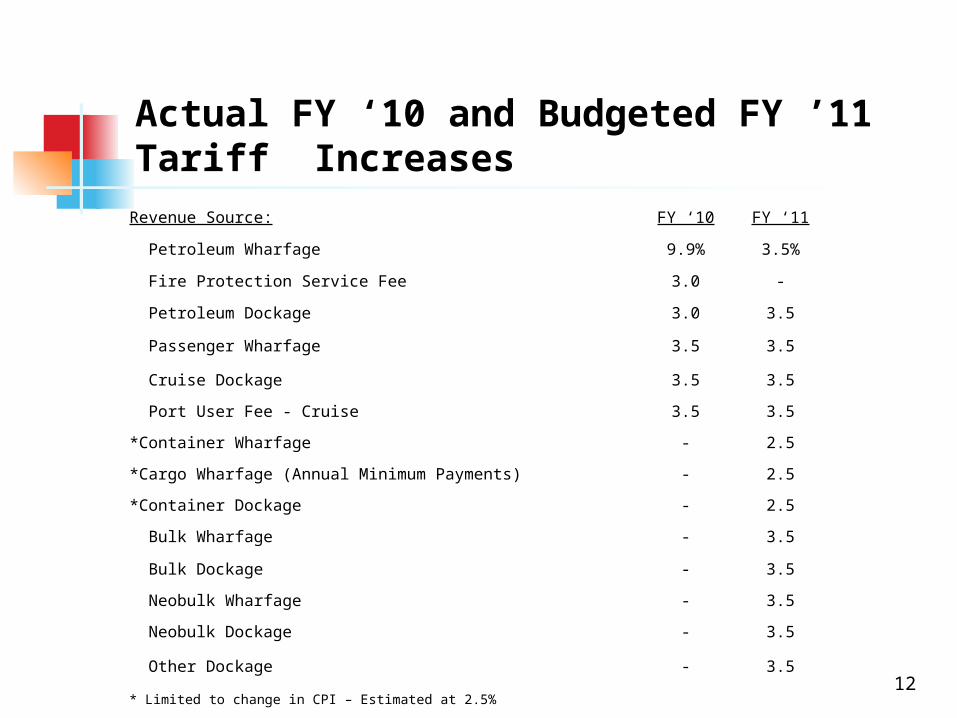
Actual FY ‘10 and Budgeted FY ’11Tariff Increases
12
Revenue Source: FY ‘10 FY ‘11
Petroleum Wharfage 9.9% 3.5%
Fire Protection Service Fee 3.0 -
Petroleum Dockage 3.0 3.5
Passenger Wharfage 3.5 3.5
Cruise Dockage 3.5 3.5
Port User Fee - Cruise 3.5 3.5
*Container Wharfage - 2.5
*Cargo Wharfage (Annual Minimum Payments) - 2.5
*Container Dockage - 2.5
Bulk Wharfage - 3.5
Bulk Dockage - 3.5
Neobulk Wharfage - 3.5
Neobulk Dockage - 3.5
Other Dockage - 3.5
* Limited to change in CPI – Estimated at 2.5%
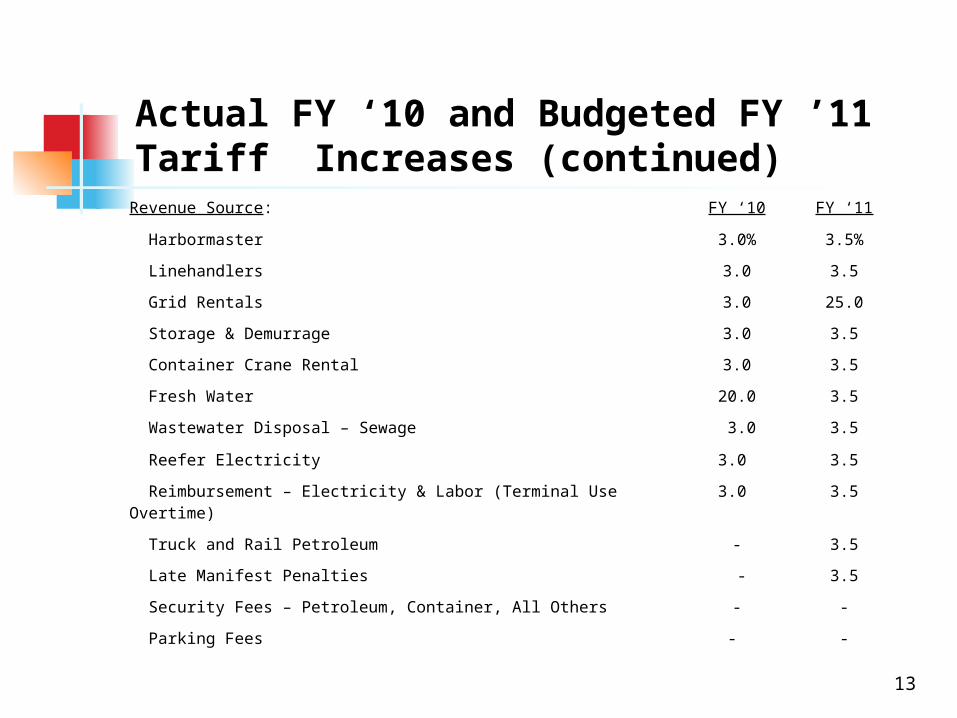
Actual FY ‘10 and Budgeted FY ’11 Tariff Increases (continued)
13
Revenue Source: FY ‘10 FY ‘11
Harbormaster 3.0% 3.5%
Linehandlers 3.0 3.5
Grid Rentals 3.0 25.0
Storage & Demurrage 3.0 3.5
Container Crane Rental 3.0 3.5
Fresh Water 20.0 3.5
Wastewater Disposal – Sewage 3.0 3.5
Reefer Electricity 3.0 3.5
Reimbursement – Electricity & Labor (Terminal Use Overtime) 3.0 3.5
Truck and Rail Petroleum - 3.5
Late Manifest Penalties - 3.5
Security Fees – Petroleum, Container, All Others - -
Parking Fees - -

FY ‘11 Budget Appropriations
14
(in millions)
Operating Budget (FY ‘10 to FY ‘11 Down $4.5M; 5.3%} $ 78.1
Capital Budget 68.2
Debt Service Budget Includes Reserves of $10.3M
42.7
Reserves 13.4
Total $202.4

Budget FY ‘11 Operating Expense Budget Reductions From FY ‘10 Budget
15
(in thousands)
Reduction to BSO (Security Guards for 9 months) $(1,576)
Reduction in Purchased Insurance (1,048)
Replacement of Maintenance with Capital Renewal (1,013)
Reduction in Electricity ( 575)
Reduction in Contractual Services ( 205)
Reduction in Advertising ( 203)
Overtime Reduction Program ( 132)
$(4,752)

16
FY '07Actual
FY '08Actual
FY '09Actual
FY '10Projected
FY '11Budget
$-
$2,000,000
$4,000,000
$6,000,000
$8,000,000
$10,000,000
$12,000,000
$14,000,000
$16,000,000
1,590,917 1,634,859 1,132,446 1,064,670 982,220
13,055,376 13,074,315
13,141,997
12,420,110 12,525,280
Straight Time Salaries and Wages
Overtime
$14,646,294 $14,709,174$14,274,443
$13,484,780
Notes:Overtime as a per-centage of payroll 10.9% 7.9%7.9%11.1%
$13,507,500
7.3%
Overtime Reduction

Historical Position Count
17
Funded Authorized
FY 07 Position Count 229 229
Unfunded Positions -6 ___
FY 08 Position Count 223 229
Deleted Positions -3 -3
Unfunded Positions -2 ___
FY 09 Position Count 218 226
Unfunded Positions -9 ___
FY 10 Position Count 209 226
Deleted Positions -2 -2
FY 11 Position Count 207 224
% Reduction in Workforce (FY07 to FY11) : 10.04% 5 Deleted and 17 Unfunded
18
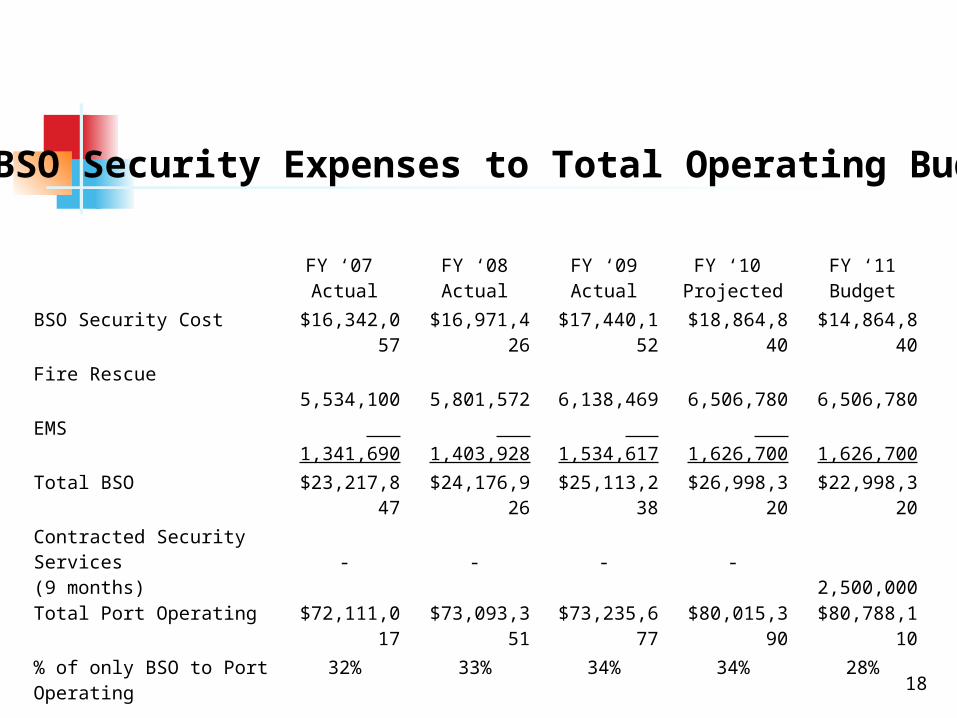
BSO Security Expenses to Total Operating Budget
FY ‘07 Actual
FY ‘08Actual
FY ‘09Actual
FY ‘10 Projected
FY ‘11Budget
BSO Security Cost $16,342,057
$16,971,426
$17,440,152
$18,864,840
$14,864,840
Fire Rescue 5,534,100
5,801,572
6,138,469
6,506,780
6,506,780
EMS 1,341,690
1,403,928
1,534,617
1,626,700
1,626,700
Total BSO $23,217,847
$24,176,926
$25,113,238
$26,998,320
$22,998,320
Contracted Security Services(9 months)
- - - -
2,500,000
Total Port Operating $72,111,017
$73,093,351
$73,235,677
$80,015,390
$80,788,110
% of only BSO to Port Operating
32% 33% 34% 34% 28%

FY ‘11 Key Proposed Capital Projects
19
(in millions)
ProjectPreviously
FundedBudget
FY ‘11Northport Petroleum Terminal (3P) $37.5
Carnival Terminals – 2, 19 ,21, & 26 $ 3.6 29.6
McIntosh Loop Road 7.9 4.5
Spangler Boulevard Bypass Road (Phase I) 2.0
Land Mitigation Turning Notch 20.0
Berth 33 Reconstruction 5.7

FY 12-15 Key Proposed Capital Projects within approved Port Master Plan Components*
(in millions)
Portwide Dredging $111.0
Cruise Terminal 4 Parking Garage $ 38.0 Cruise Terminal 4 Expansion $ 13.0 Slip 2 Expansion $ 31.5 $
82.5 Aggregate Terminal & Rail Yard Facility (3P) $
55.0 Intermodal Container Transfer Facility Phase I (3P) $
50.0 Intermodal Container Transfer Facility Southport Rail Spur
$ 10.5 Northport Petroleum Terminal (3P; FY11-$37.5M + FY12-$37.5M=$75M)
$ 37.5 Midport Parking Garage Construction $
26.3 Southport Turning Notch Expansion, Phase I $
21.7 Mitigation for Westlake Improvements (for Southport Turning Notch Phase I) $
12.0 Container Crane $
14.0 Spangler Boulevard Bypass Road Phase II (Previously budgeted $18M) $
11.0 Intermodal Container Transfer Facility Southport Rail Spur
$ 10.5
* Dependent on grants and public private partnership (3P) agreements
20

Comparative Revenue, Expense and Net Income 2002-2011
21
0
10,000,000
20,000,000
30,000,000
40,000,000
50,000,000
60,000,000
70,000,000
80,000,000
90,000,000
100,000,000
110,000,000
120,000,000
2002 2003 2004 2005 2006 2007 2008 2009 2010 2011
Operating Revenue *Operating ExpenseOperating Income before depreciation and amortizationNet Income
* Includes one time lease settlements: FY ’04 -$8,435,862 ; FY ’08-$3,800,000
Projected Budget
22
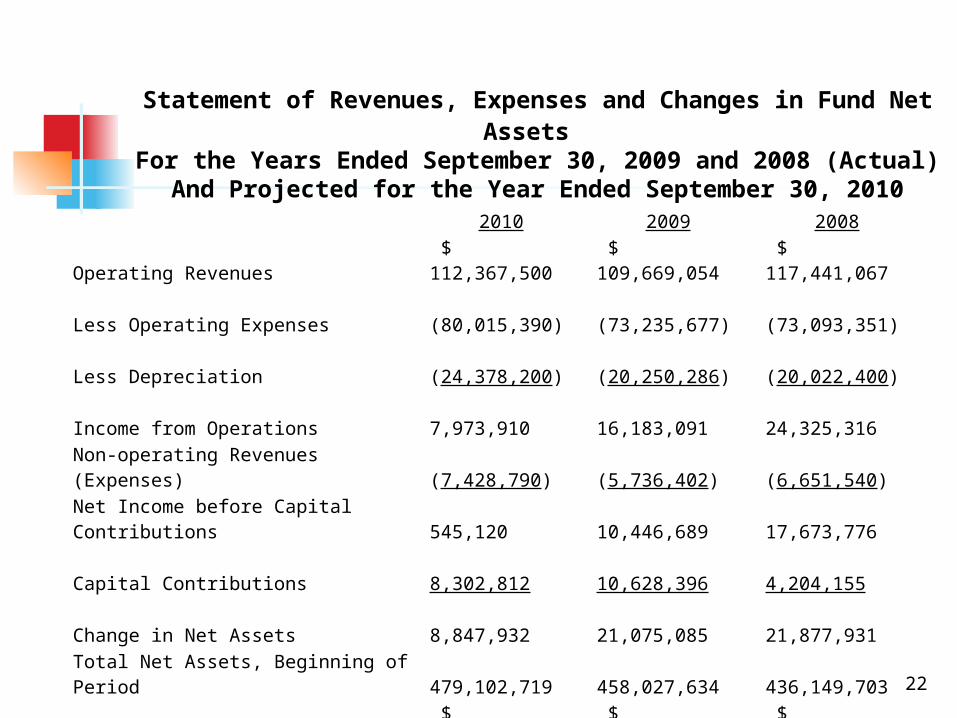
Statement of Revenues, Expenses and Changes in Fund Net Assets For the Years Ended September 30, 2009 and 2008 (Actual)
And Projected for the Year Ended September 30, 2010
2010 2009 2008
Operating Revenues $ 112,367,500 $ 109,669,054 $ 117,441,067
Less Operating Expenses (80,015,390) (73,235,677) (73,093,351)
Less Depreciation (24,378,200) (20,250,286) (20,022,400)
Income from Operations 7,973,910 16,183,091 24,325,316
Non-operating Revenues (Expenses) (7,428,790) (5,736,402) (6,651,540)
Net Income before Capital Contributions 545,120 10,446,689 17,673,776
Capital Contributions 8,302,812 10,628,396 4,204,155
Change in Net Assets 8,847,932 21,075,085 21,877,931
Total Net Assets, Beginning of Period 479,102,719 458,027,634 436,149,703
Total Net Assets, End of Period $ 487,950,651 $ 479,102,719 $ 458,027,634