fy 2011 budget summary and annual performance plan
TRANSCRIPT
FY 2011
BUDGET SUMMARY AND
ANNUAL PERFORMANCE PLAN
US DEPARTMENT OF AGRICULTURE
TABLE OF CONTENTS
ITEM PAGE
PREFACE iii
OVERVIEW 1
HIGHLIGHTS BY GOALS7
MISSION AREAAGENCY DETAILS
FARM AND FOREIGN AGRICULTURAL SERVICES Farm Service Agency 25 Risk Management Agency 39 Foreign Agricultural Service42
RURAL DEVELOPMENT Rural Business-Cooperative Service56 Rural Utilities Service 60 Rural Housing Service 64 Rural Development Salaries and Expenses 68
FOOD NUTRITION AND CONSUMER SERVICES Food and Nutrition Service 69
FOOD SAFETY Food Safety and Inspection Service79
NATURAL RESOURCES AND ENVIRONMENT Natural Resources Conservation Service 85 Forest Service 93
MARKETING AND REGULATORY PROGRAMS Animal and Plant Health Inspection Service 100 Agricultural Marketing Service 104 Grain Inspection Packers and Stockyards Administration 107
RESEARCH EDUCATION AND ECONOMICS Agricultural Research Service 111 National Institute of Food and Agriculture 116 Economic Research Service 122 National Agricultural Statistics Service 123
i
TABLE OF CONTENTS
ITEM PAGE
OFFICE OF THE SECRETARY 124
DEPARTMENTAL ACTIVITIES 126
OFFICE OF INSPECTOR GENERAL 133
APPENDIX Budget Authority by Agency 2009-2011134 Program Level by Agency 2009-2011 136 Outlays by Agency 2009-2011138 Discretionary Budget Outlays by Agency 2009-2011 139 American Recovery and Reinvestment Act of 2009 140 Staff Years by Agency 2009-2011142 Funding by Strategic Goals 143 Fee Proposals 148 Proposed Budget-Related Legislation150
ii
PREFACE
This Budget Summary and Annual Performance Plan describes the fiscal year (FY) 2011 budget for the US Department of Agriculture (USDA) All references to years refer to fiscal year except where specifically noted The funding estimates presented for FY 2010 are based on the Agriculture Rural Development Food and Drug Administration and Related Agencies Appropriations Act 2010 PL 111-80 Throughout the Summary ldquo2008 Farm Billrdquo and ldquoThe Farm Billrdquo are used to refer to the Food Conservation and Energy Act of 2008 In addition ldquoRecovery Actrdquo is used to refer to the American Recovery and Reinvestment Act of 2009
The Budget Summary is organized into three sections
y Overview - provides an overview of the 2011 budget by strategic goal and describes changes in budget authority and outlays
y Highlights by Goals - identifies key proposals within USDArsquos mission areas
y Mission AreaAgency Details - summarizes agency funding and programs and performance goals
Budget and Performance Plan Terms
y Performance Goal is the target level of performance at a specified time or period expressed as a tangible measurable outcome against which actual achievement can be compared including a goal expressed as a quantitative standard value or rate A performance goal comprises a performance measure with targets and timeframes
y Performance Measures are indicators statistics or metrics used to gauge program performance Program performance measures include outcome output and efficiency measures
y Budget Authority is the authority to commit funds of the Federal Treasury Congress provides this authority through annual appropriations acts and substantive legislation which authorizes direct spending The Presidents budget requests the Congress to appropriate or otherwise provide an amount of budget authority sufficient to carry out recommended government programs
y Obligations are commitments of Government funds that are legally binding In order for USDA to make a valid obligation it must have a sufficient amount of budget authority to cover the obligation
y Outlays are cash disbursements from the Federal Treasury to satisfy a valid obligation
y Program Level represents the gross value of all financial assistance USDA provides to the public This assistance may be in the form of grants guaranteed or direct loans cost-sharing professional services such as research or technical assistance activities or in-kind benefits such as commodities
iii
PREFACE
The budget is described in budget authority measures in most instances However there are some cases when other measures are used and the reader should take care to note which measure is being used Also note that the budget authority tables contained in this document reflect operating levels In addition performance goals reflect performance levels at ongoing funding levels and do not include the effect of supplemental including Recovery Act appropriations
Questions may be directed to the Office of Budget and Program Analysis via e-mail at bcaobpausdagov or telephone at (202) 720-6176
iv
OVERVIEW
Mission Statement USDA provides leadership on food agriculture natural resources and related issues based on sound public policy the best available science and efficient management
Vision Statement To help Americarsquos rural communities thrive and foster innovation as a result of expanded economic opportunities and sustainable agricultural production that nourishes Americarsquos children and the world and conserves the Nationrsquos natural resources
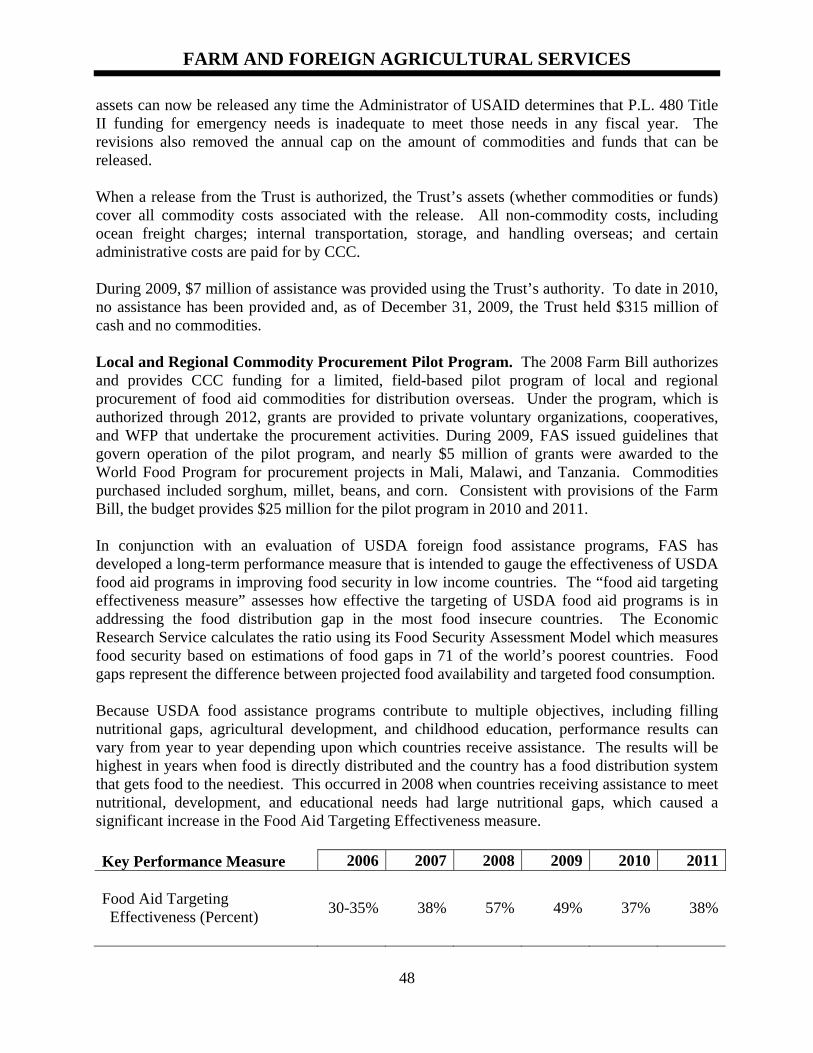
Strategic Plan Framework USDA is currently revising its Strategic Plan The 2011 budget request supports achievement of USDArsquos four strategic goals and management initiatives that describe the Departmentrsquos major programmatic policies and objectives that are expected to be the basis of the Departmentrsquos new Strategic Plan
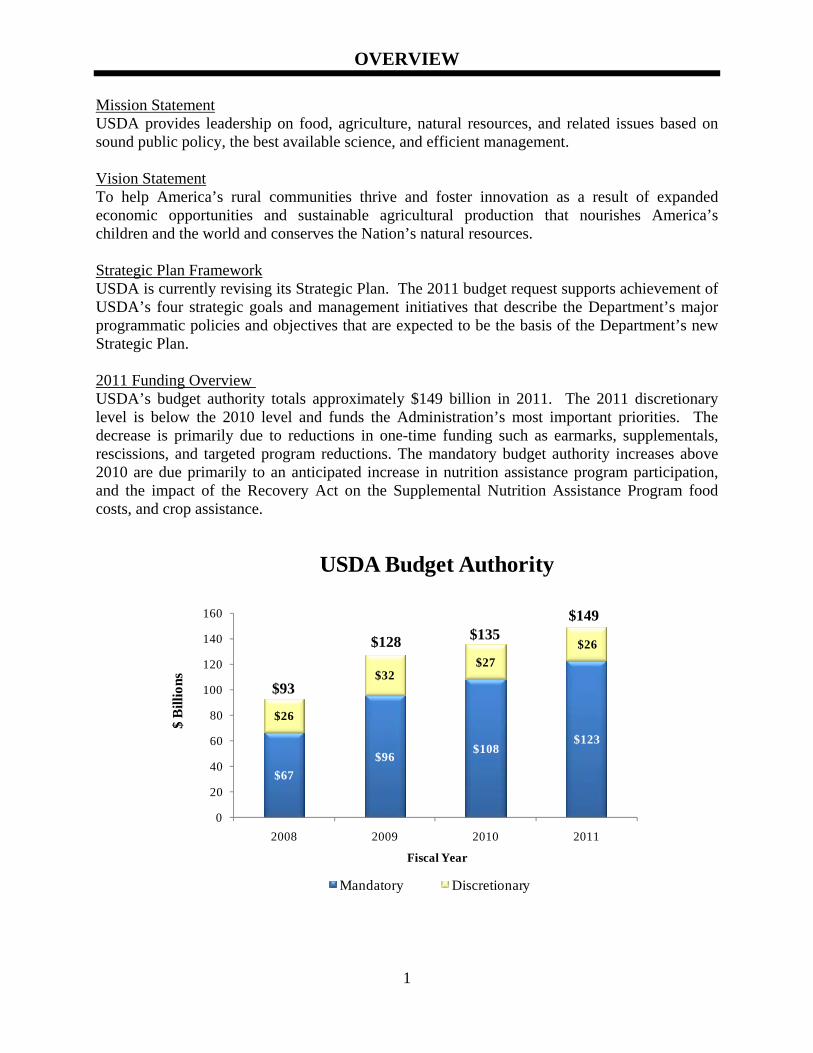
2011 Funding Overview USDArsquos budget authority totals approximately $149 billion in 2011 The 2011 discretionary level is below the 2010 level and funds the Administrationrsquos most important priorities The decrease is primarily due to reductions in one-time funding such as earmarks supplementals rescissions and targeted program reductions The mandatory budget authority increases above 2010 are due primarily to an anticipated increase in nutrition assistance program participation and the impact of the Recovery Act on the Supplemental Nutrition Assistance Program food costs and crop assistance
USDA Budget Authority
160 $149
$67 $96 $108
$123
$26
$32 $27
$26
0
20
40
60
80
100
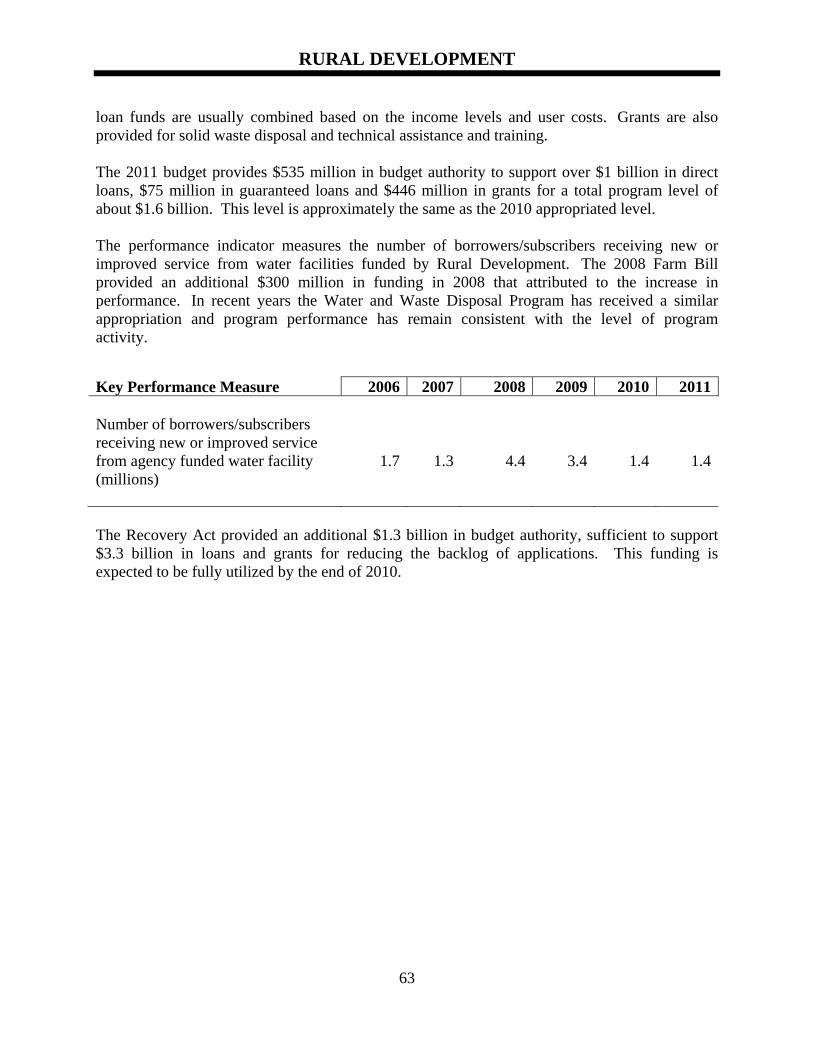
120
140
$ B
illio
ns
$93
$128 $135
2008 2009 2010 2011
Fiscal Year
Mandatory Discretionary
1
OVERVIEW
USDA Outlays $
Bill
ions
160 $142 $146 140
$115120
100 $90 80
60
40
20
0
$64
$26
$117
$29
$112
$30
$89
$26
2008 2009 2010 2011
Fiscal Year
Discretionary Mandatory
2011 Outlays
Farm and Commodity Programs
17
Nutrition Assistance
70
Conservation and Forestry
7
All Other 6
Includes Rural Development Research Food Safety and Marketing and Regulatory functions
2
OVERVIEW
USDArsquos total outlays for 2011 are estimated at $146 billion Roughly 80 percent of outlays about $117 billion in 2011 are associated with mandatory programs that provide services as required by law These include the majority of the nutrition assistance programs farm commodity programs export promotion programs and a number of conservation programs The increase in mandatory outlays in 2011 is primarily due to nutrition assistance and crop insurance The remaining 20 percent of outlays estimated at $29 billion in 2011 are associated with discretionary programs such as the Special Supplemental Nutrition Program for Women Infants and Children (WIC) rural development loans and grants research and education soil and water conservation technical assistance animal and plant health management of National Forests wildland fire and other Forest Service activities and domestic and international marketing assistance
For 2011 the Departmentrsquos budget process was organized around four program goals and an overarching management goal to improve collaboration among mission areas and agencies and to strengthen the effectiveness of USDA programs This budget presentation reflects the Departmentrsquos goal-based organizational budget process It should be noted that although agency programs and associated funding have been aligned with the four program goals many programs contribute to the achievement of multiple goals
An overview of the 2011 budget by strategic goal
Strategic Goal Help America promote agricultural production and biotechnology exports as America works to increase food security
bull Supports $23 billion to increase global food security through food assistance programs agricultural reconstruction and stabilization activities including $210 million for the McGovern-Dole International Food for Education and Child Nutrition Program
bull Requests $429 million the highest funding level ever for competitive grants through the Agriculture and Food Research Initiative while maintaining funding for formula grants Also the budget includes a 56 percent increase for the Sustainable Agriculture Research and Education (SARE) program aimed at helping farmers and ranchers adopt practices that are profitable environmentally sound and beneficial to communities
bull Requests $19 million an increase of 46 percent to strengthen regulatory oversight of biotechnology products and prevent regulated genetically engineered products from being co-mingled with non-regulated products
bull Increases funding for the National Organic Program by 45 percent to enhance enforcement ensure the integrity of the organic label and develop equivalency agreements to expand market access for US organic products
bull Includes a National Export Initiative that supports expanding export promotion activities as envisioned by this goal as well as spurring job creation and income growth for rural America under the strategic goal of assisting rural communities create prosperity
3
OVERVIEW
Strategic Goal Ensure that all of Americarsquos children have access to safe nutritious and balanced meals
bull Fully funds expected participation in nutrition assistance programs
bull Provides $10 billion over 10 years to strengthen the Child Nutrition and WIC programs through reforms aimed at improving program access establishing high standards for the nutritional quality of food available in schools exploring new strategies for reducing hunger and improving childrenrsquos food choices and improving program management
bull Proposes to raise current SNAP asset limits to streamline eligibility for families eligible for benefits from multiple programs and encourage families to save toward self-sufficiency This change would add $426 million to recipient benefits and SNAP program costs in 2011 with a 5-year total of $45 billion
bull Proposes to exclude lump sum tax credits from SNAP as part of a government-wide initiative for income support programs including Earned Income Child American Opportunity and Make Work Pay for 12 months following the month of receipt to prevent beneficiaries from experiencing a disruption in eligibility and benefits in the wake of new and refundable tax credits This change will increase recipient benefits and SNAP program costs about $11 million in 2011 with a 5-year total cost of $52 million Legislation is also being proposed to extend the Recovery Act provision that eliminates the time limits for able-bodied adults without dependents for an additional year for an one-time cost of $25 million
bull Provides over $1 billion for the Food Safety and Inspection Service including an increase of $27 million to more quickly identify and respond to outbreaks of foodborne illness as recommended by the Presidentrsquos Food Safety Working Group
Strategic Goal Assist rural communities to create prosperity so they are self-sustaining repopulating and economically thriving
bull Provides funding to support coordination of regional planning activities and establishes a set-aside that is roughly 5 percent of the funding about $280 million from approximately 20 existing programs that will be allocated competitively among regional pilot projects tailored to local needs and opportunities
bull Provides $50 million as part of the Administrationrsquos $400 million ldquoHealthy Food Financing Initiativerdquo to bring grocery stores and other healthy food retailers to underserved communities
bull Supports USDArsquos ldquoKnow Your Farmer Know Your Foodrdquo Initiative to facilitate the development of local and regional food systems that better connect consumers with local farms create new income opportunities for producers and place a greater focus on sustainable agricultural practices and nutritious local food
4
OVERVIEW
bull Requests $54 million for a National Export Initiative to expand export promotion activities that will spur job creation and income growth for rural America
bull Includes nearly $1 billion to foster the development of renewable energy
bull Fully funds the Voluntary Public Access and Habitat Incentive Program which encourages private landowners to voluntarily open their land to the public for hunting and fishing
bull Maintains a strong agriculture safety net through a system of income support disaster mitigation and farm loan programs Income support programs including direct and counter-cyclical payments and Average Crop Revenue Election (ACRE) payments are expected to total nearly $9 billion in 2011
bull Targets direct farm payments to those who needmdashand can most benefit frommdashassistance and reforms the crop insurance program by renegotiating the Governmentrsquos agreement with crop insurance companies
Strategic Goal Ensure our national forests and private working lands are conserved restored and made more resilient to climate change while enhancing our water resources
bull Increases funding for financial and technical assistance to support Farm Bill conservation programs to almost $5 billion that will improve water quality enroll almost 200000 additional acres of wetlands for restoration and reduce nutrient loading in the Chesapeake Bay Conservation activities will be targeted to priority landscapes through local state and Federal partnerships These priority landscapes may include the Bay-Delta region in California and the Upper Mississippi region These efforts will preserve and restore private lands protect water resources and mitigate the effects of climate change
bull Requests $50 million for the Presidentrsquos Watershed Improvement and Job Stabilization initiative through which the Forest Service will assess the condition of all of its watersheds prioritize them based on stakeholder input and the costs required to improve them and complete the highest priority projects to improve the condition of those watersheds
bull Accelerates the scale and pace of USDArsquos forest stewardship activities by transforming the Forest Service budget to take advantage of new tools to protect water resources and to make forests more resilient to climate change The budget provides full funding for the Forest Landscape Restoration Act and $30 million more for the Land and Water Conservation Fund
5
OVERVIEW
Management Initiatives
bull Provides $7 million for the Office of Advocacy and Outreach to increase the accessibility of USDA programs to underserved constituents and to carry out Farm Bill provisions concerning outreach to beginning small and socially disadvantaged farmers ranchers and rural communities Of this amount $4 million is for the agricultural labor grants program previously administered by Rural Development
bull Provides an increase of $83 million to support the Departmentrsquos multi-agency effort to modernize and upgrade the IT infrastructure The modernization effort will improve the ability of the Farm Service Agency Natural Resources Conservation Service and Rural Development to serve program participants This funding will allow for the first system-wide refresh of the Common Computing Environment (CCE) since the infrastructure was implemented in 2000
bull Requests $65 million to support a Government-wide Contracting and Acquisition Workforce Training initiative The requested funding will allow USDA to implement training recruitment and retention activities for the Departmentrsquos procurement workforce that is responsible for over $5 billion in annual procurement for the Department
6
HIGHLIGHTS BY GOALS
For 2011 the Departmentrsquos budget process was organized around four program goals and an overarching management goal to improve collaboration among mission areas and agencies and to strengthen the effectiveness of USDA programs This budget presentation reflects the Departmentrsquos goal-based organizational budget process It should be noted that although agency programs and associated funding have been aligned with the four program goals many programs contribute to the achievement of multiple goals
Highlights of the 2011 budget by strategic goal
STRATEGIC GOAL HELP AMERICA PROMOTE AGRICULTURAL PRODUCTION AND BIOTECHNOLOGY EXPORTS AS AMERICA WORKS TO INCREASE FOOD SECURITY
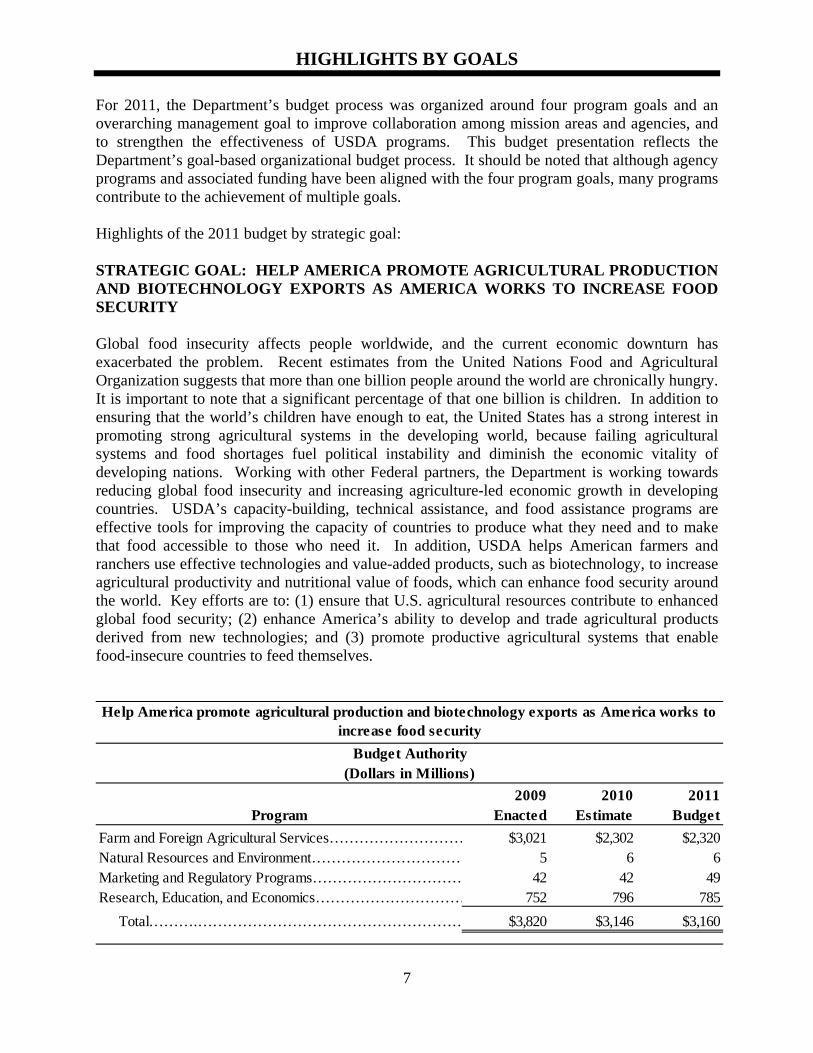
Global food insecurity affects people worldwide and the current economic downturn has exacerbated the problem Recent estimates from the United Nations Food and Agricultural Organization suggests that more than one billion people around the world are chronically hungry It is important to note that a significant percentage of that one billion is children In addition to ensuring that the worldrsquos children have enough to eat the United States has a strong interest in promoting strong agricultural systems in the developing world because failing agricultural systems and food shortages fuel political instability and diminish the economic vitality of developing nations Working with other Federal partners the Department is working towards reducing global food insecurity and increasing agriculture-led economic growth in developing countries USDArsquos capacity-building technical assistance and food assistance programs are effective tools for improving the capacity of countries to produce what they need and to make that food accessible to those who need it In addition USDA helps American farmers and ranchers use effective technologies and value-added products such as biotechnology to increase agricultural productivity and nutritional value of foods which can enhance food security around the world Key efforts are to (1) ensure that US agricultural resources contribute to enhanced global food security (2) enhance Americarsquos ability to develop and trade agricultural products derived from new technologies and (3) promote productive agricultural systems that enable food-insecure countries to feed themselves
Help America promote agricultural production and biotechnology exports as America works to increase food security
Budget Authority (Dollars in Millions)
2009 2010 2011 Program Enacted Estimate Budget
Farm and Foreign Agricultural Serviceshelliphelliphelliphelliphelliphelliphelliphelliphellip $3021 $2302 $2320 Natural Resources and Environmenthelliphelliphelliphelliphelliphelliphelliphelliphelliphellip 5 6 6 Marketing and Regulatory Programshelliphelliphelliphelliphelliphelliphelliphelliphelliphellip 42 42 49 Research Education and Economicshelliphelliphelliphelliphelliphelliphelliphelliphelliphellip 752 796 785 Totalhelliphelliphelliphelliphelliphelliphelliphelliphelliphelliphelliphelliphelliphelliphelliphelliphelliphelliphelliphelliphellip $3820 $3146 $3160
7
HIGHLIGHTS BY GOALS
Key Proposals for the 2011 Budget
bull Maintain funding for the McGovern-Dole International Food for Education and Child Nutrition Program The McGovern-Dole Program supports maternal infant and child nutrition programs in developing countries supporting food security and a healthy young population which in turn builds stable societies and increases national security The budget continues funding for the McGovern-Dole program at the 2010 enacted level of $2095 million Appropriated funding for the program was increased substantially in 2010 in order to help support additional school feeding and child nutrition programs and to bolster the Departmentrsquos contribution to supporting economic development and food security in developing countries The program is expected to assist an estimated 5 million women and children in 2011
bull Strengthen Agricultural Reconstruction and Stabilization Activities The budget provides $146 million to support the Departmentrsquos participation in reconstruction and stabilization activities primarily in Afghanistan and Iraq USDArsquos efforts support implementation of the Presidentrsquos strategies for these countries by providing technical experts who serve as advisors to key government ministries and serve on civilian-military command units including Provincial Reconstruction Teams working with farmers and local agricultural officials throughout the targeted countries During 2010 USDA is increasing the number of agricultural experts serving in Afghanistan from 14 to 64 Their work is essential for stabilizing strategic areas of the country building government capacity ensuring the successful management of assistance programs and addressing the issue of food insecurity It is estimated that as much as 80 percent of the Afghan population relies on agriculture for wages and sustenance Consistent with these efforts the Department has established a priority for increasing the number of Afghan provinces in which women and children are food secure from 10 to 14 by the end of 2011
bull Expand research to increase the adaptation of sustainable agricultural systems to farmerrancher and ecosystem needs The budget includes an increase of $11 million for Sustainable Agriculture Research and Education (SARE) programs bringing total funding to $30 million This includes $10 million for the creation of a new Federal-State Matching Grant program to assist in the establishment and enhancement of State sustainable agriculture research education and extension programs The matching requirement will leverage State or private funds SARE works to increase knowledge about and to help farmers and ranchers adopt practices that are profitable environmentally sound and beneficial to communities These competitive grants for sustainable agriculture research and education projects are awarded to scientists producers and others in order to solve problems in an interdisciplinary approach SARE grants also fund education and demonstration projects including the development of farmer-to-farmer networks Increased investment in SARE will provide American producers the tools necessary to ensure a profitable livelihood while protecting and conserving the Nationrsquos land and water resources Approximately 17000 farmers and ranchers will experience benefits by implementing innovative practices learned by participating in SARE
bull Strengthen Biotechnology Regulation The budget provides about $19 million for Biotechnology Regulatory Services within the Animal and Plant Health Inspection Service
8
HIGHLIGHTS BY GOALS
(APHIS) to assess the risks of forthcoming genetically modified organisms This is an increase of about $6 million compared to 2010 This funding will contribute to the Departmentrsquos objective of enhancing Americarsquos ability to develop and trade agricultural products derived from new technologies This includes working to prevent regulated genetically engineered products from being co-mingled with non-regulated products in commercial channels A strong regulatory system is needed to ensure the safe intr oduction of biotechnology products and to provide multiple agricultural production options
bull Maintain the integrity of the National Organic Program With sales of organic products increasing at close to 20 percent a year over the last decade additional resources are needed to ensure the integrity of the organic label As a result the 2011 budget includes an increase of $31 million for the National Organic Program almost a 45 percent increase above the 2010 funding level The increase includes $21 million for regulatory review enforcement and development of equivalency agreements plus a one-time increase of $1 million to assist accredited certifying agents enhance compliance with program regulations and ensure the integrity of the organic label which may lead to enhanced export opportunities In addition 2008 Farm Bill funds will continue to be used to provide cost share assistance for organic certification An increase of $03 million is requested for AMSrsquo Market News to continue vital data collection and repor ting of organic commodity information initiated with 2008 Farm Bill funding
bull Initiatives under other goals that promote agricultural production and exports As previously noted although agency programs and associated funding have been aligned with the four program goals many programs contribute to the achievement of multiple goals Additional initiatives that promote agricultural production and exports and the goal of assisting rural communities to create prosperity are discussed beginning on page 13 These initiatives include increasing the competitiveness of American agricultural exports maintaining a strong agricultural safety net modernizin g the farm program delivery system and ensuring fair and competitive agricultural markets
STRATEGIC GOAL ENSURE THAT ALL OF AMERICArsquoS C HILDREN HAVE ACCESS TO SAFE NUTRITIOUS AND BALANCED MEALS
A plentiful supply of safe and nutritious food is essential to the well-being of every family and the healthy development of every child in America A recent report by the Department showed that in over 500000 families with children in 2008 one or more children simply do not get enough to eat There is a growing body of evidence demonstrating that children who eat poorly or who engage in too little physical activity do not perform as well as they could academically and that improvements in nutrition and physical activity can result in improvements in academic performance Too many children also have poor diets and gain excessive weight Recent data shows that the prevalence of obesity has increased over 10 percent to 17 percent for children between 6 and 19 years of age There is also a paradox that hungry children are disproportionately prone to obesity Having poor access to healthy food contributes significantly to both of these problems The 2011 budget includes a $400 million Administration proposal to address these access issues
9
HIGHLIGHTS BY GOALS
Foodborne illness is recognized as a significant public health problem in the United States which can have a more severe impact on children than healthy adults According to the Centers for Disease Control and Prevention approximately half of the reported foodborne illnesses occur in children These illnesses can lead to short and long-term health consequences and sometimes death USDA and other Federal agencies are working in cooperation to ensure that Americarsquos children have increased access to safe and healthy food The end result will be healthier more active children who will be better able to succeed and live vital lives
USDA helps keep safe nutritious food accessible and affordable by preventing the entry and establishment of agricultural pests and diseases and minimizing production losses Safeguarding animal and plant resources against the introduction of foreign agricultural pests and diseases provides access to a diverse supply of fruits vegetables meat and poultry The Department detects and quickly responds to new invasive species and emerging agricultural and public health situations These efforts contribute to the overall agricultural health of the nations and the world
USDA supports and protects the Nationrsquos agricultural system and the consumers it serves by safeguarding the quality and wholesomeness of meat poultry and egg products providing nutrition assistance to children and low-income people who need it and proactively addressing and preventing loss and damage from pests and disease outbreaks Actions to support this goal include (1) helping put a healthy diet within reach of every American by increasing access to nutritious food (2) promoting healthy diet and physical activity behavior s (3) protecting public health by ensuring food is safe and (4) protecting agricultural health by minimizing major diseases and pests to ensure access to safe plentiful and nutritious food
Ensure that all of Americas children have access to safe nutritious and balanced meals
Budget Authority (Dollars in Millions)
2009 2010 2011 Program Enacted Estimate Budget
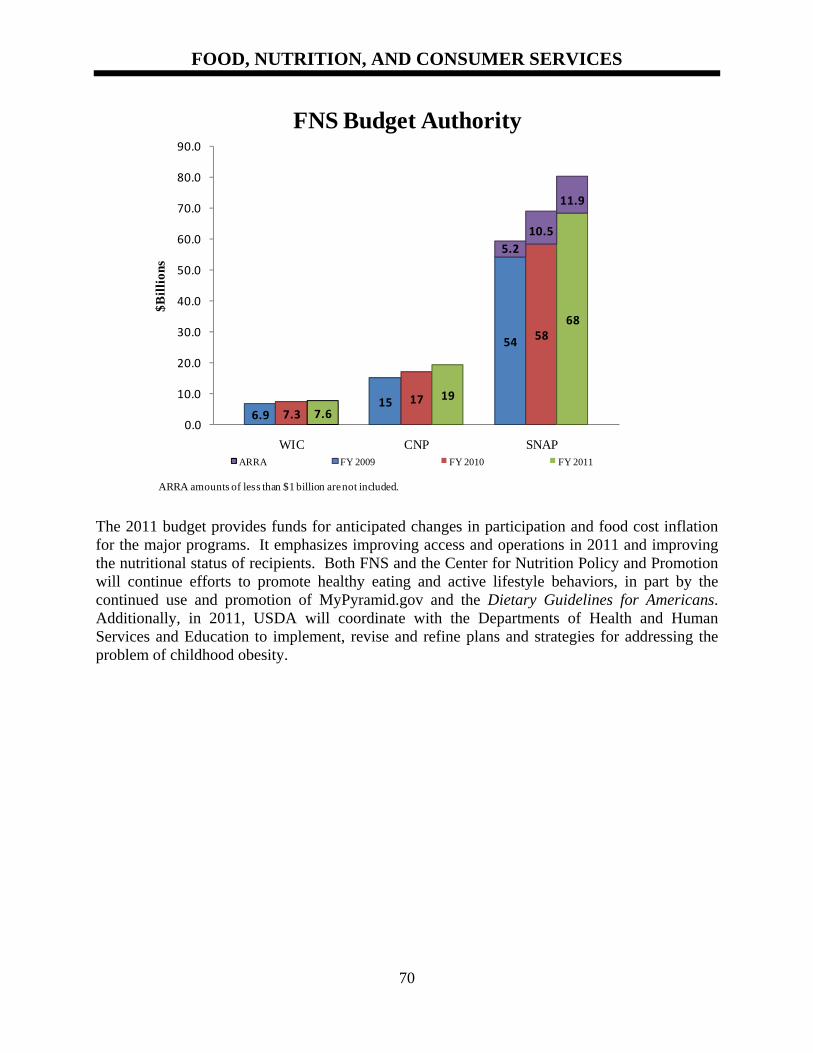
Food Nutrition and Consumer Serviceshelliphelliphelliphelliphelliphelliphelliphelliphellip $82249 $93854 $107617 Food Safetyhelliphelliphelliphelliphelliphelliphelliphelliphelliphelliphelliphelliphelliphelliphelliphelliphelliphelliphelliphellip 983 1028 1046 Marketing and Regulatory Programshelliphelliphelliphelliphelliphelliphelliphelliphelliphellip 1364 1613 1530 Research Education and Economicshelliphelliphelliphelliphelliphelliphelliphelliphelliphellip 445 479 470 Totalhelliphelliphelliphelliphelliphelliphelliphelliphelliphelliphelliphelliphelliphelliphelliphelliphelliphelliphelliphelliphellip $85041 $96974 $110663
Key Proposals for the 2011 Budget
bull Strengthen Child Nutrition and WIC programs Reauthorization of the Child Nutrition and the Special Supplemental Nutrition Program for Women Infants and Children (WIC) programs will provide significant opportunity to make available the resources needed to achieve the Presidentrsquos goal to eliminate childhood hunger by 2015 The Administration is proposing to add $10 billion over the next ten years for this effort These programs touch virtually every child in America by providing nutritious food and nutrition education to help them get the best start they can in life and connect them with critical health care services
10
HIGHLIGHTS BY GOALS
The Administrationrsquos proposals consistent with the recent National Academies Institute of Medicine (IOM) study would improve access to nutritious meals particularly for low-income children improve access to healthy fruits and vegetables reduce the prevalenc e of obesity by improving the diets of school children and by encouraging children to make wise food choices in and outside of school and improve program performance and integrity
bull Fully fund WIC WIC helps improve the health and nutritional intake of low-income pregnant breast-feeding and postpartum women infants and children up to their fifth birthday A record $76 billion is requested to ensure that all eligible women infants and children who want to participate can In addition significant increases are provided to foster increased breastfeeding including more funds for bonuses to States with high achievement in this important health priority The funding includes the resources necessary for State agencies to administer the program and to make good on the promise of the updated WIC food packages implemented beginning in FY 2010 The new food packages align with the Dietary Guidelines and infant feeding guidelines of the American Academy of Pediatrics to better promote breastfeeding increase participant rsquos consumption of fruits vegetables and whole grains and provide flexibility to accommodate cultural food preferences WIC funding will support over 10 million participants
bull Expand Supplemental Nutrition Assistance Program (SNAP) The Administration is working to establish a practical national asset limit floor across means-tested human services food and cash assistance programs Legislative language will be provided to raise current SNAP asset limits to $10000 from $2000 per household or $3000 for households including an elderly or disabled member This nationwide figure will streamline eligibility for families eligible for benefits from multiple programs and encourage families to save toward self-sufficiency This change would add $426 million to recipient benefits and SNAP program costs in 2011 with a 5-year total of $45 billion In addition FNS seeks to minimize eligibility churning and disruption caused when SNAP households receive lump sum tax refunds Legislative language will also provide for the exclusion of tax refunds in the month of receipt and for the following 12 months beginning in tax year 2009 for SNAP and all federally funded means-tested programs This will exclude lump sum tax credits including Earned Income Child American Opportunity and Make Work Pay for 12 months following the month of receipt This policy will prevent beneficiaries from experiencing a disruption in eligibility and benefits in the wake of new and refundable tax credits This change will increase recipient benefits and SNAP program costs about $11 million in 2011 with a 5-year total cost of $52 million Legislation is also bein g proposed to extend the Recovery Act provision that eliminates the time limits for able-bodied adults without dependents for an additional year for a one-time cost of $25 million
bull Strengthen administration and oversight of nutrition assistance programs Additional funding is needed to increase the staff available to improve access to nutrition assistance advance the public trust and enhance the nutritional quality of our nutrition assistance programs With rising program levels due to increased demand for nutrition assistance and rising public awareness of these significant outlays it is vital that the Food and Nutrition Service have sufficient staffing to maintain program oversight At the same time FNS is working to support the reauthorization of the Child Nutrition and WIC Programs implement the Child Nutrition Reauthorization extension programs develop proposals for the
11
HIGHLIGHTS BY GOALS
2012 Farm Bill and implement the school meal pattern regulations from the Institute of Medicine recommendations on a significantly compressed timeline FNS staff years have declined significantly from a peak of over 2700 down to less than 1300 in 2009 as program level has i ncreased significantly For 2011 the budget includes an increase of $52 million to enhance the Federal investment in program administration grantee oversight and program integrity
bull Improve nutrition education and promotion resources To ensure USDA makes progress on its strategic objectives to decrease the prevalence of obesity among children and adolescents and to improve the quality of the diets measured by the Healthy Eating Index (HEI) scores for people in low-income households (under 130 of poverty level) and for the general population the budget includes an increase of $9 million The increase will allow USDA to significantly increase development of scientific-evidence-based nutrition guidance that provides the basis for nutrition education and promotion provided by our public and private sector partners Updated Dietary Guidelines for Americans will be completed in 2010 along with enhancements to MyPyramid including interactive applications The increased funding will be used to create effective nutrition education inte rventions for schools and communities and broaden and maintain tools and systems that Americans can use to adopt behaviors that lead to more healthful eating and active lifestyles
bull Strengthen the food safety infrastructure The budget includes $1 billion for the Food Safety and Inspection Service an increase of $18 million over 2010 and funds recommendations of the Presidentrsquos Food Safety Working Group (FSWG) and other initiatives aimed at improving USDArsquos public health infrastructure Effective food safety inspections and enforcement depend upon timely quality data and analysis To ensure inspectors have the information they need the Department has invested in an automated system to alert inspectors about potential food safety problems and give them greater and more timely access to establishment performance data The Presidentrsquos budget includes a request of $40 million an increase of $13 million to continue the deployment and enhancement of the FSIS public health information infrastructure Additionally in support of key findings of the Presidentrsquos FSWG USDA will hire more epidemiologists to improve investigations of foodborne illness and outbreaks in coordination with State officials to develop ldquotrace backrdquo tools and improve record-keeping Similarly the 2011 budget proposes a $10 million increase for Baseline Studies and Hazard Analysis and Critical Control Points (HACCP) Verification Program Updates This increase above the 2010 level will allow FSIS to improve surveillance of foodborne pathogens of human-health concern in FSIS-regulated products through significant expansion of the HACCP regulatory sampling and to develop more timely estimates of pathogen prevalence in food products Accurate timely prevalence estimates for pathogens in food products are critical for evaluation of existing prevention policies and the development of new regulatory strategies These new investments will enhance FSISrsquo ability to collect analyze and present data to allow decision making based on relevant timely product and process data utilizing the best science available and respond to foodborne illness outbreaks more effectively and efficiently to better protect consumers and help industry recover faster
bull Minimize the impact of major animal and plant diseases and pests As part of the Departmentrsquos goal to ensure children have access to safe nutritious and balanced meals
12
HIGHLIGHTS BY GOALS
APHIS and other agencies protect agricultural health by minimizing major diseases and pests APHIS activities that contribute to this goal include pest and disease exclusion plant and animal health monitoring response to outbreaks of foreign plant and animal threats and management of endemic pest and diseases Of note the 2011 budget includes $11 million to continue efforts initiated with emergency funding to address the light brown apple moth (LBAM) This is an increase of $10 million compared to 2010 The LBAM is an invasive pest that attacks a wide variety of plants of agricultural or horticultural significance APHIS estimates the pest could cause annual production losses up to $1 billion if allowed to spread
bull Expand food safety research The safety of the food supply continues to be a vital public health priority Therefore USDA research continually works to meet the evolving threats to the Nationrsquos food supply The Departmentrsquos research focuses on the reduction of the hazards of introduced and naturally occurring toxins in foods and feed including pathogenic bacteria viruses parasites chemical contaminants mycotoxins and naturally occurring toxins produced by plants As part of an integrated food safety research initiative the budget proposes an increase of $25 million $20 million through NIFArsquos Agriculture and Food Research Initiative competitive program and an additional $5 million for ARS food safety research These initiatives will strengthen surveillance and epidemiology program s control food pathogens in the preharvest stage develop innovative interventions strategies to eliminate pathogens and contaminants and ensure postharvest safety and quality
bull Increase the level of obesity prevention research The increasing prevalence of overweight and obesity is unprecedented in US history and is a major cause of escalating health care costs and a predisposition of Americans to cardiovascular disease Type 2 diabetes and several cancers There is a critical need for effective proven methods for the prevention of weight gain as an important step for reducing overall obesity and overweight in the population The 2011 budget includes an increase of $50 million for research through the Agriculture and Food Research Initiative competitive grant program that will focus on identifying behavioral factors that influence obesity and conducting nutrition research that leads to the development of effective programs to prevent obesity AFRI funding will also focus research on addressing the micronutrient content of new food crops and improving the nutritional value of staple crops fruits and vegetables through plant breeding leading to greater access to healthy foods
STRATEGIC GOAL ASSIST RURAL COMMUNITIES TO CREATE PROSPERITY SO THEY ARE SELF-SUSTAINING REPOPULATING AND ECONOMICALLY THRIVING
The economic downturn has impacted many sectors and areas of the Nation including rural America At this time there remains high poverty in sparsely populated rural areas which is reflected in higher mortality rates for children higher unemployment and declining populations Since the beginning of the economic slowdown rural residents have experienced a greater decline in real income compared to other parts of the Nation Some factors contributing to this include lower rural educational attainment less competition for workers among rural employers and fewer highly skilled jobs in the rural occupational mix Given these challenges it is not surprising that over 51 percent of rural counties lost population and that a majority of farm families rely on a significant amount of off-farm income to meet their needs However an
13
HIGHLIGHTS BY GOALS
energetic and creative citizenry is looking for new ways to spur rural economic activity to create prosperity and strengthen the economic foundations of their communities Rural communities and businesses are implementing innovative technologies and modernizing infrastructure to create jobs develop new markets and increase competitiveness while conserving the Nationrsquos natural resources and providing a safe sufficient and nutritious food supply for the country and the world As a leading advocate for rural America USDA is at the forefront of developing the technology and tools necessary to transform rural America to take advantage of new opportunities
The Department supports rural communities and enhances quality of life for rural residents by improving their economic opportunities community infrastructure environmental health and the sustainability of agricultural production The common goal is to help create thriving rural communities where people want to live and raise families and where the children have economic opportunities and a bright future USDA will support this goal with actions to support a competitive agricultural system create livable communities and enhance rural prosperity The cornerstone of these efforts include five pillars of success which are (1) increasing access to broadband and continuous business creation (2) facilitating sustainable renewable energy development (3) developing regional food systems (4) capitalizing on climate change opportunities and (5) generating and retaining jobs through recreation and natural resource restoration conservation and management
Assist rural communities to create prosperity so they are self-sustaining repopulating and economically thriving
Budget Authority (Dollars in Millions)
2009 2010 2011 Program Enacted Estimate Budget
Farm and Foreign Agricultural Serviceshelliphelliphelliphelliphelliphelliphelliphelliphellip Rural Developmenthelliphelliphelliphelliphelliphelliphelliphelliphelliphelliphelliphelliphelliphelliphelliphelliphellip Natural Resources and Environmenthelliphelliphelliphelliphelliphelliphelliphelliphelliphellip Marketing and Regulatory Programshelliphelliphelliphelliphelliphelliphelliphelliphelliphellip Research Education and Economicshelliphelliphelliphelliphelliphelliphelliphelliphelliphellip Office of the Secretaryhelliphelliphelliphelliphelliphelliphelliphelliphelliphelliphelliphelliphelliphelliphelliphellip Office of the Chief Economisthelliphelliphelliphelliphelliphelliphelliphelliphelliphelliphelliphelliphellip
$20378 7247 2005
950 1355
0 6
$19171 3343
978 871
1286 0 6
$19848 2944
986 868
1267 35 6
Totalhelliphelliphelliphelliphelliphelliphelliphelliphelliphelliphelliphelliphellip helliphelliphelliphelliphelliphelliphellip hellip $31941 $25655 $25954
Key Proposals for the 2011 Budget
Multi-Agency Initiatives
bull Increase the prosperity of rural communities by strategically investing in regional innovation In recent years rural communities have been losing population have a growing income disparity with urban communities and have an aging workforce To increase prosperity USDA proposes to establish a Regional Innovation Initiative to focus on the
14
HIGHLIGHTS BY GOALS
planning and coordination of USDA and other sources of assistance for rural communities The initiative recognizes that individual communities are often affected by linkages to the other communities within regions and that working together can produce more prosperity for all By creating a regional focus and increasing collaboration with other Federal agencies USDA resources will have a larger impact enabling greater wealth creation quality of life improvements and sustainability USDA will implement a strategy that includes substantial technical assistance to enable rural regions to develop regional strategic plans Several USDA agencies will participate in the initiative including agencies from the Rural Development Marketing and Regulatory Programs and Natural Resources and Environment mission areas Beginning in 2010 USDA intends to explore its current authorities to demonstrate the potential for this approach The 2011 budget includes $14 million in Rural Development to support coordination of regional planning activities It also includes a general provision to provide a 5 percent set-aside of the funding for several USDA programs This set aside will facilitate funding for proje cts that are part of a regional strategy subject to projects meeting the eligibility requirements for the individual programs The set-aside would amount to over $135 million in budget authority which would be sufficient to support a program level of about $280 million
bull Provide incentives for food entrepreneurs to establish or expand markets and grocery stores to make healthy foods available to underserved Americans The 2011 Budget provides funding for a new multi-year multi-agency Healthy Food Financing Initiative that will increase the availability of affordable healthy foods in underserved urban and rural communities particularly through the development or equipping of grocery stores and other healthy food retailers The Departments of Agriculture Health and Human Services and Treasury will partner to make available over $400 million in financial and technical assistance to community development financial institutions other nonprofits public agencies and businesses with sound strategies for addressing the healthy food needs of communities The USDA budget includes a total of $50 million for the initiative These funds will be made available for a number of loan grant promotion and other programs that provide financial and technical assistance to support market p lanning and promotion efforts as well as infrastructure and operational improvements designed to stimulate consumer demand enhance marketing expand demand and retail outlets for farm products and increase availability of locally and regionally produced foods
bull Increase economic opportunities for producers by developing local and regional food systems USDArsquos ldquoKnow Your Farmer Know Your Foodrdquo initiative will facilitate the development of local and regional food systems that better connect consumers with local farms create new income opportunities for farmers and place a greater focus on sustainable agricultural practices and nutritious local food An increased emphasis on regional food systems will have direct and significant benefits to rural communities USDA will work to promote local and regional distribution and utilize existing strategic partnerships to levera ge local food systems USDA will also work more closely with local purchasers institutional purchasers and other regional stakeholders to create regional support systems This effort will leverage funding and program expertise from every mission area of the Department
15
HIGHLIGHTS BY GOALS
bull Promote the development of renewable energy to support energy independence and a healthier environment USDA promotes rural Americarsquos leadership in the research development and sustainability of renewable energy and energy efficiency in order to effectively reduce Americarsquos dependence on foreign oil and reduce greenhouse gas emissions USDA programs make it economically feasible for farmers ranchers and other rural small businesses to invest in alternative energy production and energy-saving activities Through funding opportunities in the form of payments grants loans and loan guarantees USDA is committed to developing clean energy sources promoting energy efficiency and curbing the effects of climate change The 2011 budget supports renewable energy development through commercialization and research This support will create jobs help establish businesses and improve economic prosperity in rural areas The budget includes funding for programs with specific energy-related purposes including the Rural Energy for America Program (REAP) and the Biorefinery Assistance Program to add to the mandatory funding provided through the 2008 Farm Bill Funding for several business programs including the Business and Industry Loan Guarantee Program and Value-Added Grants will be available for green energy projects Funding for the Homeownership Loan and Loan Guarantee programs will provide financing for more energy efficient homes In support of the Presidentrsquos commitment made at the 2009 G20 Summit the budget will target Electric Loan Program financing to alternative energy and end subsidies for the generation of electricity using fossil fuel Finally the budget includes an increase of $34 million for a comprehensive research program in alternative and renewable energy within the Agriculture and Food Research Initiativersquos competitive grant program This will advance the development of dedicated sustainable feedstocks and feedstock production systems which will not impact the food supply
bull Make rural America a better place to live USDA seeks not only to enhance the opportunities necessary for rural families to thrive economically but also to improve the living conditions in rural communities so that they are places where people can thrive USDA provides the resources and expertise necessary to rebuild the infrastructure of small communities ensuring that rural residents have decent housing and home-ownership opportunities clean water adequate systems for handling waste and vital community facilities including critical health-care centers schools and public safety departments For 2011 the budget supports $12 billion for rural home ownership by establishing a fee structure consistent with other Federal housing programs that will eliminate the subsidy costs for all new guaranteed loans Furthermore the budget includes a loan level increase of over $25 million to provide funding to support additional multi-family housing for very-low and low income families In 2011 the budget supports $16 billion in program level to provide over 14 million rural households with new or improved water and waste disposal facilities
A healthy environment is also an essential ingredient for thriving sustainable rural communities and rural quality of life For 2011 the Conservation Stewardship Program (CSP) will serve a key rol e in improving and maintaining the quality of surface water and groundwater in order to protect human health support a healthy environment and enable the productive use of land The FY 2011 budget funds CSP at approximately $630 million and nearly half or $315 million is targeted towards conservation planning and implementation to meet this strategic goal
16
HIGHLIGHTS BY GOALS
Improving agricultural education is critical to retaining young people in rural America The 2011 budget includes a number of investments in education including $10 million for the Hispanic-Serving Agricultural Colleges and Universities Endowment Fund The annual interest earnings from the Endowment Fund will be used to enhance education in agricultural sciences and related disciplines by building educational capacity at these institutions in the areas of curricula design faculty development and student recruitment and retention Additionally increased funding of $23 million is proposed in 2011 for expanding extension education programs on Indian Reservations and Tribal jurisdictions through the Federally-Recognized Tribes Extension Program and an increase of $1 million is required for Tribal Colleges Extension Services at all 1994 land-grant institutions to address the nutrition education needs of Native American s The budget also includes an increase of $5 million to support the next generation of agricultural scientists in the workforce by working with higher-education institutions to develop education and training programs with strong science technology engineering and math curriculums and increase enrollment in secondary and two-year post-secondary programs
Other Proposals
bull Increase the competitiveness of American agricultural exports Agricultural trade contributes directly to the prosperity of local and regional economies across rural America through higher commodity prices and increased sales USDA estimates that every $1 billion worth of agricultural exports supports 9000 jobs and generates an additional $14 billion in economic activity At the same time however foreign trade barriers limit exports thereby reducing farm income and preventing job growth in the agricultural sector The 2011 budget supports the National Export Initiative by providing increased funding of $54 million for the Foreign Agricultural Service (FAS) to support activities that will help to bolster the level of US agricultural exports and thereby contribute to enhanced rural prosperity and employment Of the funding provided $10 million will be used to expand FAS exporter assistance and in-country promotion activities and to meet higher operating costs at FAS overseas posts The initiative also includes $345 million to supplement funding for the Foreign Market Development (Cooperator) Program and $9 million for the Technical Assistance for Specialty Crops (TASC) Program Funding for the Cooperator and TASC programs will be in addition to that provided by the Commodity Credit Corporation and will double the overall level of funding for both programs in 2011
bull Maintain a strong agriculture safety net The 2011 budget maintains strong support for American farmers and ranchers through a system of income support disaster mitigation and farm loan programs Income support programs including direct and counter-cyclical payments and Average Crop Revenue Election payments are expected to total nearly $9 billion in 2011 The budget proposes modest reductions in the current cap on direct payments and a three-year phased reduction in farm program average Adjusted Gross Income eligibility limits for large farmers and wealthy landowners These adjustments in current program limits would affect only a very small portion of the farm program participants without disturbing the foundation of the current safety net for productive family farmers Disaster mitigation programs include the Supplemental Agricultural Disaster Assistance (SADA) programs and the Federal crop insurance program FY 2011 assistance under the SADA programs is expected to total about $14 billion while net indemnities (gross
17
HIGHLIGHTS BY GOALS
indemnities minus producer premium) under the Federal crop insurance program are expected to total about $46 billion Farm loan programs including direct and guarantee d farm ownership operating and conservation loans and Indian fractionated land loans are expected to total over $47 billion in 2011 The budget proposes $5 million increase in funding for the county estimates data collected by the National Agricultural Statistics Service Improving the quality of this data will enhance the integrity of the farm programs
bull Create new economic opportunities for American agriculture through environmental services markets To support the Departmentrsquos efforts of creating economic opportunities in rural America the 2011 budget includes activities to expand market opportunities for farmers ranchers and forest landowners Although climate change is a critical challenge facing the agricultural and forestry communities proposed legislation to respond to that challenge may create significant economic opportunities To take advantage of these opportunities USDA is seeking $2 million to support the Office of Ecosystem Services and Markets to provide analysis and establish guidelines for participation of agriculture producers and forest landowners in potential offset markets under a carbon cap and trade system These guidelines will also support market opportunities in the provision of other ecosystem services beyond carbon sequestration such as wildlife habitat preservation and water quality management Through the development of these guidelines USDA will strive to expand opportunities in rural America to create prosperity while conserving natural resources
bull Continue modernization of the farm program delivery system Continued progress needs to be made in modernizing IT systems critical to the delivery of farm service programs These systems support the delivery of over $9 billion of farm program benefits to 14 million producers Several initiatives are underway to streamline business processes and transition them away from an antiquated legacy IT system to a 21st century IT system When fully implemented these new delivery processes will expedite the delivery of all farm programs including the 2008 Farm Bill programs An increase of $953 million is proposed to support these modernization efforts This amount consists of $393 million directed toward the multi-year MIDAS initiative to streamline business processes for farm program delivery $20 million to convert software and transition applications from outmoded legacy systems to new web-based technologies and $36 million to support an $83 million multi-agency effort to refresh the aging hardware supporting the Common Computing Environment in order to maintain system reliability
bull Create National Forest recreation and forestry job opportunities USDA natural resources conservation restoration and land management programs generate economic value by attracting tourism and recreation visitors and sustaining green jobs including work restoring or creating trails and facilities providing camping boating and outfitter and guide services and supporting associated retail businesses The 2011 Forest Service (FS) recreation budget includes an increase of $5 million to ensure the National Forest roads that provide recreation opportunities to the public match the FSrsquo newly created motor-vehicle-use maps The FS budget also contains $50 million for the Presidentrsquos new Pr iority Watersheds and Job Stabilization initiative A main focus of this initiative will be creating and preserving jobs After conducting a prioritization assessment FS will use stewardship contracts (10 years in length) to produce long-term jobs across the Nation Moreover the agency will leverage outside sources to create jobs for youth in rural areas
18
HIGHLIGHTS BY GOALS
bull Ensure fair and competitive agricultural markets The 2011 budget includes an increase of $18 million to further streng then enforcement of the Packers and Stockyards Act With additional staff and legal support the Grain Inspection Packers and Stockyards Administration will bolster direct enforcement and promote greater voluntary compliance with the Act Current staffing levels are insufficient to address the growing need for regulatory and audit activities
STRATEGIC GOAL ENSURE OUR NATIONAL FORESTS AND PRIVATE WORKING LANDS ARE CONSERVED RESTORED AND MADE MORE RESILIENT TO CLIMATE CHANGE WHILE ENHANCING OUR WATER RESOURCES
A healthy and prosperous America relies on the health of our natural resources and particularly our forests and agricultural working lands The health of Americarsquos forests farmers ranchers and grasslands must be nurtured so that they continue to offer environmental benefits as a source of clean air clean and abundant water and wild life habitat Americarsquos forests supply communities with clean abundant water shelter wildlife and help us mitigate and adapt toclimate change Forests also help generate rural wealth through recreation and tourism through the creation of green jobs and through the production of wood products and energy They are a source of cultural heritage and are a national treasure
USDA plays a pivotal role in protecting and restoring these lands while making them more resilient to threats and enhancing our natural resources USDA partners with private landowners to help protect the Nationrsquos 13 billion acres of farm ranch and private forestlands As public land stewards USDA works to conserve and restore 193 million acres of National Forests and Grasslands in the National Forest System Through these programs USDA partners with other Federal agencies tribal and state governments and non-governmental organizations to assist land and natural resource managers and to connect people to the Nationrsquos magnificent lands USDA agencies provide technical financial and planning assistance to public and private partners USDArsquos data banks research and innovations give landowners and managers access to the latest science and technology to make informed decisions and implement conservation practices USDA also connects forest and farm landowners with emergent markets for ecosystem services so that they can reap the economic and environmental benefits of good stewardship This goal will be supported with actions to (1) Restore and conserve the Nationrsquos forests farms ranches and grasslands (2) Lead efforts to mitigate and adapt to climate change (3) Protect and enhance Americarsquos water resources and (4) Reduce risk from catastrophic wildfire and restore fire to its appropriate place on the landscape
19
HIGHLIGHTS BY GOALS
Ensure our national forests and private working lands are conserved restored and made more resilient to climate change while enhancing our water resources
Budget Authority (Dollars in Millions)
2009 2010 2011 Program Enacted Estimate Budget
Farm and Foreign Agricultural Serviceshelliphelliphelliphelliphelliphelliphelliphelliphellip $2245 $2331 $2317 Natural Resources and Environmenthelliphelliphelliphelliphelliphelliphelliphelliphelliphellip 8564 9149 9146 Marketing and Regulatory Programshelliphelliphelliphelliphelliphelliphelliphelliphelliphellip 86 101 71 Research Education and Economicshelliphelliphelliphelliphelliphelliphelliphelliphelliphellip 420 444 448 Office of the Chief Economisthelliphelliphelliphelliphelliphelliphelliphelliphelliphelliphelliphelliphellip 0 3 3 Hazardous Materials Managementhelliphelliphelliphelliphelliphelliphelliphelliphelliphelliphellip 5 5 5 Totalhelliphelliphelliphelliphelliphelliphelliphelliphelliphelliphelliphelliphelliphelliphelliphelliphelliphelliphelliphelliphellip $11320 $12033 $11990
Key Proposals for the 2011 Budget
Multi-Agency Initiatives
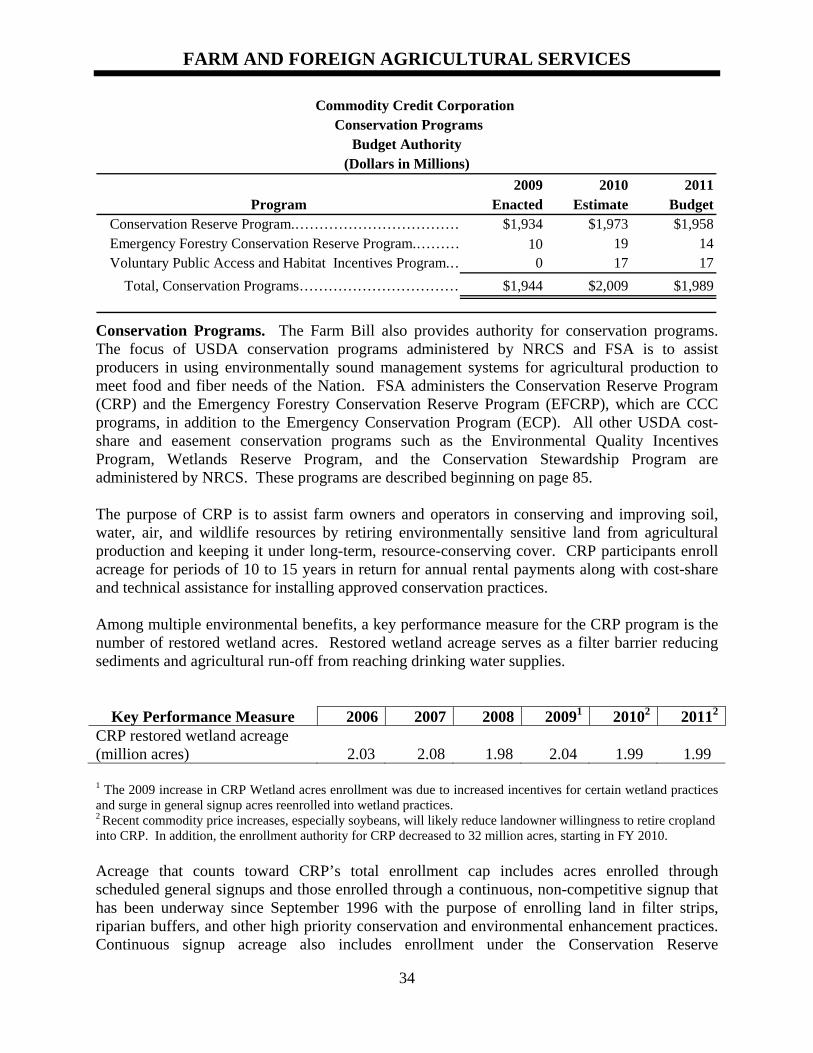
bull Expand funding for financial and technical assistance to support Farm Bill conservation programs The budget includes record levels of support for Farm Bill conservation programs bringing total funding to about $5 billion an increase of $42 million Recognizing the need for judicious allocation of these conservation resources the budget reflects a strategic targeting of high priority programs current workforce and workload capacity and efforts to ensure financial integrity and cost effectiveness This level of funding will also ensure beneficial results from investments in conservation The Conservation Reserve Program is funded at $196 billion about the same level as 2010 to support total enrollment of more than 30 million acres The Environmental Quality Incentives Program (EQIP) which is vital to ensuring that agricultural lands are effectively managed to support both agricultural production and conservation is funded at $121 billion an increase of $28 million over 2010 The Chesapeake Bay Watershed Initiative which is operated under EQIP will be funded at a level of $72 million an increase of $29 million over 2010 to help agricultural producers install conservation practices in the Chesapeake Bay watershed Funding for the newly operational Conservation Stewardship Program will be increased by $160 million to a total of $629 million which will enroll 12 million new acres in the program as well as support prior year contracts Wetlands are among the most productive ecosystems in the world that provide countless economic and environmental benefits to local communities The Wetlands Reserve Program which is one of the principal programs that support wetlands preservation and restoration is funded at $502 million in 2011 This will enable enrollment of nearly 193000 new acres into the program a level well above recent year enrollments
bull Enhance the protection of the Nationrsquos water supply To accelerate progress in protecting and enhancing the Nationrsquos water supply strategic conservation efforts are called for that identify the priority landscapes most in need of attention the critical acres within those
20
HIGHLIGHTS BY GOALS
landscapes and the high impact target (HIT) practices that will deliver the greatest benefit The 2011 budget supports efforts by the Natural Resources Conservation Service and the Forest Service to achieve the Departmentrsquos priority for accelerating the protection of clean abundant water resources by implementing HIT practices on 15 million acres of agricultural lands and 15 million acres of National Forests in priority landscapes HIT practices are those conservation measures identified by the Department to have the most significant impact on improving or conserving land and water resources Priority land scapes may include the Chesapeake Bay Upper Mississippi River Delta Lower Mississippi River Delta the Sierra Nevada the Front Range of Colorado and the California Bay Delta
Other Proposals
bull Improve targeting of conservation technical and financial assistance The 2011 budget proposes an innovative new approach to improving the Departmentrsquos strategic investment in conservation by establishing and deploying Strategic Watershed Action Teams in high priority watersheds that would help plan and apply conservation practices in a defined landscape The budget includes an increase of $25 million to support up to 35 teams of five NRCS employees each to target an identified watershed for a period of 3 to 4 years with the intent of reaching 100 percent of the landowner base eligible for Farm Bill conservation program assistance The additive effect of planned and applied conservation practices would hasten environmental improvement while keeping production agriculture competitive and profitable This initiative should greatly increase the environmental cost-effectiveness of NRCS technical and financial assistance programs It will also improve the agencyrsquos coordination with the Forest Service as that agency seeks to adopt a more landscape-scale approach to leverage its natural resource programs and to conserve and restore forestland and grassland
bull Increase support for the Land and Water Conservation Fund (LWCF) The LWCF is a special account created in 1964 and has been the principal federal source of monies to acquire new recreation lands Forest Service is one of four federal agencies to receive a portion of these funds The fund accumulates revenues from designated sources and they become available only after Congress appropriates them In line with the Presidentrsquos commitment t o fully fund the LWCF by 2014 the Forest Servicersquos Forest Legacy program and Land Acquisition program have proposed increases of $21 million and $10 million respectively
bull Improve National Forest System (NFS) watersheds Protecting Americarsquos supply of clean and abundant water is among the most crucial environmental challenges of the 21st Century Water is essential for life and vital to our prosperity this precious resource is the foundation for healthy ecosystems sustainable agricultural and forest production livable communities and viable industry The Forest Service has placed a focus on improving the health of its watersheds restoring ecosystem functions and increasing forestsrsquo resiliency to climate change The budget proposes a new line item ldquoIntegrated Resource Restorationrdquo that better characterizes the scope of the work that the Agency intends to perform in 2011 This line item is funded at $694 million of which $40 million is provided for the Collaborative Forest Landscape Restoration Fund and $50 million is provided for the Presidentrsquos new Priority Watersheds and Job Stabilization initiative Under this initiative rapid watershed
21
HIGHLIGHTS BY GOALS
assessments will be conducted of all NFS lands the agency will prioritize watershed improvement work and work that can demonstrate a change in watershed condition will be funded in a variety of watersheds across the country
bull Support Climate Change Mitigation and Adaptation USDA provides leadership to help landowners and communities adapt to climate change impacts that are already appearing These include changing water flow availability and quality changing weather patterns and ambient temperatures increased fire risk increased threats from insects and disease and changing habitat and climatic zones USDA conducts research that contributes to the development of climate change mitigation and adaptation tools and technologies and USDA outreach and extension networks make them available to farmers ranchers and land managers The 2011 budget includes an increase of $50 million within the Agriculture and Food Research Initiative competitive grants program for global climate change r esearch to develop mitigation capabilities and adaptive capacities for agricultural production
MANAGEMENT INITIATIVES
To support achievement of its strategic goals USDA is working to transform itself into a model organization By strengthening management operations and engaging employees USDA will improve customer services increase employment satisfaction and develop and implement strategies to enhance leadership performance diversity and inclusion The transformation will result in process improvements and increased perfo rmance USDA has identified the following eight management initiatives to support this effort
bull Engage USDA Employees to Transform USDA into a Model Agency USDA will continue to generate opportunities to listen to employeesrsquo concerns and ideas and to design and implement beneficial systemic changes to processes that affect employee satisfaction and human resources
bull Provide Civil Rights Services to Agriculture Employees and Customers The Departmentrsquos leadership has established civil rights as one of its top priorities To be successful all USDA employees must be committed to making USDA a model in the Federal Government for respecting the civil rights of its employees and constituents
bull Coordinate Outreach and Improve Consultation and Collaboration Efforts to Increase Access to USDA Programs and Services USDA will ensure that all Americans have equal and fair access to key USDA programs and services
bull Leverage USDA Departmental Management to Increase Performance Efficiency and Alignment USDA will expand the use of performance metrics to track areas of success and those needing improvement across the Department This information will allow agency decision makers to align resources to achieve the highest outcome
bull Optimize Information Technology (IT) Policy and Applications The Department is working to improve the effective delivery of programs and services to its constituents applicants and customers by deploying broadband creating an enterprise platform that
22
HIGHLIGHTS BY GOALS
enables open communication channels ensuring the protection of mission-critical operations and customer data and supporting portfolio views for managing across organization and geographic boundaries
bull Optimize USDA ldquoGreenrdquo or Sustainable Operations One of the Presidentrsquos top priorities for all Federal agencies is to establish an integrated strategy to work towards sustainability and to achieve reduction of greenhouse gas emissions As a steward of natural resources USDA is committed to achieving these goals and will focus its efforts towards sustainable operations
bull Enhance USDA Homeland Security and Emergency Preparedness to Protect USDA Employees and the Public USDA is working to enhance homeland security and emergency activities to provide a coordinated national effort to protect American agriculture and rural communities from intentional harm
bull Enhance the USDA Human Resources Process to Recruit and Hire Skilled Diverse Individuals to Meet the Program Needs of USDA USDA is reforming its hiring process to ensure a streamlined user-friendly environment for both the applicant and the hiring manager which will lead to the identification and selection of the most talented and competent workforce possible In doing so the Department will experience increased diversity while addressing current and future skills gaps
Key Proposals for the 2011 Budget
bull Enhance human resource capabilities As part of its efforts to transform USDA into a model organization Departmental Management (DM) is leading an initiative to respond to the Departmentrsquos human resources challenges As part of this initiative DM will focus on improving leadership development labor relations human resources accountability and veterans and other special employment programs This initiative will allow USDA to develop a workforce capable of leading the Department as it implements the strategic goals set forth by the Administration
bull Expand Program Participation of Underserved Constituents To address the need for better outreach to underserved program participant groups USDA is proposing to expand the Office of Advocacy and Outreach (OAO) in the 2011 budget through an increase of $5 million Of this amount $4 million is requested for agricultural labor grants authorized under section 14204 of the 2008 Farm Bill This program was funded through Rural Development in 2010 at the same level As part of this proposal USDA is requesting funding that will allow OAO to adequately conduct its activities related to overseeing the Advisory Committees on Minority Farmers and Beginning Farmers and Ranchers administration of the Outreach to Socially Disadvantaged Farmers Grant Program (section 2501 Program) overseeing the activities of the Office of Small Farms Coordination and the Farm Worker Coordinator managing t he 1994 1890 and Hispanic Serving Institutions Programs and other outreach functions
bull Improve service center agency IT infrastructure The 2011 budget includes $83 million to support the Departmentrsquos multi-agency effort to modernize and upgrade the IT
23
HIGHLIGHTS BY GOALS
infrastructure (also known as the Common Computing Environment (CCE)) for the Service Center Agencies (SCAs) These funds are requested in FSA NRCS and RD The proposed funding will be used to replace outdated components of the CCE many of which have exceeded their expected life cycles to reduce system vulnerabilities to failure and improve the performance and effectiveness of the shared infrastructure These improvements will allow the SCAs to better serve program participants with a more flexible and reliable IT infrastructure This funding will allow for the first system-wide refresh of the CCE since the infrastructure was implemented in 2000 In addition as the components of the CCE are replaced USDA will implement a right-sizing process whereby configuration changes will be made to better support the delivery of current and future programs As part of this process the Department will strive to improve system security reduce the long term cost of infrastructure services and improve service reliability
bull Enhance Acquisition Workforce Capabilities The 2011 budget requests $65 million to support a Government-wide Contracting and Acquisition Workforce Training initiative The requested funding will allow USDA to implement training recruitment and retention activities for the Departmentrsquos procurement workforce that is responsible for over $5 billion in annual procurement for the Department These workforce efforts along with procurement system improvements will allow USDA to achieve substantial cost savings and cost avoidances in the contracting and acquisition activities across all agencies
24
FARM AND FOREIGN AGRICULTURAL SERVICES
MISSION AND RELATIONSHIP TO STRATEGIC GOALS
The Farm and Foreign Agricultural Services (FFAS) mission area has responsibility for the delivery of programs and services which focus on supporting a sustainable and competitive US agricultural system The US agricultural sector produces $300 billion worth of farm products providing a major foundation for prosperity in rural areas as well as a critical element of the nationrsquos economy FFAS also plays an important role in the protection and enhancement of the Nationrsquos natural resource base and environment Thus the area contributes to multiple USDA Strategic Goals Specifically to assist rural communities create prosperity the FFAS mission area engages in the following activities (1) supports a strong farm financial safety net and (2) promotes the vitality of rural America by improving access to international markets providing credit guarantees for US farm exports supporting industry efforts to develop new markets and promoting better international acceptance of the products of biotechnology In support of ensuring private working lands are preserved the FFAS area (1) protects watershed health to ensure clean and abundant water and (2) enhances soil quality to maintain productive working cropland Finally in support of agricultural production and biotechnology it promotes the international acceptance of new technologies including biotechnology and promotes sustainable productive agricultural systems and trade in developing countries to enhance global food security
The work of the FFAS mission area is carried out by its three agencies the Farm Service Agency (FSA) Risk Management Agency (RMA) and Foreign Agricultural Service (FAS)
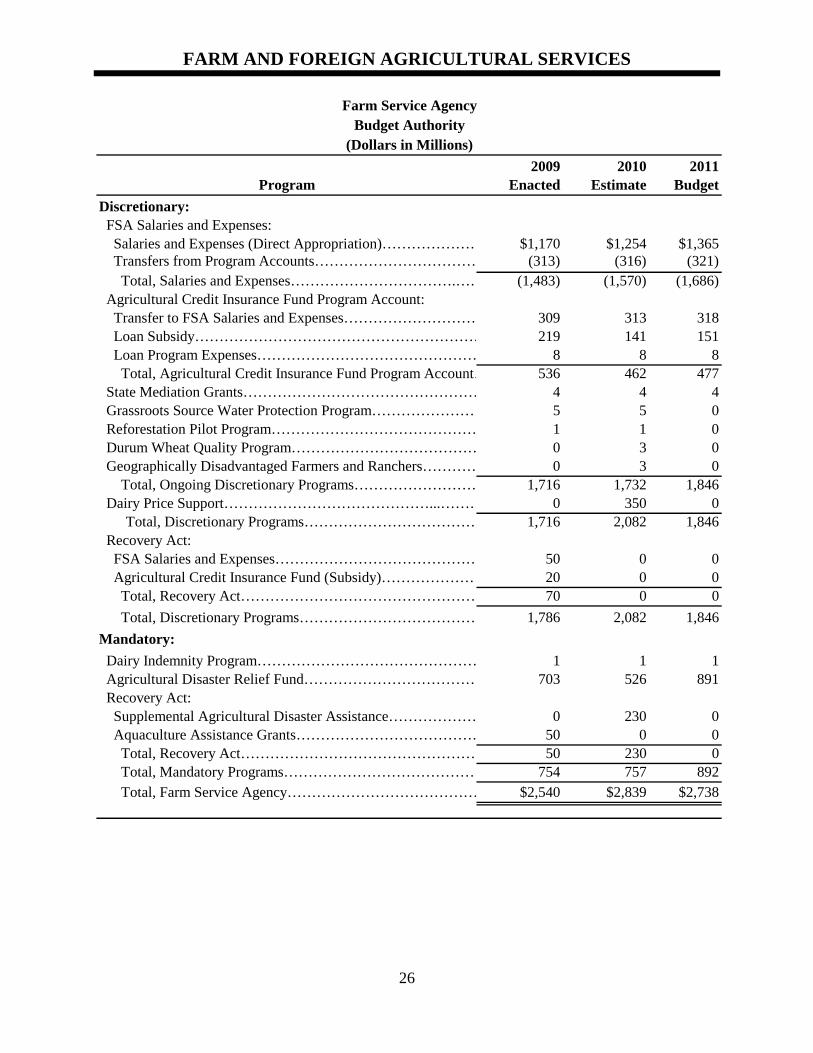
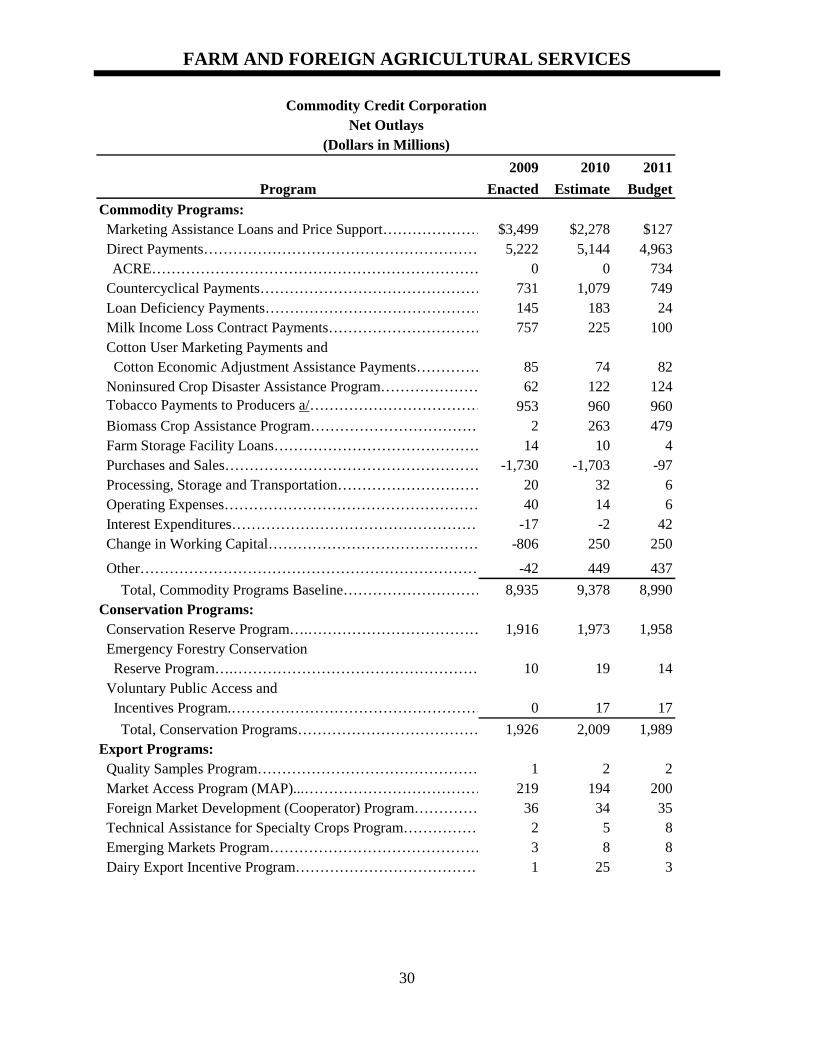
FARM SERVICE AGENCY (FSA)
FSA supports the delivery of farm credit disaster assistance and commodity and related programs and also administers some of the USDA conservation programs FSA provides administrative support for the Commodity Credit Corporation (CCC) which funds most of the commodity export and some of the conservation programs of USDA To deliver its programs FSA operates an extensive network of local Service Centers
Farm Loans Programs Program Level
$ M
illio
ns
3500
3000
2500
2000
1500
1000
500
0
$1952 $2599
$1895
$3245
$1578
$3219
FY 2009 FY 2010 FY 2011
Direct Guaranteed
25
FARM AND FOREIGN AGRICULTURAL SERVICES
Farm Service Agency Budget Authority
(Dollars in Millions) 2009 2010 2011
Program Enacted Estimate Budget Discretionary FSA Salaries and Expenses Salaries and Expenses (Direct Appropriation)helliphelliphelliphelliphelliphelliphellip $1170 $1254 $1365 Transfers from Program Accountshelliphelliphelliphelliphelliphelliphelliphelliphelliphelliphellip (313) (316) (321) Total Salaries and Expenseshelliphelliphelliphelliphelliphelliphelliphelliphelliphelliphelliphelliphellip (1483) (1570) (1686) Agricultural Credit Insurance Fund Program Account Transfer to FSA Salaries and Expenseshelliphelliphelliphelliphelliphelliphelliphelliphellip 309 313 318 Loan Subsidyhelliphelliphelliphelliphelliphelliphelliphelliphelliphelliphelliphelliphelliphelliphelliphelliphelliphelliphelliphellip 219 141 151 Loan Program Expenseshelliphelliphelliphelliphelliphelliphelliphelliphelliphelliphelliphelliphelliphelliphellip 8 8 8 Total Agricultural Credit Insurance Fund Program Accounthellip 536 462 477 State Mediation Grantshelliphelliphelliphelliphelliphelliphelliphelliphelliphelliphelliphelliphelliphelliphelliphellip 4 4 4 Grassroots Source Water Protection Programhelliphelliphelliphelliphelliphelliphellip 5 5 0 Reforestation Pilot Programhelliphelliphelliphelliphelliphelliphelliphelliphelliphelliphelliphelliphelliphellip 1 1 0 Durum Wheat Quality Programhelliphelliphelliphelliphelliphelliphelliphelliphelliphelliphelliphelliphellip 0 3 0 Geographically Disadvantaged Farmers and Ranchershelliphelliphelliphellip 0 3 0 Total Ongoing Discretionary Programshelliphelliphelliphelliphelliphelliphelliphelliphellip 1716 1732 1846 Dairy Price Supporthelliphelliphelliphelliphelliphelliphelliphelliphelliphelliphelliphelliphelliphelliphelliphelliphellip 0 350 0
Total Discretionary Programshelliphelliphelliphelliphelliphelliphelliphelliphelliphelliphelliphellip 1716 2082 1846 Recovery Act FSA Salaries and Expenseshelliphelliphelliphelliphelliphelliphelliphelliphelliphelliphelliphelliphelliphellip 50 0 0 Agricultural Credit Insurance Fund (Subsidy)helliphelliphelliphelliphelliphelliphellip 20 0 0 Total Recovery Acthelliphelliphelliphelliphelliphelliphelliphelliphelliphelliphelliphelliphelliphelliphelliphellip 70 0 0 Total Discretionary Programshelliphelliphelliphelliphelliphelliphelliphelliphelliphelliphelliphellip 1786 2082 1846 Mandatory Dairy Indemnity Programhelliphelliphelliphelliphelliphelliphelliphelliphelliphelliphelliphelliphelliphelliphellip 1 1 1 Agricultural Disaster Relief Fundhelliphelliphelliphelliphelliphelliphelliphelliphelliphelliphelliphellip 703 526 891 Recovery Act Supplemental Agricultural Disaster Assistancehelliphelliphelliphelliphelliphellip 0 230 0 Aquaculture Assistance Grantshelliphelliphelliphelliphelliphelliphelliphelliphelliphelliphelliphelliphellip 50 0 0 Total Recovery Acthelliphelliphelliphelliphelliphelliphelliphelliphelliphelliphelliphelliphelliphelliphelliphellip 50 230 0 Total Mandatory Programshelliphelliphelliphelliphelliphelliphelliphelliphelliphelliphelliphelliphellip 754 757 892 Total Farm Service Agencyhelliphelliphelliphelliphelliphelliphelliphelliphelliphelliphelliphelliphellip $2540 $2839 $2738
26
FARM AND FOREIGN AGRICULTURAL SERVICES
Farm Service Agency Agricultural Credit Insurance Fund
Farm Loan and Grant Programs Program Level (PL) and Budget Authority (BA)
(Dollars in Millions) 2009
Enacted Program PL BA
Farm Operating Loans Guaranteed Unsubsidizedhelliphelliphelliphelliphelliphelliphellip $1160 $29 Guaranteed Subsidizedhelliphelliphelliphelliphelliphelliphelliphelliphellip 150 21 Directhelliphelliphelliphelliphelliphelliphelliphelliphelliphelliphelliphelliphelliphelliphellip 685 81
Total Operating Loanshelliphelliphelliphelliphelliphelliphellip 1995 131 Farm Ownership Loans Guaranteed Unsubsidizedhelliphelliphelliphelliphelliphelliphellip 1239 4 Directhelliphelliphelliphelliphelliphelliphelliphelliphelliphelliphelliphelliphelliphelliphellip 200 13
Total Ownership Loanshelliphelliphelliphelliphelliphelliphellip 1439 17 Indian Land Acquisition Loanshelliphelliphelliphelliphelliphellip 4 a Boll Weevil Eradicationhelliphelliphelliphelliphelliphelliphelliphelliphellip 100 0 Conservation Loans Guaranteedhelliphelliphelliphelliphelliphelliphelliphelliphelliphelliphelliphellip 0 0 Directhelliphelliphelliphelliphelliphelliphelliphelliphelliphelliphelliphelliphelliphelliphellip 0 0 Total Conservation Loanshelliphelliphelliphelliphelliphellip 0 0 Indian Fractionated Land Loanshelliphelliphelliphelliphellip 0 0
Total Ongoing Farm Loan Programshelliphellip 3538 148
Supplemental Appropriations Farm Operating Loans Guaranteed Unsubsidizedhelliphelliphelliphelliphelliphellip 50 1 Directhelliphelliphelliphelliphelliphelliphelliphelliphelliphelliphelliphelliphellip 400 47 Total Operating Loanshelliphelliphelliphelliphelliphellip 450 48 Farm Ownership Loans Directhelliphelliphelliphelliphelliphelliphelliphelliphelliphelliphelliphelliphellip 360 23 Total Ownership Loanshelliphelliphelliphelliphellip 360 23
Recovery Act Direct Farm Operating Loanshelliphelliphelliphelliphellip 173 20 Total Farm Loan Programshelliphelliphelliphelliphelliphellip 4521 239 Emergency Loans bhelliphelliphelliphelliphelliphelliphelliphelliphelliphellip 30 4 Total Farm Loan and Grant Programshellip $4551 $243
2010 Estimate
PL BA
$1500 $35 170 24
1000 47
2670 106
1500 6 650 27
2150 33 4 0
100 0
75 a 75 1
150 1 10 1
5084 141
0 0 0 0 0 0
0 0 0 0
0 0 5084 141
56 2 $5140 $143
2011 Budget
PL BA
$1500 $35144 20900 55
2544 110
1500 6475 33
1975 39 2 0
60 0
75 a75 2
150 2 10 a
4741 151
0 00 00 0
0 00 0
0 04741 151
56 6$4797 $157
a Less than $05 million b From funds carried over from prior years
27
FARM AND FOREIGN AGRICULTURAL SERVICES
Farm Loan and Grant Programs The farm credit programs are an important safety net for Americarsquos farmers by providing a source of credit when they are temporarily unable to obtain credit from commercial sources The value of this safety net was demonstrated in 2009 when in response to the growing global economic and financial crisis FSA received supplemental appropriations and Recovery Act funding to bring the total funding for the farm credit programs in that year to $45 billion In 2010 in order to meet the growing demands in the farm credit programs total funding increased to $51 billion The 2011 budget supports funding for over $47 billion in direct and guaranteed loans The Administration expects that financial and economic conditions will improve and that commercial lending in rural areas will begin returning to prior levels Therefore a modest decline in the demand for direct and guaranteed loans is assumed
A portion of both direct and guaranteed farm operating and ownership loan funds is targeted to socially disadvantaged borrowers based on county level demographic data Although the statutory targets vary by loan program and county on average about 14 percent of loan funds are targeted to socially disadvantaged borrowers These targeted funds serve over 17 percent of the disadvantaged groups noted below Therefore a key performance measure for the farm credit programs is the percentage of beginning farmers racial and ethnic minority farmers and women farmers financed by FSA The target for 2011 will be to further increase the proportion of these borrowers that are served by FSA credit programs
Key Performance Measure 2006 2007 2008 2009 2010 2011 Percentage of beginning farmers racial and ethnic minority farmers and women farmers financed by FSA (Percent) 155 159 162 174 175 180
The 2011 budget proposes loan levels that are generally reflective of the ongoing financial crisis however some modest reductions are proposed in light of the expected recovery of the US and global economies For farm operating loans the 2011 budget provides $900 million for direct loans and over $16 billion for guaranteed loans These loan levels will serve an estimated 22500 farmers about 15000 of whom will receive direct loans and 7500 of whom will receive guarantees The availability of farm operating loans provides farmers with short term credit to finance the costs of continuing or improving their farming operations such as purchasing seed fertilizer livestock feed equipment and other supplies For farm ownership loans the 2011 budget provides $475 million in direct loans and $15 billion for guaranteed loans The 2011 levels will provide about 7100 people with the opportunity to either acquire their own farm or keep an existing one About 2800 borrowers will receive direct loans and 4300 will receive guaranteed loans
The 2011 budget assumes $56 million in loan level will be available for emergency loans due to carryover from prior years The 2011 budget assumes the demand for Indian land acquisition loans will be lower as a result of the new Indian Fractionated Land loans program Program level funding for the boll weevil eradication loan program is reduced to $60 million compared to $100 million in 2010 Eradication efforts have successfully eliminated the boll weevil from many cotton producing areas and as a result it is anticipated that demand for boll weevil eradication loans will decline
28
FARM AND FOREIGN AGRICULTURAL SERVICES
Funding for State mediation grants is maintained at $4 million These grants are made to States to help support certified programs that provide alternative dispute resolution on a wide variety of agricultural issues Mediation benefits family farmers including many low-income and socially disadvantaged farmers who because of mediation are often able to resolve credit and other issues and remain on the farm
Commodity Credit Corporation Budget Authority
(Dollars in Millions) 2009 2010 2011
Program Enacted Estimate Budget Mandatory Commodity Credit Corporation Fundhelliphelliphelliphelliphelliphelliphelliphelliphelliphelliphelliphellip $12111 $10859 $10522 Tobacco Trust Fundhelliphelliphelliphelliphelliphelliphelliphelliphelliphelliphelliphelliphelliphelliphelliphelliphelliphelliphellip 950 960 960
Total Mandatory Programshelliphelliphelliphelliphelliphelliphelliphelliphelliphelliphelliphelliphelliphelliphellip 13061 11819 11482 Total Commodity Credit Corporationhelliphelliphelliphelliphelliphelliphelliphelliphelliphelliphellip $13061 $11819 $11482
Commodity Credit Corporation The Commodity Credit Corporation (CCC) provides funding for commodity programs administered by FSA and many Farm Bill programs such as the conservation programs administered by FSA and the Natural Resources Conservation Service (NRCS) and export programs administered by FAS CCC borrows funds needed to finance these programs from the US Treasury and repays the borrowings with interest from receipts and from appropriations provided by Congress The commodity programs are critical components of the farm safety net serving to expand domestic market opportunities and provide risk management and financial tools to farmers and ranchers The CCC also handles the Tobacco Trust Fund which provides transition payments to former producers and owners of quotas under the former tobacco price support and quota program
29
FARM AND FOREIGN AGRICULTURAL SERVICES
Commodity Credit Corporation Net Outlays
(Dollars in Millions) 2009 2010 2011
Program Enacted Estimate Budget Commodity Programs Marketing Assistance Loans and Price Supporthelliphelliphelliphelliphelliphelliphellip $3499 $2278 $127 Direct Paymentshelliphelliphelliphelliphelliphelliphelliphelliphelliphelliphelliphelliphelliphelliphelliphelliphelliphelliphellip 5222 5144 4963
ACREhelliphelliphelliphelliphelliphelliphelliphelliphelliphelliphelliphelliphelliphelliphelliphelliphelliphelliphelliphelliphelliphelliphellip 0 0 734 Countercyclical Paymentshelliphelliphelliphelliphelliphelliphelliphelliphelliphelliphelliphelliphelliphelliphellip 731 1079 749 Loan Deficiency Paymentshelliphelliphelliphelliphelliphelliphelliphelliphelliphelliphelliphelliphelliphelliphellip 145 183 24 Milk Income Loss Contract Paymentshelliphelliphelliphelliphelliphelliphelliphelliphelliphelliphellip 757 225 100 Cotton User Marketing Payments and Cotton Economic Adjustment Assistance Paymentshelliphelliphelliphelliphellip 85 74 82 Noninsured Crop Disaster Assistance Programhelliphelliphelliphelliphelliphelliphellip 62 122 124 Tobacco Payments to Producers ahelliphelliphelliphelliphelliphelliphelliphelliphelliphelliphelliphellip 953 960 960 Biomass Crop Assistance Programhelliphelliphelliphelliphelliphelliphelliphelliphelliphelliphelliphellip 2 263 479 Farm Storage Facility Loanshelliphelliphelliphelliphelliphelliphelliphelliphelliphelliphelliphelliphelliphellip 14 10 4 Purchases and Saleshelliphelliphelliphelliphelliphelliphelliphelliphelliphelliphelliphelliphelliphelliphelliphelliphelliphellip -1730 -1703 -97 Processing Storage and Transportationhelliphelliphelliphelliphelliphelliphelliphelliphelliphellip 20 32 6 Operating Expenseshelliphelliphelliphelliphelliphelliphelliphelliphelliphelliphelliphelliphelliphelliphelliphelliphelliphellip 40 14 6 Interest Expenditureshelliphelliphelliphelliphelliphelliphelliphelliphelliphelliphelliphelliphelliphelliphelliphelliphellip -17 -2 42 Change in Working Capitalhelliphelliphelliphelliphelliphelliphelliphelliphelliphelliphelliphelliphelliphelliphellip -806 250 250
Otherhelliphelliphelliphelliphelliphelliphelliphelliphelliphelliphelliphelliphelliphelliphelliphelliphelliphelliphelliphelliphelliphelliphellip -42 449 437 Total Commodity Programs Baselinehelliphelliphelliphelliphelliphelliphelliphelliphelliphellip 8935 9378 8990 Conservation Programs Conservation Reserve Programhelliphelliphelliphelliphelliphelliphelliphelliphelliphelliphelliphelliphellip 1916 1973 1958 Emergency Forestry Conservation Reserve Programhelliphelliphelliphelliphelliphelliphelliphelliphelliphelliphelliphelliphelliphelliphelliphelliphelliphellip 10 19 14 Voluntary Public Access and Incentives Programhelliphelliphelliphelliphelliphelliphelliphelliphelliphelliphelliphelliphelliphelliphelliphelliphellip 0 17 17 Total Conservation Programshelliphelliphelliphelliphelliphelliphelliphelliphelliphelliphelliphelliphellip 1926 2009 1989 Export Programs Quality Samples Programhelliphelliphelliphelliphelliphelliphelliphelliphelliphelliphelliphelliphelliphelliphellip 1 2 2 Market Access Program (MAP)helliphelliphelliphelliphelliphelliphelliphelliphelliphelliphelliphellip 219 194 200 Foreign Market Development (Cooperator) Programhelliphelliphelliphelliphellip 36 34 35 Technical Assistance for Specialty Crops Programhelliphelliphelliphelliphellip 2 5 8 Emerging Markets Programhelliphelliphelliphelliphelliphelliphelliphelliphelliphelliphelliphelliphelliphelliphellip 3 8 8 Dairy Export Incentive Programhelliphelliphelliphelliphelliphelliphelliphelliphelliphelliphelliphelliphellip 1 25 3
30
FARM AND FOREIGN AGRICULTURAL SERVICES
Commodity Credit Corporation Net Outlays
(Dollars in Millions) 2009 2010 2011
Program Enacted Estimate Budget Food for Progress Programhelliphelliphelliphelliphelliphelliphelliphelliphelliphelliphelliphelliphelliphelliphellip 226 148 148 Local and Regional Commodity Procurement Pilot Programhelliphellip 0 15 25 Export Credithelliphelliphelliphelliphelliphelliphelliphelliphelliphelliphelliphelliphelliphelliphelliphelliphelliphelliphelliphellip 80 83 23
Otherhelliphelliphelliphelliphelliphelliphelliphelliphelliphelliphelliphelliphelliphelliphelliphelliphelliphelliphelliphelliphelliphellip 17 30 23 Total Export Programshelliphelliphelliphelliphelliphelliphelliphelliphelliphelliphelliphelliphelliphelliphellip 585 544 475 Subtotal CCChelliphelliphelliphelliphelliphelliphelliphelliphelliphelliphelliphelliphelliphelliphelliphelliphelliphelliphellip 11446 11931 11454 Pre-credit Reform Loan Repaymentshelliphelliphelliphelliphelliphelliphelliphelliphelliphelliphellip -4 -4 -8 CCC Baselinehelliphelliphelliphelliphelliphelliphelliphelliphelliphelliphelliphelliphelliphelliphelliphelliphelliphelliphelliphelliphellip 11442 11927 11446 Proposed Legislation
Reduce MAP by 20helliphelliphelliphelliphelliphelliphelliphelliphelliphelliphelliphelliphelliphelliphelliphellip 0 0 -8 Farm Programs Savingshelliphelliphelliphelliphelliphelliphelliphelliphelliphelliphelliphelliphelliphelliphelliphellip 0 0 -3
Total CCChelliphelliphelliphelliphelliphelliphelliphelliphelliphelliphelliphelliphelliphelliphelliphelliphelliphelliphelliphellip $11442 $11927 $11435
a CCC payments are offset by receipts from the Tobacco Trust Fund
Changes over the last decade in commodity disaster and conservation programs due to policy weather and market conditions have dramatically changed the level mix and variability of CCC outlays CCC net outlays have declined from a record high of $323 billion in 2000 to to $114 billion in 2008 reflecting higher prices for most commodities resulting from increased demand for bioenergy production and strong export demand Outlays in 2009 which included the impact of 2008 Farm Bill provisions were $114 billion They reflected reduced disaster payments offset by greater outlays for dairy support programs and for the cotton program both of which are affected by lower market prices and initiatives to enhance dairy price supports Estimated outlays for 2010 rose to $119 billion partly as a result of the newly implemented Biomass Crop Assistance Program (BCAP) The 2011 estimate declines to $114 billion as higher prices are expected to reduce cotton program outlays from marketing assistance loans The 2008 Farm Bill also ended the use of commodity certificate transactions for marketing assistance loan repayments The impact is reflected in the reduction in CCC sales and purchases in 2011 as producers could no longer purchase certificates for use in loan repayments
Commodity Programs Commodity loan and income support programs constitute the majority of CCC outlays These programs provide a major portion of the farm safety net including protection against adverse market fluctuations hence outlays for many of these programs vary significantly from year to year as market conditions change The commodity programs are mandated by provisions of the 2008 Farm Bill The programs include direct payments to producers of feed grains wheat upland cotton rice soybeans other oilseeds and peanuts The direct payments based on historical program acreage and yields are set by law and do not vary with market prices or current plantings The 2008 Farm Bill also provided counter-cyclical payments for producers of the above crops when market prices decline below specified target prices In addition the 2008 Farm Bill authorized revenue-based counter-cyclical payments (ACRE) as an alternative to the traditional price-based counter-cyclical payments Sign-up for
31
FARM AND FOREIGN AGRICULTURAL SERVICES
the new ACRE program began April 27 2009 and continued to August 14 2009 to give producers ample time to decide whether to participate in ACRE or remain in the traditional direct and counter-cyclical payment program About 17 million farms are enrolled in the direct and counter-cyclical payment programs The 2011 budget proposes modest reductions in the current cap on direct payments and a three year phased reduction in farm program average Adjusted Gross Income (AGI) eligibility limits for large farmers and wealthy landowners These adjustments in current program limits would affect only a very small portion of the farm program participants without disturbing the foundation of the current safety net for productive family farmers In addition the budget proposes elimination of commodity storage payments in the marketing assistance loan program for cotton and peanuts The Department is prepared to work with Congress and stakeholders as these proposals are being considered
The CCC marketing assistance loan (MAL) program is available to producers of commodities eligible for direct and counter-cyclical payments as well as for wool mohair honey and pulses CCC marketing assistance loans provide interim financing to eligible producers allowing them to delay selling their crop at harvest when prices are typically at their lowest When market prices decline these loans may be repaid at rates below the loan rate thus providing benefits which help offset the effect of lower market returns
32
FARM AND FOREIGN AGRICULTURAL SERVICES
Commodity Credit Corporation Commodity Program Net Outlays
(Dollars in Millions) 2009 2010 2011
Program Enacted Estimate Budget Commodity Feed Grainshelliphelliphelliphelliphelliphelliphelliphelliphelliphelliphelliphelliphelliphelliphelliphelliphelliphelliphelliphellip $2458 $2451 $2645 Wheathelliphelliphelliphelliphelliphelliphelliphelliphelliphelliphelliphelliphelliphelliphelliphelliphelliphelliphelliphelliphelliphellip 1224 1299 1425 Ricehelliphelliphelliphelliphelliphelliphelliphelliphelliphelliphelliphelliphelliphelliphelliphelliphelliphelliphelliphelliphelliphelliphellip 411 558 429 Upland and Extra Long Staple Cottonhelliphelliphelliphelliphelliphelliphelliphelliphellip 2213 2387 1552 Tobacco ahelliphelliphelliphelliphelliphelliphelliphelliphelliphelliphelliphelliphelliphelliphelliphelliphelliphelliphelliphellip -172 0 0 Dairyhelliphelliphelliphelliphelliphelliphelliphelliphelliphelliphelliphelliphelliphelliphelliphelliphelliphelliphelliphelliphelliphellip 994 343 362 Soybeans and Productshelliphelliphelliphelliphelliphelliphelliphelliphelliphelliphelliphelliphelliphelliphellip 611 585 624 Minor Oilseedshelliphelliphelliphelliphelliphelliphelliphelliphelliphelliphelliphelliphelliphelliphelliphelliphelliphellip 23 22 25 Peanutshelliphelliphelliphelliphelliphelliphelliphelliphelliphelliphelliphelliphelliphelliphelliphelliphelliphelliphelliphelliphellip 98 90 132 Sugarhelliphelliphelliphelliphelliphelliphelliphelliphelliphelliphelliphelliphelliphelliphelliphelliphelliphelliphelliphelliphelliphellip b 0 0 Honeyhelliphelliphelliphelliphelliphelliphelliphelliphelliphelliphelliphelliphelliphelliphelliphelliphelliphelliphelliphelliphelliphellip -1 b b Wool and Mohairhelliphelliphelliphelliphelliphelliphelliphelliphelliphelliphelliphelliphelliphelliphelliphelliphellip 9 7 7 Vegetable Oil Productshelliphelliphelliphelliphelliphelliphelliphelliphelliphelliphelliphelliphelliphelliphellip 28 49 30 Other Commoditieshelliphelliphelliphelliphelliphelliphelliphelliphelliphelliphelliphelliphelliphelliphelliphelliphellip 57 -8 5
Subtotal Assistance To Farmershelliphelliphelliphelliphelliphelliphelliphelliphelliphellip 7953 7783 7236 Other chelliphelliphelliphelliphelliphelliphelliphelliphelliphelliphelliphelliphelliphelliphelliphelliphelliphelliphelliphelliphellip 982 1596 1754 Commodity Programs Baselinehelliphelliphelliphelliphelliphelliphelliphelliphelliphelliphelliphellip 8936 9379 8990 Proposed Legislation - Farm Programs Savingshelliphelliphelliphelliphelliphellip 0 0 -3 Total Commodity Programshelliphelliphelliphelliphelliphelliphelliphelliphelliphelliphelliphellip $8936 $9379 $8987
a Reflects impact of offsetting receipts from Tobacco Trust Fund b Less than $05 million c Includes working capital interest operating expenses reimbursable agreements and an adjustment for Food for Progress commodity purchases
33
FARM AND FOREIGN AGRICULTURAL SERVICES
Commodity Credit Corporation Conservation Programs
Budget Authority (Dollars in Millions)
2009 2010 2011 Program Enacted Estimate Budget
Conservation Reserve Programhelliphelliphelliphelliphelliphelliphelliphelliphelliphelliphelliphellip $1934 $1973 $1958 Emergency Forestry Conservation Reserve Programhelliphelliphellip 10 19 14 Voluntary Public Access and Habitat Incentives Programhellip 0 17 17
Total Conservation Programshelliphelliphelliphelliphelliphelliphelliphelliphelliphelliphellip $1944 $2009 $1989
Conservation Programs The Farm Bill also provides authority for conservation programs The focus of USDA conservation programs administered by NRCS and FSA is to assist producers in using environmentally sound management systems for agricultural production to meet food and fiber needs of the Nation FSA administers the Conservation Reserve Program (CRP) and the Emergency Forestry Conservation Reserve Program (EFCRP) which are CCC programs in addition to the Emergency Conservation Program (ECP) All other USDA cost-share and easement conservation programs such as the Environment al Quality Incentives Program Wetlands Reserve Program and the Conservation Stewardship Program are administered by NRCS These programs are described beginning on page 85
The purpose of CRP is to assist farm owners and operators in conserving and improving soil water air and wildlife resources b y retirin g environmentally se sitive landn from a gricultural production and keeping it under long-term resource-conserving cover CRP participants enroll acreage for periods of 10 to 15 years in return for annual rental payments along with cost-share and technical assistance for installing approved conservation practices
Among multiple environmental benefits a key performance measure for the CRP program is the number of restored wetland acres Restored wetland acreage serves as a filter barrier reducing sediments and agricultural run-off from reaching drinking water supplies
Key Performance Measure 2006 2007 2008 20091 20102 20112
CRP restored wetland acreage (million acres) 203 208 198 204 199 199
1 The 2009 increase in CRP Wetland acres enrollment was due to increased incentives for certain wetland practices and surge in general signup acres reenrolled into wetland practices 2 Recent commodity price increases especially soybeans will likely reduce landowner willingness to retire cropland into CRP In addition the enrollment authority for CRP decreased to 32 million acres starting in FY 2010
Acreage that counts toward CRPrsquos total enrollment cap includes acres enrolled through scheduled general signups and those enrolled through a continuous non-competitive signup that has been underway since September 1996 with the purpose of enrolling land in filter strips riparian buffers and other high priority conservation and environmental enhancement practices Continuous signup acreage also includes enrollment under the Conservation Reserve
34
FARM AND FOREIGN AGRICULTURAL SERVICES
Enhancement Program (CREP) that is designed to target program benefits to address specific local and regional conservation problems At this time 32 States have approved CREP agreements
CRP enrollment totaled 338 million acres at the end of 2009 with over 85 percent of the acreage having been enrolled under scheduled general signups A general signup of 10 million acres was held in 2006 however no general signup has been held since then The budget projects that total enrolled acreage may decrease to 314 million acres by the end of FY 2010 The budget assumes a potential general signup in 2010 could add up to 29 million general signup acres allowing a cumulative enrollment of 302 million CRP acres by the end of 2011 CRP is limited to a maximum of 32 million acres by the 2008 Farm Bill
Under ECP the Department shares the cost of carrying out practices to assist and encourage farmers to rehabilitate farmland damaged by natural disasters In particular it addresses those problems which represent damage that is unusual and would not recur frequently in the same area and if left untreated would (1) impair or endanger the land (2) materially affect the productive capacity of the land (3) be so costly to rehabilitate that Federal assistance would be required to return the land to productive agricultural use For the past several years this program has been funded through emergency supplemental appropriations The budget is proposing no new funding for the ECP in 2011 since funding needs are difficult to predict in advance
Biomass Crop Assistance Program (BCAP) In 2009 the first phase of the BCAP as mandated by the 2008 Farm Bill was implemented This provision provides matching payments for the collection harvest storage and transportation of biomass material to approved energy conversion facilities Beginning in 2010 the program will provide financial assistance for the establishment and maintenance of crops for bioenergy production once regulations are completed The program will then continue into 2011 and beyond
Supplemental Agricultural Disaster Assistance
Outlays
(Dollars in Millions) 2009 2010 2011
Program Enacted Estimate Budget Supplemental Revenue Assistance Payments 0 $945 $865 Livestock Indemnity Paymentshelliphelliphelliphelliphelliphelliphelliphelliphelliphelliphelliphelliphelliphelliphelliphelliphelliphelliphellip $3 69 69 Livestock Forage Disaster Program 0 409 409 Emergency Assistance for Livestock Honey Bees and Farm-Raised Fishhelliphellip 0 100 50 Tree Assistance Program helliphelliphelliphelliphelliphelliphelliphelliphelliphelliphelliphelliphelliphelliphelliphelliphelliphelliphelliphelliphellip 0 5 5
Subtotal Supplemental Agricultural Disaster Assistance helliphelliphelliphelliphelliphellip 3 1528 1398 Recovery Act SURE Paymentshelliphelliphelliphelliphelliphelliphelliphelliphelliphelliphelliphelliphelliphelliphelliphelliphellip 0 207 23
Total Supplemental Agricultural Disaster Assistance helliphelliphelliphelliphelliphelliphelliphellip $3 $1735 $1421
35
FARM AND FOREIGN AGRICULTURAL SERVICES
Supplemental Agricultural Disaster Assistance The 2008 Farm Bill authorized five new disaster assistance programs FSA administers the five new disaster programs however unlike prior ad hoc disaster programs the new disaster assistance programs are funded through the Agricultural Disaster Relief Trust Fund (Trust Fund) rather than through CCC The Trust Fund receives funding equivalent to 308 percent of the amounts received under the Harmonized Tariff Schedule of the United States Actual assistance levels will depend on the extent of producersrsquo qualifying needs
The Supplemental Revenue Assistance Payments Program (SURE) provides assistance to eligible crop producers on farms in primary and contiguous disaster counties designated by the Secretary of Agriculture or in other counties in which weather-related losses exceeded 50 percent of the normal production for that year The Livestock Indemnity Program (LIP) provides assistance to eligible livestock producers on farms that have incurred livestock death losses in excess of normal mortality rates due to adverse weather during the calendar year The Livestock Forage Program (LFP) provides assistance to eligible livestock producers for grazing losses for covered livestock due to drought conditions or fire The Emergency Livestock Assistance Program (ELAP) provides assistance to eligible producers of livestock (inc luding horses) honey bees and farm-raised fish for losses not covered under the other disaster programs The Tree Assistance Program (TAP) provides assistance to eligible orchardists and nursery tree growers that planted trees for commercial sale (including Christmas trees) for losses resulting from a natural disaster The Recovery Act provided an estimated $230 million of additional disaster assistance through the above programs for producers who suffered losses in crop year 2008 but had not yet paid the crop insurance related fees necessary to become eligible
Dairy and Other Appropriated Assistance The 2010 Appropriations Act included $350 million for additional assistance for dairy producers A total of $290 million was provided for payments to dairy producers and $60 million for purchases of dairy products for distribution to the needy Other additional assistance in 2010 provided by the Appropriations Act includes support for a durum wheat quality program and support for geographically disadvantaged producers No funds are requested for these activities in the 2011 Budget
In addition the Recovery Act provided $50 million for Aquaculture Grants which are intended to compensate aquaculture growers for high feed costs during the 2008 fiscal year The grants were administered as block grants to the States which in turn provide the assistance to eligible growers Under the provisions of the Recovery Act producers who receive assistance under the Aquaculture Grants program will be unable to receive assistance under ELAP for the same losses
36
FARM AND FOREIGN AGRICULTURAL SERVICES
Farm Service Agency Staff Years
2009 2010 2011 Program Enacted Estimate Budget
helliphelliphelliphelliphelliphelliphelliphelliphelliphelliphelliphelliphelliphelliphelliphelliphelliphelliphelliphelliphelliphellipFederal 5042 5094 5104 Non-Federal Permanent Full-Timehelliphelliphelliphelliphelliphelliphelliphelliphelliphelliphelliphelliphelliphelliphelliphellip 8673 8775 8775 Temporaryhelliphelliphelliphelliphelliphelliphelliphelliphelliphelliphelliphelliphelliphelliphelliphelliphelliphelliphelliphellip 745 650 650
Total Non-Federalhelliphelliphelliphelliphelliphelliphelliphelliphelliphelliphelliphelliphelliphelliphelliphellip 9418 9425 9425 Total FSA Staff Yearshelliphelliphelliphelliphelliphelliphelliphelliphelliphelliphelliphelliphelliphellip 14460 14519 14529
Salaries and Expenses The 2011 budget proposes a level of $1686 billion to support 5104 Federal staff years and 9425 non-Federal staff years Total estimated staff years will be increased by 10 over the 2010 level to provide for increased IT modernization project management The budget includes funding to support ongoing operational needs based on current programs and the current delivery system
Information Technology (IT) Modernization and Stabilization The Farm Service Agency relies on one of the oldest information technology systems (hardware and software) within the Department of Agriculture Billions of dollars of annual farm program payments conservation payments and loans to producers mandated b y the 2008 Farm Bill and other legislation are dependent upon the continued viability of this antiquated IT system FSA must upgrade the aging technology infrastructure and equipment which is creating inefficiencies and threatening the delivery of fundamental services to producers
At the present time producers looking to sign up for programs are often confronted by lines long delays and inefficiencies County office personnel are often required to use two computers on different operating systems to sign a producer up for a single program These two computers one relying on the outdated legacy system and one relying on a modern web-based system are unable to communicate with each other forcing the county office personnel to enter data into multiple systems or manually transfer data maintained in one system to the other This causes sign-up delays and significantly increases the likelihood of data entry errors that can lead to improper payments
Further the outmoded IT systems of the Farm Service Agency are highly vulnerable to security breaches because inadequate data storage capacity requires sensitive producer data and financial information to be uploaded into mainframe computers from physical media sent from county offices across the country rather than electronically An independent review conducted pursuant to Section 1618 of the 2008 Farm Bill also concluded that ldquoModernization will bring significant benefits such as improvements in cost efficiency producer access fraud mitigation staff efficiency and morale More fundamentally Modernization will replace the aging platforms that are difficult to maintain and incapable of supporting the fiduciary requirements that FSA faces today and will continue to face in the futurerdquo
37
FARM AND FOREIGN AGRICULTURAL SERVICES
The 2011 Budget proposes an increase of $953 million to fund critical IT replacement and modernization projects to support core FSA operations Of this amount $393 million is proposed for continued implementation of the MIDAS initiative (Modernize and Innovate the Delivery of Agricultural Systems) which is a comprehensive project to streamline the existing complicated business processes that support mandated farm programs and provide a modern IT infrastructure to operate the programs The 2011 proposal builds on funding included in the FY 2010 appropriation to continue this multi-year effort Development of MIDAS is an extensive effort which will result in a secure modern IT system capable of supporting web-based program delivery The system will also provide linkages with the Departmentrsquos new financial management system The proposed 2011 funding includes $1 million for increased staffing to ensure appropriate contract oversight and management of this complex project
A second component of the IT proposal is a $20 million increase needed for conversion of FSA software to shift program applications from the current obsolete system to the new IT system Existing program software that is essential to delivery of FSA rsquos core programs is written for the outmoded mainframe IT system and needs to be converted for use with modern web-based systems Funds will support this conversion of program delivery applications for use with the new system
Further the budget proposes a $36 million increase in FSA to support the Departmentrsquos efforts to modernize and upgrade the Common Computing Environment (CCE) for the Service Center Agencies (SCAs) This funding will be used to replace outdated components of the IT infrastructure many of which have exceeded their expected life cycles in order to reduce system vulnerabilities to failure and improve the performance and effectiveness of the shared infrastructure These improvements will allow the SCAs to better serve program participants with a more flexible and reliable IT infrastructure This funding will allow for the first system-wide refresh of the CCE since the infrastructure was implemented in 2000 In addition as the components of the CCE are replaced USDA will implement a right-sizing process whereby configuration changes will be made to better support the delivery of current and future programs As part of this process the Department will strive to improve system security reduce the long term cost of infrastructure services and improve service reliability
A key performance measure for Modernization efforts is the percentage of program benefits delivered directly by the county office using web-enabled technologies and not utilizing outmoded legacy systems This will enable more timely more accurate and reliable delivery of benefits to producers as the newer technologies are phased in
Key Performance Measure 2006 2007 2008 2009 2010 2011 Maintain or increase percentage of program benefits delivered through a Web environment (percent) 33 33 33 33 50 70
38
FARM AND FOREIGN AGRICULTURAL SERVICES
RISK MANAGEMENT AGENCY (RMA)
Program Level (Dollars in Millions)
2009 2010 2011 Program Enacted Estimate Budget
SUMMARY OF GOVERNMENT COSTS Discretionary Administrative and Operating Expenseshelliphelliphelliphelliphelliphelliphelliphelliphellip $77 $80 $83 Mandatory Delivery and Other Administrative Expenses ahelliphelliphelliphelliphellip 1654 1642 1770 Gross Indemnities bhelliphelliphelliphelliphelliphelliphelliphelliphelliphelliphelliphelliphelliphelliphelliphellip 8416 7669 8249 Underwriting Gains c helliphelliphelliphelliphelliphelliphelliphelliphelliphelliphelliphelliphelliphelliphellip 1963 1168 1202 Farm Bill Agricultural Management Assistancehelliphelliphelliphelliphellip (6) (6) (6)
Subtotal Crop Insurance Program Levelhelliphelliphelliphelliphelliphelliphellip 12033 10479 11221 Less Producer Premium and Administration Feeshelliphellip -4211 -3577 -3606
Total Government Costshelliphelliphelliphelliphelliphelliphelliphelliphelliphelliphelliphelliphellip $7899 $6982 $7698
a Includes reimbursements to private companies and certain costs for research development and other activities b The amount of premium subsidy paid by the Federal government is not reflected in the table above The budget for the Federal Crop Insurance Program assumes a crop year loss ratio (gross indemnititestotal premium) of 10 However the fiscal year loss ratio could be higher or lower than 10 due to differences in the timeing of cash flows and participation rates from year to year Nevertheless the amount of premium subsidy may be approximated in the table above by subtracting producer premium and administrative fees from gross indemnities c Payments to private insurance companies
Discretionary funds for the Federal Crop Insurance Program cover Federal salaries and related expenses to manage the program The 2011 budget includes about $83 million for these costs compared to about $80 million for 2010 The increase includes $07 million for pay costs to maintain current staffing levels and $20 million for increasing costs necessary to maintain the existing IT infrastructure
The Federal Crop Insurance Program provides an important safety net that protects producers from a wide range of risks caused by natural disasters as well as the risk of price fluctuations In recent years an increasing proportion of risk protection has been provided by revenue insurance which protects against both a loss of yield and price declines The Federal Crop Insurance Program is a critical component of the farm safety net
A key performance measure for the Federal Crop Insurance Program is the total value of crops protected or total liabilities The following table presents both actual liabilities and normalized liabilities which account for the effects of changes in commodity prices Commodity prices are a key external factor which can significantly affect performance measurements for the crop insurance program
39
Key Performance Measures 2006 2007 2008 2009 2010 2011 Value of FCIC risk protection coverage provided through FCIC sponsored insurance ($Billions) $499 $673 $899 $904 $814 $839 Normalized value of FCIC risk protection coverage provided through FCIC sponsored insurance ($Billions) $481 $507 $515 $514 $519 $524
FARM AND FOREIGN AGRICULTURAL SERVICES
For the 2010 crop year the Federal Crop Insurance Program is expected to provide about $814 billion in risk protection on about 286 million acres This represents about 80 percent of the Nationrsquos acres planted to principal crops In 2009 about 70 percent of the liabilities were covered under revenue products which provide protection against both a loss of yield and a decline in commodity prices
Participation in the Federal Crop Insurance Program by producers is voluntary however participation is encouraged through premium subsidies In addition participation in the Federal Crop Insurance Program is required in order to participate in the supplemental agricultural disaster assistance programs authorized in the 2008 Farm Bill Crop insurance is delivered to producers through private insurance companies that share in the risk of loss and opportunity for gain The companies are reimbursed for their delivery expenses and receive underwriting gains in years of favorable loss experience The costs associated with the Federal Crop Insurance Program include premium subsidies indemnity payments (in excess of premiums) underwriting gains paid to private companies reimbursements to private companies for delivery expenses and other authorized expenditures
The Standard Reinsurance Agreement (SRA) is the contract between USDA and the private insurance companies which contains many of the financial terms and conditions for participation in the Federal Crop Insurance Program The 2008 Farm Bill authorized USDA to renegotiate the SRA for the 2011 crop year and every 5 years thereafter In December 2009 USDA announced that it was cancelling the current SRA and would renegotiate the agreement with the companies for the 2011 crop year USDA expects to complete the negotiation process by July 1 2010 the start of the 2011 crop year Through the renegotiation process USDA intends to align administrative and operating subsidies paid to insurance companies closer to actual delivery costs provide a reasonable rate of return to the insurance companies equalize reinsurance performance across States to more effectively reach under-served producers commodities and areas and improve program integrity
In preparation for these negotiations RMA contracted with an internationally known company Milliman Inc to review historical rates of return and determine what a reasonable rate of return is for the crop insurance industry RMA data shows that annual insurance industry payments have doubled from $18 billion in 2006 to an estimated $38 billion in 2009 based on the terms of the existing SRA Meanwhile the number of total policies dropped slightly from 13 million in 2000 to 11 million in 2008 The changes being proposed will help protect farmers from higher costs improve access to crop insurance and provide greater protection from crop losses The new agreement will also provide insurance companies with greater flexibility for their operations
40
FARM AND FOREIGN AGRICULTURAL SERVICES
and financial incentives to increase service to underserved producers and areas while ensuring that taxpayers are well-served by the program USDA expects to have in place a stronger Federal Crop Insurance Program that helps producers better manage their risk and that serves farmers in every region of the country and to complete the negotiation process by July 1 2010 the start of the 2011 crop year
The performance for the Federal Crop Insurance Program is tracked on a crop year basis which spans multiple fiscal years As a result the table on page 39 reflects certain assumptions about the fiscal year in which the crop year costs andor revenues will fall Furthermore the amount of liabilities covered by the Federal Crop Insurance Program is strongly influenced by changing commodity prices
Actual indemnities for fiscal year 2009 reflect crop year 2008 losses which were paid out in fiscal year 2009 plus crop year 2009 losses which were paid out in fiscal year 2009 The relatively low actual indemnities for fiscal year 2009 reflect the low loss ratios experienced in the 2008 and 2009 The actual loss ratio for crop year 2008 was a low 088 Losses for crop year 2009 are not yet finalized however the statutory target used for budgetary purposes is 10
Estimated indemnities for fiscal year 2010 reflect about 65 percent of the estimated losses for crop year 2009 plus 35 percent of the estimated losses for crop year 2010 Losses for crop years 2010 and 2011 reflect an estimated loss ratio of 10 Estimated indemnities for fiscal year 2011 are calculated in the same manner as 2010
There is a one year lag between crop year underwriting gains and the fiscal year in which they are paid out Consequently the underwriting gains for fiscal year 2009 reflect the low loss ratio experienced for crop year 2008 The underwriting gain totals for fiscal years 2010 and 2011 reflects the assumption that the loss ratio in crop years 2009 and 2010 will be 10
In fiscal year 2009 the actual total Government cost for the Federal Crop Insurance Program was about $79 billion Of this amount about $42 billion was for net indemnities to producers (gross indemnities minus producer paid premiums) The remaining amount of about $36 billion was for payments to the private insurance companies to deliver the program
41
FARM AND FOREIGN AGRICULTURAL SERVICES
FOREIGN AGRICULTURAL SERVICE (FAS)
FAS administers a variety of programs that are designed to facilitate access to international markets and thereby help to support a competitive US agricultural system FAS also carries out activities that promote productive agricultural systems in developing countries and contribute to increased trade and enhanced global food security Working bilaterally and with international organizations FAS encourages the development of transparent and science-based regulatory systems that allow for the safe development and use of agricultural goods derived from new technologies
National Export Initiative
120
100 $97
FAS Export Promotion Activities
80
FMDP - Foreign Market Development Program -- Discretionary Funding 2011
TASC - Technical Assistance for 60 Specialty Crops Program -- Discretionary
Funding 2011
FMDP - Foreign Market Development Program -- Mandatory CCC Funding $41 $42
40 TASC - Technical Assistance for Specialty Crops Program -- Mandatory CCC Funding
20
0 7 8 9
34 34 34
9
35
10
2009 2010 2011
Fiscal Year
$ M
illio
ns
42
FARM AND FOREIGN AGRICULTURAL SERVICES
Foreign Agricultural Service Budget Authority
(Dollars in Millions) 2009 2010 2011
Program Enacted Estimate Budget Discretionary FAS Salaries and Expenses Salaries and Expenses (Direct Appropriation)helliphelliphelliphelliphelliphelliphelliphellip $165 $180 $201 Agricultural Reconstruction and Stabilization helliphelliphelliphelliphelliphelliphellip 0 0 15 Foreign Market Development (Cooperator) Programhelliphelliphelliphellip 0 0 35 Technical Assistance for Specialty Crops Programhelliphelliphelliphelliphellip 0 0 9 Transfer from CCC Export Credit Program Accounthelliphelliphelliphelliphellip (5) (6) (7) Total FAS Salaries and Expenseshelliphelliphelliphelliphelliphelliphelliphelliphelliphelliphelliphellip (170) (187) (265) Foreign Food Assistance McGovern-Dole International Food for Education Programhelliphellip 100 210 210
PL 480 Title II Donationshelliphelliphelliphelliphelliphelliphelliphelliphelliphelliphelliphelliphelliphelliphellip 1226 1690 1690 PL 480 Title II Supplemental Fundinghelliphelliphelliphelliphelliphelliphelliphelliphellip 1095 0 0
Total PL 480 Title II Donationshelliphelliphelliphelliphelliphelliphelliphelliphelliphelliphellip 2321 1690 1690 PL 480 Title I Program Account
Transfer to Farm Service Agency Salaries and Expenseshelliphelliphellip 3 3 3 Commodity Credit Corporation Export Credit Program Account Transfer to FSA and FAS Salaries and Expenseshelliphelliphelliphelliphelliphellip (5) (7) (7) Total Discretionary Programshelliphelliphelliphelliphelliphelliphelliphelliphelliphelliphelliphelliphellip 2589 2083 2161 Mandatory Quality Samples Programhelliphelliphelliphelliphelliphelliphelliphelliphelliphelliphelliphelliphelliphelliphelliphellip 2 2 2 Farm Bill Market Development Programs Foreign Market Development (Cooperator) Programhelliphelliphelliphellip 34 34 34 Technical Assistance for Specialty Crops Programhelliphelliphelliphelliphellip 7 8 9 Market Access Programhelliphelliphelliphelliphelliphelliphelliphelliphelliphelliphelliphelliphelliphelliphelliphellip 200 200 160 Emerging Markets Programhelliphelliphelliphelliphelliphelliphelliphelliphelliphelliphelliphelliphelliphellip 10 10 10 Dairy Export Incentive Programhelliphelliphelliphelliphelliphelliphelliphelliphelliphelliphelliphelliphellip 19 10 0 Foreign Food Assistance McGovern-Dole International Food for Education Programhelliphellip 84 0 0 Food for Progress - CCC Funded helliphelliphelliphelliphelliphelliphelliphelliphelliphelliphelliphellip 216 150 146 Bill Emerson Humanitarian Trusthelliphelliphelliphelliphelliphelliphelliphelliphelliphelliphelliphellip 7 a a Local and Regional Commodity Procurement Pilot Programhellip 5 25 25 Total Farm Bill Programshelliphelliphelliphelliphelliphelliphelliphelliphelliphelliphelliphelliphelliphelliphellip 582 437 384 Recovery Act Trade Adjustment Assistance for Farmershelliphelliphelliphelliphelliphelliphelliphelliphellip 25 90 22 Total Mandatory Programshelliphelliphelliphelliphelliphelliphelliphelliphelliphelliphelliphelliphelliphellip 609 529 408 Total Foreign Agricultural Servicehelliphelliphelliphelliphelliphelliphelliphelliphelliphelliphellip $3198 $2612 $2569
a Assets of the Trust can be released any time the Administrator of the US Agency for International Development determines that PL 480 Title II funding for emergency needs is inadequate to meet those needs in any fiscal year
43
FARM AND FOREIGN AGRICULTURAL SERVICES
Foreign Agricultural Service CCC Export Credit Programs
Program Level (PL) and Budget Authority (BA) (Dollars in Millions)
2009 2010 2011 Enacted Estimate Budget
Program PL BA PL BA PL BA GSM-102 Guaranteeshelliphelliphelliphelliphelliphelliphelliphelliphelliphellip $5357 $40 $5400 0 $5400 0 Facilities Financing Guaranteeshelliphelliphelliphelliphelliphellip 0 0 100 $11 100 $18 Total CCC Export Credithelliphelliphelliphelliphelliphelliphellip $5357 $40 $5500 $11 $5500 $18
CCC Export Credit Guarantee Programs The CCC export credit guarantee programs administered by FAS in conjunction with FSA provide payment guarantees for the commercial financing of US agricultural exports These programs facilitate exports to buyers in countries where credit is necessary to maintain or increase US sales
The budget includes an overall program level of $55 billion for CCC export credit guarantees in 2011 This estimate reflects the level of sales expected to be registered under the export credit guarantee programs However the actual level of programming could vary from this estimate depending upon program demand market conditions and other relevant factors during the course of the year
Of the total program level for export credit guarantees expected to be issued by CCC in 2011 $54 billion will be made available under the GSM-102 program which provides guarantees on commercial export credit extended with short-term repayment terms (up to 3 years)
The budget also includes an estimated program level of $100 million for facility financing guarantees in 2011 Under this activity CCC provides guarantees to facilitate the financing of goods and services exported from the United States to improve or establish agriculture-related facilities in emerging markets By supporting such facilities these guarantees enhance sales of US agricultural products to countries where demand is constricted due to inadequate storage processing or handling capabilities
International Federal credit programs have traditionally used government-wide assumptions about defaults and recoveries but are now encouraged to develop program specific assumptions For GSM-102 guarantees program specific recovery assumptions were incorporated into the subsidy calculation for the 2009 budget and program specific assumptions about defaults were incorporated in the 2010 budget Because actual program performance and expectations for the future differ from the government-wide assumptions used in previous years the changes to these two factors have resulted in substantially reduced subsidy rates for the program Due to a lack of historical program data government-wide assumptions continue to be used for the subsidy estimate for the facilities guarantee program
Quality Samples Program Funding for the Quality Samples Program is maintained at the 2010 level of about $25 million Under this program CCC provides funding to assist private entities
44
FARM AND FOREIGN AGRICULTURAL SERVICES
to furnish samples of US agricultural products to foreign importers in order to overcome trade and marketing obstacles The program which is carried out under the authority of the CCC Charter Act provides foreign importers with a better understanding and appreciation of the characteristics of US agricultural products
Market Development Programs FAS administers a number of programs in partnership with private sector cooperator organizations that support the development maintenance and expansion of commercial export markets for US agricultural commodities and products The 2011 budget proposes a series of adjustments in the funding levels for these programs to reflect the changing nature of agricultural trade competition
The budget increases funding for the Foreign Market Development (Cooperator) Program to $69 million in 2011 This includes $345 million to be provided by CCC consistent with provisions of the 2008 Farm Bill and an additional $345 million of discretionary funding to be provided in the FAS salaries and expenses account as part of the National Export Initiative Under this program cost-share assistance is provided to nonprofit commodity and agricultural trade associations to support overseas market development activities that are designed to remove long-term impediments to increased US trade These activities include technical assistance trade servicing and market research Annual funding for the Cooperator Program has remained relatively unchanged since the early 1980s which has discouraged new organizations from participating and new types of activities from being undertaken The priority of the Cooperator Program is the pursuit of export market gains that require longer term initiatives and resource commitments Increasing the funding level in 2011 will provide the opportunity to broaden international acceptance of the products of biotechnology which account for a third of our agricultural exports today and will account for even more in the future as well as to take advantage of emerging market opportunities that require long term market development investment
For the Technical Assistance for Specialty Crops (TASC) Program the budget includes total funding of $18 million consisting of $9 million of CCC funding and $9 million of discretionary funding provided in the FAS salaries and expenses account Similar to the Cooperator Program funding for TASC will be increased in 2011 as part of the National Export Initiative TASC is designed to address unique barriers that prohibit or threaten the export of US specialty crops Under the program grants are provided to assist US organizations in activities designed to overcome sanitary phytosanitary or related technical barriers to trade Increased funding for the program reflects the growing importance of specialty crops for US agricultural export growth and the contribution the program has made in resolving numerous trade barriers that have restricted trade
The budget provides funding of $160 million for the Market Access Program (MAP) This program reimburses participating organizations for a portion of the cost of carrying out overseas marketing and promotional activities such as consumer promotions MAP participants include nonprofit agricultural trade organizations State-regional trade groups cooperatives and private companies that qualify as small businesses Annual MAP funding has grown substantially since 2001 when the program level was $90 million Although the 2011 MAP funding level is
45
FARM AND FOREIGN AGRICULTURAL SERVICES
reduced from 2010 it still provides a program level that is nearly 80 percent above 2001 reflecting the recent strong expansion in programming
The budget maintains funding for the Emerging Markets Program at $10 million consistent with provisions of the 2008 Farm Bill The program authorizes CCC funding to be made available to carry out technical assistance activities that promote the export of US agricultural products and address technical barriers to trade in emerging markets Many types of technical assistance activities are eligible for funding including feasibility studies market research industry sector assessments specialized training and business workshops
Dairy Export Incentive Program Under the Dairy Export Incentive Program (DEIP) CCC funds are used to make bonus payments to exporters of US agricultural commodities to enable them to be price competitive and thereby make sales in targeted overseas markets where competitor countries are making subsidized sales
Because of global market conditions including falling international dairy prices and the reinstitution of dairy export subsidies by the European Union DEIP was reactivated in May 2009 and $19 million of bonuses were awarded under the program during 2009 Global market conditions are expected to improve gradually with the United States once again regaining its competitive position in export dairy markets Based on that assumption the budget includes a projected program level of $10 million for DEIP in 2010 and no funding for 2011 However should conditions warrant CCC funding can continue to be made available to the program up to the maximum annual level authorized under US commitments to the World Trade Organization
Foreign Food Assistance The United States plays a leading role in global efforts to alleviate hunger and malnutrition and enhance world food security through international food aid activities USDA contributes to these efforts by carrying out a variety of food aid programs which support economic growth and development in recipient countries
McGovern-Dole International Food for Education and Child Nutrition Program The McGovern-Dole International Food for Education and Child Nutrition Program provides for the donation of US agricultural commodities and associated financial and technical assistance to carry out preschool and school feeding programs in foreign countries Maternal infant and child nutrition programs also are authorized under the program Its purpose is to reduce the incidence of hunger and malnutrition and improve literacy and primary education These measures contribute to a healthy literate workforce that can support a more prosperous sustainable economy and ensure long-term food security
The 2011 budget continues funding for the McGovern-Dole program at the 2010 enacted level of $2095 million Appropriated funding for the program was increased substantially in 2010 in order to help support additional school feeding and child nutrition programs and to bolster the Departmentrsquos contribution to supporting economic development and food security in developing countries The program is expected to assist an estimated 5 million women and children in 2011
46
FARM AND FOREIGN AGRICULTURAL SERVICES
Food for Peace Act (PL 480) Assistance provided under the authority of the Food for Peace Act is a primary means by which the United States provides foreign food assistance Also known as PL 480 the assistance is authorized to be provided through two program authorities
bull Title I provides for sales of US agricultural commodities to developing country governments and private entities through concessional financing agreements and for donations through Food for Progress grant agreements The Title I program is administered by FAS
bull Title II provides for donations of humanitarian food assistance to needy people in foreign countries in response to malnutrition famine and other extraordinary relief requirements and to meet economic development needs that address food security The assistance is provided primarily through private voluntary organizations cooperatives or international organizations mainly the World Food Program (WFP) of the United Nations The Title II program is administered by the US Agency for International Development (USAID)
For 2011 the budget provides funding of nearly $17 billion for PL 480 Title II food assistance unchanged from the 2010 enacted level Last yearrsquos budget increased base funding for Title II programming by 38 percent over the previous year in order to bolster resources available for emergency needs enhance global food security and restore US leadership in global development efforts The 2011 budget maintains funding at that level in further support of those objectives
The budget includes no funding for Title I credit sales and grants
Food for Progress The Food for Progress Act of 1985 authorizes US agricultural commodities to be provided to developing countries and emerging democracies that have made commitments to introduce and expand free enterprise in their agricultural economies Statutory authority for the program was extended in the 2008 Farm Bill
Food for Progress agreements can be entered into with foreign governments private voluntary organizations nonprofit agricultural organizations cooperatives or intergovernmental organizations Agreements currently provide for the commodities to be supplied on grant terms
The Food for Progress authorizing statute provides for the use of CCC funding for commodity procurement transportation and associated non-commodity costs for the program
The 2011 budget assumes that $146 million of CCC funding will be used to support the Food for Progress program which is expected to support approximately 170000 metric tons of commodity assistance
Bill Emerson Humanitarian Trust The Bill Emerson Humanitarian Trust (the Trust) is a commodity andor monetary reserve designed to ensure that the United States can meet its international food assistance commitments under PL 480 Title II Substantial changes in the statutory authorities for the Trust were included in the 2008 Farm Bill These included revisions easing the criteria for release of commodities and funds from the Trust As revised the Trustrsquos
47
FARM AND FOREIGN AGRICULTURAL SERVICES
assets can now be released any time the Administrator of USAID determines that PL 480 Title II funding for emergency needs is inadequate to meet those needs in any fiscal year The revisions also removed the annual cap on the amount of commodities and funds that can be released
When a release from the Trust is authorized the Trustrsquos assets (whether commodities or funds) cover all commodity costs associated with the release All non-commodity costs including ocean freight charges internal transportation storage and handling overseas and certain administrative costs are paid for by CCC
During 2009 $7 million of assistance was provided using the Trustrsquos authority To date in 2010 no assistance has been provided and as of December 31 2009 the Trust held $315 million of cash and no commodities
Local and Regional Commodity Procurement Pilot Program The 2008 Farm Bill authorizes and provides CCC funding for a limited field-based pilot program of local and regional procurement of food aid commodities for distribution overseas Under the program which is authorized through 2012 grants are provided to private voluntary organizations cooperatives and WFP that undertake the procurement activities During 2009 FAS issued guidelines that govern operation of the pilot program and nearly $5 million of grants were awarded to the World Food Program for procurement projects in Mali Malawi and Tanzania Commodities purchased included sorghum millet beans and corn Consistent with provisions of the Farm Bill the budget provides $25 million for the pilot program in 2010 and 2011
In conjunction with an evaluation of USDA foreign food assistance programs FAS has developed a long-term performance measure that is intended to gauge the effectiveness of USDA food aid programs in improving food security in low income countries The ldquofood aid targeting effectiveness measurerdquo assesses how effective the targeting of USDA food aid programs is in addressing the food distribution gap in the most food insecure countries The Economic Research Service calculates the ratio using its Food Security Assessment Model which measures food security based on estimations of food gaps in 71 of the worldrsquos poorest countries Food gaps represent the difference between projected food availability and targeted food consumption
Because USDA food assistance programs contribute to multiple objectives including filling nutritional gaps agricultural development and childhood education performance results can vary from year to year depending upon which countries receive assistance The results will be highest in years when food is directly distributed and the country has a food distribution system that gets food to the neediest This occurred in 2008 when countries receiving assistance to meet nutritional development and educational needs had large nutritional gaps which caused a significant increase in the Food Aid Targeting Effectiveness measure
2006 2007 2008 2009 2010 2011Key Performance Measure
Food Aid Targeting 30-35 38 57 49 37 38Effectiveness (Percent)
48
FARM AND FOREIGN AGRICULTURAL SERVICES
Trade Adjustment Assistance for Farmers The Recovery Act reauthorized the Trade Adjustment Assistance (TAA) for Farmers program that was originally authorized by the Trade Act of 2002 Statutory authority for the original program had expired in December 2007 As revised by the Recovery Act USDA is now authorized to provide assistance to eligible producers of raw agricultural commodities and fishermen when production in the most recent marketing year yields less than 85 percent of the average national price production quantity value of production or cash receipts for such commodity for the 3 preceding marketing years and increases in imports contributed importantly to such declines as determined by the Secretary
TAA for Farmers provides producers of raw agricultural commodities and fishermen who have been adversely affected by import competition free technical assistance the reimbursement of certain travel and per diem costs associated with training and cash benefits of up to $12000 linked to the development and implementation of approved business adjustment plans The program covers farmers livestock producers fish farmers and fishermen competing with like or directly competitive imported products
During 2009 $25 million of TAA funding was obligated for the costs of implementing the revised program including the costs of contracting for the provision of technical assistance over a multi-year period As authorized by the Recovery Act the budget assumes annual funding of $90 million for the program for 2010 and $225 million for 2011 Statutory authority for the TAA for Farmers program expires on December 31 2010
49
FARM AND FOREIGN AGRICULTURAL SERVICES
Foreign Agricultural Service Salaries and Expenses (Dollars in Millions)
2009 2010 2011 Program Enacted Estimate Budget
Agricultural Exportshelliphelliphelliphelliphelliphelliphelliphelliphelliphelliphelliphelliphelliphelliphelliphelliphellip $112 $123 $182 New Technologieshelliphelliphelliphelliphelliphelliphelliphelliphelliphelliphelliphelliphelliphelliphelliphelliphellip 21 23 24 Food Securityhelliphelliphelliphelliphelliphelliphelliphelliphelliphelliphelliphelliphelliphelliphelliphelliphelliphelliphellip 34 38 41 Climate Changehelliphelliphelliphelliphelliphelliphelliphelliphelliphelliphelliphelliphelliphelliphelliphelliphelliphellip 3 3 3 Agricultural Reconstruction and Stablizationhelliphelliphelliphelliphelliphelliphellip 0 0 15
Total Appropriated Programshelliphelliphelliphelliphelliphelliphelliphelliphelliphelliphellip 170 187 265 FAS Computer Facility and Other IRM Costs Funded by CCChelliphelliphelliphelliphelliphelliphelliphelliphelliphelliphelliphelliphelliphelliphelliphelliphellip 20 24 21 Development Assistance Programs Funded by AID and Other Organizationshelliphelliphelliphelliphelliphelliphelliphelliphelliphelliphelliphellip 67 66 66 Agricultural Reconstruction and Stablization Activities funded by USAID and the Dept of Statehelliphelliphelliphelliphelliphelliphelliphelliphelliphelliphellip 19 209 18 Other Reimbursable Agreementshelliphelliphelliphelliphelliphelliphelliphelliphelliphelliphelliphellip 35 41 28
Total Reimbursable Program Activityhelliphelliphelliphelliphelliphelliphelliphellip 141 340 133 Total FAS Salaries and Expenseshelliphelliphelliphelliphelliphelliphelliphelliphelliphellip $311 $527 $398
Agricultural exports make a critical contribution to the prosperity of local and regional economies across rural America through increased sales and higher commodity prices Every $1 billion worth of agricultural exports supports an estimated 9000 jobs and $14 billion in economy activity Because of this important role the Department has established a high priority performance goal that by the end of 2011 it will reduce non-tariff trade barriers for five major export markets and increase US agricultural exports by $2 billion per year
Biotechnology crops and derived products are a significant portion of US agricultural exports However concerns about these products have prompted some countries to establish regulatory barriers to trade in biotechnology products as well as other measures that limit the technologyrsquos potential to help meet food security needs In a concerted and strategic effort to address these barriers FAS will play a key role in implementing a formal USDA Strategy for Facilitating the Export of Genetically Engineered Agricultural Commodities FAS will work under this coordinated approach with other agencies within USDA and elsewhere in the government as well as with allies worldwide to help address these trade barriers as well as to help other nations understand how biotechnology may help address the global challenges of food security energy security and climate change
A key component of FASrsquo work to facilitate access to overseas markets is compliance monitoring and enforcement of existing trade agreements to ensure full and fair access to overseas markets for Am erican producers and exporters Each year FAS personnel in Washington and at overseas posts monitor compliance and when necessary intervene with
50
FARM AND FOREIGN AGRICULTURAL SERVICES
foreign governments on behalf of US exporters w ho face market access difficulties as a result of unfair and illegal trade barriers Increasingly in recent years these barriers have involved Sanitary and Phytosanitary (SPS) measures As tariffs have come down globally SPS measures to protect human animal and plan t health have become more prominent barriers to trade and have required significantly enhanced efforts by FAS in collaboration with other USDA agencies to address and resolve
There can be considerable year-to-year variability in the dollar value o f tr ade preserved particularly in the case of SPS measures and t echn ical barriers to trade such as biotechnology-related trade measures Biotechnology-related me asures in particular affect major US export commodities such as rice corn soybeans and cotton and the economic significance of a single trade disruption with a major market can be substantial High commodity prices can also affect the annual level of trade preserved This variability is evident in the substantially higher value of trade preserved during 2008 and 2009 The threat to US agricultural exports from non-science based SPS barriers continues to grow and can impact billions of dollars of our trade USDA actions in 2008 and 2009 maintained soybean exports to China worth $63 billion in 2008 and $74 billion in 2009
Key Performance Measure Dollar value of agriculture trade preserved through trade agreement negotiation monitoring and enforcement ($ Billions)
2006 2007 2008 2009 2010 2011
Non-SPS Activities a $07 $05 $04 $05 $05
Value of trade preserved annually through USDA staff interventions leading to resolution of barriers created by SPS or Technical Barrier to Trade measures ($ Billions)
SPS-Related Activities b 26 $26
25 $32
73 $78
95 $99
36 $41
40 $45
a Less than $50 million b In 2008 and 2009 includes soybean exports to China
FAS conducts its activities and programs through offices in Washington DC and at 97 overseas locations The overseas offices represent and advocate for US agricultural interests provide reporting on agricultural policies production and trade for about 150 countries assist US exporters trade groups and State export marketing officials in their trade promotion efforts and help to implement technical assistance and trade capacity building programs that contribute to increased food security
51
FARM AND FOREIGN AGRICULTURAL SERVICES
The budget provides an appropriated funding level of $265 million for FAS activities in 2011 an increase of $79 million above the 2010 enacted level Of particular note increased funding is provided to expand export promotion activities maintain the agencyrsquos overseas presence at current levels and improve information technology (IT) network support at its overseas offices
Export Promotion The budget includes $54 million in discretionary funding for trade expansion activities as part of the National Export Initiative that is designed to spur economic growth and employment opportunities This includes an increase of $10 million to expand FAS exporter assistance and in-country promotion activities and to meet higher operating costs at FAS overseas posts The initiative also includes $345 million to supplement funding for the Foreign Market Development (Cooperator) Program and $9 million for the Technical Assistance for Specialty Crops (TASC) Program Funding for the Cooperator and TASC programs will be in addition to that provided by CCC and will double the overall level of funding available to both programs in 2011 Funding is increased for the Cooperator Program in order to broaden the opportunity for program participation and to support new innovative pr ogram activities The expansion in TASC funding reflects the growing importance of specialty crops for US agricultural export growth and the success TASC has had in helping to resolve numerous trade barriers
Overseas Administrative Costs The budget provides $34 million for increased payments to the Department of State for administrative services provided at overseas posts FAS has no administrative staff overseas and therefore relies on the Department of State and other agencies for the provision of those services
Overseas IT Network Support An increase of $4 million is provided for FAS to contract with the Department of State for overseas IT network support and maintenance This will allow FAS to take advantage of the secure information system infrastructure that is operated and maintained by the State Department and ensure that sensitive agency information is fully protected
Cochran and Borlaug Fellowship Programs The budget provides increased funding of $15 million for the Cochran and Borlaug Fellowship Programs These programs provide training and collaborative research opportunities in the United States for foreign agricultural researchers policy officials and other agricultural specialists and thereby help to advance US government food security and trade policy objectives Among other things the additional funding will enable an expansion of programs in Afghanistan and Pakistan to train agricultural extension agents veterinary officials and researchers in support of agricultural growth and development It will also allow for additional training in support of food security objectives in sub-Saharan African countries as well as Haiti Under our proposals as many as 680 individuals will be able to participate in and benefit from these programs
Agricultural Reconstruction and Stabilization The FAS budget also includes $146 million to support the Departmentrsquos participation in reconstruction and stabilization activities including Provincial Reconstruction Teams (PRTs) primarily in Afghanistan and Iraq Of this $13 million is moved from Departmental Management where it was funded in the 2010 appropriations act During the past year FAS has assumed full management of the operational and policy components of USDArsquos reconstruction and stabilization activities FAS also
52
FARM AND FOREIGN AGRICULTURAL SERVICES
coordinates closely with the Department of State which sets overall operational and administrative policies for activities in those two countries Transferring the funding for these activities to FAS provides for more efficient operations and is consistent with how the Department is now managing them Funding for these activities is increased by $16 million over the 2010 level to provide for an expansion of activities in Afghanistan and to meet higher operating costs
USDA is supporting implementation of the Presidentrsquos strategies for Afghanistan and Iraq by providing technical experts who serve as advisors to key government ministries and serve on civilian-military command units including PRTs working with farmers and local agricultural officials throughout the countries During 2010 USDA is increasing the number of agricultural advisors serving in Afghanistan from 14 to 64 Their work is essential for stabilizing strategic areas of the country building government capacity ensuring the successful management of assistance programs and addressing the issue of food insecurity Consistent with these efforts the Department has established a high priority performance goal of increasing the number of Afghan provinces in which women and children are food secure from 10 to 14 by the end of 2011
In addition the budget includes an estimated $133 million in funding to be made available to FAS through reimbursable agreements The largest components of this are funding for technical assistance training and research activities that FAS carries out overseas on behalf of USAID foreign governments and international organizations and agricultural reconstruction and stabilization activities that are funded by USAID and the Department of State Although funded by other agencies these activities are an important component of the Departmentrsquos efforts to support economic development and enhance food security in developing countries
53
RURAL DEVELOPMENT
Rural Housing 62
MISSION AND RELATIONSHIP TO STRATEGIC GOAL
Rural communities and businesses are implementing innovative technologies and modernizing infrastructure to create jobs develop new markets and increase competitiveness while conserving the Nationrsquos natural resources and providing a safe sufficient and nutritious food supply for the country and the world As a leading advocate for rural America USDA is at the forefront of developing the technology and tools necessary to transform rural America to take advantage of new opportunities All of the funding for USDArsquos Rural Development (RD) programs contributes to the Strategic Goal assisting rural communities to create prosperity by providing financial and technical assistance to rural residents businesses and private and public entities for a broad range of purposes that bring prosperity and better living to Rural America These programs are grouped within three agencies (1) the Rural Business-Cooperative Service (RBS) which provides assistance for the development of business and industry including small businesses and is currently implementing new loan guarantee and payment programs specifically designed for renewable energy and energy improvement projects (2) the Rural Utilities Service (RUS) which provides assistance for water and waste disposal rural electric and telecommunications including broadband access and (3) the Rural Housing Service (RHS) which provides assistance for home ownership multi-family housing and essential community facilities such as health and public safety infrastructure
Rural Development 2011 Program Level - $ 24 Billion
Rural Business 7
Salaries and Expenses
3
Rural Utilities 28
The type of assistance offered includes direct loans loan guarantees grants and technical assistance Some programs provide assistance to intermediaries that make loans or provide technical assistance to the ultimate beneficiaries Several of the programs require or encourage recipients to contribute their own resources or obtain third-party financing to support the total cost of projects in which case these programs leverage the Governmentrsquos support with private sector financing
The cost of programs that provide direct or guaranteed loans depends upon a number of factors including what prevailing interest rates are whether the interest rate on the loans is subsidized by
54
RURAL DEVELOPMENT
the Government whether there are fees and how much risk of loss is involved In the tables the budget authority for each program reflects the cost to the government to support the loan level Several of the loan programs operate at little or no cost to the Government These programs account for most of the financial assistance that RD provides They also impose a responsibility on RD to ensure that these loans are repaid within the parameters reflected in the subsidy rates applied at the time the loans were made
RD delivers its programs through a network of approximately 450 area offices and 47 State offices a centralized servicing center and finance office in St Louis Missouri and a national office
The 2011 budget includes about $29 billion in budget authority to support a program level of $24 billion in loans grants and other assistance This level of support reflects a strong commitment to Rural America It also reflects new policy directions including support for regional planning and collaboration rural and urban access to healthy foods rural homeownership and a reduction in the Nationrsquos dependence on fossil fuels
55
RURAL DEVELOPMENT
RURAL BUSINESS - COOPERATIVE SERVICE (RBS)
Program Level (PL) and Budget Authority (BA) (Dollars in Millions)
2009 2010 2011 Enacted Estimate Budget
Program PL BA PL BA PL BA Discretionary Business and Industry Guaranteed Loans helliphelliphelliphelliphelliphelliphelliphellip $993 $43 $993 $53 $942 $40 Rural Business Enterprise Grantshelliphelliphelliphelliphelliphelliphelliphelliphelliphelliphellip 39 39 39 39 39 39 Rural Business Opportunity Grantshelliphelliphelliphelliphelliphelliphelliphelliphelliphellip 5 5 5 5 3 3 Intermediary Relending Programhelliphelliphelliphelliphelliphelliphelliphelliphelliphelliphellip 34 14 34 8 36 14
Rural Economic Development Direct Loanshelliphelliphelliphelliphelliphelliphelliphelliphelliphelliphelliphelliphelliphelliphelliphelliphelliphellip 36 0 33 0 33 0 Grantshelliphelliphelliphelliphelliphelliphelliphelliphelliphelliphelliphelliphelliphelliphelliphelliphelliphelliphelliphelliphellip 10 0 10 0 10 0 Rural Microentrepreneur Assistance Program (Sec 6022) Guaranteed Loanshelliphelliphelliphelliphelliphelliphelliphelliphelliphelliphelliphelliphelliphelliphelliphellip 0 0 12 3 24 7 Grantshelliphelliphelliphelliphelliphelliphelliphelliphelliphelliphelliphelliphelliphelliphelliphelliphelliphelliphelliphelliphellip 0 0 3 3 1 1 Rural Cooperative Development Grantshelliphelliphelliphelliphelliphelliphelliphellip 9 9 14 14 20 20 Biorefinery Assistance Program (Sec 9003)helliphelliphelliphelliphelliphelliphellip 0 0 0 0 50 17 Value-added Ag Product Market Development helliphelliphelliphelliphellip 4 4 20 20 20 20 Rural Energy for America Program (Sec 9007) Guaranteed Loanshelliphelliphelliphelliphelliphelliphelliphelliphelliphelliphelliphelliphelliphelliphelliphellip 26 2 144 20 12 5 Grantshelliphelliphelliphelliphelliphelliphelliphelliphelliphelliphelliphelliphelliphelliphelliphelliphelliphelliphelliphelliphellip 3 3 20 20 34 34 EZEChelliphelliphelliphelliphelliphelliphelliphelliphelliphelliphelliphelliphelliphelliphelliphelliphelliphelliphelliphelliphellip 8 8 0 0 0 0 Subtotal RBS Programshelliphelliphelliphelliphelliphelliphelliphelliphelliphelliphelliphelliphelliphellip 1167 127 1327 185 1224 200 Salaries and Expenseshelliphelliphelliphelliphelliphelliphelliphelliphelliphelliphelliphelliphelliphelliphelliphellip 5 5 5 5 5 5 Total Ongoing Programshelliphelliphelliphelliphelliphelliphelliphelliphelliphelliphelliphelliphellip 1172 132 1332 190 1229 205 Recovery Act
Business and Industry Guaranteed Loanshelliphelliphelliphelliphelliphellip 1572 126 0 0 0 0 Rural Business Enterprise Grantshelliphelliphelliphelliphelliphelliphelliphelliphellip 19 19 0 0 0 0
Total Recovery Act Programshelliphelliphelliphelliphelliphelliphelliphelliphelliphelliphelliphellip 1591 145 0 0 0 0 Total Discretionary Programshelliphelliphelliphelliphelliphelliphelliphelliphelliphelliphelliphellip 2763 277 1332 190 1229 205 Mandatory Farm Bill
Biorefinery Assistance Guaranteed Loans (Sec 9003)hellip 225 75 691 245 0 0 Rural Energy for America Loans (Sec 9007)helliphelliphelliphellip 275 27 213 29 73 34 Rural Energy for America Grants (Sec 9007)helliphelliphelliphellip 28 28 31 31 36 36 Repowering Assistance Payments (Sec 9004)helliphelliphelliphellip 35 35 0 0 0 0 Bioenergy for Advanced Biofuels (Sec 9005)helliphelliphelliphellip 55 55 55 55 85 85 Value-added Ag Product Market Development helliphelliphellip 15 15 0 0 0 0 Rural Microentrepreneur Assist Loans (Sec 6022)helliphellip 9 3 3 1 6 2 Rural Microentrepreneur Assist Grants (Sec 6022)hellip 1 1 3 3 2 2
Total Mandatory Programshelliphelliphelliphelliphelliphelliphelliphelliphelliphelliphelliphelliphellip 643 239 996 364 202 159 Total RBS Programshelliphelliphelliphelliphelliphelliphelliphelliphelliphelliphelliphelliphelliphelliphellip$3406 $516 $2328 $554 $1431 $364
56
RURAL DEVELOPMENT
RBS administers RDrsquos rural business and cooperative services programs The primary purpose of these programs is to promote economic development
Healthy Food Financing Initiative This initiative is designed to support local and regional efforts to increase access to healthy foods particularly for the development of grocery stores and other healthy food retailers in urban and rural food deserts and other underserved areas Several RD programs are included in this initiative and are expected to be utilized to provide financing for grocery stores and other related infrastructure
Regional Innovation The 2011 budget also includes an initiative to establish a Regional Innovation Initiative to focus on the planning and coordination of USDA and other sources of assistance for rural communities This initiative recognizes that individual communities are often affected by linkages to the other communities within regions and that working together can produce more prosperity for all RD is expected to provide leadership for this initiative although several other USDA agencies are expected to participate The budget includes $14 million to fund coordination of this initiative under the salaries and expenses account
Business and Industry Guarantee Loan Program The Business and Industry (BampI) loan guarantee program the largest program level of the RBS programs provides protection against loan losses so that lenders are willing to extend credit to establish expand or modernize rural businesses The tightening rural credit markets have brought a renewed interest in the BampI program The 2011 budget supports a program level of over $900 million in BampI loan guarantees almost the same as the 2010 level The 2011 budget also proposes to increase the one-time fee on BampI guaranteed loans from up to 2 percent in 2010 to up to 3 percent in 2011 This increase is needed because increased defaults have raised the subsidy cost of the program The BampI program is expected to provide support for the Regional Innovation and Healthy Food Financing initiatives
The Recovery Act provided $126 million in budget authority that supports $16 billion in program level for BampI guarantees A significant portion of the funding provided by the Recovery Act remains available throughout 2010
Rural Business Enterprise Grant Program The Rural Business Enterprise Grant program provides grants for rural projects that finance and facilitate development of small and emerging rural businesses The 2011 budget provides $39 million for grants the same level as 2010 The program is also expected to support the Regional Innovation and Healthy Food Financing initiatives
Rural Business Opportunity Grant Program The Rural Business Opportunity Grant program promotes sustainable economic development in rural communities with exceptional needs through training and technical assistance for business development entrepreneurs and economic development officials and to assist with economic development planning The 2011 budget provides almost $3 million for grants the same level as 2010
Intermediary Relending Program The Intermediary Relending program provides one percent interest direct loans to entities that relend to rural businesses at a higher interest rate and use their
57
RURAL DEVELOPMENT
interest earnings to pay for their administrative expenses and develop capital reserves The 2011 budget supports a program level of $36 million in direct loans under this program about $2 million more than 2010 The program is also expected to provide support for the Regional Innovation and Healthy Food Financing initiatives
Rural Microentrepreneur Assistance Program Under this new program one percent direct loans and grants are made to microenterprise development organizations (MDOrsquos) The loans will be used to establish reserves for relending to microentrepreneurs and the grants are made to the MDOrsquos which may relend a portion to provide training operational support business planning and market development assistance The 2011 budget includes $8 million in discretionary funding This funding will support $24 million in loans and about $1 million in grants Including the $4 million in mandatory funding the total funding available in 2011 for this program is $30 million in loans and $3 million in grants
Rural Cooperative Development Grant Program The 2011 budget includes $20 million for this program a $6 million increase over 2010 The additional funding will be used to support locally produced distribution systems and the development of new cooperatives Cooperatives assisted by this program serve many small and minority producers
Value-Added Producer Grants The 2011 budget maintains the Value-Added Producer Grants program at the 2010 level of $20 million The program provides grants for a wide range of value-added projects including those that change the physical state of agricultural products or the way such products are marketed Ten percent of the funding is reserved for mid-tier marketing chains
Rural Energy for America Program (Section 9007) RBS has operated a renewable energy loan and grant program for the purchase of renewable energy systems and energy efficiency improvements since the passage of the 2002 Farm Bill Section 9007 of the Farm Bill implemented the Rural Energy for America Program (REAP) REAP provides similar assistance as its predecessor program the Renewable Energy and Energy Efficiency Improvement Program however REAP can now offer funding for energy audits and feasibility studies The Farm Bill provides mandatory funding that will support a program level of $73 million in loans and $36 million in grants for 2011 about $135 million below the 2010 level In addition the 2011 budget supports a discretionary program level of $12 million in loan guarantees and $34 million in grants a reduction of $132 million in program level and an increase of $14 million in grants from the 2010 level
Biorefinery Assistance Program (Section 9003) RBS now has the capability to guarantee loan funds for biorefineries up to $250 million per project Rural Development has approved three loans for biorefineries under a Notice of Funding Availability that was published in November of 2008 and is currently developing permanent regulations for the program The 2008 Farm Bill provided funding in 2008 and 2009 to support over $900 million in loan guarantees and authorizes additional funds for 2009 through 2012 The 2011 budget requests $17 million in discretionary funding to support a program level of $50 million for these facilities With this funding the total available for Section 9003 Program is over $950 million
58
RURAL DEVELOPMENT
All the funding for RD programs is expected to save or create jobs however only the business programs collect data on jobs rather than use a common multiplier to estimate them The table below reflects performance for 2009 and projections for 2010 and 2011 The projections are subject to change
Key Performance Measure 2006 2007 2008 2009 2010 2011 Number of jobs created or saved through USDA financing of businesses 71715 72710 72907 68969 72369 73224
Note Performance includes other RBS loan and grant programs that were not identified in the text
59
RURAL DEVELOPMENT
RURAL UTILITIES SERVICE (RUS)
Program Level (PL) and Budget Authority (BA) (Dollars in Millions)
2009 2010 2011 Program Enacted Estimate Budget
PL BA PL BA PL BA Discretionary Electric Programs Direct Loanshelliphelliphelliphelliphelliphelliphelliphelliphelliphelliphelliphelliphellip $6600 a $7100 0 $4100 0
Telecommunications Programs Direct Loanshelliphelliphelliphelliphelliphelliphelliphelliphelliphelliphelliphelliphellip 690 a 690 0 690 0
Distance Learning and Telemedicine Programs Grantshelliphelliphelliphelliphelliphelliphelliphelliphelliphelliphelliphelliphelliphelliphelliphellip 35 $35 38 $38 30 $30
Broadband Programs Direct Loanshelliphelliphelliphelliphelliphelliphelliphelliphelliphelliphelliphelliphellip 400 16 400 29 400 22 Grantshelliphelliphelliphelliphelliphelliphelliphelliphelliphelliphelliphelliphelliphelliphelliphellip 13 13 18 18 18 18
High Energy Costs Grants helliphelliphelliphelliphelliphelliphelliphellip 18 18 18 18 0 0 Water and Waste Disposal Programs Direct Loanshelliphelliphelliphelliphelliphelliphelliphelliphelliphelliphelliphelliphellip 1095 142 1022 77 1036 89 Guaranteed Loans helliphelliphelliphelliphelliphelliphelliphelliphelliphelliphellip 75 0 75 0 75 0 Grants helliphelliphelliphelliphelliphelliphelliphelliphelliphelliphelliphelliphelliphelliphelliphellip 397 397 474 474 446 446 Subtotal Water and Wastehelliphelliphelliphelliphelliphelliphellip 1567 539 1571 551 1557 535 Subtotal RUS programshelliphelliphelliphelliphelliphelliphelliphellip 9323 621 9835 654 6795 605
Salaries and Expenseshelliphelliphelliphelliphelliphelliphelliphelliphelliphelliphellip 39 39 40 40 38 38
Total Ongoing Discretionary Programshelliphellip 9362 660 9875 694 6833 643
Recovery Act Broadband Programs
Direct Loanhelliphelliphelliphelliphelliphelliphelliphelliphelliphelliphellip 7160 485 0 0 0 0 Grantshelliphelliphelliphelliphelliphelliphelliphelliphelliphelliphelliphelliphelliphellip 1940 1940 0 0 0 0
Water and Waste Programs Direct Loanshelliphelliphelliphelliphelliphelliphelliphelliphelliphelliphellip 2154 273 0 0 0 0 Grantshelliphelliphelliphelliphelliphelliphelliphelliphelliphelliphelliphelliphellip 1106 1106 0 0 0 0
Total Recovery Act Programshelliphelliphelliphelliphelliphellip 12360 3804 0 0 0 0 Total RUS Programshelliphelliphelliphelliphelliphelliphelliphellip $21722 $4464 $9875 $694 $6833 $643
a Less than $05 million
Electric and Telecommunications Programs The Electric and Telecommunications programs administered by RUS provide loans to establish expand and modernize vital components of the infrastructure of rural America They are long-standing programs that brought electric and telecommunication services to rural America and ensured universal service for the Nation While most borrowers have some access to private credit markets the programs help to leverage private sector investments as well as fill credit gaps that still exist for some rural areas and borrowers In addition the programs facilitate the financing of improvements to facilities that
60
RURAL DEVELOPMENT
RUS financed in the past and still holds a lien There are a number of ways USDArsquos electric program can be used to support energy conservation and efficiency projects The 2008 Farm Bill amended the Rural Electrification Act (REA) to make electric program funding available for these purposes Loans can be made to electric cooperatives that in turn offer rebates or provide loans to their customers for energy conservation and efficiency projects There is also a provision in the REA to provide deferments on certain electric loans for these purposes The Rural Economic Development Loan and Grant (REDLG) program that is administered by RBS also provides funding for electric cooperatives that may be used to support energy conservation and efficiency projects
The 2011 budget reflects the Presidentrsquos 2009 G20 commitment to phase out fossil fuels subsidies Consistent with this commitment no loan funds are provided for new construction of base or peak load generation from coal or natural gas Loan funds will be used only for the transmission and distribution of electricity carbon capture projects and the generation of electricity from renewable sources including wind The budget supports $41 billion in loans for these purposes which is expected to be sufficient to meet the demand Loans for nuclear power generation will continue to be handled by the Department of Energy
The performance indicator identifies the number of borrowerssubscribers receiving new andor improved electric service The reduction in performance is directly attributed to the reduction in program level to meet the Presidentrsquos G20 commitment to reduce fossil fuel subsidies This measure includes the improvement of existing facilities as many facilities are improved several times over their estimated useful life which results in a larger number of people being served than actually live in the service territories
Key Performance Measure 2006 2007 2008 2009 2010 2011 Number of borrowerssubscribers receiving new andor improved electric facilities (millions)
82 58 81 98 61 38
The 2011 budget also supports $690 million in telecommunications loans which is the same as 2010 and also expected to be sufficient to meet demand These loans are used for the improvement and construction of telecommunication facilities that meet broadband standards although they are not meant to be used for all broadband purposes
The performance indicator displays performance information for the traditional telecommunications and broadband loan programs Program funding has been maintained at the same level in recent years and performance for the program has remained constant
61
Key Performance Measure 2006 2007 2008 2009 2010 2011
Number of borrowerssubscribers receiving new or improved telecommunication services (millions)
030 036 078 019 035 035
RURAL DEVELOPMENT
BroadbandDistance Learning and Telemedicine The ongoing Broadband program is similar to the Broadband program that is currently active under the Recovery Act The Distance Learning and Telemedicine Grant Program is designed specifically to assist rural communities that would otherwise be without access to learning and medical services over the Internet
The 2011 budget includes $70 million in funding to support $418 million in broadband loans and grants and $30 million in grants under the Distance Learning and Telemedicine program The overall reduction of $78 million in funding from 2010 reflects termination of the grants for analog conversion and the healthcare services grants
Staff resources are currently being fully utilized administering the Broadband program authorized by the Recovery Act which provided $25 billion in budget authority for broadband loans and grants This effort is being coordinated with the Federal Communications Commission and National Telecommunications and Information Administration It is anticipated the Recovery Act funding will be fully utilized in 2010
New regulations to implement the 2008 Farm Bill modifications in the ongoing program are expected to improve the performance of the program by providing better focus on rural areas that lack access to existing providers and by strengthening the financial integrity of the loan making process
High Energy Cost Grants The intent of this program is to provide funding for energy and other rural development purposes in areas that have high energy costs No funding is provided for this program because only a limited number of States can qualify and the purposes of the program can be met through other RD programs
Water and Waste Disposal Program The Water and Waste Disposal Program provides financing for rural communities to establish expand or modernize water treatment and waste disposal facilities These facilities provide safe drinking water and sanitary waste disposal for residential users and help communities thrive by attracting new business Projects are designed for energy efficiency and water conservation
Eligibility is limited to communities of 10000 or less in population that are unable to obtain credit elsewhere In addition financing is available only to those communities with low median household income levels Priority is given to public entities serving areas with less than 5500 population and applying for loans to restore a deteriorating water system or improve enlarge or modify an inadequate waste facility Grants are limited to a maximum of 75 percent of project costs Program regulations stipulate that the grant amount should only be as much as necessary to bring the user rates down to a reasonable level for the area Water and Waste Disposal grant and
62
RURAL DEVELOPMENT
loan funds are usually combined based on the income levels and user costs Grants are also provided for solid waste disposal and technical assistance and training
The 2011 budget provides $535 million in budget authority to support over $1 billion in direct loans $75 million in guaranteed loans and $446 million in grants for a total program level of about $16 billion This level is approximately the same as the 2010 appropriated level
The performance indicator measures the number of borrowerssubscribers receiving new or improved service from water facilities funded by Rural Development The 2008 Farm Bill provided an additional $300 million in funding in 2008 that attributed to the increase in performance In recent years the Water and Waste Disposal Program has received a similar appropriation and program performance has remain consistent with the level of program activity
Key Performance Measure 2006 2007 2008 2009 2010 2011
Number of borrowerssubscribers receiving new or improved service from agency funded water facility (millions)
17 13 44 34 14 14
The Recovery Act provided an additional $13 billion in budget authority sufficient to support $33 billion in loans and grants for reducing the backlog of applications This funding is expected to be fully utilized by the end of 2010
63
RURAL DEVELOPMENT
RURAL HOUSING SERVICE (RHS)
Program Level (PL) and Budget Authority (BA) (Dollars in Millions)
2009 2010 2011 Enacted Estimate Budget
Program PL BA PL BA PL BA Discretionary Single Family Housing
Direct Loans (Sec 502)helliphelliphelliphelliphelliphelliphelliphelliphelliphellip $1121 $75 $1121 $40 $1200 $75 Guaranteed Loans (Sec 502)helliphelliphelliphelliphelliphelliphelliphellip 6232 79 11961 173 12000 b
Multi Family Housing Direct Loans (Sec 515)helliphelliphelliphelliphelliphelliphelliphelliphelliphellip 70 29 70 19 95 32 Guaranteed Loans (Sec 538)helliphelliphelliphelliphelliphelliphelliphellip 129 8 129 1 129 13
Very Low-Income Repair (Sec 504) Direct Loans helliphelliphelliphelliphelliphelliphelliphelliphelliphelliphelliphelliphelliphellip 34 9 34 4 34 6 Grants helliphelliphelliphelliphelliphelliphelliphelliphelliphelliphelliphelliphelliphelliphelliphelliphellip 32 32 32 32 31 31
All Other Direct Loanshelliphelliphelliphelliphelliphelliphelliphelliphelliphelliphellip 21 a 21 a 21 1 Grants and Payments
Rental Assistance (Sec 502 and 521)helliphelliphelliphelliphellip 903 903 980 980 966 966 Mutual and Self-Help (Sec 523)helliphelliphelliphelliphelliphelliphellip 39 39 42 42 37 37 Multi-Family Housing Revitalization helliphelliphelliphelliphellip 32 28 69 43 18 18 All Other Grant and Loan programshelliphelliphelliphelliphellip 10 10 14 14 9 9
Farm Labor Housing Program Direct Loans (Sec 514)helliphelliphelliphelliphelliphelliphelliphelliphelliphellip 22 9 27 10 27 10 Grants (Sec 516)helliphelliphelliphelliphelliphelliphelliphelliphelliphelliphelliphelliphellip 9 9 10 10 10 10
Community Facilities Programs Direct Loanshelliphelliphelliphelliphelliphelliphelliphelliphelliphelliphelliphelliphelliphelliphellip 295 17 295 4 295 4 Guaranteed Loanshelliphelliphelliphelliphelliphelliphelliphelliphelliphelliphelliphellip 206 6 206 7 206 8 Grants helliphelliphelliphelliphelliphelliphelliphelliphelliphelliphelliphelliphelliphelliphelliphelliphellip 41 41 45 45 30 30 Subtotal RHS Programshelliphelliphelliphelliphelliphelliphelliphelliphellip 9196 1294 15056 1424 15108 1250
Salaries and Expenseshelliphelliphelliphelliphelliphelliphelliphelliphelliphelliphelliphellip 460 460 469 469 455 455 Total Ongoing Discretionary Programshelliphelliphellip $9656 $1754 $15525 $1893 $15563 $1705
Recovery Act Single Family Housing
Direct (Sec 502)helliphelliphelliphelliphelliphelliphelliphelliphelliphellip 1563 65 0 0 0 0 Guaranteed Loans (Sec 502)helliphelliphelliphelliphelliphellip10111 129 0 0 0 0
Community Facility Programs Directhelliphelliphelliphelliphelliphelliphelliphelliphelliphelliphelliphelliphelliphellip 1136 24 0 0 0 0 Grantshelliphelliphelliphelliphelliphelliphelliphelliphelliphelliphelliphelliphelliphelliphellip 102 102 0 0 0 0
Total Recovery Act Programshelliphelliphelliphelliphelliphelliphelliphelliphellip12912 320 0 0 0 0 Total Discretionary Programshelliphelliphelliphelliphelliphelliphelliphelliphellip$22568 $2074 $15525 $1893 $15563 $1705
a Less than $05 million b The budget proposes a new fee structure similar to HUD with no cost to the government
64
RURAL DEVELOPMENT
Single Family Direct and Guaranteed Loan Programs The Single Family Housing program provides direct and guaranteed loans to low and moderate income families in rural areas RHS is the only Federal agency that provides direct loans for this purpose Direct loans are limited to families with incomes less than 80 percent of area median income The interest rate on these loans may be subsidized down to one percent interest Guaranteed loans are limited to families with incomes less than 115 percent of area median income The interest rate on these loans is negotiated between the borrower and the private lender Currently there is a one-time guarantee fee of 2 percent for new loans and 05 percent on loans for refinancing This guarantee fee can be financed as part of the loan amount so that it does not impose an up-front cost that some borrowers may not be able to pay
The 2011 budget provides for a $12 billion program level for direct loans about $79 million above 2010 and maintains the 2010 appropriated level of $12 billion for guaranteed loans These levels are expected to provide about 98993 homeownership opportunities a decrease from 2010 which reflects anticipated higher housing prices due to the improved economic conditions
The performance measure below displays the number of homeownership opportunities that Rural Development has provided during the fiscal year In the past these programs have received additional funding through supplemental appropriations for disaster relief efforts that affected the performance information The 2010 appropriation nearly doubled the amount of program funds that were typically provided in recent years While the appropriation for 2011 is maintained at the 2010 level the small reduction in performance can be attributed to anticipated higher housing prices due to the improved economic conditions as indicated above
Key Performance Measure 2006 2007 2008 2009 2010 2011 Homeownership opportunities provided 42172 43532 66574 55957 106030 98993
While the single family housing programs have experienced modest increases in defaults due to the current economic crisis the programs did not make or guarantee sub-prime loans during the years that led up to the crisis and remain financially sound Moreover the demand for these programs has increased as demonstrated by the rapid utilization of Recovery Act funding Accordingly USDA is proposing that the guaranteed loan program be adapted to reflect the high demand for this program by charging an annual fee in addition to the guarantee fee This annual fee at an estimated rate of 015 percent in 2011 would be distributed over the year in monthly payments This change in policy is consistent with that of HUD and the VA
The Recovery Act provided an additional $65 million in budget authority for direct loans sufficient to support about $16 billion in loans and $129 million in budget authority sufficient to support over $10 billion in guaranteed loans Recovery Act funding for both the direct and guaranteed loan programs is expected to provide more than 90000 homeownership opportunities Most of this funding was used in 2009
Multi-Family Housing Programs The Multi-Family Housing program provides financing for rental housing projects and rental assistance payments for low-income tenants of those projects
65
RURAL DEVELOPMENT
The portfolio of previously financed projects currently includes about 17000 projects that provide housing for about 460000 low-income tenants many of whom are elderly The average annual income of tenants is about $8000
In recent years USDA has focused on the revitalization of existing projects As part of this effort the outstanding debt on these projects was deferred and other incentives offered to sponsors in exchange for a commitment to seek private sector financing to revitalize their projects and remain in the program The 2011 budget reflects a change in policy toward new construction Accordingly the 2011 budget includes additional budget authority to increase the program level for Section 515 direct loans for multi-family housing from $70 million in 2010 to over $95 million in 2011 which is expected to be used for both new construction and rehabilitation of the existing portfolio The 2011 budget proposes to terminate funding for the revitalization demonstration program Section 538 guaranteed loans would be maintained at $129 million with additional budget authority being provided to accommodate an increase in subsidy costs The policy of no interest subsidy and charging no fees on guaranteed loans would be maintained
The multi-family housing voucher program would be continued at a level of $18 million This program provides one-year vouchers to protect the rents of tenants affected by projects leaving the program
Most multi-family housing projects that are financed with direct loans also receive Rental Assistance Payments The payments are used to reduce the rents of low income families to no more than 30 percent of their income These payments are made through contracts with project sponsors Providing funding for the renewal of expiring rental assistance payment contracts is essential to RHSrsquo efforts to protect the Governmentrsquos investment and ensure the projects are revitalized and remain in the program The 2011 budget includes $966 million to renew about 212000 expiring contracts and provide new contracts on both Section 515 and Farm Labor Housing The modest decrease in funding is due to improvements in the way the need for renewing expiring contracts is estimated
Other Housing Programs Rural Development offers a full array of supplemental housing programs such as Very-low Income Repair loans and grants Rural Housing Preservation Farm Labor Housing loans and grants and Self-Help Housing These programs are maintained at approximately the same program levels as in 2010
Community Facilities Loan and Grant Programs RHS also administers a Community Facilities program that provides funding for a wide range of essential Community Facilities Priority is given to health and public safety facilities The program serves rural communities of up to 20000 in population
The 2011 budget provides funding for $295 million in direct loans $206 million in loan guarantees and $30 million in grants all under the basic Community Facilities program The loan levels are the same as for 2010 while the grant level is $15 million lower due to the elimination of three small special interest community facilities programs namely Rural Community Development Initiative grants Tribal College grants and Economic Impact
66
RURAL DEVELOPMENT
Initiative grants Other RD programs are available to provide assistance similar to that offered by these programs
The performance measure below measures the percent of rural residents who are provided with improved essential community services such as health and safety facilities Program funding and performance is relatively consistent from year to year with the exception of 2007 The increase in performance resulted from a Presidential Initiative from the prior Administration to enable rural health facilities to upgrade record keeping systems to electronic medical records
Key Performance Measure 2006 2007 2008 2009 2010 2011 Percentage of customers who are provided access to new andor improved essential community facilities ndash Health Facilities 38 72 48 54 50 50
Safety Facilities 38 62 57 50 54 54
67
RURAL DEVELOPMENT
RURAL DEVELOPMENT SALARIES AND EXPENSES
Budget Authority (Dollars in Millions)
2009 2010 2011 Program Enacted Estimate Budget
Salaries and Expenses Appropriationhelliphelliphelliphelliphelliphelliphelliphelliphelliphelliphelliphelliphelliphelliphellip $193 $202 $232 Transfers Rural Electric and Telecomm Loan Programhelliphellip (39) (40) (38) Rural Housing Insurance Fund Programhelliphelliphelliphellip (460) (468) (455) Rural Development Loan Fund Programhelliphelliphelliphellip (5) (5) (5) Subtotal Transfershelliphelliphelliphelliphelliphelliphelliphelliphelliphelliphellip (504) (513) (498) Subtotal Salaries and Expenseshelliphelliphelliphelliphelliphelliphellip 697 715 730 Recovery Acthelliphelliphelliphelliphelliphelliphelliphelliphelliphelliphelliphelliphelliphelliphellip 131 0 0 Total Salaries and Expenseshelliphelliphelliphelliphelliphelliphelliphelliphelliphellip $828 $715 $730
The 2011 budget provides a total of $730 million for salaries and expenses related to carrying out RD programs This level includes an increase of $72 million for pay cost $12 million for refresh of the Common Computing Environment (CCE) and $14 million to support the development of the Regional Innovation Initiative
The 2011 budget includes $12 million for the RD portion of a Departmental effort to modernize and upgrade the IT infrastructure (also known as the Common Computing Environment (CCE)) for the Service Center Agencies (SCAs) This funding will be used to replace outdated components of the CCE many of which have exceeded their expected life cycles to reduce system vulnerabilities to failure and improve the performance and effectiveness of the shared infrastructure These improvements will allow the SCAs to better serve program participants with a more flexible and reliable IT infrastructure This funding will allow for the first system-wide refresh of the CCE since the infrastructure was implemented in 2000 In addition as the components of the CCE are replaced USDA will implement a right-sizing process whereby configuration changes will be made to better support the delivery of current and future programs As part of this process the Department will strive to improve system security reduce the long term cost of infrastructure services and improve service reliability
68
FOOD NUTRITION AND CONSUMER SERVICES
MISSION AND RELATIONSHIP TO STRATEGIC GOAL
A plentiful supply of safe and nutritious food is essential to the well-being of every family and the healthy development of every child in America Although most American households have access at all times to enough nutritious food for an active and healthy lifestyle too many households especially households with children do not have sufficient resources to ensure this access especially under the current economic conditions A recent report by the Department showed that in over 500000 families with children in 2008 one or more children simply do not get enough to eat Meaning they had to cut the size of their meals skip meals or even go whole days without food at some time during the year Too many children also have poor diets and gain excessive weight Recent data shows that the prevalence of obesity has increased over 10 percent to 17 percent for children between 6 and 19 years of age
The activities and funding of Food Nutrition and Consumer Services including the Food and Nutrition Service (FNS) and the Center for Nutrition Policy and Promotion (CNPP) support USDA Strategic Goal to ensure that all of Americarsquos children have access to safe nutritious and balanced meals FNS contributes significantly to two activities under this strategic goal including (1) increasing access to nutritious food and (2) promoting healthy diet and physical activity behaviors FNS also works to ensure that food is safe most notably for meals served through the Child Nutrition Programs and the agency is committed to increasing performance efficiency and alignment of USDA programs
The mission of FNS is to increase food security and reduce hunger in partnership with cooperating organizations by providing children and low-income people access to food a healthful diet and nutrition education in a manner that supports American agriculture and inspires public confidence The mission of CNPP is to improve the health of Americans by developing and promoting dietary guidance that links the best evidence-base scientific research to the nutrition needs of consumers In addition to providing access to nutritious food FNS also works to empower program participants with knowledge of the link between diet and health FNS administers the Departmentrsquos domestic nutrition assistance programs The Federal staff leverage their efforts by working with State and local partners to deliver nutrition assistance through the Supplemental Nutrition Assistance Program (formerly the Food Stamp Program) the Child Nutrition Programs ndash National School Lunch Program National School Breakfast Program and the Child and Adult Care Food Program and the Special Supplemental Nutrition Program for Women Infants and Children (WIC) and other programs serving specialized needs The Supplemental Nutrition Assistance Program provides basic assistance to help ensure low-income households have access to a secure and adequate diet The other programs target specific groups of people with specialized needs or in special settings Key performance measures for 2011 are to decrease the number of households with very low food security among children increase the percentage of eligible people participating in the Supplemental Nutrition Assistance Program increase the percentage of school children participating in the National School Lunch Program decrease the prevalence of obesity among children and adolescents improve Healthy Eating Index (HEI) scores for people in low-income households (under 130 percent of poverty level) and for the general population and increase the amount of Supplemental Nutrition Assistance Program benefits redeemed at farmers markets
69
FOOD NUTRITION AND CONSUMER SERVICES
FNS Budget Authority 900
800
700
600
500
400
300
200
100
00
WIC CNP SNAP ARRA FY 2009 FY 2010 FY 2011
ARRA amounts of less than $1 billion are not included
The 2011 budget provides funds for anticipated changes in participation and food cost inflation for the major programs It emphasizes improving access and operations in 2011 and improving the nutritional status of recipients Both FNS and the Center for Nutrition Policy and Promotion will continue efforts to promote healthy eating and active lifestyle behaviors in part by the continued use and promotion of MyPyramidgov and the Dietary Guidelines for Americans Additionally in 2011 USDA will coordinate with the Departments of Health and Human Services and Education to implement revise and refine plans and strategies for addressing the problem of childhood obesity
$Bill
ions
69 73 76 15 17 19
54 58 68
52 105
119
70
FOOD NUTRITION AND CONSUMER SERVICES
Food and Nutrition Service Budget Authority
(Dollars in Millions) 2009 2010 2011
Program Enacted Estimate Budget Discretionary Special Supplemental Nutrition Program (WIC) helliphelliphelliphelliphelliphelliphelliphelliphelliphelliphelliphellip $6860 $7257 $7603 Commodity Assistance Program Commodity Supplemental Food Programhelliphelliphelliphelliphelliphelliphelliphelliphelliphelliphelliphelliphelliphellip 160 171 177 The Emergency Food Assistance Program (TEFAP)
Soup Kitchens Food Bankshelliphelliphelliphelliphelliphelliphelliphelliphelliphelliphelliphelliphelliphelliphelliphelliphelliphelliphelliphellip 50 50 50 Infrastructure Grantshelliphelliphelliphelliphelliphelliphelliphelliphelliphelliphelliphelliphelliphelliphelliphelliphelliphelliphelliphelliphelliphellip 0 6 0
Farmers Market Nutrition Programhelliphelliphelliphelliphelliphelliphelliphelliphelliphelliphelliphelliphelliphelliphelliphelliphellip 20 20 20 Pacific Island Assistance and Disaster Assistancehelliphelliphelliphelliphelliphelliphelliphelliphelliphelliphellip 1 1 1 IT Modernization and Supporthelliphelliphelliphelliphelliphelliphelliphelliphelliphelliphelliphelliphelliphelliphelliphelliphelliphelliphellip 0 0 2 Nutrition Services Incentive Program ahelliphelliphelliphelliphelliphelliphelliphelliphelliphelliphelliphelliphelliphelliphellip 3 3 0
Total Commodity Assistance Programhelliphelliphelliphelliphelliphelliphelliphelliphelliphelliphelliphelliphelliphellip 234 251 250 Nutrition Programs Administrationhelliphelliphelliphelliphelliphelliphelliphelliphelliphelliphelliphelliphelliphelliphelliphelliphelliphellip 145 151 172
Total Ongoing Discretionary Programshelliphelliphelliphelliphelliphelliphelliphelliphelliphelliphelliphelliphelliphellip 7239 7659 8025 Recovery Act WIC Programhelliphelliphelliphelliphelliphelliphelliphelliphelliphelliphelliphelliphelliphelliphelliphelliphelliphelliphelliphelliphelliphelliphelliphelliphelliphellip 500 0 0 Commodity Assistance Programhelliphelliphelliphelliphelliphelliphelliphelliphelliphelliphelliphelliphelliphelliphelliphelliphelliphellip 150 0 0 Child Nutrition Programshelliphelliphelliphelliphelliphelliphelliphelliphelliphelliphelliphelliphelliphelliphelliphelliphelliphelliphelliphelliphellip 100 0 0
Total Recovery Acthelliphelliphelliphelliphelliphelliphelliphelliphelliphelliphelliphelliphelliphelliphelliphelliphelliphelliphelliphelliphelliphellip 750 0 0 Total Discretionary Programshelliphelliphelliphelliphelliphelliphelliphelliphelliphelliphelliphelliphelliphelliphelliphelliphelliphellip 7989 7659 8025
Mandatory Supplemental Nutrition Assistance Program (SNAP)helliphelliphelliphelliphelliphelliphelliphelliphelliphelliphellip 53970 58269 68207 Proposed Legislation bhelliphelliphelliphelliphelliphelliphelliphelliphelliphelliphelliphelliphelliphelliphelliphelliphelliphelliphelliphelliphelliphellip 0 11 36 Child Nutrition Programshelliphelliphelliphelliphelliphelliphelliphelliphelliphelliphelliphelliphelliphelliphelliphelliphelliphelliphelliphelliphelliphellip 15074 17034 18392 Reauthorization Proposalshelliphelliphelliphelliphelliphelliphelliphelliphelliphelliphelliphelliphelliphelliphelliphelliphelliphelliphelliphelliphellip 0 0 1000 Farm Bill Seniors Farmers Market Nutrition Program chelliphelliphelliphelliphelliphelliphelliphelliphelliphelliphelliphelliphellip 21 21 21 Recovery Act Supplemental Nutrition Assistance Programhelliphelliphelliphelliphelliphelliphelliphelliphelliphelliphelliphelliphelliphellip 5195 10460 11936 Supplemental SNAP State Administrative Expenseshelliphelliphelliphelliphelliphelliphelliphelliphelliphelliphelliphelliphelliphelliphelliphellip 0 400 0
Total Mandatory Programshelliphelliphelliphelliphelliphelliphelliphelliphelliphelliphelliphelliphelliphelliphelliphelliphelliphelliphellip 74260 86195 99592 Total FNShelliphelliphelliphelliphelliphelliphelliphelliphelliphelliphelliphelliphelliphelliphelliphelliphelliphelliphelliphelliphelliphelliphelliphelliphellip $82249 $93854 $107617
a Funds are transferred from the Department of Health and Human Services Administration on Aging b The budget also proposes to increase the asset limit to $10000 in SNAP but does not increase budget authority The funding is provided through a government-wide initiative c Funds are transferred from the Commodity Credit Corporation
71
FOOD NUTRITION AND CONSUMER SERVICES
The nutrition assistance programs work in concert to improve scores on cross-cutting performance measures of improved diet for the children and low-income people they serve
Key Performance Measure 2006 2007 2008 2009 2010 2011 Application and usage level of nutrition guidance tools (billions of pieces of nutrition guidance distributed) 15 26 32 35 30 39 Baseline 2006 = 15
People Served Through Nutrition Assistance Programs
433
WIC SNAP School Lunch
FY 2009 FY 2010 FY 2011
Supplemental Nutrition Assistance Program (SNAP) The 2011 budget anticipates an increase in participation on average of about 28 million recipients per month between 2010 and 2011 Since the Recovery Act increased the maximum allotment by 136 percent effective April 2009 and provided that the benefit remain constant until the statutory COLA for SNAP benefits exceeds that level the average benefit level in 2011 is expected to be about the same as it was in 2010 (and for several years afterwards) Increases in projected funding requirements thus reflect the anticipated increase in program participation and associated State administrative expenses
The Administration is working to establish a practical national asset limit floor across means-tested human services food and cash assistance programs Legislative language will be provided to raise current SNAP asset limits to $10000 from $2000 per household or $3000 for households including an elderly or disabled member This nationwide figure will streamline eligibility for families eligible for benefits from multiple programs and encourage families to
91
337 312
95
405
321
101
326
0
5
10
15
20
25
30
35
40
45
Peop
le S
erve
d (M
illio
ns)
72
FOOD NUTRITION AND CONSUMER SERVICES
save toward self-sufficiency In addition FNS will be proposing legislative language to provide for the exclusion of tax refunds in the month of receipt and for the following 12 months beginning in tax year 2009 for SNAP and all Federally funded means-tested programs Legislation is also being proposed to extend the Recovery Act provision that eliminates the time limits for able-bodied adults without dependents for an additional year for an one-time cost of $25 million
SNAP will continue to focus on encouraging all eligible persons to take advantage of program benefits with particular emphasis on reaching underserved populations such as the elderly Hispanics and the working poor For 2011 $6 million is included to expand the Healthy Incentives Pilot now under development which will demonstrate and evaluate the effect of financial incentives to purchase fruits and vegetables on the diets of SNAP participants Additionally $125 million is requested to test the impact of a community-wide approach that will use multiple means of communication and influence to raise the general awareness of healthy eating in a community shift social norms create more opportunities to make healthy food choices and reward such choices when made
To assist direct-to-consumer food sales $4 million is included to provide point of sale terminals to all farmersrsquo markets nationally that cannot currently redeem SNAP benefits Ensuring farmersrsquo markets have point of sales devices will substantially increase the redemption of SNAP benefits at these outlets Nutrition education continues to be a key part of the SNAP to help low-income households improve their nutrition levels
Key Performance Measure 2006 2007 2008 2009 2010 2011 Participation levels for the major Federal nutrition assistance programs (millions per month) Supplemental Nutrition Assistance Program 257 265 284 337 405 433
The Department is continuing its efforts to improve payment accuracy seeking to reach a payment accuracy rate of 95 percent in 2011 This will be achieved through working with stakeholders to implement best practices focusing particularly on error prone areas
Key Performance Measure 2006 2007 2008 2009 2010 2011 Improve SNAP payment accuracy rate Baseline 2001 = 913 942 944 950 950 950 950
The Administration is committed to ensuring an uninterrupted flow of benefits to program participants Since SNAP participation and costs are not fully predictable and can grow rapidly in a changing economic environment or in unexpected emergencies such as natural disasters the 2011 budget includes a $5 billion contingency reserve an increase of $2 billion over recent
73
FOOD NUTRITION AND CONSUMER SERVICES
years to be used in the event that program needs exceed current estimates The budget also proposes indefinite funding authority which would make additional funds available in the last four months of the fiscal year if program needs exceed the anticipated level
Child Nutrition Programs Ensuring access to food for children and improving their eating habits continues to be a priority The National School Lunch School Breakfast Summer Food Service Special Milk and Child and Adult Care Food Programs play a significant role in achieving this goal by assisting State and local governments in serving healthful nutritious meals and snacks to children in various settings with greatest emphasis on helping low-income children These programs assist children by subsidizing quality meals in participating schools and child care settings While children from all income levels receive some assistance from these programs most of the funding supports meals served to low-income children for free or at a greatly reduced price Child Nutrition Programs subsidies for meals at child care centers and family daycare homes help support child care a critical need for working families
To ensure the quality of the meals served in the school meals programs and the Child and Adult Care Food Program the Department entered into a three-year contract with the National Academiesrsquo Institute of Medicine (IOM) in February 2008 to convene a panel of experts to make recommendations for updating and revising the nutrition standards and meal requirements IOMrsquos recommendations released in October 2009 will be used to develop a regulatory proposal to make changes that will ensure that school meals do all they can to meet childrenrsquos nutritional needs foster healthy eating habits and safeguard childrenrsquos health Similarly schools that achieve recognition as HealthierUS Schools Challenge Schools achieve a high level of performance for school meal quality nutrition education and physical activity
The Administration is currently focused on the reauthorization of the Child Nutrition and WIC Programs programs which at some point in their lives touch most Americans - providing nutritious food nutrition education and connections to critical health services The Administration is proposing to add $1 billion in 2011 and a total of $10 billion over the next ten years for this priority Reauthorization reforms are a key strategy in the effort to eliminate childhood hunger by 2015 USDA will provide resources aimed at improving access to nutritious meals establishing high standards for the nutritional quality of food available in school exploring new strategies for reducing hunger and improving childrenrsquos food choices particularly for low-income children improve access to healthy fruits and vegetables reducing the prevalence of obesity by improving the diets of school children by teaching them to make wise food choices and improve program performance and integrity
For 2011 the Child Nutrition Programs are funded at a level that will support anticipated participation and food costs An increase of $2 million is sought for a Farm to School Tactical Team including both FNS and AMS staff that will support local and regional food systems by facilitating linkages between schools and their local food producers An increase of $8 million is included to measure erroneous payments in school meal programs to determine the progress made reducing erroneous payments Also $8 million is sought for a study of school lunch and breakfast meal costs This study is conducted every few years to ensure that decisions on reimbursement levels are informed by up-to-date high-quality information on the cost of producing meals and the sources and levels of revenues to cover those costs
74
FOOD NUTRITION AND CONSUMER SERVICES
The $5 million in annual funding for Hunger-Free Communities under Section 4405 of the Farm Bill will continue in 2011 Grants will focus on promotion outreach demonstration projects and technical assistance to support communities in exploring a significantly broader array of local strategies to prevent hunger primarily among children Further $700000 included in 2010 to expand the HealthierUS School Challenge will be continued in FY 2011 so work to encourage schools to take a leadership role in helping students learn to make healthier eating and lifestyle choices will continue Existing funds will also continue to help ensure the integrity of meals served increased training and technical assistance materials for the school food service community and increased Federal oversight of meals served
Key Performance Measure 2006 2007 2008 2009 2010 2011 Participation levels for the major Federal nutrition assistance programs (millions per day) National School Lunch Program 301 305 309 312 321 326 School Breakfast Program 81 83 87 110 117 122
WIC The WIC Program USDArsquos largest discretionary program helps improve the health and nutritional intake of low-income pregnant breast-feeding and postpartum women infants and children up to their fifth birthday WIC works by providing participants with vouchers redeemable for foods dense in nutrients known to be lacking in the diets of eligible groups and providing nutrition education and referrals to other important health and social services Nearly half of those born in the United States receive WIC benefits
The Presidentrsquos 2011 budget request proposes $76 billion for the WIC Program an increase of approximately $350 million above the 2010 level (excluding the Recovery Act funding) which will be augmented by larger than usual carryover balance from 2010 The Administration is committed to serving all eligible individuals seeking WIC benefits and expects the request to support a monthly average of 101 million participants Included in the request is an increase for breastfeeding promotion from $80 million to $83 million plus a doubling of funding for breastfeeding performance bonuses for States to $10 million Also $15 million for program evaluation and $60 million allocated specifically to help States improve their management information systems are continued in 2011 Further $10 million is provided to continue support for IT oversight and infrastructure and $5 million is provided to improve the application process and coordination with other programs The Recovery Act provided $500 million in additional funding for WIC $100 million for management information systems and $400 million in a contingency reserve to fund unanticipated participation costs available until the end of 2010
FNS is working with States to ensure effective implementation of the new WIC food packages as required in 2010 and will work to continue to improve overall nutritional intakes consistent with the 2010 Dietary Guidelines for Americans and increase breastfeeding rates Additionally resources are provided to increase the value of the fruit and vegetable voucher for children by $2 per family per month totaling $104 million annually Finally the budget provides for a
75
FOOD NUTRITION AND CONSUMER SERVICES
$250 million contingency fund to ensure sufficient resources for stable services should participation or food costs be higher than anticipated
Key Performance Measure 2006 2007 2008 2009 2010 2011 Participation levels for the major Federal nutrition assistance programs (millions per month) WIC Program (average) 81 83 87 91 95 101
Commodity Assistance Program (CAP) CAP distributes USDA commodities through several programs The Emergency Food Assistance Program (TEFAP) provides support to a network of food banks and other programs that assist households in need of immediate short-term food assistance TEFAP includes components of both discretionary and mandatory funding In addition the Recovery Act provided $150 million for TEFAP to increase food assistance to Americans in the economic crisis These funds were used to purchase additional commodities ($100 million) and to fund administrative costs associated with the distribution of the USDA commodities or privately-donated foods In 2011 for State and local program administration $50 million in discretionary funding is requested any part of which at State discretion may be used to purchase additional commodities Also note that under the Supplemental Nutrition Assistance Program account mandatory funding of $2465 million is provided to purchase TEFAP commodities
CAP includes funding for the Commodity Supplemental Food Program (CSFP) CSFP provides commodities to low-income elderly and pregnant postpartum and breastfeeding women infants and children up to age six The 2011 budget proposes $1768 million an increase of $54 million to offset expected cost increases due to inflation while supporting the current participation levels
In 2011 funding is requested for the Farmersrsquo Market Nutrition Program (FMNP) for women infants and children at the authorized level $20 million The FMNP provides WIC participants with vouchers to purchase fresh local fruits vegetables and herbs directly from farmers farmersrsquo markets and roadside stands In 2008 the FMNP provided coupons to 23 million WIC participants The participants redeemed their coupons at 5765 authorized farmers markets and roadside stands providing revenue to 16016 small family farmers The Seniors FMNP funded by CCC provided similar benefits to over 900000 low-income seniors In 2008 the Seniors FMNP involved over 15062 farmers at 5588 farmersrsquo markets roadside stands and community supported agriculture programs
Nutrition Programs Administration (NPA) Funding of $1721 million is requested for NPA to support Federal management and oversight of USDArsquos investment in nutrition assistance programs The budget includes an increase $52 million to enhance the Federal investment in program administration grantee oversight and protection of the integrity of program operations Participation in SNAP has gone from 172 million recipients per month in 2000 to 337 million participants a month and participation in WIC has grown from 72 million participants a month in 2000 to 91 million participants In addition FNS staff totals 1387 in 2010 to manage a
76
FOOD NUTRITION AND CONSUMER SERVICES
budget over $100 billion well below the 1800 on board in 2000 when the FNS budget was $326 billion
The request includes $9 million to increase efforts to implement scientific evidence-based nutrition guidance and guide effective nutrition education interventions in schools and communities and build and maintain education tools and systems that Americans can use to adopt behaviors that lead to more healthful eating and active lifestyles The 2010 Dietary Guidelines for Americans will be completed and released in 2010 along with enhancements to MyPyramid including interactive applications To help USDA meet its strategic objective to reduce obesity $7 million of this total will be used by CNPP obesity related nutrition education activities The remaining $2 million is needed to translate the recommendations and policy statements in the 2010 Dietary Guidelines for Americans into information that consumers and program administrators can use The Dietary Guidelines and MyPyramid are used to help establish food benefits for the programs and they are central to nutrition education and promotion programs government wide as well as private sector nutrition education and promotion
In addition to enhancing staff resources FNS seeks an additional $55 million to update and integrate its outdated financial management system to control over $100 billion in program funding and to ensure its internal computer infrastructure is operating with current hardware and software less vulnerable to cyber attacks Of this amount $35 million is needed to develop common business processes and financial management systems consistent with USDArsquos Financial Management Modernization Initiatives The $2 million will help expand use of IT tools to improve benefit delivery to program participants to streamline program administration for State and local program partners to improve nutrition education and to enhance program integrity The budget also includes $3 million to fund the Bill Emerson and Mickey Leland Hunger Fellowship programs USDA is directly requesting funds for these activities consistent with the provisions of the 2008 Farm Bill which established the Fellows programs within the Department to address hunger and poverty in the United States as well as international hunger and other humanitarian needs
USDArsquos ability to simplify and improve the programs increase program efforts to improve nutritional outcomes encourage healthy and nutritious diets and expand an obesity prevention campaign is fostered by the Federal administrative efforts supported by Nutrition Program Administration funds
77
FOOD NUTRITION AND CONSUMER SERVICES
Food and Nutrition Service Key Indicators
2009 2010 2011 Actual Estimate Budget
Average Participation Millions Supplemental Nutrition Assistance Program (per month)helliphellip 337 405 433 Free School Lunchhelliphelliphelliphelliphelliphelliphelliphelliphelliphelliphelliphelliphelliphelliphelliphelliphellip 162 184 190 Total School Lunch (per day)helliphelliphelliphelliphelliphelliphelliphelliphelliphelliphelliphelliphellip 312 321 326 Free School Breakfasthelliphelliphelliphelliphelliphelliphelliphelliphelliphelliphelliphelliphelliphelliphelliphellip 79 87 93 Total School Breakfast (per day)helliphelliphelliphelliphelliphelliphelliphelliphelliphelliphellip 110 117 122 WIC (per month)helliphelliphelliphelliphelliphelliphelliphelliphelliphelliphelliphelliphelliphelliphelliphelliphelliphellip 91 95 101 Commodity Supplemental Food Program (CSFP) WIC (per month)helliphelliphelliphelliphelliphelliphelliphelliphelliphelliphelliphelliphelliphelliphelliphelliphellip 002 002 002 Elderly (per month)helliphelliphelliphelliphelliphelliphelliphelliphelliphelliphelliphelliphelliphelliphelliphellip 044 056 058 Food Distribution Program on Indian Reservations (FDPIR) (per month)helliphelliphelliphelliphelliphelliphelliphelliphelliphellip 010 010 010 Unemployment Rate (percent)helliphelliphelliphelliphelliphelliphelliphelliphelliphelliphelliphellip 84 101 95 AveragePersonMonth Food Benefit in $ Supplemental Nutrition Assistance Programhelliphelliphelliphelliphelliphelliphellip $12445 $13293 $13276 WIChelliphelliphelliphelliphelliphelliphelliphelliphelliphelliphelliphelliphelliphelliphelliphelliphelliphelliphelliphelliphelliphelliphellip 4255 4398 4559 CSFP WIC (FNS Funded) ahelliphelliphelliphelliphelliphelliphelliphelliphelliphelliphelliphellip 2655 2800 2775 CSFP Elderly (FNS Funded) ahelliphelliphelliphelliphelliphelliphelliphelliphelliphelliphellip 1877 1947 1918 FDPIR (FNS Funded) ahelliphelliphelliphelliphelliphelliphelliphelliphelliphelliphelliphelliphelliphellip 5454 6042 6090 Per Meal Subsidies Including Commodities in $ b School Lunch Free helliphelliphelliphelliphelliphelliphelliphelliphelliphelliphelliphelliphelliphelliphelliphelliphelliphelliphelliphelliphelliphellip $280 $289 $293 Reduced Price helliphelliphelliphelliphelliphelliphelliphelliphelliphelliphelliphelliphelliphelliphelliphelliphelliphellip 239 248 253 Paid helliphelliphelliphelliphelliphelliphelliphelliphelliphelliphelliphelliphelliphelliphelliphelliphelliphelliphelliphelliphelliphellip 045 045 046 School Breakfast Free helliphelliphelliphelliphelliphelliphelliphelliphelliphelliphelliphelliphelliphelliphelliphelliphelliphelliphelliphelliphelliphellip 166 172 175 Paid helliphelliphelliphelliphelliphelliphelliphelliphelliphelliphelliphelliphelliphelliphelliphelliphelliphelliphelliphelliphelliphellip 025 026 026
a Excludes bonus commodities In 2009 an average of $326 $279 and $285 per month was added in bonus commodities for each participant monthly for CSFPWIC CSFPelderly and FDPIR respectively b Excludes bonus commodities
78
FOOD SAFETY
MISSION AREA AND RELATIONSHIP TO STRATEGIC GOAL
Foodborne illness is recognized as a significant public health problem in the United States which can have a more severe impact on children than healthy adults According to the Centers for Disease Control and Prevention approximately half of the reported foodborne illnesses occur in children These diseases can lead to short and long-term health consequences and sometimes can result in death USDA and other Federal agencies are working in cooperation to ensure that Americans have increased access to safe and healthy food
The Food Safety mission area is the public health mission area of USDA that is responsible for ensuring that the Nationrsquos commercial supply of meat poultry and processed egg products is safe wholesome and properly labeled and packaged This includes products produced domestically in Federally-inspected establishments as well as products imported from foreign countries Funds for the Food Safety mission area support USDA Strategic Goal to ensure that all of Americarsquos children have access to safe nutritious and balanced meals
The mission area includes the activities of the Food Safety and Inspection Service (FSIS) which provides Federal inspection of meat poultry and processed egg products establishments support for similar establishments under State inspection programs development and implementation of the Public Health Information System to enhance science-based data-driven inspections and determination of international equivalence of foreign systems FSIS coordinates the development of its policies with other USDA agencies and other Federal agencies including the Food and Drug Administration (FDA) the Environmental Protection Agency the Centers for Disease Control and Prevention as well as foreign governments and international organizations to ensure an integrated farm-to-table approach to food safety Furthermore the Secretary of Agriculture is the co-chair of the Presidentrsquos Food Safety Working Group (FSWG) created in March 2009 which brings together cabinet secretaries and senior officials to advise the President on issues pertaining to food safety
In addition to FSIS the Food Safety mission area includes the general oversight of the Office of the US Manager of Codex which is the major international mechanism for encouraging fair international trade in food while promoting the health and economic interests of consumers
79
FOOD SAFETY
Budget Authority (Dollars in Millions)
2009 2010 2011 Program Enacted Estimate Budget
Discretionary Federal Food Safety and Inspectionhelliphelliphelliphelliphelliphelliphelliphelliphelliphelliphelliphelliphelliphelliphellip $872 $903 $912 State Food Safety and Inspectionhelliphelliphelliphelliphelliphelliphelliphelliphelliphelliphelliphelliphelliphelliphelliphellip 65 66 65 International Food Safety and Inspectionhelliphelliphelliphelliphelliphelliphelliphelliphelliphelliphelliphellip 18 19 16 Public Health Data Communication Infrastructure Systemhelliphelliphelliphelliphelliphellip 13 27 40 Codex Alimentariushelliphelliphelliphelliphelliphelliphelliphelliphelliphelliphelliphelliphelliphelliphelliphelliphelliphelliphelliphelliphellip 4 4 4
Total Discretionary Programshelliphelliphelliphelliphelliphelliphelliphelliphelliphelliphelliphelliphelliphelliphellip 972 1019 1037
Mandatory Trust Funds (Voluntary Inspection Services)helliphelliphelliphelliphelliphelliphelliphelliphelliphelliphellip 11 9 9 User Fees (OvertimeHoliday Inspection Services)helliphelliphelliphelliphelliphelliphelliphellip (135) (122) (122)
Total FSIS Programshelliphelliphelliphelliphelliphelliphelliphelliphelliphelliphelliphelliphelliphelliphelliphelliphelliphelliphellip $983 $1028 $1046
Organizational Structure To accomplish its functions FSIS employees are located at approximately 6286 slaughtering and processing establishments and import houses and other Federally-regulated facilities Headquarters personnel are responsible for overseeing administration of the program and ensuring that scientific and technological developments are incorporated into inspection procedures The Codex Office reports to the Under Secretary of Food Safety and coordinates all government and non-government participation in the activities of the Codex Alimentarius Commission
Inspection Data Infrastructure and Outbreak Response To ensure that FSIS can support its approximately 8500 Federal in-plant and other frontline personnel the Federal share of State inspection programs and continue to improve the data infrastructure supporting the Nationrsquos food safety system the 2011 budget proposes a discretionary funding level of slightly more than $1 billion an increase of approximately $18 million over 2010 The budget provides the full amount necessary to meet regulatory responsibilities including pay costs and other necessary supporting costs and continues the upward trend in funding over the past decade
80
FOOD SAFETY
FSIS Budget Authority 1200
1000
800
600
400
200
0
Fiscal Year
The 2011 budget requests $40 million an increase of $13 million to continue the deployment and enhancement of the FSIS public-health information infrastructure The additional funds will allow for the purchase of critical equipment the expansion of telecommunications and broadband bandwidth capacity and the improvement of information gathering systems to enhance access of inspection personnel to centralized mission critical systems These new investments are critical to fully leverage the Public Health Information System recently developed by FSIS to enhance the agencyrsquos ability to collect analyze and present data to allow decision making based on relevant timely product and process data utilizing the best science available
In response to key findings of the Presidentrsquos FSWG a $43 million increase is requested for the inter-agency Federal-State Foodborne Disease Outbreak Response Team to allow FSIS to more quickly investigate and respond to outbreaks including faster detection of outbreaks and removal of products from commerce to prevent further illnesses Using these new funds additional staff will be hired to support illness investigation outbreakresponse coordination collaboration on multi-State investigations and proactive public health partner communication outreach In addition these new staff will support a Unified Incident Command System to facilitate communication and decision-making in an emergency a goal of the Presidentrsquos FSWG Taken together this initiative will enhance detection of outbreaks and likely allow for earlier detection of outbreaks which would result in more timely FSIS actions to prevent further illnesses
Similarly in support of key findings of the Presidentrsquos FSWG the 2011 budget proposes a $10 million increase for Baseline Studies and Hazard Analysis and Critical Control Points (HACCP) Verification Program Updates This increase above the 2010 level will allow FSIS to improve surveillance of foodborne pathogens of human-health concern in FSIS-regulated products through significant expansion of the HACCP regulatory sampling and to develop more timely estimates of pathogen prevalence in food products by conducting an additional traditional
$ M
illio
ns
2000 2001 2002 2003 2004 2005 2006 2007 2008 2009 2010 2011
81
FOOD SAFETY
baseline study Accurate timely prevalence estimates for pathogens in food products are critical for evaluation of existing prevention policies and the development of new regulatory strategies FSIS estimates a 25 percent increase in the accuracy of existing performance measures as a result of the proposed increase in HACCP sampling In addition with the ability to conduct a third baseline study in 2011 FSIS will be able to expand its data collection efforts to cover E coli O157H7 in lamb and sheep or Salmonella prevalence in sows and boars
Meat amp Poultry Slaughter Volume Inspected
60
55
50
45
Meat 40
Poultry
35
30
Fiscal Year
Combating Foodborne Illness FSIS is instrumental in helping reduce the level of foodborne illness by targeting common and dangerous pathogens for control In addition to its work ensuring safe and wholesome products are available to the consumer FSIS also conducts public education campaigns to inform consumers about safe food handling methods to decrease the likelihood of foodborne illness from products that were improperly stored handled andor prepared As part of the FSWG FSIS will conduct consumer focus group studies to measure consumer understanding of labeling and other public health messaging and develop new outreach and education strategies based on the results Also as part of the FSWG FSIS will collaborate with FDA to establish a preventative health campaign to increase outreach to clinicians public health professionals and consumers on actions to reduce the risk of foodborne illness
With the funding requested for 2011 FSIS expects to achieve the following performance measures
Bill
ions
of P
ound
s
00 01 02 03 04 05 06 07 08 09
82
Key Performance Measure Overall public exposure to Salmonella from broiler carcasses1
2006
45
2007
73
2008
83
2009
82 in Category
1
2010
90 in Category
1
2011
92 in Category
1
Total illnesses from all FSIS Regulated Products 645609 436343 380259 324175 268092 265411
Percent of establishments with a functional food defense plan2
Large Establishments Small Establishments
Very Small Establishments
NA NA NA
91 53 21
96 64 25
96 64 25
96 69 37
96 74 48
FOOD SAFETY
1The figures represent the proportion of establishments whose two most recent Salmonella test results are equal to or less than 50 percent of the FSIS performance standard for the product class These are the Category 1 establishments considered to have consistent process control As more establishments reach Category 1 status it is expected that fewer people will be exposed to Salmonella from classes of raw products regulated by FSIS
2Food Defense plans are written procedures that food processing establishments should follow to protect the food supply from intentional contamination with chemicals biological agents or other harmful substances Large establishments (ge500 employees) Small establishments (le 499 employees but gt 10) Very Small Establishments (lt10 employees or lt $25 million in annual sales)
FSIS continues to make improvements in its food safety policies and inspection of meat poultry and processed egg products For example FSIS implemented its new bench trim sampling program for E coli O157H7 to detect the pathogen with greater confidence in ground beef FSIS has also developed new pathogen reduction performance standards for control of Salmonella and Campylobacter bacteria in response to recommendations of the Presidents FSWG The goal set by FSIS is to have 90 percent of establishments meeting the new Salmonella standards by the end of calendar year 2010 Similarly FSIS will also post on its Web site compliance guidelines for poultry slaughter establishments including additional pre-harvest recommendations for controlling Salmonella and Campylobacter in poultry To measure the success of these food safety programs FSIS is collaborating with FDA and other FSWG members to develop performance metrics so that all the Federal agencies are consistently measuring success of their food safety programs
The 2008 Farm Bill made several amendments to statutes administered by FSIS and gave the agency other instructions As a result FSIS is developing new regulations to implement mandatory inspection for catfish a program for interstate shipment of State-inspected meat and poultry products requirements that would apply to inspected establishments for recall procedures for documenting process control (HACCP plan) reassessments and for notifying FSIS if they have reason to believe adulterated or misbranded product is in commerce Given the investment to date and the need for considerable stakeholder engagement and regulatory development before the adoption and implementation of a catfish inspection program a decrease
83
FOOD SAFETY
of $103 million from 2010 levels is proposed in the budget for catfish-related activities A level of $5 million for the program is adequate to meet inspection needs in 2011
User Fees and Trust Funds In 2011 FSIS estimates it will collect $131 million through existing user fee and trust fund activities for providing overtime holiday and voluntary inspection services Separately FSIS will submit legislative proposals that would permit two additional user fees in 2011 a user fee that would be collected from plants that have sample failures or require additional inspection activities stemming from a pattern of regulatory non-compliance and a Facility Application and Annual Renewal Activities user fee to cover the increased costs of services above and beyond basic inspection services provided to meat poultry or processed egg products establishments including those services related to compliance risk assessments hazard analyses inspection planning and inspections compliance review and enforcement information technology support product sampling and risk communication Total collections from these proposals are estimated at $4 million and $86 million respectively
84
NATURAL RESOURCES AND ENVIRONMENT
9
Discretionary Programs EQIP
MISSION AND RELATIONSHIP TO STRATEGIC GOALS
A healthy and prosperous America relies on the health of our natural resources and particularly our forests and agricultural working lands The health of Americarsquos 193 million acres of National forests and grasslands and 13 billion acres of farm ranch and private forest lands must be nurtured so that they continue to offer environmental benefits as a source of clean air clean and abundant water and wildlife habitat Americarsquos forests supply communities with clean abundant water shelter wildlife and help us mitigate and adapt to climate change Forests also help generate rural wealth through recreation and tourism through the creation of green jobs and through the production of wood products and energy They are a source of cultural heritage and are a national treasure
The mission of the Natural Resources and Environment area is to promote the conservation and sustainable use of natural resources on the Nations private lands and to sustain production of all the goods and services that the public demands of the national forests The mission area includes two agencies the Natural Resources Conservation Service (NRCS) and the Forest Service (FS)
The two agencies are the primary contributors to achieving the Strategic Goal that ensures our National Forests and private working lands are conserved restored and made more resilient to climate change while enhancing water resources This is accomplished through a variety of programs aimed at preserving and restoring our public and private lands protecting our water resources mitigating the effects of climate change and reducing the risk from catastrophic wildfires NRCS partners with state and local government agencies and private landowners and provides technical and financial assistance to help protect farm and ranch lands and private forestland FS oversees the management of the National Forest System
The NRE mission area primarily through NRCS also has responsibility for implementing most of the Conservation Title of the 2008 Farm Bill which in 2011 will enroll about 305 million acres at a total cost of about more than $3 billion
2011 Conservation Budget Total = $5952 Billion
Wetlands Reserve
All Other Conservation Mandatory
Reserve Programs 33 8
Conservation Stewardship
Programs 14
20 16
85
NATURAL RESOURCES AND ENVIRONMENT
Mill
ions
of A
cres
Farm Bill Conservation Programs Cumulative Acres Enrolled
350
300
250
200
704
267 413
314
564
302
183 23 368
237 346
338
347
75 35
361
204
1104 1312 1483 1652 1772 1897
925
All Other
150 CRP EQIP
100
50
0
2004 2005 2006 2007 2008 2009 2010 2011
86
NATURAL RESOURCES AND ENVIRONMENT
NATURAL RESOURCES CONSERVATION SERVICE (NRCS)
Budget Authority (Dollars in Millions)
2009 2010 2011 Program Enacted Estimate Budget
Discretionary Conservation Operations Conservation Technical Assistancehelliphelliphelliphelliphelliphelliphelliphelliphelliphelliphelliphellip $730 $762 $797 All Other Conservation Operations Programshelliphelliphelliphelliphelliphelliphelliphellip 123 126 127
Total Conservation Operationshelliphelliphelliphelliphelliphelliphelliphelliphelliphelliphelliphelliphellip 853 888 924 Watershed and Flood Prevention Operationshelliphelliphelliphelliphelliphelliphelliphelliphellip 24 30 0 Watershed Rehabilitation Programhelliphelliphelliphelliphelliphelliphelliphelliphelliphelliphelliphelliphellip 40 40 40 Resource Conservation and Developmenthelliphelliphelliphelliphelliphelliphelliphelliphelliphellip 51 51 0 Total Ongoing Discretionary Programshelliphelliphelliphelliphelliphelliphelliphelliphellip 968 1009 964
Recovery Act Watershed and Flood Prevention Operationshelliphelliphelliphelliphelliphelliphelliphelliphellip 290 0 0 Watershed Rehabilitation Programhelliphelliphelliphelliphelliphelliphelliphelliphelliphelliphelliphelliphellip 50 0 0 Total Recovery Act Programshelliphelliphelliphelliphelliphelliphelliphelliphelliphelliphelliphelliphellip 340 0 0 Total Discretionary Programshelliphelliphelliphelliphelliphelliphelliphelliphelliphelliphelliphelliphellip 1308 1009 964
Mandatory Farm Bill Programs Environmental Quality Incentives Programhelliphelliphelliphelliphelliphelliphelliphellip 1067 1180 1208 Wetlands Reserve Programhelliphelliphelliphelliphelliphelliphelliphelliphelliphelliphelliphelliphelliphelliphellip 436 613 502 Conservation Security Programhelliphelliphelliphelliphelliphelliphelliphelliphelliphelliphelliphellip 276 234 212 Conservation Stewardship Programhelliphelliphelliphelliphelliphelliphelliphelliphelliphelliphellip 9 469 629 Agricultural Water Enhancement Programhelliphelliphelliphelliphelliphelliphelliphellip 73 73 74 Farm and Ranch Lands Protection Programhelliphelliphelliphelliphelliphelliphelliphellip 121 150 160 Wildlife Habitat Incentives Programhelliphelliphelliphelliphelliphelliphelliphelliphelliphelliphellip 85 85 73 Grassland Reserve Programhelliphelliphelliphelliphelliphelliphelliphelliphelliphelliphelliphelliphelliphellip 48 101 79 Healthy Forest Reserve Programhelliphelliphelliphelliphelliphelliphelliphelliphelliphelliphelliphelliphellip 10 10 10 Chesapeake Bay Watershedhelliphelliphelliphelliphelliphelliphelliphelliphelliphelliphelliphelliphelliphelliphellip 23 43 72 Agricultural Management Assistance ahelliphelliphelliphelliphelliphelliphelliphelliphellip 15 15 10 Conservation Reserve Program Tech Assist (Reimb)helliphelliphelliphellip (56) (83) (124)
Total Farm Bill Programshelliphelliphelliphelliphelliphelliphelliphelliphelliphelliphelliphelliphelliphellip 2163 2973 3029
Total NRCS Programshelliphelliphelliphelliphelliphelliphelliphelliphelliphelliphelliphelliphelliphelliphelliphelliphellip $3471 $3982 $3993
a Total AMA program also includes funds provided to RMA and AMS
87
NATURAL RESOURCES AND ENVIRONMENT
The Presidentrsquos 2011 budget for NRCS strategically targets funding to high priority areas and effectively supports land conservation wildlife habitat improvement and wetland protection Funding is provided for conservation programs that focus on addressing the needs of priority landscapes in the most need of protection emphasize partnering with local constituents to efficiently implement programs and initiatives and contribute to efforts that address energy conservation renewable energy production and greenhouse gas emissions NRCS will continue to direct financial and technical assistance programs to land owners and users through the USDA Service Centers and through local conservation districts
Conservation Operations (CO) The 2011 budget proposes $924 million for CO which includes $797 million for conservation technical assistance (CTA) as well as $127 million for other CO activities including the Grazing Lands Conservation Initiative Soil Surveys Snow Surveys and Plant Materials Centers At this level the agency will continue to support locally-led cooperative conservation through the unique partnership that has been developed over the years with each conservation district and local stakeholders
The 2011 request for CTA includes an increase of $35 million over 2010 and a redirection of $374 million in Congressional earmarks This will enable NRCS to focus on the highest priority program areas such as improving and streamlining technical assistance delivery to farmers implementing Strategic Watershed Action Teams (SWAT) to target high priority watersheds in the most need of protection and updating the IT infrastructure or Common Computing Environment (CCE) Through CTA the budget projects that nearly 1300 comprehensive nutrient management plans will be applied 77 million will have conservation applied to improve soil quality and 146 million acres of grazing land and forest land will be protected as the result of conservation efforts The estimates reflect the initiative to focus activities on high priority watershed that provide the greatest environmental benefit
Key Performance Measure 2006 2007 2008 2009 2010 2011 CTA Comprehensive nutrient management plans applied (number of plans)
2269 1911 1745 1485 1300 1300
CTA Cropland with conservation applied to improve soil quality (millions of acres)
64 73 83 76 75 77
CTA Grazing land and forest land with conservation applied to protect and improve the resource base (millions of acres)
80 122 165 160 146 146
The budget includes $25 million for the SWAT initiative which will greatly increase the effectiveness of conservation programs Each SWAT will target an identified watershed for a period of 3 to 4 years with the intent of reaching 100 percent of the landowner base eligible for Farm Bill conservation program assistance The additive effect of planned and applied conservation practices would hasten environmental improvement while keeping production agriculture competitive and profitable
88
NATURAL RESOURCES AND ENVIRONMENT
The budget includes $35 million for NRCS to support the Departmentrsquos efforts to modernize and upgrade the CCE for the Service Center Agencies (SCAs) This funding will be used to replace outdated components of the CCE many of which have exceeded their expected life cycles reduce system vulnerabilities to failure and improve the performance and effectiveness of the shared infrastructure These improvements will allow the SCAs to better serve program participants with a more flexible and reliable IT infrastructure and enable the first system-wide refresh of the CCE since the infrastructure was implemented in 2000 In addition as the components of the CCE are replaced USDA will implement a right-sizing process whereby configuration changes will be made to better support the delivery of current and future programs As part of this process the Department will strive to improve system security reduce the long term cost of infrastructure services and improve service reliability Finally the CO budget includes a targeted fee proposal for conservation plans that is assumed to generate $19 million in revenue
Watershed and Flood Prevention Operations (WFPO) WFPO provides technical and financial assistance to local communities and sponsoring organizations to construct flood protection water supply and water quality improvement projects The 2011 budget proposes to terminate funding for this activity because earmarks prevent NRCS from prioritizing these projects on their merits and because benefits are highly localized and local sponsors are expected to assume a greater role in identifying and addressing water resource problems The Recovery Act provided $290 million in non-earmarked funds for this program in 2009 which supported over 195 projects representing more than 28000 acres in 36 States
Watershed Rehabilitation Program This program provides financial and technical assistance to communities for planning and financing the rehabilitation of Federally-constructed flood prevention dams that have reached the end of their design lives The budget includes $40 million in discretionary funds the same as 2010 for technical assistance to help local governments and private landowners plan the rehabilitation of those dams with the greatest potential for failure The Recovery Act provided $50 million for rehabilitation work in 2009 which supported more than two dozen projects in 11 States
Resource Conservation and Development (RCampD) As part of the Administrationrsquos continued commitment to fiscal responsibility the budget proposes to eliminate the RCampD program Begun in 1962 the program was intended to build community leadership skills through the establishment of RCampD councils that would access Federal State and local programs for the communityrsquos benefit After 47 years the program has matured to the point that this goal has been accomplished RCampD councils have developed sufficiently strong State and local ties to secure funding for their continued operation without Federal assistance A number of alternatives to RCampD support also exist including the use of other Federal State and local programs and existing avenues such as those provided through State Technical Committees
Environmental Quality Incentives Program (EQIP) The purpose of EQIP is to provide assistance to landowners who face serious natural resource challenges that impact soil water and related natural resources including grazing lands wetlands and wildlife habitat The 2011 budget proposes $12 billion for EQIP an increase of $28 million over 2010 This would enable nearly 43000 new contracts to participate in the program and would cover more than
89
NATURAL RESOURCES AND ENVIRONMENT
142 million acres The program will continue to emphasize land management practices such as the application of comprehensive nutrient management plans Consistent with the initiative to focus efforts in high priority areas EQIP enrollment acres are expected to fall due to targeting acres with the highest conservation benefit These acres often are relatively smaller farms Despite this reduction in acreage enrollment NRCS anticipates being able to maintain its key performance measures for EQIP (see table below) The Agricultural Water Enhancement Program (AWEP) which is operated under EQIP is funded at $74 million about $1 million more than the 2010 level AWEP promotes the conservation of ground and surface water and the improvement of water quality
EQIP Key Performance Measure 2006 2007 2008 2009 2010 2011 Comprehensive nutrient management plans applied (number of plans) 2774 2490 2520 2019 2000 2000
Cropland with conservation applied to improve soil quality (millions of acres)
34 53 56 48 50 50
Grazing land and forest land with conservation applied to protect and improve the resource base (millions of acres)
122 165 169 172 15 15
Chesapeake Bay Watershed Initiative The Chesapeake Bay Watershed Initiative provides producers conservation assistance through several USDA programs and is funded at $72 million or nearly $29 million more than the 2010 level This program helps agricultural producers improve water quality and quantity and restore enhance and preserve soil air and related resources in the Chesapeake Bay watershed through the implementation of conservation practices
Wetlands Reserve Program (WRP) WRP is a voluntary program in which landowners are paid to retire cropland from agricultural production if those lands are restored to wetlands and protected in most cases with a long-term or permanent easement Landowners receive fair market value for the land and are provided with cost-share assistance to cover the restoration expenses The 2008 Farm Bill authorized the program to enroll up to 3041200 acres through the end of fiscal year 2012 During 2009 funding was provided for WRP to enroll approximately 179000 acres and funding for 2010 allows for up to 250000 acres The 2011 budget request includes $502 million to enroll 192982 acres in 2011 During 2011 it is expected that 140000 acres of wetlands will be created restored or enhanced
Key Performance Measure 2006 2007 2008 2009 2010 2011
WRP Wetlands created 181979 149330 128860 106379 125000 140000restored or enhanced (acres)
90
NATURAL RESOURCES AND ENVIRONMENT
Conservation Security Program The Conservation Security Program was established in the 2002 Farm Bill and is a voluntary program that provides financial and technical assistance on Tribal and private agricultural working lands to support ongoing conservation stewardship The program provides payments to producers who maintain and enhance the condition of natural resources The program was not reauthorized in the 2008 Farm Bill The budget includes $212 million for the Conservation Security Program in 2011 in order to service existing contracts
Conservation Stewardship Program The 2008 Farm Bill replaced the Conservation Security Program with a new Conservation Stewardship Program which is distinguished from the old program in that it encourages participants to undertake new conservation activities in addition to maintaining and managing existing conservation activities Also the new program operates under an annual acreage limitation rather than a funding cap The budget proposes $629 million an increase of $160 million from 2010 for the program to enroll 12 million acres during 2011
Farm and Ranch Lands Protection Program (FRPP) Through this program the Federal Government facilitates and provides funding for the purchase of conservation easements or other interests in land for the purpose of protecting agricultural use and related conservation values by limiting nonagricultural uses of the land FRPP is carried out through existing State Tribal and local governments non-governmental organizations and local farmland protection programs The Farm and Ranch Lands Protection Program is funded at $160 million in 2011 an increase of $10 million over 2010 For 2011 NRCS has set a target to protect 45000 prime unique or important farmland acres from conversion via FRPP
Key Performance Measure 2006 2007 2008 2009 2010 2011
FRPP Prime unique or important farmland protected from conversion to non-agricultural uses by conservation easements acres
46909 38495 27401 38260 40000 45000
Wildlife Habitat Incentives Program (WHIP) The program provides financial and technical assistance to eligible participants to develop habitats for upland wildlife wetland wildlife threatened and endangered species and fish and other types of wildlife The purpose of the program is to create needed wildlife habitat that supports wildlife populations with local State and national significance The budget proposes funding for WHIP at $73 million in 2011 a reduction of $12 million from 2010 Although funding is reduced the Agency has established an ambitious goal for WHIP to contribute to the improvement of 400000 acres of non-Federal land for fish and wildlife habitat during 2011
91
NATURAL RESOURCES AND ENVIRONMENT
Key Performance Measure 2006 2007 2008 2009 2010 2011
WHIP Non-Federal land with conservation applied to improve 175543 388769 316896 335402 350000 400000 fish and wildlife habitat quality acres
Grasslands Reserve Program (GRP) GRP was authorized in the 2002 Farm Bill as a voluntary program to help landowners and operators restore and protect grassland including rangeland pastureland and certain other lands while maintaining the landsrsquo suitability for grazing Participants can enroll acreage in rental agreements with varying lengths or in long-term or permanent easements The program is jointly administered by NRCS and the Farm Service Agency (FSA) which has lead responsibility for rental agreement administration and financial activities NRCS has lead responsibility for technical issues and easement administration The program was initiated in 2003 and reached its statutory funding limit of $254 million in 2007 However the 2008 Farm Bill reauthorized the program for 2009-2012 and capped it at 12 million additional acres GRP is funded at $79 million for 2011 to enroll an additional 245830 acres
Conservation Reserve Program Technical Assistance NRCS provides technical support including land eligibility determinations conservation planning and practice implementation for the Conservation Reserve Program (CRP) The 2011 budget includes $124 million for CRP technical assistance CRP is administered by FSA The program status for 2011 is described on page 34
92
FOREST SERVICE (FS) Budget Authority
(Dollars in Millions) 2009 2010 2011
Program Enacted Estimate Estimate
NATURAL RESOURCES AND ENVIRONMENT
Discretionary Accounts Forest and Rangeland Researchhelliphelliphelliphelliphelliphelliphelliphelliphelliphelliphelliphelliphellip $296 $312 $304 State and Private Forestryhelliphelliphelliphelliphelliphelliphelliphelliphelliphelliphelliphelliphelliphelliphellip 266 308 322 National Forest System Integrated Resource Restoration Priority Watersheds and Job Stabilizationhelliphelliphelliphelliphelliphelliphellip 0 0 50 Collaborative Forest Landscape Restoration Fund ahelliphelliphellip 0 0 40 Restoration and Management of Ecosystemshelliphelliphelliphelliphelliphellip 652 668 604
Total Integrated Resource Restorationhelliphelliphelliphelliphelliphelliphellip 652 668 694 Recreation Heritage and Wildernesshelliphelliphelliphelliphelliphelliphelliphelliphelliphellip 278 285 293
Other NFS Activitieshelliphelliphelliphelliphelliphelliphelliphelliphelliphelliphelliphelliphelliphelliphelliphellip 580 598 599 Total NFShelliphelliphelliphelliphelliphelliphelliphelliphelliphelliphelliphelliphelliphelliphelliphelliphelliphelliphellip 1510 1551 1586 Wildland Fire Activities Preparednesshelliphelliphelliphelliphelliphelliphelliphelliphelliphelliphelliphelliphelliphelliphelliphelliphelliphelliphellip 675 675 1008 Suppression Suppression Activitieshelliphelliphelliphelliphelliphelliphelliphelliphelliphelliphelliphelliphelliphelliphellip 994 923 595 FLAME Fundhelliphelliphelliphelliphelliphelliphelliphelliphelliphelliphelliphelliphelliphelliphelliphelliphelliphellip 0 413 291 Wildland Fire Contingency Reservehelliphelliphelliphelliphelliphelliphelliphelliphellip 0 0 282
Total Suppressionhelliphelliphelliphelliphelliphelliphelliphelliphelliphelliphelliphelliphelliphelliphellip 994 1336 1168 Hazardous Fuels Reduction ahelliphelliphelliphelliphelliphelliphelliphelliphelliphelliphelliphelliphellip 328 340 349 Other Fire Operationshelliphelliphelliphelliphelliphelliphelliphelliphelliphelliphelliphelliphelliphelliphelliphellip 135 166 120 Total Wildland Fire Activitieshelliphelliphelliphelliphelliphelliphelliphelliphelliphelliphellip 2132 2517 2645 Capital Improvement and Maintenancehelliphelliphelliphelliphelliphelliphelliphelliphelliphellip 495 556 438 Land Acquisitionhelliphelliphelliphelliphelliphelliphelliphelliphelliphelliphelliphelliphelliphelliphelliphelliphelliphellip 51 65 75 Other Accountshelliphelliphelliphelliphelliphelliphelliphelliphelliphelliphelliphelliphelliphelliphelliphelliphelliphelliphellip 9 6 6 Subtotal Ongoing Discretionary helliphelliphelliphelliphelliphelliphelliphelliphelliphellip 4759 5315 5377
Emergency Supplemental Funding and Repaymentshelliphelliphelliphellip 200 0 0 Recovery Act
Capital Improvement and Maintenancehelliphelliphelliphelliphelliphelliphelliphelliphellip 650 0 0 Wildland Fire Managementhelliphelliphelliphelliphelliphelliphelliphelliphelliphelliphelliphelliphellip 500 0 0
Total Recovery Act Programshelliphelliphelliphelliphelliphelliphelliphelliphelliphelliphellip 1150 0 0 Total Discretionary helliphelliphelliphelliphelliphelliphelliphelliphelliphelliphelliphelliphelliphelliphellip $6109 $5315 $5377
a $10 million available for Collaborative Forest Landscape Restoration Fund from Hazardous Fuels Reduction in 2010
93
NATURAL RESOURCES AND ENVIRONMENT
Capital Improvement amp
Land Acquisition 1
All Other 13
Wildland Fire Management
43
Budget Authority (Dollars in Millions)
2009 2010 2011 Program Enacted Estimate Estimate
Mandatory Programs Permanent Appropriationshelliphelliphelliphelliphelliphelliphelliphelliphelliphelliphelliphelliphelliphellip $361 $349 $316 Secure Rural Schoolshelliphelliphelliphelliphelliphelliphelliphelliphelliphelliphelliphelliphelliphelliphelliphellip 395 387 348 Trust Fundshelliphelliphelliphelliphelliphelliphelliphelliphelliphelliphelliphelliphelliphelliphelliphelliphelliphelliphelliphellip 238 100 104
Total Mandatoryhelliphelliphelliphelliphelliphelliphelliphelliphelliphelliphelliphelliphelliphelliphelliphellip 994 836 768
Total Forest Service Budget Authorityhelliphelliphelliphelliphelliphelliphelliphellip $7103 $6151 $6145
2011 Forest Service Budget Authority Total = $61 Billion
National Forest System 26
State amp Private Forestry 5
Forest and Rangeland Research
5
Maintenance 7
The Forest Service (FS) with over 30000 staff years is the largest employer in USDA For 2011 the total request for FS ongoing discretionary activities is $54 billion an increase of $79 million over 2010 This budget will restore landscapes improve water quality reduce greenhouse gas emissions implement travel management plans and create green jobs Through targeted administrative savings in the Agencyrsquos cost pools FS will shift $52 million in administrative expenditures to programs Specifically $32 million of efficiencies in information technology and business processes will be borne by employing a centralized data center and other administrative service savings and a new automated contracting system for pre-suppression fire activities will generate $10 million in information technology savings A new automated Human Capital Management system will increase FSrsquo efficiency in handling worker claims by $10 million
94
NATURAL RESOURCES AND ENVIRONMENT
Forest and Rangeland Research For 2011 $304 million is proposed for Forest and Rangeland Research FS maintains the worlds largest forest research organization While its broad mission is to develop knowledge and technology needed to enhance the economic and environmental values of all of the Nations forests the program also supports the specific research needs that arise from managing the National Forest System (NFS) For example FS is using tools developed by this program to evaluate potential fire growth values at risk and cost-efficiency of firefighting on large wildland fire events The budget provides for the completion of a nation-wide comprehensive carbon inventory
State and Private Forestry (SampPF) Through SampPF programs FS addresses forest health concerns on Federal State and private lands A small decrease in Cooperative Fire funding is requested because in FY2011 assistance in preparing for wildfires will be focused to States and local governments that have established standards so that firefighters will be able to defend their communities safely For 2011 total funding for SampPF programs is proposed at $322 million an increase of $14 million above the 2010 level In line with the Presidentrsquos commitment to fully fund the Land and Water Conservation Fund by 2014 a $21 million increase is proposed in the Forest Legacy programmdasha program that cost-shares the purchase of conservation easements to protect nationally prioritized forest lands from development An increase of $1 million is also proposed for the creation of a Community Forest amp Open Space Conservation program to cost share fee-simple purchases of land as authorized by the 2008 Farm Bill The budget proposes an increase of $2 million to implement a competitive cost-share program for the strategic planting of trees for greenhouse gas reduction efforts in urban areas
National Forest System (NFS) FS manages over 193 million acres of public land in 44 States Puerto Rico and the Virgin Islands These lands known collectively as the NFS are managed for multiple uses on a sustained-use basis For 2011 total funding for NFS is proposed at approximately $16 billion a $35 million increase from the 2010 level The Agency has placed a focus on restoring forests for the benefit of watersheds forest health climate and vibrant local economies
bull The budget proposes a new line item ldquoIntegrated Resource Restorationrdquo which combines the Vegetation amp Watershed Management Wildlife amp Fisheries Habitat Management and Forest Products into a single line item This new line item better characterizes the scope of the work that the Agency intends to perform in 2011 Addressing the forest health crisis and restoring our forests will require integrating traditional timber management with other stewardship activities Indeed restoring our forests is not possible without a vibrant forestry sector This new line item will integrate timber management forest restoration biomass production and other stewardship activities on National Forest System lands and will support similar activities funded from other sources on adjacent Federal State and tribal lands This new line item is funded at $694 million which is an increase of $26 million above 2010
bull Within the Integrated Resource Restoration budget line item $40 million is provided for the Collaborative Forest Landscape Restoration Fund This fund will be used for ecological treatments authorized by the Forest Landscape Restoration Act of 2009 contributing to significantly improving watershed conditions creating landscapes that are
95
NATURAL RESOURCES AND ENVIRONMENT
more resilient to climate change and reducing fire risk These funds will be leveraged with local and private resources magnifying the benefits of Federal funding across forest landscapes
bull Within the Integrated Resource Restoration budget line item $50 million is provided for the new Priority Watersheds and Job Stabilization initiative Under this initiative watershed assessments will be conducted of all NFS lands integrating State forest resource assessments into the process Further the agency will use diverse stakeholder groups to prioritize watershed improvement work and a science-based monitoring program will be established to demonstrate a change in watershed condition
bull An increase of $5 million in Recreation is provided for implementation of the Agencyrsquos motor-vehicle-use maps developed as part of its travel management planning process
Wildland Fire Activities Through the Wildland Fire Activities FS protects life property and natural resources on NFS land and an additional 20 million acres on adjacent State and private lands through fee or reciprocal protection agreements For 2011 total funding for these activities is proposed at $26 billion which represents an increase of $128 million above the 2010 level As directed in the 2010 Interior Appropriations conference report to improve transparency FS realigned its suppression and preparedness costs resulting in $333 million being shifted from Suppression to Preparedness Funds are provided in fire preparedness for a minimum of 10480 firefighters The Wildland Fire budget contains $595 million for suppression activities $291 million for the FLAME fund for large-fire suppression activities and $282 million for a contingency reserve which would be used if suppression funds are exhausted In 2011 the agency will allocate $349 million for fuels reduction projects using a clear and accountable method for prioritizing potential projects that will be developed over the next three months The budget provides $15 million for the Forest Biomass for Energy Program and $5 million for the Community Wood Energy Program as authorized by the 2008 Farm Bill
96
NATURAL RESOURCES AND ENVIRONMENT
Key Performance Measure 2006 2007 2008 2009 2010 2011
Percentage of total National Forest System land base for which fire risk is reduced
11 19 21 30 30 31
through movement to a better condition class
Acres of WUI fuels treated to reduce the risk of
1590 1654 1940 1740 1470 1600
catastrophic fire
Percentage of acres treated in the WUI that have been
17 25 36 28 41 75
identified in Community Wildfire Protection Plans
Capital Improvement and Maintenance Capital Improvement and Maintenance funds construction maintenance and decommissioning of buildings recreation sites facilities roads and trails For 2011 total funding for these programs is proposed at $438 million which represents a decrease of $100 million from 2010 Most of the reduction comes from a reduction in funding for Roads activities While $168 million is provided for road maintenance and decommissioning no funding is provided for new road construction or upgrades to existing roads Roads funds will be focused on ldquoright-sizingrdquo the FS road system The budget provides $50 million for the Legacy Roads and Trails program
Land Acquisition The Land Acquisition program protects resources decreases administrative costs and increases visitor access to the National Forests and Grasslands by acquiring parcels of land for inclusion in the NFS For 2011 the budget proposes $75 million in total funding for this program The $10 million increase from 2010 reflects progress toward the Presidentrsquos goal of fully funding the Land and Water Conservation Fund by 2014 In 2011 FS will nationally prioritize the parcels it is considering for acquisition in a manner similar to the Forest Legacy program
97
MARKETING AND REGULATORY PROGRAMS
MISSION AND RELATIONSHIP TO STRATEGIC GOALS
2011 MRP Discretionary Budget Authority Total = $1019 Billion
AMS 10
APHIS 86
GIPSA 4
The economic vitality and quality of life in rural America and the US economy at large depends on a competitive efficient and productive agricultural system US agricultural producers are not simply farmers and ranchers they are often small business owners trying to survive and support their families and rural communities in a challenging global technologically advanced and competitive business environment In an era of market consolidation and intense competition these producers rely on fair and open access to markets and control over their decisions to thrive Agricultural producers also need to safeguard animal and plant resources against the introduction of foreign agricultural pests and diseases
The mission of Marketing and Regulatory Programs (MRP) is to facilitate and expand the domestic and international marketing of US agricultural products to help protect the agricultural sector from plant and animal health threats and to ensure humane care and treatment of certain animals These programs provide the basic infrastructure to improve agricultural market competitiveness for the overall benefit of both consumers and producers of American agriculture Thus the mission area contributes to all of USDArsquos Strategic Goals
USDA also plays a critical role in increasing prosperity and sustainability in our Nationrsquos agricultural system and rural communities Among other efforts MRP uses oversight activities to protect producers from unfair competition and unfair business practices and working with the Department of Justice MRP helps prevent anti-competitive behaviors across the agribusiness sector MRP also assists producers in management and marketing by providing market trend analysis and business and marketing tools This assistance includes developing and overseeing national standards for the production and handling of agricultural products labeled as organic in the National Organic Program among other items MRP programs also help increase the competitiveness of the agricultural sector by enhancing protection of the Nationrsquos agriculture from pests and diseases and increase the efficiency of production and domestic and international marketing of US commodities
98
MARKETING AND REGULATORY PROGRAMS
The Marketing and Regulatory Programs are administered by three agencies the Animal and Plant Health Inspection Service (APHIS) the Agricultural Marketing Service (AMS) and the Grain Inspection Packers and Stockyards Administration (GIPSA)
99
MARKETING AND REGULATORY PROGRAMS
ANIMAL AND PLANT HEALTH INSPECTION SERVICE (APHIS)
Budget Authority (Dollars in Millions)
2009 2010 2011 Program Enacted Estimate Budget
Discretionary Pest and Disease Exclusion Agricultural Quarantine Inspection (AQI) Appropriated helliphelliphelliphelliphelliphelliphelliphelliphelliphelliphelliphelliphelliphelliphelliphelliphelliphelliphellip $27 $29 $27 Fruit Fly Exclusion and Detectionhelliphelliphelliphelliphelliphelliphelliphelliphelliphelliphelliphellip 62 63 64 Overseas Technical and Trade Operationshelliphelliphelliphelliphelliphelliphelliphelliphellip 16 16 17 All Other Pest and Disease Exclusionhelliphelliphelliphelliphelliphelliphelliphelliphelliphelliphellip 55 59 51
Total Pest and Disease Exclusionhelliphelliphelliphelliphelliphelliphelliphelliphelliphelliphellip 160 167 159 Plant and Animal Health Monitoring Animal Health Monitoring and Surveillancehelliphelliphelliphelliphelliphelliphelliphellip 129 122 129 Animal and Plant Health Regulatory Enforcementhelliphelliphelliphelliphelliphelliphelliphelliphelliphelliphelliphelliphelliphelliphelliphelliphelliphelliphelliphellip 14 14 14 Avian Influenza helliphelliphelliphelliphelliphelliphelliphelliphelliphelliphelliphelliphelliphelliphelliphelliphelliphelliphellip 61 60 53 Emergency Management Systemshelliphelliphelliphelliphelliphelliphelliphelliphelliphelliphelliphellip 16 16 16 Pest Detectionhelliphelliphelliphelliphelliphelliphelliphelliphelliphelliphelliphelliphelliphelliphelliphelliphelliphelliphelliphellip 28 28 27 All Other Plant and Animal Health Monitoringhelliphelliphelliphelliphelliphelliphellip 8 9 8
Total Plant and Animal Health Monitoringhelliphelliphelliphelliphelliphelliphellip 256 249 247 Pest and Disease Management Emerging Plant Pestshelliphelliphelliphelliphelliphelliphelliphelliphelliphelliphelliphelliphelliphelliphelliphelliphellip 134 159 158 Wildlife Services Operationshelliphelliphelliphelliphelliphelliphelliphelliphelliphelliphelliphelliphelliphellip 76 78 71 All Other Pest and Disease Managementhelliphelliphelliphelliphelliphelliphelliphelliphellip 135 132 107
Total Pest and Disease Managementhelliphelliphelliphelliphelliphelliphelliphelliphelliphellip 345 369 336 Animal Carehelliphelliphelliphelliphelliphelliphelliphelliphelliphelliphelliphelliphelliphelliphelliphelliphelliphelliphelliphelliphellip 22 22 23 Biotechnology Regulatory Serviceshelliphelliphelliphelliphelliphelliphelliphelliphelliphelliphelliphellip 13 13 19 Veterinary Biologics and Diagnosticshelliphelliphelliphelliphelliphelliphelliphelliphelliphelliphellip 41 43 47 Other Scientific and Technical Serviceshelliphelliphelliphelliphelliphelliphelliphelliphelliphellip 30 32 29 PhysicalOperational Securityhelliphelliphelliphelliphelliphelliphelliphelliphelliphelliphelliphelliphelliphellip 6 6 6 Information Technology Infrastructurehelliphelliphelliphelliphelliphelliphelliphelliphelliphelliphellip 4 4 4 Total Salaries and Expenseshelliphelliphelliphelliphelliphelliphelliphelliphelliphelliphelliphelliphellip 877 905 870 Buildings and Facilitieshelliphelliphelliphelliphelliphelliphelliphelliphelliphelliphelliphelliphelliphelliphelliphelliphellip 5 5 5
Total Ongoing Activitieshelliphelliphelliphelliphelliphelliphelliphelliphelliphelliphelliphelliphelliphellip 881 910 875 Emergency Funding (CCC)helliphelliphelliphelliphelliphelliphelliphelliphelliphelliphelliphelliphelliphelliphellip 29 28 0
Total APHIS Discretionary Programshelliphelliphelliphelliphelliphelliphelliphelliphelliphelliphellip $910 $938 $875
100
MARKETING AND REGULATORY PROGRAMS
(Dollars in Millions)
2009 2010 2011 Program Enacted Estimate Budget
Mandatory Agricultural Quarantine Inspection (AQI) Fees ahelliphelliphelliphelliphelliphellip $147 $186 $190 Trust Fundshelliphelliphelliphelliphelliphelliphelliphelliphelliphelliphelliphelliphelliphelliphelliphelliphelliphelliphelliphelliphellip 17 14 14 Farm Bill
National Clean Plant Networkhelliphelliphelliphelliphelliphelliphelliphelliphelliphelliphelliphelliphellip 5 5 5 Plant Pest and Disease Managementhelliphelliphelliphelliphelliphelliphelliphelliphelliphelliphellip 12 45 50
Total Farm Bill Programshelliphelliphelliphelliphelliphelliphelliphelliphelliphelliphelliphelliphelliphellip 17 50 55 Total Mandatory Programshelliphelliphelliphelliphelliphelliphelliphelliphelliphelliphelliphelliphellip 181 250 259 Total APHIS Programshelliphelliphelliphelliphelliphelliphelliphelliphelliphelliphelliphelliphelliphellip $1091 $1188 $1134
a Total estimated collections are $498 million in 2010 and $508 million in 2011 Of the total $312 million and $318 million are transferred to the Department of Homeland Security in 2010 and 2011 respectively
APHIS works cooperatively with State and local agencies private groups and foreign governments to protect the safety of the Nationrsquos agriculture
The 2011 budget proposes an appropriation of about $875 million of which approximately $870 million is for salaries and expenses and about $5 million for buildings and facilities This total is a net decrease of about $35 million compared to 2010 In general the budget proposes a reallocation of resources from programs that have achieved success (eg cotton pests and screwworm) and for those which progress in eradication is not deemed feasible at this time (eg emerald ash borer) to those efforts where success in eradication may be feasible (eg Asian long-horned beetle and light brown apple moth) The budget also proposes the elimination of earmarks
APHIS supports the Departmentrsquos strategic goal to ensure children have access to safe nutritious and balanced meals Specifically APHIS and other agencies protect agricultural health by minimizing major diseases and pests This outcome is measured as the value of damage prevented and mitigated annually as a result of APHIS activities The measure indicates a decrease between fiscal years 2008 and 2009 as a result of the declining economyrsquos impact on the value of the commodities that are protected by these efforts
Key Performance Measure 2006 2007 2008 2009 2010 2011 Value of damage prevented and mitigated annually as a result of selected plant and animal health monitoring and surveillance efforts
NA 137 138 105 107 111
($ billions)
101
MARKETING AND REGULATORY PROGRAMS
Pest and Disease Exclusion The 2011 budget includes discretionary appropriations of $159 million for pest and disease exclusion The budget includes an increase of $09 million above the 2010 level to cover costs associated with the Foreign Service Pay Modernization Initiative and assist developing countries in strengthening their regulatory capacity to detect and address pests and diseases In recent years APHIS has been successful in driving the screwworm south The budget includes a decrease of $75 million below the 2010 level due to the full operation of a new sterile screwworm production facility closer to the present range of the screwworm In addition to discretionary funding APHIS collects user fees to provide technical support related to agricultural quarantine and inspections that occur at ports of entry These collections are shared with the Department of Homeland Securityrsquos Customs and Border Protection APHIS plans to retain $190 million in 2011
Plant and Animal Health Monitoring The budget requests $247 million for plant and animal health monitoring and surveillance In 2009 USDA collected stakeholder views on the National Animal Identification System (NAIS) through a variety of mechanisms (eg official Federal Registered-announced comment periods focus groups ongoing stakeholder input) This input will be used to revise the NAIS to better meet the needs of the animal agriculture community The requested $142 million will be essential in implementing an improved traceability system The budget requests a net reduction of about $7 million from the Avian Influenza line item due in part to having completed the stockpile of emergency response equipment and supplies The revised level of funding would continue to protect avian health
Pest and Disease Management Programs APHIS provides technical and financial support to help control or eradicate a variety of agricultural health threats This support is provided to various stakeholders ranging from individuals to States The 2011 budget requests $336 million for pest and disease management efforts This includes an increase of $16 million to address the Asian longhorned beetle in Massachusetts This also includes an increase of $10 million to continue efforts initiated with emergency funding to address the light brown apple moth The budget includes a decrease of about $14 million to account for successes in reducing acreage infested with boll weevil and pink bollworm Boll weevil eradication is projected by the end of fiscal year 2010 and the pink bollworm is projected to be eradicated by the end of fiscal year 2012 The budget includes a decrease of about $24 million within the emerald ash borer (EAB) program due to the limited eradication methods available and the need to devote limited resources to other pests where the likelihood of success is greater Due to these limited eradication methods APHIS will pursue a control strategy to minimize the current spread of the pest APHIS will continue survey work for EAB under a management strategy but not the costly tree removal that has been the center of the eradication strategy Tree removal has been ineffective at slowing the spread of EAB Methods development work will continue in 2011 with the possibility of developing an effective means of slowing and reversing the spread of this pest To combat any sudden urgent and unforeseen pest and disease outbreaks the Secretary retains authority to transfer funds from the CCC or other USDA accounts
Animal Care The 2011 budget proposes $23 million for Animal Welfare Act activities which is approximately the same as 2010 The budget requests $09 million for Horse Protection Act activities APHIS will submit legislative proposals to authorize the annual collection of about $12 million in user fees for Animal Welfare activities As recipients of Animal Welfare permits
102
MARKETING AND REGULATORY PROGRAMS
are the direct beneficiaries of animal welfare inspections the proposed user fee will place the cost of providing these services on the recipient rather than the US taxpayer
Scientific and Technical Services Within USDA APHIS has chief regulatory oversight of genetically modified organisms APHIS also develops methods and provides diagnostic support to prevent detect control and eradicate agricultural health threats APHIS as well works to prevent ineffective or harmful animal biologics (eg vaccines) from being marketed In addition APHIS provides Federal leadership in developing methods to address wildlife conflicts Several of these activities have been funded by earmarks which are eliminated in the 2011 budget The budget includes about $19 million an increase of about $6 million for Biotechnology Regulatory Services to assess the risk of genetically modified organisms As the number and complexity of proposed biotechnology products increase additional staff will be required to provide sufficient review This increase supports the Departmental priority of helping promote agricultural production and biotechnology exports by increasing the number of genetically engineered plant lines that are found to be safe by APHIS Finally APHIS will submit legislative proposals to authorize the annual collection of about $5 million in user fees for Biotechnology Regulatory Services activities and about $9 million in user fees for Veterinary Biologics activities As recipients of biotechnology permits and biologics licenses are the direct beneficiaries of many of the services provided by the respective division of APHIS the proposed user fee will place the cost of providing these services on the recipient rather than the US taxpayer
Key Performance Measure 2006 2007 2008 2009 2010 2011 Cumulative number of genetically engineered plant lines reviewed by USDA and found safe for use in the environment 70 73 78 80 85 100
Buildings and Facilities The budget requests $5 million for general repairs and maintenance of APHIS buildings This amount will be used for critical repairs at APHIS facilities
103
MARKETING AND REGULATORY PROGRAMS
AGRICULTURAL MARKETING SERVICE (AMS)
Budget Authority (Dollars in Millions)
2009 2010 2011 Program Enacted Estimate Budget
Discretionary Marketing Services Market Newshelliphelliphelliphelliphelliphelliphelliphelliphelliphelliphelliphelliphelliphelliphelliphelliphelliphelliphelliphelliphelliphelliphelliphellip $33 $34 $35 Egg Surveillance and Standardizationhelliphelliphelliphelliphelliphelliphelliphelliphelliphelliphelliphelliphelliphellip 8 8 8 Market Protection and Promotionhelliphelliphelliphelliphelliphelliphelliphelliphelliphelliphelliphelliphelliphelliphelliphellip 40 43 47 Wholesale Farmers and Alternative Market Developmenthelliphelliphelliphelliphelliphellip 3 3 4 Transportation Serviceshelliphelliphelliphelliphelliphelliphelliphelliphelliphelliphelliphelliphelliphelliphelliphelliphelliphelliphelliphellip 3 3 3
Total Marketing Serviceshelliphelliphelliphelliphelliphelliphelliphelliphelliphelliphelliphelliphelliphelliphelliphelliphelliphellip 87 91 97
Payments to States and Possessions Payments to Stateshelliphelliphelliphelliphelliphelliphelliphelliphelliphelliphelliphelliphelliphelliphelliphelliphelliphelliphelliphelliphelliphellip 2 2 3
Total Payments to States and Possessionshelliphelliphelliphelliphelliphelliphelliphelliphelliphelliphellip 2 2 3
Total Discretionary Programshelliphelliphelliphelliphelliphelliphelliphelliphelliphelliphelliphelliphelliphelliphelliphelliphelliphellip 89 93 100
Mandatory Funds for Strengthening Markets Income and Supply (Section 32) Commodity Program Expenseshelliphelliphelliphelliphelliphelliphelliphelliphelliphelliphelliphelliphelliphelliphelliphelliphellip 964 1056 982 Section 32 Administrative Funds
Marketing Agreements and Orders (MAampO)helliphelliphelliphelliphelliphelliphelliphelliphelliphelliphellip 17 20 20 Web-based Supply Chain Managementhelliphelliphelliphelliphelliphelliphelliphelliphelliphelliphelliphelliphellip 20 10 0 Commodity Purchase Serviceshelliphelliphelliphelliphelliphelliphelliphelliphelliphelliphelliphelliphelliphelliphelliphellip 11 12 13
Total Section 32 Administrative Fundshelliphelliphelliphelliphelliphelliphelliphelliphelliphelliphelliphellip 48 42 33 Total Section 32 Fundshelliphelliphelliphelliphelliphelliphelliphelliphelliphelliphelliphelliphelliphelliphelliphelliphelliphellip 1012 1098 1015
User Fees Perishable Agricultural Commodities Acthelliphelliphelliphelliphelliphelliphelliphelliphelliphelliphelliphelliphellip 7 7 7 Commodity Grading Serviceshelliphelliphelliphelliphelliphelliphelliphelliphelliphelliphelliphelliphelliphelliphelliphelliphellip 150 140 148
Total User Fee Funded Programshelliphelliphelliphelliphelliphelliphelliphelliphelliphelliphelliphelliphelliphelliphellip 157 147 155 Farm Bill Specialty Crop Block Grants (Sec 10109)helliphelliphelliphelliphelliphelliphelliphelliphelliphelliphelliphellip 49 55 55 Farmers Market Promotion Program (Sec 10106)helliphelliphelliphelliphelliphelliphelliphelliphellip 5 5 10 Agricultural Mgmt Assistance Organic Cost-Share (Sec 2801)helliphelliphelliphellip (2) (2) (2)
Total Farm Bill Programshelliphelliphelliphelliphelliphelliphelliphelliphelliphelliphelliphelliphelliphelliphelliphelliphellip 54 60 65
Total Mandatory Programshelliphelliphelliphelliphelliphelliphelliphelliphelliphelliphelliphelliphelliphelliphelliphellip 1223 1305 1235 Total AMS Programshelliphelliphelliphelliphelliphelliphelliphelliphelliphelliphelliphelliphelliphelliphelliphelliphelliphelliphelliphelliphellip $1312 $1398 $1335
The mission of AMS is to facilitate the competitive and efficient marketing of agricultural products in domestic and international markets while ensuring fair trading practices AMS programs benefit producers traders and consumers of US food and fiber products by promoting a strategic marketing perspective that adapts product and marketing decisions to
104
MARKETING AND REGULATORY PROGRAMS
consumer demands changing domestic and international marketing practices and new technology
AMS programs will play key roles in two initiatives The Wholesale Farmers and Alternative Market Development Program together with Rural Development programs will be part of the Government-wide Healthy Food Financing Initiative to support local and regional efforts to increase access to healthy food particularly for the development of grocery stores and other healthy food retailers in urban and rural food deserts and other underserved areas In a related effort the ldquoKnow Your Farmer Know Your Foodrdquo initiative will facilitate the development of local and regional food systems that better connect consumers with local farms create new income opportunities for farmers and place a greater focus on sustainable agricultural practices and nutritious local food Increases are proposed for the Wholesale Farmers and Alternative Market Development Program and the Federal-State Marketing Improvement Program to accomplish program objectives In addition the 2008 Farm Bill provides increased funding for the Farmers Market Promotion Program Some Section 32 funds (described below) will also be employed
Marketing Services AMS administers a variety of programs that enhance the marketing and distribution of agricultural products Activities include the dissemination of market information surveillance of shell egg handling operations development of commodity grade standards protection of producers from unfair marketing practices statistical sampling of commodities for microbiological contamination and pestici de residues development and enforcement of organic standards research and technical assistance aimed at improving efficiency of food marketing and distribution and pesticide recordkeeping
The 2011 budget includes $101 million an increase of $31 million above the 2010 level for the National Organic Program This increase includes $21 million for regulatory review enforcement and development of equivalency agreements plus a one-time increase of $1 million for assisting accredited certifying agents in achieving International Organization for Standardization (ISO) compliance to enhance compliance with program regulations and ensure the integrity of the organic label
In addition an increase of $03 million is in cluded for Market News to support the continuation of data collection and reporting of organic commodity information initiated with $35 million AMS received in 2008 Farm Bill funding
AMS will continue providing assistance to organic producers in specific states through the Agricultural Management Assistance Organic Certification Cost-Share program and using funds from the 2008 Farm Bill for organic producers and handlers nationally through the National Organic Certification Cost-Share Program Cost-share assistance is at a rate of 75 percent of certification costs up to a maximum of $750 per year
The budget includes $38 million an increase of about $09 million for the Wholesale Farmers and Alternative Market Development Program to improve access to local and regionally produced foods as part of the Departmentrsquos ldquoKnow Your Farmer Know Your Foodrdquo initiative
105
MARKETING AND REGULATORY PROGRAMS
Additional funds are included to enhance sampling under the Microbiological Data Program (about $03 million) and maintain effective testing levels of foods and drinking water under the Pesticide Data Program (about $09 million)
Payments to States and Possessions Under the Federal-State Marketing Improvement Program (FSMIP) AMS provides matching funds to State Departments of Agriculture for projects aimed at improving marketing efficiency reducing marketing costs for producers and lowering food costs for consumers The 2011 budget req uests a total of almost $3 million an increase of $13 million for the program nearly doubling of the 2010 funding level The new funding would be targeted to grants that focus on local food marketing opportunities and is part of the ldquoKnow Your Farmer Know Your Foodrdquo initiative
Section 32 Funds Section 32 of the Act of August 24 1935 authorizes the appropriation for each fiscal year of an amount equal to 30 percent of the gross receipts from duties collected under customs laws of the United States during the preceding calendar year These funds are used to encourage domestic consumption of non-price supported perishable commodities and re-establish farmersrsquo purchasing power through a variety of activities including purchases of such commodities and removal of surplus commodities from the marketplace for distribution to Federal nutrition assistance programs such as the National School Lunch Program diversion programs that bring production in line with demand and disaster assistance for producers Section 32 funds are also used to finance the administrative costs associated with the purchase of commodities and developing the specifications used for food procurement throughout the Federal government The 2011 budget request includes an increase of $055 million in Commodity Purchase Services to allow AMS to work with the Food and Nutrition Servicersquos Farm to School Tactical Team to better link local and regionally grown foods to school feeding programs The 2011 budget also proposes a rescission of $50 million in funds available for Section 32
Marketing agreements and orders help stabilize market prices and the supply of milk fruit vegetables and certain specialty crops The orders are administered locally by marketing order committees and market administrators Local activities are funded through assessments on regulated handlers Section 32 funds are used to finance Federal oversight activities for marketing agreements and orders at the national level
User Fee Programs AMS operates programs funded through license or user fees The Commodity Grading Services program provides voluntary commodity grading and classing services for dairy products fresh and processed fruits and vegetables meat and meat products poultry eggs tobacco and cotton In addition AMS enforces the Perishab le Agricultural Commodities Act (PACA) which prohibits unfair and fraudulent practices in the marketing of perishable agricultural commodities by regulating shippers distributors and retailers Full and prompt payment for fresh fruits and vegetables is a key objective of the program
2008 Farm Bill In addition to organic certification cost-sharing AMS will continue other programs at the enacted funding levels provided in the 2008 Farm Bill The Specialty Crop Block Grant Program provides funds to States solely to enhance the competitiveness of specialty crops Specialty crops are defined as fruits vegetables tree nuts dried fruits horticulture and
106
MARKETING AND REGULATORY PROGRAMS
nursery crops (including floriculture) AMS awarded approximately $49 million in specialty crop block grants during 2009 The Farm Bill made $55 million available for 2010 and 2011 Under the Farmersrsquo Market Promotion Program competitive grants are given to help improve and expand domestic farmersrsquo markets roadside stands community-supported agriculture programs agro-tourism activities and other direct producer-to-consumer market opportunities AMS awarded more than $45 million in grants during 2009 The Farm Bill made $5 million available in 2010 and $10 million in 2011
GRAIN INSPECTION PACKERS AND STOCKYARDS ADMINISTRATION (GIPSA)
Budget Authority (Dollars in Millions)
2009 2010 2011 Program Enacted Estimate Budget
Discretionary Salaries and Expenses Grain Regulatory Programhelliphelliphelliphelliphelliphelliphelliphelliphelliphelliphelliphelliphelliphellip $18 $18 $18 Packers and Stockyards Programhelliphelliphelliphelliphelliphelliphelliphelliphelliphelliphellip 22 24 26
Total Salaries and Expenseshelliphelliphelliphelliphelliphelliphelliphelliphelliphelliphelliphellip 40 42 44
Mandatory Inspection and Weighing User Feeshelliphelliphelliphelliphelliphelliphelliphelliphelliphellip (42) (42) (45) Total GIPSA Programshelliphelliphelliphelliphelliphelliphelliphelliphelliphelliphelliphelliphelliphellip $40 $42 $44
GIPSA establishes the official US standards for grain conducts official weighing and grain inspection activities and grades rice dry beans peas lentils and processed grain products The agency regulates and monitors the activities of dealers market agencies stockyard owners live poultry dealers packer buyers packers and swine contractors in order to detect prohibited unfair unjust discriminatory or deceptive and anti-competitive practices in the livestock meat and poultry industries The agency also reviews the fina ncial records of these entities to promote the financial integrity of the livestock meat and poultry industries As such its efforts help USDA enhance international competitiveness of American agriculture and the economic viability and sustainability of rural and farm economies
For 2011 the budget proposes a program level for salaries and expenses of about $89 million of which $45 million is from existing inspection and weighing user fees Of the appropriations request of $44 million about $18 million is devoted to the Grain Regulatory Program including standardization compliance and methods development activities and nearly $26 million to the Packers and Stockyards Program Separately GIPSA will submit a legislative proposal to authorize the collection of fees for the development of grain standards and to amend the Packers and Stockyards Act to provide authority to collect license fees to cover the cost of the program
107
MARKETING AND REGULATORY PROGRAMS
The 2011 budget includes an increase of approximately $18 million to further strengthen enforcement of the Packers and Stockyards Act With additional staff including attorneys GIPSA would bolster direct enforcement and promote greater voluntary compliance with the Act The increase would enable GIPSA to perform approximately 500 additional inspections and compliance reviews and increase industry compliance with the Packers and Stockyards Act to 85 percent
Key Performance Measure 2006 2007 2008 2009 2010 2011
Percent of industry compliance with the Packers and Stockyards Act NA 75 80 80 83 85
108
RESEARCH EDUCATION AND ECONOMICS
MISSION AND RELATIONSHIP TO STRATEGIC GOALS
2011 REE Budget Authority Total = $29 Billion
ARS 41
ERS 3
NASS 6
NIFA 50
Agricultural research is the key element in productivity increases which is central to economic growth in the agricultural sector and typically induces strong effects in other sectors Agricultural research ultimately leads to increased profitability for farmers reduced food costs and greater choice for consumers and improved management of the natural-resource base Major Studies have consistently found that the net social returns from public agricultural research in the United States are high estimated to be at least 35 percent annually Although agricultural research may seem to be an anachronism in todays urban society issues such as the safety of genetically engineered foods pathogens in the food supply and environmental problems make it as important as ever
The Research Education and Economics (REE) mission area provides Federal leadership for the discovery application and dissemination of information and technologies spanning the biological physical and social sciences through agricultural research education and extension activities and economic and statistical analysis which supports all of USDArsquos Strategic Goals The 2011 REE budget serves to ensure a safe sustainable and competitive US food and fiber system and healthy families and communities
REE provides research education and extension that support each of the Departmentrsquos four strategic goals through its intramural and competitive grant programs and through strengthening the capacity of institutions of higher education Through major funding initiatives REE will be the catalyst and premier provider of knowledge for US agriculture by focusing its resources on five key activities Enhance Rural Prosperity Lead Efforts to Mitigate and Adapt to Climate Change Support Agriculture Production in Food-Insecure Nations Increase Access to Nutritious Food and Protect Agricultural Health by Minimizing Major Diseases and Pests to Ensure Access to Safe Plentiful and Nutritious Food
109
RESEARCH EDUCATION AND ECONOMICS
REE responsibilities are carried out by four agencies the Agricultural Research Service conducts intramural research in the area of natural and biological sciences the Economic Research Service performs intramural economic and social science research the National Agricultural Statistics Service conducts the Census of Agriculture and provides the official current statistics on agricultural production and indicators of the economic and environmental welfare of the farm sector and the National Institute of Food and Agriculture partners with land grant and non-land grant colleges and universities in carrying out extramural research higher education and extension activities
110
RESEARCH EDUCATION AND ECONOMICS
AGRICULTURAL RESEARCH SERVICE (ARS)
Budget Authority (Dollars in Millions)
2009 2010 2011 Program Enacted Estimate Budget
Discretionary New ProductsProduct QualityValue Added $103 $105 $113 Livestock Production 80 81 85 Crop Production 199 208 220 Food Safety 106 108 114 Livestock Protection 75 79 83 Crop Protection 198 204 213 Human Nutrition 79 86 91 Environmental Stewardship 220 228 240
Total Research Programs 1060 1099 1159 National Agricultural Library 23 22 23 Repair and Maintenance of Facilities 17 17 18
Total Ongoing Programs 1100 1138 1200 Earmarked Projects 40 42 0
Total Research and Information Activities 1140 1180 1200 Buildings and Facilities 47 71 0
Total Ongoing Discretionary Programs 1187 1251 1200 Collaborative Research Program 3 0 0
Recovery Act Buildings and Facilities 176 0 0
Total Discretionary Programs 1366 1251 1200 Mandatory Trust Funds 24 24 24
Total ARS $1390 $1275 $1224
ARS conducts research to develop new scientific knowledge transfer technology to the private sector to solve technical agricultural problems of broad scope and high national priority and provide access to scientific data The agency also includes the National Agricultural Library the Nations major information resource in the food agricultural and natural resource sciences
111
RESEARCH EDUCATION AND ECONOMICS
2011 ARS Research Budget Authority Total = $12 Billion
Food Safety and Environmental
Product QualityValue
Added 10
Crops 36
Livestock 14
Nutrition 17
Stewardship 20
All Other 3
The 2011 budget requests approximately $12 billion for ARS research and information funding This is an increase of $20 million over the 2010 enacted level Further approximately $42 million in Congressional earmarks have been redirected to high-priority research initiatives including the following
New ProductsProduct QualityValue Added ARS research enhances the economic viability and competitiveness of US agriculture by (1) maintaining the quality of harvested agricultural commodities or enhancing their marketability and (2) expanding domestic and global market opportunities through the development of value-added food and non-food products and processes The 2011 budget provides an increase of $10 million for the establishment of Regional Biofuels Feedstocks Research and Demonstration Centers These five Centers will be managed by ARS and will coordinate efforts for research conducted by other agencies and departments to accelerate the development and deployment of dedicated energy feedstocks including perennial grasses and sustainable feedstock production systems for advanced biofuels suited for best participation within different regions across the nation
Livestock Production ARS conducts research that develops biotechnological methods to use animal germplasm and associated genetic and genomic repositories and databases to ensure an abundant and safe food supply Research also provides the knowledge to assess farm animal well-being reduce animal stress increase animal health and improve the international competitiveness and sustainability of US aquaculture The 2011 budget includes an increase of $3 million for research on breeding and germplasm improvement to enhance food production and security ARS will harness the expanding body of genomic information on beef and dairy cattle swine and trout to improve feed and production efficiency and animal health Information on the relationships between health nutrients growth and feed efficiency can be used to reduce inputs to animal production and optimize animal health and animal product quality characteristics The proposed research will have a wide range of applications including the selection of animals with improved growth efficiency and disease resistance and
112
RESEARCH EDUCATION AND ECONOMICS
the development of genetic-based performance prediction The 2011 budget also includes an increase of $2 million for genomic sequencing to characterize important traits for food animal production and fund research to identify genes that will improve the health growth and productivity of food animals Addressing animal health and feed efficiency is the key to meeting the demands of the growing population and preventing world hunger
Crop Production ARS safeguards and utilizes plant microbial and insect germplasm associated genetic and genomic databases and bioinformatic tools to ensure an abundant high quality safe and inexpensive supply of food feed fiber ornamentals and industrial products To further these goals the 2011 budget provides an increase of $43 million for crop breeding to enhance food production and security The proposed research will expand ARSrsquo capacity to improve genetic resources and cultivars for the benefit of US producers seed companies processors and consumers As a result the research will lead to improved germplasm and varieties with higher yields improved disease and pest resistance and resilience to weather extremes such as high temperature and drought The budget additionally includes an increase of $37 million for ARS to expand activities to identify acquire and secure unprotected genetic resources of plants insects and crop and veterinary associated microbes A broad spectrum of genetic diversity in the form of viable and well documented germplasm will be conserved Vulnerable or threatened genetic resources vital to national security will be safely stored and backed-up in secure facilities The 2011 budget proposes an additional $08 million to specifically address the need to protect the worldrsquos grain supply through grain disease research and conservation Preventing grain disease losses is critical in meeting the demands of a growing population The budget also includes an increase $08 million to support the activities of the World Food Prize Foundation which annually recognizes those who have advanced human development by improving the quantity quality or availability of the worldrsquos food supply
The budget provides an additional $1 million for developing local food systems for the urban Eastern Seaboard Region New research will assess the capacity to produce food locally that will meet the needs of a large urban population by examining the constraints imposed by environmental economic social and geographic factors This information will be used to assess local food production potential and economic viability and supports the Departmentrsquos Know Your Farmer Know Your Food Initiative Finally an increase of $05 million is proposed for research to determine the role of pathogens and other stress factors in Colony Collapse Disorder of honey bees and how to mitigate their effects
Food Safety ARS research helps to ensure that the food supply is safe for consumers and that food and feed meet foreign and domestic regulatory requirements This research also focuses on the reduction of the hazards of both introduced and naturally occurring toxins in foods and feed including pathogenic bacteria viruses parasites chemical contaminants mycotoxins and naturally occurring toxins produced by plants The 2011 budget includes an additional $5 million to enhance research to safeguard the Nationrsquos food supply from foodborne pathogens by developing and validating management practices to prevent pre-harvest pathogen contamination of produce and post-harvest strategies to eliminate pathogen contamination Research will also develop and validate detection and sensing technologies for pathogens toxins and chemical residues
113
RESEARCH EDUCATION AND ECONOMICS
Livestock Protection ARS conducts research to reduce economic losses from infectious genetic and metabolic diseases of livestock and poultry and to eliminate the losses to animal production and products caused by arthropod diseases and arthropod borne trauma This research also reduces the risk to humans from arthropod borne zoonotic diseases and enhances the safety of animal products The budget includes an increase of $3 million for improved animal protection to enhance food production and security Research will focus on the development of preventive measures to combat priority infectious diseases of livestock and poultry Specific projects include the development of new measures to control bovine tuberculosis and bovine respiratory diseases Furthermore diagnostics vaccines and biotherapeutics designed to convey disease resistance in genetically-defined animal populations will be produced As a result of this research catastrophic losses from new and emerging diseases will be avoided
Crop Protection ARS provides the knowledge to reduce losses caused by plant diseases by defining practices that are effective and affordable and that maintain environmental quality Research also provides the technology to manage pest populations below economic damage thresholds by the integration of environmentally compatible strategies that are based on an increased understanding of the pestrsquos biology and ecology The 2011 budget includes an increase of $48 million for crop protection research to expand grain crop germplasm collection enhancement and breeding programs Specific projects will focus on improving citrus germplasm to protect from citrus greening breeding oats wheat and barley to be resistant to Ug99 and other cereal rusts and breed legume germplasm with enhanced disease and pest protection Breeding and disease protection research will increase the production capacity of perennial grains and optimize perennial grain production systems Additionally sustainable agricultural systems will be developed through research on long-term crop rotation trials This research will expand the adoption of sustainable agricultural practices and address a critical aspect of world hunger by avoiding catastrophic losses from new and emerging cereal diseases The budget also includes an increase of $33 million for research on the Departmentrsquos scientific collections USDA has principal responsibility for safeguarding the Nationrsquos insect systematics collections which are needed for developing pest management strategies identifying new pollinators and the testing of natural enemies needed for biological control of insects and weeds Through this research crops and veterinary animals will be better protected from pests through biological control plant resistance and the development of other management tools
Human Nutrition ARS centers conduct basic and applied research to identify and understand how nutrients and other bioactive food components affect the health of diverse populations including children the elderly pregnant and lactating women and healthy adults The ultimate goal of this food-based agricultural research is to identify foods and diets coupled with genetics and physical activity that will sustain and promote health throughout life The 2011 budget proposes an increase of $64 million for research on childrenrsquos nutrition and health Obesity prevalence among adults and children in the US has tripled in the last 30 years During this time the Dietary Guidelines for Americans (DGA) have been issued by USDA in partnership with the Department of Health and Human Service Despite the DGA forming the basis for Federal food and nutrition policy and the requirement of USDA nutrition assistance programs to provide meals that meet the DGA few Americans have diets that come
114
RESEARCH EDUCATION AND ECONOMICS
close to the recommendations The proposed increase will fund a study to identify barriers and facilitators to following the DGA in multiple locations nationwide in children and adults and in three racial and ethnic groups New methods to motivate behavior change in eating and physical activity will result from this research Finally funds will be used to enhance the nutrition information available through wwwNutritiongov With most nutrition information aimed at adults ARS will significantly increase information about childrenrsquos healthy weight gain during growth and ways by which obesity can be prevented
Environmental Stewardship This broad area of research emphasizes the development of technology and scientific knowledge that will allow producers to manage conserve and protect the Nationrsquos soil water and air resources while optimizing agricultural productivity The 2011 budget proposes an additional $54 million to conduct research that will enhance American agriculturersquos adaptability to a changing global climate ARS will increase the resilience of crops so they can thrive in variable and extreme environments as well as focus on mitigating the effects of climate change by ensuring the availability of water through improved management Research will also develop production systems that will provide a sustainable balance of crop production carbon soil sequestration and net greenhouse gas emissions The budget also proposes an increase of $63 million for research which will develop sustainable agricultural practices through the integration of information and technologies leading to enhanced productivity profitability energy efficiency and natural resource stewardship for American farmers and ranchers New practices will be developed that utilize on-farm resources and natural processes which reduce the need for inputs and reduce production costs and risks The development of these improved agricultural systems will increase the long-term financial viability competitiveness and sustainability of farms and rural communities and increase food and fiber security for the US and the world
National Agricultural Library (NAL) NAL is one of four national libraries in the United States and provides access to scientific agricultural data NAL continues to expand its efforts to provide this information through the Internet thereby increasing the efficiency of its information management and delivery The budget proposes an increase of $15 million for developing information and tools on all facets of sustainable agriculture including information on sustainable and regenerative crop and livestock farming systems ecological pest management renewable energy options for farms direct marketing practices and community food systems organic production certification and marketing and crop and livestock diversification
Buildings and Facilities Repair and Modernization ARS has over 100 research facilities throughout the US and abroad many collocated with other USDA agencies and university partners The budget does not include funding for ARS building and facilities projects but rather provides an increase of $175 million for a review of USDA research facilities to develop a Department-wide capital improvement strategy to guide future investments consistent with priority program goals
115
RESEARCH EDUCATION AND ECONOMICS
NATIONAL INSTITUTE OF FOOD AND AGRICULTURE (NIFA)
Budget Authority (Dollars in Millions)
2009 2010 2011 Program Enacted Estimate Budget
Discretionary Research and Education Activities $691 $792 $839 Extension Activities 474 495 479 Integrated Activities 57 60 25 Native American Endowment Fund Interest 4 4 4
Total Ongoing Discretionary Programshelliphelliphelliphelliphelliphelliphelliphellip 1226 1351 1347 Mandatory Risk Management Education 5 5 5 Native American Endowment Fund 12 12 12 Hispanic-Serving Ag-Colleges Endowment Fund 0 0 10 Farm Bill
Biomass Research and Development 20 28 30 Organic Agriculture Research and Education Initiative 18 20 20 Healthy Urban Enterprise Development Center 1 1 1 Beginning Farmer and Rancher Development Program 18 19 19 Specialty Crop Research Initiative 50 50 50 Biodiesel Fuel Education Program (1) (1) (1) Community Food Projects (5) (5) (5) Total Farm Bill Programs 107 118 120
Total Mandatory Programs 124 135 147 Total NIFA $1350 $1486 $1494
NIFA formerly the Cooperative State Research Education and Extension Service has the primary responsibility for providing linkages between the Federal and State components of a broad-based national agricultural research extension and higher education system NIFA provides funding for projects conducted in partnership with the State Agricultural Experiment Stations the State Cooperative Extension System land grant universities colleges and other research and education institutions Federal funds are distributed to universities and institutions by statutory formula funding competitive awards and grants NIFA is responsible for administering USDAs primary competitive research grants program the Agriculture and Food Research Initiative (AFRI) which supports investigator-initiated research with strong potential to contribute to major breakthroughs in agricultural science
116
RESEARCH EDUCATION AND ECONOMICS
National Institute of Food and Agriculture Budget Authority
(Dollars in Millions) 2009 2010 2011
Program Enacted Estimate Budget Discretionary Formula Grants
Smith-Lever 3 (bampc)helliphelliphelliphelliphelliphelliphelliphelliphelliphelliphelliphelliphelliphelliphelliphelliphellip $289 $298 $298 Hatch Acthelliphelliphelliphelliphelliphelliphelliphelliphelliphelliphelliphelliphelliphelliphelliphelliphelliphelliphelliphelliphellip 207 215 215 1890 Research and Extensionhelliphelliphelliphelliphelliphelliphelliphelliphelliphelliphelliphelliphelliphellip 86 91 91 McIntire-Stennis Cooperative Forestryhelliphelliphelliphelliphelliphelliphelliphelliphelliphellip 28 29 29 Animal Health and Disease Researchhelliphelliphelliphelliphelliphelliphelliphelliphelliphelliphellip 3 3 3 Total Formula Grantshelliphelliphelliphelliphelliphelliphelliphelliphelliphelliphelliphelliphelliphelliphelliphellip 613 636 636
Agriculture and Food Research Initiativehelliphelliphelliphelliphelliphelliphelliphelliphelliphellip 202 262 429 Integrated Activities - Section 406helliphelliphelliphelliphelliphelliphelliphelliphelliphelliphelliphellip 42 45 0 Pest ControlManagement Activitieshelliphelliphelliphelliphelliphelliphelliphelliphelliphelliphellip 26 26 26 Sustainable Agriculture Federal-State Matching Grantshelliphelliphelliphellip 0 0 10 Sustainable Agriculture Research and Extensionhelliphelliphelliphelliphelliphelliphellip 19 19 20 Higher Education Programshelliphelliphelliphelliphelliphelliphelliphelliphelliphelliphelliphelliphelliphelliphellip 40 47 52 Native American Endowment Fund Interesthelliphelliphelliphelliphelliphelliphelliphelliphellip 4 4 4 Federally-Recognized Tribes Extension Programhelliphelliphelliphelliphelliphellip 3 3 5 1890 Facilitieshelliphelliphelliphelliphelliphelliphelliphelliphelliphelliphelliphelliphelliphelliphelliphelliphelliphelliphelliphellip 18 20 20 Extension Services at 1994 Institutionshelliphelliphelliphelliphelliphelliphelliphelliphelliphellip 3 4 5 Expanded Food and Nutrition Education Program (EFNEP)helliphellip 66 68 68 Federal Administrationhelliphelliphelliphelliphelliphelliphelliphelliphelliphelliphelliphelliphelliphelliphelliphelliphellip 17 18 18 Electronic Grants Administration Systemhelliphelliphelliphelliphelliphelliphelliphelliphelliphellip 2 2 5 Regional Diagnostic Networkhelliphelliphelliphelliphelliphelliphelliphelliphelliphelliphelliphelliphelliphellip 10 10 10 Veterinary Medical Services Acthelliphelliphelliphelliphelliphelliphelliphelliphelliphelliphelliphelliphellip 3 5 5 Other Research Extension and Integrated Programshelliphelliphelliphelliphellip 30 37 34
Subtotal Ongoing Discretionaryhelliphelliphelliphelliphelliphelliphelliphelliphelliphelliphelliphellip 1098 1206 1347 Earmarked Projects and Grantshelliphelliphelliphelliphelliphelliphelliphelliphelliphelliphelliphelliphelliphellip 128 141 0 Improved Nutritional Delivery of Food Assistance Grantshelliphelliphellip 0 4 0
Total Discretionary Programshelliphelliphelliphelliphelliphelliphelliphelliphelliphelliphelliphellip 1226 1351 1347 Mandatory Risk Management Education 5 5 5 Native American Endowment Fund 12 12 12 Hispanic-Serving Ag-Colleges Endowment Fund 0 0 10 Farm Bill Programs 107 118 120 Biodiesel Fuel Education Program (1) (1) (1) Community Food Projects (5) (5) (5)
Total NIFA $1350 $1486 $1494
117
RESEARCH EDUCATION AND ECONOMICS
2011 NIFA Budget Authority
$747 800 $731 $731 $704 700
600
500
400
300
200
100
0
Formula Competitive Earmarks
Does not include endowment funds
The 2011 budget requests approximately $135 billion in discretionary funding for NIFA While in total this amount is the same as the 2010 level it reflects a major redirection of funding priorities The Department has greatly increased funding of competitive grants maintained funding for capacity building through formula programs and eliminated $141 million in Congressional earmarks High-priority research initiatives include the following
Agriculture and Food Research Initiative (AFRI) AFRI is the Nationrsquos premier competitive peer-reviewed research program for fundamental and applied sciences in agriculture It is broad in scope with programs ranging from fundamental science to farm management and community issues The 2011 budget proposes a substantial increase in competitive research funding with $4288 million for AFRI an increase of $167 million over 2010 Included in this amount is an increase of $34 million for the Departmentrsquos alternative and renewable energy research initiative to develop high-quality cost-effective feedstocks for biofuel production that do not affect the food supply $50 million for global climate change research to develop mitigation capabilities and adaptive capacities for agricultural production $13 million for international food security to expand research education and extension efforts on plant and animal diseases that threaten public health and agricultural production $20 million for an integrated food safety research program which will improve our understanding of disease-causing microorganisms their products and naturally occurring contaminants in meats poultry seafood and fresh fruits and vegetables and $50 million in nutrition and obesity prevention research
Electronic Grants Administration With increased funding for AFRI a significant rise in the number of applications is anticipated requiring increased efficiency of the grant-making processes and systems Additionally the breadth and types of grants made will increase
$ M
illio
ns
$527 $604
$128 $141
2009 2010 2011
118
RESEARCH EDUCATION AND ECONOMICS
requiring the development of new grant management tools The 2011 budget proposes an increase of $3 million for improved grants management systems which will substantially lower the transaction costs of applying for an AFRI or other NIFA competitive grant while increasing proposal receipt and acceptance speeds and accuracy
Sustainable Agriculture Research and Education (SARE) Program SARE advances agricultural innovations that improve profitability environmental stewardship and quality of life As part of the Departmentrsquos Know Your Farmer Know Your Food Initiative the 2011 budget proposes an increase of $10 million for the creation of a new Federal-State Matching Grant SARE Program to assist in the establishment and enhancement of State sustainable agriculture research education and extension programs The matching requirement will leverage State or private funds and build the capabilities of American agriculture in becoming more productive and sustainable Additionally an increase of $076 million is proposed to support research and extension that will improve soil quality and carbon sequestration save energy and mitigate climate change as well as provide education and training for Cooperative Extension the Natural Resources Conservation Service and other agriculture professionals These program increases will bring total SARE funding to $30 million
Key Performance Measure 2006 2007 2008 2009 2010 2011 The number of farmers and ranchers that gained an economic environmental or quality-of-life benefit from a change in practice learned by participating in a SARE project 9610 10240 10849 11300 11800 12300
Hispanic-Serving Agricultural Colleges and Universities Endowment Fund With the Hispanic community being the fastest growing sector of the American population an investment in the Hispanic-Serving Agricultural Colleges and Universities (HSACU) is needed to ensure that these institutions can effectively compete for NIFA competitive grants Section 7129 of the 2008 Farm Bill authorized the establishment of an endowment fund for HSACU The 2011 budget proposes an increase of $10 million to establish the fund which will lead to significant and measurable advancement of Hispanic and other students in the food and agricultural sciences Funding will come from the annual interest generated by the Endowment
Extension Education on Tribal Lands and at 1994 Institutions The Federally-Recognized Tribes Extension Program supports extension agents who establish programs in agriculture community development families and societal issues facing Native Americans The budget proposes an increase of $23 million to more than double the number of tribes being served by extension and will be used to develop and deploy sustainable production practices Additionally the budget proposes an increase of $1 million for Extension Services at the 1994 Institutions to conduct an Expanded Food and Nutrition Education Program (EFNEP) pilot in a number of Native American communities through a competitive grant process The 1994 Institutions which have demonstrated initial success in providing nutrition education
119
RESEARCH EDUCATION AND ECONOMICS
would partner with 1862 Institutions with a strong EFNEP or other innovative program to provide culturally relevant nutrition education
Formula Funding NIFA provides formula funding for research and extension at 1862 1890 and 1994 land-grant institutions schools of forestry and schools of veterinary medicine The 2011 budget continues to maintain funding for these important capacity building programs at the 2010 enacted level This funding will allow institutions to sustain the matching requirement that by many of these programs have thereby allowing Federal funds to leverage non-Federal resources Programs include Hatch Act and Smith-Lever programs which fund research and extension at 1862 Institutions Evans-Allen 1890 Extension and the 1890 Facilities Grants program which fund agricultural research extension and the acquisition and improvement of facilities equipment and libraries at 1890 institutions including Tuskegee University and West Virginia State University the Tribal Colleges Endowment Fund which distributes the interest earned by an endowment and the Tribal Colleges Education Equity Grants Program which strengthens higher education instruction at the thirty-four 1994 land-grant institutions the McIntire-Stennis Cooperative Forestry Program which funds research on forests and related rangelands at eligible 1862 and 1890 land-grants and institutions offering training in the forestry sciences the Animal Health and Disease Research Program which funds research at accredited colleges of veterinary medicine and State Agricultural Experiment Stations that conduct animal health and disease research and the Expanded Food and Nutrition Education Program carried out by the 1862 and 1890 land-grant institutions to assist low-income individuals in acquiring the knowledge skills and changed-behavior necessary for nutritionally sound diets
1890 Land Grant Institutions The 2011 budget request maintains the historic funding levels for programs supporting 1890 land-grant institutions and includes approximately $91 million for 1890 research and extension formula programs -- $485 million for research and $427 million for extension Additionally the request includes $198 million for 1890 Facilities Grants and $183 million Capacity Building Grants at 1890 Institutions The budget for these programs reflects Administrationrsquos policy to maintain these important programs
Rural Revitalization through Education In support of the Presidentrsquos initiative to make education a national priority the budget proposes a total increase of $5 million for rural education to sustain rural communities This includes an increase of $25 million for the Secondary Education Two-Year Postsecondary Education and Ag in the K-12 Classroom (SPECA) Grants Program and $25 million for the Higher Education Institution Challenge (HEC) Grants Program With SPECA funds NIFA will focus on improving the economic health and viability of rural communities through the development of degree programs emphasizing new and emerging employment opportunities in agriscience and agribusiness fields With HEC funds NIFA will assist academic institutions in rural areas to prepare students for emerging science technology engineering and mathematics (STEM) opportunities
Veterinary Medicine Loan Repayment Program (VMLRP) The 2011 budget maintains funding for the VMLRP at the 2010 enacted level of $48 million The VMLRP will repay the
120
RESEARCH EDUCATION AND ECONOMICS
loans of veterinarians who agree to serve in geographic and veterinary practice areas that have a shortage of food animal veterinarians NIFA published the interim rule for the program on July 9 2009 which established the process and procedures for designating veterinarian shortage situations and administering the VMLRP
121
RESEARCH EDUCATION AND ECONOMICS
ECONOMIC RESEARCH SERVICE (ERS)
Budget Authority (Dollars in Millions)
2009 2010 2011 Program Enacted Estimate Budget
Economic Research Servicehelliphelliphelliphelliphelliphelliphelliphelliphelliphelliphelliphelliphelliphellip $80 $82 $87
ERS provides economic and other social science information and analysis on agriculture food the environment and rural development ERS produces such information and analyses to inform policy and program decisions made across the spectrum of USDA missions and supplies them in outlets that are also accessible to USDA stakeholders and the general public The 2011 budget requests approximately $87 million in program funding an increase of $8 million in program initiatives which is offset by $3 million in terminations of low-priority programs
Community Access to Local Foods The availability of fresh healthy local foods depends to a large extent on the local food environment and community characteristics Food choices are critically important to health outcomes and these choices are shaped or significantly influenced by these factors Therefore the budget proposes an increase of $2 million which supports the Departmentrsquos Know Your Farmer Know Your Food initiative to develop data and conduct economic research on the access to affordable and nutritious local foods in low-income communities With USDA playing a key role in developing policies that address diet and health this initiative will lead to a better understanding of how the Department can better support sustainable and healthy communities
Data Improvement As part of a government-wide data improvement program the 2011 budget includes an increase of $4 million to strengthen the Departmentrsquos statistical protocols and tools This includes a $2 million initiative to establish a structure among statistical agencies headed by ERS to improve data access develop tools for data processing and increase the utility of Federal data The 2011 budget also includes an increase of $2 million for an administrative data pilot project Administrative data information collected in conjunction with administering government programs provide an opportunity for increasing the statistical ability to understand and address critical policy issues The goal of this initial project will be (1) to understand how nutrition assistance and other government programs work together to provide a social safety net and (2) how nutrition assistance and health care policy work together to improve dietary and health outcomes
Data Integrity and Confidentiality As part of the Administrationrsquos expense cutting measures USDA will consolidate seven existing leases ERS will physically relocate from its current location as part of this move To maintain the integrity and confidentiality of its data at secure sites the budget proposes an increase of approximately $1 million for storage and security at separate locations with the ability to control and monitor access
122
RESEARCH EDUCATION AND ECONOMICS
NATIONAL AGRICULTURAL STATISTICS SERVICE (NASS)
Budget Authority (Dollars in Millions)
2009 2010 2011 Program Enacted Estimate Budget
Discretionary Agricultural Estimates $115 $124 $132 Census of Agriculture 37 38 33
Total Discretionary Programs $152 $162 $165
The mission of NASS is to provide timely accurate and useful statistics in service to US agriculture NASS statistics provide the information necessary to keep agricultural markets stable and efficient and to help maintain a consistency for all users of agricultural statistics The 2011 budget requests approximately $164 million in program funding This includes an increase of $63 million in initiatives which is offset by $51 million in terminations of low-priority programs which includes eliminating a land tenure survey that duplicates work being conducted under the Agricultural Resource Management Survey
County Estimates Program The agricultural estimation program provides a comprehensive set of unbiased data covering most agricultural commodities as well as economic environmental and rural demographic data As part of this program NASS has produced county-level statistics for selected commodities that impact billions of dollars of government payments The budget includes an increase of $5 million to improve the data quality of the County Estimates program which is used within the Department to administer crop insurance programs that provide US farmers a safety net ensuring protection against unstable growing conditions as well as crop revenue support programs emergency assistance payments and the Conservation Reserve Program
Climate Change Also within the agricultural estimation program an increase of $08 million is proposed that will allow NASS to enhance its remote sensing activities NASS continues to utilize advanced technologies to monitor agricultural acreage and production This initiative is proposed to increase the number of States in which cropland data is collected and provide NASS the ability to collect additional data on crop conditions as well as fill an important informational gap on soil moisture conditions and drought monitoring
Organic Agriculture Study Also within the agricultural estimation program an increase of $05 million is proposed that will allow NASS to develop an ongoing data series on organic production handling and distribution With this information USDA and others will be able to monitor the financial health and continued growth and evolution of this important sector
Census of Agriculture The 2011 budget includes funding to support the second year of the 2012 Census of Agriculturersquos five year cycle The Census of Agriculture provides comprehensive data on the agricultural economy with national State and county level details The census data are relied upon to measure trends and new developments in the agricultural sector
123
OFFICE OF THE SECRETARY
Budget Authority (Dollars in Millions)
2009 2010 2011 Program Enacted Estimate Budget
Discretionary Office of the Secretaryhelliphelliphelliphelliphelliphelliphelliphelliphelliphelliphelliphelliphelliphelliphellip $15 $19 $20 Healthy Food Financing Initiativehelliphelliphelliphelliphelliphelliphelliphelliphelliphelliphellip 0 0 35 Mandatory Trust Fundshelliphelliphelliphelliphelliphelliphelliphelliphelliphelliphelliphelliphelliphelliphelliphelliphelliphelliphelliphellip 1 1 1 Total OSEChelliphelliphelliphelliphelliphelliphelliphelliphelliphelliphelliphelliphelliphelliphelliphelliphelliphelliphelliphellip $16 $20 $56
OFFICE OF THE SECRETARY
The Office of the Secretary (OSEC) assisted by the Deputy Secretary the Subcabinet and members of their immediate staffs directs and coordinates the work of the Department This involves providing policy direction for all areas of the Department and maintaining liaisons with the Executive Office of the President members of Congress and the public The 2011 budget requests $20 million for OSEC to fund on-going policy leadership tribal consultation and cross-cutting trade and biotechnology activities Of this amount there is an increase of $2 million for the Office of Ecosystem Services and Markets within the Office of the Under Secretary for Natural Resources and Environment to coordinate USDA involvement in the development of market opportunities for services provided by American agriculture such as carbon sequestration and water conservation
Healthy Food Financing Initiative provides funding for a new multi-year Healthy Food Financing Initiative (HFFI) that will increase the availability of affordable healthy foods in underserved urban and rural communities particularly through the development or equipping of grocery stores and other healthy food retailers To support this initiative the Departments of Agriculture Health and Human Services and Treasury have partnered to make available over $400 million in financial and technical assistance to community development financial institutions other nonprofits public agencies and businesses with sound strategies for addressing the healthy food needs of communities These organizations will use Federal grants below-market rate loans loan guarantees and tax credits to attract private sector capital for an even greater investment in projects that increase access to fresh produce and other healthy foods The goal is to substantially reduce the number of food deserts in our nation over the next several years
Food deserts are communities in which residents do not have access to affordable and healthy food options Instead of supermarkets and grocery stores these communities are typically served by fast food restaurants and convenience stores that offer little if any healthy options This lack of access contributes to a poor diet and can lead to higher levels of obesity and other diet-related diseases such as diabetes and heart disease Most often these communities are economically distressed and less attractive under conventional financing to retailers of healthy food But effective local programs have shown that well-targeted financing and technical assistance can
124
OFFICE OF THE SECRETARY
create viable business outcomes and access to healthier food options Targeting federal financial assistance to these areas will not only increase the supply of healthy foods and create new markets for farmers but also create jobs and support broader development efforts to revitalize distressed communities
The 2011 budget requests an additional $35 million for financial and technical assistance including assistance made through the Intermediary Relending Program of the Rural Development mission area In addition $15 million would be reserved from specified accounts in the Rural Development and Marketing and Regulatory Program mission areas to provide additional support for the initiative Not more than 10 percent of the available funding for any one program would be subject to the reserve Through the initiative funds will be made available from a number of loan grant promotion and other programs to provide financial and technical assistance to support market planning and promotion efforts as well as infrastructure and operational improvements designed to stimulate consumer demand enhance marketing expand demand and retail outlets for farm products and increase availability of locally and regionally produced foods
125
DEPARTMENTAL ACTIVITIES
DEPARTMENTAL MANAGEMENT
Budget Authority (Dollars in Millions)
2009 2010 2011 Program Enacted Estimate Budget
Discretionary Office of Advocacy and Outreachhelliphelliphelliphelliphelliphelliphelliphelliphelliphelliphellip 0 $2 $7 Assistant SecretaryOffice of Civil Rightshelliphelliphelliphelliphelliphelliphelliphellip $22 24 25 Office of the Chief Financial Officerhelliphelliphelliphelliphelliphelliphelliphelliphelliphellip 6 7 7 Office of Budget and Program Analysishelliphelliphelliphelliphelliphelliphelliphelliphellip 9 9 9 Office of the Chief Information Officerhelliphelliphelliphelliphelliphelliphelliphelliphellip 18 62 64 Departmental Administrationhelliphelliphelliphelliphelliphelliphelliphelliphelliphelliphelliphelliphellip 27 28 31 Contracting and Acquisition Workforce Traininghelliphelliphelliphellip 0 0 6 Provincial Reconstruction Teamshelliphelliphelliphelliphelliphelliphelliphelliphelliphelliphellip 0 13 a Office of Homeland Securityhelliphelliphelliphelliphelliphelliphelliphelliphelliphelliphelliphellip 1 2 2 Agriculture Buildings and Facilitieshelliphelliphelliphelliphelliphelliphelliphelliphelliphellip 244 293 278 Hazardous Materials Managementhelliphelliphelliphelliphelliphelliphelliphelliphelliphelliphellip 5 5 5 Total Ongoing Discretionary Programshelliphelliphelliphelliphelliphelliphelliphellip 332 445 434 Recovery Act Agriculture Buildings and Facilitieshelliphelliphelliphelliphelliphelliphelliphelliphelliphellip 24 0 0 Total Discretionary Programshelliphelliphelliphelliphelliphelliphelliphelliphelliphelliphellip 356 445 434 Mandatory Farm Bill Biobased Markets Programhelliphelliphelliphelliphelliphelliphelliphelliphelliphelliphelliphelliphellip 2 2 2 Outreach for Socially Disadvantaged Farmers bhelliphelliphelliphelliphellip 15 20 20 Total Farm Bill Programshelliphelliphelliphelliphelliphelliphelliphelliphelliphelliphelliphelliphelliphellip 17 22 22 Total Departmental Managementhelliphelliphelliphelliphelliphelliphelliphelliphelliphellip $373 $467 $456
a Funded within the Foreign Agricultural Service b This program was administered by the National Institute of Food and Agriculture (NIFA) in 2009 at $15 million and transferred to the Office of Advocacy and Outreach in 2010
Departmental Management (DM) is responsible for providing coordination of all administrative functions and support for policy activities of the Department DM is leading the Departmentrsquos implementation of Management Initiatives to
bull Transform USDA into a model Federal agency for effective program delivery by enhancing leadership encouraging employee inclusion and focusing on improving customer and employee satisfaction
126
DEPARTMENTAL ACTIVITIES
bull Provide civil rights leadership to USDA employees applicants and customers by increasing the use of an early resolution process a form of alternative dispute resolution for civil rights and equal employment opportunity complaints reducing the inventory of program civil rights complaints and analyzing field operations for systemic improvements
bull Coordinate outreach efforts to increase access to USDA programs and services among women and minority farmers
bull Use resources more effectively by incorporating into the Departmentrsquos current management practices new strategies and policies that increase performance and encourage efficiency and alignment of activities to the Departmentrsquos strategic goals
bull Implement modern information technology systems and policies in a cost effective manner that improve program delivery along with internal and external communications capabilities to better serve USDA constituents
bull Maximize USDA ldquogreenrdquo operations by increasing the use of bio-preferred products and alternative energy increasing recycling and decreasing water and energy usage at USDA facilities
bull Improve Departmental emergency preparedness and security measures to protect USDA employees and the public to ensure the continued delivery of USDA products and services
bull Enhance human resources policies and practices to develop a USDA workforce that is more representative of the National population and has the necessary skills to ensure the continued and improved delivery of services by the Department
The 2011 budget proposes funding to maintain the staffing levels necessary to lead implementation of these initiatives and provide adequate service delivery by Departmental Management while addressing key policy issues related to outreach human resources procurement system improvements financial management and information technology security and capital investment These efforts are critical to making the Department an efficient effective and discrimination-free organization that delivers the best return on taxpayersrsquo investments
The Office of Advocacy and Outreach (OAO) was established by the 2008 Farm Bill to increase the accessibility of USDA programs to underserved constituents OAO activities include overseeing the Advisory Committees on Minority Farmers and Beginning Farmers and Ranchers administering the Outreach to Socially Disadvantaged Farmers Grant Program (section 2501 Program) overseeing the activities of the Office of Small Farms Coordination and the Farm Worker Coordinator managing the 1994 1890 and Hispanic Serving Institutions (HSI) Programs and coordinatingconducting other outreach functions The 2011 budget requests $7 million for OAO to carry out these responsibilities and the provisions of the Farm Bill related to outreach to beginning small and socially disadvantaged farmers ranchers and rural communities Of this amount $4 million is requested for agricultural labor grants authorized under section 14204 of the 2008 Farm Bill This program was funded through Rural
127
DEPARTMENTAL ACTIVITIES
Development in 2010 at the same level OAO will operate this program in 2011 to assist agricultural employers and farm workers by improving the supply stability safety and training of the agricultural labor force In addition to the requested funding OAO will receive $20 million provided by the 2008 Farm Bill for the 2501 Grants Program and an estimated $6 million in reimbursements for programs previously managed by the Office of Civil Rights (1890 and 1994 Programs) and the Agricultural Research Service (HSI Program)
The Assistant Secretary for Civil Rights and the Office of Civil Rights (OCR) provide policy guidance leadership coordination and training and complaint prevention and processing for the Department and the agencies OCRrsquos mission is to facilitate the fair and equitable treatment of USDA customers and employees and ensure the delivery and enforcement of civil rights programs and activities Through its efforts OCR strives to 1) foster a positive civil rights climate at USDA 2) process Equal Employment Opportunity (EEO) and program complaints in a timely efficient and cost effective manner 3) reduce and prevent EEO and program complaints through training and guidance and 4) offer alternative dispute resolution services The 2011 budget requests $24 million for OCR to meet the Administrationrsquos commitment to improving USDArsquos handling of civil rights matters An additional $09 million is requested to reflect the transfer of the Office of the Assistant Secretary for Civil Rights to Departmental Management from the Office of the Secretary
The Office of the Chief Financial Officer (OCFO) provides overall direction and leadership in the development of financial management policies and systems and produces the Departmentrsquos consolidated financial statements and Strategic Plan OCFO also oversees the provision of administrative accounting payroll and related systems for USDA and other agencies through operation of the National Finance Center The 2011 budget requests $7 million for OCFO to continue its leadership and oversight of the Departmentrsquos financial management process and implementation of the Federal Funding Accountability and Transparency Act the Improper Payments Information Act and Departmental travel and debarment and suspension policies
The Office of Budget and Program Analysis (OBPA) provides analyses and information to the Secretary and other senior policy officials to support informed decision-making regarding the Departmentrsquos programs and policies and budget legislative and regulatory actions OBPA also serves the key functions of providing information to the Office of Management and Budget and the Appropriations Committees related to the USDA budget and coordinating the Departmentrsquos implementation of the Farm Bill including providing relevant implementation and mandatory spending information to the Authorizing Committees The 2011 budget requests $9 million for OBPA for the continued delivery of analyses and support provided to USDA policy officials
The Office of the Chief Information Officer (OCIO) provides policy guidance leadership and coordination for the Departments information management technology investment and cyber security activities in support of USDA program delivery The 2011 budget requests $64 million for OCIO to fund on-going activities including efforts to improve the Departmentrsquos cyber security posture This request includes an increase of $2 million to expand a Department-wide cyber security initiative to address deficiencies in the USDA network and IT systems Through this initiative OCIO conducts network security assessments to identify system vulnerabilities and operates a Security Operations Center that provides continuous cyber security
128
DEPARTMENTAL ACTIVITIES
monitoring of the Departmentrsquos network Through the continued implementation of the initiative the Department will address critical vulnerabilities while establishing a multi-layer cyber security structure
Departmental Administration (DA) provides overall direction leadership and coordination for the Departmentrsquos management of human resources ethics property procurement facilities management small and disadvantaged business utilization programs and the regulatory hearing and administrative proceedings conducted by the Administrative Law Judges and the Judicial Officer The 2011 budget requests $31 million for DA including a $17 million increase to implement a human resources initiative in USDA that will build the capabilities of the Departmentrsquos workforce through leadership development and veteran hiring In addition the budget requests a decrease in DA of $13 million to reflect the transfer of the agriculture reconstruction and stabilization activities in Afghanistan and Iraq to FAS As these efforts support implementation of Presidential strategies by providing technical experts who serve as advisors to key government ministries and serve on civilian-military command units including Provincial Reconstruction Teams these international activities are best managed through FAS
DA also manages the BioPreferred Program as authorized in section 9002 of the Farm Bill as amended by the 2008 Farm Bill As part of this program DA is developing a USDA Certified Biobased Label that will allow manufacturers and vendors of qualifying biobased products market their products utilizing the label In support of the programrsquos implementation the budget requests $03 million to ensure the integrity and enforce compliance with the USDA Certified Biobased Labeling Program This funding will be used to establish an audit program through which DA can monitor the use of the biobased label in the market to ensure that vendors and manufacturers of biobased products are utilizing the label in accordance with program regulations In addition to the funding request USDA is also seeking legislative authority to assess monetary penalties for violations of the Biobased Labeling regulations to further ensure the programrsquos integrity and public trust in the label
In addition the 2011 budget requests $65 million to support a Government-wide Contracting and Acquisition Workforce Training initiative The requested funding will allow USDA to implement training recruitment and retention activities for the Departmentrsquos procurement workforce that is responsible for over $5 billion in annual procurement for the Department These workforce efforts along with procurement system improvements will allow USDA to achieve substantial cost savings and avoidances in the contracting and acquisition activities across all agencies
The Office of Homeland Security (OHS) provides a central homeland security oversight and assistance capability within USDA OHS is responsible for providing oversight and coordination of the Departmentrsquos preparation and response to matters of homeland security importance In addition OHS is responsible for providing the protective services for the Secretary and Deputy Secretary of Agriculture The 2011 budget requests $2 million for OHS to continue its leadership and coordination of Departmental security matters to ensure that USDA is prepared for potential threats or emergency situations
129
DEPARTMENTAL ACTIVITIES
The request for Agriculture Buildings and Facilities (Ag BampF) and Rental Payments for 2011 is $278 million The account provides funding for the rental payments to the General Services Administration (GSA) and security services payments to the Department of Homeland Security (DHS) This account is also responsible for all maintenance utilities and administration of the more than 25 million square feet in the two USDA headquarters buildings The 2011 budget includes $179 million for payments to GSA for rent and $14 million to DHS for building security The budget requests an increase of $14 million for a total of $28 million in 2011 to continue modernization of the Departmentrsquos South Building As the building houses over 5800 USDA employees it is critical that the facility be renovated to eliminate environmental hazards and to reduce overall energy consumption The renovation project will preserve and restore the historic features of the building replace antiquated heating and cooling systems plumbing and electrical systems eliminate environmental hazards such as asbestos and lead paint provide accommodations for persons with disabilities and create modern and efficient office space The 2011 budget also requests authority to use prior year unobligated balances to pay deficiencies incurred between 2004 and 2008
In addition the budget also proposes an increase of $04 million to implement provisions of the Departmentrsquos Employee Satisfaction and Wellness Program This funding will allow USDA to improve offerings to employees related to healthy eating options and physical fitness USDA employees and the over 100000 annual visitors to the South Building cafeteria would be educated on the importance of farmers and origins of the food being served while employees would benefit from improved fitness equipment and class offerings in the fitness center
The Hazardous Materials Management (HMM) Program provides for the efficient management and cleanup of hazardous materials on facilities and lands under the jurisdiction custody and control of the Department and the prevention of releases of hazardous substances from USDA facilities The 2011 budget requests $5 million for the HMM program to conduct cleanup and remediation activities to seek repayment from polluters for hazardous materials cleanup responsibilities and to assist the Department in meeting Federal environmental laws
130
DEPARTMENTAL ACTIVITIES
DEPARTMENTAL STAFF OFFICES
Budget Authority (Dollars in Millions)
2009 2010 2011 Program Enacted Estimate Budget
Discretionary Office of the Chief Economisthelliphelliphelliphelliphelliphelliphelliphelliphelliphelliphelliphellip $11 $13 $13 National Appeals Divisionhelliphelliphelliphelliphelliphelliphelliphelliphelliphelliphelliphelliphelliphellip 15 15 15 Office of Communicationshelliphelliphelliphelliphelliphelliphelliphelliphelliphelliphelliphelliphelliphellip 10 10 10 Office of the General Counselhelliphelliphelliphelliphelliphelliphelliphelliphelliphelliphelliphellip 42 44 46 Total Discretionary Programshelliphelliphelliphelliphelliphelliphelliphelliphelliphelliphellip 78 82 84 Mandatory Farm Bill Biodiesel Fuel Education Programhelliphelliphelliphelliphelliphelliphelliphelliphelliphellip 1 1 1
Total Mandatory Programshelliphelliphelliphelliphelliphelliphelliphelliphelliphelliphelliphellip 1 1 1
Total Departmental Staff Officeshelliphelliphelliphelliphelliphelliphelliphelliphelliphellip $79 $83 $85
The Departmental Staff Offices provide legal and economic support and communications coordination for the Departmentrsquos program activities These offices are vital to USDArsquos success in creating opportunities for Americarsquos farmers ranchers and rural communities by providing economic analyses and legal counsel to the Departmentrsquos policy officials and decision makers The 2011 budget proposes funding to ensure that these offices maintain the staffing levels needed to provide leadership oversight and coordination
The Office of the Chief Economist (OCE) advises the Secretary and Department officials on the economic implications of Department policies programs and proposed legislation and serves as the focal point for the Departmentrsquos economic intelligence analysis and review related to domestic and international food and agriculture markets OCE also provides advice and analysis on bioenergy new uses of agricultural products sustainable development agricultural labor and global climate change The 2011 budget requests $13 million for OCE to continue its support of USDA policy officials and the dissemination of agricultural economic information
The National Appeals Division (NAD) conducts evidentiary administrative appeal hearings and reviews arising from program operations of the Rural Development mission area the Farm Service Agency the Risk Management Agency and the Natural Resources Conservation Service The 2011 budget requests $15 million for NAD to continue activities to increase the fairness of program delivery by the Service Center Agencies
The Departmentrsquos Office of Communications (OC) provides leadership and coordination for the development of communication strategies for the Department and plays a critical role in disseminating information about USDArsquos programs to the general public The 2011 budget
131
DEPARTMENTAL ACTIVITIES
requests $10 million for OC to continue to develop effective communications strategies that make USDA programs and operations more open and transparent to the public
The Office of the General Counsel (OGC) provides legal oversight counsel and support to the Departmentrsquos agencies The 2011 budget requests $46 million for OGC including an increase of $15 million to ensure that OGC has the resources to conduct necessary training and travel and other activities for which funding has been reduced in recent years to cover salary expenses This funding will be used to maintain and improve OGC service delivery to the entire Department
132
OFFICE OF INSPECTOR GENERAL
OFFICE OF INSPECTOR GENERAL
Budget Authority (Dollars in Millions)
2009 2010 2011 Program Enacted Estimate Budget
Discretionary Ongoing Appropriationshelliphelliphelliphelliphelliphelliphelliphelliphelliphelliphelliphelliphelliphelliphellip $86 $89 $90 Recovery Act Fundinghelliphelliphelliphelliphelliphelliphelliphelliphelliphelliphelliphelliphelliphelliphellip 22 0 0 Total Office of Inspector Generalhelliphelliphelliphelliphelliphelliphelliphelliphelliphellip $108 $89 $90
The Office of Inspector General (OIG) conducts and supervises audits to prevent and detect fraud waste and abuse and to improve the effectiveness of USDA programs and operations As the law enforcement arm of USDA OIG also investigates criminal activity involving the Departmentrsquos programs and personnel The 2011 budget requests $90 million for OIG for audit and investigation review of the Departmentrsquos programs This funding includes an increase of $04 million to support the Council of Inspectors General for Integrity and Efficiency to coordinate Federal efforts to improve program delivery The Council was established under the authority of the Inspector General Reform Act of 2008 In addition an increase of $02 million is requested for training activities to ensure that OIG effectively meets professional training standards and necessary federal law enforcement requirements
133
APPENDIX
UNITED STATES DEPARTMENT OF AGRICULTURE (Dollars in Millions)
Budget Authority
Change 2009 2010 2011 2010 to
AGENCYPROGRAM Enacted Estimate Budget 2011 FARM AND FOREIGN AGRICULTURAL SERVICES Farm Service Agency Discretionary Programshelliphelliphelliphelliphelliphelliphelliphelliphelliphelliphelliphelliphelliphelliphelliphelliphelliphelliphelliphelliphelliphellip $1645 $2082 $1846 -$236 Mandatory Programs (excluding CCC)helliphelliphelliphelliphelliphelliphelliphelliphelliphelliphelliphelliphelliphelliphelliphellip 704 527 892 365
Recovery Acthelliphelliphelliphelliphelliphelliphelliphelliphelliphelliphelliphelliphelliphelliphelliphelliphelliphelliphelliphelliphelliphelliphelliphelliphelliphellip 120 230 0 -230 Other Supplementalshelliphelliphelliphelliphelliphelliphelliphelliphelliphelliphelliphelliphelliphelliphelliphelliphelliphelliphelliphelliphelliphelliphellip 71 0 0 0 Commodity Credit Corporation Programs (mandatory)helliphelliphelliphelliphelliphelliphelliphelliphelliphellip 13061 11819 11482 -337 Total Farm Service Agencyhelliphelliphelliphelliphelliphelliphelliphelliphelliphelliphelliphelliphelliphelliphelliphelliphelliphelliphelliphellip 15601 14658 14220 -438
Risk Management Agency Discretionary Programshelliphelliphelliphelliphelliphelliphelliphelliphelliphelliphelliphelliphelliphelliphelliphelliphelliphelliphelliphelliphelliphellip 77 80 83 3 Mandatory Programshelliphelliphelliphelliphelliphelliphelliphelliphelliphelliphelliphelliphelliphelliphelliphelliphelliphelliphelliphelliphelliphelliphellip 6767 6455 7613 1158 Total Risk Management Agencyhelliphelliphelliphelliphelliphelliphelliphelliphelliphelliphelliphelliphelliphelliphelliphelliphelliphellip 6844 6535 7696 1161
Foreign Agricultural Service Discretionary Programs (excluding PL 480)helliphelliphelliphelliphelliphelliphelliphelliphelliphelliphelliphelliphelliphellip 265 390 468 78 Mandatory Programshelliphelliphelliphelliphelliphelliphelliphelliphelliphelliphelliphelliphelliphelliphelliphelliphelliphelliphelliphelliphelliphelliphellip 584 439 386 -53 Recovery Acthelliphelliphelliphelliphelliphelliphelliphelliphelliphelliphelliphelliphelliphelliphelliphelliphelliphelliphelliphelliphelliphelliphelliphelliphelliphellip 25 90 22 -68 PL 480 (discretionary)helliphelliphelliphelliphelliphelliphelliphelliphelliphelliphelliphelliphelliphelliphelliphelliphelliphelliphelliphelliphelliphellip 1229 1693 1693 0 PL 480 (supplemental appropriations)helliphelliphelliphelliphelliphelliphelliphelliphelliphelliphelliphelliphelliphelliphelliphellip 1095 0 0 0
Total Foreign Agricultural Servicehelliphelliphelliphelliphelliphelliphelliphelliphelliphelliphelliphelliphelliphelliphelliphelliphellip 3198 2612 2569 -43 Total Farm and Foreign Agricultural Serviceshelliphelliphelliphelliphelliphelliphelliphelliphelliphelliphellip 25644 23805 24485 681
RURAL DEVELOPMENT Rural Utilities Service Discretionary Programshelliphelliphelliphelliphelliphelliphelliphelliphelliphelliphelliphelliphelliphelliphelliphelliphelliphelliphelliphelliphelliphellip 660 694 643 -51 Recovery Acthelliphelliphelliphelliphelliphelliphelliphelliphelliphelliphelliphelliphelliphelliphelliphelliphelliphelliphelliphelliphelliphelliphelliphelliphelliphellip 3804 0 0 0 Total Rural Utilities Servicehelliphelliphelliphelliphelliphelliphelliphelliphelliphelliphelliphelliphelliphelliphelliphelliphelliphelliphelliphellip 4464 694 643 -51
Rural Housing Service Discretionary Programshelliphelliphelliphelliphelliphelliphelliphelliphelliphelliphelliphelliphelliphelliphelliphelliphelliphelliphelliphelliphelliphellip 1754 1893 1705 -188 Recovery Acthelliphelliphelliphelliphelliphelliphelliphelliphelliphelliphelliphelliphelliphelliphelliphelliphelliphelliphelliphelliphelliphelliphelliphelliphelliphellip 320 0 0 0 Total Rural Housing Servicehelliphelliphelliphelliphelliphelliphelliphelliphelliphelliphelliphelliphelliphelliphelliphelliphelliphelliphellip 2074 1893 1705 -188
Rural Business - Cooperative Service Discretionary Programshelliphelliphelliphelliphelliphelliphelliphelliphelliphelliphelliphelliphelliphelliphelliphelliphelliphelliphelliphelliphelliphellip 132 190 205 15 Mandatory Programshelliphelliphelliphelliphelliphelliphelliphelliphelliphelliphelliphelliphelliphelliphelliphelliphelliphelliphelliphelliphelliphelliphellip 239 364 159 -205 Recovery Acthelliphelliphelliphelliphelliphelliphelliphelliphelliphelliphelliphelliphelliphelliphelliphelliphelliphelliphelliphelliphelliphelliphelliphelliphelliphellip 145 0 0 0 Total Rural Business - Cooperative Servicehelliphelliphelliphelliphelliphelliphelliphelliphelliphelliphelliphelliphellip 516 554 364 -190
Rural Development Salaries and Expenses Discretionary Programshelliphelliphelliphelliphelliphelliphelliphelliphelliphelliphelliphelliphelliphelliphelliphelliphelliphelliphelliphelliphelliphellip 193 202 232 30 Recovery Acthelliphelliphelliphelliphelliphelliphelliphelliphelliphelliphelliphelliphelliphelliphelliphelliphelliphelliphelliphelliphelliphelliphelliphelliphelliphellip 131 0 0 0 Total Salaries and Expenseshelliphelliphelliphelliphelliphelliphelliphelliphelliphelliphelliphelliphelliphelliphelliphelliphelliphelliphellip 324 202 232 30
Total Rural Developmenthelliphelliphelliphelliphelliphelliphelliphelliphelliphelliphelliphelliphelliphelliphelliphelliphelliphelliphellip 7378 3343 2944 -399 FOOD NUTRITION AND CONSUMER SERVICES Food and Nutrition Service Discretionary Programshelliphelliphelliphelliphelliphelliphelliphelliphelliphelliphelliphelliphelliphelliphelliphelliphelliphelliphelliphelliphelliphellip 7239 7659 8025 366 Mandatory Programshelliphelliphelliphelliphelliphelliphelliphelliphelliphelliphelliphelliphelliphelliphelliphelliphelliphelliphelliphelliphelliphelliphellip 69065 75335 87656 12321 Recovery Acthelliphelliphelliphelliphelliphelliphelliphelliphelliphelliphelliphelliphelliphelliphelliphelliphelliphelliphelliphelliphelliphelliphelliphelliphelliphellip 5945 10460 11936 1476 Other Supplementalshelliphelliphelliphelliphelliphelliphelliphelliphelliphelliphelliphelliphelliphelliphelliphelliphelliphelliphelliphelliphelliphelliphellip 0 400 0 -400
Total Food Nutrition and Consumer Serviceshelliphelliphelliphelliphelliphelliphelliphelliphelliphelliphellip 82249 93854 107617 13763 FOOD SAFETY Food Safety and Inspection Service Discretionary Programshelliphelliphelliphelliphelliphelliphelliphelliphelliphelliphelliphelliphelliphelliphelliphelliphelliphelliphelliphelliphelliphellip 972 1019 1037 18 Mandatory Programshelliphelliphelliphelliphelliphelliphelliphelliphelliphelliphelliphelliphelliphelliphelliphelliphelliphelliphelliphelliphelliphelliphellip 11 9 9 0
Total Food Safetyhelliphelliphelliphelliphelliphelliphelliphelliphelliphelliphelliphelliphelliphelliphelliphelliphelliphelliphelliphelliphelliphellip 983 1028 1046 18 NATURAL RESOURCES AND ENVIRONMENT Natural Resources Conservation Service Discretionary Programshelliphelliphelliphelliphelliphelliphelliphelliphelliphelliphelliphelliphelliphelliphelliphelliphelliphelliphelliphelliphelliphellip 968 1009 964 -45 Mandatory Programshelliphelliphelliphelliphelliphelliphelliphelliphelliphelliphelliphelliphelliphelliphelliphelliphelliphelliphelliphelliphelliphelliphellip 2163 2973 3029 56 Recovery Acthelliphelliphelliphelliphelliphelliphelliphelliphelliphelliphelliphelliphelliphelliphelliphelliphelliphelliphelliphelliphelliphelliphelliphelliphelliphellip 340 0 0 0 Total Natural Resources Conservation Servicehelliphelliphelliphelliphelliphelliphelliphelliphelliphelliphelliphellip 3471 3982 3993 11
134
APPENDIX
UNITED STATES DEPARTMENT OF AGRICULTURE (Dollars in Millions)
Budget Authority Change
2009 2010 2011 2010 to AGENCYPROGRAM Enacted Estimate Budget 2011
Forest Service Discretionary Programshelliphelliphelliphelliphelliphelliphelliphelliphelliphelliphelliphelliphelliphelliphelliphelliphelliphelliphelliphelliphelliphellip 4759 5315 5377 62 Mandatory Programshelliphelliphelliphelliphelliphelliphelliphelliphelliphelliphelliphelliphelliphelliphelliphelliphelliphelliphelliphelliphelliphelliphellip 994 836 768 -68 Recovery Acthelliphelliphelliphelliphelliphelliphelliphelliphelliphelliphelliphelliphelliphelliphelliphelliphelliphelliphelliphelliphelliphelliphelliphelliphelliphellip 1150 0 0 0 Other Supplementalshelliphelliphelliphelliphelliphelliphelliphelliphelliphelliphelliphelliphelliphelliphelliphelliphelliphelliphelliphelliphelliphelliphellip 200 0 0 0 Total Forest Servicehelliphelliphelliphelliphelliphelliphelliphelliphelliphelliphelliphelliphelliphelliphelliphelliphelliphelliphelliphelliphelliphelliphellip 7103 6151 6145 -6
Total Natural Resources and Environmenthelliphelliphelliphelliphelliphelliphelliphelliphelliphelliphelliphellip 10574 10133 10138 5 MARKETING AND REGULATORY PROGRAMS Animal and Plant Health Inspection Service Discretionary Programshelliphelliphelliphelliphelliphelliphelliphelliphelliphelliphelliphelliphelliphelliphelliphelliphelliphelliphelliphelliphelliphellip 881 910 875 -35 Mandatory Programshelliphelliphelliphelliphelliphelliphelliphelliphelliphelliphelliphelliphelliphelliphelliphelliphelliphelliphelliphelliphelliphelliphellip 181 250 259 9 Emergency Funding (CCC)helliphelliphelliphelliphelliphelliphelliphelliphelliphelliphelliphelliphelliphelliphelliphelliphelliphelliphelliphelliphellip 29 28 0 -28 Total Animal and Plant Health Inspection Servicehelliphelliphelliphelliphelliphelliphelliphelliphelliphelliphellip 1091 1188 1134 -54 Agricultural Marketing Service Discretionary Programshelliphelliphelliphelliphelliphelliphelliphelliphelliphelliphelliphelliphelliphelliphelliphelliphelliphelliphelliphelliphelliphellip 89 93 100 7 Mandatory Programshelliphelliphelliphelliphelliphelliphelliphelliphelliphelliphelliphelliphelliphelliphelliphelliphelliphelliphelliphelliphelliphelliphellip 1223 1305 1235 -70 Total Agricultural Marketing Servicehelliphelliphelliphelliphelliphelliphelliphelliphelliphelliphelliphelliphelliphelliphelliphellip 1312 1398 1335 -63 Grain Inspection Packers and Stockyards Administration Discretionary Programshelliphelliphelliphelliphelliphelliphelliphelliphelliphelliphelliphelliphelliphelliphelliphelliphelliphelliphelliphelliphelliphellip 40 42 44 2
Total Marketing and Regulatory Programshelliphelliphelliphelliphelliphelliphelliphelliphelliphelliphelliphellip 2443 2628 2513 -115 RESEARCH EDUCATION AND ECONOMICS Agricultural Research Service Discretionary Programshelliphelliphelliphelliphelliphelliphelliphelliphelliphelliphelliphelliphelliphelliphelliphelliphelliphelliphelliphelliphelliphellip 1190 1251 1200 -51 Mandatory Programshelliphelliphelliphelliphelliphelliphelliphelliphelliphelliphelliphelliphelliphelliphelliphelliphelliphelliphelliphelliphelliphelliphellip 24 24 24 0 Recovery Acthelliphelliphelliphelliphelliphelliphelliphelliphelliphelliphelliphelliphelliphelliphelliphelliphelliphelliphelliphelliphelliphelliphelliphelliphelliphellip 176 0 0 0 Total Agricultural Research Servicehelliphelliphelliphelliphelliphelliphelliphelliphelliphelliphelliphelliphelliphelliphelliphellip 1390 1275 1224 -51 National Institute of Food and Agriculture Discretionary Programshelliphelliphelliphelliphelliphelliphelliphelliphelliphelliphelliphelliphelliphelliphelliphelliphelliphelliphelliphelliphelliphellip 1226 1351 1347 -5 Mandatory Programshelliphelliphelliphelliphelliphelliphelliphelliphelliphelliphelliphelliphelliphelliphelliphelliphelliphelliphelliphelliphelliphelliphellip 124 135 147 12 Total National Institute of Food and Agriculturehelliphelliphelliphelliphelliphelliphelliphelliphelliphelliphelliphellip 1350 1486 1494 7 Economic Research Service Discretionary Programshelliphelliphelliphelliphelliphelliphelliphelliphelliphelliphelliphelliphelliphelliphelliphelliphelliphelliphelliphelliphelliphellip 80 82 87 5 National Agricultural Statistics Service Discretionary Programshelliphelliphelliphelliphelliphelliphelliphelliphelliphelliphelliphelliphelliphelliphelliphelliphelliphelliphelliphelliphelliphellip 152 162 165 3
Total Research Education and Economicshelliphelliphelliphelliphelliphelliphelliphelliphelliphelliphelliphellip 2972 3005 2970 -36 OTHER ACTIVITIES Departmental Activities Discretionary Programshelliphelliphelliphelliphelliphelliphelliphelliphelliphelliphelliphelliphelliphelliphelliphelliphelliphelliphelliphelliphelliphellip 425 546 573 27 Mandatory Programshelliphelliphelliphelliphelliphelliphelliphelliphelliphelliphelliphelliphelliphelliphelliphelliphelliphelliphelliphelliphelliphelliphellip 19 24 24 0 Recovery Acthelliphelliphelliphelliphelliphelliphelliphelliphelliphelliphelliphelliphelliphelliphelliphelliphelliphelliphelliphelliphelliphelliphelliphelliphelliphellip 24 0 0 0 Total Departmental Activitieshelliphelliphelliphelliphelliphelliphelliphelliphelliphelliphelliphelliphelliphelliphelliphelliphelliphelliphellip 468 570 597 27 Office of Inspector General Discretionary Programshelliphelliphelliphelliphelliphelliphelliphelliphelliphelliphelliphelliphelliphelliphelliphelliphelliphelliphelliphelliphelliphellip 86 89 90 1 Recovery Acthelliphelliphelliphelliphelliphelliphelliphelliphelliphelliphelliphelliphelliphelliphelliphelliphelliphelliphelliphelliphelliphelliphelliphelliphelliphellip 22 0 0 0 Total Office of Inspector Generalhelliphelliphelliphelliphelliphelliphelliphelliphelliphelliphelliphelliphelliphelliphelliphelliphellip 108 89 90 1
Total Departmental Activitieshelliphelliphelliphelliphelliphelliphelliphelliphelliphelliphelliphelliphelliphelliphelliphelliphellip 576 659 687 28
USDA SUB-TOTALhelliphelliphelliphelliphelliphelliphelliphelliphelliphelliphelliphelliphelliphelliphelliphelliphelliphelliphelliphelliphelliphellip $132819 $138455 $152400 $13945 Offsetting Receiptshelliphelliphelliphelliphelliphelliphelliphelliphelliphelliphelliphelliphelliphelliphelliphelliphelliphelliphelliphelliphelliphelliphelliphellip -4993 -2936 -3795 -859 USDA TOTALhelliphelliphelliphelliphelliphelliphelliphelliphelliphelliphelliphelliphelliphelliphelliphelliphelliphelliphelliphelliphelliphelliphelliphelliphelliphellip $127826 $135519 $148605 $13086
135
APPENDIX
UNITED STATES DEPARTMENT OF AGRICULTURE (Dollars in Millions)
Program Level
Change 2009 2010 2011 2010 to
AGENCYPROGRAM Enacted Estimate Budget 2011
FARM AND FOREIGN AGRICULTURAL SERVICES Farm Service Agency Farm Loan and Grant Programshelliphelliphelliphelliphelliphelliphelliphelliphelliphelliphelliphelliphelliphelliphellip $4551 $5140 $4797 -$343 Conservation and Other Programshelliphelliphelliphelliphelliphelliphelliphelliphelliphelliphelliphelliphelliphellip 2282 2359 2154 -205 Disaster Assistancehelliphelliphelliphelliphelliphelliphelliphelliphelliphelliphelliphelliphelliphelliphelliphelliphelliphelliphelliphellip 703 526 891 365 Commodity Programshelliphelliphelliphelliphelliphelliphelliphelliphelliphelliphelliphelliphelliphelliphelliphelliphelliphelliphellip 17679 18458 18315 -143 Commodity Credit Corporation Programshelliphelliphelliphelliphelliphelliphelliphelliphelliphelliphellip (25453) (26437) (26255) (-182) Salaries and Expenseshelliphelliphelliphelliphelliphelliphelliphelliphelliphelliphelliphelliphelliphelliphelliphelliphelliphelliphellip 1483 1570 1686 116 Total Farm Service Agencyhelliphelliphelliphelliphelliphelliphelliphelliphelliphelliphelliphelliphelliphelliphelliphellip 26699 28053 27843 -211
Risk Management Agency Administrative and Operating Expenseshelliphelliphelliphelliphelliphelliphelliphelliphelliphelliphelliphellip 77 80 83 3 Crop Insurance Fundhelliphelliphelliphelliphelliphelliphelliphelliphelliphelliphelliphelliphelliphelliphelliphelliphelliphelliphellip 7998 9556 11373 1817 Total Risk Management Agencyhelliphelliphelliphelliphelliphelliphelliphelliphelliphelliphelliphelliphelliphellip 8075 9636 11456 1820
Foreign Agricultural Service Export Credit Guaranteeshelliphelliphelliphelliphelliphelliphelliphelliphelliphelliphelliphelliphelliphelliphelliphelliphellip 5357 5500 5500 0 Market Development Programshelliphelliphelliphelliphelliphelliphelliphelliphelliphelliphelliphelliphelliphelliphellip 251 252 213 -39 Dairy Export Incentive Programhelliphelliphelliphelliphelliphelliphelliphelliphelliphelliphelliphelliphelliphelliphellip 19 10 0 -10 Foreign Food Assistancehelliphelliphelliphelliphelliphelliphelliphelliphelliphelliphelliphelliphelliphelliphelliphelliphellip 312 175 171 -4 Trade Adjustment Assistance for Farmershelliphelliphelliphelliphelliphelliphelliphelliphelliphelliphellip 25 90 22 -68 Salaries and Expenseshelliphelliphelliphelliphelliphelliphelliphelliphelliphelliphelliphelliphelliphelliphelliphelliphelliphelliphellip 311 527 398 -129 Total Foreign Agricultural Servicehelliphelliphelliphelliphelliphelliphelliphelliphelliphelliphelliphelliphelliphellip 6275 6554 6304 -250
Total Farm and Foreign Agricultural Serviceshelliphelliphelliphelliphelliphelliphelliphelliphellip 41049 44243 45603 1359
RURAL DEVELOPMENT Rural Utilities Service Loans and Grantshelliphelliphelliphelliphelliphelliphelliphelliphelliphelliphelliphelliphelliphelliphelliphelliphelliphelliphelliphellip 21722 9875 6833 -3042
Rural Housing Service Loans and Grantshelliphelliphelliphelliphelliphelliphelliphelliphelliphelliphelliphelliphelliphelliphelliphelliphelliphelliphelliphellip 22568 15525 15563 38
Rural Business - Cooperative Service Loans and Grantshelliphelliphelliphelliphelliphelliphelliphelliphelliphelliphelliphelliphelliphelliphelliphelliphelliphelliphelliphellip 3406 2328 1431 -897
Salaries and Expenseshelliphelliphelliphelliphelliphelliphelliphelliphelliphelliphelliphelliphelliphelliphelliphelliphelliphellip 324 202 232 30 Total Rural Developmenthelliphelliphelliphelliphelliphelliphelliphelliphelliphelliphelliphelliphelliphelliphelliphellip 48020 27930 24059 -3871
FOOD NUTRITION AND CONSUMER SERVICES Food and Nutrition Service Supplemental Nutrition Assistance Programhelliphelliphelliphelliphelliphelliphelliphelliphelliphelliphellip 51442 60413 63211 2798 Child Nutrition Programshelliphelliphelliphelliphelliphelliphelliphelliphelliphelliphelliphelliphelliphelliphelliphelliphelliphellip 15406 17299 18403 1104 Women Infants and Children (WIC)helliphelliphelliphelliphelliphelliphelliphelliphelliphelliphelliphelliphellip 6956 7746 8058 312 All Otherhelliphelliphelliphelliphelliphelliphelliphelliphelliphelliphelliphelliphelliphelliphelliphelliphelliphelliphelliphelliphelliphelliphelliphellip 408 423 442 19
Total Food Nutrition and Consumer Serviceshelliphelliphelliphelliphelliphelliphelliphellip 74212 85881 90114 4233
FOOD SAFETY Food Safety and Inspection Servicehelliphelliphelliphelliphelliphelliphelliphelliphelliphelliphelliphelliphellip 983 1028 1046 18
136
APPENDIX
UNITED STATES DEPARTMENT OF AGRICULTURE (Dollars in Millions)
Program Level Change
2009 2010 2011 2010 to AGENCYPROGRAM Enacted Estimate Budget 2011
NATURAL RESOURCES AND ENVIRONMENT Natural Resources Conservation Service Conservation Operationshelliphelliphelliphelliphelliphelliphelliphelliphelliphelliphelliphelliphelliphelliphelliphelliphellip 853 888 924 36 Watershed Programshelliphelliphelliphelliphelliphelliphelliphelliphelliphelliphelliphelliphelliphelliphelliphelliphelliphelliphellip 404 70 40 -30 Resource Conservation and Developmenthelliphelliphelliphelliphelliphelliphelliphelliphelliphellip 51 51 0 -51 Farm Security and Rural Investment Programshelliphelliphelliphelliphelliphelliphelliphellip 2163 2973 3029 56
Total Natural Resources Conservation Servicehelliphelliphelliphelliphelliphelliphelliphellip 3471 3982 3993 11
Forest Service National Forest Systemhelliphelliphelliphelliphelliphelliphelliphelliphelliphelliphelliphelliphelliphelliphelliphelliphelliphellip 1510 1551 1586 35 Forest and Rangeland Researchhelliphelliphelliphelliphelliphelliphelliphelliphelliphelliphelliphelliphelliphellip 296 312 304 -8 State and Private Forestryhelliphelliphelliphelliphelliphelliphelliphelliphelliphelliphelliphelliphelliphelliphelliphelliphellip 266 308 322 14 Wildland Fire Activitieshelliphelliphelliphelliphelliphelliphelliphelliphelliphelliphelliphelliphelliphelliphelliphelliphellip 2832 2517 2645 128 Capital Improvement and Maintenancehelliphelliphelliphelliphelliphelliphelliphelliphelliphelliphellip 1145 556 438 -118 Land Acquisitionhelliphelliphelliphelliphelliphelliphelliphelliphelliphelliphelliphelliphelliphelliphelliphelliphelliphelliphelliphellip 51 65 75 10 All Otherhelliphelliphelliphelliphelliphelliphelliphelliphelliphelliphelliphelliphelliphelliphelliphelliphelliphelliphelliphelliphelliphelliphellip 9 6 6 0
Total Discretionary Accountshelliphelliphelliphelliphelliphelliphelliphelliphelliphelliphelliphelliphelliphellip 6109 5315 5377 62 Mandatoryhelliphelliphelliphelliphelliphelliphelliphelliphelliphelliphelliphelliphelliphelliphelliphelliphelliphelliphelliphelliphelliphelliphellip 994 836 768 -68
Total Forest Servicehelliphelliphelliphelliphelliphelliphelliphelliphelliphelliphelliphelliphelliphelliphelliphelliphelliphellip 7103 6151 6145 -6 Total Natural Resources and Environmenthelliphelliphelliphelliphelliphelliphelliphelliphellip 10574 10133 10138 5
MARKETING AND REGULATORY PROGRAMS Animal and Plant Health Inspection Service Salaries and Expenseshelliphelliphelliphelliphelliphelliphelliphelliphelliphelliphelliphelliphelliphelliphelliphelliphelliphellip 877 905 870 -35 Emergency Fundinghelliphelliphelliphelliphelliphelliphelliphelliphelliphelliphelliphelliphelliphelliphelliphelliphelliphelliphellip 29 28 0 -28 Mandatoryhelliphelliphelliphelliphelliphelliphelliphelliphelliphelliphelliphelliphelliphelliphelliphelliphelliphelliphelliphelliphelliphelliphellip 181 250 259 9 Buildings and Facilitieshelliphelliphelliphelliphelliphelliphelliphelliphelliphelliphelliphelliphelliphelliphelliphelliphellip 5 5 5 0
Total Animal and Plant Health Inspection Servicehelliphelliphelliphelliphelliphellip 1092 1188 1134 -54 Agricultural Marketing Servicehelliphelliphelliphelliphelliphelliphelliphelliphelliphelliphelliphelliphelliphellip 300 300 320 20 Section 32 Fundshelliphelliphelliphelliphelliphelliphelliphelliphelliphelliphelliphelliphelliphelliphelliphelliphelliphelliphelliphellip 1012 1098 1015 -83 Grain Inspection Packers and Stockyards
Administrationhelliphelliphelliphelliphelliphelliphelliphelliphelliphelliphelliphelliphelliphelliphelliphelliphelliphelliphelliphellip 40 42 44 2 Total Marketing and Regulatory Programshelliphelliphelliphelliphelliphelliphelliphellip 2444 2628 2513 -115
RESEARCH EDUCATION AND ECONOMICS Agricultural Research Servicehelliphelliphelliphelliphelliphelliphelliphelliphelliphelliphelliphelliphelliphelliphellip 1390 1275 1224 -51 National Institute of Food and Agriculturehelliphelliphelliphelliphelliphelliphelliphelliphellip 1350 1486 1494 7 Economic Research Servicehelliphelliphelliphelliphelliphelliphelliphelliphelliphelliphelliphelliphelliphelliphelliphellip 80 82 87 5 National Agricultural Statistics Servicehelliphelliphelliphelliphelliphelliphelliphelliphelliphelliphellip 152 162 165 3
Total Research Education and Economicshelliphelliphelliphelliphelliphelliphelliphellip 2972 3005 2970 -36
OTHER ACTIVITIES
Office of the Secretaryhelliphelliphelliphelliphelliphelliphelliphelliphelliphelliphelliphelliphelliphelliphelliphelliphelliphellip 16 19 56 37 Departmental Managementhelliphelliphelliphelliphelliphelliphelliphelliphelliphelliphelliphelliphelliphelliphelliphellip 371 467 456 -11 Departmental Staff Officeshelliphelliphelliphelliphelliphelliphelliphelliphelliphelliphelliphelliphelliphelliphelliphelliphellip 80 84 86 2 Office of Inspector Generalhelliphelliphelliphelliphelliphelliphelliphelliphelliphelliphelliphelliphelliphelliphelliphellip 108 89 90 1
Total Other Activitieshelliphelliphelliphelliphelliphelliphelliphelliphelliphelliphelliphelliphelliphelliphelliphelliphellip 575 659 688 29 USDA Sub-Totalhelliphelliphelliphelliphelliphelliphelliphelliphelliphelliphelliphelliphelliphelliphelliphelliphelliphelliphelliphellip $180829 $175507 $177131 $1623
Receipts and Loan Repayments and Other Adjustmentshelliphelliphelliphelliphellip -4993 -2936 -3795 -859
USDA TOTALhelliphelliphelliphelliphelliphelliphelliphelliphelliphelliphelliphelliphelliphelliphelliphelliphelliphelliphelliphelliphellip $175836 $172571 $173336 $764
137
APPENDIX
UNITED STATES DEPARTMENT OF AGRICULTURE
Outlays
(Dollars in Millions)
2009 2010 2011 AGENCY Actual Estimate Budget
FARM AND FOREIGN AGRICULTURAL SERVICES Farm Service Agencyhelliphelliphelliphelliphelliphelliphelliphelliphelliphelliphelliphelliphelliphelliphelliphelliphelliphelliphellip $1890 $4657 $3169 Commodity Credit Corporation Programshelliphelliphelliphelliphelliphelliphelliphelliphelliphelliphellip 11443 11927 11435 Risk Management Agencyhelliphelliphelliphelliphelliphelliphelliphelliphelliphelliphelliphelliphelliphelliphelliphelliphellip 7962 7033 7637 Foreign Agricultural Servicehelliphelliphelliphelliphelliphelliphelliphelliphelliphelliphelliphelliphelliphelliphelliphelliphellip 321 419 496 PL 480helliphelliphelliphelliphelliphelliphelliphelliphelliphelliphelliphelliphelliphelliphelliphelliphelliphelliphelliphelliphelliphelliphelliphelliphellip 1601 1185 1537
RURAL DEVELOPMENT Salaries and Expenseshelliphelliphelliphelliphelliphelliphelliphelliphelliphelliphelliphelliphelliphelliphelliphelliphelliphelliphellip 38 297 238 Rural Utilities Servicehelliphelliphelliphelliphelliphelliphelliphelliphelliphelliphelliphelliphelliphelliphelliphelliphelliphelliphellip 29 613 598 Rural Housing Servicehelliphelliphelliphelliphelliphelliphelliphelliphelliphelliphelliphelliphelliphelliphelliphelliphelliphelliphellip 1519 1928 1335 Rural Business - Cooperative Servicehelliphelliphelliphelliphelliphelliphelliphelliphelliphelliphelliphelliphellip 133 285 387 Rural Empowerment ZonesEnterprise Communitieshelliphelliphelliphelliphelliphelliphellip 16 10 3
FOOD NUTRITION AND CONSUMER SERVICES Food and Nutrition Servicehelliphelliphelliphelliphelliphelliphelliphelliphelliphelliphelliphelliphelliphelliphelliphelliphellip 77848 97945 102410
NATURAL RESOURCES AND ENVIRONMENT Natural Resources Conservation Servicehelliphelliphelliphelliphelliphelliphelliphelliphelliphelliphelliphellip 2725 3525 3722 Forest Servicehelliphelliphelliphelliphelliphelliphelliphelliphelliphelliphelliphelliphelliphelliphelliphelliphelliphelliphelliphelliphelliphellip 5945 6881 6079
FOOD SAFETY Food Safety and Inspection Servicehelliphelliphelliphelliphelliphelliphelliphelliphelliphelliphelliphelliphelliphellip 963 1004 1031
RESEARCH EDUCATION AND ECONOMICS Agricultural Research Servicehelliphelliphelliphelliphelliphelliphelliphelliphelliphelliphelliphelliphelliphelliphelliphellip 1200 1272 1251 National Institute of Food and Agriculturehelliphelliphelliphelliphelliphelliphelliphelliphelliphelliphellip 1182 1483 1624 Economic Research Servicehelliphelliphelliphelliphelliphelliphelliphelliphelliphelliphelliphelliphelliphelliphelliphelliphellip 80 81 87 National Agricultural Statistics Servicehelliphelliphelliphelliphelliphelliphelliphelliphelliphelliphelliphellip 145 162 165
MARKETING AND REGULATORY PROGRAMS Animal and Plant Health Inspection Servicehelliphelliphelliphelliphelliphelliphelliphelliphelliphellip 1183 1328 1267 Agricultural Marketing Servicehelliphelliphelliphelliphelliphelliphelliphelliphelliphelliphelliphelliphelliphelliphellip 259 281 307
Section 32 Fundshelliphelliphelliphelliphelliphelliphelliphelliphelliphelliphelliphelliphelliphelliphelliphelliphelliphelliphelliphelliphellip 948 1098 1015 Grain Inspection Packers and Stockyards Administrationhelliphelliphelliphelliphellip 41 40 14
DEPARTMENTAL ACTIVITIES Office of the Secretaryhelliphelliphelliphelliphelliphelliphelliphelliphelliphelliphelliphelliphelliphelliphelliphelliphelliphelliphellip 11 19 43 Common Computing Environmenthelliphelliphelliphelliphelliphelliphelliphelliphelliphelliphelliphelliphelliphellip 6 16 0 Departmental Administrationhelliphelliphelliphelliphelliphelliphelliphelliphelliphelliphelliphelliphelliphelliphelliphellip 79 170 173 Agriculture Buildings and Facilitieshelliphelliphelliphelliphelliphelliphelliphelliphelliphelliphelliphelliphelliphellip 236 314 281 Hazardous Waste Managementhelliphelliphelliphelliphelliphelliphelliphelliphelliphelliphelliphelliphelliphelliphelliphellip 8 9 10 Office of the General Counselhelliphelliphelliphelliphelliphelliphelliphelliphelliphelliphelliphelliphelliphelliphelliphellip 40 44 46 Office of Inspector Generalhelliphelliphelliphelliphelliphelliphelliphelliphelliphelliphelliphelliphelliphelliphelliphelliphellip 84 95 96 Office of Communicationshelliphelliphelliphelliphelliphelliphelliphelliphelliphelliphelliphelliphelliphelliphelliphelliphellip 9 10 10 Executive Operations
Office of the Chief Economisthelliphelliphelliphelliphelliphelliphelliphelliphelliphelliphelliphelliphelliphelliphellip 12 14 14 National Appeals Divisionhelliphelliphelliphelliphelliphelliphelliphelliphelliphelliphelliphelliphelliphelliphelliphelliphellip 14 14 15
Working Capital Fundhelliphelliphelliphelliphelliphelliphelliphelliphelliphelliphelliphelliphelliphelliphelliphelliphelliphelliphellip 46 -25 0 Gifts and Bequestshelliphelliphelliphelliphelliphelliphelliphelliphelliphelliphelliphelliphelliphelliphelliphelliphelliphelliphelliphellip 1 1 1
Subtotalhelliphelliphelliphelliphelliphelliphelliphelliphelliphelliphelliphelliphelliphelliphelliphelliphelliphelliphelliphelliphelliphelliphelliphellip 118017 144135 146496 Offsetting Receiptshelliphelliphelliphelliphelliphelliphelliphelliphelliphelliphelliphelliphelliphelliphelliphelliphelliphelliphelliphelliphellip -3577 -2120 -749
TOTAL US DEPARTMENT OF AGRICULTUREhelliphelliphelliphelliphelliphellip $114440 $142015 $145747
138
APPENDIX
UNITED STATES DEPARTMENT OF AGRICULTURE
Discretionary Outlays
(Dollars in Millions)
2009 2010 2011 AGENCY Actual Estimate Budget
FARM AND FOREIGN AGRICULTURAL SERVICES Farm Service Agencyhelliphelliphelliphelliphelliphelliphelliphelliphelliphelliphelliphelliphelliphelliphelliphelliphelliphelliphellip $1872 $2354 $1940 Risk Management Agencyhelliphelliphelliphelliphelliphelliphelliphelliphelliphelliphelliphelliphelliphelliphelliphelliphellip 73 79 82 Foreign Agricultural Servicehelliphelliphelliphelliphelliphelliphelliphelliphelliphelliphelliphelliphelliphelliphelliphelliphellip 236 395 472 PL 480helliphelliphelliphelliphelliphelliphelliphelliphelliphelliphelliphelliphelliphelliphelliphelliphelliphelliphelliphelliphelliphelliphelliphelliphellip 2169 1504 1847 RURAL DEVELOPMENT Salaries and Expenseshelliphelliphelliphelliphelliphelliphelliphelliphelliphelliphelliphelliphelliphelliphelliphelliphelliphelliphellip 38 297 238 Rural Utilities Servicehelliphelliphelliphelliphelliphelliphelliphelliphelliphelliphelliphelliphelliphelliphelliphelliphelliphelliphellip 608 1248 1786 Rural Housing Servicehelliphelliphelliphelliphelliphelliphelliphelliphelliphelliphelliphelliphelliphelliphelliphelliphelliphelliphellip 1982 2297 2018 Rural Business - Cooperative Servicehelliphelliphelliphelliphelliphelliphelliphelliphelliphelliphelliphelliphellip 169 215 125 Rural Empowerment ZonesEnterprise Communitieshelliphelliphelliphelliphelliphelliphellip 16 10 3 FOOD NUTRITION AND CONSUMER SERVICES Food and Nutrition Servicehelliphelliphelliphelliphelliphelliphelliphelliphelliphelliphelliphelliphelliphelliphelliphelliphellip 7070 8725 8074 NATURAL RESOURCES AND ENVIRONMENT Natural Resources Conservation Servicehelliphelliphelliphelliphelliphelliphelliphelliphelliphelliphelliphellip 1141 1401 969 Forest Servicehelliphelliphelliphelliphelliphelliphelliphelliphelliphelliphelliphelliphelliphelliphelliphelliphelliphelliphelliphelliphelliphellip 5129 6007 5322 FOOD SAFETY Food Safety and Inspection Servicehelliphelliphelliphelliphelliphelliphelliphelliphelliphelliphelliphelliphelliphellip 956 995 1033 RESEARCH EDUCATION AND ECONOMICS Agricultural Research Servicehelliphelliphelliphelliphelliphelliphelliphelliphelliphelliphelliphelliphelliphelliphelliphellip 1178 1250 1227 National Institute of Food and Agriculturehelliphelliphelliphelliphelliphelliphelliphelliphelliphelliphellip 1140 1396 1542 Economic Research Servicehelliphelliphelliphelliphelliphelliphelliphelliphelliphelliphelliphelliphelliphelliphelliphelliphellip 80 81 87 National Agricultural Statistics Servicehelliphelliphelliphelliphelliphelliphelliphelliphelliphelliphelliphellip 145 162 165 MARKETING AND REGULATORY PROGRAMS Animal and Plant Health Inspection Servicehelliphelliphelliphelliphelliphelliphelliphelliphelliphellip 942 1085 1030 Agricultural Marketing Servicehelliphelliphelliphelliphelliphelliphelliphelliphelliphelliphelliphelliphelliphelliphellip 101 103 52 Grain Inspection Packers and Stockyards Administrationhelliphelliphelliphelliphellip 40 42 43
DEPARTMENTAL ACTIVITIES Office of the Secretaryhelliphelliphelliphelliphelliphelliphelliphelliphelliphelliphelliphelliphelliphelliphelliphelliphelliphelliphellip 11 19 43 Departmental Administrationhelliphelliphelliphelliphelliphelliphelliphelliphelliphelliphelliphelliphelliphelliphelliphellip 78 148 151 Agriculture Buildings and Facilitieshelliphelliphelliphelliphelliphelliphelliphelliphelliphelliphelliphelliphelliphellip 236 314 281 Hazardous Waste Managementhelliphelliphelliphelliphelliphelliphelliphelliphelliphelliphelliphelliphelliphelliphelliphellip 8 9 10 Office of the General Counselhelliphelliphelliphelliphelliphelliphelliphelliphelliphelliphelliphelliphelliphelliphelliphellip 40 44 46 Office of Inspector Generalhelliphelliphelliphelliphelliphelliphelliphelliphelliphelliphelliphelliphelliphelliphelliphelliphellip 84 95 96 Office of Communicationshelliphelliphelliphelliphelliphelliphelliphelliphelliphelliphelliphelliphelliphelliphelliphelliphellip 9 10 10 Executive Operations
Office of the Chief Economisthelliphelliphelliphelliphelliphelliphelliphelliphelliphelliphelliphelliphelliphelliphellip 11 13 13 National Appeals Divisionhelliphelliphelliphelliphelliphelliphelliphelliphelliphelliphelliphelliphelliphelliphelliphelliphellip 14 14 15 Common Computing Environmenthelliphelliphelliphelliphelliphelliphelliphelliphelliphelliphelliphelliphelliphellip 6 16 0 Working Capital Fundhelliphelliphelliphelliphelliphelliphelliphelliphelliphelliphelliphelliphelliphelliphelliphelliphelliphelliphellip 46 -25 0 Subtotalhelliphelliphelliphelliphelliphelliphelliphelliphelliphelliphelliphelliphelliphelliphelliphelliphelliphelliphelliphelliphelliphelliphelliphellip 25628 30303 28720 Offsetting Receiptshelliphelliphelliphelliphelliphelliphelliphelliphelliphelliphelliphelliphelliphelliphelliphelliphelliphelliphelliphelliphellip -58 -70 -78
TOTAL US DEPARTMENT OF AGRICULTUREhelliphelliphelliphelliphelliphellip $25570 $30233 $28642
139
APPENDIX
UNITED STATES DEPARTMENT OF AGRICULTURE
American Recovery and Reinvestment Act of 2009 (Dollars in Millions)
2009 - 2010 2011
AgencyProgram Available Estimate
DEPARTMENTAL ADMINISTRATION Agriculture Buildings and Facilities and Rental Paymentshelliphelliphelliphelliphelliphelliphellip $24 0
AGRICULTURAL RESEARCH SERVICE Buildings and Facilitieshelliphelliphelliphelliphelliphelliphelliphelliphelliphelliphelliphelliphelliphelliphelliphelliphelliphelliphelliphellip 176 0
OFFICE OF INSPECTOR GENERAL Oversight and Audithelliphelliphelliphelliphelliphelliphelliphelliphelliphelliphelliphelliphelliphelliphelliphelliphelliphelliphelliphelliphellip 22 0
FARM SERVICE AGENCY Salaries and Expenses - Information Technologyhelliphelliphelliphelliphelliphelliphelliphelliphelliphellip 50 0 Agricultural Credit Insurance Fund Program Account Farm Operating Direct Loanshelliphelliphelliphelliphelliphelliphelliphelliphelliphelliphelliphelliphelliphelliphelliphelliphellip 20 0 Loan Levelhelliphelliphelliphelliphelliphelliphelliphelliphelliphelliphelliphelliphelliphelliphelliphelliphelliphelliphelliphelliphelliphelliphellip (173) (0) Total FSAhelliphelliphelliphelliphelliphelliphelliphelliphelliphelliphelliphelliphelliphelliphelliphelliphelliphelliphelliphelliphelliphelliphelliphelliphellip 70 0
NATURAL RESOURCES CONSERVATION SERVICE Watershed and Flood Prevention Operationshelliphelliphelliphelliphelliphelliphelliphelliphelliphelliphelliphellip 290 0 Watershed Rehabilitation Programhelliphelliphelliphelliphelliphelliphelliphelliphelliphelliphelliphelliphelliphelliphelliphellip 50 0 Total NRCShelliphelliphelliphelliphelliphelliphelliphelliphelliphelliphelliphelliphelliphelliphelliphelliphelliphelliphelliphelliphelliphelliphelliphellip 340 0
RURAL DEVELOPMENT Salaries and Expenseshelliphelliphelliphelliphelliphelliphelliphelliphelliphelliphelliphelliphelliphelliphelliphelliphelliphelliphelliphelliphellip 131 a 0
Rural Business-Cooperative Service Rural Business and Industry Guaranteed Loans Programhelliphelliphelliphelliphelliphelliphellip 126 0 Loan Levelhelliphelliphelliphelliphelliphelliphelliphelliphelliphelliphelliphelliphelliphelliphelliphelliphelliphelliphelliphelliphelliphelliphellip (1572) (0) Rural Business Enterprise Grantshelliphelliphelliphelliphelliphelliphelliphelliphelliphelliphelliphelliphelliphelliphelliphellip 19 0 Total RBShelliphelliphelliphelliphelliphelliphelliphelliphelliphelliphelliphelliphelliphelliphelliphelliphelliphelliphelliphelliphelliphelliphelliphelliphellip 145 0
Rural Housing Service Rural Community Facilities Loans Programhelliphelliphelliphelliphelliphelliphelliphelliphelliphelliphelliphellip 24 0 Loan Levelhelliphelliphelliphelliphelliphelliphelliphelliphelliphelliphelliphelliphelliphelliphelliphelliphelliphelliphelliphelliphelliphelliphellip (1136) (0) Rural Community Facilities Grants Programhelliphelliphelliphelliphelliphelliphelliphelliphelliphelliphelliphellip 102 0 Section 502 Direct Single Family Housing Loan Programhelliphelliphelliphelliphelliphellip 65 0 Loan Levelhelliphelliphelliphelliphelliphelliphelliphelliphelliphelliphelliphelliphelliphelliphelliphelliphelliphelliphelliphelliphelliphelliphellip (1563) (0) Section 502 Guaranteed Single Family Housing Loan Programhelliphelliphelliphellip 129 0 Loan Levelhelliphelliphelliphelliphelliphelliphelliphelliphelliphelliphelliphelliphelliphelliphelliphelliphelliphelliphelliphelliphelliphelliphellip (10111) (0) Total RHShelliphelliphelliphelliphelliphelliphelliphelliphelliphelliphelliphelliphelliphelliphelliphelliphelliphelliphelliphelliphelliphelliphelliphellip 320 0
140
APPENDIX
American Recovery and Reinvestment Act of 2009 (Dollars in Millions)
2009 - 2010 2011
AgencyProgram Available Estimate
Rural Utilities Service Rural Water amp Waste Disposal Direct Loan Programhelliphelliphelliphelliphelliphelliphelliphellip 400 0
Loan Levelhelliphelliphelliphelliphelliphelliphelliphelliphelliphelliphelliphelliphelliphelliphelliphelliphelliphelliphelliphelliphelliphelliphellip (2154) (0) Rural Water amp Waste Disposal Grants Programhelliphelliphelliphelliphelliphelliphelliphelliphelliphellip 939 0 Distance Learning Telemedicine amp Broadband Grants Programhelliphelliphellip 1940 0 Distance Learning Telemedicine amp Broadband Loan Programhelliphelliphelliphellip 485 0
Loan Levelhelliphelliphelliphelliphelliphelliphelliphelliphelliphelliphelliphelliphelliphelliphelliphelliphelliphelliphelliphelliphelliphelliphellip (7160) (0) Total RUShelliphelliphelliphelliphelliphelliphelliphelliphelliphelliphelliphelliphelliphelliphelliphelliphelliphelliphelliphelliphelliphelliphelliphellip 3764 0
FOOD AND NUTRITION SERVICE WIC Management Information Systemshelliphelliphelliphelliphelliphelliphelliphelliphelliphelliphelliphelliphellip 100 0 WIC Contingency Fundhelliphelliphelliphelliphelliphelliphelliphelliphelliphelliphelliphelliphelliphelliphelliphelliphelliphelliphelliphellip 400 0
Total WIChelliphelliphelliphelliphelliphelliphelliphelliphelliphelliphelliphelliphelliphelliphelliphelliphelliphelliphelliphelliphelliphelliphelliphellip 500 0
Supplemental Nutrition Assistance Program Increased Benefitshelliphelliphelliphelliphelliphelliphelliphelliphelliphelliphelliphelliphelliphelliphelliphelliphelliphelliphelliphellip 15355 b 11936 State Administrative Expenseshelliphelliphelliphelliphelliphelliphelliphelliphelliphelliphelliphelliphelliphelliphelliphellip 290 0 FDPIR Administrative Expenseshelliphelliphelliphelliphelliphelliphelliphelliphelliphelliphelliphelliphelliphelliphellip 5 0 FNS Management and Oversighthelliphelliphelliphelliphelliphelliphelliphelliphelliphelliphelliphelliphelliphelliphellip 5 0
Total SNAPhelliphelliphelliphelliphelliphelliphelliphelliphelliphelliphelliphelliphelliphelliphelliphelliphelliphelliphelliphelliphelliphelliphellip 15655 11936 Child Nutrition Equipment Assistancehelliphelliphelliphelliphelliphelliphelliphelliphelliphelliphelliphelliphelliphellip 100 0
The Emergency Food Assistance Programhelliphelliphelliphelliphelliphelliphelliphelliphelliphelliphelliphellip 150 0
FOREST SERVICE Capital Improvement and Maintenancehelliphelliphelliphelliphelliphelliphelliphelliphelliphelliphelliphelliphelliphellip 650 0 Wildland Fire Managementhelliphelliphelliphelliphelliphelliphelliphelliphelliphelliphelliphelliphelliphelliphelliphelliphelliphellip 500 0
Total FShelliphelliphelliphelliphelliphelliphelliphelliphelliphelliphelliphelliphelliphelliphelliphelliphelliphelliphelliphelliphelliphelliphelliphelliphellip 1150 0
AGRICULTURAL DISASTER ASSISTANCE TRANSITION 2008 Transition Assistancehelliphelliphelliphelliphelliphelliphelliphelliphelliphelliphelliphelliphelliphelliphelliphelliphelliphellip 230 c 0
Aquaculture Assistance Grants (CCC Funds)helliphelliphelliphelliphelliphelliphelliphelliphelliphelliphellip 50 0 Total Disaster Assistancehelliphelliphelliphelliphelliphelliphelliphelliphelliphelliphelliphelliphelliphelliphelliphelliphelliphelliphellip 280 0
FOREIGN AGRICULTURAL SERVICE Trade Adjustment Assistance for Farmershelliphelliphelliphelliphelliphelliphelliphelliphelliphelliphelliphellip 180 22
RECAP Total USDA Discretionary Fundshelliphelliphelliphelliphelliphelliphelliphelliphelliphelliphelliphelliphelliphelliphellip 6942 0 Total USDA Mandatory Fundshelliphelliphelliphelliphelliphelliphelliphelliphelliphelliphelliphelliphelliphelliphelliphellip 16065 11958
Total USDAhelliphelliphelliphelliphelliphelliphelliphelliphelliphelliphelliphelliphelliphelliphelliphelliphelliphelliphelliphelliphelliphellip $23007 $11958
a The Act allows up to 3 percent of the funds provided to RD to be used for administrative costs b CBO scored at $198 billion over three years The impact of the Recovery Act on benefits will continue until the Thrifty Food Plan costs equal the provision made by the Recovery Act c CBO scored at $744 million over two years
141
APPENDIX
UNITED STATES DEPARTMENT OF AGRICULTURE Staff Years
2010 2011 Agency 2009 Estimate Budget
FARM AND FOREIGN AGRICULTURAL SERVICES Farm Service Agency 5042 5094 5104 Risk Management Agency 481 568 568 Foreign Agricultural Service 951 1006 1006
RURAL DEVELOPMENT Rural Development 5873 6100 6100
FOOD NUTRITION AND CONSUMER SERVICES Food and Nutrition Service 1269 1387 1443
NATURAL RESOURCES AND ENVIRONMENT Natural Resources Conservation Service 11186 14104 11565 Forest Service 34395 36760 35716
FOOD SAFETY Food Safety and Inspection Service 9460 9696 9727
RESEARCH EDUCATION AND ECONOMICS Agricultural Research Service 8268 8351 8433 National Institute of Food and Agriculture 376 440 440 Economic Research Service 389 399 409 National Agricultural Statistics Service 1093 1174 1175
MARKETING AND REGULATORY PROGRAMS Animal and Plant Health Inspection Service 7935 7888 7751 Agricultural Marketing Service 2815 2848 2848 Grain Inspection Packers amp Stockyards Administration 682 689 705
DEPARTMENTAL ACTIVITIES Office of the Secretary 63 101 96 Office of Advocacy and Outreach 0 45 50 Office of Civil Rights helliphelliphelliphelliphelliphelliphelliphelliphelliphelliphelliphelliphelliphelliphelliphelliphelliphelliphellip 130 140 140 Office of the Chief Financial Officer 1190 1363 1379 Office of Budget and Program Analysis 49 60 60 Office of the Chief Information Officer 937 1058 1058 Departmental Administration 519 575 539 Office of Homeland Security 15 19 19 Office of the Chief Economist 54 62 61 National Appeals Division 94 99 99 Office of Communications 82 98 98 Office of the Inspector General 550 600 600 Office of the General Counsel 302 318 318
Total USDA Federal Staffing 94201 101042 97507 FSA Non-Federal Staffing 9418 9425 9425 Total USDA Staffing 103619 110467 106932
This page corrects data included in the printed version of the 2011 Budget Summary
142
APPENDIX
Strategic Goal Help America promote agricultural production and biotechnology exports as America works to
increase food security
Budget Authority (Dollars in Millions)
2009 2010 2011 Program Enacted Estimate Budget
FARM AND FOREIGN AGRICULTURAL SERVICES Foreign Agricultural Servicehelliphelliphelliphelliphelliphelliphelliphelliphelliphelliphelliphellip $3021 $2302 $2320
Total FFAShelliphelliphelliphelliphelliphelliphelliphelliphelliphelliphelliphelliphelliphelliphelliphelliphelliphelliphelliphellip 3021 2302 2320
NATURAL RESOURCES AND ENVIRONMENT Natural Resources Conservation Servicehelliphelliphelliphelliphelliphelliphelliphellip 5 6 6 Total NREhelliphelliphelliphelliphelliphelliphelliphelliphelliphelliphelliphelliphelliphelliphelliphelliphelliphelliphelliphellip 5 6 6
MARKETING AND REGULATORY PROGRAMS Animal and Plant Health Inspection Servicehelliphelliphelliphelliphelliphellip 42 42 49
Agricultural Marketing Servicehelliphelliphelliphelliphelliphelliphelliphelliphelliphelliphellip 0 0 0 Total MRPhelliphelliphelliphelliphelliphelliphelliphelliphelliphelliphelliphelliphelliphelliphelliphelliphelliphelliphelliphellip 42 42 49
RESEARCH EDUCATION AND ECONOMICS Agricultural Research Servicehelliphelliphelliphelliphelliphelliphelliphelliphelliphelliphelliphellip 575 598 602 National Institute of Food and Agriculturehelliphelliphelliphelliphelliphelliphellip 157 178 161 Economic Research Servicehelliphelliphelliphelliphelliphelliphelliphelliphelliphelliphelliphelliphellip 20 20 21 National Agricultural Statistics Servicehelliphelliphelliphelliphelliphelliphelliphellip 0 0 1 Total REEhelliphelliphelliphelliphelliphelliphelliphelliphelliphelliphelliphelliphelliphelliphelliphelliphelliphelliphelliphellip 752 796 785
Totalhelliphelliphelliphelliphelliphelliphelliphelliphelliphelliphelliphelliphelliphelliphelliphelliphelliphelliphelliphelliphelliphellip $3820 $3146 $3160
143
APPENDIX
Strategic Goal Ensure that all of Americas children have access to safe nutritious and balanced meals
Budget Authority (Dollars in Millions)
2009 2010 2011 Program Enacted Estimate Budget
FOOD NUTRITION AND CONSUMER SERVICES Food and Nutrition Servicehelliphelliphelliphelliphelliphelliphelliphelliphelliphelliphelliphelliphellip $82249 $93854 $107617
FOOD SAFETY Food Safety and Inspection Servicehelliphelliphelliphelliphelliphelliphelliphelliphelliphellip 983 1028 1046
MARKETING AND REGULATORY PROGRAMS Animal and Plant Health Inspection Servicehelliphelliphelliphelliphelliphellip 860 939 915
Agricultural Marketing Servicehelliphelliphelliphelliphelliphelliphelliphelliphelliphelliphellip 504 674 615 Total MRPhelliphelliphelliphelliphelliphelliphelliphelliphelliphelliphelliphelliphelliphelliphelliphelliphelliphelliphelliphellip 1364 1613 1530
RESEARCH EDUCATION AND ECONOMICS Agricultural Research Servicehelliphelliphelliphelliphelliphelliphelliphelliphelliphelliphelliphellip 191 197 205 National Institute of Food and Agriculturehelliphelliphelliphelliphelliphelliphellip 230 248 233 Economic Research Servicehelliphelliphelliphelliphelliphelliphelliphelliphelliphelliphelliphelliphellip 21 22 24 National Agricultural Statistics Servicehelliphelliphelliphelliphelliphelliphelliphellip 3 8 8 Total REEhelliphelliphelliphelliphelliphelliphelliphelliphelliphelliphelliphelliphelliphelliphelliphelliphelliphelliphelliphellip 445 475 470
Totalhelliphelliphelliphelliphelliphelliphelliphelliphelliphelliphelliphelliphelliphelliphelliphelliphelliphelliphelliphelliphelliphellip $85041 $96970 $110663
144
APPENDIX
Strategic Goal Assist rural communities to create prosperity so they are self-sustaining repopulating and
economically thriving
Budget Authority (Dollars in Millions)
2009 2010 2011 Program Enacted Estimate Budget
FARM AND FOREIGN AGRICULTURAL SERVICES Farm Service Agencyhelliphelliphelliphelliphelliphelliphelliphelliphelliphelliphelliphelliphelliphelliphellip $12774 $11785 $11431
Foreign Agricultural Servicehelliphelliphelliphelliphelliphelliphelliphelliphelliphelliphelliphellip 759 851 721 Risk Management Agencyhelliphelliphelliphelliphelliphelliphelliphelliphelliphelliphelliphelliphellip 6844 6535 7696 Total FFAShelliphelliphelliphelliphelliphelliphelliphelliphelliphelliphelliphelliphelliphelliphelliphelliphelliphelliphelliphellip 20377 19171 19848
RURAL DEVELOPMENT Rural Business Servicehelliphelliphelliphelliphelliphelliphelliphelliphelliphelliphelliphelliphelliphelliphellip 518 556159 366
Rural Housing Servicehelliphelliphelliphelliphelliphelliphelliphelliphelliphelliphelliphelliphelliphelliphellip 2250 2078 1917 Rural Utilities Servicehelliphelliphelliphelliphelliphelliphelliphelliphelliphelliphelliphelliphelliphelliphellip 4479 709 661 Total RDhelliphelliphelliphelliphelliphelliphelliphelliphelliphelliphelliphelliphelliphelliphelliphelliphelliphelliphelliphelliphellip 7247 3343 2944
NATURAL RESOURCES AND ENVIRONMENT Natural Resources Conservation Servicehelliphelliphelliphelliphelliphelliphelliphellip 182 306 320
Forest Servicehelliphelliphelliphelliphelliphelliphelliphelliphelliphelliphelliphelliphelliphelliphelliphelliphelliphellip 1823 672 666 Total NREhelliphelliphelliphelliphelliphelliphelliphelliphelliphelliphelliphelliphelliphelliphelliphelliphelliphelliphelliphellip 2005 978 986
MARKETING AND REGULATORY PROGRAMS Animal and Plant Health Inspection Servicehelliphelliphelliphelliphelliphellip 103 106 99
Agricultural Marketing Servicehelliphelliphelliphelliphelliphelliphelliphelliphelliphelliphellip 807 723 725 Grain Inspection Packers and Stockyards Administrationhellip 40 42 44 Total MRPhelliphelliphelliphelliphelliphelliphelliphelliphelliphelliphelliphelliphelliphelliphelliphelliphelliphelliphelliphellip 950 871 868
RESEARCH EDUCATION AND ECONOMICS Agricultural Research Servicehelliphelliphelliphelliphelliphelliphelliphelliphelliphelliphelliphellip 398 246 178 National Institute of Food and Agriculturehelliphelliphelliphelliphelliphelliphellip 780 857 904 Economic Research Servicehelliphelliphelliphelliphelliphelliphelliphelliphelliphelliphelliphelliphellip 29 30 30 National Agricultural Statistics Servicehelliphelliphelliphelliphelliphelliphelliphellip 148 153 155 Total REEhelliphelliphelliphelliphelliphelliphelliphelliphelliphelliphelliphelliphelliphelliphelliphelliphelliphelliphelliphellip 1355 1286 1267
DEPARTMENTAL STAFF OFFICES Office of the Secretaryhelliphelliphelliphelliphelliphelliphelliphelliphelliphelliphelliphelliphelliphelliphellip 0 0 35
Office of the Chief Economisthelliphelliphelliphelliphelliphelliphelliphelliphelliphelliphelliphellip 6 6 6 Total Staff Officeshelliphelliphelliphelliphelliphelliphelliphelliphelliphelliphelliphelliphelliphelliphelliphelliphellip 6 6 41
Totalhelliphelliphelliphelliphelliphelliphelliphelliphelliphelliphelliphelliphelliphelliphelliphelliphelliphelliphelliphelliphelliphellip $31940 $25655 $25954
145
APPENDIX
Strategic Goal Ensure our national forests and private working lands are conserved restored and made more
resilient to climate change while enhancing our water resources Budget Authority
(Dollars in Millions) 2009 2010 2011
Program Enacted Estimate Budget FARM AND FOREIGN AGRICULTURAL SERVICES Farm Service Agencyhelliphelliphelliphelliphelliphelliphelliphelliphelliphelliphelliphelliphelliphelliphellip $2242 $2328 $2314
Foreign Agricultural Servicehelliphelliphelliphelliphelliphelliphelliphelliphelliphelliphelliphellip 3 3 3 Total FFAShelliphelliphelliphelliphelliphelliphelliphelliphelliphelliphelliphelliphelliphelliphelliphelliphelliphelliphelliphellip 2245 2331 2317
NATURAL RESOURCES AND ENVIRONMENT Natural Resources Conservation Servicehelliphelliphelliphelliphelliphelliphelliphellip 3284 3670 3667
Forest Servicehelliphelliphelliphelliphelliphelliphelliphelliphelliphelliphelliphelliphelliphelliphelliphelliphelliphellip 5280 5479 5479 Total NREhelliphelliphelliphelliphelliphelliphelliphelliphelliphelliphelliphelliphelliphelliphelliphelliphelliphelliphelliphellip 8564 9149 9146
MARKETING AND REGULATORY PROGRAMS Animal and Plant Health Inspection Servicehelliphelliphelliphelliphelliphellip 86 101 71 Total MRPhelliphelliphelliphelliphelliphelliphelliphelliphelliphelliphelliphelliphelliphelliphelliphelliphelliphelliphelliphellip 86 101 71
RESEARCH EDUCATION AND ECONOMICS Agricultural Research Servicehelliphelliphelliphelliphelliphelliphelliphelliphelliphelliphelliphellip 226 234 240 National Institute of Food and Agriculturehelliphelliphelliphelliphelliphelliphellip 183 199 196 Economic Research Servicehelliphelliphelliphelliphelliphelliphelliphelliphelliphelliphelliphelliphellip 10 11 11 National Agricultural Statistics Servicehelliphelliphelliphelliphelliphelliphelliphellip 1 1 1 Total REEhelliphelliphelliphelliphelliphelliphelliphelliphelliphelliphelliphelliphelliphelliphelliphelliphelliphelliphelliphellip 420 444 448
DEPARTMENTAL STAFF OFFICES Office of the Chief Economisthelliphelliphelliphelliphelliphelliphelliphelliphelliphelliphelliphellip 0 3 3 Hazardous Materials Managementhelliphelliphelliphelliphelliphelliphelliphelliphelliphellip 5 5 5
Total Staff Officeshelliphelliphelliphelliphelliphelliphelliphelliphelliphelliphelliphelliphelliphelliphelliphelliphellip 5 8 8
Totalhelliphelliphelliphelliphelliphelliphelliphelliphelliphelliphelliphelliphelliphelliphelliphelliphelliphelliphelliphelliphelliphelliphellip $11320 $12033 $11990
146
APPENDIX
Management Activities (Dollars in Millions)
2009 2010 2011 Program Enacted Estimate Budget
Departmental Activitieshelliphelliphelliphelliphelliphelliphelliphelliphelliphelliphelliphelliphelliphelliphellip $549 $626 $620 Total Management Activitieshelliphelliphelliphelliphelliphelliphelliphelliphelliphelliphelliphelliphellip $549 $626 $620
147
APPENDIX
Fee Proposals (Dollars in Millions)
2011 Agency and Program Budget Authority
Food Safety Food Safety and Inspection Service
User Fee Proposals bull Two user fees associated with the Food Safety and
Inspection Service are proposed One proposal would provide the authority to collect user fees from plants that require additional inspection activities because of performance failures such as retesting recalls or inspection activities linked to an outbreak A second proposal would provide authority to collect a Facility Application and Annual Renewal Activities user fee to cover the increased cost above those basic inspection services provided to meat poultry or processed egg products establishments Total collection from these proposals are estimated to be about $11 million in 2011
$0
Natural Resources and Environment Natural Resources Conservation Service
User Fee Proposal 0
bull The budget includes a targeted fee proposal for conservation plans development Total collections from these proposals are estimated to be $19 million
Marketing and Regulatory Programs Animal and Plant Health Inspection Service
User Fee Proposals 0
bull The budget proposal authorizes the Secretary of Agriculture to prescribe adjust and collect fees to cover the costs incurred for activities in relation to the review maintenance and inspections connected to licensing activities associated with the Animal Welfare Act Virus Serum Toxin Act and the Plant Protection Act The estimated fees would result in receipts of $195 million in 2011 which includes $9 million for animal care $675 million for veterinary biologics and $375 million for Biotechnology Regulatory Services
148
0
APPENDIX
Grain Inspection Packers and Stockyards Administration User Fee Proposal
bull The budget would establish a fee for grain standardization and a Packers and Stockyards license fee The proposal would result in approximately $29 million ($4 million and $25 million respectively)
149
APPENDIX
Proposed Budget-Related Legislation (Dollars in Millions)
2011 Agency and Program Budget Authority
Farm and Foreign Agricultural Services Commodity Credit Corporation
Payment Limitation -$1
bull The 2011 budget proposes to utilize the existing payment limitations from the 2008 Farm Bill but adjust the limits within them to achieve significant savings over 10 years Specifically the proposal would reduce the cap on Direct Payments and reduce the Adjusted Gross Income limitations USDA estimates that the sum of the above changes may save the government a total of roughly $23 billion over 10 years
Reduced Commodity Storage Payments -2
bull This proposal would eliminate cotton and peanut storage credits The credits allow producers to store their cotton and peanuts at the Governmentrsquos cost until prices rise Therefore storage credits have a negative impact on the amount of commodities on the market Because storage is covered by the Government producers may store their commodities for longer than necessary There is no reason the Government should be paying for the storage of cotton or peanuts particularly since it does not provide this assistance for other commodities
Foreign Agricultural Service Reform Market Access Program (MAP) -8
bull This proposal reduces annual funding for MAP by 20 percent in order to achieve deficit reduction savings Under the program funds are used to reimburse participating organizations for a portion of the costs of carrying out overseas marketing and promotional activities such as direct consumer promotions Historically more than 80 percent of MAP funding has been devoted to building export markets for high-value products including a wide range of specialty crops
This page corrects a statement included in the printed version of the 2011 Budget Summary
150
APPENDIX
Although funding for new MAP programming will be reduced by $40 million in 2011 outlay savings during the first year are estimated to be $4 million due to the slow rate of spend-out for the program
Food Nutrition and Consumer Services Food and Nutrition Service
Child Nutrition and WIC Reauthorization 1000
bull The budget proposes to add $10 billion over the next ten years for the reauthorization of the Child Nutrition and WIC Programs The proposals would (1) Improve access to nutritious meals particularly for low-income children (2) Improve access to healthy fruits and vegetables (3) Reduce the prevalence of obesity by improving the diets of school children and by teaching children to make wise food choices in and outside of school and (4) Improve program performance and integrity
Supplemental Nutrition Assistance Program 25
bull The budget proposes to add $25 million to extend the American Recovery and Reinvestment Act provision that eliminates the time limits for able-bodied adults without dependents for an additional year
Supplemental Nutrition Assistance Program 11
bull The budget proposes to exclude refundable tax credits from benefit and eligibility determination in the month of receipt and for the following 12 months
Supplemental Nutrition Assistance Program 0
bull The budget proposes to increase the asset limit to $10000 in SNAP but does not increase budget authority The funding is provided through a government-wide initiative
151
0
APPENDIX
Departmental Management Departmental Management
Penalties
bull The budget will include a proposal to assess penalties for misuse of the biopreferred label
152
- 01ContentsTablepdf
- 02Preface
- 03Overview
- 04Highlights by Goals
- 06FFAS
- 07RD
- 08FNS
- 09FSIS
- 10NRE
- 11MRP
- 12REE
-
- NATIONAL INSTITUTE OF FOOD AND AGRICULTURE (NIFA)
- NIFA formerly the Cooperative State Research Education and Extension Service has the primary responsibility for providing linkages between the Federal and State components of a broad-based national agricultural research extension and higher education system NIFA provides funding for projects conducted in partnership with the State Agricultural Experiment Stations the State Cooperative Extension System land grant universities colleges and other research and education institutions Federal funds are distributed to universities and institutions by statutory formula funding competitive awards and grants NIFA is responsible for administering USDAs primary competitive research grants program the Agriculture and Food Research Initiative (AFRI) which supports investigator-initiated research with strong potential to contribute to major breakthroughs in agricultural science
-
- 13OSEC
- 14DM
- 15All Other
- 16OIG
- 17APPENDIX
-

TABLE OF CONTENTS
ITEM PAGE
PREFACE iii
OVERVIEW 1
HIGHLIGHTS BY GOALS7
MISSION AREAAGENCY DETAILS
FARM AND FOREIGN AGRICULTURAL SERVICES Farm Service Agency 25 Risk Management Agency 39 Foreign Agricultural Service42
RURAL DEVELOPMENT Rural Business-Cooperative Service56 Rural Utilities Service 60 Rural Housing Service 64 Rural Development Salaries and Expenses 68
FOOD NUTRITION AND CONSUMER SERVICES Food and Nutrition Service 69
FOOD SAFETY Food Safety and Inspection Service79
NATURAL RESOURCES AND ENVIRONMENT Natural Resources Conservation Service 85 Forest Service 93
MARKETING AND REGULATORY PROGRAMS Animal and Plant Health Inspection Service 100 Agricultural Marketing Service 104 Grain Inspection Packers and Stockyards Administration 107
RESEARCH EDUCATION AND ECONOMICS Agricultural Research Service 111 National Institute of Food and Agriculture 116 Economic Research Service 122 National Agricultural Statistics Service 123
i
TABLE OF CONTENTS
ITEM PAGE
OFFICE OF THE SECRETARY 124
DEPARTMENTAL ACTIVITIES 126
OFFICE OF INSPECTOR GENERAL 133
APPENDIX Budget Authority by Agency 2009-2011134 Program Level by Agency 2009-2011 136 Outlays by Agency 2009-2011138 Discretionary Budget Outlays by Agency 2009-2011 139 American Recovery and Reinvestment Act of 2009 140 Staff Years by Agency 2009-2011142 Funding by Strategic Goals 143 Fee Proposals 148 Proposed Budget-Related Legislation150
ii
PREFACE
This Budget Summary and Annual Performance Plan describes the fiscal year (FY) 2011 budget for the US Department of Agriculture (USDA) All references to years refer to fiscal year except where specifically noted The funding estimates presented for FY 2010 are based on the Agriculture Rural Development Food and Drug Administration and Related Agencies Appropriations Act 2010 PL 111-80 Throughout the Summary ldquo2008 Farm Billrdquo and ldquoThe Farm Billrdquo are used to refer to the Food Conservation and Energy Act of 2008 In addition ldquoRecovery Actrdquo is used to refer to the American Recovery and Reinvestment Act of 2009
The Budget Summary is organized into three sections
y Overview - provides an overview of the 2011 budget by strategic goal and describes changes in budget authority and outlays
y Highlights by Goals - identifies key proposals within USDArsquos mission areas
y Mission AreaAgency Details - summarizes agency funding and programs and performance goals
Budget and Performance Plan Terms
y Performance Goal is the target level of performance at a specified time or period expressed as a tangible measurable outcome against which actual achievement can be compared including a goal expressed as a quantitative standard value or rate A performance goal comprises a performance measure with targets and timeframes
y Performance Measures are indicators statistics or metrics used to gauge program performance Program performance measures include outcome output and efficiency measures
y Budget Authority is the authority to commit funds of the Federal Treasury Congress provides this authority through annual appropriations acts and substantive legislation which authorizes direct spending The Presidents budget requests the Congress to appropriate or otherwise provide an amount of budget authority sufficient to carry out recommended government programs
y Obligations are commitments of Government funds that are legally binding In order for USDA to make a valid obligation it must have a sufficient amount of budget authority to cover the obligation
y Outlays are cash disbursements from the Federal Treasury to satisfy a valid obligation
y Program Level represents the gross value of all financial assistance USDA provides to the public This assistance may be in the form of grants guaranteed or direct loans cost-sharing professional services such as research or technical assistance activities or in-kind benefits such as commodities
iii
PREFACE
The budget is described in budget authority measures in most instances However there are some cases when other measures are used and the reader should take care to note which measure is being used Also note that the budget authority tables contained in this document reflect operating levels In addition performance goals reflect performance levels at ongoing funding levels and do not include the effect of supplemental including Recovery Act appropriations
Questions may be directed to the Office of Budget and Program Analysis via e-mail at bcaobpausdagov or telephone at (202) 720-6176
iv
OVERVIEW
Mission Statement USDA provides leadership on food agriculture natural resources and related issues based on sound public policy the best available science and efficient management
Vision Statement To help Americarsquos rural communities thrive and foster innovation as a result of expanded economic opportunities and sustainable agricultural production that nourishes Americarsquos children and the world and conserves the Nationrsquos natural resources
Strategic Plan Framework USDA is currently revising its Strategic Plan The 2011 budget request supports achievement of USDArsquos four strategic goals and management initiatives that describe the Departmentrsquos major programmatic policies and objectives that are expected to be the basis of the Departmentrsquos new Strategic Plan
2011 Funding Overview USDArsquos budget authority totals approximately $149 billion in 2011 The 2011 discretionary level is below the 2010 level and funds the Administrationrsquos most important priorities The decrease is primarily due to reductions in one-time funding such as earmarks supplementals rescissions and targeted program reductions The mandatory budget authority increases above 2010 are due primarily to an anticipated increase in nutrition assistance program participation and the impact of the Recovery Act on the Supplemental Nutrition Assistance Program food costs and crop assistance
USDA Budget Authority
160 $149
$67 $96 $108
$123
$26
$32 $27
$26
0
20
40
60
80
100
120
140
$ B
illio
ns
$93
$128 $135
2008 2009 2010 2011
Fiscal Year
Mandatory Discretionary
1
OVERVIEW
USDA Outlays $
Bill
ions
160 $142 $146 140
$115120
100 $90 80
60
40
20
0
$64
$26
$117
$29
$112
$30
$89
$26
2008 2009 2010 2011
Fiscal Year
Discretionary Mandatory
2011 Outlays
Farm and Commodity Programs
17
Nutrition Assistance
70
Conservation and Forestry
7
All Other 6
Includes Rural Development Research Food Safety and Marketing and Regulatory functions
2
OVERVIEW
USDArsquos total outlays for 2011 are estimated at $146 billion Roughly 80 percent of outlays about $117 billion in 2011 are associated with mandatory programs that provide services as required by law These include the majority of the nutrition assistance programs farm commodity programs export promotion programs and a number of conservation programs The increase in mandatory outlays in 2011 is primarily due to nutrition assistance and crop insurance The remaining 20 percent of outlays estimated at $29 billion in 2011 are associated with discretionary programs such as the Special Supplemental Nutrition Program for Women Infants and Children (WIC) rural development loans and grants research and education soil and water conservation technical assistance animal and plant health management of National Forests wildland fire and other Forest Service activities and domestic and international marketing assistance
For 2011 the Departmentrsquos budget process was organized around four program goals and an overarching management goal to improve collaboration among mission areas and agencies and to strengthen the effectiveness of USDA programs This budget presentation reflects the Departmentrsquos goal-based organizational budget process It should be noted that although agency programs and associated funding have been aligned with the four program goals many programs contribute to the achievement of multiple goals
An overview of the 2011 budget by strategic goal
Strategic Goal Help America promote agricultural production and biotechnology exports as America works to increase food security
bull Supports $23 billion to increase global food security through food assistance programs agricultural reconstruction and stabilization activities including $210 million for the McGovern-Dole International Food for Education and Child Nutrition Program
bull Requests $429 million the highest funding level ever for competitive grants through the Agriculture and Food Research Initiative while maintaining funding for formula grants Also the budget includes a 56 percent increase for the Sustainable Agriculture Research and Education (SARE) program aimed at helping farmers and ranchers adopt practices that are profitable environmentally sound and beneficial to communities
bull Requests $19 million an increase of 46 percent to strengthen regulatory oversight of biotechnology products and prevent regulated genetically engineered products from being co-mingled with non-regulated products
bull Increases funding for the National Organic Program by 45 percent to enhance enforcement ensure the integrity of the organic label and develop equivalency agreements to expand market access for US organic products
bull Includes a National Export Initiative that supports expanding export promotion activities as envisioned by this goal as well as spurring job creation and income growth for rural America under the strategic goal of assisting rural communities create prosperity
3
OVERVIEW
Strategic Goal Ensure that all of Americarsquos children have access to safe nutritious and balanced meals
bull Fully funds expected participation in nutrition assistance programs
bull Provides $10 billion over 10 years to strengthen the Child Nutrition and WIC programs through reforms aimed at improving program access establishing high standards for the nutritional quality of food available in schools exploring new strategies for reducing hunger and improving childrenrsquos food choices and improving program management
bull Proposes to raise current SNAP asset limits to streamline eligibility for families eligible for benefits from multiple programs and encourage families to save toward self-sufficiency This change would add $426 million to recipient benefits and SNAP program costs in 2011 with a 5-year total of $45 billion
bull Proposes to exclude lump sum tax credits from SNAP as part of a government-wide initiative for income support programs including Earned Income Child American Opportunity and Make Work Pay for 12 months following the month of receipt to prevent beneficiaries from experiencing a disruption in eligibility and benefits in the wake of new and refundable tax credits This change will increase recipient benefits and SNAP program costs about $11 million in 2011 with a 5-year total cost of $52 million Legislation is also being proposed to extend the Recovery Act provision that eliminates the time limits for able-bodied adults without dependents for an additional year for an one-time cost of $25 million
bull Provides over $1 billion for the Food Safety and Inspection Service including an increase of $27 million to more quickly identify and respond to outbreaks of foodborne illness as recommended by the Presidentrsquos Food Safety Working Group
Strategic Goal Assist rural communities to create prosperity so they are self-sustaining repopulating and economically thriving
bull Provides funding to support coordination of regional planning activities and establishes a set-aside that is roughly 5 percent of the funding about $280 million from approximately 20 existing programs that will be allocated competitively among regional pilot projects tailored to local needs and opportunities
bull Provides $50 million as part of the Administrationrsquos $400 million ldquoHealthy Food Financing Initiativerdquo to bring grocery stores and other healthy food retailers to underserved communities
bull Supports USDArsquos ldquoKnow Your Farmer Know Your Foodrdquo Initiative to facilitate the development of local and regional food systems that better connect consumers with local farms create new income opportunities for producers and place a greater focus on sustainable agricultural practices and nutritious local food
4
OVERVIEW
bull Requests $54 million for a National Export Initiative to expand export promotion activities that will spur job creation and income growth for rural America
bull Includes nearly $1 billion to foster the development of renewable energy
bull Fully funds the Voluntary Public Access and Habitat Incentive Program which encourages private landowners to voluntarily open their land to the public for hunting and fishing
bull Maintains a strong agriculture safety net through a system of income support disaster mitigation and farm loan programs Income support programs including direct and counter-cyclical payments and Average Crop Revenue Election (ACRE) payments are expected to total nearly $9 billion in 2011
bull Targets direct farm payments to those who needmdashand can most benefit frommdashassistance and reforms the crop insurance program by renegotiating the Governmentrsquos agreement with crop insurance companies
Strategic Goal Ensure our national forests and private working lands are conserved restored and made more resilient to climate change while enhancing our water resources
bull Increases funding for financial and technical assistance to support Farm Bill conservation programs to almost $5 billion that will improve water quality enroll almost 200000 additional acres of wetlands for restoration and reduce nutrient loading in the Chesapeake Bay Conservation activities will be targeted to priority landscapes through local state and Federal partnerships These priority landscapes may include the Bay-Delta region in California and the Upper Mississippi region These efforts will preserve and restore private lands protect water resources and mitigate the effects of climate change
bull Requests $50 million for the Presidentrsquos Watershed Improvement and Job Stabilization initiative through which the Forest Service will assess the condition of all of its watersheds prioritize them based on stakeholder input and the costs required to improve them and complete the highest priority projects to improve the condition of those watersheds
bull Accelerates the scale and pace of USDArsquos forest stewardship activities by transforming the Forest Service budget to take advantage of new tools to protect water resources and to make forests more resilient to climate change The budget provides full funding for the Forest Landscape Restoration Act and $30 million more for the Land and Water Conservation Fund
5
OVERVIEW
Management Initiatives
bull Provides $7 million for the Office of Advocacy and Outreach to increase the accessibility of USDA programs to underserved constituents and to carry out Farm Bill provisions concerning outreach to beginning small and socially disadvantaged farmers ranchers and rural communities Of this amount $4 million is for the agricultural labor grants program previously administered by Rural Development
bull Provides an increase of $83 million to support the Departmentrsquos multi-agency effort to modernize and upgrade the IT infrastructure The modernization effort will improve the ability of the Farm Service Agency Natural Resources Conservation Service and Rural Development to serve program participants This funding will allow for the first system-wide refresh of the Common Computing Environment (CCE) since the infrastructure was implemented in 2000
bull Requests $65 million to support a Government-wide Contracting and Acquisition Workforce Training initiative The requested funding will allow USDA to implement training recruitment and retention activities for the Departmentrsquos procurement workforce that is responsible for over $5 billion in annual procurement for the Department
6
HIGHLIGHTS BY GOALS
For 2011 the Departmentrsquos budget process was organized around four program goals and an overarching management goal to improve collaboration among mission areas and agencies and to strengthen the effectiveness of USDA programs This budget presentation reflects the Departmentrsquos goal-based organizational budget process It should be noted that although agency programs and associated funding have been aligned with the four program goals many programs contribute to the achievement of multiple goals
Highlights of the 2011 budget by strategic goal
STRATEGIC GOAL HELP AMERICA PROMOTE AGRICULTURAL PRODUCTION AND BIOTECHNOLOGY EXPORTS AS AMERICA WORKS TO INCREASE FOOD SECURITY
Global food insecurity affects people worldwide and the current economic downturn has exacerbated the problem Recent estimates from the United Nations Food and Agricultural Organization suggests that more than one billion people around the world are chronically hungry It is important to note that a significant percentage of that one billion is children In addition to ensuring that the worldrsquos children have enough to eat the United States has a strong interest in promoting strong agricultural systems in the developing world because failing agricultural systems and food shortages fuel political instability and diminish the economic vitality of developing nations Working with other Federal partners the Department is working towards reducing global food insecurity and increasing agriculture-led economic growth in developing countries USDArsquos capacity-building technical assistance and food assistance programs are effective tools for improving the capacity of countries to produce what they need and to make that food accessible to those who need it In addition USDA helps American farmers and ranchers use effective technologies and value-added products such as biotechnology to increase agricultural productivity and nutritional value of foods which can enhance food security around the world Key efforts are to (1) ensure that US agricultural resources contribute to enhanced global food security (2) enhance Americarsquos ability to develop and trade agricultural products derived from new technologies and (3) promote productive agricultural systems that enable food-insecure countries to feed themselves
Help America promote agricultural production and biotechnology exports as America works to increase food security
Budget Authority (Dollars in Millions)
2009 2010 2011 Program Enacted Estimate Budget
Farm and Foreign Agricultural Serviceshelliphelliphelliphelliphelliphelliphelliphelliphellip $3021 $2302 $2320 Natural Resources and Environmenthelliphelliphelliphelliphelliphelliphelliphelliphelliphellip 5 6 6 Marketing and Regulatory Programshelliphelliphelliphelliphelliphelliphelliphelliphelliphellip 42 42 49 Research Education and Economicshelliphelliphelliphelliphelliphelliphelliphelliphelliphellip 752 796 785 Totalhelliphelliphelliphelliphelliphelliphelliphelliphelliphelliphelliphelliphelliphelliphelliphelliphelliphelliphelliphelliphellip $3820 $3146 $3160
7
HIGHLIGHTS BY GOALS
Key Proposals for the 2011 Budget
bull Maintain funding for the McGovern-Dole International Food for Education and Child Nutrition Program The McGovern-Dole Program supports maternal infant and child nutrition programs in developing countries supporting food security and a healthy young population which in turn builds stable societies and increases national security The budget continues funding for the McGovern-Dole program at the 2010 enacted level of $2095 million Appropriated funding for the program was increased substantially in 2010 in order to help support additional school feeding and child nutrition programs and to bolster the Departmentrsquos contribution to supporting economic development and food security in developing countries The program is expected to assist an estimated 5 million women and children in 2011
bull Strengthen Agricultural Reconstruction and Stabilization Activities The budget provides $146 million to support the Departmentrsquos participation in reconstruction and stabilization activities primarily in Afghanistan and Iraq USDArsquos efforts support implementation of the Presidentrsquos strategies for these countries by providing technical experts who serve as advisors to key government ministries and serve on civilian-military command units including Provincial Reconstruction Teams working with farmers and local agricultural officials throughout the targeted countries During 2010 USDA is increasing the number of agricultural experts serving in Afghanistan from 14 to 64 Their work is essential for stabilizing strategic areas of the country building government capacity ensuring the successful management of assistance programs and addressing the issue of food insecurity It is estimated that as much as 80 percent of the Afghan population relies on agriculture for wages and sustenance Consistent with these efforts the Department has established a priority for increasing the number of Afghan provinces in which women and children are food secure from 10 to 14 by the end of 2011
bull Expand research to increase the adaptation of sustainable agricultural systems to farmerrancher and ecosystem needs The budget includes an increase of $11 million for Sustainable Agriculture Research and Education (SARE) programs bringing total funding to $30 million This includes $10 million for the creation of a new Federal-State Matching Grant program to assist in the establishment and enhancement of State sustainable agriculture research education and extension programs The matching requirement will leverage State or private funds SARE works to increase knowledge about and to help farmers and ranchers adopt practices that are profitable environmentally sound and beneficial to communities These competitive grants for sustainable agriculture research and education projects are awarded to scientists producers and others in order to solve problems in an interdisciplinary approach SARE grants also fund education and demonstration projects including the development of farmer-to-farmer networks Increased investment in SARE will provide American producers the tools necessary to ensure a profitable livelihood while protecting and conserving the Nationrsquos land and water resources Approximately 17000 farmers and ranchers will experience benefits by implementing innovative practices learned by participating in SARE
bull Strengthen Biotechnology Regulation The budget provides about $19 million for Biotechnology Regulatory Services within the Animal and Plant Health Inspection Service
8
HIGHLIGHTS BY GOALS
(APHIS) to assess the risks of forthcoming genetically modified organisms This is an increase of about $6 million compared to 2010 This funding will contribute to the Departmentrsquos objective of enhancing Americarsquos ability to develop and trade agricultural products derived from new technologies This includes working to prevent regulated genetically engineered products from being co-mingled with non-regulated products in commercial channels A strong regulatory system is needed to ensure the safe intr oduction of biotechnology products and to provide multiple agricultural production options
bull Maintain the integrity of the National Organic Program With sales of organic products increasing at close to 20 percent a year over the last decade additional resources are needed to ensure the integrity of the organic label As a result the 2011 budget includes an increase of $31 million for the National Organic Program almost a 45 percent increase above the 2010 funding level The increase includes $21 million for regulatory review enforcement and development of equivalency agreements plus a one-time increase of $1 million to assist accredited certifying agents enhance compliance with program regulations and ensure the integrity of the organic label which may lead to enhanced export opportunities In addition 2008 Farm Bill funds will continue to be used to provide cost share assistance for organic certification An increase of $03 million is requested for AMSrsquo Market News to continue vital data collection and repor ting of organic commodity information initiated with 2008 Farm Bill funding
bull Initiatives under other goals that promote agricultural production and exports As previously noted although agency programs and associated funding have been aligned with the four program goals many programs contribute to the achievement of multiple goals Additional initiatives that promote agricultural production and exports and the goal of assisting rural communities to create prosperity are discussed beginning on page 13 These initiatives include increasing the competitiveness of American agricultural exports maintaining a strong agricultural safety net modernizin g the farm program delivery system and ensuring fair and competitive agricultural markets
STRATEGIC GOAL ENSURE THAT ALL OF AMERICArsquoS C HILDREN HAVE ACCESS TO SAFE NUTRITIOUS AND BALANCED MEALS
A plentiful supply of safe and nutritious food is essential to the well-being of every family and the healthy development of every child in America A recent report by the Department showed that in over 500000 families with children in 2008 one or more children simply do not get enough to eat There is a growing body of evidence demonstrating that children who eat poorly or who engage in too little physical activity do not perform as well as they could academically and that improvements in nutrition and physical activity can result in improvements in academic performance Too many children also have poor diets and gain excessive weight Recent data shows that the prevalence of obesity has increased over 10 percent to 17 percent for children between 6 and 19 years of age There is also a paradox that hungry children are disproportionately prone to obesity Having poor access to healthy food contributes significantly to both of these problems The 2011 budget includes a $400 million Administration proposal to address these access issues
9
HIGHLIGHTS BY GOALS
Foodborne illness is recognized as a significant public health problem in the United States which can have a more severe impact on children than healthy adults According to the Centers for Disease Control and Prevention approximately half of the reported foodborne illnesses occur in children These illnesses can lead to short and long-term health consequences and sometimes death USDA and other Federal agencies are working in cooperation to ensure that Americarsquos children have increased access to safe and healthy food The end result will be healthier more active children who will be better able to succeed and live vital lives
USDA helps keep safe nutritious food accessible and affordable by preventing the entry and establishment of agricultural pests and diseases and minimizing production losses Safeguarding animal and plant resources against the introduction of foreign agricultural pests and diseases provides access to a diverse supply of fruits vegetables meat and poultry The Department detects and quickly responds to new invasive species and emerging agricultural and public health situations These efforts contribute to the overall agricultural health of the nations and the world
USDA supports and protects the Nationrsquos agricultural system and the consumers it serves by safeguarding the quality and wholesomeness of meat poultry and egg products providing nutrition assistance to children and low-income people who need it and proactively addressing and preventing loss and damage from pests and disease outbreaks Actions to support this goal include (1) helping put a healthy diet within reach of every American by increasing access to nutritious food (2) promoting healthy diet and physical activity behavior s (3) protecting public health by ensuring food is safe and (4) protecting agricultural health by minimizing major diseases and pests to ensure access to safe plentiful and nutritious food
Ensure that all of Americas children have access to safe nutritious and balanced meals
Budget Authority (Dollars in Millions)
2009 2010 2011 Program Enacted Estimate Budget
Food Nutrition and Consumer Serviceshelliphelliphelliphelliphelliphelliphelliphelliphellip $82249 $93854 $107617 Food Safetyhelliphelliphelliphelliphelliphelliphelliphelliphelliphelliphelliphelliphelliphelliphelliphelliphelliphelliphelliphellip 983 1028 1046 Marketing and Regulatory Programshelliphelliphelliphelliphelliphelliphelliphelliphelliphellip 1364 1613 1530 Research Education and Economicshelliphelliphelliphelliphelliphelliphelliphelliphelliphellip 445 479 470 Totalhelliphelliphelliphelliphelliphelliphelliphelliphelliphelliphelliphelliphelliphelliphelliphelliphelliphelliphelliphelliphellip $85041 $96974 $110663
Key Proposals for the 2011 Budget
bull Strengthen Child Nutrition and WIC programs Reauthorization of the Child Nutrition and the Special Supplemental Nutrition Program for Women Infants and Children (WIC) programs will provide significant opportunity to make available the resources needed to achieve the Presidentrsquos goal to eliminate childhood hunger by 2015 The Administration is proposing to add $10 billion over the next ten years for this effort These programs touch virtually every child in America by providing nutritious food and nutrition education to help them get the best start they can in life and connect them with critical health care services
10
HIGHLIGHTS BY GOALS
The Administrationrsquos proposals consistent with the recent National Academies Institute of Medicine (IOM) study would improve access to nutritious meals particularly for low-income children improve access to healthy fruits and vegetables reduce the prevalenc e of obesity by improving the diets of school children and by encouraging children to make wise food choices in and outside of school and improve program performance and integrity
bull Fully fund WIC WIC helps improve the health and nutritional intake of low-income pregnant breast-feeding and postpartum women infants and children up to their fifth birthday A record $76 billion is requested to ensure that all eligible women infants and children who want to participate can In addition significant increases are provided to foster increased breastfeeding including more funds for bonuses to States with high achievement in this important health priority The funding includes the resources necessary for State agencies to administer the program and to make good on the promise of the updated WIC food packages implemented beginning in FY 2010 The new food packages align with the Dietary Guidelines and infant feeding guidelines of the American Academy of Pediatrics to better promote breastfeeding increase participant rsquos consumption of fruits vegetables and whole grains and provide flexibility to accommodate cultural food preferences WIC funding will support over 10 million participants
bull Expand Supplemental Nutrition Assistance Program (SNAP) The Administration is working to establish a practical national asset limit floor across means-tested human services food and cash assistance programs Legislative language will be provided to raise current SNAP asset limits to $10000 from $2000 per household or $3000 for households including an elderly or disabled member This nationwide figure will streamline eligibility for families eligible for benefits from multiple programs and encourage families to save toward self-sufficiency This change would add $426 million to recipient benefits and SNAP program costs in 2011 with a 5-year total of $45 billion In addition FNS seeks to minimize eligibility churning and disruption caused when SNAP households receive lump sum tax refunds Legislative language will also provide for the exclusion of tax refunds in the month of receipt and for the following 12 months beginning in tax year 2009 for SNAP and all federally funded means-tested programs This will exclude lump sum tax credits including Earned Income Child American Opportunity and Make Work Pay for 12 months following the month of receipt This policy will prevent beneficiaries from experiencing a disruption in eligibility and benefits in the wake of new and refundable tax credits This change will increase recipient benefits and SNAP program costs about $11 million in 2011 with a 5-year total cost of $52 million Legislation is also bein g proposed to extend the Recovery Act provision that eliminates the time limits for able-bodied adults without dependents for an additional year for a one-time cost of $25 million
bull Strengthen administration and oversight of nutrition assistance programs Additional funding is needed to increase the staff available to improve access to nutrition assistance advance the public trust and enhance the nutritional quality of our nutrition assistance programs With rising program levels due to increased demand for nutrition assistance and rising public awareness of these significant outlays it is vital that the Food and Nutrition Service have sufficient staffing to maintain program oversight At the same time FNS is working to support the reauthorization of the Child Nutrition and WIC Programs implement the Child Nutrition Reauthorization extension programs develop proposals for the
11
HIGHLIGHTS BY GOALS
2012 Farm Bill and implement the school meal pattern regulations from the Institute of Medicine recommendations on a significantly compressed timeline FNS staff years have declined significantly from a peak of over 2700 down to less than 1300 in 2009 as program level has i ncreased significantly For 2011 the budget includes an increase of $52 million to enhance the Federal investment in program administration grantee oversight and program integrity
bull Improve nutrition education and promotion resources To ensure USDA makes progress on its strategic objectives to decrease the prevalence of obesity among children and adolescents and to improve the quality of the diets measured by the Healthy Eating Index (HEI) scores for people in low-income households (under 130 of poverty level) and for the general population the budget includes an increase of $9 million The increase will allow USDA to significantly increase development of scientific-evidence-based nutrition guidance that provides the basis for nutrition education and promotion provided by our public and private sector partners Updated Dietary Guidelines for Americans will be completed in 2010 along with enhancements to MyPyramid including interactive applications The increased funding will be used to create effective nutrition education inte rventions for schools and communities and broaden and maintain tools and systems that Americans can use to adopt behaviors that lead to more healthful eating and active lifestyles
bull Strengthen the food safety infrastructure The budget includes $1 billion for the Food Safety and Inspection Service an increase of $18 million over 2010 and funds recommendations of the Presidentrsquos Food Safety Working Group (FSWG) and other initiatives aimed at improving USDArsquos public health infrastructure Effective food safety inspections and enforcement depend upon timely quality data and analysis To ensure inspectors have the information they need the Department has invested in an automated system to alert inspectors about potential food safety problems and give them greater and more timely access to establishment performance data The Presidentrsquos budget includes a request of $40 million an increase of $13 million to continue the deployment and enhancement of the FSIS public health information infrastructure Additionally in support of key findings of the Presidentrsquos FSWG USDA will hire more epidemiologists to improve investigations of foodborne illness and outbreaks in coordination with State officials to develop ldquotrace backrdquo tools and improve record-keeping Similarly the 2011 budget proposes a $10 million increase for Baseline Studies and Hazard Analysis and Critical Control Points (HACCP) Verification Program Updates This increase above the 2010 level will allow FSIS to improve surveillance of foodborne pathogens of human-health concern in FSIS-regulated products through significant expansion of the HACCP regulatory sampling and to develop more timely estimates of pathogen prevalence in food products Accurate timely prevalence estimates for pathogens in food products are critical for evaluation of existing prevention policies and the development of new regulatory strategies These new investments will enhance FSISrsquo ability to collect analyze and present data to allow decision making based on relevant timely product and process data utilizing the best science available and respond to foodborne illness outbreaks more effectively and efficiently to better protect consumers and help industry recover faster
bull Minimize the impact of major animal and plant diseases and pests As part of the Departmentrsquos goal to ensure children have access to safe nutritious and balanced meals
12
HIGHLIGHTS BY GOALS
APHIS and other agencies protect agricultural health by minimizing major diseases and pests APHIS activities that contribute to this goal include pest and disease exclusion plant and animal health monitoring response to outbreaks of foreign plant and animal threats and management of endemic pest and diseases Of note the 2011 budget includes $11 million to continue efforts initiated with emergency funding to address the light brown apple moth (LBAM) This is an increase of $10 million compared to 2010 The LBAM is an invasive pest that attacks a wide variety of plants of agricultural or horticultural significance APHIS estimates the pest could cause annual production losses up to $1 billion if allowed to spread
bull Expand food safety research The safety of the food supply continues to be a vital public health priority Therefore USDA research continually works to meet the evolving threats to the Nationrsquos food supply The Departmentrsquos research focuses on the reduction of the hazards of introduced and naturally occurring toxins in foods and feed including pathogenic bacteria viruses parasites chemical contaminants mycotoxins and naturally occurring toxins produced by plants As part of an integrated food safety research initiative the budget proposes an increase of $25 million $20 million through NIFArsquos Agriculture and Food Research Initiative competitive program and an additional $5 million for ARS food safety research These initiatives will strengthen surveillance and epidemiology program s control food pathogens in the preharvest stage develop innovative interventions strategies to eliminate pathogens and contaminants and ensure postharvest safety and quality
bull Increase the level of obesity prevention research The increasing prevalence of overweight and obesity is unprecedented in US history and is a major cause of escalating health care costs and a predisposition of Americans to cardiovascular disease Type 2 diabetes and several cancers There is a critical need for effective proven methods for the prevention of weight gain as an important step for reducing overall obesity and overweight in the population The 2011 budget includes an increase of $50 million for research through the Agriculture and Food Research Initiative competitive grant program that will focus on identifying behavioral factors that influence obesity and conducting nutrition research that leads to the development of effective programs to prevent obesity AFRI funding will also focus research on addressing the micronutrient content of new food crops and improving the nutritional value of staple crops fruits and vegetables through plant breeding leading to greater access to healthy foods
STRATEGIC GOAL ASSIST RURAL COMMUNITIES TO CREATE PROSPERITY SO THEY ARE SELF-SUSTAINING REPOPULATING AND ECONOMICALLY THRIVING
The economic downturn has impacted many sectors and areas of the Nation including rural America At this time there remains high poverty in sparsely populated rural areas which is reflected in higher mortality rates for children higher unemployment and declining populations Since the beginning of the economic slowdown rural residents have experienced a greater decline in real income compared to other parts of the Nation Some factors contributing to this include lower rural educational attainment less competition for workers among rural employers and fewer highly skilled jobs in the rural occupational mix Given these challenges it is not surprising that over 51 percent of rural counties lost population and that a majority of farm families rely on a significant amount of off-farm income to meet their needs However an
13
HIGHLIGHTS BY GOALS
energetic and creative citizenry is looking for new ways to spur rural economic activity to create prosperity and strengthen the economic foundations of their communities Rural communities and businesses are implementing innovative technologies and modernizing infrastructure to create jobs develop new markets and increase competitiveness while conserving the Nationrsquos natural resources and providing a safe sufficient and nutritious food supply for the country and the world As a leading advocate for rural America USDA is at the forefront of developing the technology and tools necessary to transform rural America to take advantage of new opportunities
The Department supports rural communities and enhances quality of life for rural residents by improving their economic opportunities community infrastructure environmental health and the sustainability of agricultural production The common goal is to help create thriving rural communities where people want to live and raise families and where the children have economic opportunities and a bright future USDA will support this goal with actions to support a competitive agricultural system create livable communities and enhance rural prosperity The cornerstone of these efforts include five pillars of success which are (1) increasing access to broadband and continuous business creation (2) facilitating sustainable renewable energy development (3) developing regional food systems (4) capitalizing on climate change opportunities and (5) generating and retaining jobs through recreation and natural resource restoration conservation and management
Assist rural communities to create prosperity so they are self-sustaining repopulating and economically thriving
Budget Authority (Dollars in Millions)
2009 2010 2011 Program Enacted Estimate Budget
Farm and Foreign Agricultural Serviceshelliphelliphelliphelliphelliphelliphelliphelliphellip Rural Developmenthelliphelliphelliphelliphelliphelliphelliphelliphelliphelliphelliphelliphelliphelliphelliphelliphellip Natural Resources and Environmenthelliphelliphelliphelliphelliphelliphelliphelliphelliphellip Marketing and Regulatory Programshelliphelliphelliphelliphelliphelliphelliphelliphelliphellip Research Education and Economicshelliphelliphelliphelliphelliphelliphelliphelliphelliphellip Office of the Secretaryhelliphelliphelliphelliphelliphelliphelliphelliphelliphelliphelliphelliphelliphelliphelliphellip Office of the Chief Economisthelliphelliphelliphelliphelliphelliphelliphelliphelliphelliphelliphelliphellip
$20378 7247 2005
950 1355
0 6
$19171 3343
978 871
1286 0 6
$19848 2944
986 868
1267 35 6
Totalhelliphelliphelliphelliphelliphelliphelliphelliphelliphelliphelliphelliphellip helliphelliphelliphelliphelliphelliphellip hellip $31941 $25655 $25954
Key Proposals for the 2011 Budget
Multi-Agency Initiatives
bull Increase the prosperity of rural communities by strategically investing in regional innovation In recent years rural communities have been losing population have a growing income disparity with urban communities and have an aging workforce To increase prosperity USDA proposes to establish a Regional Innovation Initiative to focus on the
14
HIGHLIGHTS BY GOALS
planning and coordination of USDA and other sources of assistance for rural communities The initiative recognizes that individual communities are often affected by linkages to the other communities within regions and that working together can produce more prosperity for all By creating a regional focus and increasing collaboration with other Federal agencies USDA resources will have a larger impact enabling greater wealth creation quality of life improvements and sustainability USDA will implement a strategy that includes substantial technical assistance to enable rural regions to develop regional strategic plans Several USDA agencies will participate in the initiative including agencies from the Rural Development Marketing and Regulatory Programs and Natural Resources and Environment mission areas Beginning in 2010 USDA intends to explore its current authorities to demonstrate the potential for this approach The 2011 budget includes $14 million in Rural Development to support coordination of regional planning activities It also includes a general provision to provide a 5 percent set-aside of the funding for several USDA programs This set aside will facilitate funding for proje cts that are part of a regional strategy subject to projects meeting the eligibility requirements for the individual programs The set-aside would amount to over $135 million in budget authority which would be sufficient to support a program level of about $280 million
bull Provide incentives for food entrepreneurs to establish or expand markets and grocery stores to make healthy foods available to underserved Americans The 2011 Budget provides funding for a new multi-year multi-agency Healthy Food Financing Initiative that will increase the availability of affordable healthy foods in underserved urban and rural communities particularly through the development or equipping of grocery stores and other healthy food retailers The Departments of Agriculture Health and Human Services and Treasury will partner to make available over $400 million in financial and technical assistance to community development financial institutions other nonprofits public agencies and businesses with sound strategies for addressing the healthy food needs of communities The USDA budget includes a total of $50 million for the initiative These funds will be made available for a number of loan grant promotion and other programs that provide financial and technical assistance to support market p lanning and promotion efforts as well as infrastructure and operational improvements designed to stimulate consumer demand enhance marketing expand demand and retail outlets for farm products and increase availability of locally and regionally produced foods
bull Increase economic opportunities for producers by developing local and regional food systems USDArsquos ldquoKnow Your Farmer Know Your Foodrdquo initiative will facilitate the development of local and regional food systems that better connect consumers with local farms create new income opportunities for farmers and place a greater focus on sustainable agricultural practices and nutritious local food An increased emphasis on regional food systems will have direct and significant benefits to rural communities USDA will work to promote local and regional distribution and utilize existing strategic partnerships to levera ge local food systems USDA will also work more closely with local purchasers institutional purchasers and other regional stakeholders to create regional support systems This effort will leverage funding and program expertise from every mission area of the Department
15
HIGHLIGHTS BY GOALS
bull Promote the development of renewable energy to support energy independence and a healthier environment USDA promotes rural Americarsquos leadership in the research development and sustainability of renewable energy and energy efficiency in order to effectively reduce Americarsquos dependence on foreign oil and reduce greenhouse gas emissions USDA programs make it economically feasible for farmers ranchers and other rural small businesses to invest in alternative energy production and energy-saving activities Through funding opportunities in the form of payments grants loans and loan guarantees USDA is committed to developing clean energy sources promoting energy efficiency and curbing the effects of climate change The 2011 budget supports renewable energy development through commercialization and research This support will create jobs help establish businesses and improve economic prosperity in rural areas The budget includes funding for programs with specific energy-related purposes including the Rural Energy for America Program (REAP) and the Biorefinery Assistance Program to add to the mandatory funding provided through the 2008 Farm Bill Funding for several business programs including the Business and Industry Loan Guarantee Program and Value-Added Grants will be available for green energy projects Funding for the Homeownership Loan and Loan Guarantee programs will provide financing for more energy efficient homes In support of the Presidentrsquos commitment made at the 2009 G20 Summit the budget will target Electric Loan Program financing to alternative energy and end subsidies for the generation of electricity using fossil fuel Finally the budget includes an increase of $34 million for a comprehensive research program in alternative and renewable energy within the Agriculture and Food Research Initiativersquos competitive grant program This will advance the development of dedicated sustainable feedstocks and feedstock production systems which will not impact the food supply
bull Make rural America a better place to live USDA seeks not only to enhance the opportunities necessary for rural families to thrive economically but also to improve the living conditions in rural communities so that they are places where people can thrive USDA provides the resources and expertise necessary to rebuild the infrastructure of small communities ensuring that rural residents have decent housing and home-ownership opportunities clean water adequate systems for handling waste and vital community facilities including critical health-care centers schools and public safety departments For 2011 the budget supports $12 billion for rural home ownership by establishing a fee structure consistent with other Federal housing programs that will eliminate the subsidy costs for all new guaranteed loans Furthermore the budget includes a loan level increase of over $25 million to provide funding to support additional multi-family housing for very-low and low income families In 2011 the budget supports $16 billion in program level to provide over 14 million rural households with new or improved water and waste disposal facilities
A healthy environment is also an essential ingredient for thriving sustainable rural communities and rural quality of life For 2011 the Conservation Stewardship Program (CSP) will serve a key rol e in improving and maintaining the quality of surface water and groundwater in order to protect human health support a healthy environment and enable the productive use of land The FY 2011 budget funds CSP at approximately $630 million and nearly half or $315 million is targeted towards conservation planning and implementation to meet this strategic goal
16
HIGHLIGHTS BY GOALS
Improving agricultural education is critical to retaining young people in rural America The 2011 budget includes a number of investments in education including $10 million for the Hispanic-Serving Agricultural Colleges and Universities Endowment Fund The annual interest earnings from the Endowment Fund will be used to enhance education in agricultural sciences and related disciplines by building educational capacity at these institutions in the areas of curricula design faculty development and student recruitment and retention Additionally increased funding of $23 million is proposed in 2011 for expanding extension education programs on Indian Reservations and Tribal jurisdictions through the Federally-Recognized Tribes Extension Program and an increase of $1 million is required for Tribal Colleges Extension Services at all 1994 land-grant institutions to address the nutrition education needs of Native American s The budget also includes an increase of $5 million to support the next generation of agricultural scientists in the workforce by working with higher-education institutions to develop education and training programs with strong science technology engineering and math curriculums and increase enrollment in secondary and two-year post-secondary programs
Other Proposals
bull Increase the competitiveness of American agricultural exports Agricultural trade contributes directly to the prosperity of local and regional economies across rural America through higher commodity prices and increased sales USDA estimates that every $1 billion worth of agricultural exports supports 9000 jobs and generates an additional $14 billion in economic activity At the same time however foreign trade barriers limit exports thereby reducing farm income and preventing job growth in the agricultural sector The 2011 budget supports the National Export Initiative by providing increased funding of $54 million for the Foreign Agricultural Service (FAS) to support activities that will help to bolster the level of US agricultural exports and thereby contribute to enhanced rural prosperity and employment Of the funding provided $10 million will be used to expand FAS exporter assistance and in-country promotion activities and to meet higher operating costs at FAS overseas posts The initiative also includes $345 million to supplement funding for the Foreign Market Development (Cooperator) Program and $9 million for the Technical Assistance for Specialty Crops (TASC) Program Funding for the Cooperator and TASC programs will be in addition to that provided by the Commodity Credit Corporation and will double the overall level of funding for both programs in 2011
bull Maintain a strong agriculture safety net The 2011 budget maintains strong support for American farmers and ranchers through a system of income support disaster mitigation and farm loan programs Income support programs including direct and counter-cyclical payments and Average Crop Revenue Election payments are expected to total nearly $9 billion in 2011 The budget proposes modest reductions in the current cap on direct payments and a three-year phased reduction in farm program average Adjusted Gross Income eligibility limits for large farmers and wealthy landowners These adjustments in current program limits would affect only a very small portion of the farm program participants without disturbing the foundation of the current safety net for productive family farmers Disaster mitigation programs include the Supplemental Agricultural Disaster Assistance (SADA) programs and the Federal crop insurance program FY 2011 assistance under the SADA programs is expected to total about $14 billion while net indemnities (gross
17
HIGHLIGHTS BY GOALS
indemnities minus producer premium) under the Federal crop insurance program are expected to total about $46 billion Farm loan programs including direct and guarantee d farm ownership operating and conservation loans and Indian fractionated land loans are expected to total over $47 billion in 2011 The budget proposes $5 million increase in funding for the county estimates data collected by the National Agricultural Statistics Service Improving the quality of this data will enhance the integrity of the farm programs
bull Create new economic opportunities for American agriculture through environmental services markets To support the Departmentrsquos efforts of creating economic opportunities in rural America the 2011 budget includes activities to expand market opportunities for farmers ranchers and forest landowners Although climate change is a critical challenge facing the agricultural and forestry communities proposed legislation to respond to that challenge may create significant economic opportunities To take advantage of these opportunities USDA is seeking $2 million to support the Office of Ecosystem Services and Markets to provide analysis and establish guidelines for participation of agriculture producers and forest landowners in potential offset markets under a carbon cap and trade system These guidelines will also support market opportunities in the provision of other ecosystem services beyond carbon sequestration such as wildlife habitat preservation and water quality management Through the development of these guidelines USDA will strive to expand opportunities in rural America to create prosperity while conserving natural resources
bull Continue modernization of the farm program delivery system Continued progress needs to be made in modernizing IT systems critical to the delivery of farm service programs These systems support the delivery of over $9 billion of farm program benefits to 14 million producers Several initiatives are underway to streamline business processes and transition them away from an antiquated legacy IT system to a 21st century IT system When fully implemented these new delivery processes will expedite the delivery of all farm programs including the 2008 Farm Bill programs An increase of $953 million is proposed to support these modernization efforts This amount consists of $393 million directed toward the multi-year MIDAS initiative to streamline business processes for farm program delivery $20 million to convert software and transition applications from outmoded legacy systems to new web-based technologies and $36 million to support an $83 million multi-agency effort to refresh the aging hardware supporting the Common Computing Environment in order to maintain system reliability
bull Create National Forest recreation and forestry job opportunities USDA natural resources conservation restoration and land management programs generate economic value by attracting tourism and recreation visitors and sustaining green jobs including work restoring or creating trails and facilities providing camping boating and outfitter and guide services and supporting associated retail businesses The 2011 Forest Service (FS) recreation budget includes an increase of $5 million to ensure the National Forest roads that provide recreation opportunities to the public match the FSrsquo newly created motor-vehicle-use maps The FS budget also contains $50 million for the Presidentrsquos new Pr iority Watersheds and Job Stabilization initiative A main focus of this initiative will be creating and preserving jobs After conducting a prioritization assessment FS will use stewardship contracts (10 years in length) to produce long-term jobs across the Nation Moreover the agency will leverage outside sources to create jobs for youth in rural areas
18
HIGHLIGHTS BY GOALS
bull Ensure fair and competitive agricultural markets The 2011 budget includes an increase of $18 million to further streng then enforcement of the Packers and Stockyards Act With additional staff and legal support the Grain Inspection Packers and Stockyards Administration will bolster direct enforcement and promote greater voluntary compliance with the Act Current staffing levels are insufficient to address the growing need for regulatory and audit activities
STRATEGIC GOAL ENSURE OUR NATIONAL FORESTS AND PRIVATE WORKING LANDS ARE CONSERVED RESTORED AND MADE MORE RESILIENT TO CLIMATE CHANGE WHILE ENHANCING OUR WATER RESOURCES
A healthy and prosperous America relies on the health of our natural resources and particularly our forests and agricultural working lands The health of Americarsquos forests farmers ranchers and grasslands must be nurtured so that they continue to offer environmental benefits as a source of clean air clean and abundant water and wild life habitat Americarsquos forests supply communities with clean abundant water shelter wildlife and help us mitigate and adapt toclimate change Forests also help generate rural wealth through recreation and tourism through the creation of green jobs and through the production of wood products and energy They are a source of cultural heritage and are a national treasure
USDA plays a pivotal role in protecting and restoring these lands while making them more resilient to threats and enhancing our natural resources USDA partners with private landowners to help protect the Nationrsquos 13 billion acres of farm ranch and private forestlands As public land stewards USDA works to conserve and restore 193 million acres of National Forests and Grasslands in the National Forest System Through these programs USDA partners with other Federal agencies tribal and state governments and non-governmental organizations to assist land and natural resource managers and to connect people to the Nationrsquos magnificent lands USDA agencies provide technical financial and planning assistance to public and private partners USDArsquos data banks research and innovations give landowners and managers access to the latest science and technology to make informed decisions and implement conservation practices USDA also connects forest and farm landowners with emergent markets for ecosystem services so that they can reap the economic and environmental benefits of good stewardship This goal will be supported with actions to (1) Restore and conserve the Nationrsquos forests farms ranches and grasslands (2) Lead efforts to mitigate and adapt to climate change (3) Protect and enhance Americarsquos water resources and (4) Reduce risk from catastrophic wildfire and restore fire to its appropriate place on the landscape
19
HIGHLIGHTS BY GOALS
Ensure our national forests and private working lands are conserved restored and made more resilient to climate change while enhancing our water resources
Budget Authority (Dollars in Millions)
2009 2010 2011 Program Enacted Estimate Budget
Farm and Foreign Agricultural Serviceshelliphelliphelliphelliphelliphelliphelliphelliphellip $2245 $2331 $2317 Natural Resources and Environmenthelliphelliphelliphelliphelliphelliphelliphelliphelliphellip 8564 9149 9146 Marketing and Regulatory Programshelliphelliphelliphelliphelliphelliphelliphelliphelliphellip 86 101 71 Research Education and Economicshelliphelliphelliphelliphelliphelliphelliphelliphelliphellip 420 444 448 Office of the Chief Economisthelliphelliphelliphelliphelliphelliphelliphelliphelliphelliphelliphelliphellip 0 3 3 Hazardous Materials Managementhelliphelliphelliphelliphelliphelliphelliphelliphelliphelliphellip 5 5 5 Totalhelliphelliphelliphelliphelliphelliphelliphelliphelliphelliphelliphelliphelliphelliphelliphelliphelliphelliphelliphelliphellip $11320 $12033 $11990
Key Proposals for the 2011 Budget
Multi-Agency Initiatives
bull Expand funding for financial and technical assistance to support Farm Bill conservation programs The budget includes record levels of support for Farm Bill conservation programs bringing total funding to about $5 billion an increase of $42 million Recognizing the need for judicious allocation of these conservation resources the budget reflects a strategic targeting of high priority programs current workforce and workload capacity and efforts to ensure financial integrity and cost effectiveness This level of funding will also ensure beneficial results from investments in conservation The Conservation Reserve Program is funded at $196 billion about the same level as 2010 to support total enrollment of more than 30 million acres The Environmental Quality Incentives Program (EQIP) which is vital to ensuring that agricultural lands are effectively managed to support both agricultural production and conservation is funded at $121 billion an increase of $28 million over 2010 The Chesapeake Bay Watershed Initiative which is operated under EQIP will be funded at a level of $72 million an increase of $29 million over 2010 to help agricultural producers install conservation practices in the Chesapeake Bay watershed Funding for the newly operational Conservation Stewardship Program will be increased by $160 million to a total of $629 million which will enroll 12 million new acres in the program as well as support prior year contracts Wetlands are among the most productive ecosystems in the world that provide countless economic and environmental benefits to local communities The Wetlands Reserve Program which is one of the principal programs that support wetlands preservation and restoration is funded at $502 million in 2011 This will enable enrollment of nearly 193000 new acres into the program a level well above recent year enrollments
bull Enhance the protection of the Nationrsquos water supply To accelerate progress in protecting and enhancing the Nationrsquos water supply strategic conservation efforts are called for that identify the priority landscapes most in need of attention the critical acres within those
20
HIGHLIGHTS BY GOALS
landscapes and the high impact target (HIT) practices that will deliver the greatest benefit The 2011 budget supports efforts by the Natural Resources Conservation Service and the Forest Service to achieve the Departmentrsquos priority for accelerating the protection of clean abundant water resources by implementing HIT practices on 15 million acres of agricultural lands and 15 million acres of National Forests in priority landscapes HIT practices are those conservation measures identified by the Department to have the most significant impact on improving or conserving land and water resources Priority land scapes may include the Chesapeake Bay Upper Mississippi River Delta Lower Mississippi River Delta the Sierra Nevada the Front Range of Colorado and the California Bay Delta
Other Proposals
bull Improve targeting of conservation technical and financial assistance The 2011 budget proposes an innovative new approach to improving the Departmentrsquos strategic investment in conservation by establishing and deploying Strategic Watershed Action Teams in high priority watersheds that would help plan and apply conservation practices in a defined landscape The budget includes an increase of $25 million to support up to 35 teams of five NRCS employees each to target an identified watershed for a period of 3 to 4 years with the intent of reaching 100 percent of the landowner base eligible for Farm Bill conservation program assistance The additive effect of planned and applied conservation practices would hasten environmental improvement while keeping production agriculture competitive and profitable This initiative should greatly increase the environmental cost-effectiveness of NRCS technical and financial assistance programs It will also improve the agencyrsquos coordination with the Forest Service as that agency seeks to adopt a more landscape-scale approach to leverage its natural resource programs and to conserve and restore forestland and grassland
bull Increase support for the Land and Water Conservation Fund (LWCF) The LWCF is a special account created in 1964 and has been the principal federal source of monies to acquire new recreation lands Forest Service is one of four federal agencies to receive a portion of these funds The fund accumulates revenues from designated sources and they become available only after Congress appropriates them In line with the Presidentrsquos commitment t o fully fund the LWCF by 2014 the Forest Servicersquos Forest Legacy program and Land Acquisition program have proposed increases of $21 million and $10 million respectively
bull Improve National Forest System (NFS) watersheds Protecting Americarsquos supply of clean and abundant water is among the most crucial environmental challenges of the 21st Century Water is essential for life and vital to our prosperity this precious resource is the foundation for healthy ecosystems sustainable agricultural and forest production livable communities and viable industry The Forest Service has placed a focus on improving the health of its watersheds restoring ecosystem functions and increasing forestsrsquo resiliency to climate change The budget proposes a new line item ldquoIntegrated Resource Restorationrdquo that better characterizes the scope of the work that the Agency intends to perform in 2011 This line item is funded at $694 million of which $40 million is provided for the Collaborative Forest Landscape Restoration Fund and $50 million is provided for the Presidentrsquos new Priority Watersheds and Job Stabilization initiative Under this initiative rapid watershed
21
HIGHLIGHTS BY GOALS
assessments will be conducted of all NFS lands the agency will prioritize watershed improvement work and work that can demonstrate a change in watershed condition will be funded in a variety of watersheds across the country
bull Support Climate Change Mitigation and Adaptation USDA provides leadership to help landowners and communities adapt to climate change impacts that are already appearing These include changing water flow availability and quality changing weather patterns and ambient temperatures increased fire risk increased threats from insects and disease and changing habitat and climatic zones USDA conducts research that contributes to the development of climate change mitigation and adaptation tools and technologies and USDA outreach and extension networks make them available to farmers ranchers and land managers The 2011 budget includes an increase of $50 million within the Agriculture and Food Research Initiative competitive grants program for global climate change r esearch to develop mitigation capabilities and adaptive capacities for agricultural production
MANAGEMENT INITIATIVES
To support achievement of its strategic goals USDA is working to transform itself into a model organization By strengthening management operations and engaging employees USDA will improve customer services increase employment satisfaction and develop and implement strategies to enhance leadership performance diversity and inclusion The transformation will result in process improvements and increased perfo rmance USDA has identified the following eight management initiatives to support this effort
bull Engage USDA Employees to Transform USDA into a Model Agency USDA will continue to generate opportunities to listen to employeesrsquo concerns and ideas and to design and implement beneficial systemic changes to processes that affect employee satisfaction and human resources
bull Provide Civil Rights Services to Agriculture Employees and Customers The Departmentrsquos leadership has established civil rights as one of its top priorities To be successful all USDA employees must be committed to making USDA a model in the Federal Government for respecting the civil rights of its employees and constituents
bull Coordinate Outreach and Improve Consultation and Collaboration Efforts to Increase Access to USDA Programs and Services USDA will ensure that all Americans have equal and fair access to key USDA programs and services
bull Leverage USDA Departmental Management to Increase Performance Efficiency and Alignment USDA will expand the use of performance metrics to track areas of success and those needing improvement across the Department This information will allow agency decision makers to align resources to achieve the highest outcome
bull Optimize Information Technology (IT) Policy and Applications The Department is working to improve the effective delivery of programs and services to its constituents applicants and customers by deploying broadband creating an enterprise platform that
22
HIGHLIGHTS BY GOALS
enables open communication channels ensuring the protection of mission-critical operations and customer data and supporting portfolio views for managing across organization and geographic boundaries
bull Optimize USDA ldquoGreenrdquo or Sustainable Operations One of the Presidentrsquos top priorities for all Federal agencies is to establish an integrated strategy to work towards sustainability and to achieve reduction of greenhouse gas emissions As a steward of natural resources USDA is committed to achieving these goals and will focus its efforts towards sustainable operations
bull Enhance USDA Homeland Security and Emergency Preparedness to Protect USDA Employees and the Public USDA is working to enhance homeland security and emergency activities to provide a coordinated national effort to protect American agriculture and rural communities from intentional harm
bull Enhance the USDA Human Resources Process to Recruit and Hire Skilled Diverse Individuals to Meet the Program Needs of USDA USDA is reforming its hiring process to ensure a streamlined user-friendly environment for both the applicant and the hiring manager which will lead to the identification and selection of the most talented and competent workforce possible In doing so the Department will experience increased diversity while addressing current and future skills gaps
Key Proposals for the 2011 Budget
bull Enhance human resource capabilities As part of its efforts to transform USDA into a model organization Departmental Management (DM) is leading an initiative to respond to the Departmentrsquos human resources challenges As part of this initiative DM will focus on improving leadership development labor relations human resources accountability and veterans and other special employment programs This initiative will allow USDA to develop a workforce capable of leading the Department as it implements the strategic goals set forth by the Administration
bull Expand Program Participation of Underserved Constituents To address the need for better outreach to underserved program participant groups USDA is proposing to expand the Office of Advocacy and Outreach (OAO) in the 2011 budget through an increase of $5 million Of this amount $4 million is requested for agricultural labor grants authorized under section 14204 of the 2008 Farm Bill This program was funded through Rural Development in 2010 at the same level As part of this proposal USDA is requesting funding that will allow OAO to adequately conduct its activities related to overseeing the Advisory Committees on Minority Farmers and Beginning Farmers and Ranchers administration of the Outreach to Socially Disadvantaged Farmers Grant Program (section 2501 Program) overseeing the activities of the Office of Small Farms Coordination and the Farm Worker Coordinator managing t he 1994 1890 and Hispanic Serving Institutions Programs and other outreach functions
bull Improve service center agency IT infrastructure The 2011 budget includes $83 million to support the Departmentrsquos multi-agency effort to modernize and upgrade the IT
23
HIGHLIGHTS BY GOALS
infrastructure (also known as the Common Computing Environment (CCE)) for the Service Center Agencies (SCAs) These funds are requested in FSA NRCS and RD The proposed funding will be used to replace outdated components of the CCE many of which have exceeded their expected life cycles to reduce system vulnerabilities to failure and improve the performance and effectiveness of the shared infrastructure These improvements will allow the SCAs to better serve program participants with a more flexible and reliable IT infrastructure This funding will allow for the first system-wide refresh of the CCE since the infrastructure was implemented in 2000 In addition as the components of the CCE are replaced USDA will implement a right-sizing process whereby configuration changes will be made to better support the delivery of current and future programs As part of this process the Department will strive to improve system security reduce the long term cost of infrastructure services and improve service reliability
bull Enhance Acquisition Workforce Capabilities The 2011 budget requests $65 million to support a Government-wide Contracting and Acquisition Workforce Training initiative The requested funding will allow USDA to implement training recruitment and retention activities for the Departmentrsquos procurement workforce that is responsible for over $5 billion in annual procurement for the Department These workforce efforts along with procurement system improvements will allow USDA to achieve substantial cost savings and cost avoidances in the contracting and acquisition activities across all agencies
24
FARM AND FOREIGN AGRICULTURAL SERVICES
MISSION AND RELATIONSHIP TO STRATEGIC GOALS
The Farm and Foreign Agricultural Services (FFAS) mission area has responsibility for the delivery of programs and services which focus on supporting a sustainable and competitive US agricultural system The US agricultural sector produces $300 billion worth of farm products providing a major foundation for prosperity in rural areas as well as a critical element of the nationrsquos economy FFAS also plays an important role in the protection and enhancement of the Nationrsquos natural resource base and environment Thus the area contributes to multiple USDA Strategic Goals Specifically to assist rural communities create prosperity the FFAS mission area engages in the following activities (1) supports a strong farm financial safety net and (2) promotes the vitality of rural America by improving access to international markets providing credit guarantees for US farm exports supporting industry efforts to develop new markets and promoting better international acceptance of the products of biotechnology In support of ensuring private working lands are preserved the FFAS area (1) protects watershed health to ensure clean and abundant water and (2) enhances soil quality to maintain productive working cropland Finally in support of agricultural production and biotechnology it promotes the international acceptance of new technologies including biotechnology and promotes sustainable productive agricultural systems and trade in developing countries to enhance global food security
The work of the FFAS mission area is carried out by its three agencies the Farm Service Agency (FSA) Risk Management Agency (RMA) and Foreign Agricultural Service (FAS)
FARM SERVICE AGENCY (FSA)
FSA supports the delivery of farm credit disaster assistance and commodity and related programs and also administers some of the USDA conservation programs FSA provides administrative support for the Commodity Credit Corporation (CCC) which funds most of the commodity export and some of the conservation programs of USDA To deliver its programs FSA operates an extensive network of local Service Centers
Farm Loans Programs Program Level
$ M
illio
ns
3500
3000
2500
2000
1500
1000
500
0
$1952 $2599
$1895
$3245
$1578
$3219
FY 2009 FY 2010 FY 2011
Direct Guaranteed
25
FARM AND FOREIGN AGRICULTURAL SERVICES
Farm Service Agency Budget Authority
(Dollars in Millions) 2009 2010 2011
Program Enacted Estimate Budget Discretionary FSA Salaries and Expenses Salaries and Expenses (Direct Appropriation)helliphelliphelliphelliphelliphelliphellip $1170 $1254 $1365 Transfers from Program Accountshelliphelliphelliphelliphelliphelliphelliphelliphelliphelliphellip (313) (316) (321) Total Salaries and Expenseshelliphelliphelliphelliphelliphelliphelliphelliphelliphelliphelliphelliphellip (1483) (1570) (1686) Agricultural Credit Insurance Fund Program Account Transfer to FSA Salaries and Expenseshelliphelliphelliphelliphelliphelliphelliphelliphellip 309 313 318 Loan Subsidyhelliphelliphelliphelliphelliphelliphelliphelliphelliphelliphelliphelliphelliphelliphelliphelliphelliphelliphelliphellip 219 141 151 Loan Program Expenseshelliphelliphelliphelliphelliphelliphelliphelliphelliphelliphelliphelliphelliphelliphellip 8 8 8 Total Agricultural Credit Insurance Fund Program Accounthellip 536 462 477 State Mediation Grantshelliphelliphelliphelliphelliphelliphelliphelliphelliphelliphelliphelliphelliphelliphelliphellip 4 4 4 Grassroots Source Water Protection Programhelliphelliphelliphelliphelliphelliphellip 5 5 0 Reforestation Pilot Programhelliphelliphelliphelliphelliphelliphelliphelliphelliphelliphelliphelliphelliphellip 1 1 0 Durum Wheat Quality Programhelliphelliphelliphelliphelliphelliphelliphelliphelliphelliphelliphelliphellip 0 3 0 Geographically Disadvantaged Farmers and Ranchershelliphelliphelliphellip 0 3 0 Total Ongoing Discretionary Programshelliphelliphelliphelliphelliphelliphelliphelliphellip 1716 1732 1846 Dairy Price Supporthelliphelliphelliphelliphelliphelliphelliphelliphelliphelliphelliphelliphelliphelliphelliphelliphellip 0 350 0
Total Discretionary Programshelliphelliphelliphelliphelliphelliphelliphelliphelliphelliphelliphellip 1716 2082 1846 Recovery Act FSA Salaries and Expenseshelliphelliphelliphelliphelliphelliphelliphelliphelliphelliphelliphelliphelliphellip 50 0 0 Agricultural Credit Insurance Fund (Subsidy)helliphelliphelliphelliphelliphelliphellip 20 0 0 Total Recovery Acthelliphelliphelliphelliphelliphelliphelliphelliphelliphelliphelliphelliphelliphelliphelliphellip 70 0 0 Total Discretionary Programshelliphelliphelliphelliphelliphelliphelliphelliphelliphelliphelliphellip 1786 2082 1846 Mandatory Dairy Indemnity Programhelliphelliphelliphelliphelliphelliphelliphelliphelliphelliphelliphelliphelliphelliphellip 1 1 1 Agricultural Disaster Relief Fundhelliphelliphelliphelliphelliphelliphelliphelliphelliphelliphelliphellip 703 526 891 Recovery Act Supplemental Agricultural Disaster Assistancehelliphelliphelliphelliphelliphellip 0 230 0 Aquaculture Assistance Grantshelliphelliphelliphelliphelliphelliphelliphelliphelliphelliphelliphelliphellip 50 0 0 Total Recovery Acthelliphelliphelliphelliphelliphelliphelliphelliphelliphelliphelliphelliphelliphelliphelliphellip 50 230 0 Total Mandatory Programshelliphelliphelliphelliphelliphelliphelliphelliphelliphelliphelliphelliphellip 754 757 892 Total Farm Service Agencyhelliphelliphelliphelliphelliphelliphelliphelliphelliphelliphelliphelliphellip $2540 $2839 $2738
26
FARM AND FOREIGN AGRICULTURAL SERVICES
Farm Service Agency Agricultural Credit Insurance Fund
Farm Loan and Grant Programs Program Level (PL) and Budget Authority (BA)
(Dollars in Millions) 2009
Enacted Program PL BA
Farm Operating Loans Guaranteed Unsubsidizedhelliphelliphelliphelliphelliphelliphellip $1160 $29 Guaranteed Subsidizedhelliphelliphelliphelliphelliphelliphelliphelliphellip 150 21 Directhelliphelliphelliphelliphelliphelliphelliphelliphelliphelliphelliphelliphelliphelliphellip 685 81
Total Operating Loanshelliphelliphelliphelliphelliphelliphellip 1995 131 Farm Ownership Loans Guaranteed Unsubsidizedhelliphelliphelliphelliphelliphelliphellip 1239 4 Directhelliphelliphelliphelliphelliphelliphelliphelliphelliphelliphelliphelliphelliphelliphellip 200 13
Total Ownership Loanshelliphelliphelliphelliphelliphelliphellip 1439 17 Indian Land Acquisition Loanshelliphelliphelliphelliphelliphellip 4 a Boll Weevil Eradicationhelliphelliphelliphelliphelliphelliphelliphelliphellip 100 0 Conservation Loans Guaranteedhelliphelliphelliphelliphelliphelliphelliphelliphelliphelliphelliphellip 0 0 Directhelliphelliphelliphelliphelliphelliphelliphelliphelliphelliphelliphelliphelliphelliphellip 0 0 Total Conservation Loanshelliphelliphelliphelliphelliphellip 0 0 Indian Fractionated Land Loanshelliphelliphelliphelliphellip 0 0
Total Ongoing Farm Loan Programshelliphellip 3538 148
Supplemental Appropriations Farm Operating Loans Guaranteed Unsubsidizedhelliphelliphelliphelliphelliphellip 50 1 Directhelliphelliphelliphelliphelliphelliphelliphelliphelliphelliphelliphelliphellip 400 47 Total Operating Loanshelliphelliphelliphelliphelliphellip 450 48 Farm Ownership Loans Directhelliphelliphelliphelliphelliphelliphelliphelliphelliphelliphelliphelliphellip 360 23 Total Ownership Loanshelliphelliphelliphelliphellip 360 23
Recovery Act Direct Farm Operating Loanshelliphelliphelliphelliphellip 173 20 Total Farm Loan Programshelliphelliphelliphelliphelliphellip 4521 239 Emergency Loans bhelliphelliphelliphelliphelliphelliphelliphelliphelliphellip 30 4 Total Farm Loan and Grant Programshellip $4551 $243
2010 Estimate
PL BA
$1500 $35 170 24
1000 47
2670 106
1500 6 650 27
2150 33 4 0
100 0
75 a 75 1
150 1 10 1
5084 141
0 0 0 0 0 0
0 0 0 0
0 0 5084 141
56 2 $5140 $143
2011 Budget
PL BA
$1500 $35144 20900 55
2544 110
1500 6475 33
1975 39 2 0
60 0
75 a75 2
150 2 10 a
4741 151
0 00 00 0
0 00 0
0 04741 151
56 6$4797 $157
a Less than $05 million b From funds carried over from prior years
27
FARM AND FOREIGN AGRICULTURAL SERVICES
Farm Loan and Grant Programs The farm credit programs are an important safety net for Americarsquos farmers by providing a source of credit when they are temporarily unable to obtain credit from commercial sources The value of this safety net was demonstrated in 2009 when in response to the growing global economic and financial crisis FSA received supplemental appropriations and Recovery Act funding to bring the total funding for the farm credit programs in that year to $45 billion In 2010 in order to meet the growing demands in the farm credit programs total funding increased to $51 billion The 2011 budget supports funding for over $47 billion in direct and guaranteed loans The Administration expects that financial and economic conditions will improve and that commercial lending in rural areas will begin returning to prior levels Therefore a modest decline in the demand for direct and guaranteed loans is assumed
A portion of both direct and guaranteed farm operating and ownership loan funds is targeted to socially disadvantaged borrowers based on county level demographic data Although the statutory targets vary by loan program and county on average about 14 percent of loan funds are targeted to socially disadvantaged borrowers These targeted funds serve over 17 percent of the disadvantaged groups noted below Therefore a key performance measure for the farm credit programs is the percentage of beginning farmers racial and ethnic minority farmers and women farmers financed by FSA The target for 2011 will be to further increase the proportion of these borrowers that are served by FSA credit programs
Key Performance Measure 2006 2007 2008 2009 2010 2011 Percentage of beginning farmers racial and ethnic minority farmers and women farmers financed by FSA (Percent) 155 159 162 174 175 180
The 2011 budget proposes loan levels that are generally reflective of the ongoing financial crisis however some modest reductions are proposed in light of the expected recovery of the US and global economies For farm operating loans the 2011 budget provides $900 million for direct loans and over $16 billion for guaranteed loans These loan levels will serve an estimated 22500 farmers about 15000 of whom will receive direct loans and 7500 of whom will receive guarantees The availability of farm operating loans provides farmers with short term credit to finance the costs of continuing or improving their farming operations such as purchasing seed fertilizer livestock feed equipment and other supplies For farm ownership loans the 2011 budget provides $475 million in direct loans and $15 billion for guaranteed loans The 2011 levels will provide about 7100 people with the opportunity to either acquire their own farm or keep an existing one About 2800 borrowers will receive direct loans and 4300 will receive guaranteed loans
The 2011 budget assumes $56 million in loan level will be available for emergency loans due to carryover from prior years The 2011 budget assumes the demand for Indian land acquisition loans will be lower as a result of the new Indian Fractionated Land loans program Program level funding for the boll weevil eradication loan program is reduced to $60 million compared to $100 million in 2010 Eradication efforts have successfully eliminated the boll weevil from many cotton producing areas and as a result it is anticipated that demand for boll weevil eradication loans will decline
28
FARM AND FOREIGN AGRICULTURAL SERVICES
Funding for State mediation grants is maintained at $4 million These grants are made to States to help support certified programs that provide alternative dispute resolution on a wide variety of agricultural issues Mediation benefits family farmers including many low-income and socially disadvantaged farmers who because of mediation are often able to resolve credit and other issues and remain on the farm
Commodity Credit Corporation Budget Authority
(Dollars in Millions) 2009 2010 2011
Program Enacted Estimate Budget Mandatory Commodity Credit Corporation Fundhelliphelliphelliphelliphelliphelliphelliphelliphelliphelliphelliphellip $12111 $10859 $10522 Tobacco Trust Fundhelliphelliphelliphelliphelliphelliphelliphelliphelliphelliphelliphelliphelliphelliphelliphelliphelliphelliphellip 950 960 960
Total Mandatory Programshelliphelliphelliphelliphelliphelliphelliphelliphelliphelliphelliphelliphelliphelliphellip 13061 11819 11482 Total Commodity Credit Corporationhelliphelliphelliphelliphelliphelliphelliphelliphelliphelliphellip $13061 $11819 $11482
Commodity Credit Corporation The Commodity Credit Corporation (CCC) provides funding for commodity programs administered by FSA and many Farm Bill programs such as the conservation programs administered by FSA and the Natural Resources Conservation Service (NRCS) and export programs administered by FAS CCC borrows funds needed to finance these programs from the US Treasury and repays the borrowings with interest from receipts and from appropriations provided by Congress The commodity programs are critical components of the farm safety net serving to expand domestic market opportunities and provide risk management and financial tools to farmers and ranchers The CCC also handles the Tobacco Trust Fund which provides transition payments to former producers and owners of quotas under the former tobacco price support and quota program
29
FARM AND FOREIGN AGRICULTURAL SERVICES
Commodity Credit Corporation Net Outlays
(Dollars in Millions) 2009 2010 2011
Program Enacted Estimate Budget Commodity Programs Marketing Assistance Loans and Price Supporthelliphelliphelliphelliphelliphelliphellip $3499 $2278 $127 Direct Paymentshelliphelliphelliphelliphelliphelliphelliphelliphelliphelliphelliphelliphelliphelliphelliphelliphelliphelliphellip 5222 5144 4963
ACREhelliphelliphelliphelliphelliphelliphelliphelliphelliphelliphelliphelliphelliphelliphelliphelliphelliphelliphelliphelliphelliphelliphellip 0 0 734 Countercyclical Paymentshelliphelliphelliphelliphelliphelliphelliphelliphelliphelliphelliphelliphelliphelliphellip 731 1079 749 Loan Deficiency Paymentshelliphelliphelliphelliphelliphelliphelliphelliphelliphelliphelliphelliphelliphelliphellip 145 183 24 Milk Income Loss Contract Paymentshelliphelliphelliphelliphelliphelliphelliphelliphelliphelliphellip 757 225 100 Cotton User Marketing Payments and Cotton Economic Adjustment Assistance Paymentshelliphelliphelliphelliphellip 85 74 82 Noninsured Crop Disaster Assistance Programhelliphelliphelliphelliphelliphelliphellip 62 122 124 Tobacco Payments to Producers ahelliphelliphelliphelliphelliphelliphelliphelliphelliphelliphelliphellip 953 960 960 Biomass Crop Assistance Programhelliphelliphelliphelliphelliphelliphelliphelliphelliphelliphelliphellip 2 263 479 Farm Storage Facility Loanshelliphelliphelliphelliphelliphelliphelliphelliphelliphelliphelliphelliphelliphellip 14 10 4 Purchases and Saleshelliphelliphelliphelliphelliphelliphelliphelliphelliphelliphelliphelliphelliphelliphelliphelliphelliphellip -1730 -1703 -97 Processing Storage and Transportationhelliphelliphelliphelliphelliphelliphelliphelliphelliphellip 20 32 6 Operating Expenseshelliphelliphelliphelliphelliphelliphelliphelliphelliphelliphelliphelliphelliphelliphelliphelliphelliphellip 40 14 6 Interest Expenditureshelliphelliphelliphelliphelliphelliphelliphelliphelliphelliphelliphelliphelliphelliphelliphelliphellip -17 -2 42 Change in Working Capitalhelliphelliphelliphelliphelliphelliphelliphelliphelliphelliphelliphelliphelliphelliphellip -806 250 250
Otherhelliphelliphelliphelliphelliphelliphelliphelliphelliphelliphelliphelliphelliphelliphelliphelliphelliphelliphelliphelliphelliphelliphellip -42 449 437 Total Commodity Programs Baselinehelliphelliphelliphelliphelliphelliphelliphelliphelliphellip 8935 9378 8990 Conservation Programs Conservation Reserve Programhelliphelliphelliphelliphelliphelliphelliphelliphelliphelliphelliphelliphellip 1916 1973 1958 Emergency Forestry Conservation Reserve Programhelliphelliphelliphelliphelliphelliphelliphelliphelliphelliphelliphelliphelliphelliphelliphelliphelliphellip 10 19 14 Voluntary Public Access and Incentives Programhelliphelliphelliphelliphelliphelliphelliphelliphelliphelliphelliphelliphelliphelliphelliphelliphellip 0 17 17 Total Conservation Programshelliphelliphelliphelliphelliphelliphelliphelliphelliphelliphelliphelliphellip 1926 2009 1989 Export Programs Quality Samples Programhelliphelliphelliphelliphelliphelliphelliphelliphelliphelliphelliphelliphelliphelliphellip 1 2 2 Market Access Program (MAP)helliphelliphelliphelliphelliphelliphelliphelliphelliphelliphelliphellip 219 194 200 Foreign Market Development (Cooperator) Programhelliphelliphelliphelliphellip 36 34 35 Technical Assistance for Specialty Crops Programhelliphelliphelliphelliphellip 2 5 8 Emerging Markets Programhelliphelliphelliphelliphelliphelliphelliphelliphelliphelliphelliphelliphelliphelliphellip 3 8 8 Dairy Export Incentive Programhelliphelliphelliphelliphelliphelliphelliphelliphelliphelliphelliphelliphellip 1 25 3
30
FARM AND FOREIGN AGRICULTURAL SERVICES
Commodity Credit Corporation Net Outlays
(Dollars in Millions) 2009 2010 2011
Program Enacted Estimate Budget Food for Progress Programhelliphelliphelliphelliphelliphelliphelliphelliphelliphelliphelliphelliphelliphelliphellip 226 148 148 Local and Regional Commodity Procurement Pilot Programhelliphellip 0 15 25 Export Credithelliphelliphelliphelliphelliphelliphelliphelliphelliphelliphelliphelliphelliphelliphelliphelliphelliphelliphelliphellip 80 83 23
Otherhelliphelliphelliphelliphelliphelliphelliphelliphelliphelliphelliphelliphelliphelliphelliphelliphelliphelliphelliphelliphelliphellip 17 30 23 Total Export Programshelliphelliphelliphelliphelliphelliphelliphelliphelliphelliphelliphelliphelliphelliphellip 585 544 475 Subtotal CCChelliphelliphelliphelliphelliphelliphelliphelliphelliphelliphelliphelliphelliphelliphelliphelliphelliphelliphellip 11446 11931 11454 Pre-credit Reform Loan Repaymentshelliphelliphelliphelliphelliphelliphelliphelliphelliphelliphellip -4 -4 -8 CCC Baselinehelliphelliphelliphelliphelliphelliphelliphelliphelliphelliphelliphelliphelliphelliphelliphelliphelliphelliphelliphelliphellip 11442 11927 11446 Proposed Legislation
Reduce MAP by 20helliphelliphelliphelliphelliphelliphelliphelliphelliphelliphelliphelliphelliphelliphelliphellip 0 0 -8 Farm Programs Savingshelliphelliphelliphelliphelliphelliphelliphelliphelliphelliphelliphelliphelliphelliphelliphellip 0 0 -3
Total CCChelliphelliphelliphelliphelliphelliphelliphelliphelliphelliphelliphelliphelliphelliphelliphelliphelliphelliphelliphellip $11442 $11927 $11435
a CCC payments are offset by receipts from the Tobacco Trust Fund
Changes over the last decade in commodity disaster and conservation programs due to policy weather and market conditions have dramatically changed the level mix and variability of CCC outlays CCC net outlays have declined from a record high of $323 billion in 2000 to to $114 billion in 2008 reflecting higher prices for most commodities resulting from increased demand for bioenergy production and strong export demand Outlays in 2009 which included the impact of 2008 Farm Bill provisions were $114 billion They reflected reduced disaster payments offset by greater outlays for dairy support programs and for the cotton program both of which are affected by lower market prices and initiatives to enhance dairy price supports Estimated outlays for 2010 rose to $119 billion partly as a result of the newly implemented Biomass Crop Assistance Program (BCAP) The 2011 estimate declines to $114 billion as higher prices are expected to reduce cotton program outlays from marketing assistance loans The 2008 Farm Bill also ended the use of commodity certificate transactions for marketing assistance loan repayments The impact is reflected in the reduction in CCC sales and purchases in 2011 as producers could no longer purchase certificates for use in loan repayments
Commodity Programs Commodity loan and income support programs constitute the majority of CCC outlays These programs provide a major portion of the farm safety net including protection against adverse market fluctuations hence outlays for many of these programs vary significantly from year to year as market conditions change The commodity programs are mandated by provisions of the 2008 Farm Bill The programs include direct payments to producers of feed grains wheat upland cotton rice soybeans other oilseeds and peanuts The direct payments based on historical program acreage and yields are set by law and do not vary with market prices or current plantings The 2008 Farm Bill also provided counter-cyclical payments for producers of the above crops when market prices decline below specified target prices In addition the 2008 Farm Bill authorized revenue-based counter-cyclical payments (ACRE) as an alternative to the traditional price-based counter-cyclical payments Sign-up for
31
FARM AND FOREIGN AGRICULTURAL SERVICES
the new ACRE program began April 27 2009 and continued to August 14 2009 to give producers ample time to decide whether to participate in ACRE or remain in the traditional direct and counter-cyclical payment program About 17 million farms are enrolled in the direct and counter-cyclical payment programs The 2011 budget proposes modest reductions in the current cap on direct payments and a three year phased reduction in farm program average Adjusted Gross Income (AGI) eligibility limits for large farmers and wealthy landowners These adjustments in current program limits would affect only a very small portion of the farm program participants without disturbing the foundation of the current safety net for productive family farmers In addition the budget proposes elimination of commodity storage payments in the marketing assistance loan program for cotton and peanuts The Department is prepared to work with Congress and stakeholders as these proposals are being considered
The CCC marketing assistance loan (MAL) program is available to producers of commodities eligible for direct and counter-cyclical payments as well as for wool mohair honey and pulses CCC marketing assistance loans provide interim financing to eligible producers allowing them to delay selling their crop at harvest when prices are typically at their lowest When market prices decline these loans may be repaid at rates below the loan rate thus providing benefits which help offset the effect of lower market returns
32
FARM AND FOREIGN AGRICULTURAL SERVICES
Commodity Credit Corporation Commodity Program Net Outlays
(Dollars in Millions) 2009 2010 2011
Program Enacted Estimate Budget Commodity Feed Grainshelliphelliphelliphelliphelliphelliphelliphelliphelliphelliphelliphelliphelliphelliphelliphelliphelliphelliphelliphellip $2458 $2451 $2645 Wheathelliphelliphelliphelliphelliphelliphelliphelliphelliphelliphelliphelliphelliphelliphelliphelliphelliphelliphelliphelliphelliphellip 1224 1299 1425 Ricehelliphelliphelliphelliphelliphelliphelliphelliphelliphelliphelliphelliphelliphelliphelliphelliphelliphelliphelliphelliphelliphelliphellip 411 558 429 Upland and Extra Long Staple Cottonhelliphelliphelliphelliphelliphelliphelliphelliphellip 2213 2387 1552 Tobacco ahelliphelliphelliphelliphelliphelliphelliphelliphelliphelliphelliphelliphelliphelliphelliphelliphelliphelliphelliphellip -172 0 0 Dairyhelliphelliphelliphelliphelliphelliphelliphelliphelliphelliphelliphelliphelliphelliphelliphelliphelliphelliphelliphelliphelliphellip 994 343 362 Soybeans and Productshelliphelliphelliphelliphelliphelliphelliphelliphelliphelliphelliphelliphelliphelliphellip 611 585 624 Minor Oilseedshelliphelliphelliphelliphelliphelliphelliphelliphelliphelliphelliphelliphelliphelliphelliphelliphelliphellip 23 22 25 Peanutshelliphelliphelliphelliphelliphelliphelliphelliphelliphelliphelliphelliphelliphelliphelliphelliphelliphelliphelliphelliphellip 98 90 132 Sugarhelliphelliphelliphelliphelliphelliphelliphelliphelliphelliphelliphelliphelliphelliphelliphelliphelliphelliphelliphelliphelliphellip b 0 0 Honeyhelliphelliphelliphelliphelliphelliphelliphelliphelliphelliphelliphelliphelliphelliphelliphelliphelliphelliphelliphelliphelliphellip -1 b b Wool and Mohairhelliphelliphelliphelliphelliphelliphelliphelliphelliphelliphelliphelliphelliphelliphelliphelliphellip 9 7 7 Vegetable Oil Productshelliphelliphelliphelliphelliphelliphelliphelliphelliphelliphelliphelliphelliphelliphellip 28 49 30 Other Commoditieshelliphelliphelliphelliphelliphelliphelliphelliphelliphelliphelliphelliphelliphelliphelliphelliphellip 57 -8 5
Subtotal Assistance To Farmershelliphelliphelliphelliphelliphelliphelliphelliphelliphellip 7953 7783 7236 Other chelliphelliphelliphelliphelliphelliphelliphelliphelliphelliphelliphelliphelliphelliphelliphelliphelliphelliphelliphelliphellip 982 1596 1754 Commodity Programs Baselinehelliphelliphelliphelliphelliphelliphelliphelliphelliphelliphelliphellip 8936 9379 8990 Proposed Legislation - Farm Programs Savingshelliphelliphelliphelliphelliphellip 0 0 -3 Total Commodity Programshelliphelliphelliphelliphelliphelliphelliphelliphelliphelliphelliphellip $8936 $9379 $8987
a Reflects impact of offsetting receipts from Tobacco Trust Fund b Less than $05 million c Includes working capital interest operating expenses reimbursable agreements and an adjustment for Food for Progress commodity purchases
33
FARM AND FOREIGN AGRICULTURAL SERVICES
Commodity Credit Corporation Conservation Programs
Budget Authority (Dollars in Millions)
2009 2010 2011 Program Enacted Estimate Budget
Conservation Reserve Programhelliphelliphelliphelliphelliphelliphelliphelliphelliphelliphelliphellip $1934 $1973 $1958 Emergency Forestry Conservation Reserve Programhelliphelliphellip 10 19 14 Voluntary Public Access and Habitat Incentives Programhellip 0 17 17
Total Conservation Programshelliphelliphelliphelliphelliphelliphelliphelliphelliphelliphellip $1944 $2009 $1989
Conservation Programs The Farm Bill also provides authority for conservation programs The focus of USDA conservation programs administered by NRCS and FSA is to assist producers in using environmentally sound management systems for agricultural production to meet food and fiber needs of the Nation FSA administers the Conservation Reserve Program (CRP) and the Emergency Forestry Conservation Reserve Program (EFCRP) which are CCC programs in addition to the Emergency Conservation Program (ECP) All other USDA cost-share and easement conservation programs such as the Environment al Quality Incentives Program Wetlands Reserve Program and the Conservation Stewardship Program are administered by NRCS These programs are described beginning on page 85
The purpose of CRP is to assist farm owners and operators in conserving and improving soil water air and wildlife resources b y retirin g environmentally se sitive landn from a gricultural production and keeping it under long-term resource-conserving cover CRP participants enroll acreage for periods of 10 to 15 years in return for annual rental payments along with cost-share and technical assistance for installing approved conservation practices
Among multiple environmental benefits a key performance measure for the CRP program is the number of restored wetland acres Restored wetland acreage serves as a filter barrier reducing sediments and agricultural run-off from reaching drinking water supplies
Key Performance Measure 2006 2007 2008 20091 20102 20112
CRP restored wetland acreage (million acres) 203 208 198 204 199 199
1 The 2009 increase in CRP Wetland acres enrollment was due to increased incentives for certain wetland practices and surge in general signup acres reenrolled into wetland practices 2 Recent commodity price increases especially soybeans will likely reduce landowner willingness to retire cropland into CRP In addition the enrollment authority for CRP decreased to 32 million acres starting in FY 2010
Acreage that counts toward CRPrsquos total enrollment cap includes acres enrolled through scheduled general signups and those enrolled through a continuous non-competitive signup that has been underway since September 1996 with the purpose of enrolling land in filter strips riparian buffers and other high priority conservation and environmental enhancement practices Continuous signup acreage also includes enrollment under the Conservation Reserve
34
FARM AND FOREIGN AGRICULTURAL SERVICES
Enhancement Program (CREP) that is designed to target program benefits to address specific local and regional conservation problems At this time 32 States have approved CREP agreements
CRP enrollment totaled 338 million acres at the end of 2009 with over 85 percent of the acreage having been enrolled under scheduled general signups A general signup of 10 million acres was held in 2006 however no general signup has been held since then The budget projects that total enrolled acreage may decrease to 314 million acres by the end of FY 2010 The budget assumes a potential general signup in 2010 could add up to 29 million general signup acres allowing a cumulative enrollment of 302 million CRP acres by the end of 2011 CRP is limited to a maximum of 32 million acres by the 2008 Farm Bill
Under ECP the Department shares the cost of carrying out practices to assist and encourage farmers to rehabilitate farmland damaged by natural disasters In particular it addresses those problems which represent damage that is unusual and would not recur frequently in the same area and if left untreated would (1) impair or endanger the land (2) materially affect the productive capacity of the land (3) be so costly to rehabilitate that Federal assistance would be required to return the land to productive agricultural use For the past several years this program has been funded through emergency supplemental appropriations The budget is proposing no new funding for the ECP in 2011 since funding needs are difficult to predict in advance
Biomass Crop Assistance Program (BCAP) In 2009 the first phase of the BCAP as mandated by the 2008 Farm Bill was implemented This provision provides matching payments for the collection harvest storage and transportation of biomass material to approved energy conversion facilities Beginning in 2010 the program will provide financial assistance for the establishment and maintenance of crops for bioenergy production once regulations are completed The program will then continue into 2011 and beyond
Supplemental Agricultural Disaster Assistance
Outlays
(Dollars in Millions) 2009 2010 2011
Program Enacted Estimate Budget Supplemental Revenue Assistance Payments 0 $945 $865 Livestock Indemnity Paymentshelliphelliphelliphelliphelliphelliphelliphelliphelliphelliphelliphelliphelliphelliphelliphelliphelliphelliphellip $3 69 69 Livestock Forage Disaster Program 0 409 409 Emergency Assistance for Livestock Honey Bees and Farm-Raised Fishhelliphellip 0 100 50 Tree Assistance Program helliphelliphelliphelliphelliphelliphelliphelliphelliphelliphelliphelliphelliphelliphelliphelliphelliphelliphelliphelliphellip 0 5 5
Subtotal Supplemental Agricultural Disaster Assistance helliphelliphelliphelliphelliphellip 3 1528 1398 Recovery Act SURE Paymentshelliphelliphelliphelliphelliphelliphelliphelliphelliphelliphelliphelliphelliphelliphelliphelliphellip 0 207 23
Total Supplemental Agricultural Disaster Assistance helliphelliphelliphelliphelliphelliphelliphellip $3 $1735 $1421
35
FARM AND FOREIGN AGRICULTURAL SERVICES
Supplemental Agricultural Disaster Assistance The 2008 Farm Bill authorized five new disaster assistance programs FSA administers the five new disaster programs however unlike prior ad hoc disaster programs the new disaster assistance programs are funded through the Agricultural Disaster Relief Trust Fund (Trust Fund) rather than through CCC The Trust Fund receives funding equivalent to 308 percent of the amounts received under the Harmonized Tariff Schedule of the United States Actual assistance levels will depend on the extent of producersrsquo qualifying needs
The Supplemental Revenue Assistance Payments Program (SURE) provides assistance to eligible crop producers on farms in primary and contiguous disaster counties designated by the Secretary of Agriculture or in other counties in which weather-related losses exceeded 50 percent of the normal production for that year The Livestock Indemnity Program (LIP) provides assistance to eligible livestock producers on farms that have incurred livestock death losses in excess of normal mortality rates due to adverse weather during the calendar year The Livestock Forage Program (LFP) provides assistance to eligible livestock producers for grazing losses for covered livestock due to drought conditions or fire The Emergency Livestock Assistance Program (ELAP) provides assistance to eligible producers of livestock (inc luding horses) honey bees and farm-raised fish for losses not covered under the other disaster programs The Tree Assistance Program (TAP) provides assistance to eligible orchardists and nursery tree growers that planted trees for commercial sale (including Christmas trees) for losses resulting from a natural disaster The Recovery Act provided an estimated $230 million of additional disaster assistance through the above programs for producers who suffered losses in crop year 2008 but had not yet paid the crop insurance related fees necessary to become eligible
Dairy and Other Appropriated Assistance The 2010 Appropriations Act included $350 million for additional assistance for dairy producers A total of $290 million was provided for payments to dairy producers and $60 million for purchases of dairy products for distribution to the needy Other additional assistance in 2010 provided by the Appropriations Act includes support for a durum wheat quality program and support for geographically disadvantaged producers No funds are requested for these activities in the 2011 Budget
In addition the Recovery Act provided $50 million for Aquaculture Grants which are intended to compensate aquaculture growers for high feed costs during the 2008 fiscal year The grants were administered as block grants to the States which in turn provide the assistance to eligible growers Under the provisions of the Recovery Act producers who receive assistance under the Aquaculture Grants program will be unable to receive assistance under ELAP for the same losses
36
FARM AND FOREIGN AGRICULTURAL SERVICES
Farm Service Agency Staff Years
2009 2010 2011 Program Enacted Estimate Budget
helliphelliphelliphelliphelliphelliphelliphelliphelliphelliphelliphelliphelliphelliphelliphelliphelliphelliphelliphelliphelliphellipFederal 5042 5094 5104 Non-Federal Permanent Full-Timehelliphelliphelliphelliphelliphelliphelliphelliphelliphelliphelliphelliphelliphelliphelliphellip 8673 8775 8775 Temporaryhelliphelliphelliphelliphelliphelliphelliphelliphelliphelliphelliphelliphelliphelliphelliphelliphelliphelliphelliphellip 745 650 650
Total Non-Federalhelliphelliphelliphelliphelliphelliphelliphelliphelliphelliphelliphelliphelliphelliphelliphellip 9418 9425 9425 Total FSA Staff Yearshelliphelliphelliphelliphelliphelliphelliphelliphelliphelliphelliphelliphelliphellip 14460 14519 14529
Salaries and Expenses The 2011 budget proposes a level of $1686 billion to support 5104 Federal staff years and 9425 non-Federal staff years Total estimated staff years will be increased by 10 over the 2010 level to provide for increased IT modernization project management The budget includes funding to support ongoing operational needs based on current programs and the current delivery system
Information Technology (IT) Modernization and Stabilization The Farm Service Agency relies on one of the oldest information technology systems (hardware and software) within the Department of Agriculture Billions of dollars of annual farm program payments conservation payments and loans to producers mandated b y the 2008 Farm Bill and other legislation are dependent upon the continued viability of this antiquated IT system FSA must upgrade the aging technology infrastructure and equipment which is creating inefficiencies and threatening the delivery of fundamental services to producers
At the present time producers looking to sign up for programs are often confronted by lines long delays and inefficiencies County office personnel are often required to use two computers on different operating systems to sign a producer up for a single program These two computers one relying on the outdated legacy system and one relying on a modern web-based system are unable to communicate with each other forcing the county office personnel to enter data into multiple systems or manually transfer data maintained in one system to the other This causes sign-up delays and significantly increases the likelihood of data entry errors that can lead to improper payments
Further the outmoded IT systems of the Farm Service Agency are highly vulnerable to security breaches because inadequate data storage capacity requires sensitive producer data and financial information to be uploaded into mainframe computers from physical media sent from county offices across the country rather than electronically An independent review conducted pursuant to Section 1618 of the 2008 Farm Bill also concluded that ldquoModernization will bring significant benefits such as improvements in cost efficiency producer access fraud mitigation staff efficiency and morale More fundamentally Modernization will replace the aging platforms that are difficult to maintain and incapable of supporting the fiduciary requirements that FSA faces today and will continue to face in the futurerdquo
37
FARM AND FOREIGN AGRICULTURAL SERVICES
The 2011 Budget proposes an increase of $953 million to fund critical IT replacement and modernization projects to support core FSA operations Of this amount $393 million is proposed for continued implementation of the MIDAS initiative (Modernize and Innovate the Delivery of Agricultural Systems) which is a comprehensive project to streamline the existing complicated business processes that support mandated farm programs and provide a modern IT infrastructure to operate the programs The 2011 proposal builds on funding included in the FY 2010 appropriation to continue this multi-year effort Development of MIDAS is an extensive effort which will result in a secure modern IT system capable of supporting web-based program delivery The system will also provide linkages with the Departmentrsquos new financial management system The proposed 2011 funding includes $1 million for increased staffing to ensure appropriate contract oversight and management of this complex project
A second component of the IT proposal is a $20 million increase needed for conversion of FSA software to shift program applications from the current obsolete system to the new IT system Existing program software that is essential to delivery of FSA rsquos core programs is written for the outmoded mainframe IT system and needs to be converted for use with modern web-based systems Funds will support this conversion of program delivery applications for use with the new system
Further the budget proposes a $36 million increase in FSA to support the Departmentrsquos efforts to modernize and upgrade the Common Computing Environment (CCE) for the Service Center Agencies (SCAs) This funding will be used to replace outdated components of the IT infrastructure many of which have exceeded their expected life cycles in order to reduce system vulnerabilities to failure and improve the performance and effectiveness of the shared infrastructure These improvements will allow the SCAs to better serve program participants with a more flexible and reliable IT infrastructure This funding will allow for the first system-wide refresh of the CCE since the infrastructure was implemented in 2000 In addition as the components of the CCE are replaced USDA will implement a right-sizing process whereby configuration changes will be made to better support the delivery of current and future programs As part of this process the Department will strive to improve system security reduce the long term cost of infrastructure services and improve service reliability
A key performance measure for Modernization efforts is the percentage of program benefits delivered directly by the county office using web-enabled technologies and not utilizing outmoded legacy systems This will enable more timely more accurate and reliable delivery of benefits to producers as the newer technologies are phased in
Key Performance Measure 2006 2007 2008 2009 2010 2011 Maintain or increase percentage of program benefits delivered through a Web environment (percent) 33 33 33 33 50 70
38
FARM AND FOREIGN AGRICULTURAL SERVICES
RISK MANAGEMENT AGENCY (RMA)
Program Level (Dollars in Millions)
2009 2010 2011 Program Enacted Estimate Budget
SUMMARY OF GOVERNMENT COSTS Discretionary Administrative and Operating Expenseshelliphelliphelliphelliphelliphelliphelliphelliphellip $77 $80 $83 Mandatory Delivery and Other Administrative Expenses ahelliphelliphelliphelliphellip 1654 1642 1770 Gross Indemnities bhelliphelliphelliphelliphelliphelliphelliphelliphelliphelliphelliphelliphelliphelliphelliphellip 8416 7669 8249 Underwriting Gains c helliphelliphelliphelliphelliphelliphelliphelliphelliphelliphelliphelliphelliphelliphellip 1963 1168 1202 Farm Bill Agricultural Management Assistancehelliphelliphelliphelliphellip (6) (6) (6)
Subtotal Crop Insurance Program Levelhelliphelliphelliphelliphelliphelliphellip 12033 10479 11221 Less Producer Premium and Administration Feeshelliphellip -4211 -3577 -3606
Total Government Costshelliphelliphelliphelliphelliphelliphelliphelliphelliphelliphelliphelliphellip $7899 $6982 $7698
a Includes reimbursements to private companies and certain costs for research development and other activities b The amount of premium subsidy paid by the Federal government is not reflected in the table above The budget for the Federal Crop Insurance Program assumes a crop year loss ratio (gross indemnititestotal premium) of 10 However the fiscal year loss ratio could be higher or lower than 10 due to differences in the timeing of cash flows and participation rates from year to year Nevertheless the amount of premium subsidy may be approximated in the table above by subtracting producer premium and administrative fees from gross indemnities c Payments to private insurance companies
Discretionary funds for the Federal Crop Insurance Program cover Federal salaries and related expenses to manage the program The 2011 budget includes about $83 million for these costs compared to about $80 million for 2010 The increase includes $07 million for pay costs to maintain current staffing levels and $20 million for increasing costs necessary to maintain the existing IT infrastructure
The Federal Crop Insurance Program provides an important safety net that protects producers from a wide range of risks caused by natural disasters as well as the risk of price fluctuations In recent years an increasing proportion of risk protection has been provided by revenue insurance which protects against both a loss of yield and price declines The Federal Crop Insurance Program is a critical component of the farm safety net
A key performance measure for the Federal Crop Insurance Program is the total value of crops protected or total liabilities The following table presents both actual liabilities and normalized liabilities which account for the effects of changes in commodity prices Commodity prices are a key external factor which can significantly affect performance measurements for the crop insurance program
39
Key Performance Measures 2006 2007 2008 2009 2010 2011 Value of FCIC risk protection coverage provided through FCIC sponsored insurance ($Billions) $499 $673 $899 $904 $814 $839 Normalized value of FCIC risk protection coverage provided through FCIC sponsored insurance ($Billions) $481 $507 $515 $514 $519 $524
FARM AND FOREIGN AGRICULTURAL SERVICES
For the 2010 crop year the Federal Crop Insurance Program is expected to provide about $814 billion in risk protection on about 286 million acres This represents about 80 percent of the Nationrsquos acres planted to principal crops In 2009 about 70 percent of the liabilities were covered under revenue products which provide protection against both a loss of yield and a decline in commodity prices
Participation in the Federal Crop Insurance Program by producers is voluntary however participation is encouraged through premium subsidies In addition participation in the Federal Crop Insurance Program is required in order to participate in the supplemental agricultural disaster assistance programs authorized in the 2008 Farm Bill Crop insurance is delivered to producers through private insurance companies that share in the risk of loss and opportunity for gain The companies are reimbursed for their delivery expenses and receive underwriting gains in years of favorable loss experience The costs associated with the Federal Crop Insurance Program include premium subsidies indemnity payments (in excess of premiums) underwriting gains paid to private companies reimbursements to private companies for delivery expenses and other authorized expenditures
The Standard Reinsurance Agreement (SRA) is the contract between USDA and the private insurance companies which contains many of the financial terms and conditions for participation in the Federal Crop Insurance Program The 2008 Farm Bill authorized USDA to renegotiate the SRA for the 2011 crop year and every 5 years thereafter In December 2009 USDA announced that it was cancelling the current SRA and would renegotiate the agreement with the companies for the 2011 crop year USDA expects to complete the negotiation process by July 1 2010 the start of the 2011 crop year Through the renegotiation process USDA intends to align administrative and operating subsidies paid to insurance companies closer to actual delivery costs provide a reasonable rate of return to the insurance companies equalize reinsurance performance across States to more effectively reach under-served producers commodities and areas and improve program integrity
In preparation for these negotiations RMA contracted with an internationally known company Milliman Inc to review historical rates of return and determine what a reasonable rate of return is for the crop insurance industry RMA data shows that annual insurance industry payments have doubled from $18 billion in 2006 to an estimated $38 billion in 2009 based on the terms of the existing SRA Meanwhile the number of total policies dropped slightly from 13 million in 2000 to 11 million in 2008 The changes being proposed will help protect farmers from higher costs improve access to crop insurance and provide greater protection from crop losses The new agreement will also provide insurance companies with greater flexibility for their operations
40
FARM AND FOREIGN AGRICULTURAL SERVICES
and financial incentives to increase service to underserved producers and areas while ensuring that taxpayers are well-served by the program USDA expects to have in place a stronger Federal Crop Insurance Program that helps producers better manage their risk and that serves farmers in every region of the country and to complete the negotiation process by July 1 2010 the start of the 2011 crop year
The performance for the Federal Crop Insurance Program is tracked on a crop year basis which spans multiple fiscal years As a result the table on page 39 reflects certain assumptions about the fiscal year in which the crop year costs andor revenues will fall Furthermore the amount of liabilities covered by the Federal Crop Insurance Program is strongly influenced by changing commodity prices
Actual indemnities for fiscal year 2009 reflect crop year 2008 losses which were paid out in fiscal year 2009 plus crop year 2009 losses which were paid out in fiscal year 2009 The relatively low actual indemnities for fiscal year 2009 reflect the low loss ratios experienced in the 2008 and 2009 The actual loss ratio for crop year 2008 was a low 088 Losses for crop year 2009 are not yet finalized however the statutory target used for budgetary purposes is 10
Estimated indemnities for fiscal year 2010 reflect about 65 percent of the estimated losses for crop year 2009 plus 35 percent of the estimated losses for crop year 2010 Losses for crop years 2010 and 2011 reflect an estimated loss ratio of 10 Estimated indemnities for fiscal year 2011 are calculated in the same manner as 2010
There is a one year lag between crop year underwriting gains and the fiscal year in which they are paid out Consequently the underwriting gains for fiscal year 2009 reflect the low loss ratio experienced for crop year 2008 The underwriting gain totals for fiscal years 2010 and 2011 reflects the assumption that the loss ratio in crop years 2009 and 2010 will be 10
In fiscal year 2009 the actual total Government cost for the Federal Crop Insurance Program was about $79 billion Of this amount about $42 billion was for net indemnities to producers (gross indemnities minus producer paid premiums) The remaining amount of about $36 billion was for payments to the private insurance companies to deliver the program
41
FARM AND FOREIGN AGRICULTURAL SERVICES
FOREIGN AGRICULTURAL SERVICE (FAS)
FAS administers a variety of programs that are designed to facilitate access to international markets and thereby help to support a competitive US agricultural system FAS also carries out activities that promote productive agricultural systems in developing countries and contribute to increased trade and enhanced global food security Working bilaterally and with international organizations FAS encourages the development of transparent and science-based regulatory systems that allow for the safe development and use of agricultural goods derived from new technologies
National Export Initiative
120
100 $97
FAS Export Promotion Activities
80
FMDP - Foreign Market Development Program -- Discretionary Funding 2011
TASC - Technical Assistance for 60 Specialty Crops Program -- Discretionary
Funding 2011
FMDP - Foreign Market Development Program -- Mandatory CCC Funding $41 $42
40 TASC - Technical Assistance for Specialty Crops Program -- Mandatory CCC Funding
20
0 7 8 9
34 34 34
9
35
10
2009 2010 2011
Fiscal Year
$ M
illio
ns
42
FARM AND FOREIGN AGRICULTURAL SERVICES
Foreign Agricultural Service Budget Authority
(Dollars in Millions) 2009 2010 2011
Program Enacted Estimate Budget Discretionary FAS Salaries and Expenses Salaries and Expenses (Direct Appropriation)helliphelliphelliphelliphelliphelliphelliphellip $165 $180 $201 Agricultural Reconstruction and Stabilization helliphelliphelliphelliphelliphelliphellip 0 0 15 Foreign Market Development (Cooperator) Programhelliphelliphelliphellip 0 0 35 Technical Assistance for Specialty Crops Programhelliphelliphelliphelliphellip 0 0 9 Transfer from CCC Export Credit Program Accounthelliphelliphelliphelliphellip (5) (6) (7) Total FAS Salaries and Expenseshelliphelliphelliphelliphelliphelliphelliphelliphelliphelliphelliphellip (170) (187) (265) Foreign Food Assistance McGovern-Dole International Food for Education Programhelliphellip 100 210 210
PL 480 Title II Donationshelliphelliphelliphelliphelliphelliphelliphelliphelliphelliphelliphelliphelliphelliphellip 1226 1690 1690 PL 480 Title II Supplemental Fundinghelliphelliphelliphelliphelliphelliphelliphelliphellip 1095 0 0
Total PL 480 Title II Donationshelliphelliphelliphelliphelliphelliphelliphelliphelliphelliphellip 2321 1690 1690 PL 480 Title I Program Account
Transfer to Farm Service Agency Salaries and Expenseshelliphelliphellip 3 3 3 Commodity Credit Corporation Export Credit Program Account Transfer to FSA and FAS Salaries and Expenseshelliphelliphelliphelliphelliphellip (5) (7) (7) Total Discretionary Programshelliphelliphelliphelliphelliphelliphelliphelliphelliphelliphelliphelliphellip 2589 2083 2161 Mandatory Quality Samples Programhelliphelliphelliphelliphelliphelliphelliphelliphelliphelliphelliphelliphelliphelliphelliphellip 2 2 2 Farm Bill Market Development Programs Foreign Market Development (Cooperator) Programhelliphelliphelliphellip 34 34 34 Technical Assistance for Specialty Crops Programhelliphelliphelliphelliphellip 7 8 9 Market Access Programhelliphelliphelliphelliphelliphelliphelliphelliphelliphelliphelliphelliphelliphelliphelliphellip 200 200 160 Emerging Markets Programhelliphelliphelliphelliphelliphelliphelliphelliphelliphelliphelliphelliphelliphellip 10 10 10 Dairy Export Incentive Programhelliphelliphelliphelliphelliphelliphelliphelliphelliphelliphelliphelliphellip 19 10 0 Foreign Food Assistance McGovern-Dole International Food for Education Programhelliphellip 84 0 0 Food for Progress - CCC Funded helliphelliphelliphelliphelliphelliphelliphelliphelliphelliphelliphellip 216 150 146 Bill Emerson Humanitarian Trusthelliphelliphelliphelliphelliphelliphelliphelliphelliphelliphelliphellip 7 a a Local and Regional Commodity Procurement Pilot Programhellip 5 25 25 Total Farm Bill Programshelliphelliphelliphelliphelliphelliphelliphelliphelliphelliphelliphelliphelliphelliphellip 582 437 384 Recovery Act Trade Adjustment Assistance for Farmershelliphelliphelliphelliphelliphelliphelliphelliphellip 25 90 22 Total Mandatory Programshelliphelliphelliphelliphelliphelliphelliphelliphelliphelliphelliphelliphelliphellip 609 529 408 Total Foreign Agricultural Servicehelliphelliphelliphelliphelliphelliphelliphelliphelliphelliphellip $3198 $2612 $2569
a Assets of the Trust can be released any time the Administrator of the US Agency for International Development determines that PL 480 Title II funding for emergency needs is inadequate to meet those needs in any fiscal year
43
FARM AND FOREIGN AGRICULTURAL SERVICES
Foreign Agricultural Service CCC Export Credit Programs
Program Level (PL) and Budget Authority (BA) (Dollars in Millions)
2009 2010 2011 Enacted Estimate Budget
Program PL BA PL BA PL BA GSM-102 Guaranteeshelliphelliphelliphelliphelliphelliphelliphelliphelliphellip $5357 $40 $5400 0 $5400 0 Facilities Financing Guaranteeshelliphelliphelliphelliphelliphellip 0 0 100 $11 100 $18 Total CCC Export Credithelliphelliphelliphelliphelliphelliphellip $5357 $40 $5500 $11 $5500 $18
CCC Export Credit Guarantee Programs The CCC export credit guarantee programs administered by FAS in conjunction with FSA provide payment guarantees for the commercial financing of US agricultural exports These programs facilitate exports to buyers in countries where credit is necessary to maintain or increase US sales
The budget includes an overall program level of $55 billion for CCC export credit guarantees in 2011 This estimate reflects the level of sales expected to be registered under the export credit guarantee programs However the actual level of programming could vary from this estimate depending upon program demand market conditions and other relevant factors during the course of the year
Of the total program level for export credit guarantees expected to be issued by CCC in 2011 $54 billion will be made available under the GSM-102 program which provides guarantees on commercial export credit extended with short-term repayment terms (up to 3 years)
The budget also includes an estimated program level of $100 million for facility financing guarantees in 2011 Under this activity CCC provides guarantees to facilitate the financing of goods and services exported from the United States to improve or establish agriculture-related facilities in emerging markets By supporting such facilities these guarantees enhance sales of US agricultural products to countries where demand is constricted due to inadequate storage processing or handling capabilities
International Federal credit programs have traditionally used government-wide assumptions about defaults and recoveries but are now encouraged to develop program specific assumptions For GSM-102 guarantees program specific recovery assumptions were incorporated into the subsidy calculation for the 2009 budget and program specific assumptions about defaults were incorporated in the 2010 budget Because actual program performance and expectations for the future differ from the government-wide assumptions used in previous years the changes to these two factors have resulted in substantially reduced subsidy rates for the program Due to a lack of historical program data government-wide assumptions continue to be used for the subsidy estimate for the facilities guarantee program
Quality Samples Program Funding for the Quality Samples Program is maintained at the 2010 level of about $25 million Under this program CCC provides funding to assist private entities
44
FARM AND FOREIGN AGRICULTURAL SERVICES
to furnish samples of US agricultural products to foreign importers in order to overcome trade and marketing obstacles The program which is carried out under the authority of the CCC Charter Act provides foreign importers with a better understanding and appreciation of the characteristics of US agricultural products
Market Development Programs FAS administers a number of programs in partnership with private sector cooperator organizations that support the development maintenance and expansion of commercial export markets for US agricultural commodities and products The 2011 budget proposes a series of adjustments in the funding levels for these programs to reflect the changing nature of agricultural trade competition
The budget increases funding for the Foreign Market Development (Cooperator) Program to $69 million in 2011 This includes $345 million to be provided by CCC consistent with provisions of the 2008 Farm Bill and an additional $345 million of discretionary funding to be provided in the FAS salaries and expenses account as part of the National Export Initiative Under this program cost-share assistance is provided to nonprofit commodity and agricultural trade associations to support overseas market development activities that are designed to remove long-term impediments to increased US trade These activities include technical assistance trade servicing and market research Annual funding for the Cooperator Program has remained relatively unchanged since the early 1980s which has discouraged new organizations from participating and new types of activities from being undertaken The priority of the Cooperator Program is the pursuit of export market gains that require longer term initiatives and resource commitments Increasing the funding level in 2011 will provide the opportunity to broaden international acceptance of the products of biotechnology which account for a third of our agricultural exports today and will account for even more in the future as well as to take advantage of emerging market opportunities that require long term market development investment
For the Technical Assistance for Specialty Crops (TASC) Program the budget includes total funding of $18 million consisting of $9 million of CCC funding and $9 million of discretionary funding provided in the FAS salaries and expenses account Similar to the Cooperator Program funding for TASC will be increased in 2011 as part of the National Export Initiative TASC is designed to address unique barriers that prohibit or threaten the export of US specialty crops Under the program grants are provided to assist US organizations in activities designed to overcome sanitary phytosanitary or related technical barriers to trade Increased funding for the program reflects the growing importance of specialty crops for US agricultural export growth and the contribution the program has made in resolving numerous trade barriers that have restricted trade
The budget provides funding of $160 million for the Market Access Program (MAP) This program reimburses participating organizations for a portion of the cost of carrying out overseas marketing and promotional activities such as consumer promotions MAP participants include nonprofit agricultural trade organizations State-regional trade groups cooperatives and private companies that qualify as small businesses Annual MAP funding has grown substantially since 2001 when the program level was $90 million Although the 2011 MAP funding level is
45
FARM AND FOREIGN AGRICULTURAL SERVICES
reduced from 2010 it still provides a program level that is nearly 80 percent above 2001 reflecting the recent strong expansion in programming
The budget maintains funding for the Emerging Markets Program at $10 million consistent with provisions of the 2008 Farm Bill The program authorizes CCC funding to be made available to carry out technical assistance activities that promote the export of US agricultural products and address technical barriers to trade in emerging markets Many types of technical assistance activities are eligible for funding including feasibility studies market research industry sector assessments specialized training and business workshops
Dairy Export Incentive Program Under the Dairy Export Incentive Program (DEIP) CCC funds are used to make bonus payments to exporters of US agricultural commodities to enable them to be price competitive and thereby make sales in targeted overseas markets where competitor countries are making subsidized sales
Because of global market conditions including falling international dairy prices and the reinstitution of dairy export subsidies by the European Union DEIP was reactivated in May 2009 and $19 million of bonuses were awarded under the program during 2009 Global market conditions are expected to improve gradually with the United States once again regaining its competitive position in export dairy markets Based on that assumption the budget includes a projected program level of $10 million for DEIP in 2010 and no funding for 2011 However should conditions warrant CCC funding can continue to be made available to the program up to the maximum annual level authorized under US commitments to the World Trade Organization
Foreign Food Assistance The United States plays a leading role in global efforts to alleviate hunger and malnutrition and enhance world food security through international food aid activities USDA contributes to these efforts by carrying out a variety of food aid programs which support economic growth and development in recipient countries
McGovern-Dole International Food for Education and Child Nutrition Program The McGovern-Dole International Food for Education and Child Nutrition Program provides for the donation of US agricultural commodities and associated financial and technical assistance to carry out preschool and school feeding programs in foreign countries Maternal infant and child nutrition programs also are authorized under the program Its purpose is to reduce the incidence of hunger and malnutrition and improve literacy and primary education These measures contribute to a healthy literate workforce that can support a more prosperous sustainable economy and ensure long-term food security
The 2011 budget continues funding for the McGovern-Dole program at the 2010 enacted level of $2095 million Appropriated funding for the program was increased substantially in 2010 in order to help support additional school feeding and child nutrition programs and to bolster the Departmentrsquos contribution to supporting economic development and food security in developing countries The program is expected to assist an estimated 5 million women and children in 2011
46
FARM AND FOREIGN AGRICULTURAL SERVICES
Food for Peace Act (PL 480) Assistance provided under the authority of the Food for Peace Act is a primary means by which the United States provides foreign food assistance Also known as PL 480 the assistance is authorized to be provided through two program authorities
bull Title I provides for sales of US agricultural commodities to developing country governments and private entities through concessional financing agreements and for donations through Food for Progress grant agreements The Title I program is administered by FAS
bull Title II provides for donations of humanitarian food assistance to needy people in foreign countries in response to malnutrition famine and other extraordinary relief requirements and to meet economic development needs that address food security The assistance is provided primarily through private voluntary organizations cooperatives or international organizations mainly the World Food Program (WFP) of the United Nations The Title II program is administered by the US Agency for International Development (USAID)
For 2011 the budget provides funding of nearly $17 billion for PL 480 Title II food assistance unchanged from the 2010 enacted level Last yearrsquos budget increased base funding for Title II programming by 38 percent over the previous year in order to bolster resources available for emergency needs enhance global food security and restore US leadership in global development efforts The 2011 budget maintains funding at that level in further support of those objectives
The budget includes no funding for Title I credit sales and grants
Food for Progress The Food for Progress Act of 1985 authorizes US agricultural commodities to be provided to developing countries and emerging democracies that have made commitments to introduce and expand free enterprise in their agricultural economies Statutory authority for the program was extended in the 2008 Farm Bill
Food for Progress agreements can be entered into with foreign governments private voluntary organizations nonprofit agricultural organizations cooperatives or intergovernmental organizations Agreements currently provide for the commodities to be supplied on grant terms
The Food for Progress authorizing statute provides for the use of CCC funding for commodity procurement transportation and associated non-commodity costs for the program
The 2011 budget assumes that $146 million of CCC funding will be used to support the Food for Progress program which is expected to support approximately 170000 metric tons of commodity assistance
Bill Emerson Humanitarian Trust The Bill Emerson Humanitarian Trust (the Trust) is a commodity andor monetary reserve designed to ensure that the United States can meet its international food assistance commitments under PL 480 Title II Substantial changes in the statutory authorities for the Trust were included in the 2008 Farm Bill These included revisions easing the criteria for release of commodities and funds from the Trust As revised the Trustrsquos
47
FARM AND FOREIGN AGRICULTURAL SERVICES
assets can now be released any time the Administrator of USAID determines that PL 480 Title II funding for emergency needs is inadequate to meet those needs in any fiscal year The revisions also removed the annual cap on the amount of commodities and funds that can be released
When a release from the Trust is authorized the Trustrsquos assets (whether commodities or funds) cover all commodity costs associated with the release All non-commodity costs including ocean freight charges internal transportation storage and handling overseas and certain administrative costs are paid for by CCC
During 2009 $7 million of assistance was provided using the Trustrsquos authority To date in 2010 no assistance has been provided and as of December 31 2009 the Trust held $315 million of cash and no commodities
Local and Regional Commodity Procurement Pilot Program The 2008 Farm Bill authorizes and provides CCC funding for a limited field-based pilot program of local and regional procurement of food aid commodities for distribution overseas Under the program which is authorized through 2012 grants are provided to private voluntary organizations cooperatives and WFP that undertake the procurement activities During 2009 FAS issued guidelines that govern operation of the pilot program and nearly $5 million of grants were awarded to the World Food Program for procurement projects in Mali Malawi and Tanzania Commodities purchased included sorghum millet beans and corn Consistent with provisions of the Farm Bill the budget provides $25 million for the pilot program in 2010 and 2011
In conjunction with an evaluation of USDA foreign food assistance programs FAS has developed a long-term performance measure that is intended to gauge the effectiveness of USDA food aid programs in improving food security in low income countries The ldquofood aid targeting effectiveness measurerdquo assesses how effective the targeting of USDA food aid programs is in addressing the food distribution gap in the most food insecure countries The Economic Research Service calculates the ratio using its Food Security Assessment Model which measures food security based on estimations of food gaps in 71 of the worldrsquos poorest countries Food gaps represent the difference between projected food availability and targeted food consumption
Because USDA food assistance programs contribute to multiple objectives including filling nutritional gaps agricultural development and childhood education performance results can vary from year to year depending upon which countries receive assistance The results will be highest in years when food is directly distributed and the country has a food distribution system that gets food to the neediest This occurred in 2008 when countries receiving assistance to meet nutritional development and educational needs had large nutritional gaps which caused a significant increase in the Food Aid Targeting Effectiveness measure
2006 2007 2008 2009 2010 2011Key Performance Measure
Food Aid Targeting 30-35 38 57 49 37 38Effectiveness (Percent)
48
FARM AND FOREIGN AGRICULTURAL SERVICES
Trade Adjustment Assistance for Farmers The Recovery Act reauthorized the Trade Adjustment Assistance (TAA) for Farmers program that was originally authorized by the Trade Act of 2002 Statutory authority for the original program had expired in December 2007 As revised by the Recovery Act USDA is now authorized to provide assistance to eligible producers of raw agricultural commodities and fishermen when production in the most recent marketing year yields less than 85 percent of the average national price production quantity value of production or cash receipts for such commodity for the 3 preceding marketing years and increases in imports contributed importantly to such declines as determined by the Secretary
TAA for Farmers provides producers of raw agricultural commodities and fishermen who have been adversely affected by import competition free technical assistance the reimbursement of certain travel and per diem costs associated with training and cash benefits of up to $12000 linked to the development and implementation of approved business adjustment plans The program covers farmers livestock producers fish farmers and fishermen competing with like or directly competitive imported products
During 2009 $25 million of TAA funding was obligated for the costs of implementing the revised program including the costs of contracting for the provision of technical assistance over a multi-year period As authorized by the Recovery Act the budget assumes annual funding of $90 million for the program for 2010 and $225 million for 2011 Statutory authority for the TAA for Farmers program expires on December 31 2010
49
FARM AND FOREIGN AGRICULTURAL SERVICES
Foreign Agricultural Service Salaries and Expenses (Dollars in Millions)
2009 2010 2011 Program Enacted Estimate Budget
Agricultural Exportshelliphelliphelliphelliphelliphelliphelliphelliphelliphelliphelliphelliphelliphelliphelliphelliphellip $112 $123 $182 New Technologieshelliphelliphelliphelliphelliphelliphelliphelliphelliphelliphelliphelliphelliphelliphelliphelliphellip 21 23 24 Food Securityhelliphelliphelliphelliphelliphelliphelliphelliphelliphelliphelliphelliphelliphelliphelliphelliphelliphelliphellip 34 38 41 Climate Changehelliphelliphelliphelliphelliphelliphelliphelliphelliphelliphelliphelliphelliphelliphelliphelliphelliphellip 3 3 3 Agricultural Reconstruction and Stablizationhelliphelliphelliphelliphelliphelliphellip 0 0 15
Total Appropriated Programshelliphelliphelliphelliphelliphelliphelliphelliphelliphelliphellip 170 187 265 FAS Computer Facility and Other IRM Costs Funded by CCChelliphelliphelliphelliphelliphelliphelliphelliphelliphelliphelliphelliphelliphelliphelliphelliphellip 20 24 21 Development Assistance Programs Funded by AID and Other Organizationshelliphelliphelliphelliphelliphelliphelliphelliphelliphelliphelliphellip 67 66 66 Agricultural Reconstruction and Stablization Activities funded by USAID and the Dept of Statehelliphelliphelliphelliphelliphelliphelliphelliphelliphelliphellip 19 209 18 Other Reimbursable Agreementshelliphelliphelliphelliphelliphelliphelliphelliphelliphelliphelliphellip 35 41 28
Total Reimbursable Program Activityhelliphelliphelliphelliphelliphelliphelliphellip 141 340 133 Total FAS Salaries and Expenseshelliphelliphelliphelliphelliphelliphelliphelliphelliphellip $311 $527 $398
Agricultural exports make a critical contribution to the prosperity of local and regional economies across rural America through increased sales and higher commodity prices Every $1 billion worth of agricultural exports supports an estimated 9000 jobs and $14 billion in economy activity Because of this important role the Department has established a high priority performance goal that by the end of 2011 it will reduce non-tariff trade barriers for five major export markets and increase US agricultural exports by $2 billion per year
Biotechnology crops and derived products are a significant portion of US agricultural exports However concerns about these products have prompted some countries to establish regulatory barriers to trade in biotechnology products as well as other measures that limit the technologyrsquos potential to help meet food security needs In a concerted and strategic effort to address these barriers FAS will play a key role in implementing a formal USDA Strategy for Facilitating the Export of Genetically Engineered Agricultural Commodities FAS will work under this coordinated approach with other agencies within USDA and elsewhere in the government as well as with allies worldwide to help address these trade barriers as well as to help other nations understand how biotechnology may help address the global challenges of food security energy security and climate change
A key component of FASrsquo work to facilitate access to overseas markets is compliance monitoring and enforcement of existing trade agreements to ensure full and fair access to overseas markets for Am erican producers and exporters Each year FAS personnel in Washington and at overseas posts monitor compliance and when necessary intervene with
50
FARM AND FOREIGN AGRICULTURAL SERVICES
foreign governments on behalf of US exporters w ho face market access difficulties as a result of unfair and illegal trade barriers Increasingly in recent years these barriers have involved Sanitary and Phytosanitary (SPS) measures As tariffs have come down globally SPS measures to protect human animal and plan t health have become more prominent barriers to trade and have required significantly enhanced efforts by FAS in collaboration with other USDA agencies to address and resolve
There can be considerable year-to-year variability in the dollar value o f tr ade preserved particularly in the case of SPS measures and t echn ical barriers to trade such as biotechnology-related trade measures Biotechnology-related me asures in particular affect major US export commodities such as rice corn soybeans and cotton and the economic significance of a single trade disruption with a major market can be substantial High commodity prices can also affect the annual level of trade preserved This variability is evident in the substantially higher value of trade preserved during 2008 and 2009 The threat to US agricultural exports from non-science based SPS barriers continues to grow and can impact billions of dollars of our trade USDA actions in 2008 and 2009 maintained soybean exports to China worth $63 billion in 2008 and $74 billion in 2009
Key Performance Measure Dollar value of agriculture trade preserved through trade agreement negotiation monitoring and enforcement ($ Billions)
2006 2007 2008 2009 2010 2011
Non-SPS Activities a $07 $05 $04 $05 $05
Value of trade preserved annually through USDA staff interventions leading to resolution of barriers created by SPS or Technical Barrier to Trade measures ($ Billions)
SPS-Related Activities b 26 $26
25 $32
73 $78
95 $99
36 $41
40 $45
a Less than $50 million b In 2008 and 2009 includes soybean exports to China
FAS conducts its activities and programs through offices in Washington DC and at 97 overseas locations The overseas offices represent and advocate for US agricultural interests provide reporting on agricultural policies production and trade for about 150 countries assist US exporters trade groups and State export marketing officials in their trade promotion efforts and help to implement technical assistance and trade capacity building programs that contribute to increased food security
51
FARM AND FOREIGN AGRICULTURAL SERVICES
The budget provides an appropriated funding level of $265 million for FAS activities in 2011 an increase of $79 million above the 2010 enacted level Of particular note increased funding is provided to expand export promotion activities maintain the agencyrsquos overseas presence at current levels and improve information technology (IT) network support at its overseas offices
Export Promotion The budget includes $54 million in discretionary funding for trade expansion activities as part of the National Export Initiative that is designed to spur economic growth and employment opportunities This includes an increase of $10 million to expand FAS exporter assistance and in-country promotion activities and to meet higher operating costs at FAS overseas posts The initiative also includes $345 million to supplement funding for the Foreign Market Development (Cooperator) Program and $9 million for the Technical Assistance for Specialty Crops (TASC) Program Funding for the Cooperator and TASC programs will be in addition to that provided by CCC and will double the overall level of funding available to both programs in 2011 Funding is increased for the Cooperator Program in order to broaden the opportunity for program participation and to support new innovative pr ogram activities The expansion in TASC funding reflects the growing importance of specialty crops for US agricultural export growth and the success TASC has had in helping to resolve numerous trade barriers
Overseas Administrative Costs The budget provides $34 million for increased payments to the Department of State for administrative services provided at overseas posts FAS has no administrative staff overseas and therefore relies on the Department of State and other agencies for the provision of those services
Overseas IT Network Support An increase of $4 million is provided for FAS to contract with the Department of State for overseas IT network support and maintenance This will allow FAS to take advantage of the secure information system infrastructure that is operated and maintained by the State Department and ensure that sensitive agency information is fully protected
Cochran and Borlaug Fellowship Programs The budget provides increased funding of $15 million for the Cochran and Borlaug Fellowship Programs These programs provide training and collaborative research opportunities in the United States for foreign agricultural researchers policy officials and other agricultural specialists and thereby help to advance US government food security and trade policy objectives Among other things the additional funding will enable an expansion of programs in Afghanistan and Pakistan to train agricultural extension agents veterinary officials and researchers in support of agricultural growth and development It will also allow for additional training in support of food security objectives in sub-Saharan African countries as well as Haiti Under our proposals as many as 680 individuals will be able to participate in and benefit from these programs
Agricultural Reconstruction and Stabilization The FAS budget also includes $146 million to support the Departmentrsquos participation in reconstruction and stabilization activities including Provincial Reconstruction Teams (PRTs) primarily in Afghanistan and Iraq Of this $13 million is moved from Departmental Management where it was funded in the 2010 appropriations act During the past year FAS has assumed full management of the operational and policy components of USDArsquos reconstruction and stabilization activities FAS also
52
FARM AND FOREIGN AGRICULTURAL SERVICES
coordinates closely with the Department of State which sets overall operational and administrative policies for activities in those two countries Transferring the funding for these activities to FAS provides for more efficient operations and is consistent with how the Department is now managing them Funding for these activities is increased by $16 million over the 2010 level to provide for an expansion of activities in Afghanistan and to meet higher operating costs
USDA is supporting implementation of the Presidentrsquos strategies for Afghanistan and Iraq by providing technical experts who serve as advisors to key government ministries and serve on civilian-military command units including PRTs working with farmers and local agricultural officials throughout the countries During 2010 USDA is increasing the number of agricultural advisors serving in Afghanistan from 14 to 64 Their work is essential for stabilizing strategic areas of the country building government capacity ensuring the successful management of assistance programs and addressing the issue of food insecurity Consistent with these efforts the Department has established a high priority performance goal of increasing the number of Afghan provinces in which women and children are food secure from 10 to 14 by the end of 2011
In addition the budget includes an estimated $133 million in funding to be made available to FAS through reimbursable agreements The largest components of this are funding for technical assistance training and research activities that FAS carries out overseas on behalf of USAID foreign governments and international organizations and agricultural reconstruction and stabilization activities that are funded by USAID and the Department of State Although funded by other agencies these activities are an important component of the Departmentrsquos efforts to support economic development and enhance food security in developing countries
53
RURAL DEVELOPMENT
Rural Housing 62
MISSION AND RELATIONSHIP TO STRATEGIC GOAL
Rural communities and businesses are implementing innovative technologies and modernizing infrastructure to create jobs develop new markets and increase competitiveness while conserving the Nationrsquos natural resources and providing a safe sufficient and nutritious food supply for the country and the world As a leading advocate for rural America USDA is at the forefront of developing the technology and tools necessary to transform rural America to take advantage of new opportunities All of the funding for USDArsquos Rural Development (RD) programs contributes to the Strategic Goal assisting rural communities to create prosperity by providing financial and technical assistance to rural residents businesses and private and public entities for a broad range of purposes that bring prosperity and better living to Rural America These programs are grouped within three agencies (1) the Rural Business-Cooperative Service (RBS) which provides assistance for the development of business and industry including small businesses and is currently implementing new loan guarantee and payment programs specifically designed for renewable energy and energy improvement projects (2) the Rural Utilities Service (RUS) which provides assistance for water and waste disposal rural electric and telecommunications including broadband access and (3) the Rural Housing Service (RHS) which provides assistance for home ownership multi-family housing and essential community facilities such as health and public safety infrastructure
Rural Development 2011 Program Level - $ 24 Billion
Rural Business 7
Salaries and Expenses
3
Rural Utilities 28
The type of assistance offered includes direct loans loan guarantees grants and technical assistance Some programs provide assistance to intermediaries that make loans or provide technical assistance to the ultimate beneficiaries Several of the programs require or encourage recipients to contribute their own resources or obtain third-party financing to support the total cost of projects in which case these programs leverage the Governmentrsquos support with private sector financing
The cost of programs that provide direct or guaranteed loans depends upon a number of factors including what prevailing interest rates are whether the interest rate on the loans is subsidized by
54
RURAL DEVELOPMENT
the Government whether there are fees and how much risk of loss is involved In the tables the budget authority for each program reflects the cost to the government to support the loan level Several of the loan programs operate at little or no cost to the Government These programs account for most of the financial assistance that RD provides They also impose a responsibility on RD to ensure that these loans are repaid within the parameters reflected in the subsidy rates applied at the time the loans were made
RD delivers its programs through a network of approximately 450 area offices and 47 State offices a centralized servicing center and finance office in St Louis Missouri and a national office
The 2011 budget includes about $29 billion in budget authority to support a program level of $24 billion in loans grants and other assistance This level of support reflects a strong commitment to Rural America It also reflects new policy directions including support for regional planning and collaboration rural and urban access to healthy foods rural homeownership and a reduction in the Nationrsquos dependence on fossil fuels
55
RURAL DEVELOPMENT
RURAL BUSINESS - COOPERATIVE SERVICE (RBS)
Program Level (PL) and Budget Authority (BA) (Dollars in Millions)
2009 2010 2011 Enacted Estimate Budget
Program PL BA PL BA PL BA Discretionary Business and Industry Guaranteed Loans helliphelliphelliphelliphelliphelliphelliphellip $993 $43 $993 $53 $942 $40 Rural Business Enterprise Grantshelliphelliphelliphelliphelliphelliphelliphelliphelliphelliphellip 39 39 39 39 39 39 Rural Business Opportunity Grantshelliphelliphelliphelliphelliphelliphelliphelliphelliphellip 5 5 5 5 3 3 Intermediary Relending Programhelliphelliphelliphelliphelliphelliphelliphelliphelliphelliphellip 34 14 34 8 36 14
Rural Economic Development Direct Loanshelliphelliphelliphelliphelliphelliphelliphelliphelliphelliphelliphelliphelliphelliphelliphelliphelliphellip 36 0 33 0 33 0 Grantshelliphelliphelliphelliphelliphelliphelliphelliphelliphelliphelliphelliphelliphelliphelliphelliphelliphelliphelliphelliphellip 10 0 10 0 10 0 Rural Microentrepreneur Assistance Program (Sec 6022) Guaranteed Loanshelliphelliphelliphelliphelliphelliphelliphelliphelliphelliphelliphelliphelliphelliphelliphellip 0 0 12 3 24 7 Grantshelliphelliphelliphelliphelliphelliphelliphelliphelliphelliphelliphelliphelliphelliphelliphelliphelliphelliphelliphelliphellip 0 0 3 3 1 1 Rural Cooperative Development Grantshelliphelliphelliphelliphelliphelliphelliphellip 9 9 14 14 20 20 Biorefinery Assistance Program (Sec 9003)helliphelliphelliphelliphelliphelliphellip 0 0 0 0 50 17 Value-added Ag Product Market Development helliphelliphelliphelliphellip 4 4 20 20 20 20 Rural Energy for America Program (Sec 9007) Guaranteed Loanshelliphelliphelliphelliphelliphelliphelliphelliphelliphelliphelliphelliphelliphelliphelliphellip 26 2 144 20 12 5 Grantshelliphelliphelliphelliphelliphelliphelliphelliphelliphelliphelliphelliphelliphelliphelliphelliphelliphelliphelliphelliphellip 3 3 20 20 34 34 EZEChelliphelliphelliphelliphelliphelliphelliphelliphelliphelliphelliphelliphelliphelliphelliphelliphelliphelliphelliphelliphellip 8 8 0 0 0 0 Subtotal RBS Programshelliphelliphelliphelliphelliphelliphelliphelliphelliphelliphelliphelliphelliphellip 1167 127 1327 185 1224 200 Salaries and Expenseshelliphelliphelliphelliphelliphelliphelliphelliphelliphelliphelliphelliphelliphelliphelliphellip 5 5 5 5 5 5 Total Ongoing Programshelliphelliphelliphelliphelliphelliphelliphelliphelliphelliphelliphelliphellip 1172 132 1332 190 1229 205 Recovery Act
Business and Industry Guaranteed Loanshelliphelliphelliphelliphelliphellip 1572 126 0 0 0 0 Rural Business Enterprise Grantshelliphelliphelliphelliphelliphelliphelliphelliphellip 19 19 0 0 0 0
Total Recovery Act Programshelliphelliphelliphelliphelliphelliphelliphelliphelliphelliphelliphellip 1591 145 0 0 0 0 Total Discretionary Programshelliphelliphelliphelliphelliphelliphelliphelliphelliphelliphelliphellip 2763 277 1332 190 1229 205 Mandatory Farm Bill
Biorefinery Assistance Guaranteed Loans (Sec 9003)hellip 225 75 691 245 0 0 Rural Energy for America Loans (Sec 9007)helliphelliphelliphellip 275 27 213 29 73 34 Rural Energy for America Grants (Sec 9007)helliphelliphelliphellip 28 28 31 31 36 36 Repowering Assistance Payments (Sec 9004)helliphelliphelliphellip 35 35 0 0 0 0 Bioenergy for Advanced Biofuels (Sec 9005)helliphelliphelliphellip 55 55 55 55 85 85 Value-added Ag Product Market Development helliphelliphellip 15 15 0 0 0 0 Rural Microentrepreneur Assist Loans (Sec 6022)helliphellip 9 3 3 1 6 2 Rural Microentrepreneur Assist Grants (Sec 6022)hellip 1 1 3 3 2 2
Total Mandatory Programshelliphelliphelliphelliphelliphelliphelliphelliphelliphelliphelliphelliphellip 643 239 996 364 202 159 Total RBS Programshelliphelliphelliphelliphelliphelliphelliphelliphelliphelliphelliphelliphelliphelliphellip$3406 $516 $2328 $554 $1431 $364
56
RURAL DEVELOPMENT
RBS administers RDrsquos rural business and cooperative services programs The primary purpose of these programs is to promote economic development
Healthy Food Financing Initiative This initiative is designed to support local and regional efforts to increase access to healthy foods particularly for the development of grocery stores and other healthy food retailers in urban and rural food deserts and other underserved areas Several RD programs are included in this initiative and are expected to be utilized to provide financing for grocery stores and other related infrastructure
Regional Innovation The 2011 budget also includes an initiative to establish a Regional Innovation Initiative to focus on the planning and coordination of USDA and other sources of assistance for rural communities This initiative recognizes that individual communities are often affected by linkages to the other communities within regions and that working together can produce more prosperity for all RD is expected to provide leadership for this initiative although several other USDA agencies are expected to participate The budget includes $14 million to fund coordination of this initiative under the salaries and expenses account
Business and Industry Guarantee Loan Program The Business and Industry (BampI) loan guarantee program the largest program level of the RBS programs provides protection against loan losses so that lenders are willing to extend credit to establish expand or modernize rural businesses The tightening rural credit markets have brought a renewed interest in the BampI program The 2011 budget supports a program level of over $900 million in BampI loan guarantees almost the same as the 2010 level The 2011 budget also proposes to increase the one-time fee on BampI guaranteed loans from up to 2 percent in 2010 to up to 3 percent in 2011 This increase is needed because increased defaults have raised the subsidy cost of the program The BampI program is expected to provide support for the Regional Innovation and Healthy Food Financing initiatives
The Recovery Act provided $126 million in budget authority that supports $16 billion in program level for BampI guarantees A significant portion of the funding provided by the Recovery Act remains available throughout 2010
Rural Business Enterprise Grant Program The Rural Business Enterprise Grant program provides grants for rural projects that finance and facilitate development of small and emerging rural businesses The 2011 budget provides $39 million for grants the same level as 2010 The program is also expected to support the Regional Innovation and Healthy Food Financing initiatives
Rural Business Opportunity Grant Program The Rural Business Opportunity Grant program promotes sustainable economic development in rural communities with exceptional needs through training and technical assistance for business development entrepreneurs and economic development officials and to assist with economic development planning The 2011 budget provides almost $3 million for grants the same level as 2010
Intermediary Relending Program The Intermediary Relending program provides one percent interest direct loans to entities that relend to rural businesses at a higher interest rate and use their
57
RURAL DEVELOPMENT
interest earnings to pay for their administrative expenses and develop capital reserves The 2011 budget supports a program level of $36 million in direct loans under this program about $2 million more than 2010 The program is also expected to provide support for the Regional Innovation and Healthy Food Financing initiatives
Rural Microentrepreneur Assistance Program Under this new program one percent direct loans and grants are made to microenterprise development organizations (MDOrsquos) The loans will be used to establish reserves for relending to microentrepreneurs and the grants are made to the MDOrsquos which may relend a portion to provide training operational support business planning and market development assistance The 2011 budget includes $8 million in discretionary funding This funding will support $24 million in loans and about $1 million in grants Including the $4 million in mandatory funding the total funding available in 2011 for this program is $30 million in loans and $3 million in grants
Rural Cooperative Development Grant Program The 2011 budget includes $20 million for this program a $6 million increase over 2010 The additional funding will be used to support locally produced distribution systems and the development of new cooperatives Cooperatives assisted by this program serve many small and minority producers
Value-Added Producer Grants The 2011 budget maintains the Value-Added Producer Grants program at the 2010 level of $20 million The program provides grants for a wide range of value-added projects including those that change the physical state of agricultural products or the way such products are marketed Ten percent of the funding is reserved for mid-tier marketing chains
Rural Energy for America Program (Section 9007) RBS has operated a renewable energy loan and grant program for the purchase of renewable energy systems and energy efficiency improvements since the passage of the 2002 Farm Bill Section 9007 of the Farm Bill implemented the Rural Energy for America Program (REAP) REAP provides similar assistance as its predecessor program the Renewable Energy and Energy Efficiency Improvement Program however REAP can now offer funding for energy audits and feasibility studies The Farm Bill provides mandatory funding that will support a program level of $73 million in loans and $36 million in grants for 2011 about $135 million below the 2010 level In addition the 2011 budget supports a discretionary program level of $12 million in loan guarantees and $34 million in grants a reduction of $132 million in program level and an increase of $14 million in grants from the 2010 level
Biorefinery Assistance Program (Section 9003) RBS now has the capability to guarantee loan funds for biorefineries up to $250 million per project Rural Development has approved three loans for biorefineries under a Notice of Funding Availability that was published in November of 2008 and is currently developing permanent regulations for the program The 2008 Farm Bill provided funding in 2008 and 2009 to support over $900 million in loan guarantees and authorizes additional funds for 2009 through 2012 The 2011 budget requests $17 million in discretionary funding to support a program level of $50 million for these facilities With this funding the total available for Section 9003 Program is over $950 million
58
RURAL DEVELOPMENT
All the funding for RD programs is expected to save or create jobs however only the business programs collect data on jobs rather than use a common multiplier to estimate them The table below reflects performance for 2009 and projections for 2010 and 2011 The projections are subject to change
Key Performance Measure 2006 2007 2008 2009 2010 2011 Number of jobs created or saved through USDA financing of businesses 71715 72710 72907 68969 72369 73224
Note Performance includes other RBS loan and grant programs that were not identified in the text
59
RURAL DEVELOPMENT
RURAL UTILITIES SERVICE (RUS)
Program Level (PL) and Budget Authority (BA) (Dollars in Millions)
2009 2010 2011 Program Enacted Estimate Budget
PL BA PL BA PL BA Discretionary Electric Programs Direct Loanshelliphelliphelliphelliphelliphelliphelliphelliphelliphelliphelliphelliphellip $6600 a $7100 0 $4100 0
Telecommunications Programs Direct Loanshelliphelliphelliphelliphelliphelliphelliphelliphelliphelliphelliphelliphellip 690 a 690 0 690 0
Distance Learning and Telemedicine Programs Grantshelliphelliphelliphelliphelliphelliphelliphelliphelliphelliphelliphelliphelliphelliphelliphellip 35 $35 38 $38 30 $30
Broadband Programs Direct Loanshelliphelliphelliphelliphelliphelliphelliphelliphelliphelliphelliphelliphellip 400 16 400 29 400 22 Grantshelliphelliphelliphelliphelliphelliphelliphelliphelliphelliphelliphelliphelliphelliphelliphellip 13 13 18 18 18 18
High Energy Costs Grants helliphelliphelliphelliphelliphelliphelliphellip 18 18 18 18 0 0 Water and Waste Disposal Programs Direct Loanshelliphelliphelliphelliphelliphelliphelliphelliphelliphelliphelliphelliphellip 1095 142 1022 77 1036 89 Guaranteed Loans helliphelliphelliphelliphelliphelliphelliphelliphelliphelliphellip 75 0 75 0 75 0 Grants helliphelliphelliphelliphelliphelliphelliphelliphelliphelliphelliphelliphelliphelliphelliphellip 397 397 474 474 446 446 Subtotal Water and Wastehelliphelliphelliphelliphelliphelliphellip 1567 539 1571 551 1557 535 Subtotal RUS programshelliphelliphelliphelliphelliphelliphelliphellip 9323 621 9835 654 6795 605
Salaries and Expenseshelliphelliphelliphelliphelliphelliphelliphelliphelliphelliphellip 39 39 40 40 38 38
Total Ongoing Discretionary Programshelliphellip 9362 660 9875 694 6833 643
Recovery Act Broadband Programs
Direct Loanhelliphelliphelliphelliphelliphelliphelliphelliphelliphelliphellip 7160 485 0 0 0 0 Grantshelliphelliphelliphelliphelliphelliphelliphelliphelliphelliphelliphelliphelliphellip 1940 1940 0 0 0 0
Water and Waste Programs Direct Loanshelliphelliphelliphelliphelliphelliphelliphelliphelliphelliphellip 2154 273 0 0 0 0 Grantshelliphelliphelliphelliphelliphelliphelliphelliphelliphelliphelliphelliphellip 1106 1106 0 0 0 0
Total Recovery Act Programshelliphelliphelliphelliphelliphellip 12360 3804 0 0 0 0 Total RUS Programshelliphelliphelliphelliphelliphelliphelliphellip $21722 $4464 $9875 $694 $6833 $643
a Less than $05 million
Electric and Telecommunications Programs The Electric and Telecommunications programs administered by RUS provide loans to establish expand and modernize vital components of the infrastructure of rural America They are long-standing programs that brought electric and telecommunication services to rural America and ensured universal service for the Nation While most borrowers have some access to private credit markets the programs help to leverage private sector investments as well as fill credit gaps that still exist for some rural areas and borrowers In addition the programs facilitate the financing of improvements to facilities that
60
RURAL DEVELOPMENT
RUS financed in the past and still holds a lien There are a number of ways USDArsquos electric program can be used to support energy conservation and efficiency projects The 2008 Farm Bill amended the Rural Electrification Act (REA) to make electric program funding available for these purposes Loans can be made to electric cooperatives that in turn offer rebates or provide loans to their customers for energy conservation and efficiency projects There is also a provision in the REA to provide deferments on certain electric loans for these purposes The Rural Economic Development Loan and Grant (REDLG) program that is administered by RBS also provides funding for electric cooperatives that may be used to support energy conservation and efficiency projects
The 2011 budget reflects the Presidentrsquos 2009 G20 commitment to phase out fossil fuels subsidies Consistent with this commitment no loan funds are provided for new construction of base or peak load generation from coal or natural gas Loan funds will be used only for the transmission and distribution of electricity carbon capture projects and the generation of electricity from renewable sources including wind The budget supports $41 billion in loans for these purposes which is expected to be sufficient to meet the demand Loans for nuclear power generation will continue to be handled by the Department of Energy
The performance indicator identifies the number of borrowerssubscribers receiving new andor improved electric service The reduction in performance is directly attributed to the reduction in program level to meet the Presidentrsquos G20 commitment to reduce fossil fuel subsidies This measure includes the improvement of existing facilities as many facilities are improved several times over their estimated useful life which results in a larger number of people being served than actually live in the service territories
Key Performance Measure 2006 2007 2008 2009 2010 2011 Number of borrowerssubscribers receiving new andor improved electric facilities (millions)
82 58 81 98 61 38
The 2011 budget also supports $690 million in telecommunications loans which is the same as 2010 and also expected to be sufficient to meet demand These loans are used for the improvement and construction of telecommunication facilities that meet broadband standards although they are not meant to be used for all broadband purposes
The performance indicator displays performance information for the traditional telecommunications and broadband loan programs Program funding has been maintained at the same level in recent years and performance for the program has remained constant
61
Key Performance Measure 2006 2007 2008 2009 2010 2011
Number of borrowerssubscribers receiving new or improved telecommunication services (millions)
030 036 078 019 035 035
RURAL DEVELOPMENT
BroadbandDistance Learning and Telemedicine The ongoing Broadband program is similar to the Broadband program that is currently active under the Recovery Act The Distance Learning and Telemedicine Grant Program is designed specifically to assist rural communities that would otherwise be without access to learning and medical services over the Internet
The 2011 budget includes $70 million in funding to support $418 million in broadband loans and grants and $30 million in grants under the Distance Learning and Telemedicine program The overall reduction of $78 million in funding from 2010 reflects termination of the grants for analog conversion and the healthcare services grants
Staff resources are currently being fully utilized administering the Broadband program authorized by the Recovery Act which provided $25 billion in budget authority for broadband loans and grants This effort is being coordinated with the Federal Communications Commission and National Telecommunications and Information Administration It is anticipated the Recovery Act funding will be fully utilized in 2010
New regulations to implement the 2008 Farm Bill modifications in the ongoing program are expected to improve the performance of the program by providing better focus on rural areas that lack access to existing providers and by strengthening the financial integrity of the loan making process
High Energy Cost Grants The intent of this program is to provide funding for energy and other rural development purposes in areas that have high energy costs No funding is provided for this program because only a limited number of States can qualify and the purposes of the program can be met through other RD programs
Water and Waste Disposal Program The Water and Waste Disposal Program provides financing for rural communities to establish expand or modernize water treatment and waste disposal facilities These facilities provide safe drinking water and sanitary waste disposal for residential users and help communities thrive by attracting new business Projects are designed for energy efficiency and water conservation
Eligibility is limited to communities of 10000 or less in population that are unable to obtain credit elsewhere In addition financing is available only to those communities with low median household income levels Priority is given to public entities serving areas with less than 5500 population and applying for loans to restore a deteriorating water system or improve enlarge or modify an inadequate waste facility Grants are limited to a maximum of 75 percent of project costs Program regulations stipulate that the grant amount should only be as much as necessary to bring the user rates down to a reasonable level for the area Water and Waste Disposal grant and
62
RURAL DEVELOPMENT
loan funds are usually combined based on the income levels and user costs Grants are also provided for solid waste disposal and technical assistance and training
The 2011 budget provides $535 million in budget authority to support over $1 billion in direct loans $75 million in guaranteed loans and $446 million in grants for a total program level of about $16 billion This level is approximately the same as the 2010 appropriated level
The performance indicator measures the number of borrowerssubscribers receiving new or improved service from water facilities funded by Rural Development The 2008 Farm Bill provided an additional $300 million in funding in 2008 that attributed to the increase in performance In recent years the Water and Waste Disposal Program has received a similar appropriation and program performance has remain consistent with the level of program activity
Key Performance Measure 2006 2007 2008 2009 2010 2011
Number of borrowerssubscribers receiving new or improved service from agency funded water facility (millions)
17 13 44 34 14 14
The Recovery Act provided an additional $13 billion in budget authority sufficient to support $33 billion in loans and grants for reducing the backlog of applications This funding is expected to be fully utilized by the end of 2010
63
RURAL DEVELOPMENT
RURAL HOUSING SERVICE (RHS)
Program Level (PL) and Budget Authority (BA) (Dollars in Millions)
2009 2010 2011 Enacted Estimate Budget
Program PL BA PL BA PL BA Discretionary Single Family Housing
Direct Loans (Sec 502)helliphelliphelliphelliphelliphelliphelliphelliphelliphellip $1121 $75 $1121 $40 $1200 $75 Guaranteed Loans (Sec 502)helliphelliphelliphelliphelliphelliphelliphellip 6232 79 11961 173 12000 b
Multi Family Housing Direct Loans (Sec 515)helliphelliphelliphelliphelliphelliphelliphelliphelliphellip 70 29 70 19 95 32 Guaranteed Loans (Sec 538)helliphelliphelliphelliphelliphelliphelliphellip 129 8 129 1 129 13
Very Low-Income Repair (Sec 504) Direct Loans helliphelliphelliphelliphelliphelliphelliphelliphelliphelliphelliphelliphelliphellip 34 9 34 4 34 6 Grants helliphelliphelliphelliphelliphelliphelliphelliphelliphelliphelliphelliphelliphelliphelliphelliphellip 32 32 32 32 31 31
All Other Direct Loanshelliphelliphelliphelliphelliphelliphelliphelliphelliphelliphellip 21 a 21 a 21 1 Grants and Payments
Rental Assistance (Sec 502 and 521)helliphelliphelliphelliphellip 903 903 980 980 966 966 Mutual and Self-Help (Sec 523)helliphelliphelliphelliphelliphelliphellip 39 39 42 42 37 37 Multi-Family Housing Revitalization helliphelliphelliphelliphellip 32 28 69 43 18 18 All Other Grant and Loan programshelliphelliphelliphelliphellip 10 10 14 14 9 9
Farm Labor Housing Program Direct Loans (Sec 514)helliphelliphelliphelliphelliphelliphelliphelliphelliphellip 22 9 27 10 27 10 Grants (Sec 516)helliphelliphelliphelliphelliphelliphelliphelliphelliphelliphelliphelliphellip 9 9 10 10 10 10
Community Facilities Programs Direct Loanshelliphelliphelliphelliphelliphelliphelliphelliphelliphelliphelliphelliphelliphelliphellip 295 17 295 4 295 4 Guaranteed Loanshelliphelliphelliphelliphelliphelliphelliphelliphelliphelliphelliphellip 206 6 206 7 206 8 Grants helliphelliphelliphelliphelliphelliphelliphelliphelliphelliphelliphelliphelliphelliphelliphelliphellip 41 41 45 45 30 30 Subtotal RHS Programshelliphelliphelliphelliphelliphelliphelliphelliphellip 9196 1294 15056 1424 15108 1250
Salaries and Expenseshelliphelliphelliphelliphelliphelliphelliphelliphelliphelliphelliphellip 460 460 469 469 455 455 Total Ongoing Discretionary Programshelliphelliphellip $9656 $1754 $15525 $1893 $15563 $1705
Recovery Act Single Family Housing
Direct (Sec 502)helliphelliphelliphelliphelliphelliphelliphelliphelliphellip 1563 65 0 0 0 0 Guaranteed Loans (Sec 502)helliphelliphelliphelliphelliphellip10111 129 0 0 0 0
Community Facility Programs Directhelliphelliphelliphelliphelliphelliphelliphelliphelliphelliphelliphelliphelliphellip 1136 24 0 0 0 0 Grantshelliphelliphelliphelliphelliphelliphelliphelliphelliphelliphelliphelliphelliphelliphellip 102 102 0 0 0 0
Total Recovery Act Programshelliphelliphelliphelliphelliphelliphelliphelliphellip12912 320 0 0 0 0 Total Discretionary Programshelliphelliphelliphelliphelliphelliphelliphelliphellip$22568 $2074 $15525 $1893 $15563 $1705
a Less than $05 million b The budget proposes a new fee structure similar to HUD with no cost to the government
64
RURAL DEVELOPMENT
Single Family Direct and Guaranteed Loan Programs The Single Family Housing program provides direct and guaranteed loans to low and moderate income families in rural areas RHS is the only Federal agency that provides direct loans for this purpose Direct loans are limited to families with incomes less than 80 percent of area median income The interest rate on these loans may be subsidized down to one percent interest Guaranteed loans are limited to families with incomes less than 115 percent of area median income The interest rate on these loans is negotiated between the borrower and the private lender Currently there is a one-time guarantee fee of 2 percent for new loans and 05 percent on loans for refinancing This guarantee fee can be financed as part of the loan amount so that it does not impose an up-front cost that some borrowers may not be able to pay
The 2011 budget provides for a $12 billion program level for direct loans about $79 million above 2010 and maintains the 2010 appropriated level of $12 billion for guaranteed loans These levels are expected to provide about 98993 homeownership opportunities a decrease from 2010 which reflects anticipated higher housing prices due to the improved economic conditions
The performance measure below displays the number of homeownership opportunities that Rural Development has provided during the fiscal year In the past these programs have received additional funding through supplemental appropriations for disaster relief efforts that affected the performance information The 2010 appropriation nearly doubled the amount of program funds that were typically provided in recent years While the appropriation for 2011 is maintained at the 2010 level the small reduction in performance can be attributed to anticipated higher housing prices due to the improved economic conditions as indicated above
Key Performance Measure 2006 2007 2008 2009 2010 2011 Homeownership opportunities provided 42172 43532 66574 55957 106030 98993
While the single family housing programs have experienced modest increases in defaults due to the current economic crisis the programs did not make or guarantee sub-prime loans during the years that led up to the crisis and remain financially sound Moreover the demand for these programs has increased as demonstrated by the rapid utilization of Recovery Act funding Accordingly USDA is proposing that the guaranteed loan program be adapted to reflect the high demand for this program by charging an annual fee in addition to the guarantee fee This annual fee at an estimated rate of 015 percent in 2011 would be distributed over the year in monthly payments This change in policy is consistent with that of HUD and the VA
The Recovery Act provided an additional $65 million in budget authority for direct loans sufficient to support about $16 billion in loans and $129 million in budget authority sufficient to support over $10 billion in guaranteed loans Recovery Act funding for both the direct and guaranteed loan programs is expected to provide more than 90000 homeownership opportunities Most of this funding was used in 2009
Multi-Family Housing Programs The Multi-Family Housing program provides financing for rental housing projects and rental assistance payments for low-income tenants of those projects
65
RURAL DEVELOPMENT
The portfolio of previously financed projects currently includes about 17000 projects that provide housing for about 460000 low-income tenants many of whom are elderly The average annual income of tenants is about $8000
In recent years USDA has focused on the revitalization of existing projects As part of this effort the outstanding debt on these projects was deferred and other incentives offered to sponsors in exchange for a commitment to seek private sector financing to revitalize their projects and remain in the program The 2011 budget reflects a change in policy toward new construction Accordingly the 2011 budget includes additional budget authority to increase the program level for Section 515 direct loans for multi-family housing from $70 million in 2010 to over $95 million in 2011 which is expected to be used for both new construction and rehabilitation of the existing portfolio The 2011 budget proposes to terminate funding for the revitalization demonstration program Section 538 guaranteed loans would be maintained at $129 million with additional budget authority being provided to accommodate an increase in subsidy costs The policy of no interest subsidy and charging no fees on guaranteed loans would be maintained
The multi-family housing voucher program would be continued at a level of $18 million This program provides one-year vouchers to protect the rents of tenants affected by projects leaving the program
Most multi-family housing projects that are financed with direct loans also receive Rental Assistance Payments The payments are used to reduce the rents of low income families to no more than 30 percent of their income These payments are made through contracts with project sponsors Providing funding for the renewal of expiring rental assistance payment contracts is essential to RHSrsquo efforts to protect the Governmentrsquos investment and ensure the projects are revitalized and remain in the program The 2011 budget includes $966 million to renew about 212000 expiring contracts and provide new contracts on both Section 515 and Farm Labor Housing The modest decrease in funding is due to improvements in the way the need for renewing expiring contracts is estimated
Other Housing Programs Rural Development offers a full array of supplemental housing programs such as Very-low Income Repair loans and grants Rural Housing Preservation Farm Labor Housing loans and grants and Self-Help Housing These programs are maintained at approximately the same program levels as in 2010
Community Facilities Loan and Grant Programs RHS also administers a Community Facilities program that provides funding for a wide range of essential Community Facilities Priority is given to health and public safety facilities The program serves rural communities of up to 20000 in population
The 2011 budget provides funding for $295 million in direct loans $206 million in loan guarantees and $30 million in grants all under the basic Community Facilities program The loan levels are the same as for 2010 while the grant level is $15 million lower due to the elimination of three small special interest community facilities programs namely Rural Community Development Initiative grants Tribal College grants and Economic Impact
66
RURAL DEVELOPMENT
Initiative grants Other RD programs are available to provide assistance similar to that offered by these programs
The performance measure below measures the percent of rural residents who are provided with improved essential community services such as health and safety facilities Program funding and performance is relatively consistent from year to year with the exception of 2007 The increase in performance resulted from a Presidential Initiative from the prior Administration to enable rural health facilities to upgrade record keeping systems to electronic medical records
Key Performance Measure 2006 2007 2008 2009 2010 2011 Percentage of customers who are provided access to new andor improved essential community facilities ndash Health Facilities 38 72 48 54 50 50
Safety Facilities 38 62 57 50 54 54
67
RURAL DEVELOPMENT
RURAL DEVELOPMENT SALARIES AND EXPENSES
Budget Authority (Dollars in Millions)
2009 2010 2011 Program Enacted Estimate Budget
Salaries and Expenses Appropriationhelliphelliphelliphelliphelliphelliphelliphelliphelliphelliphelliphelliphelliphelliphellip $193 $202 $232 Transfers Rural Electric and Telecomm Loan Programhelliphellip (39) (40) (38) Rural Housing Insurance Fund Programhelliphelliphelliphellip (460) (468) (455) Rural Development Loan Fund Programhelliphelliphelliphellip (5) (5) (5) Subtotal Transfershelliphelliphelliphelliphelliphelliphelliphelliphelliphelliphellip (504) (513) (498) Subtotal Salaries and Expenseshelliphelliphelliphelliphelliphelliphellip 697 715 730 Recovery Acthelliphelliphelliphelliphelliphelliphelliphelliphelliphelliphelliphelliphelliphelliphellip 131 0 0 Total Salaries and Expenseshelliphelliphelliphelliphelliphelliphelliphelliphelliphellip $828 $715 $730
The 2011 budget provides a total of $730 million for salaries and expenses related to carrying out RD programs This level includes an increase of $72 million for pay cost $12 million for refresh of the Common Computing Environment (CCE) and $14 million to support the development of the Regional Innovation Initiative
The 2011 budget includes $12 million for the RD portion of a Departmental effort to modernize and upgrade the IT infrastructure (also known as the Common Computing Environment (CCE)) for the Service Center Agencies (SCAs) This funding will be used to replace outdated components of the CCE many of which have exceeded their expected life cycles to reduce system vulnerabilities to failure and improve the performance and effectiveness of the shared infrastructure These improvements will allow the SCAs to better serve program participants with a more flexible and reliable IT infrastructure This funding will allow for the first system-wide refresh of the CCE since the infrastructure was implemented in 2000 In addition as the components of the CCE are replaced USDA will implement a right-sizing process whereby configuration changes will be made to better support the delivery of current and future programs As part of this process the Department will strive to improve system security reduce the long term cost of infrastructure services and improve service reliability
68
FOOD NUTRITION AND CONSUMER SERVICES
MISSION AND RELATIONSHIP TO STRATEGIC GOAL
A plentiful supply of safe and nutritious food is essential to the well-being of every family and the healthy development of every child in America Although most American households have access at all times to enough nutritious food for an active and healthy lifestyle too many households especially households with children do not have sufficient resources to ensure this access especially under the current economic conditions A recent report by the Department showed that in over 500000 families with children in 2008 one or more children simply do not get enough to eat Meaning they had to cut the size of their meals skip meals or even go whole days without food at some time during the year Too many children also have poor diets and gain excessive weight Recent data shows that the prevalence of obesity has increased over 10 percent to 17 percent for children between 6 and 19 years of age
The activities and funding of Food Nutrition and Consumer Services including the Food and Nutrition Service (FNS) and the Center for Nutrition Policy and Promotion (CNPP) support USDA Strategic Goal to ensure that all of Americarsquos children have access to safe nutritious and balanced meals FNS contributes significantly to two activities under this strategic goal including (1) increasing access to nutritious food and (2) promoting healthy diet and physical activity behaviors FNS also works to ensure that food is safe most notably for meals served through the Child Nutrition Programs and the agency is committed to increasing performance efficiency and alignment of USDA programs
The mission of FNS is to increase food security and reduce hunger in partnership with cooperating organizations by providing children and low-income people access to food a healthful diet and nutrition education in a manner that supports American agriculture and inspires public confidence The mission of CNPP is to improve the health of Americans by developing and promoting dietary guidance that links the best evidence-base scientific research to the nutrition needs of consumers In addition to providing access to nutritious food FNS also works to empower program participants with knowledge of the link between diet and health FNS administers the Departmentrsquos domestic nutrition assistance programs The Federal staff leverage their efforts by working with State and local partners to deliver nutrition assistance through the Supplemental Nutrition Assistance Program (formerly the Food Stamp Program) the Child Nutrition Programs ndash National School Lunch Program National School Breakfast Program and the Child and Adult Care Food Program and the Special Supplemental Nutrition Program for Women Infants and Children (WIC) and other programs serving specialized needs The Supplemental Nutrition Assistance Program provides basic assistance to help ensure low-income households have access to a secure and adequate diet The other programs target specific groups of people with specialized needs or in special settings Key performance measures for 2011 are to decrease the number of households with very low food security among children increase the percentage of eligible people participating in the Supplemental Nutrition Assistance Program increase the percentage of school children participating in the National School Lunch Program decrease the prevalence of obesity among children and adolescents improve Healthy Eating Index (HEI) scores for people in low-income households (under 130 percent of poverty level) and for the general population and increase the amount of Supplemental Nutrition Assistance Program benefits redeemed at farmers markets
69
FOOD NUTRITION AND CONSUMER SERVICES
FNS Budget Authority 900
800
700
600
500
400
300
200
100
00
WIC CNP SNAP ARRA FY 2009 FY 2010 FY 2011
ARRA amounts of less than $1 billion are not included
The 2011 budget provides funds for anticipated changes in participation and food cost inflation for the major programs It emphasizes improving access and operations in 2011 and improving the nutritional status of recipients Both FNS and the Center for Nutrition Policy and Promotion will continue efforts to promote healthy eating and active lifestyle behaviors in part by the continued use and promotion of MyPyramidgov and the Dietary Guidelines for Americans Additionally in 2011 USDA will coordinate with the Departments of Health and Human Services and Education to implement revise and refine plans and strategies for addressing the problem of childhood obesity
$Bill
ions
69 73 76 15 17 19
54 58 68
52 105
119
70
FOOD NUTRITION AND CONSUMER SERVICES
Food and Nutrition Service Budget Authority
(Dollars in Millions) 2009 2010 2011
Program Enacted Estimate Budget Discretionary Special Supplemental Nutrition Program (WIC) helliphelliphelliphelliphelliphelliphelliphelliphelliphelliphelliphellip $6860 $7257 $7603 Commodity Assistance Program Commodity Supplemental Food Programhelliphelliphelliphelliphelliphelliphelliphelliphelliphelliphelliphelliphelliphellip 160 171 177 The Emergency Food Assistance Program (TEFAP)
Soup Kitchens Food Bankshelliphelliphelliphelliphelliphelliphelliphelliphelliphelliphelliphelliphelliphelliphelliphelliphelliphelliphelliphellip 50 50 50 Infrastructure Grantshelliphelliphelliphelliphelliphelliphelliphelliphelliphelliphelliphelliphelliphelliphelliphelliphelliphelliphelliphelliphelliphellip 0 6 0
Farmers Market Nutrition Programhelliphelliphelliphelliphelliphelliphelliphelliphelliphelliphelliphelliphelliphelliphelliphelliphellip 20 20 20 Pacific Island Assistance and Disaster Assistancehelliphelliphelliphelliphelliphelliphelliphelliphelliphelliphellip 1 1 1 IT Modernization and Supporthelliphelliphelliphelliphelliphelliphelliphelliphelliphelliphelliphelliphelliphelliphelliphelliphelliphelliphellip 0 0 2 Nutrition Services Incentive Program ahelliphelliphelliphelliphelliphelliphelliphelliphelliphelliphelliphelliphelliphelliphellip 3 3 0
Total Commodity Assistance Programhelliphelliphelliphelliphelliphelliphelliphelliphelliphelliphelliphelliphelliphellip 234 251 250 Nutrition Programs Administrationhelliphelliphelliphelliphelliphelliphelliphelliphelliphelliphelliphelliphelliphelliphelliphelliphelliphellip 145 151 172
Total Ongoing Discretionary Programshelliphelliphelliphelliphelliphelliphelliphelliphelliphelliphelliphelliphelliphellip 7239 7659 8025 Recovery Act WIC Programhelliphelliphelliphelliphelliphelliphelliphelliphelliphelliphelliphelliphelliphelliphelliphelliphelliphelliphelliphelliphelliphelliphelliphelliphelliphellip 500 0 0 Commodity Assistance Programhelliphelliphelliphelliphelliphelliphelliphelliphelliphelliphelliphelliphelliphelliphelliphelliphelliphellip 150 0 0 Child Nutrition Programshelliphelliphelliphelliphelliphelliphelliphelliphelliphelliphelliphelliphelliphelliphelliphelliphelliphelliphelliphelliphellip 100 0 0
Total Recovery Acthelliphelliphelliphelliphelliphelliphelliphelliphelliphelliphelliphelliphelliphelliphelliphelliphelliphelliphelliphelliphelliphellip 750 0 0 Total Discretionary Programshelliphelliphelliphelliphelliphelliphelliphelliphelliphelliphelliphelliphelliphelliphelliphelliphelliphellip 7989 7659 8025
Mandatory Supplemental Nutrition Assistance Program (SNAP)helliphelliphelliphelliphelliphelliphelliphelliphelliphelliphellip 53970 58269 68207 Proposed Legislation bhelliphelliphelliphelliphelliphelliphelliphelliphelliphelliphelliphelliphelliphelliphelliphelliphelliphelliphelliphelliphelliphellip 0 11 36 Child Nutrition Programshelliphelliphelliphelliphelliphelliphelliphelliphelliphelliphelliphelliphelliphelliphelliphelliphelliphelliphelliphelliphelliphellip 15074 17034 18392 Reauthorization Proposalshelliphelliphelliphelliphelliphelliphelliphelliphelliphelliphelliphelliphelliphelliphelliphelliphelliphelliphelliphelliphellip 0 0 1000 Farm Bill Seniors Farmers Market Nutrition Program chelliphelliphelliphelliphelliphelliphelliphelliphelliphelliphelliphelliphellip 21 21 21 Recovery Act Supplemental Nutrition Assistance Programhelliphelliphelliphelliphelliphelliphelliphelliphelliphelliphelliphelliphelliphellip 5195 10460 11936 Supplemental SNAP State Administrative Expenseshelliphelliphelliphelliphelliphelliphelliphelliphelliphelliphelliphelliphelliphelliphelliphellip 0 400 0
Total Mandatory Programshelliphelliphelliphelliphelliphelliphelliphelliphelliphelliphelliphelliphelliphelliphelliphelliphelliphelliphellip 74260 86195 99592 Total FNShelliphelliphelliphelliphelliphelliphelliphelliphelliphelliphelliphelliphelliphelliphelliphelliphelliphelliphelliphelliphelliphelliphelliphelliphellip $82249 $93854 $107617
a Funds are transferred from the Department of Health and Human Services Administration on Aging b The budget also proposes to increase the asset limit to $10000 in SNAP but does not increase budget authority The funding is provided through a government-wide initiative c Funds are transferred from the Commodity Credit Corporation
71
FOOD NUTRITION AND CONSUMER SERVICES
The nutrition assistance programs work in concert to improve scores on cross-cutting performance measures of improved diet for the children and low-income people they serve
Key Performance Measure 2006 2007 2008 2009 2010 2011 Application and usage level of nutrition guidance tools (billions of pieces of nutrition guidance distributed) 15 26 32 35 30 39 Baseline 2006 = 15
People Served Through Nutrition Assistance Programs
433
WIC SNAP School Lunch
FY 2009 FY 2010 FY 2011
Supplemental Nutrition Assistance Program (SNAP) The 2011 budget anticipates an increase in participation on average of about 28 million recipients per month between 2010 and 2011 Since the Recovery Act increased the maximum allotment by 136 percent effective April 2009 and provided that the benefit remain constant until the statutory COLA for SNAP benefits exceeds that level the average benefit level in 2011 is expected to be about the same as it was in 2010 (and for several years afterwards) Increases in projected funding requirements thus reflect the anticipated increase in program participation and associated State administrative expenses
The Administration is working to establish a practical national asset limit floor across means-tested human services food and cash assistance programs Legislative language will be provided to raise current SNAP asset limits to $10000 from $2000 per household or $3000 for households including an elderly or disabled member This nationwide figure will streamline eligibility for families eligible for benefits from multiple programs and encourage families to
91
337 312
95
405
321
101
326
0
5
10
15
20
25
30
35
40
45
Peop
le S
erve
d (M
illio
ns)
72
FOOD NUTRITION AND CONSUMER SERVICES
save toward self-sufficiency In addition FNS will be proposing legislative language to provide for the exclusion of tax refunds in the month of receipt and for the following 12 months beginning in tax year 2009 for SNAP and all Federally funded means-tested programs Legislation is also being proposed to extend the Recovery Act provision that eliminates the time limits for able-bodied adults without dependents for an additional year for an one-time cost of $25 million
SNAP will continue to focus on encouraging all eligible persons to take advantage of program benefits with particular emphasis on reaching underserved populations such as the elderly Hispanics and the working poor For 2011 $6 million is included to expand the Healthy Incentives Pilot now under development which will demonstrate and evaluate the effect of financial incentives to purchase fruits and vegetables on the diets of SNAP participants Additionally $125 million is requested to test the impact of a community-wide approach that will use multiple means of communication and influence to raise the general awareness of healthy eating in a community shift social norms create more opportunities to make healthy food choices and reward such choices when made
To assist direct-to-consumer food sales $4 million is included to provide point of sale terminals to all farmersrsquo markets nationally that cannot currently redeem SNAP benefits Ensuring farmersrsquo markets have point of sales devices will substantially increase the redemption of SNAP benefits at these outlets Nutrition education continues to be a key part of the SNAP to help low-income households improve their nutrition levels
Key Performance Measure 2006 2007 2008 2009 2010 2011 Participation levels for the major Federal nutrition assistance programs (millions per month) Supplemental Nutrition Assistance Program 257 265 284 337 405 433
The Department is continuing its efforts to improve payment accuracy seeking to reach a payment accuracy rate of 95 percent in 2011 This will be achieved through working with stakeholders to implement best practices focusing particularly on error prone areas
Key Performance Measure 2006 2007 2008 2009 2010 2011 Improve SNAP payment accuracy rate Baseline 2001 = 913 942 944 950 950 950 950
The Administration is committed to ensuring an uninterrupted flow of benefits to program participants Since SNAP participation and costs are not fully predictable and can grow rapidly in a changing economic environment or in unexpected emergencies such as natural disasters the 2011 budget includes a $5 billion contingency reserve an increase of $2 billion over recent
73
FOOD NUTRITION AND CONSUMER SERVICES
years to be used in the event that program needs exceed current estimates The budget also proposes indefinite funding authority which would make additional funds available in the last four months of the fiscal year if program needs exceed the anticipated level
Child Nutrition Programs Ensuring access to food for children and improving their eating habits continues to be a priority The National School Lunch School Breakfast Summer Food Service Special Milk and Child and Adult Care Food Programs play a significant role in achieving this goal by assisting State and local governments in serving healthful nutritious meals and snacks to children in various settings with greatest emphasis on helping low-income children These programs assist children by subsidizing quality meals in participating schools and child care settings While children from all income levels receive some assistance from these programs most of the funding supports meals served to low-income children for free or at a greatly reduced price Child Nutrition Programs subsidies for meals at child care centers and family daycare homes help support child care a critical need for working families
To ensure the quality of the meals served in the school meals programs and the Child and Adult Care Food Program the Department entered into a three-year contract with the National Academiesrsquo Institute of Medicine (IOM) in February 2008 to convene a panel of experts to make recommendations for updating and revising the nutrition standards and meal requirements IOMrsquos recommendations released in October 2009 will be used to develop a regulatory proposal to make changes that will ensure that school meals do all they can to meet childrenrsquos nutritional needs foster healthy eating habits and safeguard childrenrsquos health Similarly schools that achieve recognition as HealthierUS Schools Challenge Schools achieve a high level of performance for school meal quality nutrition education and physical activity
The Administration is currently focused on the reauthorization of the Child Nutrition and WIC Programs programs which at some point in their lives touch most Americans - providing nutritious food nutrition education and connections to critical health services The Administration is proposing to add $1 billion in 2011 and a total of $10 billion over the next ten years for this priority Reauthorization reforms are a key strategy in the effort to eliminate childhood hunger by 2015 USDA will provide resources aimed at improving access to nutritious meals establishing high standards for the nutritional quality of food available in school exploring new strategies for reducing hunger and improving childrenrsquos food choices particularly for low-income children improve access to healthy fruits and vegetables reducing the prevalence of obesity by improving the diets of school children by teaching them to make wise food choices and improve program performance and integrity
For 2011 the Child Nutrition Programs are funded at a level that will support anticipated participation and food costs An increase of $2 million is sought for a Farm to School Tactical Team including both FNS and AMS staff that will support local and regional food systems by facilitating linkages between schools and their local food producers An increase of $8 million is included to measure erroneous payments in school meal programs to determine the progress made reducing erroneous payments Also $8 million is sought for a study of school lunch and breakfast meal costs This study is conducted every few years to ensure that decisions on reimbursement levels are informed by up-to-date high-quality information on the cost of producing meals and the sources and levels of revenues to cover those costs
74
FOOD NUTRITION AND CONSUMER SERVICES
The $5 million in annual funding for Hunger-Free Communities under Section 4405 of the Farm Bill will continue in 2011 Grants will focus on promotion outreach demonstration projects and technical assistance to support communities in exploring a significantly broader array of local strategies to prevent hunger primarily among children Further $700000 included in 2010 to expand the HealthierUS School Challenge will be continued in FY 2011 so work to encourage schools to take a leadership role in helping students learn to make healthier eating and lifestyle choices will continue Existing funds will also continue to help ensure the integrity of meals served increased training and technical assistance materials for the school food service community and increased Federal oversight of meals served
Key Performance Measure 2006 2007 2008 2009 2010 2011 Participation levels for the major Federal nutrition assistance programs (millions per day) National School Lunch Program 301 305 309 312 321 326 School Breakfast Program 81 83 87 110 117 122
WIC The WIC Program USDArsquos largest discretionary program helps improve the health and nutritional intake of low-income pregnant breast-feeding and postpartum women infants and children up to their fifth birthday WIC works by providing participants with vouchers redeemable for foods dense in nutrients known to be lacking in the diets of eligible groups and providing nutrition education and referrals to other important health and social services Nearly half of those born in the United States receive WIC benefits
The Presidentrsquos 2011 budget request proposes $76 billion for the WIC Program an increase of approximately $350 million above the 2010 level (excluding the Recovery Act funding) which will be augmented by larger than usual carryover balance from 2010 The Administration is committed to serving all eligible individuals seeking WIC benefits and expects the request to support a monthly average of 101 million participants Included in the request is an increase for breastfeeding promotion from $80 million to $83 million plus a doubling of funding for breastfeeding performance bonuses for States to $10 million Also $15 million for program evaluation and $60 million allocated specifically to help States improve their management information systems are continued in 2011 Further $10 million is provided to continue support for IT oversight and infrastructure and $5 million is provided to improve the application process and coordination with other programs The Recovery Act provided $500 million in additional funding for WIC $100 million for management information systems and $400 million in a contingency reserve to fund unanticipated participation costs available until the end of 2010
FNS is working with States to ensure effective implementation of the new WIC food packages as required in 2010 and will work to continue to improve overall nutritional intakes consistent with the 2010 Dietary Guidelines for Americans and increase breastfeeding rates Additionally resources are provided to increase the value of the fruit and vegetable voucher for children by $2 per family per month totaling $104 million annually Finally the budget provides for a
75
FOOD NUTRITION AND CONSUMER SERVICES
$250 million contingency fund to ensure sufficient resources for stable services should participation or food costs be higher than anticipated
Key Performance Measure 2006 2007 2008 2009 2010 2011 Participation levels for the major Federal nutrition assistance programs (millions per month) WIC Program (average) 81 83 87 91 95 101
Commodity Assistance Program (CAP) CAP distributes USDA commodities through several programs The Emergency Food Assistance Program (TEFAP) provides support to a network of food banks and other programs that assist households in need of immediate short-term food assistance TEFAP includes components of both discretionary and mandatory funding In addition the Recovery Act provided $150 million for TEFAP to increase food assistance to Americans in the economic crisis These funds were used to purchase additional commodities ($100 million) and to fund administrative costs associated with the distribution of the USDA commodities or privately-donated foods In 2011 for State and local program administration $50 million in discretionary funding is requested any part of which at State discretion may be used to purchase additional commodities Also note that under the Supplemental Nutrition Assistance Program account mandatory funding of $2465 million is provided to purchase TEFAP commodities
CAP includes funding for the Commodity Supplemental Food Program (CSFP) CSFP provides commodities to low-income elderly and pregnant postpartum and breastfeeding women infants and children up to age six The 2011 budget proposes $1768 million an increase of $54 million to offset expected cost increases due to inflation while supporting the current participation levels
In 2011 funding is requested for the Farmersrsquo Market Nutrition Program (FMNP) for women infants and children at the authorized level $20 million The FMNP provides WIC participants with vouchers to purchase fresh local fruits vegetables and herbs directly from farmers farmersrsquo markets and roadside stands In 2008 the FMNP provided coupons to 23 million WIC participants The participants redeemed their coupons at 5765 authorized farmers markets and roadside stands providing revenue to 16016 small family farmers The Seniors FMNP funded by CCC provided similar benefits to over 900000 low-income seniors In 2008 the Seniors FMNP involved over 15062 farmers at 5588 farmersrsquo markets roadside stands and community supported agriculture programs
Nutrition Programs Administration (NPA) Funding of $1721 million is requested for NPA to support Federal management and oversight of USDArsquos investment in nutrition assistance programs The budget includes an increase $52 million to enhance the Federal investment in program administration grantee oversight and protection of the integrity of program operations Participation in SNAP has gone from 172 million recipients per month in 2000 to 337 million participants a month and participation in WIC has grown from 72 million participants a month in 2000 to 91 million participants In addition FNS staff totals 1387 in 2010 to manage a
76
FOOD NUTRITION AND CONSUMER SERVICES
budget over $100 billion well below the 1800 on board in 2000 when the FNS budget was $326 billion
The request includes $9 million to increase efforts to implement scientific evidence-based nutrition guidance and guide effective nutrition education interventions in schools and communities and build and maintain education tools and systems that Americans can use to adopt behaviors that lead to more healthful eating and active lifestyles The 2010 Dietary Guidelines for Americans will be completed and released in 2010 along with enhancements to MyPyramid including interactive applications To help USDA meet its strategic objective to reduce obesity $7 million of this total will be used by CNPP obesity related nutrition education activities The remaining $2 million is needed to translate the recommendations and policy statements in the 2010 Dietary Guidelines for Americans into information that consumers and program administrators can use The Dietary Guidelines and MyPyramid are used to help establish food benefits for the programs and they are central to nutrition education and promotion programs government wide as well as private sector nutrition education and promotion
In addition to enhancing staff resources FNS seeks an additional $55 million to update and integrate its outdated financial management system to control over $100 billion in program funding and to ensure its internal computer infrastructure is operating with current hardware and software less vulnerable to cyber attacks Of this amount $35 million is needed to develop common business processes and financial management systems consistent with USDArsquos Financial Management Modernization Initiatives The $2 million will help expand use of IT tools to improve benefit delivery to program participants to streamline program administration for State and local program partners to improve nutrition education and to enhance program integrity The budget also includes $3 million to fund the Bill Emerson and Mickey Leland Hunger Fellowship programs USDA is directly requesting funds for these activities consistent with the provisions of the 2008 Farm Bill which established the Fellows programs within the Department to address hunger and poverty in the United States as well as international hunger and other humanitarian needs
USDArsquos ability to simplify and improve the programs increase program efforts to improve nutritional outcomes encourage healthy and nutritious diets and expand an obesity prevention campaign is fostered by the Federal administrative efforts supported by Nutrition Program Administration funds
77
FOOD NUTRITION AND CONSUMER SERVICES
Food and Nutrition Service Key Indicators
2009 2010 2011 Actual Estimate Budget
Average Participation Millions Supplemental Nutrition Assistance Program (per month)helliphellip 337 405 433 Free School Lunchhelliphelliphelliphelliphelliphelliphelliphelliphelliphelliphelliphelliphelliphelliphelliphelliphellip 162 184 190 Total School Lunch (per day)helliphelliphelliphelliphelliphelliphelliphelliphelliphelliphelliphelliphellip 312 321 326 Free School Breakfasthelliphelliphelliphelliphelliphelliphelliphelliphelliphelliphelliphelliphelliphelliphelliphellip 79 87 93 Total School Breakfast (per day)helliphelliphelliphelliphelliphelliphelliphelliphelliphelliphellip 110 117 122 WIC (per month)helliphelliphelliphelliphelliphelliphelliphelliphelliphelliphelliphelliphelliphelliphelliphelliphelliphellip 91 95 101 Commodity Supplemental Food Program (CSFP) WIC (per month)helliphelliphelliphelliphelliphelliphelliphelliphelliphelliphelliphelliphelliphelliphelliphelliphellip 002 002 002 Elderly (per month)helliphelliphelliphelliphelliphelliphelliphelliphelliphelliphelliphelliphelliphelliphelliphellip 044 056 058 Food Distribution Program on Indian Reservations (FDPIR) (per month)helliphelliphelliphelliphelliphelliphelliphelliphelliphellip 010 010 010 Unemployment Rate (percent)helliphelliphelliphelliphelliphelliphelliphelliphelliphelliphelliphellip 84 101 95 AveragePersonMonth Food Benefit in $ Supplemental Nutrition Assistance Programhelliphelliphelliphelliphelliphelliphellip $12445 $13293 $13276 WIChelliphelliphelliphelliphelliphelliphelliphelliphelliphelliphelliphelliphelliphelliphelliphelliphelliphelliphelliphelliphelliphelliphellip 4255 4398 4559 CSFP WIC (FNS Funded) ahelliphelliphelliphelliphelliphelliphelliphelliphelliphelliphelliphellip 2655 2800 2775 CSFP Elderly (FNS Funded) ahelliphelliphelliphelliphelliphelliphelliphelliphelliphelliphellip 1877 1947 1918 FDPIR (FNS Funded) ahelliphelliphelliphelliphelliphelliphelliphelliphelliphelliphelliphelliphelliphellip 5454 6042 6090 Per Meal Subsidies Including Commodities in $ b School Lunch Free helliphelliphelliphelliphelliphelliphelliphelliphelliphelliphelliphelliphelliphelliphelliphelliphelliphelliphelliphelliphelliphellip $280 $289 $293 Reduced Price helliphelliphelliphelliphelliphelliphelliphelliphelliphelliphelliphelliphelliphelliphelliphelliphelliphellip 239 248 253 Paid helliphelliphelliphelliphelliphelliphelliphelliphelliphelliphelliphelliphelliphelliphelliphelliphelliphelliphelliphelliphelliphellip 045 045 046 School Breakfast Free helliphelliphelliphelliphelliphelliphelliphelliphelliphelliphelliphelliphelliphelliphelliphelliphelliphelliphelliphelliphelliphellip 166 172 175 Paid helliphelliphelliphelliphelliphelliphelliphelliphelliphelliphelliphelliphelliphelliphelliphelliphelliphelliphelliphelliphelliphellip 025 026 026
a Excludes bonus commodities In 2009 an average of $326 $279 and $285 per month was added in bonus commodities for each participant monthly for CSFPWIC CSFPelderly and FDPIR respectively b Excludes bonus commodities
78
FOOD SAFETY
MISSION AREA AND RELATIONSHIP TO STRATEGIC GOAL
Foodborne illness is recognized as a significant public health problem in the United States which can have a more severe impact on children than healthy adults According to the Centers for Disease Control and Prevention approximately half of the reported foodborne illnesses occur in children These diseases can lead to short and long-term health consequences and sometimes can result in death USDA and other Federal agencies are working in cooperation to ensure that Americans have increased access to safe and healthy food
The Food Safety mission area is the public health mission area of USDA that is responsible for ensuring that the Nationrsquos commercial supply of meat poultry and processed egg products is safe wholesome and properly labeled and packaged This includes products produced domestically in Federally-inspected establishments as well as products imported from foreign countries Funds for the Food Safety mission area support USDA Strategic Goal to ensure that all of Americarsquos children have access to safe nutritious and balanced meals
The mission area includes the activities of the Food Safety and Inspection Service (FSIS) which provides Federal inspection of meat poultry and processed egg products establishments support for similar establishments under State inspection programs development and implementation of the Public Health Information System to enhance science-based data-driven inspections and determination of international equivalence of foreign systems FSIS coordinates the development of its policies with other USDA agencies and other Federal agencies including the Food and Drug Administration (FDA) the Environmental Protection Agency the Centers for Disease Control and Prevention as well as foreign governments and international organizations to ensure an integrated farm-to-table approach to food safety Furthermore the Secretary of Agriculture is the co-chair of the Presidentrsquos Food Safety Working Group (FSWG) created in March 2009 which brings together cabinet secretaries and senior officials to advise the President on issues pertaining to food safety
In addition to FSIS the Food Safety mission area includes the general oversight of the Office of the US Manager of Codex which is the major international mechanism for encouraging fair international trade in food while promoting the health and economic interests of consumers
79
FOOD SAFETY
Budget Authority (Dollars in Millions)
2009 2010 2011 Program Enacted Estimate Budget
Discretionary Federal Food Safety and Inspectionhelliphelliphelliphelliphelliphelliphelliphelliphelliphelliphelliphelliphelliphelliphellip $872 $903 $912 State Food Safety and Inspectionhelliphelliphelliphelliphelliphelliphelliphelliphelliphelliphelliphelliphelliphelliphelliphellip 65 66 65 International Food Safety and Inspectionhelliphelliphelliphelliphelliphelliphelliphelliphelliphelliphelliphellip 18 19 16 Public Health Data Communication Infrastructure Systemhelliphelliphelliphelliphelliphellip 13 27 40 Codex Alimentariushelliphelliphelliphelliphelliphelliphelliphelliphelliphelliphelliphelliphelliphelliphelliphelliphelliphelliphelliphelliphellip 4 4 4
Total Discretionary Programshelliphelliphelliphelliphelliphelliphelliphelliphelliphelliphelliphelliphelliphelliphellip 972 1019 1037
Mandatory Trust Funds (Voluntary Inspection Services)helliphelliphelliphelliphelliphelliphelliphelliphelliphelliphellip 11 9 9 User Fees (OvertimeHoliday Inspection Services)helliphelliphelliphelliphelliphelliphelliphellip (135) (122) (122)
Total FSIS Programshelliphelliphelliphelliphelliphelliphelliphelliphelliphelliphelliphelliphelliphelliphelliphelliphelliphelliphellip $983 $1028 $1046
Organizational Structure To accomplish its functions FSIS employees are located at approximately 6286 slaughtering and processing establishments and import houses and other Federally-regulated facilities Headquarters personnel are responsible for overseeing administration of the program and ensuring that scientific and technological developments are incorporated into inspection procedures The Codex Office reports to the Under Secretary of Food Safety and coordinates all government and non-government participation in the activities of the Codex Alimentarius Commission
Inspection Data Infrastructure and Outbreak Response To ensure that FSIS can support its approximately 8500 Federal in-plant and other frontline personnel the Federal share of State inspection programs and continue to improve the data infrastructure supporting the Nationrsquos food safety system the 2011 budget proposes a discretionary funding level of slightly more than $1 billion an increase of approximately $18 million over 2010 The budget provides the full amount necessary to meet regulatory responsibilities including pay costs and other necessary supporting costs and continues the upward trend in funding over the past decade
80
FOOD SAFETY
FSIS Budget Authority 1200
1000
800
600
400
200
0
Fiscal Year
The 2011 budget requests $40 million an increase of $13 million to continue the deployment and enhancement of the FSIS public-health information infrastructure The additional funds will allow for the purchase of critical equipment the expansion of telecommunications and broadband bandwidth capacity and the improvement of information gathering systems to enhance access of inspection personnel to centralized mission critical systems These new investments are critical to fully leverage the Public Health Information System recently developed by FSIS to enhance the agencyrsquos ability to collect analyze and present data to allow decision making based on relevant timely product and process data utilizing the best science available
In response to key findings of the Presidentrsquos FSWG a $43 million increase is requested for the inter-agency Federal-State Foodborne Disease Outbreak Response Team to allow FSIS to more quickly investigate and respond to outbreaks including faster detection of outbreaks and removal of products from commerce to prevent further illnesses Using these new funds additional staff will be hired to support illness investigation outbreakresponse coordination collaboration on multi-State investigations and proactive public health partner communication outreach In addition these new staff will support a Unified Incident Command System to facilitate communication and decision-making in an emergency a goal of the Presidentrsquos FSWG Taken together this initiative will enhance detection of outbreaks and likely allow for earlier detection of outbreaks which would result in more timely FSIS actions to prevent further illnesses
Similarly in support of key findings of the Presidentrsquos FSWG the 2011 budget proposes a $10 million increase for Baseline Studies and Hazard Analysis and Critical Control Points (HACCP) Verification Program Updates This increase above the 2010 level will allow FSIS to improve surveillance of foodborne pathogens of human-health concern in FSIS-regulated products through significant expansion of the HACCP regulatory sampling and to develop more timely estimates of pathogen prevalence in food products by conducting an additional traditional
$ M
illio
ns
2000 2001 2002 2003 2004 2005 2006 2007 2008 2009 2010 2011
81
FOOD SAFETY
baseline study Accurate timely prevalence estimates for pathogens in food products are critical for evaluation of existing prevention policies and the development of new regulatory strategies FSIS estimates a 25 percent increase in the accuracy of existing performance measures as a result of the proposed increase in HACCP sampling In addition with the ability to conduct a third baseline study in 2011 FSIS will be able to expand its data collection efforts to cover E coli O157H7 in lamb and sheep or Salmonella prevalence in sows and boars
Meat amp Poultry Slaughter Volume Inspected
60
55
50
45
Meat 40
Poultry
35
30
Fiscal Year
Combating Foodborne Illness FSIS is instrumental in helping reduce the level of foodborne illness by targeting common and dangerous pathogens for control In addition to its work ensuring safe and wholesome products are available to the consumer FSIS also conducts public education campaigns to inform consumers about safe food handling methods to decrease the likelihood of foodborne illness from products that were improperly stored handled andor prepared As part of the FSWG FSIS will conduct consumer focus group studies to measure consumer understanding of labeling and other public health messaging and develop new outreach and education strategies based on the results Also as part of the FSWG FSIS will collaborate with FDA to establish a preventative health campaign to increase outreach to clinicians public health professionals and consumers on actions to reduce the risk of foodborne illness
With the funding requested for 2011 FSIS expects to achieve the following performance measures
Bill
ions
of P
ound
s
00 01 02 03 04 05 06 07 08 09
82
Key Performance Measure Overall public exposure to Salmonella from broiler carcasses1
2006
45
2007
73
2008
83
2009
82 in Category
1
2010
90 in Category
1
2011
92 in Category
1
Total illnesses from all FSIS Regulated Products 645609 436343 380259 324175 268092 265411
Percent of establishments with a functional food defense plan2
Large Establishments Small Establishments
Very Small Establishments
NA NA NA
91 53 21
96 64 25
96 64 25
96 69 37
96 74 48
FOOD SAFETY
1The figures represent the proportion of establishments whose two most recent Salmonella test results are equal to or less than 50 percent of the FSIS performance standard for the product class These are the Category 1 establishments considered to have consistent process control As more establishments reach Category 1 status it is expected that fewer people will be exposed to Salmonella from classes of raw products regulated by FSIS
2Food Defense plans are written procedures that food processing establishments should follow to protect the food supply from intentional contamination with chemicals biological agents or other harmful substances Large establishments (ge500 employees) Small establishments (le 499 employees but gt 10) Very Small Establishments (lt10 employees or lt $25 million in annual sales)
FSIS continues to make improvements in its food safety policies and inspection of meat poultry and processed egg products For example FSIS implemented its new bench trim sampling program for E coli O157H7 to detect the pathogen with greater confidence in ground beef FSIS has also developed new pathogen reduction performance standards for control of Salmonella and Campylobacter bacteria in response to recommendations of the Presidents FSWG The goal set by FSIS is to have 90 percent of establishments meeting the new Salmonella standards by the end of calendar year 2010 Similarly FSIS will also post on its Web site compliance guidelines for poultry slaughter establishments including additional pre-harvest recommendations for controlling Salmonella and Campylobacter in poultry To measure the success of these food safety programs FSIS is collaborating with FDA and other FSWG members to develop performance metrics so that all the Federal agencies are consistently measuring success of their food safety programs
The 2008 Farm Bill made several amendments to statutes administered by FSIS and gave the agency other instructions As a result FSIS is developing new regulations to implement mandatory inspection for catfish a program for interstate shipment of State-inspected meat and poultry products requirements that would apply to inspected establishments for recall procedures for documenting process control (HACCP plan) reassessments and for notifying FSIS if they have reason to believe adulterated or misbranded product is in commerce Given the investment to date and the need for considerable stakeholder engagement and regulatory development before the adoption and implementation of a catfish inspection program a decrease
83
FOOD SAFETY
of $103 million from 2010 levels is proposed in the budget for catfish-related activities A level of $5 million for the program is adequate to meet inspection needs in 2011
User Fees and Trust Funds In 2011 FSIS estimates it will collect $131 million through existing user fee and trust fund activities for providing overtime holiday and voluntary inspection services Separately FSIS will submit legislative proposals that would permit two additional user fees in 2011 a user fee that would be collected from plants that have sample failures or require additional inspection activities stemming from a pattern of regulatory non-compliance and a Facility Application and Annual Renewal Activities user fee to cover the increased costs of services above and beyond basic inspection services provided to meat poultry or processed egg products establishments including those services related to compliance risk assessments hazard analyses inspection planning and inspections compliance review and enforcement information technology support product sampling and risk communication Total collections from these proposals are estimated at $4 million and $86 million respectively
84
NATURAL RESOURCES AND ENVIRONMENT
9
Discretionary Programs EQIP
MISSION AND RELATIONSHIP TO STRATEGIC GOALS
A healthy and prosperous America relies on the health of our natural resources and particularly our forests and agricultural working lands The health of Americarsquos 193 million acres of National forests and grasslands and 13 billion acres of farm ranch and private forest lands must be nurtured so that they continue to offer environmental benefits as a source of clean air clean and abundant water and wildlife habitat Americarsquos forests supply communities with clean abundant water shelter wildlife and help us mitigate and adapt to climate change Forests also help generate rural wealth through recreation and tourism through the creation of green jobs and through the production of wood products and energy They are a source of cultural heritage and are a national treasure
The mission of the Natural Resources and Environment area is to promote the conservation and sustainable use of natural resources on the Nations private lands and to sustain production of all the goods and services that the public demands of the national forests The mission area includes two agencies the Natural Resources Conservation Service (NRCS) and the Forest Service (FS)
The two agencies are the primary contributors to achieving the Strategic Goal that ensures our National Forests and private working lands are conserved restored and made more resilient to climate change while enhancing water resources This is accomplished through a variety of programs aimed at preserving and restoring our public and private lands protecting our water resources mitigating the effects of climate change and reducing the risk from catastrophic wildfires NRCS partners with state and local government agencies and private landowners and provides technical and financial assistance to help protect farm and ranch lands and private forestland FS oversees the management of the National Forest System
The NRE mission area primarily through NRCS also has responsibility for implementing most of the Conservation Title of the 2008 Farm Bill which in 2011 will enroll about 305 million acres at a total cost of about more than $3 billion
2011 Conservation Budget Total = $5952 Billion
Wetlands Reserve
All Other Conservation Mandatory
Reserve Programs 33 8
Conservation Stewardship
Programs 14
20 16
85
NATURAL RESOURCES AND ENVIRONMENT
Mill
ions
of A
cres
Farm Bill Conservation Programs Cumulative Acres Enrolled
350
300
250
200
704
267 413
314
564
302
183 23 368
237 346
338
347
75 35
361
204
1104 1312 1483 1652 1772 1897
925
All Other
150 CRP EQIP
100
50
0
2004 2005 2006 2007 2008 2009 2010 2011
86
NATURAL RESOURCES AND ENVIRONMENT
NATURAL RESOURCES CONSERVATION SERVICE (NRCS)
Budget Authority (Dollars in Millions)
2009 2010 2011 Program Enacted Estimate Budget
Discretionary Conservation Operations Conservation Technical Assistancehelliphelliphelliphelliphelliphelliphelliphelliphelliphelliphelliphellip $730 $762 $797 All Other Conservation Operations Programshelliphelliphelliphelliphelliphelliphelliphellip 123 126 127
Total Conservation Operationshelliphelliphelliphelliphelliphelliphelliphelliphelliphelliphelliphelliphellip 853 888 924 Watershed and Flood Prevention Operationshelliphelliphelliphelliphelliphelliphelliphelliphellip 24 30 0 Watershed Rehabilitation Programhelliphelliphelliphelliphelliphelliphelliphelliphelliphelliphelliphelliphellip 40 40 40 Resource Conservation and Developmenthelliphelliphelliphelliphelliphelliphelliphelliphelliphellip 51 51 0 Total Ongoing Discretionary Programshelliphelliphelliphelliphelliphelliphelliphelliphellip 968 1009 964
Recovery Act Watershed and Flood Prevention Operationshelliphelliphelliphelliphelliphelliphelliphelliphellip 290 0 0 Watershed Rehabilitation Programhelliphelliphelliphelliphelliphelliphelliphelliphelliphelliphelliphelliphellip 50 0 0 Total Recovery Act Programshelliphelliphelliphelliphelliphelliphelliphelliphelliphelliphelliphelliphellip 340 0 0 Total Discretionary Programshelliphelliphelliphelliphelliphelliphelliphelliphelliphelliphelliphelliphellip 1308 1009 964
Mandatory Farm Bill Programs Environmental Quality Incentives Programhelliphelliphelliphelliphelliphelliphelliphellip 1067 1180 1208 Wetlands Reserve Programhelliphelliphelliphelliphelliphelliphelliphelliphelliphelliphelliphelliphelliphelliphellip 436 613 502 Conservation Security Programhelliphelliphelliphelliphelliphelliphelliphelliphelliphelliphelliphellip 276 234 212 Conservation Stewardship Programhelliphelliphelliphelliphelliphelliphelliphelliphelliphelliphellip 9 469 629 Agricultural Water Enhancement Programhelliphelliphelliphelliphelliphelliphelliphellip 73 73 74 Farm and Ranch Lands Protection Programhelliphelliphelliphelliphelliphelliphelliphellip 121 150 160 Wildlife Habitat Incentives Programhelliphelliphelliphelliphelliphelliphelliphelliphelliphelliphellip 85 85 73 Grassland Reserve Programhelliphelliphelliphelliphelliphelliphelliphelliphelliphelliphelliphelliphelliphellip 48 101 79 Healthy Forest Reserve Programhelliphelliphelliphelliphelliphelliphelliphelliphelliphelliphelliphelliphellip 10 10 10 Chesapeake Bay Watershedhelliphelliphelliphelliphelliphelliphelliphelliphelliphelliphelliphelliphelliphelliphellip 23 43 72 Agricultural Management Assistance ahelliphelliphelliphelliphelliphelliphelliphelliphellip 15 15 10 Conservation Reserve Program Tech Assist (Reimb)helliphelliphelliphellip (56) (83) (124)
Total Farm Bill Programshelliphelliphelliphelliphelliphelliphelliphelliphelliphelliphelliphelliphelliphellip 2163 2973 3029
Total NRCS Programshelliphelliphelliphelliphelliphelliphelliphelliphelliphelliphelliphelliphelliphelliphelliphelliphellip $3471 $3982 $3993
a Total AMA program also includes funds provided to RMA and AMS
87
NATURAL RESOURCES AND ENVIRONMENT
The Presidentrsquos 2011 budget for NRCS strategically targets funding to high priority areas and effectively supports land conservation wildlife habitat improvement and wetland protection Funding is provided for conservation programs that focus on addressing the needs of priority landscapes in the most need of protection emphasize partnering with local constituents to efficiently implement programs and initiatives and contribute to efforts that address energy conservation renewable energy production and greenhouse gas emissions NRCS will continue to direct financial and technical assistance programs to land owners and users through the USDA Service Centers and through local conservation districts
Conservation Operations (CO) The 2011 budget proposes $924 million for CO which includes $797 million for conservation technical assistance (CTA) as well as $127 million for other CO activities including the Grazing Lands Conservation Initiative Soil Surveys Snow Surveys and Plant Materials Centers At this level the agency will continue to support locally-led cooperative conservation through the unique partnership that has been developed over the years with each conservation district and local stakeholders
The 2011 request for CTA includes an increase of $35 million over 2010 and a redirection of $374 million in Congressional earmarks This will enable NRCS to focus on the highest priority program areas such as improving and streamlining technical assistance delivery to farmers implementing Strategic Watershed Action Teams (SWAT) to target high priority watersheds in the most need of protection and updating the IT infrastructure or Common Computing Environment (CCE) Through CTA the budget projects that nearly 1300 comprehensive nutrient management plans will be applied 77 million will have conservation applied to improve soil quality and 146 million acres of grazing land and forest land will be protected as the result of conservation efforts The estimates reflect the initiative to focus activities on high priority watershed that provide the greatest environmental benefit
Key Performance Measure 2006 2007 2008 2009 2010 2011 CTA Comprehensive nutrient management plans applied (number of plans)
2269 1911 1745 1485 1300 1300
CTA Cropland with conservation applied to improve soil quality (millions of acres)
64 73 83 76 75 77
CTA Grazing land and forest land with conservation applied to protect and improve the resource base (millions of acres)
80 122 165 160 146 146
The budget includes $25 million for the SWAT initiative which will greatly increase the effectiveness of conservation programs Each SWAT will target an identified watershed for a period of 3 to 4 years with the intent of reaching 100 percent of the landowner base eligible for Farm Bill conservation program assistance The additive effect of planned and applied conservation practices would hasten environmental improvement while keeping production agriculture competitive and profitable
88
NATURAL RESOURCES AND ENVIRONMENT
The budget includes $35 million for NRCS to support the Departmentrsquos efforts to modernize and upgrade the CCE for the Service Center Agencies (SCAs) This funding will be used to replace outdated components of the CCE many of which have exceeded their expected life cycles reduce system vulnerabilities to failure and improve the performance and effectiveness of the shared infrastructure These improvements will allow the SCAs to better serve program participants with a more flexible and reliable IT infrastructure and enable the first system-wide refresh of the CCE since the infrastructure was implemented in 2000 In addition as the components of the CCE are replaced USDA will implement a right-sizing process whereby configuration changes will be made to better support the delivery of current and future programs As part of this process the Department will strive to improve system security reduce the long term cost of infrastructure services and improve service reliability Finally the CO budget includes a targeted fee proposal for conservation plans that is assumed to generate $19 million in revenue
Watershed and Flood Prevention Operations (WFPO) WFPO provides technical and financial assistance to local communities and sponsoring organizations to construct flood protection water supply and water quality improvement projects The 2011 budget proposes to terminate funding for this activity because earmarks prevent NRCS from prioritizing these projects on their merits and because benefits are highly localized and local sponsors are expected to assume a greater role in identifying and addressing water resource problems The Recovery Act provided $290 million in non-earmarked funds for this program in 2009 which supported over 195 projects representing more than 28000 acres in 36 States
Watershed Rehabilitation Program This program provides financial and technical assistance to communities for planning and financing the rehabilitation of Federally-constructed flood prevention dams that have reached the end of their design lives The budget includes $40 million in discretionary funds the same as 2010 for technical assistance to help local governments and private landowners plan the rehabilitation of those dams with the greatest potential for failure The Recovery Act provided $50 million for rehabilitation work in 2009 which supported more than two dozen projects in 11 States
Resource Conservation and Development (RCampD) As part of the Administrationrsquos continued commitment to fiscal responsibility the budget proposes to eliminate the RCampD program Begun in 1962 the program was intended to build community leadership skills through the establishment of RCampD councils that would access Federal State and local programs for the communityrsquos benefit After 47 years the program has matured to the point that this goal has been accomplished RCampD councils have developed sufficiently strong State and local ties to secure funding for their continued operation without Federal assistance A number of alternatives to RCampD support also exist including the use of other Federal State and local programs and existing avenues such as those provided through State Technical Committees
Environmental Quality Incentives Program (EQIP) The purpose of EQIP is to provide assistance to landowners who face serious natural resource challenges that impact soil water and related natural resources including grazing lands wetlands and wildlife habitat The 2011 budget proposes $12 billion for EQIP an increase of $28 million over 2010 This would enable nearly 43000 new contracts to participate in the program and would cover more than
89
NATURAL RESOURCES AND ENVIRONMENT
142 million acres The program will continue to emphasize land management practices such as the application of comprehensive nutrient management plans Consistent with the initiative to focus efforts in high priority areas EQIP enrollment acres are expected to fall due to targeting acres with the highest conservation benefit These acres often are relatively smaller farms Despite this reduction in acreage enrollment NRCS anticipates being able to maintain its key performance measures for EQIP (see table below) The Agricultural Water Enhancement Program (AWEP) which is operated under EQIP is funded at $74 million about $1 million more than the 2010 level AWEP promotes the conservation of ground and surface water and the improvement of water quality
EQIP Key Performance Measure 2006 2007 2008 2009 2010 2011 Comprehensive nutrient management plans applied (number of plans) 2774 2490 2520 2019 2000 2000
Cropland with conservation applied to improve soil quality (millions of acres)
34 53 56 48 50 50
Grazing land and forest land with conservation applied to protect and improve the resource base (millions of acres)
122 165 169 172 15 15
Chesapeake Bay Watershed Initiative The Chesapeake Bay Watershed Initiative provides producers conservation assistance through several USDA programs and is funded at $72 million or nearly $29 million more than the 2010 level This program helps agricultural producers improve water quality and quantity and restore enhance and preserve soil air and related resources in the Chesapeake Bay watershed through the implementation of conservation practices
Wetlands Reserve Program (WRP) WRP is a voluntary program in which landowners are paid to retire cropland from agricultural production if those lands are restored to wetlands and protected in most cases with a long-term or permanent easement Landowners receive fair market value for the land and are provided with cost-share assistance to cover the restoration expenses The 2008 Farm Bill authorized the program to enroll up to 3041200 acres through the end of fiscal year 2012 During 2009 funding was provided for WRP to enroll approximately 179000 acres and funding for 2010 allows for up to 250000 acres The 2011 budget request includes $502 million to enroll 192982 acres in 2011 During 2011 it is expected that 140000 acres of wetlands will be created restored or enhanced
Key Performance Measure 2006 2007 2008 2009 2010 2011
WRP Wetlands created 181979 149330 128860 106379 125000 140000restored or enhanced (acres)
90
NATURAL RESOURCES AND ENVIRONMENT
Conservation Security Program The Conservation Security Program was established in the 2002 Farm Bill and is a voluntary program that provides financial and technical assistance on Tribal and private agricultural working lands to support ongoing conservation stewardship The program provides payments to producers who maintain and enhance the condition of natural resources The program was not reauthorized in the 2008 Farm Bill The budget includes $212 million for the Conservation Security Program in 2011 in order to service existing contracts
Conservation Stewardship Program The 2008 Farm Bill replaced the Conservation Security Program with a new Conservation Stewardship Program which is distinguished from the old program in that it encourages participants to undertake new conservation activities in addition to maintaining and managing existing conservation activities Also the new program operates under an annual acreage limitation rather than a funding cap The budget proposes $629 million an increase of $160 million from 2010 for the program to enroll 12 million acres during 2011
Farm and Ranch Lands Protection Program (FRPP) Through this program the Federal Government facilitates and provides funding for the purchase of conservation easements or other interests in land for the purpose of protecting agricultural use and related conservation values by limiting nonagricultural uses of the land FRPP is carried out through existing State Tribal and local governments non-governmental organizations and local farmland protection programs The Farm and Ranch Lands Protection Program is funded at $160 million in 2011 an increase of $10 million over 2010 For 2011 NRCS has set a target to protect 45000 prime unique or important farmland acres from conversion via FRPP
Key Performance Measure 2006 2007 2008 2009 2010 2011
FRPP Prime unique or important farmland protected from conversion to non-agricultural uses by conservation easements acres
46909 38495 27401 38260 40000 45000
Wildlife Habitat Incentives Program (WHIP) The program provides financial and technical assistance to eligible participants to develop habitats for upland wildlife wetland wildlife threatened and endangered species and fish and other types of wildlife The purpose of the program is to create needed wildlife habitat that supports wildlife populations with local State and national significance The budget proposes funding for WHIP at $73 million in 2011 a reduction of $12 million from 2010 Although funding is reduced the Agency has established an ambitious goal for WHIP to contribute to the improvement of 400000 acres of non-Federal land for fish and wildlife habitat during 2011
91
NATURAL RESOURCES AND ENVIRONMENT
Key Performance Measure 2006 2007 2008 2009 2010 2011
WHIP Non-Federal land with conservation applied to improve 175543 388769 316896 335402 350000 400000 fish and wildlife habitat quality acres
Grasslands Reserve Program (GRP) GRP was authorized in the 2002 Farm Bill as a voluntary program to help landowners and operators restore and protect grassland including rangeland pastureland and certain other lands while maintaining the landsrsquo suitability for grazing Participants can enroll acreage in rental agreements with varying lengths or in long-term or permanent easements The program is jointly administered by NRCS and the Farm Service Agency (FSA) which has lead responsibility for rental agreement administration and financial activities NRCS has lead responsibility for technical issues and easement administration The program was initiated in 2003 and reached its statutory funding limit of $254 million in 2007 However the 2008 Farm Bill reauthorized the program for 2009-2012 and capped it at 12 million additional acres GRP is funded at $79 million for 2011 to enroll an additional 245830 acres
Conservation Reserve Program Technical Assistance NRCS provides technical support including land eligibility determinations conservation planning and practice implementation for the Conservation Reserve Program (CRP) The 2011 budget includes $124 million for CRP technical assistance CRP is administered by FSA The program status for 2011 is described on page 34
92
FOREST SERVICE (FS) Budget Authority
(Dollars in Millions) 2009 2010 2011
Program Enacted Estimate Estimate
NATURAL RESOURCES AND ENVIRONMENT
Discretionary Accounts Forest and Rangeland Researchhelliphelliphelliphelliphelliphelliphelliphelliphelliphelliphelliphelliphellip $296 $312 $304 State and Private Forestryhelliphelliphelliphelliphelliphelliphelliphelliphelliphelliphelliphelliphelliphelliphellip 266 308 322 National Forest System Integrated Resource Restoration Priority Watersheds and Job Stabilizationhelliphelliphelliphelliphelliphelliphellip 0 0 50 Collaborative Forest Landscape Restoration Fund ahelliphelliphellip 0 0 40 Restoration and Management of Ecosystemshelliphelliphelliphelliphelliphellip 652 668 604
Total Integrated Resource Restorationhelliphelliphelliphelliphelliphelliphellip 652 668 694 Recreation Heritage and Wildernesshelliphelliphelliphelliphelliphelliphelliphelliphelliphellip 278 285 293
Other NFS Activitieshelliphelliphelliphelliphelliphelliphelliphelliphelliphelliphelliphelliphelliphelliphelliphellip 580 598 599 Total NFShelliphelliphelliphelliphelliphelliphelliphelliphelliphelliphelliphelliphelliphelliphelliphelliphelliphelliphellip 1510 1551 1586 Wildland Fire Activities Preparednesshelliphelliphelliphelliphelliphelliphelliphelliphelliphelliphelliphelliphelliphelliphelliphelliphelliphelliphellip 675 675 1008 Suppression Suppression Activitieshelliphelliphelliphelliphelliphelliphelliphelliphelliphelliphelliphelliphelliphelliphellip 994 923 595 FLAME Fundhelliphelliphelliphelliphelliphelliphelliphelliphelliphelliphelliphelliphelliphelliphelliphelliphelliphellip 0 413 291 Wildland Fire Contingency Reservehelliphelliphelliphelliphelliphelliphelliphelliphellip 0 0 282
Total Suppressionhelliphelliphelliphelliphelliphelliphelliphelliphelliphelliphelliphelliphelliphelliphellip 994 1336 1168 Hazardous Fuels Reduction ahelliphelliphelliphelliphelliphelliphelliphelliphelliphelliphelliphelliphellip 328 340 349 Other Fire Operationshelliphelliphelliphelliphelliphelliphelliphelliphelliphelliphelliphelliphelliphelliphelliphellip 135 166 120 Total Wildland Fire Activitieshelliphelliphelliphelliphelliphelliphelliphelliphelliphelliphellip 2132 2517 2645 Capital Improvement and Maintenancehelliphelliphelliphelliphelliphelliphelliphelliphelliphellip 495 556 438 Land Acquisitionhelliphelliphelliphelliphelliphelliphelliphelliphelliphelliphelliphelliphelliphelliphelliphelliphelliphellip 51 65 75 Other Accountshelliphelliphelliphelliphelliphelliphelliphelliphelliphelliphelliphelliphelliphelliphelliphelliphelliphelliphellip 9 6 6 Subtotal Ongoing Discretionary helliphelliphelliphelliphelliphelliphelliphelliphelliphellip 4759 5315 5377
Emergency Supplemental Funding and Repaymentshelliphelliphelliphellip 200 0 0 Recovery Act
Capital Improvement and Maintenancehelliphelliphelliphelliphelliphelliphelliphelliphellip 650 0 0 Wildland Fire Managementhelliphelliphelliphelliphelliphelliphelliphelliphelliphelliphelliphelliphellip 500 0 0
Total Recovery Act Programshelliphelliphelliphelliphelliphelliphelliphelliphelliphelliphellip 1150 0 0 Total Discretionary helliphelliphelliphelliphelliphelliphelliphelliphelliphelliphelliphelliphelliphelliphellip $6109 $5315 $5377
a $10 million available for Collaborative Forest Landscape Restoration Fund from Hazardous Fuels Reduction in 2010
93
NATURAL RESOURCES AND ENVIRONMENT
Capital Improvement amp
Land Acquisition 1
All Other 13
Wildland Fire Management
43
Budget Authority (Dollars in Millions)
2009 2010 2011 Program Enacted Estimate Estimate
Mandatory Programs Permanent Appropriationshelliphelliphelliphelliphelliphelliphelliphelliphelliphelliphelliphelliphelliphellip $361 $349 $316 Secure Rural Schoolshelliphelliphelliphelliphelliphelliphelliphelliphelliphelliphelliphelliphelliphelliphelliphellip 395 387 348 Trust Fundshelliphelliphelliphelliphelliphelliphelliphelliphelliphelliphelliphelliphelliphelliphelliphelliphelliphelliphelliphellip 238 100 104
Total Mandatoryhelliphelliphelliphelliphelliphelliphelliphelliphelliphelliphelliphelliphelliphelliphelliphellip 994 836 768
Total Forest Service Budget Authorityhelliphelliphelliphelliphelliphelliphelliphellip $7103 $6151 $6145
2011 Forest Service Budget Authority Total = $61 Billion
National Forest System 26
State amp Private Forestry 5
Forest and Rangeland Research
5
Maintenance 7
The Forest Service (FS) with over 30000 staff years is the largest employer in USDA For 2011 the total request for FS ongoing discretionary activities is $54 billion an increase of $79 million over 2010 This budget will restore landscapes improve water quality reduce greenhouse gas emissions implement travel management plans and create green jobs Through targeted administrative savings in the Agencyrsquos cost pools FS will shift $52 million in administrative expenditures to programs Specifically $32 million of efficiencies in information technology and business processes will be borne by employing a centralized data center and other administrative service savings and a new automated contracting system for pre-suppression fire activities will generate $10 million in information technology savings A new automated Human Capital Management system will increase FSrsquo efficiency in handling worker claims by $10 million
94
NATURAL RESOURCES AND ENVIRONMENT
Forest and Rangeland Research For 2011 $304 million is proposed for Forest and Rangeland Research FS maintains the worlds largest forest research organization While its broad mission is to develop knowledge and technology needed to enhance the economic and environmental values of all of the Nations forests the program also supports the specific research needs that arise from managing the National Forest System (NFS) For example FS is using tools developed by this program to evaluate potential fire growth values at risk and cost-efficiency of firefighting on large wildland fire events The budget provides for the completion of a nation-wide comprehensive carbon inventory
State and Private Forestry (SampPF) Through SampPF programs FS addresses forest health concerns on Federal State and private lands A small decrease in Cooperative Fire funding is requested because in FY2011 assistance in preparing for wildfires will be focused to States and local governments that have established standards so that firefighters will be able to defend their communities safely For 2011 total funding for SampPF programs is proposed at $322 million an increase of $14 million above the 2010 level In line with the Presidentrsquos commitment to fully fund the Land and Water Conservation Fund by 2014 a $21 million increase is proposed in the Forest Legacy programmdasha program that cost-shares the purchase of conservation easements to protect nationally prioritized forest lands from development An increase of $1 million is also proposed for the creation of a Community Forest amp Open Space Conservation program to cost share fee-simple purchases of land as authorized by the 2008 Farm Bill The budget proposes an increase of $2 million to implement a competitive cost-share program for the strategic planting of trees for greenhouse gas reduction efforts in urban areas
National Forest System (NFS) FS manages over 193 million acres of public land in 44 States Puerto Rico and the Virgin Islands These lands known collectively as the NFS are managed for multiple uses on a sustained-use basis For 2011 total funding for NFS is proposed at approximately $16 billion a $35 million increase from the 2010 level The Agency has placed a focus on restoring forests for the benefit of watersheds forest health climate and vibrant local economies
bull The budget proposes a new line item ldquoIntegrated Resource Restorationrdquo which combines the Vegetation amp Watershed Management Wildlife amp Fisheries Habitat Management and Forest Products into a single line item This new line item better characterizes the scope of the work that the Agency intends to perform in 2011 Addressing the forest health crisis and restoring our forests will require integrating traditional timber management with other stewardship activities Indeed restoring our forests is not possible without a vibrant forestry sector This new line item will integrate timber management forest restoration biomass production and other stewardship activities on National Forest System lands and will support similar activities funded from other sources on adjacent Federal State and tribal lands This new line item is funded at $694 million which is an increase of $26 million above 2010
bull Within the Integrated Resource Restoration budget line item $40 million is provided for the Collaborative Forest Landscape Restoration Fund This fund will be used for ecological treatments authorized by the Forest Landscape Restoration Act of 2009 contributing to significantly improving watershed conditions creating landscapes that are
95
NATURAL RESOURCES AND ENVIRONMENT
more resilient to climate change and reducing fire risk These funds will be leveraged with local and private resources magnifying the benefits of Federal funding across forest landscapes
bull Within the Integrated Resource Restoration budget line item $50 million is provided for the new Priority Watersheds and Job Stabilization initiative Under this initiative watershed assessments will be conducted of all NFS lands integrating State forest resource assessments into the process Further the agency will use diverse stakeholder groups to prioritize watershed improvement work and a science-based monitoring program will be established to demonstrate a change in watershed condition
bull An increase of $5 million in Recreation is provided for implementation of the Agencyrsquos motor-vehicle-use maps developed as part of its travel management planning process
Wildland Fire Activities Through the Wildland Fire Activities FS protects life property and natural resources on NFS land and an additional 20 million acres on adjacent State and private lands through fee or reciprocal protection agreements For 2011 total funding for these activities is proposed at $26 billion which represents an increase of $128 million above the 2010 level As directed in the 2010 Interior Appropriations conference report to improve transparency FS realigned its suppression and preparedness costs resulting in $333 million being shifted from Suppression to Preparedness Funds are provided in fire preparedness for a minimum of 10480 firefighters The Wildland Fire budget contains $595 million for suppression activities $291 million for the FLAME fund for large-fire suppression activities and $282 million for a contingency reserve which would be used if suppression funds are exhausted In 2011 the agency will allocate $349 million for fuels reduction projects using a clear and accountable method for prioritizing potential projects that will be developed over the next three months The budget provides $15 million for the Forest Biomass for Energy Program and $5 million for the Community Wood Energy Program as authorized by the 2008 Farm Bill
96
NATURAL RESOURCES AND ENVIRONMENT
Key Performance Measure 2006 2007 2008 2009 2010 2011
Percentage of total National Forest System land base for which fire risk is reduced
11 19 21 30 30 31
through movement to a better condition class
Acres of WUI fuels treated to reduce the risk of
1590 1654 1940 1740 1470 1600
catastrophic fire
Percentage of acres treated in the WUI that have been
17 25 36 28 41 75
identified in Community Wildfire Protection Plans
Capital Improvement and Maintenance Capital Improvement and Maintenance funds construction maintenance and decommissioning of buildings recreation sites facilities roads and trails For 2011 total funding for these programs is proposed at $438 million which represents a decrease of $100 million from 2010 Most of the reduction comes from a reduction in funding for Roads activities While $168 million is provided for road maintenance and decommissioning no funding is provided for new road construction or upgrades to existing roads Roads funds will be focused on ldquoright-sizingrdquo the FS road system The budget provides $50 million for the Legacy Roads and Trails program
Land Acquisition The Land Acquisition program protects resources decreases administrative costs and increases visitor access to the National Forests and Grasslands by acquiring parcels of land for inclusion in the NFS For 2011 the budget proposes $75 million in total funding for this program The $10 million increase from 2010 reflects progress toward the Presidentrsquos goal of fully funding the Land and Water Conservation Fund by 2014 In 2011 FS will nationally prioritize the parcels it is considering for acquisition in a manner similar to the Forest Legacy program
97
MARKETING AND REGULATORY PROGRAMS
MISSION AND RELATIONSHIP TO STRATEGIC GOALS
2011 MRP Discretionary Budget Authority Total = $1019 Billion
AMS 10
APHIS 86
GIPSA 4
The economic vitality and quality of life in rural America and the US economy at large depends on a competitive efficient and productive agricultural system US agricultural producers are not simply farmers and ranchers they are often small business owners trying to survive and support their families and rural communities in a challenging global technologically advanced and competitive business environment In an era of market consolidation and intense competition these producers rely on fair and open access to markets and control over their decisions to thrive Agricultural producers also need to safeguard animal and plant resources against the introduction of foreign agricultural pests and diseases
The mission of Marketing and Regulatory Programs (MRP) is to facilitate and expand the domestic and international marketing of US agricultural products to help protect the agricultural sector from plant and animal health threats and to ensure humane care and treatment of certain animals These programs provide the basic infrastructure to improve agricultural market competitiveness for the overall benefit of both consumers and producers of American agriculture Thus the mission area contributes to all of USDArsquos Strategic Goals
USDA also plays a critical role in increasing prosperity and sustainability in our Nationrsquos agricultural system and rural communities Among other efforts MRP uses oversight activities to protect producers from unfair competition and unfair business practices and working with the Department of Justice MRP helps prevent anti-competitive behaviors across the agribusiness sector MRP also assists producers in management and marketing by providing market trend analysis and business and marketing tools This assistance includes developing and overseeing national standards for the production and handling of agricultural products labeled as organic in the National Organic Program among other items MRP programs also help increase the competitiveness of the agricultural sector by enhancing protection of the Nationrsquos agriculture from pests and diseases and increase the efficiency of production and domestic and international marketing of US commodities
98
MARKETING AND REGULATORY PROGRAMS
The Marketing and Regulatory Programs are administered by three agencies the Animal and Plant Health Inspection Service (APHIS) the Agricultural Marketing Service (AMS) and the Grain Inspection Packers and Stockyards Administration (GIPSA)
99
MARKETING AND REGULATORY PROGRAMS
ANIMAL AND PLANT HEALTH INSPECTION SERVICE (APHIS)
Budget Authority (Dollars in Millions)
2009 2010 2011 Program Enacted Estimate Budget
Discretionary Pest and Disease Exclusion Agricultural Quarantine Inspection (AQI) Appropriated helliphelliphelliphelliphelliphelliphelliphelliphelliphelliphelliphelliphelliphelliphelliphelliphelliphelliphellip $27 $29 $27 Fruit Fly Exclusion and Detectionhelliphelliphelliphelliphelliphelliphelliphelliphelliphelliphelliphellip 62 63 64 Overseas Technical and Trade Operationshelliphelliphelliphelliphelliphelliphelliphelliphellip 16 16 17 All Other Pest and Disease Exclusionhelliphelliphelliphelliphelliphelliphelliphelliphelliphelliphellip 55 59 51
Total Pest and Disease Exclusionhelliphelliphelliphelliphelliphelliphelliphelliphelliphelliphellip 160 167 159 Plant and Animal Health Monitoring Animal Health Monitoring and Surveillancehelliphelliphelliphelliphelliphelliphelliphellip 129 122 129 Animal and Plant Health Regulatory Enforcementhelliphelliphelliphelliphelliphelliphelliphelliphelliphelliphelliphelliphelliphelliphelliphelliphelliphelliphelliphellip 14 14 14 Avian Influenza helliphelliphelliphelliphelliphelliphelliphelliphelliphelliphelliphelliphelliphelliphelliphelliphelliphelliphellip 61 60 53 Emergency Management Systemshelliphelliphelliphelliphelliphelliphelliphelliphelliphelliphelliphellip 16 16 16 Pest Detectionhelliphelliphelliphelliphelliphelliphelliphelliphelliphelliphelliphelliphelliphelliphelliphelliphelliphelliphelliphellip 28 28 27 All Other Plant and Animal Health Monitoringhelliphelliphelliphelliphelliphelliphellip 8 9 8
Total Plant and Animal Health Monitoringhelliphelliphelliphelliphelliphelliphellip 256 249 247 Pest and Disease Management Emerging Plant Pestshelliphelliphelliphelliphelliphelliphelliphelliphelliphelliphelliphelliphelliphelliphelliphelliphellip 134 159 158 Wildlife Services Operationshelliphelliphelliphelliphelliphelliphelliphelliphelliphelliphelliphelliphelliphellip 76 78 71 All Other Pest and Disease Managementhelliphelliphelliphelliphelliphelliphelliphelliphellip 135 132 107
Total Pest and Disease Managementhelliphelliphelliphelliphelliphelliphelliphelliphelliphellip 345 369 336 Animal Carehelliphelliphelliphelliphelliphelliphelliphelliphelliphelliphelliphelliphelliphelliphelliphelliphelliphelliphelliphelliphellip 22 22 23 Biotechnology Regulatory Serviceshelliphelliphelliphelliphelliphelliphelliphelliphelliphelliphelliphellip 13 13 19 Veterinary Biologics and Diagnosticshelliphelliphelliphelliphelliphelliphelliphelliphelliphelliphellip 41 43 47 Other Scientific and Technical Serviceshelliphelliphelliphelliphelliphelliphelliphelliphelliphellip 30 32 29 PhysicalOperational Securityhelliphelliphelliphelliphelliphelliphelliphelliphelliphelliphelliphelliphelliphellip 6 6 6 Information Technology Infrastructurehelliphelliphelliphelliphelliphelliphelliphelliphelliphelliphellip 4 4 4 Total Salaries and Expenseshelliphelliphelliphelliphelliphelliphelliphelliphelliphelliphelliphelliphellip 877 905 870 Buildings and Facilitieshelliphelliphelliphelliphelliphelliphelliphelliphelliphelliphelliphelliphelliphelliphelliphelliphellip 5 5 5
Total Ongoing Activitieshelliphelliphelliphelliphelliphelliphelliphelliphelliphelliphelliphelliphelliphellip 881 910 875 Emergency Funding (CCC)helliphelliphelliphelliphelliphelliphelliphelliphelliphelliphelliphelliphelliphelliphellip 29 28 0
Total APHIS Discretionary Programshelliphelliphelliphelliphelliphelliphelliphelliphelliphelliphellip $910 $938 $875
100
MARKETING AND REGULATORY PROGRAMS
(Dollars in Millions)
2009 2010 2011 Program Enacted Estimate Budget
Mandatory Agricultural Quarantine Inspection (AQI) Fees ahelliphelliphelliphelliphelliphellip $147 $186 $190 Trust Fundshelliphelliphelliphelliphelliphelliphelliphelliphelliphelliphelliphelliphelliphelliphelliphelliphelliphelliphelliphelliphellip 17 14 14 Farm Bill
National Clean Plant Networkhelliphelliphelliphelliphelliphelliphelliphelliphelliphelliphelliphelliphellip 5 5 5 Plant Pest and Disease Managementhelliphelliphelliphelliphelliphelliphelliphelliphelliphelliphellip 12 45 50
Total Farm Bill Programshelliphelliphelliphelliphelliphelliphelliphelliphelliphelliphelliphelliphelliphellip 17 50 55 Total Mandatory Programshelliphelliphelliphelliphelliphelliphelliphelliphelliphelliphelliphelliphellip 181 250 259 Total APHIS Programshelliphelliphelliphelliphelliphelliphelliphelliphelliphelliphelliphelliphelliphellip $1091 $1188 $1134
a Total estimated collections are $498 million in 2010 and $508 million in 2011 Of the total $312 million and $318 million are transferred to the Department of Homeland Security in 2010 and 2011 respectively
APHIS works cooperatively with State and local agencies private groups and foreign governments to protect the safety of the Nationrsquos agriculture
The 2011 budget proposes an appropriation of about $875 million of which approximately $870 million is for salaries and expenses and about $5 million for buildings and facilities This total is a net decrease of about $35 million compared to 2010 In general the budget proposes a reallocation of resources from programs that have achieved success (eg cotton pests and screwworm) and for those which progress in eradication is not deemed feasible at this time (eg emerald ash borer) to those efforts where success in eradication may be feasible (eg Asian long-horned beetle and light brown apple moth) The budget also proposes the elimination of earmarks
APHIS supports the Departmentrsquos strategic goal to ensure children have access to safe nutritious and balanced meals Specifically APHIS and other agencies protect agricultural health by minimizing major diseases and pests This outcome is measured as the value of damage prevented and mitigated annually as a result of APHIS activities The measure indicates a decrease between fiscal years 2008 and 2009 as a result of the declining economyrsquos impact on the value of the commodities that are protected by these efforts
Key Performance Measure 2006 2007 2008 2009 2010 2011 Value of damage prevented and mitigated annually as a result of selected plant and animal health monitoring and surveillance efforts
NA 137 138 105 107 111
($ billions)
101
MARKETING AND REGULATORY PROGRAMS
Pest and Disease Exclusion The 2011 budget includes discretionary appropriations of $159 million for pest and disease exclusion The budget includes an increase of $09 million above the 2010 level to cover costs associated with the Foreign Service Pay Modernization Initiative and assist developing countries in strengthening their regulatory capacity to detect and address pests and diseases In recent years APHIS has been successful in driving the screwworm south The budget includes a decrease of $75 million below the 2010 level due to the full operation of a new sterile screwworm production facility closer to the present range of the screwworm In addition to discretionary funding APHIS collects user fees to provide technical support related to agricultural quarantine and inspections that occur at ports of entry These collections are shared with the Department of Homeland Securityrsquos Customs and Border Protection APHIS plans to retain $190 million in 2011
Plant and Animal Health Monitoring The budget requests $247 million for plant and animal health monitoring and surveillance In 2009 USDA collected stakeholder views on the National Animal Identification System (NAIS) through a variety of mechanisms (eg official Federal Registered-announced comment periods focus groups ongoing stakeholder input) This input will be used to revise the NAIS to better meet the needs of the animal agriculture community The requested $142 million will be essential in implementing an improved traceability system The budget requests a net reduction of about $7 million from the Avian Influenza line item due in part to having completed the stockpile of emergency response equipment and supplies The revised level of funding would continue to protect avian health
Pest and Disease Management Programs APHIS provides technical and financial support to help control or eradicate a variety of agricultural health threats This support is provided to various stakeholders ranging from individuals to States The 2011 budget requests $336 million for pest and disease management efforts This includes an increase of $16 million to address the Asian longhorned beetle in Massachusetts This also includes an increase of $10 million to continue efforts initiated with emergency funding to address the light brown apple moth The budget includes a decrease of about $14 million to account for successes in reducing acreage infested with boll weevil and pink bollworm Boll weevil eradication is projected by the end of fiscal year 2010 and the pink bollworm is projected to be eradicated by the end of fiscal year 2012 The budget includes a decrease of about $24 million within the emerald ash borer (EAB) program due to the limited eradication methods available and the need to devote limited resources to other pests where the likelihood of success is greater Due to these limited eradication methods APHIS will pursue a control strategy to minimize the current spread of the pest APHIS will continue survey work for EAB under a management strategy but not the costly tree removal that has been the center of the eradication strategy Tree removal has been ineffective at slowing the spread of EAB Methods development work will continue in 2011 with the possibility of developing an effective means of slowing and reversing the spread of this pest To combat any sudden urgent and unforeseen pest and disease outbreaks the Secretary retains authority to transfer funds from the CCC or other USDA accounts
Animal Care The 2011 budget proposes $23 million for Animal Welfare Act activities which is approximately the same as 2010 The budget requests $09 million for Horse Protection Act activities APHIS will submit legislative proposals to authorize the annual collection of about $12 million in user fees for Animal Welfare activities As recipients of Animal Welfare permits
102
MARKETING AND REGULATORY PROGRAMS
are the direct beneficiaries of animal welfare inspections the proposed user fee will place the cost of providing these services on the recipient rather than the US taxpayer
Scientific and Technical Services Within USDA APHIS has chief regulatory oversight of genetically modified organisms APHIS also develops methods and provides diagnostic support to prevent detect control and eradicate agricultural health threats APHIS as well works to prevent ineffective or harmful animal biologics (eg vaccines) from being marketed In addition APHIS provides Federal leadership in developing methods to address wildlife conflicts Several of these activities have been funded by earmarks which are eliminated in the 2011 budget The budget includes about $19 million an increase of about $6 million for Biotechnology Regulatory Services to assess the risk of genetically modified organisms As the number and complexity of proposed biotechnology products increase additional staff will be required to provide sufficient review This increase supports the Departmental priority of helping promote agricultural production and biotechnology exports by increasing the number of genetically engineered plant lines that are found to be safe by APHIS Finally APHIS will submit legislative proposals to authorize the annual collection of about $5 million in user fees for Biotechnology Regulatory Services activities and about $9 million in user fees for Veterinary Biologics activities As recipients of biotechnology permits and biologics licenses are the direct beneficiaries of many of the services provided by the respective division of APHIS the proposed user fee will place the cost of providing these services on the recipient rather than the US taxpayer
Key Performance Measure 2006 2007 2008 2009 2010 2011 Cumulative number of genetically engineered plant lines reviewed by USDA and found safe for use in the environment 70 73 78 80 85 100
Buildings and Facilities The budget requests $5 million for general repairs and maintenance of APHIS buildings This amount will be used for critical repairs at APHIS facilities
103
MARKETING AND REGULATORY PROGRAMS
AGRICULTURAL MARKETING SERVICE (AMS)
Budget Authority (Dollars in Millions)
2009 2010 2011 Program Enacted Estimate Budget
Discretionary Marketing Services Market Newshelliphelliphelliphelliphelliphelliphelliphelliphelliphelliphelliphelliphelliphelliphelliphelliphelliphelliphelliphelliphelliphelliphelliphellip $33 $34 $35 Egg Surveillance and Standardizationhelliphelliphelliphelliphelliphelliphelliphelliphelliphelliphelliphelliphelliphellip 8 8 8 Market Protection and Promotionhelliphelliphelliphelliphelliphelliphelliphelliphelliphelliphelliphelliphelliphelliphelliphellip 40 43 47 Wholesale Farmers and Alternative Market Developmenthelliphelliphelliphelliphelliphellip 3 3 4 Transportation Serviceshelliphelliphelliphelliphelliphelliphelliphelliphelliphelliphelliphelliphelliphelliphelliphelliphelliphelliphelliphellip 3 3 3
Total Marketing Serviceshelliphelliphelliphelliphelliphelliphelliphelliphelliphelliphelliphelliphelliphelliphelliphelliphelliphellip 87 91 97
Payments to States and Possessions Payments to Stateshelliphelliphelliphelliphelliphelliphelliphelliphelliphelliphelliphelliphelliphelliphelliphelliphelliphelliphelliphelliphelliphellip 2 2 3
Total Payments to States and Possessionshelliphelliphelliphelliphelliphelliphelliphelliphelliphelliphellip 2 2 3
Total Discretionary Programshelliphelliphelliphelliphelliphelliphelliphelliphelliphelliphelliphelliphelliphelliphelliphelliphelliphellip 89 93 100
Mandatory Funds for Strengthening Markets Income and Supply (Section 32) Commodity Program Expenseshelliphelliphelliphelliphelliphelliphelliphelliphelliphelliphelliphelliphelliphelliphelliphelliphellip 964 1056 982 Section 32 Administrative Funds
Marketing Agreements and Orders (MAampO)helliphelliphelliphelliphelliphelliphelliphelliphelliphelliphellip 17 20 20 Web-based Supply Chain Managementhelliphelliphelliphelliphelliphelliphelliphelliphelliphelliphelliphelliphellip 20 10 0 Commodity Purchase Serviceshelliphelliphelliphelliphelliphelliphelliphelliphelliphelliphelliphelliphelliphelliphelliphellip 11 12 13
Total Section 32 Administrative Fundshelliphelliphelliphelliphelliphelliphelliphelliphelliphelliphelliphellip 48 42 33 Total Section 32 Fundshelliphelliphelliphelliphelliphelliphelliphelliphelliphelliphelliphelliphelliphelliphelliphelliphelliphellip 1012 1098 1015
User Fees Perishable Agricultural Commodities Acthelliphelliphelliphelliphelliphelliphelliphelliphelliphelliphelliphelliphellip 7 7 7 Commodity Grading Serviceshelliphelliphelliphelliphelliphelliphelliphelliphelliphelliphelliphelliphelliphelliphelliphelliphellip 150 140 148
Total User Fee Funded Programshelliphelliphelliphelliphelliphelliphelliphelliphelliphelliphelliphelliphelliphelliphellip 157 147 155 Farm Bill Specialty Crop Block Grants (Sec 10109)helliphelliphelliphelliphelliphelliphelliphelliphelliphelliphelliphellip 49 55 55 Farmers Market Promotion Program (Sec 10106)helliphelliphelliphelliphelliphelliphelliphelliphellip 5 5 10 Agricultural Mgmt Assistance Organic Cost-Share (Sec 2801)helliphelliphelliphellip (2) (2) (2)
Total Farm Bill Programshelliphelliphelliphelliphelliphelliphelliphelliphelliphelliphelliphelliphelliphelliphelliphelliphellip 54 60 65
Total Mandatory Programshelliphelliphelliphelliphelliphelliphelliphelliphelliphelliphelliphelliphelliphelliphelliphellip 1223 1305 1235 Total AMS Programshelliphelliphelliphelliphelliphelliphelliphelliphelliphelliphelliphelliphelliphelliphelliphelliphelliphelliphelliphelliphellip $1312 $1398 $1335
The mission of AMS is to facilitate the competitive and efficient marketing of agricultural products in domestic and international markets while ensuring fair trading practices AMS programs benefit producers traders and consumers of US food and fiber products by promoting a strategic marketing perspective that adapts product and marketing decisions to
104
MARKETING AND REGULATORY PROGRAMS
consumer demands changing domestic and international marketing practices and new technology
AMS programs will play key roles in two initiatives The Wholesale Farmers and Alternative Market Development Program together with Rural Development programs will be part of the Government-wide Healthy Food Financing Initiative to support local and regional efforts to increase access to healthy food particularly for the development of grocery stores and other healthy food retailers in urban and rural food deserts and other underserved areas In a related effort the ldquoKnow Your Farmer Know Your Foodrdquo initiative will facilitate the development of local and regional food systems that better connect consumers with local farms create new income opportunities for farmers and place a greater focus on sustainable agricultural practices and nutritious local food Increases are proposed for the Wholesale Farmers and Alternative Market Development Program and the Federal-State Marketing Improvement Program to accomplish program objectives In addition the 2008 Farm Bill provides increased funding for the Farmers Market Promotion Program Some Section 32 funds (described below) will also be employed
Marketing Services AMS administers a variety of programs that enhance the marketing and distribution of agricultural products Activities include the dissemination of market information surveillance of shell egg handling operations development of commodity grade standards protection of producers from unfair marketing practices statistical sampling of commodities for microbiological contamination and pestici de residues development and enforcement of organic standards research and technical assistance aimed at improving efficiency of food marketing and distribution and pesticide recordkeeping
The 2011 budget includes $101 million an increase of $31 million above the 2010 level for the National Organic Program This increase includes $21 million for regulatory review enforcement and development of equivalency agreements plus a one-time increase of $1 million for assisting accredited certifying agents in achieving International Organization for Standardization (ISO) compliance to enhance compliance with program regulations and ensure the integrity of the organic label
In addition an increase of $03 million is in cluded for Market News to support the continuation of data collection and reporting of organic commodity information initiated with $35 million AMS received in 2008 Farm Bill funding
AMS will continue providing assistance to organic producers in specific states through the Agricultural Management Assistance Organic Certification Cost-Share program and using funds from the 2008 Farm Bill for organic producers and handlers nationally through the National Organic Certification Cost-Share Program Cost-share assistance is at a rate of 75 percent of certification costs up to a maximum of $750 per year
The budget includes $38 million an increase of about $09 million for the Wholesale Farmers and Alternative Market Development Program to improve access to local and regionally produced foods as part of the Departmentrsquos ldquoKnow Your Farmer Know Your Foodrdquo initiative
105
MARKETING AND REGULATORY PROGRAMS
Additional funds are included to enhance sampling under the Microbiological Data Program (about $03 million) and maintain effective testing levels of foods and drinking water under the Pesticide Data Program (about $09 million)
Payments to States and Possessions Under the Federal-State Marketing Improvement Program (FSMIP) AMS provides matching funds to State Departments of Agriculture for projects aimed at improving marketing efficiency reducing marketing costs for producers and lowering food costs for consumers The 2011 budget req uests a total of almost $3 million an increase of $13 million for the program nearly doubling of the 2010 funding level The new funding would be targeted to grants that focus on local food marketing opportunities and is part of the ldquoKnow Your Farmer Know Your Foodrdquo initiative
Section 32 Funds Section 32 of the Act of August 24 1935 authorizes the appropriation for each fiscal year of an amount equal to 30 percent of the gross receipts from duties collected under customs laws of the United States during the preceding calendar year These funds are used to encourage domestic consumption of non-price supported perishable commodities and re-establish farmersrsquo purchasing power through a variety of activities including purchases of such commodities and removal of surplus commodities from the marketplace for distribution to Federal nutrition assistance programs such as the National School Lunch Program diversion programs that bring production in line with demand and disaster assistance for producers Section 32 funds are also used to finance the administrative costs associated with the purchase of commodities and developing the specifications used for food procurement throughout the Federal government The 2011 budget request includes an increase of $055 million in Commodity Purchase Services to allow AMS to work with the Food and Nutrition Servicersquos Farm to School Tactical Team to better link local and regionally grown foods to school feeding programs The 2011 budget also proposes a rescission of $50 million in funds available for Section 32
Marketing agreements and orders help stabilize market prices and the supply of milk fruit vegetables and certain specialty crops The orders are administered locally by marketing order committees and market administrators Local activities are funded through assessments on regulated handlers Section 32 funds are used to finance Federal oversight activities for marketing agreements and orders at the national level
User Fee Programs AMS operates programs funded through license or user fees The Commodity Grading Services program provides voluntary commodity grading and classing services for dairy products fresh and processed fruits and vegetables meat and meat products poultry eggs tobacco and cotton In addition AMS enforces the Perishab le Agricultural Commodities Act (PACA) which prohibits unfair and fraudulent practices in the marketing of perishable agricultural commodities by regulating shippers distributors and retailers Full and prompt payment for fresh fruits and vegetables is a key objective of the program
2008 Farm Bill In addition to organic certification cost-sharing AMS will continue other programs at the enacted funding levels provided in the 2008 Farm Bill The Specialty Crop Block Grant Program provides funds to States solely to enhance the competitiveness of specialty crops Specialty crops are defined as fruits vegetables tree nuts dried fruits horticulture and
106
MARKETING AND REGULATORY PROGRAMS
nursery crops (including floriculture) AMS awarded approximately $49 million in specialty crop block grants during 2009 The Farm Bill made $55 million available for 2010 and 2011 Under the Farmersrsquo Market Promotion Program competitive grants are given to help improve and expand domestic farmersrsquo markets roadside stands community-supported agriculture programs agro-tourism activities and other direct producer-to-consumer market opportunities AMS awarded more than $45 million in grants during 2009 The Farm Bill made $5 million available in 2010 and $10 million in 2011
GRAIN INSPECTION PACKERS AND STOCKYARDS ADMINISTRATION (GIPSA)
Budget Authority (Dollars in Millions)
2009 2010 2011 Program Enacted Estimate Budget
Discretionary Salaries and Expenses Grain Regulatory Programhelliphelliphelliphelliphelliphelliphelliphelliphelliphelliphelliphelliphelliphellip $18 $18 $18 Packers and Stockyards Programhelliphelliphelliphelliphelliphelliphelliphelliphelliphelliphellip 22 24 26
Total Salaries and Expenseshelliphelliphelliphelliphelliphelliphelliphelliphelliphelliphelliphellip 40 42 44
Mandatory Inspection and Weighing User Feeshelliphelliphelliphelliphelliphelliphelliphelliphelliphellip (42) (42) (45) Total GIPSA Programshelliphelliphelliphelliphelliphelliphelliphelliphelliphelliphelliphelliphelliphellip $40 $42 $44
GIPSA establishes the official US standards for grain conducts official weighing and grain inspection activities and grades rice dry beans peas lentils and processed grain products The agency regulates and monitors the activities of dealers market agencies stockyard owners live poultry dealers packer buyers packers and swine contractors in order to detect prohibited unfair unjust discriminatory or deceptive and anti-competitive practices in the livestock meat and poultry industries The agency also reviews the fina ncial records of these entities to promote the financial integrity of the livestock meat and poultry industries As such its efforts help USDA enhance international competitiveness of American agriculture and the economic viability and sustainability of rural and farm economies
For 2011 the budget proposes a program level for salaries and expenses of about $89 million of which $45 million is from existing inspection and weighing user fees Of the appropriations request of $44 million about $18 million is devoted to the Grain Regulatory Program including standardization compliance and methods development activities and nearly $26 million to the Packers and Stockyards Program Separately GIPSA will submit a legislative proposal to authorize the collection of fees for the development of grain standards and to amend the Packers and Stockyards Act to provide authority to collect license fees to cover the cost of the program
107
MARKETING AND REGULATORY PROGRAMS
The 2011 budget includes an increase of approximately $18 million to further strengthen enforcement of the Packers and Stockyards Act With additional staff including attorneys GIPSA would bolster direct enforcement and promote greater voluntary compliance with the Act The increase would enable GIPSA to perform approximately 500 additional inspections and compliance reviews and increase industry compliance with the Packers and Stockyards Act to 85 percent
Key Performance Measure 2006 2007 2008 2009 2010 2011
Percent of industry compliance with the Packers and Stockyards Act NA 75 80 80 83 85
108
RESEARCH EDUCATION AND ECONOMICS
MISSION AND RELATIONSHIP TO STRATEGIC GOALS
2011 REE Budget Authority Total = $29 Billion
ARS 41
ERS 3
NASS 6
NIFA 50
Agricultural research is the key element in productivity increases which is central to economic growth in the agricultural sector and typically induces strong effects in other sectors Agricultural research ultimately leads to increased profitability for farmers reduced food costs and greater choice for consumers and improved management of the natural-resource base Major Studies have consistently found that the net social returns from public agricultural research in the United States are high estimated to be at least 35 percent annually Although agricultural research may seem to be an anachronism in todays urban society issues such as the safety of genetically engineered foods pathogens in the food supply and environmental problems make it as important as ever
The Research Education and Economics (REE) mission area provides Federal leadership for the discovery application and dissemination of information and technologies spanning the biological physical and social sciences through agricultural research education and extension activities and economic and statistical analysis which supports all of USDArsquos Strategic Goals The 2011 REE budget serves to ensure a safe sustainable and competitive US food and fiber system and healthy families and communities
REE provides research education and extension that support each of the Departmentrsquos four strategic goals through its intramural and competitive grant programs and through strengthening the capacity of institutions of higher education Through major funding initiatives REE will be the catalyst and premier provider of knowledge for US agriculture by focusing its resources on five key activities Enhance Rural Prosperity Lead Efforts to Mitigate and Adapt to Climate Change Support Agriculture Production in Food-Insecure Nations Increase Access to Nutritious Food and Protect Agricultural Health by Minimizing Major Diseases and Pests to Ensure Access to Safe Plentiful and Nutritious Food
109
RESEARCH EDUCATION AND ECONOMICS
REE responsibilities are carried out by four agencies the Agricultural Research Service conducts intramural research in the area of natural and biological sciences the Economic Research Service performs intramural economic and social science research the National Agricultural Statistics Service conducts the Census of Agriculture and provides the official current statistics on agricultural production and indicators of the economic and environmental welfare of the farm sector and the National Institute of Food and Agriculture partners with land grant and non-land grant colleges and universities in carrying out extramural research higher education and extension activities
110
RESEARCH EDUCATION AND ECONOMICS
AGRICULTURAL RESEARCH SERVICE (ARS)
Budget Authority (Dollars in Millions)
2009 2010 2011 Program Enacted Estimate Budget
Discretionary New ProductsProduct QualityValue Added $103 $105 $113 Livestock Production 80 81 85 Crop Production 199 208 220 Food Safety 106 108 114 Livestock Protection 75 79 83 Crop Protection 198 204 213 Human Nutrition 79 86 91 Environmental Stewardship 220 228 240
Total Research Programs 1060 1099 1159 National Agricultural Library 23 22 23 Repair and Maintenance of Facilities 17 17 18
Total Ongoing Programs 1100 1138 1200 Earmarked Projects 40 42 0
Total Research and Information Activities 1140 1180 1200 Buildings and Facilities 47 71 0
Total Ongoing Discretionary Programs 1187 1251 1200 Collaborative Research Program 3 0 0
Recovery Act Buildings and Facilities 176 0 0
Total Discretionary Programs 1366 1251 1200 Mandatory Trust Funds 24 24 24
Total ARS $1390 $1275 $1224
ARS conducts research to develop new scientific knowledge transfer technology to the private sector to solve technical agricultural problems of broad scope and high national priority and provide access to scientific data The agency also includes the National Agricultural Library the Nations major information resource in the food agricultural and natural resource sciences
111
RESEARCH EDUCATION AND ECONOMICS
2011 ARS Research Budget Authority Total = $12 Billion
Food Safety and Environmental
Product QualityValue
Added 10
Crops 36
Livestock 14
Nutrition 17
Stewardship 20
All Other 3
The 2011 budget requests approximately $12 billion for ARS research and information funding This is an increase of $20 million over the 2010 enacted level Further approximately $42 million in Congressional earmarks have been redirected to high-priority research initiatives including the following
New ProductsProduct QualityValue Added ARS research enhances the economic viability and competitiveness of US agriculture by (1) maintaining the quality of harvested agricultural commodities or enhancing their marketability and (2) expanding domestic and global market opportunities through the development of value-added food and non-food products and processes The 2011 budget provides an increase of $10 million for the establishment of Regional Biofuels Feedstocks Research and Demonstration Centers These five Centers will be managed by ARS and will coordinate efforts for research conducted by other agencies and departments to accelerate the development and deployment of dedicated energy feedstocks including perennial grasses and sustainable feedstock production systems for advanced biofuels suited for best participation within different regions across the nation
Livestock Production ARS conducts research that develops biotechnological methods to use animal germplasm and associated genetic and genomic repositories and databases to ensure an abundant and safe food supply Research also provides the knowledge to assess farm animal well-being reduce animal stress increase animal health and improve the international competitiveness and sustainability of US aquaculture The 2011 budget includes an increase of $3 million for research on breeding and germplasm improvement to enhance food production and security ARS will harness the expanding body of genomic information on beef and dairy cattle swine and trout to improve feed and production efficiency and animal health Information on the relationships between health nutrients growth and feed efficiency can be used to reduce inputs to animal production and optimize animal health and animal product quality characteristics The proposed research will have a wide range of applications including the selection of animals with improved growth efficiency and disease resistance and
112
RESEARCH EDUCATION AND ECONOMICS
the development of genetic-based performance prediction The 2011 budget also includes an increase of $2 million for genomic sequencing to characterize important traits for food animal production and fund research to identify genes that will improve the health growth and productivity of food animals Addressing animal health and feed efficiency is the key to meeting the demands of the growing population and preventing world hunger
Crop Production ARS safeguards and utilizes plant microbial and insect germplasm associated genetic and genomic databases and bioinformatic tools to ensure an abundant high quality safe and inexpensive supply of food feed fiber ornamentals and industrial products To further these goals the 2011 budget provides an increase of $43 million for crop breeding to enhance food production and security The proposed research will expand ARSrsquo capacity to improve genetic resources and cultivars for the benefit of US producers seed companies processors and consumers As a result the research will lead to improved germplasm and varieties with higher yields improved disease and pest resistance and resilience to weather extremes such as high temperature and drought The budget additionally includes an increase of $37 million for ARS to expand activities to identify acquire and secure unprotected genetic resources of plants insects and crop and veterinary associated microbes A broad spectrum of genetic diversity in the form of viable and well documented germplasm will be conserved Vulnerable or threatened genetic resources vital to national security will be safely stored and backed-up in secure facilities The 2011 budget proposes an additional $08 million to specifically address the need to protect the worldrsquos grain supply through grain disease research and conservation Preventing grain disease losses is critical in meeting the demands of a growing population The budget also includes an increase $08 million to support the activities of the World Food Prize Foundation which annually recognizes those who have advanced human development by improving the quantity quality or availability of the worldrsquos food supply
The budget provides an additional $1 million for developing local food systems for the urban Eastern Seaboard Region New research will assess the capacity to produce food locally that will meet the needs of a large urban population by examining the constraints imposed by environmental economic social and geographic factors This information will be used to assess local food production potential and economic viability and supports the Departmentrsquos Know Your Farmer Know Your Food Initiative Finally an increase of $05 million is proposed for research to determine the role of pathogens and other stress factors in Colony Collapse Disorder of honey bees and how to mitigate their effects
Food Safety ARS research helps to ensure that the food supply is safe for consumers and that food and feed meet foreign and domestic regulatory requirements This research also focuses on the reduction of the hazards of both introduced and naturally occurring toxins in foods and feed including pathogenic bacteria viruses parasites chemical contaminants mycotoxins and naturally occurring toxins produced by plants The 2011 budget includes an additional $5 million to enhance research to safeguard the Nationrsquos food supply from foodborne pathogens by developing and validating management practices to prevent pre-harvest pathogen contamination of produce and post-harvest strategies to eliminate pathogen contamination Research will also develop and validate detection and sensing technologies for pathogens toxins and chemical residues
113
RESEARCH EDUCATION AND ECONOMICS
Livestock Protection ARS conducts research to reduce economic losses from infectious genetic and metabolic diseases of livestock and poultry and to eliminate the losses to animal production and products caused by arthropod diseases and arthropod borne trauma This research also reduces the risk to humans from arthropod borne zoonotic diseases and enhances the safety of animal products The budget includes an increase of $3 million for improved animal protection to enhance food production and security Research will focus on the development of preventive measures to combat priority infectious diseases of livestock and poultry Specific projects include the development of new measures to control bovine tuberculosis and bovine respiratory diseases Furthermore diagnostics vaccines and biotherapeutics designed to convey disease resistance in genetically-defined animal populations will be produced As a result of this research catastrophic losses from new and emerging diseases will be avoided
Crop Protection ARS provides the knowledge to reduce losses caused by plant diseases by defining practices that are effective and affordable and that maintain environmental quality Research also provides the technology to manage pest populations below economic damage thresholds by the integration of environmentally compatible strategies that are based on an increased understanding of the pestrsquos biology and ecology The 2011 budget includes an increase of $48 million for crop protection research to expand grain crop germplasm collection enhancement and breeding programs Specific projects will focus on improving citrus germplasm to protect from citrus greening breeding oats wheat and barley to be resistant to Ug99 and other cereal rusts and breed legume germplasm with enhanced disease and pest protection Breeding and disease protection research will increase the production capacity of perennial grains and optimize perennial grain production systems Additionally sustainable agricultural systems will be developed through research on long-term crop rotation trials This research will expand the adoption of sustainable agricultural practices and address a critical aspect of world hunger by avoiding catastrophic losses from new and emerging cereal diseases The budget also includes an increase of $33 million for research on the Departmentrsquos scientific collections USDA has principal responsibility for safeguarding the Nationrsquos insect systematics collections which are needed for developing pest management strategies identifying new pollinators and the testing of natural enemies needed for biological control of insects and weeds Through this research crops and veterinary animals will be better protected from pests through biological control plant resistance and the development of other management tools
Human Nutrition ARS centers conduct basic and applied research to identify and understand how nutrients and other bioactive food components affect the health of diverse populations including children the elderly pregnant and lactating women and healthy adults The ultimate goal of this food-based agricultural research is to identify foods and diets coupled with genetics and physical activity that will sustain and promote health throughout life The 2011 budget proposes an increase of $64 million for research on childrenrsquos nutrition and health Obesity prevalence among adults and children in the US has tripled in the last 30 years During this time the Dietary Guidelines for Americans (DGA) have been issued by USDA in partnership with the Department of Health and Human Service Despite the DGA forming the basis for Federal food and nutrition policy and the requirement of USDA nutrition assistance programs to provide meals that meet the DGA few Americans have diets that come
114
RESEARCH EDUCATION AND ECONOMICS
close to the recommendations The proposed increase will fund a study to identify barriers and facilitators to following the DGA in multiple locations nationwide in children and adults and in three racial and ethnic groups New methods to motivate behavior change in eating and physical activity will result from this research Finally funds will be used to enhance the nutrition information available through wwwNutritiongov With most nutrition information aimed at adults ARS will significantly increase information about childrenrsquos healthy weight gain during growth and ways by which obesity can be prevented
Environmental Stewardship This broad area of research emphasizes the development of technology and scientific knowledge that will allow producers to manage conserve and protect the Nationrsquos soil water and air resources while optimizing agricultural productivity The 2011 budget proposes an additional $54 million to conduct research that will enhance American agriculturersquos adaptability to a changing global climate ARS will increase the resilience of crops so they can thrive in variable and extreme environments as well as focus on mitigating the effects of climate change by ensuring the availability of water through improved management Research will also develop production systems that will provide a sustainable balance of crop production carbon soil sequestration and net greenhouse gas emissions The budget also proposes an increase of $63 million for research which will develop sustainable agricultural practices through the integration of information and technologies leading to enhanced productivity profitability energy efficiency and natural resource stewardship for American farmers and ranchers New practices will be developed that utilize on-farm resources and natural processes which reduce the need for inputs and reduce production costs and risks The development of these improved agricultural systems will increase the long-term financial viability competitiveness and sustainability of farms and rural communities and increase food and fiber security for the US and the world
National Agricultural Library (NAL) NAL is one of four national libraries in the United States and provides access to scientific agricultural data NAL continues to expand its efforts to provide this information through the Internet thereby increasing the efficiency of its information management and delivery The budget proposes an increase of $15 million for developing information and tools on all facets of sustainable agriculture including information on sustainable and regenerative crop and livestock farming systems ecological pest management renewable energy options for farms direct marketing practices and community food systems organic production certification and marketing and crop and livestock diversification
Buildings and Facilities Repair and Modernization ARS has over 100 research facilities throughout the US and abroad many collocated with other USDA agencies and university partners The budget does not include funding for ARS building and facilities projects but rather provides an increase of $175 million for a review of USDA research facilities to develop a Department-wide capital improvement strategy to guide future investments consistent with priority program goals
115
RESEARCH EDUCATION AND ECONOMICS
NATIONAL INSTITUTE OF FOOD AND AGRICULTURE (NIFA)
Budget Authority (Dollars in Millions)
2009 2010 2011 Program Enacted Estimate Budget
Discretionary Research and Education Activities $691 $792 $839 Extension Activities 474 495 479 Integrated Activities 57 60 25 Native American Endowment Fund Interest 4 4 4
Total Ongoing Discretionary Programshelliphelliphelliphelliphelliphelliphelliphellip 1226 1351 1347 Mandatory Risk Management Education 5 5 5 Native American Endowment Fund 12 12 12 Hispanic-Serving Ag-Colleges Endowment Fund 0 0 10 Farm Bill
Biomass Research and Development 20 28 30 Organic Agriculture Research and Education Initiative 18 20 20 Healthy Urban Enterprise Development Center 1 1 1 Beginning Farmer and Rancher Development Program 18 19 19 Specialty Crop Research Initiative 50 50 50 Biodiesel Fuel Education Program (1) (1) (1) Community Food Projects (5) (5) (5) Total Farm Bill Programs 107 118 120
Total Mandatory Programs 124 135 147 Total NIFA $1350 $1486 $1494
NIFA formerly the Cooperative State Research Education and Extension Service has the primary responsibility for providing linkages between the Federal and State components of a broad-based national agricultural research extension and higher education system NIFA provides funding for projects conducted in partnership with the State Agricultural Experiment Stations the State Cooperative Extension System land grant universities colleges and other research and education institutions Federal funds are distributed to universities and institutions by statutory formula funding competitive awards and grants NIFA is responsible for administering USDAs primary competitive research grants program the Agriculture and Food Research Initiative (AFRI) which supports investigator-initiated research with strong potential to contribute to major breakthroughs in agricultural science
116
RESEARCH EDUCATION AND ECONOMICS
National Institute of Food and Agriculture Budget Authority
(Dollars in Millions) 2009 2010 2011
Program Enacted Estimate Budget Discretionary Formula Grants
Smith-Lever 3 (bampc)helliphelliphelliphelliphelliphelliphelliphelliphelliphelliphelliphelliphelliphelliphelliphelliphellip $289 $298 $298 Hatch Acthelliphelliphelliphelliphelliphelliphelliphelliphelliphelliphelliphelliphelliphelliphelliphelliphelliphelliphelliphelliphellip 207 215 215 1890 Research and Extensionhelliphelliphelliphelliphelliphelliphelliphelliphelliphelliphelliphelliphelliphellip 86 91 91 McIntire-Stennis Cooperative Forestryhelliphelliphelliphelliphelliphelliphelliphelliphelliphellip 28 29 29 Animal Health and Disease Researchhelliphelliphelliphelliphelliphelliphelliphelliphelliphelliphellip 3 3 3 Total Formula Grantshelliphelliphelliphelliphelliphelliphelliphelliphelliphelliphelliphelliphelliphelliphelliphellip 613 636 636
Agriculture and Food Research Initiativehelliphelliphelliphelliphelliphelliphelliphelliphelliphellip 202 262 429 Integrated Activities - Section 406helliphelliphelliphelliphelliphelliphelliphelliphelliphelliphelliphellip 42 45 0 Pest ControlManagement Activitieshelliphelliphelliphelliphelliphelliphelliphelliphelliphelliphellip 26 26 26 Sustainable Agriculture Federal-State Matching Grantshelliphelliphelliphellip 0 0 10 Sustainable Agriculture Research and Extensionhelliphelliphelliphelliphelliphelliphellip 19 19 20 Higher Education Programshelliphelliphelliphelliphelliphelliphelliphelliphelliphelliphelliphelliphelliphelliphellip 40 47 52 Native American Endowment Fund Interesthelliphelliphelliphelliphelliphelliphelliphelliphellip 4 4 4 Federally-Recognized Tribes Extension Programhelliphelliphelliphelliphelliphellip 3 3 5 1890 Facilitieshelliphelliphelliphelliphelliphelliphelliphelliphelliphelliphelliphelliphelliphelliphelliphelliphelliphelliphelliphellip 18 20 20 Extension Services at 1994 Institutionshelliphelliphelliphelliphelliphelliphelliphelliphelliphellip 3 4 5 Expanded Food and Nutrition Education Program (EFNEP)helliphellip 66 68 68 Federal Administrationhelliphelliphelliphelliphelliphelliphelliphelliphelliphelliphelliphelliphelliphelliphelliphelliphellip 17 18 18 Electronic Grants Administration Systemhelliphelliphelliphelliphelliphelliphelliphelliphelliphellip 2 2 5 Regional Diagnostic Networkhelliphelliphelliphelliphelliphelliphelliphelliphelliphelliphelliphelliphelliphellip 10 10 10 Veterinary Medical Services Acthelliphelliphelliphelliphelliphelliphelliphelliphelliphelliphelliphelliphellip 3 5 5 Other Research Extension and Integrated Programshelliphelliphelliphelliphellip 30 37 34
Subtotal Ongoing Discretionaryhelliphelliphelliphelliphelliphelliphelliphelliphelliphelliphelliphellip 1098 1206 1347 Earmarked Projects and Grantshelliphelliphelliphelliphelliphelliphelliphelliphelliphelliphelliphelliphelliphellip 128 141 0 Improved Nutritional Delivery of Food Assistance Grantshelliphelliphellip 0 4 0
Total Discretionary Programshelliphelliphelliphelliphelliphelliphelliphelliphelliphelliphelliphellip 1226 1351 1347 Mandatory Risk Management Education 5 5 5 Native American Endowment Fund 12 12 12 Hispanic-Serving Ag-Colleges Endowment Fund 0 0 10 Farm Bill Programs 107 118 120 Biodiesel Fuel Education Program (1) (1) (1) Community Food Projects (5) (5) (5)
Total NIFA $1350 $1486 $1494
117
RESEARCH EDUCATION AND ECONOMICS
2011 NIFA Budget Authority
$747 800 $731 $731 $704 700
600
500
400
300
200
100
0
Formula Competitive Earmarks
Does not include endowment funds
The 2011 budget requests approximately $135 billion in discretionary funding for NIFA While in total this amount is the same as the 2010 level it reflects a major redirection of funding priorities The Department has greatly increased funding of competitive grants maintained funding for capacity building through formula programs and eliminated $141 million in Congressional earmarks High-priority research initiatives include the following
Agriculture and Food Research Initiative (AFRI) AFRI is the Nationrsquos premier competitive peer-reviewed research program for fundamental and applied sciences in agriculture It is broad in scope with programs ranging from fundamental science to farm management and community issues The 2011 budget proposes a substantial increase in competitive research funding with $4288 million for AFRI an increase of $167 million over 2010 Included in this amount is an increase of $34 million for the Departmentrsquos alternative and renewable energy research initiative to develop high-quality cost-effective feedstocks for biofuel production that do not affect the food supply $50 million for global climate change research to develop mitigation capabilities and adaptive capacities for agricultural production $13 million for international food security to expand research education and extension efforts on plant and animal diseases that threaten public health and agricultural production $20 million for an integrated food safety research program which will improve our understanding of disease-causing microorganisms their products and naturally occurring contaminants in meats poultry seafood and fresh fruits and vegetables and $50 million in nutrition and obesity prevention research
Electronic Grants Administration With increased funding for AFRI a significant rise in the number of applications is anticipated requiring increased efficiency of the grant-making processes and systems Additionally the breadth and types of grants made will increase
$ M
illio
ns
$527 $604
$128 $141
2009 2010 2011
118
RESEARCH EDUCATION AND ECONOMICS
requiring the development of new grant management tools The 2011 budget proposes an increase of $3 million for improved grants management systems which will substantially lower the transaction costs of applying for an AFRI or other NIFA competitive grant while increasing proposal receipt and acceptance speeds and accuracy
Sustainable Agriculture Research and Education (SARE) Program SARE advances agricultural innovations that improve profitability environmental stewardship and quality of life As part of the Departmentrsquos Know Your Farmer Know Your Food Initiative the 2011 budget proposes an increase of $10 million for the creation of a new Federal-State Matching Grant SARE Program to assist in the establishment and enhancement of State sustainable agriculture research education and extension programs The matching requirement will leverage State or private funds and build the capabilities of American agriculture in becoming more productive and sustainable Additionally an increase of $076 million is proposed to support research and extension that will improve soil quality and carbon sequestration save energy and mitigate climate change as well as provide education and training for Cooperative Extension the Natural Resources Conservation Service and other agriculture professionals These program increases will bring total SARE funding to $30 million
Key Performance Measure 2006 2007 2008 2009 2010 2011 The number of farmers and ranchers that gained an economic environmental or quality-of-life benefit from a change in practice learned by participating in a SARE project 9610 10240 10849 11300 11800 12300
Hispanic-Serving Agricultural Colleges and Universities Endowment Fund With the Hispanic community being the fastest growing sector of the American population an investment in the Hispanic-Serving Agricultural Colleges and Universities (HSACU) is needed to ensure that these institutions can effectively compete for NIFA competitive grants Section 7129 of the 2008 Farm Bill authorized the establishment of an endowment fund for HSACU The 2011 budget proposes an increase of $10 million to establish the fund which will lead to significant and measurable advancement of Hispanic and other students in the food and agricultural sciences Funding will come from the annual interest generated by the Endowment
Extension Education on Tribal Lands and at 1994 Institutions The Federally-Recognized Tribes Extension Program supports extension agents who establish programs in agriculture community development families and societal issues facing Native Americans The budget proposes an increase of $23 million to more than double the number of tribes being served by extension and will be used to develop and deploy sustainable production practices Additionally the budget proposes an increase of $1 million for Extension Services at the 1994 Institutions to conduct an Expanded Food and Nutrition Education Program (EFNEP) pilot in a number of Native American communities through a competitive grant process The 1994 Institutions which have demonstrated initial success in providing nutrition education
119
RESEARCH EDUCATION AND ECONOMICS
would partner with 1862 Institutions with a strong EFNEP or other innovative program to provide culturally relevant nutrition education
Formula Funding NIFA provides formula funding for research and extension at 1862 1890 and 1994 land-grant institutions schools of forestry and schools of veterinary medicine The 2011 budget continues to maintain funding for these important capacity building programs at the 2010 enacted level This funding will allow institutions to sustain the matching requirement that by many of these programs have thereby allowing Federal funds to leverage non-Federal resources Programs include Hatch Act and Smith-Lever programs which fund research and extension at 1862 Institutions Evans-Allen 1890 Extension and the 1890 Facilities Grants program which fund agricultural research extension and the acquisition and improvement of facilities equipment and libraries at 1890 institutions including Tuskegee University and West Virginia State University the Tribal Colleges Endowment Fund which distributes the interest earned by an endowment and the Tribal Colleges Education Equity Grants Program which strengthens higher education instruction at the thirty-four 1994 land-grant institutions the McIntire-Stennis Cooperative Forestry Program which funds research on forests and related rangelands at eligible 1862 and 1890 land-grants and institutions offering training in the forestry sciences the Animal Health and Disease Research Program which funds research at accredited colleges of veterinary medicine and State Agricultural Experiment Stations that conduct animal health and disease research and the Expanded Food and Nutrition Education Program carried out by the 1862 and 1890 land-grant institutions to assist low-income individuals in acquiring the knowledge skills and changed-behavior necessary for nutritionally sound diets
1890 Land Grant Institutions The 2011 budget request maintains the historic funding levels for programs supporting 1890 land-grant institutions and includes approximately $91 million for 1890 research and extension formula programs -- $485 million for research and $427 million for extension Additionally the request includes $198 million for 1890 Facilities Grants and $183 million Capacity Building Grants at 1890 Institutions The budget for these programs reflects Administrationrsquos policy to maintain these important programs
Rural Revitalization through Education In support of the Presidentrsquos initiative to make education a national priority the budget proposes a total increase of $5 million for rural education to sustain rural communities This includes an increase of $25 million for the Secondary Education Two-Year Postsecondary Education and Ag in the K-12 Classroom (SPECA) Grants Program and $25 million for the Higher Education Institution Challenge (HEC) Grants Program With SPECA funds NIFA will focus on improving the economic health and viability of rural communities through the development of degree programs emphasizing new and emerging employment opportunities in agriscience and agribusiness fields With HEC funds NIFA will assist academic institutions in rural areas to prepare students for emerging science technology engineering and mathematics (STEM) opportunities
Veterinary Medicine Loan Repayment Program (VMLRP) The 2011 budget maintains funding for the VMLRP at the 2010 enacted level of $48 million The VMLRP will repay the
120
RESEARCH EDUCATION AND ECONOMICS
loans of veterinarians who agree to serve in geographic and veterinary practice areas that have a shortage of food animal veterinarians NIFA published the interim rule for the program on July 9 2009 which established the process and procedures for designating veterinarian shortage situations and administering the VMLRP
121
RESEARCH EDUCATION AND ECONOMICS
ECONOMIC RESEARCH SERVICE (ERS)
Budget Authority (Dollars in Millions)
2009 2010 2011 Program Enacted Estimate Budget
Economic Research Servicehelliphelliphelliphelliphelliphelliphelliphelliphelliphelliphelliphelliphelliphellip $80 $82 $87
ERS provides economic and other social science information and analysis on agriculture food the environment and rural development ERS produces such information and analyses to inform policy and program decisions made across the spectrum of USDA missions and supplies them in outlets that are also accessible to USDA stakeholders and the general public The 2011 budget requests approximately $87 million in program funding an increase of $8 million in program initiatives which is offset by $3 million in terminations of low-priority programs
Community Access to Local Foods The availability of fresh healthy local foods depends to a large extent on the local food environment and community characteristics Food choices are critically important to health outcomes and these choices are shaped or significantly influenced by these factors Therefore the budget proposes an increase of $2 million which supports the Departmentrsquos Know Your Farmer Know Your Food initiative to develop data and conduct economic research on the access to affordable and nutritious local foods in low-income communities With USDA playing a key role in developing policies that address diet and health this initiative will lead to a better understanding of how the Department can better support sustainable and healthy communities
Data Improvement As part of a government-wide data improvement program the 2011 budget includes an increase of $4 million to strengthen the Departmentrsquos statistical protocols and tools This includes a $2 million initiative to establish a structure among statistical agencies headed by ERS to improve data access develop tools for data processing and increase the utility of Federal data The 2011 budget also includes an increase of $2 million for an administrative data pilot project Administrative data information collected in conjunction with administering government programs provide an opportunity for increasing the statistical ability to understand and address critical policy issues The goal of this initial project will be (1) to understand how nutrition assistance and other government programs work together to provide a social safety net and (2) how nutrition assistance and health care policy work together to improve dietary and health outcomes
Data Integrity and Confidentiality As part of the Administrationrsquos expense cutting measures USDA will consolidate seven existing leases ERS will physically relocate from its current location as part of this move To maintain the integrity and confidentiality of its data at secure sites the budget proposes an increase of approximately $1 million for storage and security at separate locations with the ability to control and monitor access
122
RESEARCH EDUCATION AND ECONOMICS
NATIONAL AGRICULTURAL STATISTICS SERVICE (NASS)
Budget Authority (Dollars in Millions)
2009 2010 2011 Program Enacted Estimate Budget
Discretionary Agricultural Estimates $115 $124 $132 Census of Agriculture 37 38 33
Total Discretionary Programs $152 $162 $165
The mission of NASS is to provide timely accurate and useful statistics in service to US agriculture NASS statistics provide the information necessary to keep agricultural markets stable and efficient and to help maintain a consistency for all users of agricultural statistics The 2011 budget requests approximately $164 million in program funding This includes an increase of $63 million in initiatives which is offset by $51 million in terminations of low-priority programs which includes eliminating a land tenure survey that duplicates work being conducted under the Agricultural Resource Management Survey
County Estimates Program The agricultural estimation program provides a comprehensive set of unbiased data covering most agricultural commodities as well as economic environmental and rural demographic data As part of this program NASS has produced county-level statistics for selected commodities that impact billions of dollars of government payments The budget includes an increase of $5 million to improve the data quality of the County Estimates program which is used within the Department to administer crop insurance programs that provide US farmers a safety net ensuring protection against unstable growing conditions as well as crop revenue support programs emergency assistance payments and the Conservation Reserve Program
Climate Change Also within the agricultural estimation program an increase of $08 million is proposed that will allow NASS to enhance its remote sensing activities NASS continues to utilize advanced technologies to monitor agricultural acreage and production This initiative is proposed to increase the number of States in which cropland data is collected and provide NASS the ability to collect additional data on crop conditions as well as fill an important informational gap on soil moisture conditions and drought monitoring
Organic Agriculture Study Also within the agricultural estimation program an increase of $05 million is proposed that will allow NASS to develop an ongoing data series on organic production handling and distribution With this information USDA and others will be able to monitor the financial health and continued growth and evolution of this important sector
Census of Agriculture The 2011 budget includes funding to support the second year of the 2012 Census of Agriculturersquos five year cycle The Census of Agriculture provides comprehensive data on the agricultural economy with national State and county level details The census data are relied upon to measure trends and new developments in the agricultural sector
123
OFFICE OF THE SECRETARY
Budget Authority (Dollars in Millions)
2009 2010 2011 Program Enacted Estimate Budget
Discretionary Office of the Secretaryhelliphelliphelliphelliphelliphelliphelliphelliphelliphelliphelliphelliphelliphelliphellip $15 $19 $20 Healthy Food Financing Initiativehelliphelliphelliphelliphelliphelliphelliphelliphelliphelliphellip 0 0 35 Mandatory Trust Fundshelliphelliphelliphelliphelliphelliphelliphelliphelliphelliphelliphelliphelliphelliphelliphelliphelliphelliphelliphellip 1 1 1 Total OSEChelliphelliphelliphelliphelliphelliphelliphelliphelliphelliphelliphelliphelliphelliphelliphelliphelliphelliphelliphellip $16 $20 $56
OFFICE OF THE SECRETARY
The Office of the Secretary (OSEC) assisted by the Deputy Secretary the Subcabinet and members of their immediate staffs directs and coordinates the work of the Department This involves providing policy direction for all areas of the Department and maintaining liaisons with the Executive Office of the President members of Congress and the public The 2011 budget requests $20 million for OSEC to fund on-going policy leadership tribal consultation and cross-cutting trade and biotechnology activities Of this amount there is an increase of $2 million for the Office of Ecosystem Services and Markets within the Office of the Under Secretary for Natural Resources and Environment to coordinate USDA involvement in the development of market opportunities for services provided by American agriculture such as carbon sequestration and water conservation
Healthy Food Financing Initiative provides funding for a new multi-year Healthy Food Financing Initiative (HFFI) that will increase the availability of affordable healthy foods in underserved urban and rural communities particularly through the development or equipping of grocery stores and other healthy food retailers To support this initiative the Departments of Agriculture Health and Human Services and Treasury have partnered to make available over $400 million in financial and technical assistance to community development financial institutions other nonprofits public agencies and businesses with sound strategies for addressing the healthy food needs of communities These organizations will use Federal grants below-market rate loans loan guarantees and tax credits to attract private sector capital for an even greater investment in projects that increase access to fresh produce and other healthy foods The goal is to substantially reduce the number of food deserts in our nation over the next several years
Food deserts are communities in which residents do not have access to affordable and healthy food options Instead of supermarkets and grocery stores these communities are typically served by fast food restaurants and convenience stores that offer little if any healthy options This lack of access contributes to a poor diet and can lead to higher levels of obesity and other diet-related diseases such as diabetes and heart disease Most often these communities are economically distressed and less attractive under conventional financing to retailers of healthy food But effective local programs have shown that well-targeted financing and technical assistance can
124
OFFICE OF THE SECRETARY
create viable business outcomes and access to healthier food options Targeting federal financial assistance to these areas will not only increase the supply of healthy foods and create new markets for farmers but also create jobs and support broader development efforts to revitalize distressed communities
The 2011 budget requests an additional $35 million for financial and technical assistance including assistance made through the Intermediary Relending Program of the Rural Development mission area In addition $15 million would be reserved from specified accounts in the Rural Development and Marketing and Regulatory Program mission areas to provide additional support for the initiative Not more than 10 percent of the available funding for any one program would be subject to the reserve Through the initiative funds will be made available from a number of loan grant promotion and other programs to provide financial and technical assistance to support market planning and promotion efforts as well as infrastructure and operational improvements designed to stimulate consumer demand enhance marketing expand demand and retail outlets for farm products and increase availability of locally and regionally produced foods
125
DEPARTMENTAL ACTIVITIES
DEPARTMENTAL MANAGEMENT
Budget Authority (Dollars in Millions)
2009 2010 2011 Program Enacted Estimate Budget
Discretionary Office of Advocacy and Outreachhelliphelliphelliphelliphelliphelliphelliphelliphelliphelliphellip 0 $2 $7 Assistant SecretaryOffice of Civil Rightshelliphelliphelliphelliphelliphelliphelliphellip $22 24 25 Office of the Chief Financial Officerhelliphelliphelliphelliphelliphelliphelliphelliphelliphellip 6 7 7 Office of Budget and Program Analysishelliphelliphelliphelliphelliphelliphelliphelliphellip 9 9 9 Office of the Chief Information Officerhelliphelliphelliphelliphelliphelliphelliphelliphellip 18 62 64 Departmental Administrationhelliphelliphelliphelliphelliphelliphelliphelliphelliphelliphelliphelliphellip 27 28 31 Contracting and Acquisition Workforce Traininghelliphelliphelliphellip 0 0 6 Provincial Reconstruction Teamshelliphelliphelliphelliphelliphelliphelliphelliphelliphelliphellip 0 13 a Office of Homeland Securityhelliphelliphelliphelliphelliphelliphelliphelliphelliphelliphelliphellip 1 2 2 Agriculture Buildings and Facilitieshelliphelliphelliphelliphelliphelliphelliphelliphelliphellip 244 293 278 Hazardous Materials Managementhelliphelliphelliphelliphelliphelliphelliphelliphelliphelliphellip 5 5 5 Total Ongoing Discretionary Programshelliphelliphelliphelliphelliphelliphelliphellip 332 445 434 Recovery Act Agriculture Buildings and Facilitieshelliphelliphelliphelliphelliphelliphelliphelliphelliphellip 24 0 0 Total Discretionary Programshelliphelliphelliphelliphelliphelliphelliphelliphelliphelliphellip 356 445 434 Mandatory Farm Bill Biobased Markets Programhelliphelliphelliphelliphelliphelliphelliphelliphelliphelliphelliphelliphellip 2 2 2 Outreach for Socially Disadvantaged Farmers bhelliphelliphelliphelliphellip 15 20 20 Total Farm Bill Programshelliphelliphelliphelliphelliphelliphelliphelliphelliphelliphelliphelliphelliphellip 17 22 22 Total Departmental Managementhelliphelliphelliphelliphelliphelliphelliphelliphelliphellip $373 $467 $456
a Funded within the Foreign Agricultural Service b This program was administered by the National Institute of Food and Agriculture (NIFA) in 2009 at $15 million and transferred to the Office of Advocacy and Outreach in 2010
Departmental Management (DM) is responsible for providing coordination of all administrative functions and support for policy activities of the Department DM is leading the Departmentrsquos implementation of Management Initiatives to
bull Transform USDA into a model Federal agency for effective program delivery by enhancing leadership encouraging employee inclusion and focusing on improving customer and employee satisfaction
126
DEPARTMENTAL ACTIVITIES
bull Provide civil rights leadership to USDA employees applicants and customers by increasing the use of an early resolution process a form of alternative dispute resolution for civil rights and equal employment opportunity complaints reducing the inventory of program civil rights complaints and analyzing field operations for systemic improvements
bull Coordinate outreach efforts to increase access to USDA programs and services among women and minority farmers
bull Use resources more effectively by incorporating into the Departmentrsquos current management practices new strategies and policies that increase performance and encourage efficiency and alignment of activities to the Departmentrsquos strategic goals
bull Implement modern information technology systems and policies in a cost effective manner that improve program delivery along with internal and external communications capabilities to better serve USDA constituents
bull Maximize USDA ldquogreenrdquo operations by increasing the use of bio-preferred products and alternative energy increasing recycling and decreasing water and energy usage at USDA facilities
bull Improve Departmental emergency preparedness and security measures to protect USDA employees and the public to ensure the continued delivery of USDA products and services
bull Enhance human resources policies and practices to develop a USDA workforce that is more representative of the National population and has the necessary skills to ensure the continued and improved delivery of services by the Department
The 2011 budget proposes funding to maintain the staffing levels necessary to lead implementation of these initiatives and provide adequate service delivery by Departmental Management while addressing key policy issues related to outreach human resources procurement system improvements financial management and information technology security and capital investment These efforts are critical to making the Department an efficient effective and discrimination-free organization that delivers the best return on taxpayersrsquo investments
The Office of Advocacy and Outreach (OAO) was established by the 2008 Farm Bill to increase the accessibility of USDA programs to underserved constituents OAO activities include overseeing the Advisory Committees on Minority Farmers and Beginning Farmers and Ranchers administering the Outreach to Socially Disadvantaged Farmers Grant Program (section 2501 Program) overseeing the activities of the Office of Small Farms Coordination and the Farm Worker Coordinator managing the 1994 1890 and Hispanic Serving Institutions (HSI) Programs and coordinatingconducting other outreach functions The 2011 budget requests $7 million for OAO to carry out these responsibilities and the provisions of the Farm Bill related to outreach to beginning small and socially disadvantaged farmers ranchers and rural communities Of this amount $4 million is requested for agricultural labor grants authorized under section 14204 of the 2008 Farm Bill This program was funded through Rural
127
DEPARTMENTAL ACTIVITIES
Development in 2010 at the same level OAO will operate this program in 2011 to assist agricultural employers and farm workers by improving the supply stability safety and training of the agricultural labor force In addition to the requested funding OAO will receive $20 million provided by the 2008 Farm Bill for the 2501 Grants Program and an estimated $6 million in reimbursements for programs previously managed by the Office of Civil Rights (1890 and 1994 Programs) and the Agricultural Research Service (HSI Program)
The Assistant Secretary for Civil Rights and the Office of Civil Rights (OCR) provide policy guidance leadership coordination and training and complaint prevention and processing for the Department and the agencies OCRrsquos mission is to facilitate the fair and equitable treatment of USDA customers and employees and ensure the delivery and enforcement of civil rights programs and activities Through its efforts OCR strives to 1) foster a positive civil rights climate at USDA 2) process Equal Employment Opportunity (EEO) and program complaints in a timely efficient and cost effective manner 3) reduce and prevent EEO and program complaints through training and guidance and 4) offer alternative dispute resolution services The 2011 budget requests $24 million for OCR to meet the Administrationrsquos commitment to improving USDArsquos handling of civil rights matters An additional $09 million is requested to reflect the transfer of the Office of the Assistant Secretary for Civil Rights to Departmental Management from the Office of the Secretary
The Office of the Chief Financial Officer (OCFO) provides overall direction and leadership in the development of financial management policies and systems and produces the Departmentrsquos consolidated financial statements and Strategic Plan OCFO also oversees the provision of administrative accounting payroll and related systems for USDA and other agencies through operation of the National Finance Center The 2011 budget requests $7 million for OCFO to continue its leadership and oversight of the Departmentrsquos financial management process and implementation of the Federal Funding Accountability and Transparency Act the Improper Payments Information Act and Departmental travel and debarment and suspension policies
The Office of Budget and Program Analysis (OBPA) provides analyses and information to the Secretary and other senior policy officials to support informed decision-making regarding the Departmentrsquos programs and policies and budget legislative and regulatory actions OBPA also serves the key functions of providing information to the Office of Management and Budget and the Appropriations Committees related to the USDA budget and coordinating the Departmentrsquos implementation of the Farm Bill including providing relevant implementation and mandatory spending information to the Authorizing Committees The 2011 budget requests $9 million for OBPA for the continued delivery of analyses and support provided to USDA policy officials
The Office of the Chief Information Officer (OCIO) provides policy guidance leadership and coordination for the Departments information management technology investment and cyber security activities in support of USDA program delivery The 2011 budget requests $64 million for OCIO to fund on-going activities including efforts to improve the Departmentrsquos cyber security posture This request includes an increase of $2 million to expand a Department-wide cyber security initiative to address deficiencies in the USDA network and IT systems Through this initiative OCIO conducts network security assessments to identify system vulnerabilities and operates a Security Operations Center that provides continuous cyber security
128
DEPARTMENTAL ACTIVITIES
monitoring of the Departmentrsquos network Through the continued implementation of the initiative the Department will address critical vulnerabilities while establishing a multi-layer cyber security structure
Departmental Administration (DA) provides overall direction leadership and coordination for the Departmentrsquos management of human resources ethics property procurement facilities management small and disadvantaged business utilization programs and the regulatory hearing and administrative proceedings conducted by the Administrative Law Judges and the Judicial Officer The 2011 budget requests $31 million for DA including a $17 million increase to implement a human resources initiative in USDA that will build the capabilities of the Departmentrsquos workforce through leadership development and veteran hiring In addition the budget requests a decrease in DA of $13 million to reflect the transfer of the agriculture reconstruction and stabilization activities in Afghanistan and Iraq to FAS As these efforts support implementation of Presidential strategies by providing technical experts who serve as advisors to key government ministries and serve on civilian-military command units including Provincial Reconstruction Teams these international activities are best managed through FAS
DA also manages the BioPreferred Program as authorized in section 9002 of the Farm Bill as amended by the 2008 Farm Bill As part of this program DA is developing a USDA Certified Biobased Label that will allow manufacturers and vendors of qualifying biobased products market their products utilizing the label In support of the programrsquos implementation the budget requests $03 million to ensure the integrity and enforce compliance with the USDA Certified Biobased Labeling Program This funding will be used to establish an audit program through which DA can monitor the use of the biobased label in the market to ensure that vendors and manufacturers of biobased products are utilizing the label in accordance with program regulations In addition to the funding request USDA is also seeking legislative authority to assess monetary penalties for violations of the Biobased Labeling regulations to further ensure the programrsquos integrity and public trust in the label
In addition the 2011 budget requests $65 million to support a Government-wide Contracting and Acquisition Workforce Training initiative The requested funding will allow USDA to implement training recruitment and retention activities for the Departmentrsquos procurement workforce that is responsible for over $5 billion in annual procurement for the Department These workforce efforts along with procurement system improvements will allow USDA to achieve substantial cost savings and avoidances in the contracting and acquisition activities across all agencies
The Office of Homeland Security (OHS) provides a central homeland security oversight and assistance capability within USDA OHS is responsible for providing oversight and coordination of the Departmentrsquos preparation and response to matters of homeland security importance In addition OHS is responsible for providing the protective services for the Secretary and Deputy Secretary of Agriculture The 2011 budget requests $2 million for OHS to continue its leadership and coordination of Departmental security matters to ensure that USDA is prepared for potential threats or emergency situations
129
DEPARTMENTAL ACTIVITIES
The request for Agriculture Buildings and Facilities (Ag BampF) and Rental Payments for 2011 is $278 million The account provides funding for the rental payments to the General Services Administration (GSA) and security services payments to the Department of Homeland Security (DHS) This account is also responsible for all maintenance utilities and administration of the more than 25 million square feet in the two USDA headquarters buildings The 2011 budget includes $179 million for payments to GSA for rent and $14 million to DHS for building security The budget requests an increase of $14 million for a total of $28 million in 2011 to continue modernization of the Departmentrsquos South Building As the building houses over 5800 USDA employees it is critical that the facility be renovated to eliminate environmental hazards and to reduce overall energy consumption The renovation project will preserve and restore the historic features of the building replace antiquated heating and cooling systems plumbing and electrical systems eliminate environmental hazards such as asbestos and lead paint provide accommodations for persons with disabilities and create modern and efficient office space The 2011 budget also requests authority to use prior year unobligated balances to pay deficiencies incurred between 2004 and 2008
In addition the budget also proposes an increase of $04 million to implement provisions of the Departmentrsquos Employee Satisfaction and Wellness Program This funding will allow USDA to improve offerings to employees related to healthy eating options and physical fitness USDA employees and the over 100000 annual visitors to the South Building cafeteria would be educated on the importance of farmers and origins of the food being served while employees would benefit from improved fitness equipment and class offerings in the fitness center
The Hazardous Materials Management (HMM) Program provides for the efficient management and cleanup of hazardous materials on facilities and lands under the jurisdiction custody and control of the Department and the prevention of releases of hazardous substances from USDA facilities The 2011 budget requests $5 million for the HMM program to conduct cleanup and remediation activities to seek repayment from polluters for hazardous materials cleanup responsibilities and to assist the Department in meeting Federal environmental laws
130
DEPARTMENTAL ACTIVITIES
DEPARTMENTAL STAFF OFFICES
Budget Authority (Dollars in Millions)
2009 2010 2011 Program Enacted Estimate Budget
Discretionary Office of the Chief Economisthelliphelliphelliphelliphelliphelliphelliphelliphelliphelliphelliphellip $11 $13 $13 National Appeals Divisionhelliphelliphelliphelliphelliphelliphelliphelliphelliphelliphelliphelliphelliphellip 15 15 15 Office of Communicationshelliphelliphelliphelliphelliphelliphelliphelliphelliphelliphelliphelliphelliphellip 10 10 10 Office of the General Counselhelliphelliphelliphelliphelliphelliphelliphelliphelliphelliphelliphellip 42 44 46 Total Discretionary Programshelliphelliphelliphelliphelliphelliphelliphelliphelliphelliphellip 78 82 84 Mandatory Farm Bill Biodiesel Fuel Education Programhelliphelliphelliphelliphelliphelliphelliphelliphelliphellip 1 1 1
Total Mandatory Programshelliphelliphelliphelliphelliphelliphelliphelliphelliphelliphelliphellip 1 1 1
Total Departmental Staff Officeshelliphelliphelliphelliphelliphelliphelliphelliphelliphellip $79 $83 $85
The Departmental Staff Offices provide legal and economic support and communications coordination for the Departmentrsquos program activities These offices are vital to USDArsquos success in creating opportunities for Americarsquos farmers ranchers and rural communities by providing economic analyses and legal counsel to the Departmentrsquos policy officials and decision makers The 2011 budget proposes funding to ensure that these offices maintain the staffing levels needed to provide leadership oversight and coordination
The Office of the Chief Economist (OCE) advises the Secretary and Department officials on the economic implications of Department policies programs and proposed legislation and serves as the focal point for the Departmentrsquos economic intelligence analysis and review related to domestic and international food and agriculture markets OCE also provides advice and analysis on bioenergy new uses of agricultural products sustainable development agricultural labor and global climate change The 2011 budget requests $13 million for OCE to continue its support of USDA policy officials and the dissemination of agricultural economic information
The National Appeals Division (NAD) conducts evidentiary administrative appeal hearings and reviews arising from program operations of the Rural Development mission area the Farm Service Agency the Risk Management Agency and the Natural Resources Conservation Service The 2011 budget requests $15 million for NAD to continue activities to increase the fairness of program delivery by the Service Center Agencies
The Departmentrsquos Office of Communications (OC) provides leadership and coordination for the development of communication strategies for the Department and plays a critical role in disseminating information about USDArsquos programs to the general public The 2011 budget
131
DEPARTMENTAL ACTIVITIES
requests $10 million for OC to continue to develop effective communications strategies that make USDA programs and operations more open and transparent to the public
The Office of the General Counsel (OGC) provides legal oversight counsel and support to the Departmentrsquos agencies The 2011 budget requests $46 million for OGC including an increase of $15 million to ensure that OGC has the resources to conduct necessary training and travel and other activities for which funding has been reduced in recent years to cover salary expenses This funding will be used to maintain and improve OGC service delivery to the entire Department
132
OFFICE OF INSPECTOR GENERAL
OFFICE OF INSPECTOR GENERAL
Budget Authority (Dollars in Millions)
2009 2010 2011 Program Enacted Estimate Budget
Discretionary Ongoing Appropriationshelliphelliphelliphelliphelliphelliphelliphelliphelliphelliphelliphelliphelliphelliphellip $86 $89 $90 Recovery Act Fundinghelliphelliphelliphelliphelliphelliphelliphelliphelliphelliphelliphelliphelliphelliphellip 22 0 0 Total Office of Inspector Generalhelliphelliphelliphelliphelliphelliphelliphelliphelliphellip $108 $89 $90
The Office of Inspector General (OIG) conducts and supervises audits to prevent and detect fraud waste and abuse and to improve the effectiveness of USDA programs and operations As the law enforcement arm of USDA OIG also investigates criminal activity involving the Departmentrsquos programs and personnel The 2011 budget requests $90 million for OIG for audit and investigation review of the Departmentrsquos programs This funding includes an increase of $04 million to support the Council of Inspectors General for Integrity and Efficiency to coordinate Federal efforts to improve program delivery The Council was established under the authority of the Inspector General Reform Act of 2008 In addition an increase of $02 million is requested for training activities to ensure that OIG effectively meets professional training standards and necessary federal law enforcement requirements
133
APPENDIX
UNITED STATES DEPARTMENT OF AGRICULTURE (Dollars in Millions)
Budget Authority
Change 2009 2010 2011 2010 to
AGENCYPROGRAM Enacted Estimate Budget 2011 FARM AND FOREIGN AGRICULTURAL SERVICES Farm Service Agency Discretionary Programshelliphelliphelliphelliphelliphelliphelliphelliphelliphelliphelliphelliphelliphelliphelliphelliphelliphelliphelliphelliphelliphellip $1645 $2082 $1846 -$236 Mandatory Programs (excluding CCC)helliphelliphelliphelliphelliphelliphelliphelliphelliphelliphelliphelliphelliphelliphelliphellip 704 527 892 365
Recovery Acthelliphelliphelliphelliphelliphelliphelliphelliphelliphelliphelliphelliphelliphelliphelliphelliphelliphelliphelliphelliphelliphelliphelliphelliphelliphellip 120 230 0 -230 Other Supplementalshelliphelliphelliphelliphelliphelliphelliphelliphelliphelliphelliphelliphelliphelliphelliphelliphelliphelliphelliphelliphelliphelliphellip 71 0 0 0 Commodity Credit Corporation Programs (mandatory)helliphelliphelliphelliphelliphelliphelliphelliphelliphellip 13061 11819 11482 -337 Total Farm Service Agencyhelliphelliphelliphelliphelliphelliphelliphelliphelliphelliphelliphelliphelliphelliphelliphelliphelliphelliphelliphellip 15601 14658 14220 -438
Risk Management Agency Discretionary Programshelliphelliphelliphelliphelliphelliphelliphelliphelliphelliphelliphelliphelliphelliphelliphelliphelliphelliphelliphelliphelliphellip 77 80 83 3 Mandatory Programshelliphelliphelliphelliphelliphelliphelliphelliphelliphelliphelliphelliphelliphelliphelliphelliphelliphelliphelliphelliphelliphelliphellip 6767 6455 7613 1158 Total Risk Management Agencyhelliphelliphelliphelliphelliphelliphelliphelliphelliphelliphelliphelliphelliphelliphelliphelliphelliphellip 6844 6535 7696 1161
Foreign Agricultural Service Discretionary Programs (excluding PL 480)helliphelliphelliphelliphelliphelliphelliphelliphelliphelliphelliphelliphelliphellip 265 390 468 78 Mandatory Programshelliphelliphelliphelliphelliphelliphelliphelliphelliphelliphelliphelliphelliphelliphelliphelliphelliphelliphelliphelliphelliphelliphellip 584 439 386 -53 Recovery Acthelliphelliphelliphelliphelliphelliphelliphelliphelliphelliphelliphelliphelliphelliphelliphelliphelliphelliphelliphelliphelliphelliphelliphelliphelliphellip 25 90 22 -68 PL 480 (discretionary)helliphelliphelliphelliphelliphelliphelliphelliphelliphelliphelliphelliphelliphelliphelliphelliphelliphelliphelliphelliphelliphellip 1229 1693 1693 0 PL 480 (supplemental appropriations)helliphelliphelliphelliphelliphelliphelliphelliphelliphelliphelliphelliphelliphelliphelliphellip 1095 0 0 0
Total Foreign Agricultural Servicehelliphelliphelliphelliphelliphelliphelliphelliphelliphelliphelliphelliphelliphelliphelliphelliphellip 3198 2612 2569 -43 Total Farm and Foreign Agricultural Serviceshelliphelliphelliphelliphelliphelliphelliphelliphelliphelliphellip 25644 23805 24485 681
RURAL DEVELOPMENT Rural Utilities Service Discretionary Programshelliphelliphelliphelliphelliphelliphelliphelliphelliphelliphelliphelliphelliphelliphelliphelliphelliphelliphelliphelliphelliphellip 660 694 643 -51 Recovery Acthelliphelliphelliphelliphelliphelliphelliphelliphelliphelliphelliphelliphelliphelliphelliphelliphelliphelliphelliphelliphelliphelliphelliphelliphelliphellip 3804 0 0 0 Total Rural Utilities Servicehelliphelliphelliphelliphelliphelliphelliphelliphelliphelliphelliphelliphelliphelliphelliphelliphelliphelliphelliphellip 4464 694 643 -51
Rural Housing Service Discretionary Programshelliphelliphelliphelliphelliphelliphelliphelliphelliphelliphelliphelliphelliphelliphelliphelliphelliphelliphelliphelliphelliphellip 1754 1893 1705 -188 Recovery Acthelliphelliphelliphelliphelliphelliphelliphelliphelliphelliphelliphelliphelliphelliphelliphelliphelliphelliphelliphelliphelliphelliphelliphelliphelliphellip 320 0 0 0 Total Rural Housing Servicehelliphelliphelliphelliphelliphelliphelliphelliphelliphelliphelliphelliphelliphelliphelliphelliphelliphelliphellip 2074 1893 1705 -188
Rural Business - Cooperative Service Discretionary Programshelliphelliphelliphelliphelliphelliphelliphelliphelliphelliphelliphelliphelliphelliphelliphelliphelliphelliphelliphelliphelliphellip 132 190 205 15 Mandatory Programshelliphelliphelliphelliphelliphelliphelliphelliphelliphelliphelliphelliphelliphelliphelliphelliphelliphelliphelliphelliphelliphelliphellip 239 364 159 -205 Recovery Acthelliphelliphelliphelliphelliphelliphelliphelliphelliphelliphelliphelliphelliphelliphelliphelliphelliphelliphelliphelliphelliphelliphelliphelliphelliphellip 145 0 0 0 Total Rural Business - Cooperative Servicehelliphelliphelliphelliphelliphelliphelliphelliphelliphelliphelliphelliphellip 516 554 364 -190
Rural Development Salaries and Expenses Discretionary Programshelliphelliphelliphelliphelliphelliphelliphelliphelliphelliphelliphelliphelliphelliphelliphelliphelliphelliphelliphelliphelliphellip 193 202 232 30 Recovery Acthelliphelliphelliphelliphelliphelliphelliphelliphelliphelliphelliphelliphelliphelliphelliphelliphelliphelliphelliphelliphelliphelliphelliphelliphelliphellip 131 0 0 0 Total Salaries and Expenseshelliphelliphelliphelliphelliphelliphelliphelliphelliphelliphelliphelliphelliphelliphelliphelliphelliphelliphellip 324 202 232 30
Total Rural Developmenthelliphelliphelliphelliphelliphelliphelliphelliphelliphelliphelliphelliphelliphelliphelliphelliphelliphelliphellip 7378 3343 2944 -399 FOOD NUTRITION AND CONSUMER SERVICES Food and Nutrition Service Discretionary Programshelliphelliphelliphelliphelliphelliphelliphelliphelliphelliphelliphelliphelliphelliphelliphelliphelliphelliphelliphelliphelliphellip 7239 7659 8025 366 Mandatory Programshelliphelliphelliphelliphelliphelliphelliphelliphelliphelliphelliphelliphelliphelliphelliphelliphelliphelliphelliphelliphelliphelliphellip 69065 75335 87656 12321 Recovery Acthelliphelliphelliphelliphelliphelliphelliphelliphelliphelliphelliphelliphelliphelliphelliphelliphelliphelliphelliphelliphelliphelliphelliphelliphelliphellip 5945 10460 11936 1476 Other Supplementalshelliphelliphelliphelliphelliphelliphelliphelliphelliphelliphelliphelliphelliphelliphelliphelliphelliphelliphelliphelliphelliphelliphellip 0 400 0 -400
Total Food Nutrition and Consumer Serviceshelliphelliphelliphelliphelliphelliphelliphelliphelliphelliphellip 82249 93854 107617 13763 FOOD SAFETY Food Safety and Inspection Service Discretionary Programshelliphelliphelliphelliphelliphelliphelliphelliphelliphelliphelliphelliphelliphelliphelliphelliphelliphelliphelliphelliphelliphellip 972 1019 1037 18 Mandatory Programshelliphelliphelliphelliphelliphelliphelliphelliphelliphelliphelliphelliphelliphelliphelliphelliphelliphelliphelliphelliphelliphelliphellip 11 9 9 0
Total Food Safetyhelliphelliphelliphelliphelliphelliphelliphelliphelliphelliphelliphelliphelliphelliphelliphelliphelliphelliphelliphelliphelliphellip 983 1028 1046 18 NATURAL RESOURCES AND ENVIRONMENT Natural Resources Conservation Service Discretionary Programshelliphelliphelliphelliphelliphelliphelliphelliphelliphelliphelliphelliphelliphelliphelliphelliphelliphelliphelliphelliphelliphellip 968 1009 964 -45 Mandatory Programshelliphelliphelliphelliphelliphelliphelliphelliphelliphelliphelliphelliphelliphelliphelliphelliphelliphelliphelliphelliphelliphelliphellip 2163 2973 3029 56 Recovery Acthelliphelliphelliphelliphelliphelliphelliphelliphelliphelliphelliphelliphelliphelliphelliphelliphelliphelliphelliphelliphelliphelliphelliphelliphelliphellip 340 0 0 0 Total Natural Resources Conservation Servicehelliphelliphelliphelliphelliphelliphelliphelliphelliphelliphelliphellip 3471 3982 3993 11
134
APPENDIX
UNITED STATES DEPARTMENT OF AGRICULTURE (Dollars in Millions)
Budget Authority Change
2009 2010 2011 2010 to AGENCYPROGRAM Enacted Estimate Budget 2011
Forest Service Discretionary Programshelliphelliphelliphelliphelliphelliphelliphelliphelliphelliphelliphelliphelliphelliphelliphelliphelliphelliphelliphelliphelliphellip 4759 5315 5377 62 Mandatory Programshelliphelliphelliphelliphelliphelliphelliphelliphelliphelliphelliphelliphelliphelliphelliphelliphelliphelliphelliphelliphelliphelliphellip 994 836 768 -68 Recovery Acthelliphelliphelliphelliphelliphelliphelliphelliphelliphelliphelliphelliphelliphelliphelliphelliphelliphelliphelliphelliphelliphelliphelliphelliphelliphellip 1150 0 0 0 Other Supplementalshelliphelliphelliphelliphelliphelliphelliphelliphelliphelliphelliphelliphelliphelliphelliphelliphelliphelliphelliphelliphelliphelliphellip 200 0 0 0 Total Forest Servicehelliphelliphelliphelliphelliphelliphelliphelliphelliphelliphelliphelliphelliphelliphelliphelliphelliphelliphelliphelliphelliphelliphellip 7103 6151 6145 -6
Total Natural Resources and Environmenthelliphelliphelliphelliphelliphelliphelliphelliphelliphelliphelliphellip 10574 10133 10138 5 MARKETING AND REGULATORY PROGRAMS Animal and Plant Health Inspection Service Discretionary Programshelliphelliphelliphelliphelliphelliphelliphelliphelliphelliphelliphelliphelliphelliphelliphelliphelliphelliphelliphelliphelliphellip 881 910 875 -35 Mandatory Programshelliphelliphelliphelliphelliphelliphelliphelliphelliphelliphelliphelliphelliphelliphelliphelliphelliphelliphelliphelliphelliphelliphellip 181 250 259 9 Emergency Funding (CCC)helliphelliphelliphelliphelliphelliphelliphelliphelliphelliphelliphelliphelliphelliphelliphelliphelliphelliphelliphelliphellip 29 28 0 -28 Total Animal and Plant Health Inspection Servicehelliphelliphelliphelliphelliphelliphelliphelliphelliphelliphellip 1091 1188 1134 -54 Agricultural Marketing Service Discretionary Programshelliphelliphelliphelliphelliphelliphelliphelliphelliphelliphelliphelliphelliphelliphelliphelliphelliphelliphelliphelliphelliphellip 89 93 100 7 Mandatory Programshelliphelliphelliphelliphelliphelliphelliphelliphelliphelliphelliphelliphelliphelliphelliphelliphelliphelliphelliphelliphelliphelliphellip 1223 1305 1235 -70 Total Agricultural Marketing Servicehelliphelliphelliphelliphelliphelliphelliphelliphelliphelliphelliphelliphelliphelliphelliphellip 1312 1398 1335 -63 Grain Inspection Packers and Stockyards Administration Discretionary Programshelliphelliphelliphelliphelliphelliphelliphelliphelliphelliphelliphelliphelliphelliphelliphelliphelliphelliphelliphelliphelliphellip 40 42 44 2
Total Marketing and Regulatory Programshelliphelliphelliphelliphelliphelliphelliphelliphelliphelliphelliphellip 2443 2628 2513 -115 RESEARCH EDUCATION AND ECONOMICS Agricultural Research Service Discretionary Programshelliphelliphelliphelliphelliphelliphelliphelliphelliphelliphelliphelliphelliphelliphelliphelliphelliphelliphelliphelliphelliphellip 1190 1251 1200 -51 Mandatory Programshelliphelliphelliphelliphelliphelliphelliphelliphelliphelliphelliphelliphelliphelliphelliphelliphelliphelliphelliphelliphelliphelliphellip 24 24 24 0 Recovery Acthelliphelliphelliphelliphelliphelliphelliphelliphelliphelliphelliphelliphelliphelliphelliphelliphelliphelliphelliphelliphelliphelliphelliphelliphelliphellip 176 0 0 0 Total Agricultural Research Servicehelliphelliphelliphelliphelliphelliphelliphelliphelliphelliphelliphelliphelliphelliphelliphellip 1390 1275 1224 -51 National Institute of Food and Agriculture Discretionary Programshelliphelliphelliphelliphelliphelliphelliphelliphelliphelliphelliphelliphelliphelliphelliphelliphelliphelliphelliphelliphelliphellip 1226 1351 1347 -5 Mandatory Programshelliphelliphelliphelliphelliphelliphelliphelliphelliphelliphelliphelliphelliphelliphelliphelliphelliphelliphelliphelliphelliphelliphellip 124 135 147 12 Total National Institute of Food and Agriculturehelliphelliphelliphelliphelliphelliphelliphelliphelliphelliphelliphellip 1350 1486 1494 7 Economic Research Service Discretionary Programshelliphelliphelliphelliphelliphelliphelliphelliphelliphelliphelliphelliphelliphelliphelliphelliphelliphelliphelliphelliphelliphellip 80 82 87 5 National Agricultural Statistics Service Discretionary Programshelliphelliphelliphelliphelliphelliphelliphelliphelliphelliphelliphelliphelliphelliphelliphelliphelliphelliphelliphelliphelliphellip 152 162 165 3
Total Research Education and Economicshelliphelliphelliphelliphelliphelliphelliphelliphelliphelliphelliphellip 2972 3005 2970 -36 OTHER ACTIVITIES Departmental Activities Discretionary Programshelliphelliphelliphelliphelliphelliphelliphelliphelliphelliphelliphelliphelliphelliphelliphelliphelliphelliphelliphelliphelliphellip 425 546 573 27 Mandatory Programshelliphelliphelliphelliphelliphelliphelliphelliphelliphelliphelliphelliphelliphelliphelliphelliphelliphelliphelliphelliphelliphelliphellip 19 24 24 0 Recovery Acthelliphelliphelliphelliphelliphelliphelliphelliphelliphelliphelliphelliphelliphelliphelliphelliphelliphelliphelliphelliphelliphelliphelliphelliphelliphellip 24 0 0 0 Total Departmental Activitieshelliphelliphelliphelliphelliphelliphelliphelliphelliphelliphelliphelliphelliphelliphelliphelliphelliphelliphellip 468 570 597 27 Office of Inspector General Discretionary Programshelliphelliphelliphelliphelliphelliphelliphelliphelliphelliphelliphelliphelliphelliphelliphelliphelliphelliphelliphelliphelliphellip 86 89 90 1 Recovery Acthelliphelliphelliphelliphelliphelliphelliphelliphelliphelliphelliphelliphelliphelliphelliphelliphelliphelliphelliphelliphelliphelliphelliphelliphelliphellip 22 0 0 0 Total Office of Inspector Generalhelliphelliphelliphelliphelliphelliphelliphelliphelliphelliphelliphelliphelliphelliphelliphelliphellip 108 89 90 1
Total Departmental Activitieshelliphelliphelliphelliphelliphelliphelliphelliphelliphelliphelliphelliphelliphelliphelliphelliphellip 576 659 687 28
USDA SUB-TOTALhelliphelliphelliphelliphelliphelliphelliphelliphelliphelliphelliphelliphelliphelliphelliphelliphelliphelliphelliphelliphelliphellip $132819 $138455 $152400 $13945 Offsetting Receiptshelliphelliphelliphelliphelliphelliphelliphelliphelliphelliphelliphelliphelliphelliphelliphelliphelliphelliphelliphelliphelliphelliphelliphellip -4993 -2936 -3795 -859 USDA TOTALhelliphelliphelliphelliphelliphelliphelliphelliphelliphelliphelliphelliphelliphelliphelliphelliphelliphelliphelliphelliphelliphelliphelliphelliphelliphellip $127826 $135519 $148605 $13086
135
APPENDIX
UNITED STATES DEPARTMENT OF AGRICULTURE (Dollars in Millions)
Program Level
Change 2009 2010 2011 2010 to
AGENCYPROGRAM Enacted Estimate Budget 2011
FARM AND FOREIGN AGRICULTURAL SERVICES Farm Service Agency Farm Loan and Grant Programshelliphelliphelliphelliphelliphelliphelliphelliphelliphelliphelliphelliphelliphelliphellip $4551 $5140 $4797 -$343 Conservation and Other Programshelliphelliphelliphelliphelliphelliphelliphelliphelliphelliphelliphelliphelliphellip 2282 2359 2154 -205 Disaster Assistancehelliphelliphelliphelliphelliphelliphelliphelliphelliphelliphelliphelliphelliphelliphelliphelliphelliphelliphelliphellip 703 526 891 365 Commodity Programshelliphelliphelliphelliphelliphelliphelliphelliphelliphelliphelliphelliphelliphelliphelliphelliphelliphelliphellip 17679 18458 18315 -143 Commodity Credit Corporation Programshelliphelliphelliphelliphelliphelliphelliphelliphelliphelliphellip (25453) (26437) (26255) (-182) Salaries and Expenseshelliphelliphelliphelliphelliphelliphelliphelliphelliphelliphelliphelliphelliphelliphelliphelliphelliphelliphellip 1483 1570 1686 116 Total Farm Service Agencyhelliphelliphelliphelliphelliphelliphelliphelliphelliphelliphelliphelliphelliphelliphelliphellip 26699 28053 27843 -211
Risk Management Agency Administrative and Operating Expenseshelliphelliphelliphelliphelliphelliphelliphelliphelliphelliphelliphellip 77 80 83 3 Crop Insurance Fundhelliphelliphelliphelliphelliphelliphelliphelliphelliphelliphelliphelliphelliphelliphelliphelliphelliphelliphellip 7998 9556 11373 1817 Total Risk Management Agencyhelliphelliphelliphelliphelliphelliphelliphelliphelliphelliphelliphelliphelliphellip 8075 9636 11456 1820
Foreign Agricultural Service Export Credit Guaranteeshelliphelliphelliphelliphelliphelliphelliphelliphelliphelliphelliphelliphelliphelliphelliphelliphellip 5357 5500 5500 0 Market Development Programshelliphelliphelliphelliphelliphelliphelliphelliphelliphelliphelliphelliphelliphelliphellip 251 252 213 -39 Dairy Export Incentive Programhelliphelliphelliphelliphelliphelliphelliphelliphelliphelliphelliphelliphelliphelliphellip 19 10 0 -10 Foreign Food Assistancehelliphelliphelliphelliphelliphelliphelliphelliphelliphelliphelliphelliphelliphelliphelliphelliphellip 312 175 171 -4 Trade Adjustment Assistance for Farmershelliphelliphelliphelliphelliphelliphelliphelliphelliphelliphellip 25 90 22 -68 Salaries and Expenseshelliphelliphelliphelliphelliphelliphelliphelliphelliphelliphelliphelliphelliphelliphelliphelliphelliphelliphellip 311 527 398 -129 Total Foreign Agricultural Servicehelliphelliphelliphelliphelliphelliphelliphelliphelliphelliphelliphelliphelliphellip 6275 6554 6304 -250
Total Farm and Foreign Agricultural Serviceshelliphelliphelliphelliphelliphelliphelliphelliphellip 41049 44243 45603 1359
RURAL DEVELOPMENT Rural Utilities Service Loans and Grantshelliphelliphelliphelliphelliphelliphelliphelliphelliphelliphelliphelliphelliphelliphelliphelliphelliphelliphelliphellip 21722 9875 6833 -3042
Rural Housing Service Loans and Grantshelliphelliphelliphelliphelliphelliphelliphelliphelliphelliphelliphelliphelliphelliphelliphelliphelliphelliphelliphellip 22568 15525 15563 38
Rural Business - Cooperative Service Loans and Grantshelliphelliphelliphelliphelliphelliphelliphelliphelliphelliphelliphelliphelliphelliphelliphelliphelliphelliphelliphellip 3406 2328 1431 -897
Salaries and Expenseshelliphelliphelliphelliphelliphelliphelliphelliphelliphelliphelliphelliphelliphelliphelliphelliphelliphellip 324 202 232 30 Total Rural Developmenthelliphelliphelliphelliphelliphelliphelliphelliphelliphelliphelliphelliphelliphelliphelliphellip 48020 27930 24059 -3871
FOOD NUTRITION AND CONSUMER SERVICES Food and Nutrition Service Supplemental Nutrition Assistance Programhelliphelliphelliphelliphelliphelliphelliphelliphelliphelliphellip 51442 60413 63211 2798 Child Nutrition Programshelliphelliphelliphelliphelliphelliphelliphelliphelliphelliphelliphelliphelliphelliphelliphelliphelliphellip 15406 17299 18403 1104 Women Infants and Children (WIC)helliphelliphelliphelliphelliphelliphelliphelliphelliphelliphelliphelliphellip 6956 7746 8058 312 All Otherhelliphelliphelliphelliphelliphelliphelliphelliphelliphelliphelliphelliphelliphelliphelliphelliphelliphelliphelliphelliphelliphelliphelliphellip 408 423 442 19
Total Food Nutrition and Consumer Serviceshelliphelliphelliphelliphelliphelliphelliphellip 74212 85881 90114 4233
FOOD SAFETY Food Safety and Inspection Servicehelliphelliphelliphelliphelliphelliphelliphelliphelliphelliphelliphelliphellip 983 1028 1046 18
136
APPENDIX
UNITED STATES DEPARTMENT OF AGRICULTURE (Dollars in Millions)
Program Level Change
2009 2010 2011 2010 to AGENCYPROGRAM Enacted Estimate Budget 2011
NATURAL RESOURCES AND ENVIRONMENT Natural Resources Conservation Service Conservation Operationshelliphelliphelliphelliphelliphelliphelliphelliphelliphelliphelliphelliphelliphelliphelliphelliphellip 853 888 924 36 Watershed Programshelliphelliphelliphelliphelliphelliphelliphelliphelliphelliphelliphelliphelliphelliphelliphelliphelliphelliphellip 404 70 40 -30 Resource Conservation and Developmenthelliphelliphelliphelliphelliphelliphelliphelliphelliphellip 51 51 0 -51 Farm Security and Rural Investment Programshelliphelliphelliphelliphelliphelliphelliphellip 2163 2973 3029 56
Total Natural Resources Conservation Servicehelliphelliphelliphelliphelliphelliphelliphellip 3471 3982 3993 11
Forest Service National Forest Systemhelliphelliphelliphelliphelliphelliphelliphelliphelliphelliphelliphelliphelliphelliphelliphelliphelliphellip 1510 1551 1586 35 Forest and Rangeland Researchhelliphelliphelliphelliphelliphelliphelliphelliphelliphelliphelliphelliphelliphellip 296 312 304 -8 State and Private Forestryhelliphelliphelliphelliphelliphelliphelliphelliphelliphelliphelliphelliphelliphelliphelliphelliphellip 266 308 322 14 Wildland Fire Activitieshelliphelliphelliphelliphelliphelliphelliphelliphelliphelliphelliphelliphelliphelliphelliphelliphellip 2832 2517 2645 128 Capital Improvement and Maintenancehelliphelliphelliphelliphelliphelliphelliphelliphelliphelliphellip 1145 556 438 -118 Land Acquisitionhelliphelliphelliphelliphelliphelliphelliphelliphelliphelliphelliphelliphelliphelliphelliphelliphelliphelliphelliphellip 51 65 75 10 All Otherhelliphelliphelliphelliphelliphelliphelliphelliphelliphelliphelliphelliphelliphelliphelliphelliphelliphelliphelliphelliphelliphelliphellip 9 6 6 0
Total Discretionary Accountshelliphelliphelliphelliphelliphelliphelliphelliphelliphelliphelliphelliphelliphellip 6109 5315 5377 62 Mandatoryhelliphelliphelliphelliphelliphelliphelliphelliphelliphelliphelliphelliphelliphelliphelliphelliphelliphelliphelliphelliphelliphelliphellip 994 836 768 -68
Total Forest Servicehelliphelliphelliphelliphelliphelliphelliphelliphelliphelliphelliphelliphelliphelliphelliphelliphelliphellip 7103 6151 6145 -6 Total Natural Resources and Environmenthelliphelliphelliphelliphelliphelliphelliphelliphellip 10574 10133 10138 5
MARKETING AND REGULATORY PROGRAMS Animal and Plant Health Inspection Service Salaries and Expenseshelliphelliphelliphelliphelliphelliphelliphelliphelliphelliphelliphelliphelliphelliphelliphelliphelliphellip 877 905 870 -35 Emergency Fundinghelliphelliphelliphelliphelliphelliphelliphelliphelliphelliphelliphelliphelliphelliphelliphelliphelliphelliphellip 29 28 0 -28 Mandatoryhelliphelliphelliphelliphelliphelliphelliphelliphelliphelliphelliphelliphelliphelliphelliphelliphelliphelliphelliphelliphelliphelliphellip 181 250 259 9 Buildings and Facilitieshelliphelliphelliphelliphelliphelliphelliphelliphelliphelliphelliphelliphelliphelliphelliphelliphellip 5 5 5 0
Total Animal and Plant Health Inspection Servicehelliphelliphelliphelliphelliphellip 1092 1188 1134 -54 Agricultural Marketing Servicehelliphelliphelliphelliphelliphelliphelliphelliphelliphelliphelliphelliphelliphellip 300 300 320 20 Section 32 Fundshelliphelliphelliphelliphelliphelliphelliphelliphelliphelliphelliphelliphelliphelliphelliphelliphelliphelliphelliphellip 1012 1098 1015 -83 Grain Inspection Packers and Stockyards
Administrationhelliphelliphelliphelliphelliphelliphelliphelliphelliphelliphelliphelliphelliphelliphelliphelliphelliphelliphelliphellip 40 42 44 2 Total Marketing and Regulatory Programshelliphelliphelliphelliphelliphelliphelliphellip 2444 2628 2513 -115
RESEARCH EDUCATION AND ECONOMICS Agricultural Research Servicehelliphelliphelliphelliphelliphelliphelliphelliphelliphelliphelliphelliphelliphelliphellip 1390 1275 1224 -51 National Institute of Food and Agriculturehelliphelliphelliphelliphelliphelliphelliphelliphellip 1350 1486 1494 7 Economic Research Servicehelliphelliphelliphelliphelliphelliphelliphelliphelliphelliphelliphelliphelliphelliphelliphellip 80 82 87 5 National Agricultural Statistics Servicehelliphelliphelliphelliphelliphelliphelliphelliphelliphelliphellip 152 162 165 3
Total Research Education and Economicshelliphelliphelliphelliphelliphelliphelliphellip 2972 3005 2970 -36
OTHER ACTIVITIES
Office of the Secretaryhelliphelliphelliphelliphelliphelliphelliphelliphelliphelliphelliphelliphelliphelliphelliphelliphelliphellip 16 19 56 37 Departmental Managementhelliphelliphelliphelliphelliphelliphelliphelliphelliphelliphelliphelliphelliphelliphelliphellip 371 467 456 -11 Departmental Staff Officeshelliphelliphelliphelliphelliphelliphelliphelliphelliphelliphelliphelliphelliphelliphelliphelliphellip 80 84 86 2 Office of Inspector Generalhelliphelliphelliphelliphelliphelliphelliphelliphelliphelliphelliphelliphelliphelliphelliphellip 108 89 90 1
Total Other Activitieshelliphelliphelliphelliphelliphelliphelliphelliphelliphelliphelliphelliphelliphelliphelliphelliphellip 575 659 688 29 USDA Sub-Totalhelliphelliphelliphelliphelliphelliphelliphelliphelliphelliphelliphelliphelliphelliphelliphelliphelliphelliphelliphellip $180829 $175507 $177131 $1623
Receipts and Loan Repayments and Other Adjustmentshelliphelliphelliphelliphellip -4993 -2936 -3795 -859
USDA TOTALhelliphelliphelliphelliphelliphelliphelliphelliphelliphelliphelliphelliphelliphelliphelliphelliphelliphelliphelliphelliphellip $175836 $172571 $173336 $764
137
APPENDIX
UNITED STATES DEPARTMENT OF AGRICULTURE
Outlays
(Dollars in Millions)
2009 2010 2011 AGENCY Actual Estimate Budget
FARM AND FOREIGN AGRICULTURAL SERVICES Farm Service Agencyhelliphelliphelliphelliphelliphelliphelliphelliphelliphelliphelliphelliphelliphelliphelliphelliphelliphelliphellip $1890 $4657 $3169 Commodity Credit Corporation Programshelliphelliphelliphelliphelliphelliphelliphelliphelliphelliphellip 11443 11927 11435 Risk Management Agencyhelliphelliphelliphelliphelliphelliphelliphelliphelliphelliphelliphelliphelliphelliphelliphelliphellip 7962 7033 7637 Foreign Agricultural Servicehelliphelliphelliphelliphelliphelliphelliphelliphelliphelliphelliphelliphelliphelliphelliphelliphellip 321 419 496 PL 480helliphelliphelliphelliphelliphelliphelliphelliphelliphelliphelliphelliphelliphelliphelliphelliphelliphelliphelliphelliphelliphelliphelliphelliphellip 1601 1185 1537
RURAL DEVELOPMENT Salaries and Expenseshelliphelliphelliphelliphelliphelliphelliphelliphelliphelliphelliphelliphelliphelliphelliphelliphelliphelliphellip 38 297 238 Rural Utilities Servicehelliphelliphelliphelliphelliphelliphelliphelliphelliphelliphelliphelliphelliphelliphelliphelliphelliphelliphellip 29 613 598 Rural Housing Servicehelliphelliphelliphelliphelliphelliphelliphelliphelliphelliphelliphelliphelliphelliphelliphelliphelliphelliphellip 1519 1928 1335 Rural Business - Cooperative Servicehelliphelliphelliphelliphelliphelliphelliphelliphelliphelliphelliphelliphellip 133 285 387 Rural Empowerment ZonesEnterprise Communitieshelliphelliphelliphelliphelliphelliphellip 16 10 3
FOOD NUTRITION AND CONSUMER SERVICES Food and Nutrition Servicehelliphelliphelliphelliphelliphelliphelliphelliphelliphelliphelliphelliphelliphelliphelliphelliphellip 77848 97945 102410
NATURAL RESOURCES AND ENVIRONMENT Natural Resources Conservation Servicehelliphelliphelliphelliphelliphelliphelliphelliphelliphelliphelliphellip 2725 3525 3722 Forest Servicehelliphelliphelliphelliphelliphelliphelliphelliphelliphelliphelliphelliphelliphelliphelliphelliphelliphelliphelliphelliphelliphellip 5945 6881 6079
FOOD SAFETY Food Safety and Inspection Servicehelliphelliphelliphelliphelliphelliphelliphelliphelliphelliphelliphelliphelliphellip 963 1004 1031
RESEARCH EDUCATION AND ECONOMICS Agricultural Research Servicehelliphelliphelliphelliphelliphelliphelliphelliphelliphelliphelliphelliphelliphelliphelliphellip 1200 1272 1251 National Institute of Food and Agriculturehelliphelliphelliphelliphelliphelliphelliphelliphelliphelliphellip 1182 1483 1624 Economic Research Servicehelliphelliphelliphelliphelliphelliphelliphelliphelliphelliphelliphelliphelliphelliphelliphelliphellip 80 81 87 National Agricultural Statistics Servicehelliphelliphelliphelliphelliphelliphelliphelliphelliphelliphelliphellip 145 162 165
MARKETING AND REGULATORY PROGRAMS Animal and Plant Health Inspection Servicehelliphelliphelliphelliphelliphelliphelliphelliphelliphellip 1183 1328 1267 Agricultural Marketing Servicehelliphelliphelliphelliphelliphelliphelliphelliphelliphelliphelliphelliphelliphelliphellip 259 281 307
Section 32 Fundshelliphelliphelliphelliphelliphelliphelliphelliphelliphelliphelliphelliphelliphelliphelliphelliphelliphelliphelliphelliphellip 948 1098 1015 Grain Inspection Packers and Stockyards Administrationhelliphelliphelliphelliphellip 41 40 14
DEPARTMENTAL ACTIVITIES Office of the Secretaryhelliphelliphelliphelliphelliphelliphelliphelliphelliphelliphelliphelliphelliphelliphelliphelliphelliphelliphellip 11 19 43 Common Computing Environmenthelliphelliphelliphelliphelliphelliphelliphelliphelliphelliphelliphelliphelliphellip 6 16 0 Departmental Administrationhelliphelliphelliphelliphelliphelliphelliphelliphelliphelliphelliphelliphelliphelliphelliphellip 79 170 173 Agriculture Buildings and Facilitieshelliphelliphelliphelliphelliphelliphelliphelliphelliphelliphelliphelliphelliphellip 236 314 281 Hazardous Waste Managementhelliphelliphelliphelliphelliphelliphelliphelliphelliphelliphelliphelliphelliphelliphelliphellip 8 9 10 Office of the General Counselhelliphelliphelliphelliphelliphelliphelliphelliphelliphelliphelliphelliphelliphelliphelliphellip 40 44 46 Office of Inspector Generalhelliphelliphelliphelliphelliphelliphelliphelliphelliphelliphelliphelliphelliphelliphelliphelliphellip 84 95 96 Office of Communicationshelliphelliphelliphelliphelliphelliphelliphelliphelliphelliphelliphelliphelliphelliphelliphelliphellip 9 10 10 Executive Operations
Office of the Chief Economisthelliphelliphelliphelliphelliphelliphelliphelliphelliphelliphelliphelliphelliphelliphellip 12 14 14 National Appeals Divisionhelliphelliphelliphelliphelliphelliphelliphelliphelliphelliphelliphelliphelliphelliphelliphelliphellip 14 14 15
Working Capital Fundhelliphelliphelliphelliphelliphelliphelliphelliphelliphelliphelliphelliphelliphelliphelliphelliphelliphelliphellip 46 -25 0 Gifts and Bequestshelliphelliphelliphelliphelliphelliphelliphelliphelliphelliphelliphelliphelliphelliphelliphelliphelliphelliphelliphellip 1 1 1
Subtotalhelliphelliphelliphelliphelliphelliphelliphelliphelliphelliphelliphelliphelliphelliphelliphelliphelliphelliphelliphelliphelliphelliphelliphellip 118017 144135 146496 Offsetting Receiptshelliphelliphelliphelliphelliphelliphelliphelliphelliphelliphelliphelliphelliphelliphelliphelliphelliphelliphelliphelliphellip -3577 -2120 -749
TOTAL US DEPARTMENT OF AGRICULTUREhelliphelliphelliphelliphelliphellip $114440 $142015 $145747
138
APPENDIX
UNITED STATES DEPARTMENT OF AGRICULTURE
Discretionary Outlays
(Dollars in Millions)
2009 2010 2011 AGENCY Actual Estimate Budget
FARM AND FOREIGN AGRICULTURAL SERVICES Farm Service Agencyhelliphelliphelliphelliphelliphelliphelliphelliphelliphelliphelliphelliphelliphelliphelliphelliphelliphelliphellip $1872 $2354 $1940 Risk Management Agencyhelliphelliphelliphelliphelliphelliphelliphelliphelliphelliphelliphelliphelliphelliphelliphelliphellip 73 79 82 Foreign Agricultural Servicehelliphelliphelliphelliphelliphelliphelliphelliphelliphelliphelliphelliphelliphelliphelliphelliphellip 236 395 472 PL 480helliphelliphelliphelliphelliphelliphelliphelliphelliphelliphelliphelliphelliphelliphelliphelliphelliphelliphelliphelliphelliphelliphelliphelliphellip 2169 1504 1847 RURAL DEVELOPMENT Salaries and Expenseshelliphelliphelliphelliphelliphelliphelliphelliphelliphelliphelliphelliphelliphelliphelliphelliphelliphelliphellip 38 297 238 Rural Utilities Servicehelliphelliphelliphelliphelliphelliphelliphelliphelliphelliphelliphelliphelliphelliphelliphelliphelliphelliphellip 608 1248 1786 Rural Housing Servicehelliphelliphelliphelliphelliphelliphelliphelliphelliphelliphelliphelliphelliphelliphelliphelliphelliphelliphellip 1982 2297 2018 Rural Business - Cooperative Servicehelliphelliphelliphelliphelliphelliphelliphelliphelliphelliphelliphelliphellip 169 215 125 Rural Empowerment ZonesEnterprise Communitieshelliphelliphelliphelliphelliphelliphellip 16 10 3 FOOD NUTRITION AND CONSUMER SERVICES Food and Nutrition Servicehelliphelliphelliphelliphelliphelliphelliphelliphelliphelliphelliphelliphelliphelliphelliphelliphellip 7070 8725 8074 NATURAL RESOURCES AND ENVIRONMENT Natural Resources Conservation Servicehelliphelliphelliphelliphelliphelliphelliphelliphelliphelliphelliphellip 1141 1401 969 Forest Servicehelliphelliphelliphelliphelliphelliphelliphelliphelliphelliphelliphelliphelliphelliphelliphelliphelliphelliphelliphelliphelliphellip 5129 6007 5322 FOOD SAFETY Food Safety and Inspection Servicehelliphelliphelliphelliphelliphelliphelliphelliphelliphelliphelliphelliphelliphellip 956 995 1033 RESEARCH EDUCATION AND ECONOMICS Agricultural Research Servicehelliphelliphelliphelliphelliphelliphelliphelliphelliphelliphelliphelliphelliphelliphelliphellip 1178 1250 1227 National Institute of Food and Agriculturehelliphelliphelliphelliphelliphelliphelliphelliphelliphelliphellip 1140 1396 1542 Economic Research Servicehelliphelliphelliphelliphelliphelliphelliphelliphelliphelliphelliphelliphelliphelliphelliphelliphellip 80 81 87 National Agricultural Statistics Servicehelliphelliphelliphelliphelliphelliphelliphelliphelliphelliphelliphellip 145 162 165 MARKETING AND REGULATORY PROGRAMS Animal and Plant Health Inspection Servicehelliphelliphelliphelliphelliphelliphelliphelliphelliphellip 942 1085 1030 Agricultural Marketing Servicehelliphelliphelliphelliphelliphelliphelliphelliphelliphelliphelliphelliphelliphelliphellip 101 103 52 Grain Inspection Packers and Stockyards Administrationhelliphelliphelliphelliphellip 40 42 43
DEPARTMENTAL ACTIVITIES Office of the Secretaryhelliphelliphelliphelliphelliphelliphelliphelliphelliphelliphelliphelliphelliphelliphelliphelliphelliphelliphellip 11 19 43 Departmental Administrationhelliphelliphelliphelliphelliphelliphelliphelliphelliphelliphelliphelliphelliphelliphelliphellip 78 148 151 Agriculture Buildings and Facilitieshelliphelliphelliphelliphelliphelliphelliphelliphelliphelliphelliphelliphelliphellip 236 314 281 Hazardous Waste Managementhelliphelliphelliphelliphelliphelliphelliphelliphelliphelliphelliphelliphelliphelliphelliphellip 8 9 10 Office of the General Counselhelliphelliphelliphelliphelliphelliphelliphelliphelliphelliphelliphelliphelliphelliphelliphellip 40 44 46 Office of Inspector Generalhelliphelliphelliphelliphelliphelliphelliphelliphelliphelliphelliphelliphelliphelliphelliphelliphellip 84 95 96 Office of Communicationshelliphelliphelliphelliphelliphelliphelliphelliphelliphelliphelliphelliphelliphelliphelliphelliphellip 9 10 10 Executive Operations
Office of the Chief Economisthelliphelliphelliphelliphelliphelliphelliphelliphelliphelliphelliphelliphelliphelliphellip 11 13 13 National Appeals Divisionhelliphelliphelliphelliphelliphelliphelliphelliphelliphelliphelliphelliphelliphelliphelliphelliphellip 14 14 15 Common Computing Environmenthelliphelliphelliphelliphelliphelliphelliphelliphelliphelliphelliphelliphelliphellip 6 16 0 Working Capital Fundhelliphelliphelliphelliphelliphelliphelliphelliphelliphelliphelliphelliphelliphelliphelliphelliphelliphelliphellip 46 -25 0 Subtotalhelliphelliphelliphelliphelliphelliphelliphelliphelliphelliphelliphelliphelliphelliphelliphelliphelliphelliphelliphelliphelliphelliphelliphellip 25628 30303 28720 Offsetting Receiptshelliphelliphelliphelliphelliphelliphelliphelliphelliphelliphelliphelliphelliphelliphelliphelliphelliphelliphelliphelliphellip -58 -70 -78
TOTAL US DEPARTMENT OF AGRICULTUREhelliphelliphelliphelliphelliphellip $25570 $30233 $28642
139
APPENDIX
UNITED STATES DEPARTMENT OF AGRICULTURE
American Recovery and Reinvestment Act of 2009 (Dollars in Millions)
2009 - 2010 2011
AgencyProgram Available Estimate
DEPARTMENTAL ADMINISTRATION Agriculture Buildings and Facilities and Rental Paymentshelliphelliphelliphelliphelliphelliphellip $24 0
AGRICULTURAL RESEARCH SERVICE Buildings and Facilitieshelliphelliphelliphelliphelliphelliphelliphelliphelliphelliphelliphelliphelliphelliphelliphelliphelliphelliphelliphellip 176 0
OFFICE OF INSPECTOR GENERAL Oversight and Audithelliphelliphelliphelliphelliphelliphelliphelliphelliphelliphelliphelliphelliphelliphelliphelliphelliphelliphelliphelliphellip 22 0
FARM SERVICE AGENCY Salaries and Expenses - Information Technologyhelliphelliphelliphelliphelliphelliphelliphelliphelliphellip 50 0 Agricultural Credit Insurance Fund Program Account Farm Operating Direct Loanshelliphelliphelliphelliphelliphelliphelliphelliphelliphelliphelliphelliphelliphelliphelliphelliphellip 20 0 Loan Levelhelliphelliphelliphelliphelliphelliphelliphelliphelliphelliphelliphelliphelliphelliphelliphelliphelliphelliphelliphelliphelliphelliphellip (173) (0) Total FSAhelliphelliphelliphelliphelliphelliphelliphelliphelliphelliphelliphelliphelliphelliphelliphelliphelliphelliphelliphelliphelliphelliphelliphelliphellip 70 0
NATURAL RESOURCES CONSERVATION SERVICE Watershed and Flood Prevention Operationshelliphelliphelliphelliphelliphelliphelliphelliphelliphelliphelliphellip 290 0 Watershed Rehabilitation Programhelliphelliphelliphelliphelliphelliphelliphelliphelliphelliphelliphelliphelliphelliphelliphellip 50 0 Total NRCShelliphelliphelliphelliphelliphelliphelliphelliphelliphelliphelliphelliphelliphelliphelliphelliphelliphelliphelliphelliphelliphelliphelliphellip 340 0
RURAL DEVELOPMENT Salaries and Expenseshelliphelliphelliphelliphelliphelliphelliphelliphelliphelliphelliphelliphelliphelliphelliphelliphelliphelliphelliphelliphellip 131 a 0
Rural Business-Cooperative Service Rural Business and Industry Guaranteed Loans Programhelliphelliphelliphelliphelliphelliphellip 126 0 Loan Levelhelliphelliphelliphelliphelliphelliphelliphelliphelliphelliphelliphelliphelliphelliphelliphelliphelliphelliphelliphelliphelliphelliphellip (1572) (0) Rural Business Enterprise Grantshelliphelliphelliphelliphelliphelliphelliphelliphelliphelliphelliphelliphelliphelliphelliphellip 19 0 Total RBShelliphelliphelliphelliphelliphelliphelliphelliphelliphelliphelliphelliphelliphelliphelliphelliphelliphelliphelliphelliphelliphelliphelliphelliphellip 145 0
Rural Housing Service Rural Community Facilities Loans Programhelliphelliphelliphelliphelliphelliphelliphelliphelliphelliphelliphellip 24 0 Loan Levelhelliphelliphelliphelliphelliphelliphelliphelliphelliphelliphelliphelliphelliphelliphelliphelliphelliphelliphelliphelliphelliphelliphellip (1136) (0) Rural Community Facilities Grants Programhelliphelliphelliphelliphelliphelliphelliphelliphelliphelliphelliphellip 102 0 Section 502 Direct Single Family Housing Loan Programhelliphelliphelliphelliphelliphellip 65 0 Loan Levelhelliphelliphelliphelliphelliphelliphelliphelliphelliphelliphelliphelliphelliphelliphelliphelliphelliphelliphelliphelliphelliphelliphellip (1563) (0) Section 502 Guaranteed Single Family Housing Loan Programhelliphelliphelliphellip 129 0 Loan Levelhelliphelliphelliphelliphelliphelliphelliphelliphelliphelliphelliphelliphelliphelliphelliphelliphelliphelliphelliphelliphelliphelliphellip (10111) (0) Total RHShelliphelliphelliphelliphelliphelliphelliphelliphelliphelliphelliphelliphelliphelliphelliphelliphelliphelliphelliphelliphelliphelliphelliphellip 320 0
140
APPENDIX
American Recovery and Reinvestment Act of 2009 (Dollars in Millions)
2009 - 2010 2011
AgencyProgram Available Estimate
Rural Utilities Service Rural Water amp Waste Disposal Direct Loan Programhelliphelliphelliphelliphelliphelliphelliphellip 400 0
Loan Levelhelliphelliphelliphelliphelliphelliphelliphelliphelliphelliphelliphelliphelliphelliphelliphelliphelliphelliphelliphelliphelliphelliphellip (2154) (0) Rural Water amp Waste Disposal Grants Programhelliphelliphelliphelliphelliphelliphelliphelliphelliphellip 939 0 Distance Learning Telemedicine amp Broadband Grants Programhelliphelliphellip 1940 0 Distance Learning Telemedicine amp Broadband Loan Programhelliphelliphelliphellip 485 0
Loan Levelhelliphelliphelliphelliphelliphelliphelliphelliphelliphelliphelliphelliphelliphelliphelliphelliphelliphelliphelliphelliphelliphelliphellip (7160) (0) Total RUShelliphelliphelliphelliphelliphelliphelliphelliphelliphelliphelliphelliphelliphelliphelliphelliphelliphelliphelliphelliphelliphelliphelliphellip 3764 0
FOOD AND NUTRITION SERVICE WIC Management Information Systemshelliphelliphelliphelliphelliphelliphelliphelliphelliphelliphelliphelliphellip 100 0 WIC Contingency Fundhelliphelliphelliphelliphelliphelliphelliphelliphelliphelliphelliphelliphelliphelliphelliphelliphelliphelliphelliphellip 400 0
Total WIChelliphelliphelliphelliphelliphelliphelliphelliphelliphelliphelliphelliphelliphelliphelliphelliphelliphelliphelliphelliphelliphelliphelliphellip 500 0
Supplemental Nutrition Assistance Program Increased Benefitshelliphelliphelliphelliphelliphelliphelliphelliphelliphelliphelliphelliphelliphelliphelliphelliphelliphelliphelliphellip 15355 b 11936 State Administrative Expenseshelliphelliphelliphelliphelliphelliphelliphelliphelliphelliphelliphelliphelliphelliphelliphellip 290 0 FDPIR Administrative Expenseshelliphelliphelliphelliphelliphelliphelliphelliphelliphelliphelliphelliphelliphelliphellip 5 0 FNS Management and Oversighthelliphelliphelliphelliphelliphelliphelliphelliphelliphelliphelliphelliphelliphelliphellip 5 0
Total SNAPhelliphelliphelliphelliphelliphelliphelliphelliphelliphelliphelliphelliphelliphelliphelliphelliphelliphelliphelliphelliphelliphelliphellip 15655 11936 Child Nutrition Equipment Assistancehelliphelliphelliphelliphelliphelliphelliphelliphelliphelliphelliphelliphelliphellip 100 0
The Emergency Food Assistance Programhelliphelliphelliphelliphelliphelliphelliphelliphelliphelliphelliphellip 150 0
FOREST SERVICE Capital Improvement and Maintenancehelliphelliphelliphelliphelliphelliphelliphelliphelliphelliphelliphelliphelliphellip 650 0 Wildland Fire Managementhelliphelliphelliphelliphelliphelliphelliphelliphelliphelliphelliphelliphelliphelliphelliphelliphelliphellip 500 0
Total FShelliphelliphelliphelliphelliphelliphelliphelliphelliphelliphelliphelliphelliphelliphelliphelliphelliphelliphelliphelliphelliphelliphelliphelliphellip 1150 0
AGRICULTURAL DISASTER ASSISTANCE TRANSITION 2008 Transition Assistancehelliphelliphelliphelliphelliphelliphelliphelliphelliphelliphelliphelliphelliphelliphelliphelliphelliphellip 230 c 0
Aquaculture Assistance Grants (CCC Funds)helliphelliphelliphelliphelliphelliphelliphelliphelliphelliphellip 50 0 Total Disaster Assistancehelliphelliphelliphelliphelliphelliphelliphelliphelliphelliphelliphelliphelliphelliphelliphelliphelliphelliphellip 280 0
FOREIGN AGRICULTURAL SERVICE Trade Adjustment Assistance for Farmershelliphelliphelliphelliphelliphelliphelliphelliphelliphelliphelliphellip 180 22
RECAP Total USDA Discretionary Fundshelliphelliphelliphelliphelliphelliphelliphelliphelliphelliphelliphelliphelliphelliphellip 6942 0 Total USDA Mandatory Fundshelliphelliphelliphelliphelliphelliphelliphelliphelliphelliphelliphelliphelliphelliphelliphellip 16065 11958
Total USDAhelliphelliphelliphelliphelliphelliphelliphelliphelliphelliphelliphelliphelliphelliphelliphelliphelliphelliphelliphelliphelliphellip $23007 $11958
a The Act allows up to 3 percent of the funds provided to RD to be used for administrative costs b CBO scored at $198 billion over three years The impact of the Recovery Act on benefits will continue until the Thrifty Food Plan costs equal the provision made by the Recovery Act c CBO scored at $744 million over two years
141
APPENDIX
UNITED STATES DEPARTMENT OF AGRICULTURE Staff Years
2010 2011 Agency 2009 Estimate Budget
FARM AND FOREIGN AGRICULTURAL SERVICES Farm Service Agency 5042 5094 5104 Risk Management Agency 481 568 568 Foreign Agricultural Service 951 1006 1006
RURAL DEVELOPMENT Rural Development 5873 6100 6100
FOOD NUTRITION AND CONSUMER SERVICES Food and Nutrition Service 1269 1387 1443
NATURAL RESOURCES AND ENVIRONMENT Natural Resources Conservation Service 11186 14104 11565 Forest Service 34395 36760 35716
FOOD SAFETY Food Safety and Inspection Service 9460 9696 9727
RESEARCH EDUCATION AND ECONOMICS Agricultural Research Service 8268 8351 8433 National Institute of Food and Agriculture 376 440 440 Economic Research Service 389 399 409 National Agricultural Statistics Service 1093 1174 1175
MARKETING AND REGULATORY PROGRAMS Animal and Plant Health Inspection Service 7935 7888 7751 Agricultural Marketing Service 2815 2848 2848 Grain Inspection Packers amp Stockyards Administration 682 689 705
DEPARTMENTAL ACTIVITIES Office of the Secretary 63 101 96 Office of Advocacy and Outreach 0 45 50 Office of Civil Rights helliphelliphelliphelliphelliphelliphelliphelliphelliphelliphelliphelliphelliphelliphelliphelliphelliphelliphellip 130 140 140 Office of the Chief Financial Officer 1190 1363 1379 Office of Budget and Program Analysis 49 60 60 Office of the Chief Information Officer 937 1058 1058 Departmental Administration 519 575 539 Office of Homeland Security 15 19 19 Office of the Chief Economist 54 62 61 National Appeals Division 94 99 99 Office of Communications 82 98 98 Office of the Inspector General 550 600 600 Office of the General Counsel 302 318 318
Total USDA Federal Staffing 94201 101042 97507 FSA Non-Federal Staffing 9418 9425 9425 Total USDA Staffing 103619 110467 106932
This page corrects data included in the printed version of the 2011 Budget Summary
142
APPENDIX
Strategic Goal Help America promote agricultural production and biotechnology exports as America works to
increase food security
Budget Authority (Dollars in Millions)
2009 2010 2011 Program Enacted Estimate Budget
FARM AND FOREIGN AGRICULTURAL SERVICES Foreign Agricultural Servicehelliphelliphelliphelliphelliphelliphelliphelliphelliphelliphelliphellip $3021 $2302 $2320
Total FFAShelliphelliphelliphelliphelliphelliphelliphelliphelliphelliphelliphelliphelliphelliphelliphelliphelliphelliphelliphellip 3021 2302 2320
NATURAL RESOURCES AND ENVIRONMENT Natural Resources Conservation Servicehelliphelliphelliphelliphelliphelliphelliphellip 5 6 6 Total NREhelliphelliphelliphelliphelliphelliphelliphelliphelliphelliphelliphelliphelliphelliphelliphelliphelliphelliphelliphellip 5 6 6
MARKETING AND REGULATORY PROGRAMS Animal and Plant Health Inspection Servicehelliphelliphelliphelliphelliphellip 42 42 49
Agricultural Marketing Servicehelliphelliphelliphelliphelliphelliphelliphelliphelliphelliphellip 0 0 0 Total MRPhelliphelliphelliphelliphelliphelliphelliphelliphelliphelliphelliphelliphelliphelliphelliphelliphelliphelliphelliphellip 42 42 49
RESEARCH EDUCATION AND ECONOMICS Agricultural Research Servicehelliphelliphelliphelliphelliphelliphelliphelliphelliphelliphelliphellip 575 598 602 National Institute of Food and Agriculturehelliphelliphelliphelliphelliphelliphellip 157 178 161 Economic Research Servicehelliphelliphelliphelliphelliphelliphelliphelliphelliphelliphelliphelliphellip 20 20 21 National Agricultural Statistics Servicehelliphelliphelliphelliphelliphelliphelliphellip 0 0 1 Total REEhelliphelliphelliphelliphelliphelliphelliphelliphelliphelliphelliphelliphelliphelliphelliphelliphelliphelliphelliphellip 752 796 785
Totalhelliphelliphelliphelliphelliphelliphelliphelliphelliphelliphelliphelliphelliphelliphelliphelliphelliphelliphelliphelliphelliphellip $3820 $3146 $3160
143
APPENDIX
Strategic Goal Ensure that all of Americas children have access to safe nutritious and balanced meals
Budget Authority (Dollars in Millions)
2009 2010 2011 Program Enacted Estimate Budget
FOOD NUTRITION AND CONSUMER SERVICES Food and Nutrition Servicehelliphelliphelliphelliphelliphelliphelliphelliphelliphelliphelliphelliphellip $82249 $93854 $107617
FOOD SAFETY Food Safety and Inspection Servicehelliphelliphelliphelliphelliphelliphelliphelliphelliphellip 983 1028 1046
MARKETING AND REGULATORY PROGRAMS Animal and Plant Health Inspection Servicehelliphelliphelliphelliphelliphellip 860 939 915
Agricultural Marketing Servicehelliphelliphelliphelliphelliphelliphelliphelliphelliphelliphellip 504 674 615 Total MRPhelliphelliphelliphelliphelliphelliphelliphelliphelliphelliphelliphelliphelliphelliphelliphelliphelliphelliphelliphellip 1364 1613 1530
RESEARCH EDUCATION AND ECONOMICS Agricultural Research Servicehelliphelliphelliphelliphelliphelliphelliphelliphelliphelliphelliphellip 191 197 205 National Institute of Food and Agriculturehelliphelliphelliphelliphelliphelliphellip 230 248 233 Economic Research Servicehelliphelliphelliphelliphelliphelliphelliphelliphelliphelliphelliphelliphellip 21 22 24 National Agricultural Statistics Servicehelliphelliphelliphelliphelliphelliphelliphellip 3 8 8 Total REEhelliphelliphelliphelliphelliphelliphelliphelliphelliphelliphelliphelliphelliphelliphelliphelliphelliphelliphelliphellip 445 475 470
Totalhelliphelliphelliphelliphelliphelliphelliphelliphelliphelliphelliphelliphelliphelliphelliphelliphelliphelliphelliphelliphelliphellip $85041 $96970 $110663
144
APPENDIX
Strategic Goal Assist rural communities to create prosperity so they are self-sustaining repopulating and
economically thriving
Budget Authority (Dollars in Millions)
2009 2010 2011 Program Enacted Estimate Budget
FARM AND FOREIGN AGRICULTURAL SERVICES Farm Service Agencyhelliphelliphelliphelliphelliphelliphelliphelliphelliphelliphelliphelliphelliphelliphellip $12774 $11785 $11431
Foreign Agricultural Servicehelliphelliphelliphelliphelliphelliphelliphelliphelliphelliphelliphellip 759 851 721 Risk Management Agencyhelliphelliphelliphelliphelliphelliphelliphelliphelliphelliphelliphelliphellip 6844 6535 7696 Total FFAShelliphelliphelliphelliphelliphelliphelliphelliphelliphelliphelliphelliphelliphelliphelliphelliphelliphelliphelliphellip 20377 19171 19848
RURAL DEVELOPMENT Rural Business Servicehelliphelliphelliphelliphelliphelliphelliphelliphelliphelliphelliphelliphelliphelliphellip 518 556159 366
Rural Housing Servicehelliphelliphelliphelliphelliphelliphelliphelliphelliphelliphelliphelliphelliphelliphellip 2250 2078 1917 Rural Utilities Servicehelliphelliphelliphelliphelliphelliphelliphelliphelliphelliphelliphelliphelliphelliphellip 4479 709 661 Total RDhelliphelliphelliphelliphelliphelliphelliphelliphelliphelliphelliphelliphelliphelliphelliphelliphelliphelliphelliphelliphellip 7247 3343 2944
NATURAL RESOURCES AND ENVIRONMENT Natural Resources Conservation Servicehelliphelliphelliphelliphelliphelliphelliphellip 182 306 320
Forest Servicehelliphelliphelliphelliphelliphelliphelliphelliphelliphelliphelliphelliphelliphelliphelliphelliphelliphellip 1823 672 666 Total NREhelliphelliphelliphelliphelliphelliphelliphelliphelliphelliphelliphelliphelliphelliphelliphelliphelliphelliphelliphellip 2005 978 986
MARKETING AND REGULATORY PROGRAMS Animal and Plant Health Inspection Servicehelliphelliphelliphelliphelliphellip 103 106 99
Agricultural Marketing Servicehelliphelliphelliphelliphelliphelliphelliphelliphelliphelliphellip 807 723 725 Grain Inspection Packers and Stockyards Administrationhellip 40 42 44 Total MRPhelliphelliphelliphelliphelliphelliphelliphelliphelliphelliphelliphelliphelliphelliphelliphelliphelliphelliphelliphellip 950 871 868
RESEARCH EDUCATION AND ECONOMICS Agricultural Research Servicehelliphelliphelliphelliphelliphelliphelliphelliphelliphelliphelliphellip 398 246 178 National Institute of Food and Agriculturehelliphelliphelliphelliphelliphelliphellip 780 857 904 Economic Research Servicehelliphelliphelliphelliphelliphelliphelliphelliphelliphelliphelliphelliphellip 29 30 30 National Agricultural Statistics Servicehelliphelliphelliphelliphelliphelliphelliphellip 148 153 155 Total REEhelliphelliphelliphelliphelliphelliphelliphelliphelliphelliphelliphelliphelliphelliphelliphelliphelliphelliphelliphellip 1355 1286 1267
DEPARTMENTAL STAFF OFFICES Office of the Secretaryhelliphelliphelliphelliphelliphelliphelliphelliphelliphelliphelliphelliphelliphelliphellip 0 0 35
Office of the Chief Economisthelliphelliphelliphelliphelliphelliphelliphelliphelliphelliphelliphellip 6 6 6 Total Staff Officeshelliphelliphelliphelliphelliphelliphelliphelliphelliphelliphelliphelliphelliphelliphelliphelliphellip 6 6 41
Totalhelliphelliphelliphelliphelliphelliphelliphelliphelliphelliphelliphelliphelliphelliphelliphelliphelliphelliphelliphelliphelliphellip $31940 $25655 $25954
145
APPENDIX
Strategic Goal Ensure our national forests and private working lands are conserved restored and made more
resilient to climate change while enhancing our water resources Budget Authority
(Dollars in Millions) 2009 2010 2011
Program Enacted Estimate Budget FARM AND FOREIGN AGRICULTURAL SERVICES Farm Service Agencyhelliphelliphelliphelliphelliphelliphelliphelliphelliphelliphelliphelliphelliphelliphellip $2242 $2328 $2314
Foreign Agricultural Servicehelliphelliphelliphelliphelliphelliphelliphelliphelliphelliphelliphellip 3 3 3 Total FFAShelliphelliphelliphelliphelliphelliphelliphelliphelliphelliphelliphelliphelliphelliphelliphelliphelliphelliphelliphellip 2245 2331 2317
NATURAL RESOURCES AND ENVIRONMENT Natural Resources Conservation Servicehelliphelliphelliphelliphelliphelliphelliphellip 3284 3670 3667
Forest Servicehelliphelliphelliphelliphelliphelliphelliphelliphelliphelliphelliphelliphelliphelliphelliphelliphelliphellip 5280 5479 5479 Total NREhelliphelliphelliphelliphelliphelliphelliphelliphelliphelliphelliphelliphelliphelliphelliphelliphelliphelliphelliphellip 8564 9149 9146
MARKETING AND REGULATORY PROGRAMS Animal and Plant Health Inspection Servicehelliphelliphelliphelliphelliphellip 86 101 71 Total MRPhelliphelliphelliphelliphelliphelliphelliphelliphelliphelliphelliphelliphelliphelliphelliphelliphelliphelliphelliphellip 86 101 71
RESEARCH EDUCATION AND ECONOMICS Agricultural Research Servicehelliphelliphelliphelliphelliphelliphelliphelliphelliphelliphelliphellip 226 234 240 National Institute of Food and Agriculturehelliphelliphelliphelliphelliphelliphellip 183 199 196 Economic Research Servicehelliphelliphelliphelliphelliphelliphelliphelliphelliphelliphelliphelliphellip 10 11 11 National Agricultural Statistics Servicehelliphelliphelliphelliphelliphelliphelliphellip 1 1 1 Total REEhelliphelliphelliphelliphelliphelliphelliphelliphelliphelliphelliphelliphelliphelliphelliphelliphelliphelliphelliphellip 420 444 448
DEPARTMENTAL STAFF OFFICES Office of the Chief Economisthelliphelliphelliphelliphelliphelliphelliphelliphelliphelliphelliphellip 0 3 3 Hazardous Materials Managementhelliphelliphelliphelliphelliphelliphelliphelliphelliphellip 5 5 5
Total Staff Officeshelliphelliphelliphelliphelliphelliphelliphelliphelliphelliphelliphelliphelliphelliphelliphelliphellip 5 8 8
Totalhelliphelliphelliphelliphelliphelliphelliphelliphelliphelliphelliphelliphelliphelliphelliphelliphelliphelliphelliphelliphelliphelliphellip $11320 $12033 $11990
146
APPENDIX
Management Activities (Dollars in Millions)
2009 2010 2011 Program Enacted Estimate Budget
Departmental Activitieshelliphelliphelliphelliphelliphelliphelliphelliphelliphelliphelliphelliphelliphelliphellip $549 $626 $620 Total Management Activitieshelliphelliphelliphelliphelliphelliphelliphelliphelliphelliphelliphelliphellip $549 $626 $620
147
APPENDIX
Fee Proposals (Dollars in Millions)
2011 Agency and Program Budget Authority
Food Safety Food Safety and Inspection Service
User Fee Proposals bull Two user fees associated with the Food Safety and
Inspection Service are proposed One proposal would provide the authority to collect user fees from plants that require additional inspection activities because of performance failures such as retesting recalls or inspection activities linked to an outbreak A second proposal would provide authority to collect a Facility Application and Annual Renewal Activities user fee to cover the increased cost above those basic inspection services provided to meat poultry or processed egg products establishments Total collection from these proposals are estimated to be about $11 million in 2011
$0
Natural Resources and Environment Natural Resources Conservation Service
User Fee Proposal 0
bull The budget includes a targeted fee proposal for conservation plans development Total collections from these proposals are estimated to be $19 million
Marketing and Regulatory Programs Animal and Plant Health Inspection Service
User Fee Proposals 0
bull The budget proposal authorizes the Secretary of Agriculture to prescribe adjust and collect fees to cover the costs incurred for activities in relation to the review maintenance and inspections connected to licensing activities associated with the Animal Welfare Act Virus Serum Toxin Act and the Plant Protection Act The estimated fees would result in receipts of $195 million in 2011 which includes $9 million for animal care $675 million for veterinary biologics and $375 million for Biotechnology Regulatory Services
148
0
APPENDIX
Grain Inspection Packers and Stockyards Administration User Fee Proposal
bull The budget would establish a fee for grain standardization and a Packers and Stockyards license fee The proposal would result in approximately $29 million ($4 million and $25 million respectively)
149
APPENDIX
Proposed Budget-Related Legislation (Dollars in Millions)
2011 Agency and Program Budget Authority
Farm and Foreign Agricultural Services Commodity Credit Corporation
Payment Limitation -$1
bull The 2011 budget proposes to utilize the existing payment limitations from the 2008 Farm Bill but adjust the limits within them to achieve significant savings over 10 years Specifically the proposal would reduce the cap on Direct Payments and reduce the Adjusted Gross Income limitations USDA estimates that the sum of the above changes may save the government a total of roughly $23 billion over 10 years
Reduced Commodity Storage Payments -2
bull This proposal would eliminate cotton and peanut storage credits The credits allow producers to store their cotton and peanuts at the Governmentrsquos cost until prices rise Therefore storage credits have a negative impact on the amount of commodities on the market Because storage is covered by the Government producers may store their commodities for longer than necessary There is no reason the Government should be paying for the storage of cotton or peanuts particularly since it does not provide this assistance for other commodities
Foreign Agricultural Service Reform Market Access Program (MAP) -8
bull This proposal reduces annual funding for MAP by 20 percent in order to achieve deficit reduction savings Under the program funds are used to reimburse participating organizations for a portion of the costs of carrying out overseas marketing and promotional activities such as direct consumer promotions Historically more than 80 percent of MAP funding has been devoted to building export markets for high-value products including a wide range of specialty crops
This page corrects a statement included in the printed version of the 2011 Budget Summary
150
APPENDIX
Although funding for new MAP programming will be reduced by $40 million in 2011 outlay savings during the first year are estimated to be $4 million due to the slow rate of spend-out for the program
Food Nutrition and Consumer Services Food and Nutrition Service
Child Nutrition and WIC Reauthorization 1000
bull The budget proposes to add $10 billion over the next ten years for the reauthorization of the Child Nutrition and WIC Programs The proposals would (1) Improve access to nutritious meals particularly for low-income children (2) Improve access to healthy fruits and vegetables (3) Reduce the prevalence of obesity by improving the diets of school children and by teaching children to make wise food choices in and outside of school and (4) Improve program performance and integrity
Supplemental Nutrition Assistance Program 25
bull The budget proposes to add $25 million to extend the American Recovery and Reinvestment Act provision that eliminates the time limits for able-bodied adults without dependents for an additional year
Supplemental Nutrition Assistance Program 11
bull The budget proposes to exclude refundable tax credits from benefit and eligibility determination in the month of receipt and for the following 12 months
Supplemental Nutrition Assistance Program 0
bull The budget proposes to increase the asset limit to $10000 in SNAP but does not increase budget authority The funding is provided through a government-wide initiative
151
0
APPENDIX
Departmental Management Departmental Management
Penalties
bull The budget will include a proposal to assess penalties for misuse of the biopreferred label
152
- 01ContentsTablepdf
- 02Preface
- 03Overview
- 04Highlights by Goals
- 06FFAS
- 07RD
- 08FNS
- 09FSIS
- 10NRE
- 11MRP
- 12REE
-
- NATIONAL INSTITUTE OF FOOD AND AGRICULTURE (NIFA)
- NIFA formerly the Cooperative State Research Education and Extension Service has the primary responsibility for providing linkages between the Federal and State components of a broad-based national agricultural research extension and higher education system NIFA provides funding for projects conducted in partnership with the State Agricultural Experiment Stations the State Cooperative Extension System land grant universities colleges and other research and education institutions Federal funds are distributed to universities and institutions by statutory formula funding competitive awards and grants NIFA is responsible for administering USDAs primary competitive research grants program the Agriculture and Food Research Initiative (AFRI) which supports investigator-initiated research with strong potential to contribute to major breakthroughs in agricultural science
-
- 13OSEC
- 14DM
- 15All Other
- 16OIG
- 17APPENDIX
-

TABLE OF CONTENTS
ITEM PAGE
OFFICE OF THE SECRETARY 124
DEPARTMENTAL ACTIVITIES 126
OFFICE OF INSPECTOR GENERAL 133
APPENDIX Budget Authority by Agency 2009-2011134 Program Level by Agency 2009-2011 136 Outlays by Agency 2009-2011138 Discretionary Budget Outlays by Agency 2009-2011 139 American Recovery and Reinvestment Act of 2009 140 Staff Years by Agency 2009-2011142 Funding by Strategic Goals 143 Fee Proposals 148 Proposed Budget-Related Legislation150
ii
PREFACE
This Budget Summary and Annual Performance Plan describes the fiscal year (FY) 2011 budget for the US Department of Agriculture (USDA) All references to years refer to fiscal year except where specifically noted The funding estimates presented for FY 2010 are based on the Agriculture Rural Development Food and Drug Administration and Related Agencies Appropriations Act 2010 PL 111-80 Throughout the Summary ldquo2008 Farm Billrdquo and ldquoThe Farm Billrdquo are used to refer to the Food Conservation and Energy Act of 2008 In addition ldquoRecovery Actrdquo is used to refer to the American Recovery and Reinvestment Act of 2009
The Budget Summary is organized into three sections
y Overview - provides an overview of the 2011 budget by strategic goal and describes changes in budget authority and outlays
y Highlights by Goals - identifies key proposals within USDArsquos mission areas
y Mission AreaAgency Details - summarizes agency funding and programs and performance goals
Budget and Performance Plan Terms
y Performance Goal is the target level of performance at a specified time or period expressed as a tangible measurable outcome against which actual achievement can be compared including a goal expressed as a quantitative standard value or rate A performance goal comprises a performance measure with targets and timeframes
y Performance Measures are indicators statistics or metrics used to gauge program performance Program performance measures include outcome output and efficiency measures
y Budget Authority is the authority to commit funds of the Federal Treasury Congress provides this authority through annual appropriations acts and substantive legislation which authorizes direct spending The Presidents budget requests the Congress to appropriate or otherwise provide an amount of budget authority sufficient to carry out recommended government programs
y Obligations are commitments of Government funds that are legally binding In order for USDA to make a valid obligation it must have a sufficient amount of budget authority to cover the obligation
y Outlays are cash disbursements from the Federal Treasury to satisfy a valid obligation
y Program Level represents the gross value of all financial assistance USDA provides to the public This assistance may be in the form of grants guaranteed or direct loans cost-sharing professional services such as research or technical assistance activities or in-kind benefits such as commodities
iii
PREFACE
The budget is described in budget authority measures in most instances However there are some cases when other measures are used and the reader should take care to note which measure is being used Also note that the budget authority tables contained in this document reflect operating levels In addition performance goals reflect performance levels at ongoing funding levels and do not include the effect of supplemental including Recovery Act appropriations
Questions may be directed to the Office of Budget and Program Analysis via e-mail at bcaobpausdagov or telephone at (202) 720-6176
iv
OVERVIEW
Mission Statement USDA provides leadership on food agriculture natural resources and related issues based on sound public policy the best available science and efficient management
Vision Statement To help Americarsquos rural communities thrive and foster innovation as a result of expanded economic opportunities and sustainable agricultural production that nourishes Americarsquos children and the world and conserves the Nationrsquos natural resources
Strategic Plan Framework USDA is currently revising its Strategic Plan The 2011 budget request supports achievement of USDArsquos four strategic goals and management initiatives that describe the Departmentrsquos major programmatic policies and objectives that are expected to be the basis of the Departmentrsquos new Strategic Plan
2011 Funding Overview USDArsquos budget authority totals approximately $149 billion in 2011 The 2011 discretionary level is below the 2010 level and funds the Administrationrsquos most important priorities The decrease is primarily due to reductions in one-time funding such as earmarks supplementals rescissions and targeted program reductions The mandatory budget authority increases above 2010 are due primarily to an anticipated increase in nutrition assistance program participation and the impact of the Recovery Act on the Supplemental Nutrition Assistance Program food costs and crop assistance
USDA Budget Authority
160 $149
$67 $96 $108
$123
$26
$32 $27
$26
0
20
40
60
80
100
120
140
$ B
illio
ns
$93
$128 $135
2008 2009 2010 2011
Fiscal Year
Mandatory Discretionary
1
OVERVIEW
USDA Outlays $
Bill
ions
160 $142 $146 140
$115120
100 $90 80
60
40
20
0
$64
$26
$117
$29
$112
$30
$89
$26
2008 2009 2010 2011
Fiscal Year
Discretionary Mandatory
2011 Outlays
Farm and Commodity Programs
17
Nutrition Assistance
70
Conservation and Forestry
7
All Other 6
Includes Rural Development Research Food Safety and Marketing and Regulatory functions
2
OVERVIEW
USDArsquos total outlays for 2011 are estimated at $146 billion Roughly 80 percent of outlays about $117 billion in 2011 are associated with mandatory programs that provide services as required by law These include the majority of the nutrition assistance programs farm commodity programs export promotion programs and a number of conservation programs The increase in mandatory outlays in 2011 is primarily due to nutrition assistance and crop insurance The remaining 20 percent of outlays estimated at $29 billion in 2011 are associated with discretionary programs such as the Special Supplemental Nutrition Program for Women Infants and Children (WIC) rural development loans and grants research and education soil and water conservation technical assistance animal and plant health management of National Forests wildland fire and other Forest Service activities and domestic and international marketing assistance
For 2011 the Departmentrsquos budget process was organized around four program goals and an overarching management goal to improve collaboration among mission areas and agencies and to strengthen the effectiveness of USDA programs This budget presentation reflects the Departmentrsquos goal-based organizational budget process It should be noted that although agency programs and associated funding have been aligned with the four program goals many programs contribute to the achievement of multiple goals
An overview of the 2011 budget by strategic goal
Strategic Goal Help America promote agricultural production and biotechnology exports as America works to increase food security
bull Supports $23 billion to increase global food security through food assistance programs agricultural reconstruction and stabilization activities including $210 million for the McGovern-Dole International Food for Education and Child Nutrition Program
bull Requests $429 million the highest funding level ever for competitive grants through the Agriculture and Food Research Initiative while maintaining funding for formula grants Also the budget includes a 56 percent increase for the Sustainable Agriculture Research and Education (SARE) program aimed at helping farmers and ranchers adopt practices that are profitable environmentally sound and beneficial to communities
bull Requests $19 million an increase of 46 percent to strengthen regulatory oversight of biotechnology products and prevent regulated genetically engineered products from being co-mingled with non-regulated products
bull Increases funding for the National Organic Program by 45 percent to enhance enforcement ensure the integrity of the organic label and develop equivalency agreements to expand market access for US organic products
bull Includes a National Export Initiative that supports expanding export promotion activities as envisioned by this goal as well as spurring job creation and income growth for rural America under the strategic goal of assisting rural communities create prosperity
3
OVERVIEW
Strategic Goal Ensure that all of Americarsquos children have access to safe nutritious and balanced meals
bull Fully funds expected participation in nutrition assistance programs
bull Provides $10 billion over 10 years to strengthen the Child Nutrition and WIC programs through reforms aimed at improving program access establishing high standards for the nutritional quality of food available in schools exploring new strategies for reducing hunger and improving childrenrsquos food choices and improving program management
bull Proposes to raise current SNAP asset limits to streamline eligibility for families eligible for benefits from multiple programs and encourage families to save toward self-sufficiency This change would add $426 million to recipient benefits and SNAP program costs in 2011 with a 5-year total of $45 billion
bull Proposes to exclude lump sum tax credits from SNAP as part of a government-wide initiative for income support programs including Earned Income Child American Opportunity and Make Work Pay for 12 months following the month of receipt to prevent beneficiaries from experiencing a disruption in eligibility and benefits in the wake of new and refundable tax credits This change will increase recipient benefits and SNAP program costs about $11 million in 2011 with a 5-year total cost of $52 million Legislation is also being proposed to extend the Recovery Act provision that eliminates the time limits for able-bodied adults without dependents for an additional year for an one-time cost of $25 million
bull Provides over $1 billion for the Food Safety and Inspection Service including an increase of $27 million to more quickly identify and respond to outbreaks of foodborne illness as recommended by the Presidentrsquos Food Safety Working Group
Strategic Goal Assist rural communities to create prosperity so they are self-sustaining repopulating and economically thriving
bull Provides funding to support coordination of regional planning activities and establishes a set-aside that is roughly 5 percent of the funding about $280 million from approximately 20 existing programs that will be allocated competitively among regional pilot projects tailored to local needs and opportunities
bull Provides $50 million as part of the Administrationrsquos $400 million ldquoHealthy Food Financing Initiativerdquo to bring grocery stores and other healthy food retailers to underserved communities
bull Supports USDArsquos ldquoKnow Your Farmer Know Your Foodrdquo Initiative to facilitate the development of local and regional food systems that better connect consumers with local farms create new income opportunities for producers and place a greater focus on sustainable agricultural practices and nutritious local food
4
OVERVIEW
bull Requests $54 million for a National Export Initiative to expand export promotion activities that will spur job creation and income growth for rural America
bull Includes nearly $1 billion to foster the development of renewable energy
bull Fully funds the Voluntary Public Access and Habitat Incentive Program which encourages private landowners to voluntarily open their land to the public for hunting and fishing
bull Maintains a strong agriculture safety net through a system of income support disaster mitigation and farm loan programs Income support programs including direct and counter-cyclical payments and Average Crop Revenue Election (ACRE) payments are expected to total nearly $9 billion in 2011
bull Targets direct farm payments to those who needmdashand can most benefit frommdashassistance and reforms the crop insurance program by renegotiating the Governmentrsquos agreement with crop insurance companies
Strategic Goal Ensure our national forests and private working lands are conserved restored and made more resilient to climate change while enhancing our water resources
bull Increases funding for financial and technical assistance to support Farm Bill conservation programs to almost $5 billion that will improve water quality enroll almost 200000 additional acres of wetlands for restoration and reduce nutrient loading in the Chesapeake Bay Conservation activities will be targeted to priority landscapes through local state and Federal partnerships These priority landscapes may include the Bay-Delta region in California and the Upper Mississippi region These efforts will preserve and restore private lands protect water resources and mitigate the effects of climate change
bull Requests $50 million for the Presidentrsquos Watershed Improvement and Job Stabilization initiative through which the Forest Service will assess the condition of all of its watersheds prioritize them based on stakeholder input and the costs required to improve them and complete the highest priority projects to improve the condition of those watersheds
bull Accelerates the scale and pace of USDArsquos forest stewardship activities by transforming the Forest Service budget to take advantage of new tools to protect water resources and to make forests more resilient to climate change The budget provides full funding for the Forest Landscape Restoration Act and $30 million more for the Land and Water Conservation Fund
5
OVERVIEW
Management Initiatives
bull Provides $7 million for the Office of Advocacy and Outreach to increase the accessibility of USDA programs to underserved constituents and to carry out Farm Bill provisions concerning outreach to beginning small and socially disadvantaged farmers ranchers and rural communities Of this amount $4 million is for the agricultural labor grants program previously administered by Rural Development
bull Provides an increase of $83 million to support the Departmentrsquos multi-agency effort to modernize and upgrade the IT infrastructure The modernization effort will improve the ability of the Farm Service Agency Natural Resources Conservation Service and Rural Development to serve program participants This funding will allow for the first system-wide refresh of the Common Computing Environment (CCE) since the infrastructure was implemented in 2000
bull Requests $65 million to support a Government-wide Contracting and Acquisition Workforce Training initiative The requested funding will allow USDA to implement training recruitment and retention activities for the Departmentrsquos procurement workforce that is responsible for over $5 billion in annual procurement for the Department
6
HIGHLIGHTS BY GOALS
For 2011 the Departmentrsquos budget process was organized around four program goals and an overarching management goal to improve collaboration among mission areas and agencies and to strengthen the effectiveness of USDA programs This budget presentation reflects the Departmentrsquos goal-based organizational budget process It should be noted that although agency programs and associated funding have been aligned with the four program goals many programs contribute to the achievement of multiple goals
Highlights of the 2011 budget by strategic goal
STRATEGIC GOAL HELP AMERICA PROMOTE AGRICULTURAL PRODUCTION AND BIOTECHNOLOGY EXPORTS AS AMERICA WORKS TO INCREASE FOOD SECURITY
Global food insecurity affects people worldwide and the current economic downturn has exacerbated the problem Recent estimates from the United Nations Food and Agricultural Organization suggests that more than one billion people around the world are chronically hungry It is important to note that a significant percentage of that one billion is children In addition to ensuring that the worldrsquos children have enough to eat the United States has a strong interest in promoting strong agricultural systems in the developing world because failing agricultural systems and food shortages fuel political instability and diminish the economic vitality of developing nations Working with other Federal partners the Department is working towards reducing global food insecurity and increasing agriculture-led economic growth in developing countries USDArsquos capacity-building technical assistance and food assistance programs are effective tools for improving the capacity of countries to produce what they need and to make that food accessible to those who need it In addition USDA helps American farmers and ranchers use effective technologies and value-added products such as biotechnology to increase agricultural productivity and nutritional value of foods which can enhance food security around the world Key efforts are to (1) ensure that US agricultural resources contribute to enhanced global food security (2) enhance Americarsquos ability to develop and trade agricultural products derived from new technologies and (3) promote productive agricultural systems that enable food-insecure countries to feed themselves
Help America promote agricultural production and biotechnology exports as America works to increase food security
Budget Authority (Dollars in Millions)
2009 2010 2011 Program Enacted Estimate Budget
Farm and Foreign Agricultural Serviceshelliphelliphelliphelliphelliphelliphelliphelliphellip $3021 $2302 $2320 Natural Resources and Environmenthelliphelliphelliphelliphelliphelliphelliphelliphelliphellip 5 6 6 Marketing and Regulatory Programshelliphelliphelliphelliphelliphelliphelliphelliphelliphellip 42 42 49 Research Education and Economicshelliphelliphelliphelliphelliphelliphelliphelliphelliphellip 752 796 785 Totalhelliphelliphelliphelliphelliphelliphelliphelliphelliphelliphelliphelliphelliphelliphelliphelliphelliphelliphelliphelliphellip $3820 $3146 $3160
7
HIGHLIGHTS BY GOALS
Key Proposals for the 2011 Budget
bull Maintain funding for the McGovern-Dole International Food for Education and Child Nutrition Program The McGovern-Dole Program supports maternal infant and child nutrition programs in developing countries supporting food security and a healthy young population which in turn builds stable societies and increases national security The budget continues funding for the McGovern-Dole program at the 2010 enacted level of $2095 million Appropriated funding for the program was increased substantially in 2010 in order to help support additional school feeding and child nutrition programs and to bolster the Departmentrsquos contribution to supporting economic development and food security in developing countries The program is expected to assist an estimated 5 million women and children in 2011
bull Strengthen Agricultural Reconstruction and Stabilization Activities The budget provides $146 million to support the Departmentrsquos participation in reconstruction and stabilization activities primarily in Afghanistan and Iraq USDArsquos efforts support implementation of the Presidentrsquos strategies for these countries by providing technical experts who serve as advisors to key government ministries and serve on civilian-military command units including Provincial Reconstruction Teams working with farmers and local agricultural officials throughout the targeted countries During 2010 USDA is increasing the number of agricultural experts serving in Afghanistan from 14 to 64 Their work is essential for stabilizing strategic areas of the country building government capacity ensuring the successful management of assistance programs and addressing the issue of food insecurity It is estimated that as much as 80 percent of the Afghan population relies on agriculture for wages and sustenance Consistent with these efforts the Department has established a priority for increasing the number of Afghan provinces in which women and children are food secure from 10 to 14 by the end of 2011
bull Expand research to increase the adaptation of sustainable agricultural systems to farmerrancher and ecosystem needs The budget includes an increase of $11 million for Sustainable Agriculture Research and Education (SARE) programs bringing total funding to $30 million This includes $10 million for the creation of a new Federal-State Matching Grant program to assist in the establishment and enhancement of State sustainable agriculture research education and extension programs The matching requirement will leverage State or private funds SARE works to increase knowledge about and to help farmers and ranchers adopt practices that are profitable environmentally sound and beneficial to communities These competitive grants for sustainable agriculture research and education projects are awarded to scientists producers and others in order to solve problems in an interdisciplinary approach SARE grants also fund education and demonstration projects including the development of farmer-to-farmer networks Increased investment in SARE will provide American producers the tools necessary to ensure a profitable livelihood while protecting and conserving the Nationrsquos land and water resources Approximately 17000 farmers and ranchers will experience benefits by implementing innovative practices learned by participating in SARE
bull Strengthen Biotechnology Regulation The budget provides about $19 million for Biotechnology Regulatory Services within the Animal and Plant Health Inspection Service
8
HIGHLIGHTS BY GOALS
(APHIS) to assess the risks of forthcoming genetically modified organisms This is an increase of about $6 million compared to 2010 This funding will contribute to the Departmentrsquos objective of enhancing Americarsquos ability to develop and trade agricultural products derived from new technologies This includes working to prevent regulated genetically engineered products from being co-mingled with non-regulated products in commercial channels A strong regulatory system is needed to ensure the safe intr oduction of biotechnology products and to provide multiple agricultural production options
bull Maintain the integrity of the National Organic Program With sales of organic products increasing at close to 20 percent a year over the last decade additional resources are needed to ensure the integrity of the organic label As a result the 2011 budget includes an increase of $31 million for the National Organic Program almost a 45 percent increase above the 2010 funding level The increase includes $21 million for regulatory review enforcement and development of equivalency agreements plus a one-time increase of $1 million to assist accredited certifying agents enhance compliance with program regulations and ensure the integrity of the organic label which may lead to enhanced export opportunities In addition 2008 Farm Bill funds will continue to be used to provide cost share assistance for organic certification An increase of $03 million is requested for AMSrsquo Market News to continue vital data collection and repor ting of organic commodity information initiated with 2008 Farm Bill funding
bull Initiatives under other goals that promote agricultural production and exports As previously noted although agency programs and associated funding have been aligned with the four program goals many programs contribute to the achievement of multiple goals Additional initiatives that promote agricultural production and exports and the goal of assisting rural communities to create prosperity are discussed beginning on page 13 These initiatives include increasing the competitiveness of American agricultural exports maintaining a strong agricultural safety net modernizin g the farm program delivery system and ensuring fair and competitive agricultural markets
STRATEGIC GOAL ENSURE THAT ALL OF AMERICArsquoS C HILDREN HAVE ACCESS TO SAFE NUTRITIOUS AND BALANCED MEALS
A plentiful supply of safe and nutritious food is essential to the well-being of every family and the healthy development of every child in America A recent report by the Department showed that in over 500000 families with children in 2008 one or more children simply do not get enough to eat There is a growing body of evidence demonstrating that children who eat poorly or who engage in too little physical activity do not perform as well as they could academically and that improvements in nutrition and physical activity can result in improvements in academic performance Too many children also have poor diets and gain excessive weight Recent data shows that the prevalence of obesity has increased over 10 percent to 17 percent for children between 6 and 19 years of age There is also a paradox that hungry children are disproportionately prone to obesity Having poor access to healthy food contributes significantly to both of these problems The 2011 budget includes a $400 million Administration proposal to address these access issues
9
HIGHLIGHTS BY GOALS
Foodborne illness is recognized as a significant public health problem in the United States which can have a more severe impact on children than healthy adults According to the Centers for Disease Control and Prevention approximately half of the reported foodborne illnesses occur in children These illnesses can lead to short and long-term health consequences and sometimes death USDA and other Federal agencies are working in cooperation to ensure that Americarsquos children have increased access to safe and healthy food The end result will be healthier more active children who will be better able to succeed and live vital lives
USDA helps keep safe nutritious food accessible and affordable by preventing the entry and establishment of agricultural pests and diseases and minimizing production losses Safeguarding animal and plant resources against the introduction of foreign agricultural pests and diseases provides access to a diverse supply of fruits vegetables meat and poultry The Department detects and quickly responds to new invasive species and emerging agricultural and public health situations These efforts contribute to the overall agricultural health of the nations and the world
USDA supports and protects the Nationrsquos agricultural system and the consumers it serves by safeguarding the quality and wholesomeness of meat poultry and egg products providing nutrition assistance to children and low-income people who need it and proactively addressing and preventing loss and damage from pests and disease outbreaks Actions to support this goal include (1) helping put a healthy diet within reach of every American by increasing access to nutritious food (2) promoting healthy diet and physical activity behavior s (3) protecting public health by ensuring food is safe and (4) protecting agricultural health by minimizing major diseases and pests to ensure access to safe plentiful and nutritious food
Ensure that all of Americas children have access to safe nutritious and balanced meals
Budget Authority (Dollars in Millions)
2009 2010 2011 Program Enacted Estimate Budget
Food Nutrition and Consumer Serviceshelliphelliphelliphelliphelliphelliphelliphelliphellip $82249 $93854 $107617 Food Safetyhelliphelliphelliphelliphelliphelliphelliphelliphelliphelliphelliphelliphelliphelliphelliphelliphelliphelliphelliphellip 983 1028 1046 Marketing and Regulatory Programshelliphelliphelliphelliphelliphelliphelliphelliphelliphellip 1364 1613 1530 Research Education and Economicshelliphelliphelliphelliphelliphelliphelliphelliphelliphellip 445 479 470 Totalhelliphelliphelliphelliphelliphelliphelliphelliphelliphelliphelliphelliphelliphelliphelliphelliphelliphelliphelliphelliphellip $85041 $96974 $110663
Key Proposals for the 2011 Budget
bull Strengthen Child Nutrition and WIC programs Reauthorization of the Child Nutrition and the Special Supplemental Nutrition Program for Women Infants and Children (WIC) programs will provide significant opportunity to make available the resources needed to achieve the Presidentrsquos goal to eliminate childhood hunger by 2015 The Administration is proposing to add $10 billion over the next ten years for this effort These programs touch virtually every child in America by providing nutritious food and nutrition education to help them get the best start they can in life and connect them with critical health care services
10
HIGHLIGHTS BY GOALS
The Administrationrsquos proposals consistent with the recent National Academies Institute of Medicine (IOM) study would improve access to nutritious meals particularly for low-income children improve access to healthy fruits and vegetables reduce the prevalenc e of obesity by improving the diets of school children and by encouraging children to make wise food choices in and outside of school and improve program performance and integrity
bull Fully fund WIC WIC helps improve the health and nutritional intake of low-income pregnant breast-feeding and postpartum women infants and children up to their fifth birthday A record $76 billion is requested to ensure that all eligible women infants and children who want to participate can In addition significant increases are provided to foster increased breastfeeding including more funds for bonuses to States with high achievement in this important health priority The funding includes the resources necessary for State agencies to administer the program and to make good on the promise of the updated WIC food packages implemented beginning in FY 2010 The new food packages align with the Dietary Guidelines and infant feeding guidelines of the American Academy of Pediatrics to better promote breastfeeding increase participant rsquos consumption of fruits vegetables and whole grains and provide flexibility to accommodate cultural food preferences WIC funding will support over 10 million participants
bull Expand Supplemental Nutrition Assistance Program (SNAP) The Administration is working to establish a practical national asset limit floor across means-tested human services food and cash assistance programs Legislative language will be provided to raise current SNAP asset limits to $10000 from $2000 per household or $3000 for households including an elderly or disabled member This nationwide figure will streamline eligibility for families eligible for benefits from multiple programs and encourage families to save toward self-sufficiency This change would add $426 million to recipient benefits and SNAP program costs in 2011 with a 5-year total of $45 billion In addition FNS seeks to minimize eligibility churning and disruption caused when SNAP households receive lump sum tax refunds Legislative language will also provide for the exclusion of tax refunds in the month of receipt and for the following 12 months beginning in tax year 2009 for SNAP and all federally funded means-tested programs This will exclude lump sum tax credits including Earned Income Child American Opportunity and Make Work Pay for 12 months following the month of receipt This policy will prevent beneficiaries from experiencing a disruption in eligibility and benefits in the wake of new and refundable tax credits This change will increase recipient benefits and SNAP program costs about $11 million in 2011 with a 5-year total cost of $52 million Legislation is also bein g proposed to extend the Recovery Act provision that eliminates the time limits for able-bodied adults without dependents for an additional year for a one-time cost of $25 million
bull Strengthen administration and oversight of nutrition assistance programs Additional funding is needed to increase the staff available to improve access to nutrition assistance advance the public trust and enhance the nutritional quality of our nutrition assistance programs With rising program levels due to increased demand for nutrition assistance and rising public awareness of these significant outlays it is vital that the Food and Nutrition Service have sufficient staffing to maintain program oversight At the same time FNS is working to support the reauthorization of the Child Nutrition and WIC Programs implement the Child Nutrition Reauthorization extension programs develop proposals for the
11
HIGHLIGHTS BY GOALS
2012 Farm Bill and implement the school meal pattern regulations from the Institute of Medicine recommendations on a significantly compressed timeline FNS staff years have declined significantly from a peak of over 2700 down to less than 1300 in 2009 as program level has i ncreased significantly For 2011 the budget includes an increase of $52 million to enhance the Federal investment in program administration grantee oversight and program integrity
bull Improve nutrition education and promotion resources To ensure USDA makes progress on its strategic objectives to decrease the prevalence of obesity among children and adolescents and to improve the quality of the diets measured by the Healthy Eating Index (HEI) scores for people in low-income households (under 130 of poverty level) and for the general population the budget includes an increase of $9 million The increase will allow USDA to significantly increase development of scientific-evidence-based nutrition guidance that provides the basis for nutrition education and promotion provided by our public and private sector partners Updated Dietary Guidelines for Americans will be completed in 2010 along with enhancements to MyPyramid including interactive applications The increased funding will be used to create effective nutrition education inte rventions for schools and communities and broaden and maintain tools and systems that Americans can use to adopt behaviors that lead to more healthful eating and active lifestyles
bull Strengthen the food safety infrastructure The budget includes $1 billion for the Food Safety and Inspection Service an increase of $18 million over 2010 and funds recommendations of the Presidentrsquos Food Safety Working Group (FSWG) and other initiatives aimed at improving USDArsquos public health infrastructure Effective food safety inspections and enforcement depend upon timely quality data and analysis To ensure inspectors have the information they need the Department has invested in an automated system to alert inspectors about potential food safety problems and give them greater and more timely access to establishment performance data The Presidentrsquos budget includes a request of $40 million an increase of $13 million to continue the deployment and enhancement of the FSIS public health information infrastructure Additionally in support of key findings of the Presidentrsquos FSWG USDA will hire more epidemiologists to improve investigations of foodborne illness and outbreaks in coordination with State officials to develop ldquotrace backrdquo tools and improve record-keeping Similarly the 2011 budget proposes a $10 million increase for Baseline Studies and Hazard Analysis and Critical Control Points (HACCP) Verification Program Updates This increase above the 2010 level will allow FSIS to improve surveillance of foodborne pathogens of human-health concern in FSIS-regulated products through significant expansion of the HACCP regulatory sampling and to develop more timely estimates of pathogen prevalence in food products Accurate timely prevalence estimates for pathogens in food products are critical for evaluation of existing prevention policies and the development of new regulatory strategies These new investments will enhance FSISrsquo ability to collect analyze and present data to allow decision making based on relevant timely product and process data utilizing the best science available and respond to foodborne illness outbreaks more effectively and efficiently to better protect consumers and help industry recover faster
bull Minimize the impact of major animal and plant diseases and pests As part of the Departmentrsquos goal to ensure children have access to safe nutritious and balanced meals
12
HIGHLIGHTS BY GOALS
APHIS and other agencies protect agricultural health by minimizing major diseases and pests APHIS activities that contribute to this goal include pest and disease exclusion plant and animal health monitoring response to outbreaks of foreign plant and animal threats and management of endemic pest and diseases Of note the 2011 budget includes $11 million to continue efforts initiated with emergency funding to address the light brown apple moth (LBAM) This is an increase of $10 million compared to 2010 The LBAM is an invasive pest that attacks a wide variety of plants of agricultural or horticultural significance APHIS estimates the pest could cause annual production losses up to $1 billion if allowed to spread
bull Expand food safety research The safety of the food supply continues to be a vital public health priority Therefore USDA research continually works to meet the evolving threats to the Nationrsquos food supply The Departmentrsquos research focuses on the reduction of the hazards of introduced and naturally occurring toxins in foods and feed including pathogenic bacteria viruses parasites chemical contaminants mycotoxins and naturally occurring toxins produced by plants As part of an integrated food safety research initiative the budget proposes an increase of $25 million $20 million through NIFArsquos Agriculture and Food Research Initiative competitive program and an additional $5 million for ARS food safety research These initiatives will strengthen surveillance and epidemiology program s control food pathogens in the preharvest stage develop innovative interventions strategies to eliminate pathogens and contaminants and ensure postharvest safety and quality
bull Increase the level of obesity prevention research The increasing prevalence of overweight and obesity is unprecedented in US history and is a major cause of escalating health care costs and a predisposition of Americans to cardiovascular disease Type 2 diabetes and several cancers There is a critical need for effective proven methods for the prevention of weight gain as an important step for reducing overall obesity and overweight in the population The 2011 budget includes an increase of $50 million for research through the Agriculture and Food Research Initiative competitive grant program that will focus on identifying behavioral factors that influence obesity and conducting nutrition research that leads to the development of effective programs to prevent obesity AFRI funding will also focus research on addressing the micronutrient content of new food crops and improving the nutritional value of staple crops fruits and vegetables through plant breeding leading to greater access to healthy foods
STRATEGIC GOAL ASSIST RURAL COMMUNITIES TO CREATE PROSPERITY SO THEY ARE SELF-SUSTAINING REPOPULATING AND ECONOMICALLY THRIVING
The economic downturn has impacted many sectors and areas of the Nation including rural America At this time there remains high poverty in sparsely populated rural areas which is reflected in higher mortality rates for children higher unemployment and declining populations Since the beginning of the economic slowdown rural residents have experienced a greater decline in real income compared to other parts of the Nation Some factors contributing to this include lower rural educational attainment less competition for workers among rural employers and fewer highly skilled jobs in the rural occupational mix Given these challenges it is not surprising that over 51 percent of rural counties lost population and that a majority of farm families rely on a significant amount of off-farm income to meet their needs However an
13
HIGHLIGHTS BY GOALS
energetic and creative citizenry is looking for new ways to spur rural economic activity to create prosperity and strengthen the economic foundations of their communities Rural communities and businesses are implementing innovative technologies and modernizing infrastructure to create jobs develop new markets and increase competitiveness while conserving the Nationrsquos natural resources and providing a safe sufficient and nutritious food supply for the country and the world As a leading advocate for rural America USDA is at the forefront of developing the technology and tools necessary to transform rural America to take advantage of new opportunities
The Department supports rural communities and enhances quality of life for rural residents by improving their economic opportunities community infrastructure environmental health and the sustainability of agricultural production The common goal is to help create thriving rural communities where people want to live and raise families and where the children have economic opportunities and a bright future USDA will support this goal with actions to support a competitive agricultural system create livable communities and enhance rural prosperity The cornerstone of these efforts include five pillars of success which are (1) increasing access to broadband and continuous business creation (2) facilitating sustainable renewable energy development (3) developing regional food systems (4) capitalizing on climate change opportunities and (5) generating and retaining jobs through recreation and natural resource restoration conservation and management
Assist rural communities to create prosperity so they are self-sustaining repopulating and economically thriving
Budget Authority (Dollars in Millions)
2009 2010 2011 Program Enacted Estimate Budget
Farm and Foreign Agricultural Serviceshelliphelliphelliphelliphelliphelliphelliphelliphellip Rural Developmenthelliphelliphelliphelliphelliphelliphelliphelliphelliphelliphelliphelliphelliphelliphelliphelliphellip Natural Resources and Environmenthelliphelliphelliphelliphelliphelliphelliphelliphelliphellip Marketing and Regulatory Programshelliphelliphelliphelliphelliphelliphelliphelliphelliphellip Research Education and Economicshelliphelliphelliphelliphelliphelliphelliphelliphelliphellip Office of the Secretaryhelliphelliphelliphelliphelliphelliphelliphelliphelliphelliphelliphelliphelliphelliphelliphellip Office of the Chief Economisthelliphelliphelliphelliphelliphelliphelliphelliphelliphelliphelliphelliphellip
$20378 7247 2005
950 1355
0 6
$19171 3343
978 871
1286 0 6
$19848 2944
986 868
1267 35 6
Totalhelliphelliphelliphelliphelliphelliphelliphelliphelliphelliphelliphelliphellip helliphelliphelliphelliphelliphelliphellip hellip $31941 $25655 $25954
Key Proposals for the 2011 Budget
Multi-Agency Initiatives
bull Increase the prosperity of rural communities by strategically investing in regional innovation In recent years rural communities have been losing population have a growing income disparity with urban communities and have an aging workforce To increase prosperity USDA proposes to establish a Regional Innovation Initiative to focus on the
14
HIGHLIGHTS BY GOALS
planning and coordination of USDA and other sources of assistance for rural communities The initiative recognizes that individual communities are often affected by linkages to the other communities within regions and that working together can produce more prosperity for all By creating a regional focus and increasing collaboration with other Federal agencies USDA resources will have a larger impact enabling greater wealth creation quality of life improvements and sustainability USDA will implement a strategy that includes substantial technical assistance to enable rural regions to develop regional strategic plans Several USDA agencies will participate in the initiative including agencies from the Rural Development Marketing and Regulatory Programs and Natural Resources and Environment mission areas Beginning in 2010 USDA intends to explore its current authorities to demonstrate the potential for this approach The 2011 budget includes $14 million in Rural Development to support coordination of regional planning activities It also includes a general provision to provide a 5 percent set-aside of the funding for several USDA programs This set aside will facilitate funding for proje cts that are part of a regional strategy subject to projects meeting the eligibility requirements for the individual programs The set-aside would amount to over $135 million in budget authority which would be sufficient to support a program level of about $280 million
bull Provide incentives for food entrepreneurs to establish or expand markets and grocery stores to make healthy foods available to underserved Americans The 2011 Budget provides funding for a new multi-year multi-agency Healthy Food Financing Initiative that will increase the availability of affordable healthy foods in underserved urban and rural communities particularly through the development or equipping of grocery stores and other healthy food retailers The Departments of Agriculture Health and Human Services and Treasury will partner to make available over $400 million in financial and technical assistance to community development financial institutions other nonprofits public agencies and businesses with sound strategies for addressing the healthy food needs of communities The USDA budget includes a total of $50 million for the initiative These funds will be made available for a number of loan grant promotion and other programs that provide financial and technical assistance to support market p lanning and promotion efforts as well as infrastructure and operational improvements designed to stimulate consumer demand enhance marketing expand demand and retail outlets for farm products and increase availability of locally and regionally produced foods
bull Increase economic opportunities for producers by developing local and regional food systems USDArsquos ldquoKnow Your Farmer Know Your Foodrdquo initiative will facilitate the development of local and regional food systems that better connect consumers with local farms create new income opportunities for farmers and place a greater focus on sustainable agricultural practices and nutritious local food An increased emphasis on regional food systems will have direct and significant benefits to rural communities USDA will work to promote local and regional distribution and utilize existing strategic partnerships to levera ge local food systems USDA will also work more closely with local purchasers institutional purchasers and other regional stakeholders to create regional support systems This effort will leverage funding and program expertise from every mission area of the Department
15
HIGHLIGHTS BY GOALS
bull Promote the development of renewable energy to support energy independence and a healthier environment USDA promotes rural Americarsquos leadership in the research development and sustainability of renewable energy and energy efficiency in order to effectively reduce Americarsquos dependence on foreign oil and reduce greenhouse gas emissions USDA programs make it economically feasible for farmers ranchers and other rural small businesses to invest in alternative energy production and energy-saving activities Through funding opportunities in the form of payments grants loans and loan guarantees USDA is committed to developing clean energy sources promoting energy efficiency and curbing the effects of climate change The 2011 budget supports renewable energy development through commercialization and research This support will create jobs help establish businesses and improve economic prosperity in rural areas The budget includes funding for programs with specific energy-related purposes including the Rural Energy for America Program (REAP) and the Biorefinery Assistance Program to add to the mandatory funding provided through the 2008 Farm Bill Funding for several business programs including the Business and Industry Loan Guarantee Program and Value-Added Grants will be available for green energy projects Funding for the Homeownership Loan and Loan Guarantee programs will provide financing for more energy efficient homes In support of the Presidentrsquos commitment made at the 2009 G20 Summit the budget will target Electric Loan Program financing to alternative energy and end subsidies for the generation of electricity using fossil fuel Finally the budget includes an increase of $34 million for a comprehensive research program in alternative and renewable energy within the Agriculture and Food Research Initiativersquos competitive grant program This will advance the development of dedicated sustainable feedstocks and feedstock production systems which will not impact the food supply
bull Make rural America a better place to live USDA seeks not only to enhance the opportunities necessary for rural families to thrive economically but also to improve the living conditions in rural communities so that they are places where people can thrive USDA provides the resources and expertise necessary to rebuild the infrastructure of small communities ensuring that rural residents have decent housing and home-ownership opportunities clean water adequate systems for handling waste and vital community facilities including critical health-care centers schools and public safety departments For 2011 the budget supports $12 billion for rural home ownership by establishing a fee structure consistent with other Federal housing programs that will eliminate the subsidy costs for all new guaranteed loans Furthermore the budget includes a loan level increase of over $25 million to provide funding to support additional multi-family housing for very-low and low income families In 2011 the budget supports $16 billion in program level to provide over 14 million rural households with new or improved water and waste disposal facilities
A healthy environment is also an essential ingredient for thriving sustainable rural communities and rural quality of life For 2011 the Conservation Stewardship Program (CSP) will serve a key rol e in improving and maintaining the quality of surface water and groundwater in order to protect human health support a healthy environment and enable the productive use of land The FY 2011 budget funds CSP at approximately $630 million and nearly half or $315 million is targeted towards conservation planning and implementation to meet this strategic goal
16
HIGHLIGHTS BY GOALS
Improving agricultural education is critical to retaining young people in rural America The 2011 budget includes a number of investments in education including $10 million for the Hispanic-Serving Agricultural Colleges and Universities Endowment Fund The annual interest earnings from the Endowment Fund will be used to enhance education in agricultural sciences and related disciplines by building educational capacity at these institutions in the areas of curricula design faculty development and student recruitment and retention Additionally increased funding of $23 million is proposed in 2011 for expanding extension education programs on Indian Reservations and Tribal jurisdictions through the Federally-Recognized Tribes Extension Program and an increase of $1 million is required for Tribal Colleges Extension Services at all 1994 land-grant institutions to address the nutrition education needs of Native American s The budget also includes an increase of $5 million to support the next generation of agricultural scientists in the workforce by working with higher-education institutions to develop education and training programs with strong science technology engineering and math curriculums and increase enrollment in secondary and two-year post-secondary programs
Other Proposals
bull Increase the competitiveness of American agricultural exports Agricultural trade contributes directly to the prosperity of local and regional economies across rural America through higher commodity prices and increased sales USDA estimates that every $1 billion worth of agricultural exports supports 9000 jobs and generates an additional $14 billion in economic activity At the same time however foreign trade barriers limit exports thereby reducing farm income and preventing job growth in the agricultural sector The 2011 budget supports the National Export Initiative by providing increased funding of $54 million for the Foreign Agricultural Service (FAS) to support activities that will help to bolster the level of US agricultural exports and thereby contribute to enhanced rural prosperity and employment Of the funding provided $10 million will be used to expand FAS exporter assistance and in-country promotion activities and to meet higher operating costs at FAS overseas posts The initiative also includes $345 million to supplement funding for the Foreign Market Development (Cooperator) Program and $9 million for the Technical Assistance for Specialty Crops (TASC) Program Funding for the Cooperator and TASC programs will be in addition to that provided by the Commodity Credit Corporation and will double the overall level of funding for both programs in 2011
bull Maintain a strong agriculture safety net The 2011 budget maintains strong support for American farmers and ranchers through a system of income support disaster mitigation and farm loan programs Income support programs including direct and counter-cyclical payments and Average Crop Revenue Election payments are expected to total nearly $9 billion in 2011 The budget proposes modest reductions in the current cap on direct payments and a three-year phased reduction in farm program average Adjusted Gross Income eligibility limits for large farmers and wealthy landowners These adjustments in current program limits would affect only a very small portion of the farm program participants without disturbing the foundation of the current safety net for productive family farmers Disaster mitigation programs include the Supplemental Agricultural Disaster Assistance (SADA) programs and the Federal crop insurance program FY 2011 assistance under the SADA programs is expected to total about $14 billion while net indemnities (gross
17
HIGHLIGHTS BY GOALS
indemnities minus producer premium) under the Federal crop insurance program are expected to total about $46 billion Farm loan programs including direct and guarantee d farm ownership operating and conservation loans and Indian fractionated land loans are expected to total over $47 billion in 2011 The budget proposes $5 million increase in funding for the county estimates data collected by the National Agricultural Statistics Service Improving the quality of this data will enhance the integrity of the farm programs
bull Create new economic opportunities for American agriculture through environmental services markets To support the Departmentrsquos efforts of creating economic opportunities in rural America the 2011 budget includes activities to expand market opportunities for farmers ranchers and forest landowners Although climate change is a critical challenge facing the agricultural and forestry communities proposed legislation to respond to that challenge may create significant economic opportunities To take advantage of these opportunities USDA is seeking $2 million to support the Office of Ecosystem Services and Markets to provide analysis and establish guidelines for participation of agriculture producers and forest landowners in potential offset markets under a carbon cap and trade system These guidelines will also support market opportunities in the provision of other ecosystem services beyond carbon sequestration such as wildlife habitat preservation and water quality management Through the development of these guidelines USDA will strive to expand opportunities in rural America to create prosperity while conserving natural resources
bull Continue modernization of the farm program delivery system Continued progress needs to be made in modernizing IT systems critical to the delivery of farm service programs These systems support the delivery of over $9 billion of farm program benefits to 14 million producers Several initiatives are underway to streamline business processes and transition them away from an antiquated legacy IT system to a 21st century IT system When fully implemented these new delivery processes will expedite the delivery of all farm programs including the 2008 Farm Bill programs An increase of $953 million is proposed to support these modernization efforts This amount consists of $393 million directed toward the multi-year MIDAS initiative to streamline business processes for farm program delivery $20 million to convert software and transition applications from outmoded legacy systems to new web-based technologies and $36 million to support an $83 million multi-agency effort to refresh the aging hardware supporting the Common Computing Environment in order to maintain system reliability
bull Create National Forest recreation and forestry job opportunities USDA natural resources conservation restoration and land management programs generate economic value by attracting tourism and recreation visitors and sustaining green jobs including work restoring or creating trails and facilities providing camping boating and outfitter and guide services and supporting associated retail businesses The 2011 Forest Service (FS) recreation budget includes an increase of $5 million to ensure the National Forest roads that provide recreation opportunities to the public match the FSrsquo newly created motor-vehicle-use maps The FS budget also contains $50 million for the Presidentrsquos new Pr iority Watersheds and Job Stabilization initiative A main focus of this initiative will be creating and preserving jobs After conducting a prioritization assessment FS will use stewardship contracts (10 years in length) to produce long-term jobs across the Nation Moreover the agency will leverage outside sources to create jobs for youth in rural areas
18
HIGHLIGHTS BY GOALS
bull Ensure fair and competitive agricultural markets The 2011 budget includes an increase of $18 million to further streng then enforcement of the Packers and Stockyards Act With additional staff and legal support the Grain Inspection Packers and Stockyards Administration will bolster direct enforcement and promote greater voluntary compliance with the Act Current staffing levels are insufficient to address the growing need for regulatory and audit activities
STRATEGIC GOAL ENSURE OUR NATIONAL FORESTS AND PRIVATE WORKING LANDS ARE CONSERVED RESTORED AND MADE MORE RESILIENT TO CLIMATE CHANGE WHILE ENHANCING OUR WATER RESOURCES
A healthy and prosperous America relies on the health of our natural resources and particularly our forests and agricultural working lands The health of Americarsquos forests farmers ranchers and grasslands must be nurtured so that they continue to offer environmental benefits as a source of clean air clean and abundant water and wild life habitat Americarsquos forests supply communities with clean abundant water shelter wildlife and help us mitigate and adapt toclimate change Forests also help generate rural wealth through recreation and tourism through the creation of green jobs and through the production of wood products and energy They are a source of cultural heritage and are a national treasure
USDA plays a pivotal role in protecting and restoring these lands while making them more resilient to threats and enhancing our natural resources USDA partners with private landowners to help protect the Nationrsquos 13 billion acres of farm ranch and private forestlands As public land stewards USDA works to conserve and restore 193 million acres of National Forests and Grasslands in the National Forest System Through these programs USDA partners with other Federal agencies tribal and state governments and non-governmental organizations to assist land and natural resource managers and to connect people to the Nationrsquos magnificent lands USDA agencies provide technical financial and planning assistance to public and private partners USDArsquos data banks research and innovations give landowners and managers access to the latest science and technology to make informed decisions and implement conservation practices USDA also connects forest and farm landowners with emergent markets for ecosystem services so that they can reap the economic and environmental benefits of good stewardship This goal will be supported with actions to (1) Restore and conserve the Nationrsquos forests farms ranches and grasslands (2) Lead efforts to mitigate and adapt to climate change (3) Protect and enhance Americarsquos water resources and (4) Reduce risk from catastrophic wildfire and restore fire to its appropriate place on the landscape
19
HIGHLIGHTS BY GOALS
Ensure our national forests and private working lands are conserved restored and made more resilient to climate change while enhancing our water resources
Budget Authority (Dollars in Millions)
2009 2010 2011 Program Enacted Estimate Budget
Farm and Foreign Agricultural Serviceshelliphelliphelliphelliphelliphelliphelliphelliphellip $2245 $2331 $2317 Natural Resources and Environmenthelliphelliphelliphelliphelliphelliphelliphelliphelliphellip 8564 9149 9146 Marketing and Regulatory Programshelliphelliphelliphelliphelliphelliphelliphelliphelliphellip 86 101 71 Research Education and Economicshelliphelliphelliphelliphelliphelliphelliphelliphelliphellip 420 444 448 Office of the Chief Economisthelliphelliphelliphelliphelliphelliphelliphelliphelliphelliphelliphelliphellip 0 3 3 Hazardous Materials Managementhelliphelliphelliphelliphelliphelliphelliphelliphelliphelliphellip 5 5 5 Totalhelliphelliphelliphelliphelliphelliphelliphelliphelliphelliphelliphelliphelliphelliphelliphelliphelliphelliphelliphelliphellip $11320 $12033 $11990
Key Proposals for the 2011 Budget
Multi-Agency Initiatives
bull Expand funding for financial and technical assistance to support Farm Bill conservation programs The budget includes record levels of support for Farm Bill conservation programs bringing total funding to about $5 billion an increase of $42 million Recognizing the need for judicious allocation of these conservation resources the budget reflects a strategic targeting of high priority programs current workforce and workload capacity and efforts to ensure financial integrity and cost effectiveness This level of funding will also ensure beneficial results from investments in conservation The Conservation Reserve Program is funded at $196 billion about the same level as 2010 to support total enrollment of more than 30 million acres The Environmental Quality Incentives Program (EQIP) which is vital to ensuring that agricultural lands are effectively managed to support both agricultural production and conservation is funded at $121 billion an increase of $28 million over 2010 The Chesapeake Bay Watershed Initiative which is operated under EQIP will be funded at a level of $72 million an increase of $29 million over 2010 to help agricultural producers install conservation practices in the Chesapeake Bay watershed Funding for the newly operational Conservation Stewardship Program will be increased by $160 million to a total of $629 million which will enroll 12 million new acres in the program as well as support prior year contracts Wetlands are among the most productive ecosystems in the world that provide countless economic and environmental benefits to local communities The Wetlands Reserve Program which is one of the principal programs that support wetlands preservation and restoration is funded at $502 million in 2011 This will enable enrollment of nearly 193000 new acres into the program a level well above recent year enrollments
bull Enhance the protection of the Nationrsquos water supply To accelerate progress in protecting and enhancing the Nationrsquos water supply strategic conservation efforts are called for that identify the priority landscapes most in need of attention the critical acres within those
20
HIGHLIGHTS BY GOALS
landscapes and the high impact target (HIT) practices that will deliver the greatest benefit The 2011 budget supports efforts by the Natural Resources Conservation Service and the Forest Service to achieve the Departmentrsquos priority for accelerating the protection of clean abundant water resources by implementing HIT practices on 15 million acres of agricultural lands and 15 million acres of National Forests in priority landscapes HIT practices are those conservation measures identified by the Department to have the most significant impact on improving or conserving land and water resources Priority land scapes may include the Chesapeake Bay Upper Mississippi River Delta Lower Mississippi River Delta the Sierra Nevada the Front Range of Colorado and the California Bay Delta
Other Proposals
bull Improve targeting of conservation technical and financial assistance The 2011 budget proposes an innovative new approach to improving the Departmentrsquos strategic investment in conservation by establishing and deploying Strategic Watershed Action Teams in high priority watersheds that would help plan and apply conservation practices in a defined landscape The budget includes an increase of $25 million to support up to 35 teams of five NRCS employees each to target an identified watershed for a period of 3 to 4 years with the intent of reaching 100 percent of the landowner base eligible for Farm Bill conservation program assistance The additive effect of planned and applied conservation practices would hasten environmental improvement while keeping production agriculture competitive and profitable This initiative should greatly increase the environmental cost-effectiveness of NRCS technical and financial assistance programs It will also improve the agencyrsquos coordination with the Forest Service as that agency seeks to adopt a more landscape-scale approach to leverage its natural resource programs and to conserve and restore forestland and grassland
bull Increase support for the Land and Water Conservation Fund (LWCF) The LWCF is a special account created in 1964 and has been the principal federal source of monies to acquire new recreation lands Forest Service is one of four federal agencies to receive a portion of these funds The fund accumulates revenues from designated sources and they become available only after Congress appropriates them In line with the Presidentrsquos commitment t o fully fund the LWCF by 2014 the Forest Servicersquos Forest Legacy program and Land Acquisition program have proposed increases of $21 million and $10 million respectively
bull Improve National Forest System (NFS) watersheds Protecting Americarsquos supply of clean and abundant water is among the most crucial environmental challenges of the 21st Century Water is essential for life and vital to our prosperity this precious resource is the foundation for healthy ecosystems sustainable agricultural and forest production livable communities and viable industry The Forest Service has placed a focus on improving the health of its watersheds restoring ecosystem functions and increasing forestsrsquo resiliency to climate change The budget proposes a new line item ldquoIntegrated Resource Restorationrdquo that better characterizes the scope of the work that the Agency intends to perform in 2011 This line item is funded at $694 million of which $40 million is provided for the Collaborative Forest Landscape Restoration Fund and $50 million is provided for the Presidentrsquos new Priority Watersheds and Job Stabilization initiative Under this initiative rapid watershed
21
HIGHLIGHTS BY GOALS
assessments will be conducted of all NFS lands the agency will prioritize watershed improvement work and work that can demonstrate a change in watershed condition will be funded in a variety of watersheds across the country
bull Support Climate Change Mitigation and Adaptation USDA provides leadership to help landowners and communities adapt to climate change impacts that are already appearing These include changing water flow availability and quality changing weather patterns and ambient temperatures increased fire risk increased threats from insects and disease and changing habitat and climatic zones USDA conducts research that contributes to the development of climate change mitigation and adaptation tools and technologies and USDA outreach and extension networks make them available to farmers ranchers and land managers The 2011 budget includes an increase of $50 million within the Agriculture and Food Research Initiative competitive grants program for global climate change r esearch to develop mitigation capabilities and adaptive capacities for agricultural production
MANAGEMENT INITIATIVES
To support achievement of its strategic goals USDA is working to transform itself into a model organization By strengthening management operations and engaging employees USDA will improve customer services increase employment satisfaction and develop and implement strategies to enhance leadership performance diversity and inclusion The transformation will result in process improvements and increased perfo rmance USDA has identified the following eight management initiatives to support this effort
bull Engage USDA Employees to Transform USDA into a Model Agency USDA will continue to generate opportunities to listen to employeesrsquo concerns and ideas and to design and implement beneficial systemic changes to processes that affect employee satisfaction and human resources
bull Provide Civil Rights Services to Agriculture Employees and Customers The Departmentrsquos leadership has established civil rights as one of its top priorities To be successful all USDA employees must be committed to making USDA a model in the Federal Government for respecting the civil rights of its employees and constituents
bull Coordinate Outreach and Improve Consultation and Collaboration Efforts to Increase Access to USDA Programs and Services USDA will ensure that all Americans have equal and fair access to key USDA programs and services
bull Leverage USDA Departmental Management to Increase Performance Efficiency and Alignment USDA will expand the use of performance metrics to track areas of success and those needing improvement across the Department This information will allow agency decision makers to align resources to achieve the highest outcome
bull Optimize Information Technology (IT) Policy and Applications The Department is working to improve the effective delivery of programs and services to its constituents applicants and customers by deploying broadband creating an enterprise platform that
22
HIGHLIGHTS BY GOALS
enables open communication channels ensuring the protection of mission-critical operations and customer data and supporting portfolio views for managing across organization and geographic boundaries
bull Optimize USDA ldquoGreenrdquo or Sustainable Operations One of the Presidentrsquos top priorities for all Federal agencies is to establish an integrated strategy to work towards sustainability and to achieve reduction of greenhouse gas emissions As a steward of natural resources USDA is committed to achieving these goals and will focus its efforts towards sustainable operations
bull Enhance USDA Homeland Security and Emergency Preparedness to Protect USDA Employees and the Public USDA is working to enhance homeland security and emergency activities to provide a coordinated national effort to protect American agriculture and rural communities from intentional harm
bull Enhance the USDA Human Resources Process to Recruit and Hire Skilled Diverse Individuals to Meet the Program Needs of USDA USDA is reforming its hiring process to ensure a streamlined user-friendly environment for both the applicant and the hiring manager which will lead to the identification and selection of the most talented and competent workforce possible In doing so the Department will experience increased diversity while addressing current and future skills gaps
Key Proposals for the 2011 Budget
bull Enhance human resource capabilities As part of its efforts to transform USDA into a model organization Departmental Management (DM) is leading an initiative to respond to the Departmentrsquos human resources challenges As part of this initiative DM will focus on improving leadership development labor relations human resources accountability and veterans and other special employment programs This initiative will allow USDA to develop a workforce capable of leading the Department as it implements the strategic goals set forth by the Administration
bull Expand Program Participation of Underserved Constituents To address the need for better outreach to underserved program participant groups USDA is proposing to expand the Office of Advocacy and Outreach (OAO) in the 2011 budget through an increase of $5 million Of this amount $4 million is requested for agricultural labor grants authorized under section 14204 of the 2008 Farm Bill This program was funded through Rural Development in 2010 at the same level As part of this proposal USDA is requesting funding that will allow OAO to adequately conduct its activities related to overseeing the Advisory Committees on Minority Farmers and Beginning Farmers and Ranchers administration of the Outreach to Socially Disadvantaged Farmers Grant Program (section 2501 Program) overseeing the activities of the Office of Small Farms Coordination and the Farm Worker Coordinator managing t he 1994 1890 and Hispanic Serving Institutions Programs and other outreach functions
bull Improve service center agency IT infrastructure The 2011 budget includes $83 million to support the Departmentrsquos multi-agency effort to modernize and upgrade the IT
23
HIGHLIGHTS BY GOALS
infrastructure (also known as the Common Computing Environment (CCE)) for the Service Center Agencies (SCAs) These funds are requested in FSA NRCS and RD The proposed funding will be used to replace outdated components of the CCE many of which have exceeded their expected life cycles to reduce system vulnerabilities to failure and improve the performance and effectiveness of the shared infrastructure These improvements will allow the SCAs to better serve program participants with a more flexible and reliable IT infrastructure This funding will allow for the first system-wide refresh of the CCE since the infrastructure was implemented in 2000 In addition as the components of the CCE are replaced USDA will implement a right-sizing process whereby configuration changes will be made to better support the delivery of current and future programs As part of this process the Department will strive to improve system security reduce the long term cost of infrastructure services and improve service reliability
bull Enhance Acquisition Workforce Capabilities The 2011 budget requests $65 million to support a Government-wide Contracting and Acquisition Workforce Training initiative The requested funding will allow USDA to implement training recruitment and retention activities for the Departmentrsquos procurement workforce that is responsible for over $5 billion in annual procurement for the Department These workforce efforts along with procurement system improvements will allow USDA to achieve substantial cost savings and cost avoidances in the contracting and acquisition activities across all agencies
24
FARM AND FOREIGN AGRICULTURAL SERVICES
MISSION AND RELATIONSHIP TO STRATEGIC GOALS
The Farm and Foreign Agricultural Services (FFAS) mission area has responsibility for the delivery of programs and services which focus on supporting a sustainable and competitive US agricultural system The US agricultural sector produces $300 billion worth of farm products providing a major foundation for prosperity in rural areas as well as a critical element of the nationrsquos economy FFAS also plays an important role in the protection and enhancement of the Nationrsquos natural resource base and environment Thus the area contributes to multiple USDA Strategic Goals Specifically to assist rural communities create prosperity the FFAS mission area engages in the following activities (1) supports a strong farm financial safety net and (2) promotes the vitality of rural America by improving access to international markets providing credit guarantees for US farm exports supporting industry efforts to develop new markets and promoting better international acceptance of the products of biotechnology In support of ensuring private working lands are preserved the FFAS area (1) protects watershed health to ensure clean and abundant water and (2) enhances soil quality to maintain productive working cropland Finally in support of agricultural production and biotechnology it promotes the international acceptance of new technologies including biotechnology and promotes sustainable productive agricultural systems and trade in developing countries to enhance global food security
The work of the FFAS mission area is carried out by its three agencies the Farm Service Agency (FSA) Risk Management Agency (RMA) and Foreign Agricultural Service (FAS)
FARM SERVICE AGENCY (FSA)
FSA supports the delivery of farm credit disaster assistance and commodity and related programs and also administers some of the USDA conservation programs FSA provides administrative support for the Commodity Credit Corporation (CCC) which funds most of the commodity export and some of the conservation programs of USDA To deliver its programs FSA operates an extensive network of local Service Centers
Farm Loans Programs Program Level
$ M
illio
ns
3500
3000
2500
2000
1500
1000
500
0
$1952 $2599
$1895
$3245
$1578
$3219
FY 2009 FY 2010 FY 2011
Direct Guaranteed
25
FARM AND FOREIGN AGRICULTURAL SERVICES
Farm Service Agency Budget Authority
(Dollars in Millions) 2009 2010 2011
Program Enacted Estimate Budget Discretionary FSA Salaries and Expenses Salaries and Expenses (Direct Appropriation)helliphelliphelliphelliphelliphelliphellip $1170 $1254 $1365 Transfers from Program Accountshelliphelliphelliphelliphelliphelliphelliphelliphelliphelliphellip (313) (316) (321) Total Salaries and Expenseshelliphelliphelliphelliphelliphelliphelliphelliphelliphelliphelliphelliphellip (1483) (1570) (1686) Agricultural Credit Insurance Fund Program Account Transfer to FSA Salaries and Expenseshelliphelliphelliphelliphelliphelliphelliphelliphellip 309 313 318 Loan Subsidyhelliphelliphelliphelliphelliphelliphelliphelliphelliphelliphelliphelliphelliphelliphelliphelliphelliphelliphelliphellip 219 141 151 Loan Program Expenseshelliphelliphelliphelliphelliphelliphelliphelliphelliphelliphelliphelliphelliphelliphellip 8 8 8 Total Agricultural Credit Insurance Fund Program Accounthellip 536 462 477 State Mediation Grantshelliphelliphelliphelliphelliphelliphelliphelliphelliphelliphelliphelliphelliphelliphelliphellip 4 4 4 Grassroots Source Water Protection Programhelliphelliphelliphelliphelliphelliphellip 5 5 0 Reforestation Pilot Programhelliphelliphelliphelliphelliphelliphelliphelliphelliphelliphelliphelliphelliphellip 1 1 0 Durum Wheat Quality Programhelliphelliphelliphelliphelliphelliphelliphelliphelliphelliphelliphelliphellip 0 3 0 Geographically Disadvantaged Farmers and Ranchershelliphelliphelliphellip 0 3 0 Total Ongoing Discretionary Programshelliphelliphelliphelliphelliphelliphelliphelliphellip 1716 1732 1846 Dairy Price Supporthelliphelliphelliphelliphelliphelliphelliphelliphelliphelliphelliphelliphelliphelliphelliphelliphellip 0 350 0
Total Discretionary Programshelliphelliphelliphelliphelliphelliphelliphelliphelliphelliphelliphellip 1716 2082 1846 Recovery Act FSA Salaries and Expenseshelliphelliphelliphelliphelliphelliphelliphelliphelliphelliphelliphelliphelliphellip 50 0 0 Agricultural Credit Insurance Fund (Subsidy)helliphelliphelliphelliphelliphelliphellip 20 0 0 Total Recovery Acthelliphelliphelliphelliphelliphelliphelliphelliphelliphelliphelliphelliphelliphelliphelliphellip 70 0 0 Total Discretionary Programshelliphelliphelliphelliphelliphelliphelliphelliphelliphelliphelliphellip 1786 2082 1846 Mandatory Dairy Indemnity Programhelliphelliphelliphelliphelliphelliphelliphelliphelliphelliphelliphelliphelliphelliphellip 1 1 1 Agricultural Disaster Relief Fundhelliphelliphelliphelliphelliphelliphelliphelliphelliphelliphelliphellip 703 526 891 Recovery Act Supplemental Agricultural Disaster Assistancehelliphelliphelliphelliphelliphellip 0 230 0 Aquaculture Assistance Grantshelliphelliphelliphelliphelliphelliphelliphelliphelliphelliphelliphelliphellip 50 0 0 Total Recovery Acthelliphelliphelliphelliphelliphelliphelliphelliphelliphelliphelliphelliphelliphelliphelliphellip 50 230 0 Total Mandatory Programshelliphelliphelliphelliphelliphelliphelliphelliphelliphelliphelliphelliphellip 754 757 892 Total Farm Service Agencyhelliphelliphelliphelliphelliphelliphelliphelliphelliphelliphelliphelliphellip $2540 $2839 $2738
26
FARM AND FOREIGN AGRICULTURAL SERVICES
Farm Service Agency Agricultural Credit Insurance Fund
Farm Loan and Grant Programs Program Level (PL) and Budget Authority (BA)
(Dollars in Millions) 2009
Enacted Program PL BA
Farm Operating Loans Guaranteed Unsubsidizedhelliphelliphelliphelliphelliphelliphellip $1160 $29 Guaranteed Subsidizedhelliphelliphelliphelliphelliphelliphelliphelliphellip 150 21 Directhelliphelliphelliphelliphelliphelliphelliphelliphelliphelliphelliphelliphelliphelliphellip 685 81
Total Operating Loanshelliphelliphelliphelliphelliphelliphellip 1995 131 Farm Ownership Loans Guaranteed Unsubsidizedhelliphelliphelliphelliphelliphelliphellip 1239 4 Directhelliphelliphelliphelliphelliphelliphelliphelliphelliphelliphelliphelliphelliphelliphellip 200 13
Total Ownership Loanshelliphelliphelliphelliphelliphelliphellip 1439 17 Indian Land Acquisition Loanshelliphelliphelliphelliphelliphellip 4 a Boll Weevil Eradicationhelliphelliphelliphelliphelliphelliphelliphelliphellip 100 0 Conservation Loans Guaranteedhelliphelliphelliphelliphelliphelliphelliphelliphelliphelliphelliphellip 0 0 Directhelliphelliphelliphelliphelliphelliphelliphelliphelliphelliphelliphelliphelliphelliphellip 0 0 Total Conservation Loanshelliphelliphelliphelliphelliphellip 0 0 Indian Fractionated Land Loanshelliphelliphelliphelliphellip 0 0
Total Ongoing Farm Loan Programshelliphellip 3538 148
Supplemental Appropriations Farm Operating Loans Guaranteed Unsubsidizedhelliphelliphelliphelliphelliphellip 50 1 Directhelliphelliphelliphelliphelliphelliphelliphelliphelliphelliphelliphelliphellip 400 47 Total Operating Loanshelliphelliphelliphelliphelliphellip 450 48 Farm Ownership Loans Directhelliphelliphelliphelliphelliphelliphelliphelliphelliphelliphelliphelliphellip 360 23 Total Ownership Loanshelliphelliphelliphelliphellip 360 23
Recovery Act Direct Farm Operating Loanshelliphelliphelliphelliphellip 173 20 Total Farm Loan Programshelliphelliphelliphelliphelliphellip 4521 239 Emergency Loans bhelliphelliphelliphelliphelliphelliphelliphelliphelliphellip 30 4 Total Farm Loan and Grant Programshellip $4551 $243
2010 Estimate
PL BA
$1500 $35 170 24
1000 47
2670 106
1500 6 650 27
2150 33 4 0
100 0
75 a 75 1
150 1 10 1
5084 141
0 0 0 0 0 0
0 0 0 0
0 0 5084 141
56 2 $5140 $143
2011 Budget
PL BA
$1500 $35144 20900 55
2544 110
1500 6475 33
1975 39 2 0
60 0
75 a75 2
150 2 10 a
4741 151
0 00 00 0
0 00 0
0 04741 151
56 6$4797 $157
a Less than $05 million b From funds carried over from prior years
27
FARM AND FOREIGN AGRICULTURAL SERVICES
Farm Loan and Grant Programs The farm credit programs are an important safety net for Americarsquos farmers by providing a source of credit when they are temporarily unable to obtain credit from commercial sources The value of this safety net was demonstrated in 2009 when in response to the growing global economic and financial crisis FSA received supplemental appropriations and Recovery Act funding to bring the total funding for the farm credit programs in that year to $45 billion In 2010 in order to meet the growing demands in the farm credit programs total funding increased to $51 billion The 2011 budget supports funding for over $47 billion in direct and guaranteed loans The Administration expects that financial and economic conditions will improve and that commercial lending in rural areas will begin returning to prior levels Therefore a modest decline in the demand for direct and guaranteed loans is assumed
A portion of both direct and guaranteed farm operating and ownership loan funds is targeted to socially disadvantaged borrowers based on county level demographic data Although the statutory targets vary by loan program and county on average about 14 percent of loan funds are targeted to socially disadvantaged borrowers These targeted funds serve over 17 percent of the disadvantaged groups noted below Therefore a key performance measure for the farm credit programs is the percentage of beginning farmers racial and ethnic minority farmers and women farmers financed by FSA The target for 2011 will be to further increase the proportion of these borrowers that are served by FSA credit programs
Key Performance Measure 2006 2007 2008 2009 2010 2011 Percentage of beginning farmers racial and ethnic minority farmers and women farmers financed by FSA (Percent) 155 159 162 174 175 180
The 2011 budget proposes loan levels that are generally reflective of the ongoing financial crisis however some modest reductions are proposed in light of the expected recovery of the US and global economies For farm operating loans the 2011 budget provides $900 million for direct loans and over $16 billion for guaranteed loans These loan levels will serve an estimated 22500 farmers about 15000 of whom will receive direct loans and 7500 of whom will receive guarantees The availability of farm operating loans provides farmers with short term credit to finance the costs of continuing or improving their farming operations such as purchasing seed fertilizer livestock feed equipment and other supplies For farm ownership loans the 2011 budget provides $475 million in direct loans and $15 billion for guaranteed loans The 2011 levels will provide about 7100 people with the opportunity to either acquire their own farm or keep an existing one About 2800 borrowers will receive direct loans and 4300 will receive guaranteed loans
The 2011 budget assumes $56 million in loan level will be available for emergency loans due to carryover from prior years The 2011 budget assumes the demand for Indian land acquisition loans will be lower as a result of the new Indian Fractionated Land loans program Program level funding for the boll weevil eradication loan program is reduced to $60 million compared to $100 million in 2010 Eradication efforts have successfully eliminated the boll weevil from many cotton producing areas and as a result it is anticipated that demand for boll weevil eradication loans will decline
28
FARM AND FOREIGN AGRICULTURAL SERVICES
Funding for State mediation grants is maintained at $4 million These grants are made to States to help support certified programs that provide alternative dispute resolution on a wide variety of agricultural issues Mediation benefits family farmers including many low-income and socially disadvantaged farmers who because of mediation are often able to resolve credit and other issues and remain on the farm
Commodity Credit Corporation Budget Authority
(Dollars in Millions) 2009 2010 2011
Program Enacted Estimate Budget Mandatory Commodity Credit Corporation Fundhelliphelliphelliphelliphelliphelliphelliphelliphelliphelliphelliphellip $12111 $10859 $10522 Tobacco Trust Fundhelliphelliphelliphelliphelliphelliphelliphelliphelliphelliphelliphelliphelliphelliphelliphelliphelliphelliphellip 950 960 960
Total Mandatory Programshelliphelliphelliphelliphelliphelliphelliphelliphelliphelliphelliphelliphelliphelliphellip 13061 11819 11482 Total Commodity Credit Corporationhelliphelliphelliphelliphelliphelliphelliphelliphelliphelliphellip $13061 $11819 $11482
Commodity Credit Corporation The Commodity Credit Corporation (CCC) provides funding for commodity programs administered by FSA and many Farm Bill programs such as the conservation programs administered by FSA and the Natural Resources Conservation Service (NRCS) and export programs administered by FAS CCC borrows funds needed to finance these programs from the US Treasury and repays the borrowings with interest from receipts and from appropriations provided by Congress The commodity programs are critical components of the farm safety net serving to expand domestic market opportunities and provide risk management and financial tools to farmers and ranchers The CCC also handles the Tobacco Trust Fund which provides transition payments to former producers and owners of quotas under the former tobacco price support and quota program
29
FARM AND FOREIGN AGRICULTURAL SERVICES
Commodity Credit Corporation Net Outlays
(Dollars in Millions) 2009 2010 2011
Program Enacted Estimate Budget Commodity Programs Marketing Assistance Loans and Price Supporthelliphelliphelliphelliphelliphelliphellip $3499 $2278 $127 Direct Paymentshelliphelliphelliphelliphelliphelliphelliphelliphelliphelliphelliphelliphelliphelliphelliphelliphelliphelliphellip 5222 5144 4963
ACREhelliphelliphelliphelliphelliphelliphelliphelliphelliphelliphelliphelliphelliphelliphelliphelliphelliphelliphelliphelliphelliphelliphellip 0 0 734 Countercyclical Paymentshelliphelliphelliphelliphelliphelliphelliphelliphelliphelliphelliphelliphelliphelliphellip 731 1079 749 Loan Deficiency Paymentshelliphelliphelliphelliphelliphelliphelliphelliphelliphelliphelliphelliphelliphelliphellip 145 183 24 Milk Income Loss Contract Paymentshelliphelliphelliphelliphelliphelliphelliphelliphelliphelliphellip 757 225 100 Cotton User Marketing Payments and Cotton Economic Adjustment Assistance Paymentshelliphelliphelliphelliphellip 85 74 82 Noninsured Crop Disaster Assistance Programhelliphelliphelliphelliphelliphelliphellip 62 122 124 Tobacco Payments to Producers ahelliphelliphelliphelliphelliphelliphelliphelliphelliphelliphelliphellip 953 960 960 Biomass Crop Assistance Programhelliphelliphelliphelliphelliphelliphelliphelliphelliphelliphelliphellip 2 263 479 Farm Storage Facility Loanshelliphelliphelliphelliphelliphelliphelliphelliphelliphelliphelliphelliphelliphellip 14 10 4 Purchases and Saleshelliphelliphelliphelliphelliphelliphelliphelliphelliphelliphelliphelliphelliphelliphelliphelliphelliphellip -1730 -1703 -97 Processing Storage and Transportationhelliphelliphelliphelliphelliphelliphelliphelliphelliphellip 20 32 6 Operating Expenseshelliphelliphelliphelliphelliphelliphelliphelliphelliphelliphelliphelliphelliphelliphelliphelliphelliphellip 40 14 6 Interest Expenditureshelliphelliphelliphelliphelliphelliphelliphelliphelliphelliphelliphelliphelliphelliphelliphelliphellip -17 -2 42 Change in Working Capitalhelliphelliphelliphelliphelliphelliphelliphelliphelliphelliphelliphelliphelliphelliphellip -806 250 250
Otherhelliphelliphelliphelliphelliphelliphelliphelliphelliphelliphelliphelliphelliphelliphelliphelliphelliphelliphelliphelliphelliphelliphellip -42 449 437 Total Commodity Programs Baselinehelliphelliphelliphelliphelliphelliphelliphelliphelliphellip 8935 9378 8990 Conservation Programs Conservation Reserve Programhelliphelliphelliphelliphelliphelliphelliphelliphelliphelliphelliphelliphellip 1916 1973 1958 Emergency Forestry Conservation Reserve Programhelliphelliphelliphelliphelliphelliphelliphelliphelliphelliphelliphelliphelliphelliphelliphelliphelliphellip 10 19 14 Voluntary Public Access and Incentives Programhelliphelliphelliphelliphelliphelliphelliphelliphelliphelliphelliphelliphelliphelliphelliphelliphellip 0 17 17 Total Conservation Programshelliphelliphelliphelliphelliphelliphelliphelliphelliphelliphelliphelliphellip 1926 2009 1989 Export Programs Quality Samples Programhelliphelliphelliphelliphelliphelliphelliphelliphelliphelliphelliphelliphelliphelliphellip 1 2 2 Market Access Program (MAP)helliphelliphelliphelliphelliphelliphelliphelliphelliphelliphelliphellip 219 194 200 Foreign Market Development (Cooperator) Programhelliphelliphelliphelliphellip 36 34 35 Technical Assistance for Specialty Crops Programhelliphelliphelliphelliphellip 2 5 8 Emerging Markets Programhelliphelliphelliphelliphelliphelliphelliphelliphelliphelliphelliphelliphelliphelliphellip 3 8 8 Dairy Export Incentive Programhelliphelliphelliphelliphelliphelliphelliphelliphelliphelliphelliphelliphellip 1 25 3
30
FARM AND FOREIGN AGRICULTURAL SERVICES
Commodity Credit Corporation Net Outlays
(Dollars in Millions) 2009 2010 2011
Program Enacted Estimate Budget Food for Progress Programhelliphelliphelliphelliphelliphelliphelliphelliphelliphelliphelliphelliphelliphelliphellip 226 148 148 Local and Regional Commodity Procurement Pilot Programhelliphellip 0 15 25 Export Credithelliphelliphelliphelliphelliphelliphelliphelliphelliphelliphelliphelliphelliphelliphelliphelliphelliphelliphelliphellip 80 83 23
Otherhelliphelliphelliphelliphelliphelliphelliphelliphelliphelliphelliphelliphelliphelliphelliphelliphelliphelliphelliphelliphelliphellip 17 30 23 Total Export Programshelliphelliphelliphelliphelliphelliphelliphelliphelliphelliphelliphelliphelliphelliphellip 585 544 475 Subtotal CCChelliphelliphelliphelliphelliphelliphelliphelliphelliphelliphelliphelliphelliphelliphelliphelliphelliphelliphellip 11446 11931 11454 Pre-credit Reform Loan Repaymentshelliphelliphelliphelliphelliphelliphelliphelliphelliphelliphellip -4 -4 -8 CCC Baselinehelliphelliphelliphelliphelliphelliphelliphelliphelliphelliphelliphelliphelliphelliphelliphelliphelliphelliphelliphelliphellip 11442 11927 11446 Proposed Legislation
Reduce MAP by 20helliphelliphelliphelliphelliphelliphelliphelliphelliphelliphelliphelliphelliphelliphelliphellip 0 0 -8 Farm Programs Savingshelliphelliphelliphelliphelliphelliphelliphelliphelliphelliphelliphelliphelliphelliphelliphellip 0 0 -3
Total CCChelliphelliphelliphelliphelliphelliphelliphelliphelliphelliphelliphelliphelliphelliphelliphelliphelliphelliphelliphellip $11442 $11927 $11435
a CCC payments are offset by receipts from the Tobacco Trust Fund
Changes over the last decade in commodity disaster and conservation programs due to policy weather and market conditions have dramatically changed the level mix and variability of CCC outlays CCC net outlays have declined from a record high of $323 billion in 2000 to to $114 billion in 2008 reflecting higher prices for most commodities resulting from increased demand for bioenergy production and strong export demand Outlays in 2009 which included the impact of 2008 Farm Bill provisions were $114 billion They reflected reduced disaster payments offset by greater outlays for dairy support programs and for the cotton program both of which are affected by lower market prices and initiatives to enhance dairy price supports Estimated outlays for 2010 rose to $119 billion partly as a result of the newly implemented Biomass Crop Assistance Program (BCAP) The 2011 estimate declines to $114 billion as higher prices are expected to reduce cotton program outlays from marketing assistance loans The 2008 Farm Bill also ended the use of commodity certificate transactions for marketing assistance loan repayments The impact is reflected in the reduction in CCC sales and purchases in 2011 as producers could no longer purchase certificates for use in loan repayments
Commodity Programs Commodity loan and income support programs constitute the majority of CCC outlays These programs provide a major portion of the farm safety net including protection against adverse market fluctuations hence outlays for many of these programs vary significantly from year to year as market conditions change The commodity programs are mandated by provisions of the 2008 Farm Bill The programs include direct payments to producers of feed grains wheat upland cotton rice soybeans other oilseeds and peanuts The direct payments based on historical program acreage and yields are set by law and do not vary with market prices or current plantings The 2008 Farm Bill also provided counter-cyclical payments for producers of the above crops when market prices decline below specified target prices In addition the 2008 Farm Bill authorized revenue-based counter-cyclical payments (ACRE) as an alternative to the traditional price-based counter-cyclical payments Sign-up for
31
FARM AND FOREIGN AGRICULTURAL SERVICES
the new ACRE program began April 27 2009 and continued to August 14 2009 to give producers ample time to decide whether to participate in ACRE or remain in the traditional direct and counter-cyclical payment program About 17 million farms are enrolled in the direct and counter-cyclical payment programs The 2011 budget proposes modest reductions in the current cap on direct payments and a three year phased reduction in farm program average Adjusted Gross Income (AGI) eligibility limits for large farmers and wealthy landowners These adjustments in current program limits would affect only a very small portion of the farm program participants without disturbing the foundation of the current safety net for productive family farmers In addition the budget proposes elimination of commodity storage payments in the marketing assistance loan program for cotton and peanuts The Department is prepared to work with Congress and stakeholders as these proposals are being considered
The CCC marketing assistance loan (MAL) program is available to producers of commodities eligible for direct and counter-cyclical payments as well as for wool mohair honey and pulses CCC marketing assistance loans provide interim financing to eligible producers allowing them to delay selling their crop at harvest when prices are typically at their lowest When market prices decline these loans may be repaid at rates below the loan rate thus providing benefits which help offset the effect of lower market returns
32
FARM AND FOREIGN AGRICULTURAL SERVICES
Commodity Credit Corporation Commodity Program Net Outlays
(Dollars in Millions) 2009 2010 2011
Program Enacted Estimate Budget Commodity Feed Grainshelliphelliphelliphelliphelliphelliphelliphelliphelliphelliphelliphelliphelliphelliphelliphelliphelliphelliphelliphellip $2458 $2451 $2645 Wheathelliphelliphelliphelliphelliphelliphelliphelliphelliphelliphelliphelliphelliphelliphelliphelliphelliphelliphelliphelliphelliphellip 1224 1299 1425 Ricehelliphelliphelliphelliphelliphelliphelliphelliphelliphelliphelliphelliphelliphelliphelliphelliphelliphelliphelliphelliphelliphelliphellip 411 558 429 Upland and Extra Long Staple Cottonhelliphelliphelliphelliphelliphelliphelliphelliphellip 2213 2387 1552 Tobacco ahelliphelliphelliphelliphelliphelliphelliphelliphelliphelliphelliphelliphelliphelliphelliphelliphelliphelliphelliphellip -172 0 0 Dairyhelliphelliphelliphelliphelliphelliphelliphelliphelliphelliphelliphelliphelliphelliphelliphelliphelliphelliphelliphelliphelliphellip 994 343 362 Soybeans and Productshelliphelliphelliphelliphelliphelliphelliphelliphelliphelliphelliphelliphelliphelliphellip 611 585 624 Minor Oilseedshelliphelliphelliphelliphelliphelliphelliphelliphelliphelliphelliphelliphelliphelliphelliphelliphelliphellip 23 22 25 Peanutshelliphelliphelliphelliphelliphelliphelliphelliphelliphelliphelliphelliphelliphelliphelliphelliphelliphelliphelliphelliphellip 98 90 132 Sugarhelliphelliphelliphelliphelliphelliphelliphelliphelliphelliphelliphelliphelliphelliphelliphelliphelliphelliphelliphelliphelliphellip b 0 0 Honeyhelliphelliphelliphelliphelliphelliphelliphelliphelliphelliphelliphelliphelliphelliphelliphelliphelliphelliphelliphelliphelliphellip -1 b b Wool and Mohairhelliphelliphelliphelliphelliphelliphelliphelliphelliphelliphelliphelliphelliphelliphelliphelliphellip 9 7 7 Vegetable Oil Productshelliphelliphelliphelliphelliphelliphelliphelliphelliphelliphelliphelliphelliphelliphellip 28 49 30 Other Commoditieshelliphelliphelliphelliphelliphelliphelliphelliphelliphelliphelliphelliphelliphelliphelliphelliphellip 57 -8 5
Subtotal Assistance To Farmershelliphelliphelliphelliphelliphelliphelliphelliphelliphellip 7953 7783 7236 Other chelliphelliphelliphelliphelliphelliphelliphelliphelliphelliphelliphelliphelliphelliphelliphelliphelliphelliphelliphelliphellip 982 1596 1754 Commodity Programs Baselinehelliphelliphelliphelliphelliphelliphelliphelliphelliphelliphelliphellip 8936 9379 8990 Proposed Legislation - Farm Programs Savingshelliphelliphelliphelliphelliphellip 0 0 -3 Total Commodity Programshelliphelliphelliphelliphelliphelliphelliphelliphelliphelliphelliphellip $8936 $9379 $8987
a Reflects impact of offsetting receipts from Tobacco Trust Fund b Less than $05 million c Includes working capital interest operating expenses reimbursable agreements and an adjustment for Food for Progress commodity purchases
33
FARM AND FOREIGN AGRICULTURAL SERVICES
Commodity Credit Corporation Conservation Programs
Budget Authority (Dollars in Millions)
2009 2010 2011 Program Enacted Estimate Budget
Conservation Reserve Programhelliphelliphelliphelliphelliphelliphelliphelliphelliphelliphelliphellip $1934 $1973 $1958 Emergency Forestry Conservation Reserve Programhelliphelliphellip 10 19 14 Voluntary Public Access and Habitat Incentives Programhellip 0 17 17
Total Conservation Programshelliphelliphelliphelliphelliphelliphelliphelliphelliphelliphellip $1944 $2009 $1989
Conservation Programs The Farm Bill also provides authority for conservation programs The focus of USDA conservation programs administered by NRCS and FSA is to assist producers in using environmentally sound management systems for agricultural production to meet food and fiber needs of the Nation FSA administers the Conservation Reserve Program (CRP) and the Emergency Forestry Conservation Reserve Program (EFCRP) which are CCC programs in addition to the Emergency Conservation Program (ECP) All other USDA cost-share and easement conservation programs such as the Environment al Quality Incentives Program Wetlands Reserve Program and the Conservation Stewardship Program are administered by NRCS These programs are described beginning on page 85
The purpose of CRP is to assist farm owners and operators in conserving and improving soil water air and wildlife resources b y retirin g environmentally se sitive landn from a gricultural production and keeping it under long-term resource-conserving cover CRP participants enroll acreage for periods of 10 to 15 years in return for annual rental payments along with cost-share and technical assistance for installing approved conservation practices
Among multiple environmental benefits a key performance measure for the CRP program is the number of restored wetland acres Restored wetland acreage serves as a filter barrier reducing sediments and agricultural run-off from reaching drinking water supplies
Key Performance Measure 2006 2007 2008 20091 20102 20112
CRP restored wetland acreage (million acres) 203 208 198 204 199 199
1 The 2009 increase in CRP Wetland acres enrollment was due to increased incentives for certain wetland practices and surge in general signup acres reenrolled into wetland practices 2 Recent commodity price increases especially soybeans will likely reduce landowner willingness to retire cropland into CRP In addition the enrollment authority for CRP decreased to 32 million acres starting in FY 2010
Acreage that counts toward CRPrsquos total enrollment cap includes acres enrolled through scheduled general signups and those enrolled through a continuous non-competitive signup that has been underway since September 1996 with the purpose of enrolling land in filter strips riparian buffers and other high priority conservation and environmental enhancement practices Continuous signup acreage also includes enrollment under the Conservation Reserve
34
FARM AND FOREIGN AGRICULTURAL SERVICES
Enhancement Program (CREP) that is designed to target program benefits to address specific local and regional conservation problems At this time 32 States have approved CREP agreements
CRP enrollment totaled 338 million acres at the end of 2009 with over 85 percent of the acreage having been enrolled under scheduled general signups A general signup of 10 million acres was held in 2006 however no general signup has been held since then The budget projects that total enrolled acreage may decrease to 314 million acres by the end of FY 2010 The budget assumes a potential general signup in 2010 could add up to 29 million general signup acres allowing a cumulative enrollment of 302 million CRP acres by the end of 2011 CRP is limited to a maximum of 32 million acres by the 2008 Farm Bill
Under ECP the Department shares the cost of carrying out practices to assist and encourage farmers to rehabilitate farmland damaged by natural disasters In particular it addresses those problems which represent damage that is unusual and would not recur frequently in the same area and if left untreated would (1) impair or endanger the land (2) materially affect the productive capacity of the land (3) be so costly to rehabilitate that Federal assistance would be required to return the land to productive agricultural use For the past several years this program has been funded through emergency supplemental appropriations The budget is proposing no new funding for the ECP in 2011 since funding needs are difficult to predict in advance
Biomass Crop Assistance Program (BCAP) In 2009 the first phase of the BCAP as mandated by the 2008 Farm Bill was implemented This provision provides matching payments for the collection harvest storage and transportation of biomass material to approved energy conversion facilities Beginning in 2010 the program will provide financial assistance for the establishment and maintenance of crops for bioenergy production once regulations are completed The program will then continue into 2011 and beyond
Supplemental Agricultural Disaster Assistance
Outlays
(Dollars in Millions) 2009 2010 2011
Program Enacted Estimate Budget Supplemental Revenue Assistance Payments 0 $945 $865 Livestock Indemnity Paymentshelliphelliphelliphelliphelliphelliphelliphelliphelliphelliphelliphelliphelliphelliphelliphelliphelliphelliphellip $3 69 69 Livestock Forage Disaster Program 0 409 409 Emergency Assistance for Livestock Honey Bees and Farm-Raised Fishhelliphellip 0 100 50 Tree Assistance Program helliphelliphelliphelliphelliphelliphelliphelliphelliphelliphelliphelliphelliphelliphelliphelliphelliphelliphelliphelliphellip 0 5 5
Subtotal Supplemental Agricultural Disaster Assistance helliphelliphelliphelliphelliphellip 3 1528 1398 Recovery Act SURE Paymentshelliphelliphelliphelliphelliphelliphelliphelliphelliphelliphelliphelliphelliphelliphelliphelliphellip 0 207 23
Total Supplemental Agricultural Disaster Assistance helliphelliphelliphelliphelliphelliphelliphellip $3 $1735 $1421
35
FARM AND FOREIGN AGRICULTURAL SERVICES
Supplemental Agricultural Disaster Assistance The 2008 Farm Bill authorized five new disaster assistance programs FSA administers the five new disaster programs however unlike prior ad hoc disaster programs the new disaster assistance programs are funded through the Agricultural Disaster Relief Trust Fund (Trust Fund) rather than through CCC The Trust Fund receives funding equivalent to 308 percent of the amounts received under the Harmonized Tariff Schedule of the United States Actual assistance levels will depend on the extent of producersrsquo qualifying needs
The Supplemental Revenue Assistance Payments Program (SURE) provides assistance to eligible crop producers on farms in primary and contiguous disaster counties designated by the Secretary of Agriculture or in other counties in which weather-related losses exceeded 50 percent of the normal production for that year The Livestock Indemnity Program (LIP) provides assistance to eligible livestock producers on farms that have incurred livestock death losses in excess of normal mortality rates due to adverse weather during the calendar year The Livestock Forage Program (LFP) provides assistance to eligible livestock producers for grazing losses for covered livestock due to drought conditions or fire The Emergency Livestock Assistance Program (ELAP) provides assistance to eligible producers of livestock (inc luding horses) honey bees and farm-raised fish for losses not covered under the other disaster programs The Tree Assistance Program (TAP) provides assistance to eligible orchardists and nursery tree growers that planted trees for commercial sale (including Christmas trees) for losses resulting from a natural disaster The Recovery Act provided an estimated $230 million of additional disaster assistance through the above programs for producers who suffered losses in crop year 2008 but had not yet paid the crop insurance related fees necessary to become eligible
Dairy and Other Appropriated Assistance The 2010 Appropriations Act included $350 million for additional assistance for dairy producers A total of $290 million was provided for payments to dairy producers and $60 million for purchases of dairy products for distribution to the needy Other additional assistance in 2010 provided by the Appropriations Act includes support for a durum wheat quality program and support for geographically disadvantaged producers No funds are requested for these activities in the 2011 Budget
In addition the Recovery Act provided $50 million for Aquaculture Grants which are intended to compensate aquaculture growers for high feed costs during the 2008 fiscal year The grants were administered as block grants to the States which in turn provide the assistance to eligible growers Under the provisions of the Recovery Act producers who receive assistance under the Aquaculture Grants program will be unable to receive assistance under ELAP for the same losses
36
FARM AND FOREIGN AGRICULTURAL SERVICES
Farm Service Agency Staff Years
2009 2010 2011 Program Enacted Estimate Budget
helliphelliphelliphelliphelliphelliphelliphelliphelliphelliphelliphelliphelliphelliphelliphelliphelliphelliphelliphelliphelliphellipFederal 5042 5094 5104 Non-Federal Permanent Full-Timehelliphelliphelliphelliphelliphelliphelliphelliphelliphelliphelliphelliphelliphelliphelliphellip 8673 8775 8775 Temporaryhelliphelliphelliphelliphelliphelliphelliphelliphelliphelliphelliphelliphelliphelliphelliphelliphelliphelliphelliphellip 745 650 650
Total Non-Federalhelliphelliphelliphelliphelliphelliphelliphelliphelliphelliphelliphelliphelliphelliphelliphellip 9418 9425 9425 Total FSA Staff Yearshelliphelliphelliphelliphelliphelliphelliphelliphelliphelliphelliphelliphelliphellip 14460 14519 14529
Salaries and Expenses The 2011 budget proposes a level of $1686 billion to support 5104 Federal staff years and 9425 non-Federal staff years Total estimated staff years will be increased by 10 over the 2010 level to provide for increased IT modernization project management The budget includes funding to support ongoing operational needs based on current programs and the current delivery system
Information Technology (IT) Modernization and Stabilization The Farm Service Agency relies on one of the oldest information technology systems (hardware and software) within the Department of Agriculture Billions of dollars of annual farm program payments conservation payments and loans to producers mandated b y the 2008 Farm Bill and other legislation are dependent upon the continued viability of this antiquated IT system FSA must upgrade the aging technology infrastructure and equipment which is creating inefficiencies and threatening the delivery of fundamental services to producers
At the present time producers looking to sign up for programs are often confronted by lines long delays and inefficiencies County office personnel are often required to use two computers on different operating systems to sign a producer up for a single program These two computers one relying on the outdated legacy system and one relying on a modern web-based system are unable to communicate with each other forcing the county office personnel to enter data into multiple systems or manually transfer data maintained in one system to the other This causes sign-up delays and significantly increases the likelihood of data entry errors that can lead to improper payments
Further the outmoded IT systems of the Farm Service Agency are highly vulnerable to security breaches because inadequate data storage capacity requires sensitive producer data and financial information to be uploaded into mainframe computers from physical media sent from county offices across the country rather than electronically An independent review conducted pursuant to Section 1618 of the 2008 Farm Bill also concluded that ldquoModernization will bring significant benefits such as improvements in cost efficiency producer access fraud mitigation staff efficiency and morale More fundamentally Modernization will replace the aging platforms that are difficult to maintain and incapable of supporting the fiduciary requirements that FSA faces today and will continue to face in the futurerdquo
37
FARM AND FOREIGN AGRICULTURAL SERVICES
The 2011 Budget proposes an increase of $953 million to fund critical IT replacement and modernization projects to support core FSA operations Of this amount $393 million is proposed for continued implementation of the MIDAS initiative (Modernize and Innovate the Delivery of Agricultural Systems) which is a comprehensive project to streamline the existing complicated business processes that support mandated farm programs and provide a modern IT infrastructure to operate the programs The 2011 proposal builds on funding included in the FY 2010 appropriation to continue this multi-year effort Development of MIDAS is an extensive effort which will result in a secure modern IT system capable of supporting web-based program delivery The system will also provide linkages with the Departmentrsquos new financial management system The proposed 2011 funding includes $1 million for increased staffing to ensure appropriate contract oversight and management of this complex project
A second component of the IT proposal is a $20 million increase needed for conversion of FSA software to shift program applications from the current obsolete system to the new IT system Existing program software that is essential to delivery of FSA rsquos core programs is written for the outmoded mainframe IT system and needs to be converted for use with modern web-based systems Funds will support this conversion of program delivery applications for use with the new system
Further the budget proposes a $36 million increase in FSA to support the Departmentrsquos efforts to modernize and upgrade the Common Computing Environment (CCE) for the Service Center Agencies (SCAs) This funding will be used to replace outdated components of the IT infrastructure many of which have exceeded their expected life cycles in order to reduce system vulnerabilities to failure and improve the performance and effectiveness of the shared infrastructure These improvements will allow the SCAs to better serve program participants with a more flexible and reliable IT infrastructure This funding will allow for the first system-wide refresh of the CCE since the infrastructure was implemented in 2000 In addition as the components of the CCE are replaced USDA will implement a right-sizing process whereby configuration changes will be made to better support the delivery of current and future programs As part of this process the Department will strive to improve system security reduce the long term cost of infrastructure services and improve service reliability
A key performance measure for Modernization efforts is the percentage of program benefits delivered directly by the county office using web-enabled technologies and not utilizing outmoded legacy systems This will enable more timely more accurate and reliable delivery of benefits to producers as the newer technologies are phased in
Key Performance Measure 2006 2007 2008 2009 2010 2011 Maintain or increase percentage of program benefits delivered through a Web environment (percent) 33 33 33 33 50 70
38
FARM AND FOREIGN AGRICULTURAL SERVICES
RISK MANAGEMENT AGENCY (RMA)
Program Level (Dollars in Millions)
2009 2010 2011 Program Enacted Estimate Budget
SUMMARY OF GOVERNMENT COSTS Discretionary Administrative and Operating Expenseshelliphelliphelliphelliphelliphelliphelliphelliphellip $77 $80 $83 Mandatory Delivery and Other Administrative Expenses ahelliphelliphelliphelliphellip 1654 1642 1770 Gross Indemnities bhelliphelliphelliphelliphelliphelliphelliphelliphelliphelliphelliphelliphelliphelliphelliphellip 8416 7669 8249 Underwriting Gains c helliphelliphelliphelliphelliphelliphelliphelliphelliphelliphelliphelliphelliphelliphellip 1963 1168 1202 Farm Bill Agricultural Management Assistancehelliphelliphelliphelliphellip (6) (6) (6)
Subtotal Crop Insurance Program Levelhelliphelliphelliphelliphelliphelliphellip 12033 10479 11221 Less Producer Premium and Administration Feeshelliphellip -4211 -3577 -3606
Total Government Costshelliphelliphelliphelliphelliphelliphelliphelliphelliphelliphelliphelliphellip $7899 $6982 $7698
a Includes reimbursements to private companies and certain costs for research development and other activities b The amount of premium subsidy paid by the Federal government is not reflected in the table above The budget for the Federal Crop Insurance Program assumes a crop year loss ratio (gross indemnititestotal premium) of 10 However the fiscal year loss ratio could be higher or lower than 10 due to differences in the timeing of cash flows and participation rates from year to year Nevertheless the amount of premium subsidy may be approximated in the table above by subtracting producer premium and administrative fees from gross indemnities c Payments to private insurance companies
Discretionary funds for the Federal Crop Insurance Program cover Federal salaries and related expenses to manage the program The 2011 budget includes about $83 million for these costs compared to about $80 million for 2010 The increase includes $07 million for pay costs to maintain current staffing levels and $20 million for increasing costs necessary to maintain the existing IT infrastructure
The Federal Crop Insurance Program provides an important safety net that protects producers from a wide range of risks caused by natural disasters as well as the risk of price fluctuations In recent years an increasing proportion of risk protection has been provided by revenue insurance which protects against both a loss of yield and price declines The Federal Crop Insurance Program is a critical component of the farm safety net
A key performance measure for the Federal Crop Insurance Program is the total value of crops protected or total liabilities The following table presents both actual liabilities and normalized liabilities which account for the effects of changes in commodity prices Commodity prices are a key external factor which can significantly affect performance measurements for the crop insurance program
39
Key Performance Measures 2006 2007 2008 2009 2010 2011 Value of FCIC risk protection coverage provided through FCIC sponsored insurance ($Billions) $499 $673 $899 $904 $814 $839 Normalized value of FCIC risk protection coverage provided through FCIC sponsored insurance ($Billions) $481 $507 $515 $514 $519 $524
FARM AND FOREIGN AGRICULTURAL SERVICES
For the 2010 crop year the Federal Crop Insurance Program is expected to provide about $814 billion in risk protection on about 286 million acres This represents about 80 percent of the Nationrsquos acres planted to principal crops In 2009 about 70 percent of the liabilities were covered under revenue products which provide protection against both a loss of yield and a decline in commodity prices
Participation in the Federal Crop Insurance Program by producers is voluntary however participation is encouraged through premium subsidies In addition participation in the Federal Crop Insurance Program is required in order to participate in the supplemental agricultural disaster assistance programs authorized in the 2008 Farm Bill Crop insurance is delivered to producers through private insurance companies that share in the risk of loss and opportunity for gain The companies are reimbursed for their delivery expenses and receive underwriting gains in years of favorable loss experience The costs associated with the Federal Crop Insurance Program include premium subsidies indemnity payments (in excess of premiums) underwriting gains paid to private companies reimbursements to private companies for delivery expenses and other authorized expenditures
The Standard Reinsurance Agreement (SRA) is the contract between USDA and the private insurance companies which contains many of the financial terms and conditions for participation in the Federal Crop Insurance Program The 2008 Farm Bill authorized USDA to renegotiate the SRA for the 2011 crop year and every 5 years thereafter In December 2009 USDA announced that it was cancelling the current SRA and would renegotiate the agreement with the companies for the 2011 crop year USDA expects to complete the negotiation process by July 1 2010 the start of the 2011 crop year Through the renegotiation process USDA intends to align administrative and operating subsidies paid to insurance companies closer to actual delivery costs provide a reasonable rate of return to the insurance companies equalize reinsurance performance across States to more effectively reach under-served producers commodities and areas and improve program integrity
In preparation for these negotiations RMA contracted with an internationally known company Milliman Inc to review historical rates of return and determine what a reasonable rate of return is for the crop insurance industry RMA data shows that annual insurance industry payments have doubled from $18 billion in 2006 to an estimated $38 billion in 2009 based on the terms of the existing SRA Meanwhile the number of total policies dropped slightly from 13 million in 2000 to 11 million in 2008 The changes being proposed will help protect farmers from higher costs improve access to crop insurance and provide greater protection from crop losses The new agreement will also provide insurance companies with greater flexibility for their operations
40
FARM AND FOREIGN AGRICULTURAL SERVICES
and financial incentives to increase service to underserved producers and areas while ensuring that taxpayers are well-served by the program USDA expects to have in place a stronger Federal Crop Insurance Program that helps producers better manage their risk and that serves farmers in every region of the country and to complete the negotiation process by July 1 2010 the start of the 2011 crop year
The performance for the Federal Crop Insurance Program is tracked on a crop year basis which spans multiple fiscal years As a result the table on page 39 reflects certain assumptions about the fiscal year in which the crop year costs andor revenues will fall Furthermore the amount of liabilities covered by the Federal Crop Insurance Program is strongly influenced by changing commodity prices
Actual indemnities for fiscal year 2009 reflect crop year 2008 losses which were paid out in fiscal year 2009 plus crop year 2009 losses which were paid out in fiscal year 2009 The relatively low actual indemnities for fiscal year 2009 reflect the low loss ratios experienced in the 2008 and 2009 The actual loss ratio for crop year 2008 was a low 088 Losses for crop year 2009 are not yet finalized however the statutory target used for budgetary purposes is 10
Estimated indemnities for fiscal year 2010 reflect about 65 percent of the estimated losses for crop year 2009 plus 35 percent of the estimated losses for crop year 2010 Losses for crop years 2010 and 2011 reflect an estimated loss ratio of 10 Estimated indemnities for fiscal year 2011 are calculated in the same manner as 2010
There is a one year lag between crop year underwriting gains and the fiscal year in which they are paid out Consequently the underwriting gains for fiscal year 2009 reflect the low loss ratio experienced for crop year 2008 The underwriting gain totals for fiscal years 2010 and 2011 reflects the assumption that the loss ratio in crop years 2009 and 2010 will be 10
In fiscal year 2009 the actual total Government cost for the Federal Crop Insurance Program was about $79 billion Of this amount about $42 billion was for net indemnities to producers (gross indemnities minus producer paid premiums) The remaining amount of about $36 billion was for payments to the private insurance companies to deliver the program
41
FARM AND FOREIGN AGRICULTURAL SERVICES
FOREIGN AGRICULTURAL SERVICE (FAS)
FAS administers a variety of programs that are designed to facilitate access to international markets and thereby help to support a competitive US agricultural system FAS also carries out activities that promote productive agricultural systems in developing countries and contribute to increased trade and enhanced global food security Working bilaterally and with international organizations FAS encourages the development of transparent and science-based regulatory systems that allow for the safe development and use of agricultural goods derived from new technologies
National Export Initiative
120
100 $97
FAS Export Promotion Activities
80
FMDP - Foreign Market Development Program -- Discretionary Funding 2011
TASC - Technical Assistance for 60 Specialty Crops Program -- Discretionary
Funding 2011
FMDP - Foreign Market Development Program -- Mandatory CCC Funding $41 $42
40 TASC - Technical Assistance for Specialty Crops Program -- Mandatory CCC Funding
20
0 7 8 9
34 34 34
9
35
10
2009 2010 2011
Fiscal Year
$ M
illio
ns
42
FARM AND FOREIGN AGRICULTURAL SERVICES
Foreign Agricultural Service Budget Authority
(Dollars in Millions) 2009 2010 2011
Program Enacted Estimate Budget Discretionary FAS Salaries and Expenses Salaries and Expenses (Direct Appropriation)helliphelliphelliphelliphelliphelliphelliphellip $165 $180 $201 Agricultural Reconstruction and Stabilization helliphelliphelliphelliphelliphelliphellip 0 0 15 Foreign Market Development (Cooperator) Programhelliphelliphelliphellip 0 0 35 Technical Assistance for Specialty Crops Programhelliphelliphelliphelliphellip 0 0 9 Transfer from CCC Export Credit Program Accounthelliphelliphelliphelliphellip (5) (6) (7) Total FAS Salaries and Expenseshelliphelliphelliphelliphelliphelliphelliphelliphelliphelliphelliphellip (170) (187) (265) Foreign Food Assistance McGovern-Dole International Food for Education Programhelliphellip 100 210 210
PL 480 Title II Donationshelliphelliphelliphelliphelliphelliphelliphelliphelliphelliphelliphelliphelliphelliphellip 1226 1690 1690 PL 480 Title II Supplemental Fundinghelliphelliphelliphelliphelliphelliphelliphelliphellip 1095 0 0
Total PL 480 Title II Donationshelliphelliphelliphelliphelliphelliphelliphelliphelliphelliphellip 2321 1690 1690 PL 480 Title I Program Account
Transfer to Farm Service Agency Salaries and Expenseshelliphelliphellip 3 3 3 Commodity Credit Corporation Export Credit Program Account Transfer to FSA and FAS Salaries and Expenseshelliphelliphelliphelliphelliphellip (5) (7) (7) Total Discretionary Programshelliphelliphelliphelliphelliphelliphelliphelliphelliphelliphelliphelliphellip 2589 2083 2161 Mandatory Quality Samples Programhelliphelliphelliphelliphelliphelliphelliphelliphelliphelliphelliphelliphelliphelliphelliphellip 2 2 2 Farm Bill Market Development Programs Foreign Market Development (Cooperator) Programhelliphelliphelliphellip 34 34 34 Technical Assistance for Specialty Crops Programhelliphelliphelliphelliphellip 7 8 9 Market Access Programhelliphelliphelliphelliphelliphelliphelliphelliphelliphelliphelliphelliphelliphelliphelliphellip 200 200 160 Emerging Markets Programhelliphelliphelliphelliphelliphelliphelliphelliphelliphelliphelliphelliphelliphellip 10 10 10 Dairy Export Incentive Programhelliphelliphelliphelliphelliphelliphelliphelliphelliphelliphelliphelliphellip 19 10 0 Foreign Food Assistance McGovern-Dole International Food for Education Programhelliphellip 84 0 0 Food for Progress - CCC Funded helliphelliphelliphelliphelliphelliphelliphelliphelliphelliphelliphellip 216 150 146 Bill Emerson Humanitarian Trusthelliphelliphelliphelliphelliphelliphelliphelliphelliphelliphelliphellip 7 a a Local and Regional Commodity Procurement Pilot Programhellip 5 25 25 Total Farm Bill Programshelliphelliphelliphelliphelliphelliphelliphelliphelliphelliphelliphelliphelliphelliphellip 582 437 384 Recovery Act Trade Adjustment Assistance for Farmershelliphelliphelliphelliphelliphelliphelliphelliphellip 25 90 22 Total Mandatory Programshelliphelliphelliphelliphelliphelliphelliphelliphelliphelliphelliphelliphelliphellip 609 529 408 Total Foreign Agricultural Servicehelliphelliphelliphelliphelliphelliphelliphelliphelliphelliphellip $3198 $2612 $2569
a Assets of the Trust can be released any time the Administrator of the US Agency for International Development determines that PL 480 Title II funding for emergency needs is inadequate to meet those needs in any fiscal year
43
FARM AND FOREIGN AGRICULTURAL SERVICES
Foreign Agricultural Service CCC Export Credit Programs
Program Level (PL) and Budget Authority (BA) (Dollars in Millions)
2009 2010 2011 Enacted Estimate Budget
Program PL BA PL BA PL BA GSM-102 Guaranteeshelliphelliphelliphelliphelliphelliphelliphelliphelliphellip $5357 $40 $5400 0 $5400 0 Facilities Financing Guaranteeshelliphelliphelliphelliphelliphellip 0 0 100 $11 100 $18 Total CCC Export Credithelliphelliphelliphelliphelliphelliphellip $5357 $40 $5500 $11 $5500 $18
CCC Export Credit Guarantee Programs The CCC export credit guarantee programs administered by FAS in conjunction with FSA provide payment guarantees for the commercial financing of US agricultural exports These programs facilitate exports to buyers in countries where credit is necessary to maintain or increase US sales
The budget includes an overall program level of $55 billion for CCC export credit guarantees in 2011 This estimate reflects the level of sales expected to be registered under the export credit guarantee programs However the actual level of programming could vary from this estimate depending upon program demand market conditions and other relevant factors during the course of the year
Of the total program level for export credit guarantees expected to be issued by CCC in 2011 $54 billion will be made available under the GSM-102 program which provides guarantees on commercial export credit extended with short-term repayment terms (up to 3 years)
The budget also includes an estimated program level of $100 million for facility financing guarantees in 2011 Under this activity CCC provides guarantees to facilitate the financing of goods and services exported from the United States to improve or establish agriculture-related facilities in emerging markets By supporting such facilities these guarantees enhance sales of US agricultural products to countries where demand is constricted due to inadequate storage processing or handling capabilities
International Federal credit programs have traditionally used government-wide assumptions about defaults and recoveries but are now encouraged to develop program specific assumptions For GSM-102 guarantees program specific recovery assumptions were incorporated into the subsidy calculation for the 2009 budget and program specific assumptions about defaults were incorporated in the 2010 budget Because actual program performance and expectations for the future differ from the government-wide assumptions used in previous years the changes to these two factors have resulted in substantially reduced subsidy rates for the program Due to a lack of historical program data government-wide assumptions continue to be used for the subsidy estimate for the facilities guarantee program
Quality Samples Program Funding for the Quality Samples Program is maintained at the 2010 level of about $25 million Under this program CCC provides funding to assist private entities
44
FARM AND FOREIGN AGRICULTURAL SERVICES
to furnish samples of US agricultural products to foreign importers in order to overcome trade and marketing obstacles The program which is carried out under the authority of the CCC Charter Act provides foreign importers with a better understanding and appreciation of the characteristics of US agricultural products
Market Development Programs FAS administers a number of programs in partnership with private sector cooperator organizations that support the development maintenance and expansion of commercial export markets for US agricultural commodities and products The 2011 budget proposes a series of adjustments in the funding levels for these programs to reflect the changing nature of agricultural trade competition
The budget increases funding for the Foreign Market Development (Cooperator) Program to $69 million in 2011 This includes $345 million to be provided by CCC consistent with provisions of the 2008 Farm Bill and an additional $345 million of discretionary funding to be provided in the FAS salaries and expenses account as part of the National Export Initiative Under this program cost-share assistance is provided to nonprofit commodity and agricultural trade associations to support overseas market development activities that are designed to remove long-term impediments to increased US trade These activities include technical assistance trade servicing and market research Annual funding for the Cooperator Program has remained relatively unchanged since the early 1980s which has discouraged new organizations from participating and new types of activities from being undertaken The priority of the Cooperator Program is the pursuit of export market gains that require longer term initiatives and resource commitments Increasing the funding level in 2011 will provide the opportunity to broaden international acceptance of the products of biotechnology which account for a third of our agricultural exports today and will account for even more in the future as well as to take advantage of emerging market opportunities that require long term market development investment
For the Technical Assistance for Specialty Crops (TASC) Program the budget includes total funding of $18 million consisting of $9 million of CCC funding and $9 million of discretionary funding provided in the FAS salaries and expenses account Similar to the Cooperator Program funding for TASC will be increased in 2011 as part of the National Export Initiative TASC is designed to address unique barriers that prohibit or threaten the export of US specialty crops Under the program grants are provided to assist US organizations in activities designed to overcome sanitary phytosanitary or related technical barriers to trade Increased funding for the program reflects the growing importance of specialty crops for US agricultural export growth and the contribution the program has made in resolving numerous trade barriers that have restricted trade
The budget provides funding of $160 million for the Market Access Program (MAP) This program reimburses participating organizations for a portion of the cost of carrying out overseas marketing and promotional activities such as consumer promotions MAP participants include nonprofit agricultural trade organizations State-regional trade groups cooperatives and private companies that qualify as small businesses Annual MAP funding has grown substantially since 2001 when the program level was $90 million Although the 2011 MAP funding level is
45
FARM AND FOREIGN AGRICULTURAL SERVICES
reduced from 2010 it still provides a program level that is nearly 80 percent above 2001 reflecting the recent strong expansion in programming
The budget maintains funding for the Emerging Markets Program at $10 million consistent with provisions of the 2008 Farm Bill The program authorizes CCC funding to be made available to carry out technical assistance activities that promote the export of US agricultural products and address technical barriers to trade in emerging markets Many types of technical assistance activities are eligible for funding including feasibility studies market research industry sector assessments specialized training and business workshops
Dairy Export Incentive Program Under the Dairy Export Incentive Program (DEIP) CCC funds are used to make bonus payments to exporters of US agricultural commodities to enable them to be price competitive and thereby make sales in targeted overseas markets where competitor countries are making subsidized sales
Because of global market conditions including falling international dairy prices and the reinstitution of dairy export subsidies by the European Union DEIP was reactivated in May 2009 and $19 million of bonuses were awarded under the program during 2009 Global market conditions are expected to improve gradually with the United States once again regaining its competitive position in export dairy markets Based on that assumption the budget includes a projected program level of $10 million for DEIP in 2010 and no funding for 2011 However should conditions warrant CCC funding can continue to be made available to the program up to the maximum annual level authorized under US commitments to the World Trade Organization
Foreign Food Assistance The United States plays a leading role in global efforts to alleviate hunger and malnutrition and enhance world food security through international food aid activities USDA contributes to these efforts by carrying out a variety of food aid programs which support economic growth and development in recipient countries
McGovern-Dole International Food for Education and Child Nutrition Program The McGovern-Dole International Food for Education and Child Nutrition Program provides for the donation of US agricultural commodities and associated financial and technical assistance to carry out preschool and school feeding programs in foreign countries Maternal infant and child nutrition programs also are authorized under the program Its purpose is to reduce the incidence of hunger and malnutrition and improve literacy and primary education These measures contribute to a healthy literate workforce that can support a more prosperous sustainable economy and ensure long-term food security
The 2011 budget continues funding for the McGovern-Dole program at the 2010 enacted level of $2095 million Appropriated funding for the program was increased substantially in 2010 in order to help support additional school feeding and child nutrition programs and to bolster the Departmentrsquos contribution to supporting economic development and food security in developing countries The program is expected to assist an estimated 5 million women and children in 2011
46
FARM AND FOREIGN AGRICULTURAL SERVICES
Food for Peace Act (PL 480) Assistance provided under the authority of the Food for Peace Act is a primary means by which the United States provides foreign food assistance Also known as PL 480 the assistance is authorized to be provided through two program authorities
bull Title I provides for sales of US agricultural commodities to developing country governments and private entities through concessional financing agreements and for donations through Food for Progress grant agreements The Title I program is administered by FAS
bull Title II provides for donations of humanitarian food assistance to needy people in foreign countries in response to malnutrition famine and other extraordinary relief requirements and to meet economic development needs that address food security The assistance is provided primarily through private voluntary organizations cooperatives or international organizations mainly the World Food Program (WFP) of the United Nations The Title II program is administered by the US Agency for International Development (USAID)
For 2011 the budget provides funding of nearly $17 billion for PL 480 Title II food assistance unchanged from the 2010 enacted level Last yearrsquos budget increased base funding for Title II programming by 38 percent over the previous year in order to bolster resources available for emergency needs enhance global food security and restore US leadership in global development efforts The 2011 budget maintains funding at that level in further support of those objectives
The budget includes no funding for Title I credit sales and grants
Food for Progress The Food for Progress Act of 1985 authorizes US agricultural commodities to be provided to developing countries and emerging democracies that have made commitments to introduce and expand free enterprise in their agricultural economies Statutory authority for the program was extended in the 2008 Farm Bill
Food for Progress agreements can be entered into with foreign governments private voluntary organizations nonprofit agricultural organizations cooperatives or intergovernmental organizations Agreements currently provide for the commodities to be supplied on grant terms
The Food for Progress authorizing statute provides for the use of CCC funding for commodity procurement transportation and associated non-commodity costs for the program
The 2011 budget assumes that $146 million of CCC funding will be used to support the Food for Progress program which is expected to support approximately 170000 metric tons of commodity assistance
Bill Emerson Humanitarian Trust The Bill Emerson Humanitarian Trust (the Trust) is a commodity andor monetary reserve designed to ensure that the United States can meet its international food assistance commitments under PL 480 Title II Substantial changes in the statutory authorities for the Trust were included in the 2008 Farm Bill These included revisions easing the criteria for release of commodities and funds from the Trust As revised the Trustrsquos
47
FARM AND FOREIGN AGRICULTURAL SERVICES
assets can now be released any time the Administrator of USAID determines that PL 480 Title II funding for emergency needs is inadequate to meet those needs in any fiscal year The revisions also removed the annual cap on the amount of commodities and funds that can be released
When a release from the Trust is authorized the Trustrsquos assets (whether commodities or funds) cover all commodity costs associated with the release All non-commodity costs including ocean freight charges internal transportation storage and handling overseas and certain administrative costs are paid for by CCC
During 2009 $7 million of assistance was provided using the Trustrsquos authority To date in 2010 no assistance has been provided and as of December 31 2009 the Trust held $315 million of cash and no commodities
Local and Regional Commodity Procurement Pilot Program The 2008 Farm Bill authorizes and provides CCC funding for a limited field-based pilot program of local and regional procurement of food aid commodities for distribution overseas Under the program which is authorized through 2012 grants are provided to private voluntary organizations cooperatives and WFP that undertake the procurement activities During 2009 FAS issued guidelines that govern operation of the pilot program and nearly $5 million of grants were awarded to the World Food Program for procurement projects in Mali Malawi and Tanzania Commodities purchased included sorghum millet beans and corn Consistent with provisions of the Farm Bill the budget provides $25 million for the pilot program in 2010 and 2011
In conjunction with an evaluation of USDA foreign food assistance programs FAS has developed a long-term performance measure that is intended to gauge the effectiveness of USDA food aid programs in improving food security in low income countries The ldquofood aid targeting effectiveness measurerdquo assesses how effective the targeting of USDA food aid programs is in addressing the food distribution gap in the most food insecure countries The Economic Research Service calculates the ratio using its Food Security Assessment Model which measures food security based on estimations of food gaps in 71 of the worldrsquos poorest countries Food gaps represent the difference between projected food availability and targeted food consumption
Because USDA food assistance programs contribute to multiple objectives including filling nutritional gaps agricultural development and childhood education performance results can vary from year to year depending upon which countries receive assistance The results will be highest in years when food is directly distributed and the country has a food distribution system that gets food to the neediest This occurred in 2008 when countries receiving assistance to meet nutritional development and educational needs had large nutritional gaps which caused a significant increase in the Food Aid Targeting Effectiveness measure
2006 2007 2008 2009 2010 2011Key Performance Measure
Food Aid Targeting 30-35 38 57 49 37 38Effectiveness (Percent)
48
FARM AND FOREIGN AGRICULTURAL SERVICES
Trade Adjustment Assistance for Farmers The Recovery Act reauthorized the Trade Adjustment Assistance (TAA) for Farmers program that was originally authorized by the Trade Act of 2002 Statutory authority for the original program had expired in December 2007 As revised by the Recovery Act USDA is now authorized to provide assistance to eligible producers of raw agricultural commodities and fishermen when production in the most recent marketing year yields less than 85 percent of the average national price production quantity value of production or cash receipts for such commodity for the 3 preceding marketing years and increases in imports contributed importantly to such declines as determined by the Secretary
TAA for Farmers provides producers of raw agricultural commodities and fishermen who have been adversely affected by import competition free technical assistance the reimbursement of certain travel and per diem costs associated with training and cash benefits of up to $12000 linked to the development and implementation of approved business adjustment plans The program covers farmers livestock producers fish farmers and fishermen competing with like or directly competitive imported products
During 2009 $25 million of TAA funding was obligated for the costs of implementing the revised program including the costs of contracting for the provision of technical assistance over a multi-year period As authorized by the Recovery Act the budget assumes annual funding of $90 million for the program for 2010 and $225 million for 2011 Statutory authority for the TAA for Farmers program expires on December 31 2010
49
FARM AND FOREIGN AGRICULTURAL SERVICES
Foreign Agricultural Service Salaries and Expenses (Dollars in Millions)
2009 2010 2011 Program Enacted Estimate Budget
Agricultural Exportshelliphelliphelliphelliphelliphelliphelliphelliphelliphelliphelliphelliphelliphelliphelliphelliphellip $112 $123 $182 New Technologieshelliphelliphelliphelliphelliphelliphelliphelliphelliphelliphelliphelliphelliphelliphelliphelliphellip 21 23 24 Food Securityhelliphelliphelliphelliphelliphelliphelliphelliphelliphelliphelliphelliphelliphelliphelliphelliphelliphelliphellip 34 38 41 Climate Changehelliphelliphelliphelliphelliphelliphelliphelliphelliphelliphelliphelliphelliphelliphelliphelliphelliphellip 3 3 3 Agricultural Reconstruction and Stablizationhelliphelliphelliphelliphelliphelliphellip 0 0 15
Total Appropriated Programshelliphelliphelliphelliphelliphelliphelliphelliphelliphelliphellip 170 187 265 FAS Computer Facility and Other IRM Costs Funded by CCChelliphelliphelliphelliphelliphelliphelliphelliphelliphelliphelliphelliphelliphelliphelliphelliphellip 20 24 21 Development Assistance Programs Funded by AID and Other Organizationshelliphelliphelliphelliphelliphelliphelliphelliphelliphelliphelliphellip 67 66 66 Agricultural Reconstruction and Stablization Activities funded by USAID and the Dept of Statehelliphelliphelliphelliphelliphelliphelliphelliphelliphelliphellip 19 209 18 Other Reimbursable Agreementshelliphelliphelliphelliphelliphelliphelliphelliphelliphelliphelliphellip 35 41 28
Total Reimbursable Program Activityhelliphelliphelliphelliphelliphelliphelliphellip 141 340 133 Total FAS Salaries and Expenseshelliphelliphelliphelliphelliphelliphelliphelliphelliphellip $311 $527 $398
Agricultural exports make a critical contribution to the prosperity of local and regional economies across rural America through increased sales and higher commodity prices Every $1 billion worth of agricultural exports supports an estimated 9000 jobs and $14 billion in economy activity Because of this important role the Department has established a high priority performance goal that by the end of 2011 it will reduce non-tariff trade barriers for five major export markets and increase US agricultural exports by $2 billion per year
Biotechnology crops and derived products are a significant portion of US agricultural exports However concerns about these products have prompted some countries to establish regulatory barriers to trade in biotechnology products as well as other measures that limit the technologyrsquos potential to help meet food security needs In a concerted and strategic effort to address these barriers FAS will play a key role in implementing a formal USDA Strategy for Facilitating the Export of Genetically Engineered Agricultural Commodities FAS will work under this coordinated approach with other agencies within USDA and elsewhere in the government as well as with allies worldwide to help address these trade barriers as well as to help other nations understand how biotechnology may help address the global challenges of food security energy security and climate change
A key component of FASrsquo work to facilitate access to overseas markets is compliance monitoring and enforcement of existing trade agreements to ensure full and fair access to overseas markets for Am erican producers and exporters Each year FAS personnel in Washington and at overseas posts monitor compliance and when necessary intervene with
50
FARM AND FOREIGN AGRICULTURAL SERVICES
foreign governments on behalf of US exporters w ho face market access difficulties as a result of unfair and illegal trade barriers Increasingly in recent years these barriers have involved Sanitary and Phytosanitary (SPS) measures As tariffs have come down globally SPS measures to protect human animal and plan t health have become more prominent barriers to trade and have required significantly enhanced efforts by FAS in collaboration with other USDA agencies to address and resolve
There can be considerable year-to-year variability in the dollar value o f tr ade preserved particularly in the case of SPS measures and t echn ical barriers to trade such as biotechnology-related trade measures Biotechnology-related me asures in particular affect major US export commodities such as rice corn soybeans and cotton and the economic significance of a single trade disruption with a major market can be substantial High commodity prices can also affect the annual level of trade preserved This variability is evident in the substantially higher value of trade preserved during 2008 and 2009 The threat to US agricultural exports from non-science based SPS barriers continues to grow and can impact billions of dollars of our trade USDA actions in 2008 and 2009 maintained soybean exports to China worth $63 billion in 2008 and $74 billion in 2009
Key Performance Measure Dollar value of agriculture trade preserved through trade agreement negotiation monitoring and enforcement ($ Billions)
2006 2007 2008 2009 2010 2011
Non-SPS Activities a $07 $05 $04 $05 $05
Value of trade preserved annually through USDA staff interventions leading to resolution of barriers created by SPS or Technical Barrier to Trade measures ($ Billions)
SPS-Related Activities b 26 $26
25 $32
73 $78
95 $99
36 $41
40 $45
a Less than $50 million b In 2008 and 2009 includes soybean exports to China
FAS conducts its activities and programs through offices in Washington DC and at 97 overseas locations The overseas offices represent and advocate for US agricultural interests provide reporting on agricultural policies production and trade for about 150 countries assist US exporters trade groups and State export marketing officials in their trade promotion efforts and help to implement technical assistance and trade capacity building programs that contribute to increased food security
51
FARM AND FOREIGN AGRICULTURAL SERVICES
The budget provides an appropriated funding level of $265 million for FAS activities in 2011 an increase of $79 million above the 2010 enacted level Of particular note increased funding is provided to expand export promotion activities maintain the agencyrsquos overseas presence at current levels and improve information technology (IT) network support at its overseas offices
Export Promotion The budget includes $54 million in discretionary funding for trade expansion activities as part of the National Export Initiative that is designed to spur economic growth and employment opportunities This includes an increase of $10 million to expand FAS exporter assistance and in-country promotion activities and to meet higher operating costs at FAS overseas posts The initiative also includes $345 million to supplement funding for the Foreign Market Development (Cooperator) Program and $9 million for the Technical Assistance for Specialty Crops (TASC) Program Funding for the Cooperator and TASC programs will be in addition to that provided by CCC and will double the overall level of funding available to both programs in 2011 Funding is increased for the Cooperator Program in order to broaden the opportunity for program participation and to support new innovative pr ogram activities The expansion in TASC funding reflects the growing importance of specialty crops for US agricultural export growth and the success TASC has had in helping to resolve numerous trade barriers
Overseas Administrative Costs The budget provides $34 million for increased payments to the Department of State for administrative services provided at overseas posts FAS has no administrative staff overseas and therefore relies on the Department of State and other agencies for the provision of those services
Overseas IT Network Support An increase of $4 million is provided for FAS to contract with the Department of State for overseas IT network support and maintenance This will allow FAS to take advantage of the secure information system infrastructure that is operated and maintained by the State Department and ensure that sensitive agency information is fully protected
Cochran and Borlaug Fellowship Programs The budget provides increased funding of $15 million for the Cochran and Borlaug Fellowship Programs These programs provide training and collaborative research opportunities in the United States for foreign agricultural researchers policy officials and other agricultural specialists and thereby help to advance US government food security and trade policy objectives Among other things the additional funding will enable an expansion of programs in Afghanistan and Pakistan to train agricultural extension agents veterinary officials and researchers in support of agricultural growth and development It will also allow for additional training in support of food security objectives in sub-Saharan African countries as well as Haiti Under our proposals as many as 680 individuals will be able to participate in and benefit from these programs
Agricultural Reconstruction and Stabilization The FAS budget also includes $146 million to support the Departmentrsquos participation in reconstruction and stabilization activities including Provincial Reconstruction Teams (PRTs) primarily in Afghanistan and Iraq Of this $13 million is moved from Departmental Management where it was funded in the 2010 appropriations act During the past year FAS has assumed full management of the operational and policy components of USDArsquos reconstruction and stabilization activities FAS also
52
FARM AND FOREIGN AGRICULTURAL SERVICES
coordinates closely with the Department of State which sets overall operational and administrative policies for activities in those two countries Transferring the funding for these activities to FAS provides for more efficient operations and is consistent with how the Department is now managing them Funding for these activities is increased by $16 million over the 2010 level to provide for an expansion of activities in Afghanistan and to meet higher operating costs
USDA is supporting implementation of the Presidentrsquos strategies for Afghanistan and Iraq by providing technical experts who serve as advisors to key government ministries and serve on civilian-military command units including PRTs working with farmers and local agricultural officials throughout the countries During 2010 USDA is increasing the number of agricultural advisors serving in Afghanistan from 14 to 64 Their work is essential for stabilizing strategic areas of the country building government capacity ensuring the successful management of assistance programs and addressing the issue of food insecurity Consistent with these efforts the Department has established a high priority performance goal of increasing the number of Afghan provinces in which women and children are food secure from 10 to 14 by the end of 2011
In addition the budget includes an estimated $133 million in funding to be made available to FAS through reimbursable agreements The largest components of this are funding for technical assistance training and research activities that FAS carries out overseas on behalf of USAID foreign governments and international organizations and agricultural reconstruction and stabilization activities that are funded by USAID and the Department of State Although funded by other agencies these activities are an important component of the Departmentrsquos efforts to support economic development and enhance food security in developing countries
53
RURAL DEVELOPMENT
Rural Housing 62
MISSION AND RELATIONSHIP TO STRATEGIC GOAL
Rural communities and businesses are implementing innovative technologies and modernizing infrastructure to create jobs develop new markets and increase competitiveness while conserving the Nationrsquos natural resources and providing a safe sufficient and nutritious food supply for the country and the world As a leading advocate for rural America USDA is at the forefront of developing the technology and tools necessary to transform rural America to take advantage of new opportunities All of the funding for USDArsquos Rural Development (RD) programs contributes to the Strategic Goal assisting rural communities to create prosperity by providing financial and technical assistance to rural residents businesses and private and public entities for a broad range of purposes that bring prosperity and better living to Rural America These programs are grouped within three agencies (1) the Rural Business-Cooperative Service (RBS) which provides assistance for the development of business and industry including small businesses and is currently implementing new loan guarantee and payment programs specifically designed for renewable energy and energy improvement projects (2) the Rural Utilities Service (RUS) which provides assistance for water and waste disposal rural electric and telecommunications including broadband access and (3) the Rural Housing Service (RHS) which provides assistance for home ownership multi-family housing and essential community facilities such as health and public safety infrastructure
Rural Development 2011 Program Level - $ 24 Billion
Rural Business 7
Salaries and Expenses
3
Rural Utilities 28
The type of assistance offered includes direct loans loan guarantees grants and technical assistance Some programs provide assistance to intermediaries that make loans or provide technical assistance to the ultimate beneficiaries Several of the programs require or encourage recipients to contribute their own resources or obtain third-party financing to support the total cost of projects in which case these programs leverage the Governmentrsquos support with private sector financing
The cost of programs that provide direct or guaranteed loans depends upon a number of factors including what prevailing interest rates are whether the interest rate on the loans is subsidized by
54
RURAL DEVELOPMENT
the Government whether there are fees and how much risk of loss is involved In the tables the budget authority for each program reflects the cost to the government to support the loan level Several of the loan programs operate at little or no cost to the Government These programs account for most of the financial assistance that RD provides They also impose a responsibility on RD to ensure that these loans are repaid within the parameters reflected in the subsidy rates applied at the time the loans were made
RD delivers its programs through a network of approximately 450 area offices and 47 State offices a centralized servicing center and finance office in St Louis Missouri and a national office
The 2011 budget includes about $29 billion in budget authority to support a program level of $24 billion in loans grants and other assistance This level of support reflects a strong commitment to Rural America It also reflects new policy directions including support for regional planning and collaboration rural and urban access to healthy foods rural homeownership and a reduction in the Nationrsquos dependence on fossil fuels
55
RURAL DEVELOPMENT
RURAL BUSINESS - COOPERATIVE SERVICE (RBS)
Program Level (PL) and Budget Authority (BA) (Dollars in Millions)
2009 2010 2011 Enacted Estimate Budget
Program PL BA PL BA PL BA Discretionary Business and Industry Guaranteed Loans helliphelliphelliphelliphelliphelliphelliphellip $993 $43 $993 $53 $942 $40 Rural Business Enterprise Grantshelliphelliphelliphelliphelliphelliphelliphelliphelliphelliphellip 39 39 39 39 39 39 Rural Business Opportunity Grantshelliphelliphelliphelliphelliphelliphelliphelliphelliphellip 5 5 5 5 3 3 Intermediary Relending Programhelliphelliphelliphelliphelliphelliphelliphelliphelliphelliphellip 34 14 34 8 36 14
Rural Economic Development Direct Loanshelliphelliphelliphelliphelliphelliphelliphelliphelliphelliphelliphelliphelliphelliphelliphelliphelliphellip 36 0 33 0 33 0 Grantshelliphelliphelliphelliphelliphelliphelliphelliphelliphelliphelliphelliphelliphelliphelliphelliphelliphelliphelliphelliphellip 10 0 10 0 10 0 Rural Microentrepreneur Assistance Program (Sec 6022) Guaranteed Loanshelliphelliphelliphelliphelliphelliphelliphelliphelliphelliphelliphelliphelliphelliphelliphellip 0 0 12 3 24 7 Grantshelliphelliphelliphelliphelliphelliphelliphelliphelliphelliphelliphelliphelliphelliphelliphelliphelliphelliphelliphelliphellip 0 0 3 3 1 1 Rural Cooperative Development Grantshelliphelliphelliphelliphelliphelliphelliphellip 9 9 14 14 20 20 Biorefinery Assistance Program (Sec 9003)helliphelliphelliphelliphelliphelliphellip 0 0 0 0 50 17 Value-added Ag Product Market Development helliphelliphelliphelliphellip 4 4 20 20 20 20 Rural Energy for America Program (Sec 9007) Guaranteed Loanshelliphelliphelliphelliphelliphelliphelliphelliphelliphelliphelliphelliphelliphelliphelliphellip 26 2 144 20 12 5 Grantshelliphelliphelliphelliphelliphelliphelliphelliphelliphelliphelliphelliphelliphelliphelliphelliphelliphelliphelliphelliphellip 3 3 20 20 34 34 EZEChelliphelliphelliphelliphelliphelliphelliphelliphelliphelliphelliphelliphelliphelliphelliphelliphelliphelliphelliphelliphellip 8 8 0 0 0 0 Subtotal RBS Programshelliphelliphelliphelliphelliphelliphelliphelliphelliphelliphelliphelliphelliphellip 1167 127 1327 185 1224 200 Salaries and Expenseshelliphelliphelliphelliphelliphelliphelliphelliphelliphelliphelliphelliphelliphelliphelliphellip 5 5 5 5 5 5 Total Ongoing Programshelliphelliphelliphelliphelliphelliphelliphelliphelliphelliphelliphelliphellip 1172 132 1332 190 1229 205 Recovery Act
Business and Industry Guaranteed Loanshelliphelliphelliphelliphelliphellip 1572 126 0 0 0 0 Rural Business Enterprise Grantshelliphelliphelliphelliphelliphelliphelliphelliphellip 19 19 0 0 0 0
Total Recovery Act Programshelliphelliphelliphelliphelliphelliphelliphelliphelliphelliphelliphellip 1591 145 0 0 0 0 Total Discretionary Programshelliphelliphelliphelliphelliphelliphelliphelliphelliphelliphelliphellip 2763 277 1332 190 1229 205 Mandatory Farm Bill
Biorefinery Assistance Guaranteed Loans (Sec 9003)hellip 225 75 691 245 0 0 Rural Energy for America Loans (Sec 9007)helliphelliphelliphellip 275 27 213 29 73 34 Rural Energy for America Grants (Sec 9007)helliphelliphelliphellip 28 28 31 31 36 36 Repowering Assistance Payments (Sec 9004)helliphelliphelliphellip 35 35 0 0 0 0 Bioenergy for Advanced Biofuels (Sec 9005)helliphelliphelliphellip 55 55 55 55 85 85 Value-added Ag Product Market Development helliphelliphellip 15 15 0 0 0 0 Rural Microentrepreneur Assist Loans (Sec 6022)helliphellip 9 3 3 1 6 2 Rural Microentrepreneur Assist Grants (Sec 6022)hellip 1 1 3 3 2 2
Total Mandatory Programshelliphelliphelliphelliphelliphelliphelliphelliphelliphelliphelliphelliphellip 643 239 996 364 202 159 Total RBS Programshelliphelliphelliphelliphelliphelliphelliphelliphelliphelliphelliphelliphelliphelliphellip$3406 $516 $2328 $554 $1431 $364
56
RURAL DEVELOPMENT
RBS administers RDrsquos rural business and cooperative services programs The primary purpose of these programs is to promote economic development
Healthy Food Financing Initiative This initiative is designed to support local and regional efforts to increase access to healthy foods particularly for the development of grocery stores and other healthy food retailers in urban and rural food deserts and other underserved areas Several RD programs are included in this initiative and are expected to be utilized to provide financing for grocery stores and other related infrastructure
Regional Innovation The 2011 budget also includes an initiative to establish a Regional Innovation Initiative to focus on the planning and coordination of USDA and other sources of assistance for rural communities This initiative recognizes that individual communities are often affected by linkages to the other communities within regions and that working together can produce more prosperity for all RD is expected to provide leadership for this initiative although several other USDA agencies are expected to participate The budget includes $14 million to fund coordination of this initiative under the salaries and expenses account
Business and Industry Guarantee Loan Program The Business and Industry (BampI) loan guarantee program the largest program level of the RBS programs provides protection against loan losses so that lenders are willing to extend credit to establish expand or modernize rural businesses The tightening rural credit markets have brought a renewed interest in the BampI program The 2011 budget supports a program level of over $900 million in BampI loan guarantees almost the same as the 2010 level The 2011 budget also proposes to increase the one-time fee on BampI guaranteed loans from up to 2 percent in 2010 to up to 3 percent in 2011 This increase is needed because increased defaults have raised the subsidy cost of the program The BampI program is expected to provide support for the Regional Innovation and Healthy Food Financing initiatives
The Recovery Act provided $126 million in budget authority that supports $16 billion in program level for BampI guarantees A significant portion of the funding provided by the Recovery Act remains available throughout 2010
Rural Business Enterprise Grant Program The Rural Business Enterprise Grant program provides grants for rural projects that finance and facilitate development of small and emerging rural businesses The 2011 budget provides $39 million for grants the same level as 2010 The program is also expected to support the Regional Innovation and Healthy Food Financing initiatives
Rural Business Opportunity Grant Program The Rural Business Opportunity Grant program promotes sustainable economic development in rural communities with exceptional needs through training and technical assistance for business development entrepreneurs and economic development officials and to assist with economic development planning The 2011 budget provides almost $3 million for grants the same level as 2010
Intermediary Relending Program The Intermediary Relending program provides one percent interest direct loans to entities that relend to rural businesses at a higher interest rate and use their
57
RURAL DEVELOPMENT
interest earnings to pay for their administrative expenses and develop capital reserves The 2011 budget supports a program level of $36 million in direct loans under this program about $2 million more than 2010 The program is also expected to provide support for the Regional Innovation and Healthy Food Financing initiatives
Rural Microentrepreneur Assistance Program Under this new program one percent direct loans and grants are made to microenterprise development organizations (MDOrsquos) The loans will be used to establish reserves for relending to microentrepreneurs and the grants are made to the MDOrsquos which may relend a portion to provide training operational support business planning and market development assistance The 2011 budget includes $8 million in discretionary funding This funding will support $24 million in loans and about $1 million in grants Including the $4 million in mandatory funding the total funding available in 2011 for this program is $30 million in loans and $3 million in grants
Rural Cooperative Development Grant Program The 2011 budget includes $20 million for this program a $6 million increase over 2010 The additional funding will be used to support locally produced distribution systems and the development of new cooperatives Cooperatives assisted by this program serve many small and minority producers
Value-Added Producer Grants The 2011 budget maintains the Value-Added Producer Grants program at the 2010 level of $20 million The program provides grants for a wide range of value-added projects including those that change the physical state of agricultural products or the way such products are marketed Ten percent of the funding is reserved for mid-tier marketing chains
Rural Energy for America Program (Section 9007) RBS has operated a renewable energy loan and grant program for the purchase of renewable energy systems and energy efficiency improvements since the passage of the 2002 Farm Bill Section 9007 of the Farm Bill implemented the Rural Energy for America Program (REAP) REAP provides similar assistance as its predecessor program the Renewable Energy and Energy Efficiency Improvement Program however REAP can now offer funding for energy audits and feasibility studies The Farm Bill provides mandatory funding that will support a program level of $73 million in loans and $36 million in grants for 2011 about $135 million below the 2010 level In addition the 2011 budget supports a discretionary program level of $12 million in loan guarantees and $34 million in grants a reduction of $132 million in program level and an increase of $14 million in grants from the 2010 level
Biorefinery Assistance Program (Section 9003) RBS now has the capability to guarantee loan funds for biorefineries up to $250 million per project Rural Development has approved three loans for biorefineries under a Notice of Funding Availability that was published in November of 2008 and is currently developing permanent regulations for the program The 2008 Farm Bill provided funding in 2008 and 2009 to support over $900 million in loan guarantees and authorizes additional funds for 2009 through 2012 The 2011 budget requests $17 million in discretionary funding to support a program level of $50 million for these facilities With this funding the total available for Section 9003 Program is over $950 million
58
RURAL DEVELOPMENT
All the funding for RD programs is expected to save or create jobs however only the business programs collect data on jobs rather than use a common multiplier to estimate them The table below reflects performance for 2009 and projections for 2010 and 2011 The projections are subject to change
Key Performance Measure 2006 2007 2008 2009 2010 2011 Number of jobs created or saved through USDA financing of businesses 71715 72710 72907 68969 72369 73224
Note Performance includes other RBS loan and grant programs that were not identified in the text
59
RURAL DEVELOPMENT
RURAL UTILITIES SERVICE (RUS)
Program Level (PL) and Budget Authority (BA) (Dollars in Millions)
2009 2010 2011 Program Enacted Estimate Budget
PL BA PL BA PL BA Discretionary Electric Programs Direct Loanshelliphelliphelliphelliphelliphelliphelliphelliphelliphelliphelliphelliphellip $6600 a $7100 0 $4100 0
Telecommunications Programs Direct Loanshelliphelliphelliphelliphelliphelliphelliphelliphelliphelliphelliphelliphellip 690 a 690 0 690 0
Distance Learning and Telemedicine Programs Grantshelliphelliphelliphelliphelliphelliphelliphelliphelliphelliphelliphelliphelliphelliphelliphellip 35 $35 38 $38 30 $30
Broadband Programs Direct Loanshelliphelliphelliphelliphelliphelliphelliphelliphelliphelliphelliphelliphellip 400 16 400 29 400 22 Grantshelliphelliphelliphelliphelliphelliphelliphelliphelliphelliphelliphelliphelliphelliphelliphellip 13 13 18 18 18 18
High Energy Costs Grants helliphelliphelliphelliphelliphelliphelliphellip 18 18 18 18 0 0 Water and Waste Disposal Programs Direct Loanshelliphelliphelliphelliphelliphelliphelliphelliphelliphelliphelliphelliphellip 1095 142 1022 77 1036 89 Guaranteed Loans helliphelliphelliphelliphelliphelliphelliphelliphelliphelliphellip 75 0 75 0 75 0 Grants helliphelliphelliphelliphelliphelliphelliphelliphelliphelliphelliphelliphelliphelliphelliphellip 397 397 474 474 446 446 Subtotal Water and Wastehelliphelliphelliphelliphelliphelliphellip 1567 539 1571 551 1557 535 Subtotal RUS programshelliphelliphelliphelliphelliphelliphelliphellip 9323 621 9835 654 6795 605
Salaries and Expenseshelliphelliphelliphelliphelliphelliphelliphelliphelliphelliphellip 39 39 40 40 38 38
Total Ongoing Discretionary Programshelliphellip 9362 660 9875 694 6833 643
Recovery Act Broadband Programs
Direct Loanhelliphelliphelliphelliphelliphelliphelliphelliphelliphelliphellip 7160 485 0 0 0 0 Grantshelliphelliphelliphelliphelliphelliphelliphelliphelliphelliphelliphelliphelliphellip 1940 1940 0 0 0 0
Water and Waste Programs Direct Loanshelliphelliphelliphelliphelliphelliphelliphelliphelliphelliphellip 2154 273 0 0 0 0 Grantshelliphelliphelliphelliphelliphelliphelliphelliphelliphelliphelliphelliphellip 1106 1106 0 0 0 0
Total Recovery Act Programshelliphelliphelliphelliphelliphellip 12360 3804 0 0 0 0 Total RUS Programshelliphelliphelliphelliphelliphelliphelliphellip $21722 $4464 $9875 $694 $6833 $643
a Less than $05 million
Electric and Telecommunications Programs The Electric and Telecommunications programs administered by RUS provide loans to establish expand and modernize vital components of the infrastructure of rural America They are long-standing programs that brought electric and telecommunication services to rural America and ensured universal service for the Nation While most borrowers have some access to private credit markets the programs help to leverage private sector investments as well as fill credit gaps that still exist for some rural areas and borrowers In addition the programs facilitate the financing of improvements to facilities that
60
RURAL DEVELOPMENT
RUS financed in the past and still holds a lien There are a number of ways USDArsquos electric program can be used to support energy conservation and efficiency projects The 2008 Farm Bill amended the Rural Electrification Act (REA) to make electric program funding available for these purposes Loans can be made to electric cooperatives that in turn offer rebates or provide loans to their customers for energy conservation and efficiency projects There is also a provision in the REA to provide deferments on certain electric loans for these purposes The Rural Economic Development Loan and Grant (REDLG) program that is administered by RBS also provides funding for electric cooperatives that may be used to support energy conservation and efficiency projects
The 2011 budget reflects the Presidentrsquos 2009 G20 commitment to phase out fossil fuels subsidies Consistent with this commitment no loan funds are provided for new construction of base or peak load generation from coal or natural gas Loan funds will be used only for the transmission and distribution of electricity carbon capture projects and the generation of electricity from renewable sources including wind The budget supports $41 billion in loans for these purposes which is expected to be sufficient to meet the demand Loans for nuclear power generation will continue to be handled by the Department of Energy
The performance indicator identifies the number of borrowerssubscribers receiving new andor improved electric service The reduction in performance is directly attributed to the reduction in program level to meet the Presidentrsquos G20 commitment to reduce fossil fuel subsidies This measure includes the improvement of existing facilities as many facilities are improved several times over their estimated useful life which results in a larger number of people being served than actually live in the service territories
Key Performance Measure 2006 2007 2008 2009 2010 2011 Number of borrowerssubscribers receiving new andor improved electric facilities (millions)
82 58 81 98 61 38
The 2011 budget also supports $690 million in telecommunications loans which is the same as 2010 and also expected to be sufficient to meet demand These loans are used for the improvement and construction of telecommunication facilities that meet broadband standards although they are not meant to be used for all broadband purposes
The performance indicator displays performance information for the traditional telecommunications and broadband loan programs Program funding has been maintained at the same level in recent years and performance for the program has remained constant
61
Key Performance Measure 2006 2007 2008 2009 2010 2011
Number of borrowerssubscribers receiving new or improved telecommunication services (millions)
030 036 078 019 035 035
RURAL DEVELOPMENT
BroadbandDistance Learning and Telemedicine The ongoing Broadband program is similar to the Broadband program that is currently active under the Recovery Act The Distance Learning and Telemedicine Grant Program is designed specifically to assist rural communities that would otherwise be without access to learning and medical services over the Internet
The 2011 budget includes $70 million in funding to support $418 million in broadband loans and grants and $30 million in grants under the Distance Learning and Telemedicine program The overall reduction of $78 million in funding from 2010 reflects termination of the grants for analog conversion and the healthcare services grants
Staff resources are currently being fully utilized administering the Broadband program authorized by the Recovery Act which provided $25 billion in budget authority for broadband loans and grants This effort is being coordinated with the Federal Communications Commission and National Telecommunications and Information Administration It is anticipated the Recovery Act funding will be fully utilized in 2010
New regulations to implement the 2008 Farm Bill modifications in the ongoing program are expected to improve the performance of the program by providing better focus on rural areas that lack access to existing providers and by strengthening the financial integrity of the loan making process
High Energy Cost Grants The intent of this program is to provide funding for energy and other rural development purposes in areas that have high energy costs No funding is provided for this program because only a limited number of States can qualify and the purposes of the program can be met through other RD programs
Water and Waste Disposal Program The Water and Waste Disposal Program provides financing for rural communities to establish expand or modernize water treatment and waste disposal facilities These facilities provide safe drinking water and sanitary waste disposal for residential users and help communities thrive by attracting new business Projects are designed for energy efficiency and water conservation
Eligibility is limited to communities of 10000 or less in population that are unable to obtain credit elsewhere In addition financing is available only to those communities with low median household income levels Priority is given to public entities serving areas with less than 5500 population and applying for loans to restore a deteriorating water system or improve enlarge or modify an inadequate waste facility Grants are limited to a maximum of 75 percent of project costs Program regulations stipulate that the grant amount should only be as much as necessary to bring the user rates down to a reasonable level for the area Water and Waste Disposal grant and
62
RURAL DEVELOPMENT
loan funds are usually combined based on the income levels and user costs Grants are also provided for solid waste disposal and technical assistance and training
The 2011 budget provides $535 million in budget authority to support over $1 billion in direct loans $75 million in guaranteed loans and $446 million in grants for a total program level of about $16 billion This level is approximately the same as the 2010 appropriated level
The performance indicator measures the number of borrowerssubscribers receiving new or improved service from water facilities funded by Rural Development The 2008 Farm Bill provided an additional $300 million in funding in 2008 that attributed to the increase in performance In recent years the Water and Waste Disposal Program has received a similar appropriation and program performance has remain consistent with the level of program activity
Key Performance Measure 2006 2007 2008 2009 2010 2011
Number of borrowerssubscribers receiving new or improved service from agency funded water facility (millions)
17 13 44 34 14 14
The Recovery Act provided an additional $13 billion in budget authority sufficient to support $33 billion in loans and grants for reducing the backlog of applications This funding is expected to be fully utilized by the end of 2010
63
RURAL DEVELOPMENT
RURAL HOUSING SERVICE (RHS)
Program Level (PL) and Budget Authority (BA) (Dollars in Millions)
2009 2010 2011 Enacted Estimate Budget
Program PL BA PL BA PL BA Discretionary Single Family Housing
Direct Loans (Sec 502)helliphelliphelliphelliphelliphelliphelliphelliphelliphellip $1121 $75 $1121 $40 $1200 $75 Guaranteed Loans (Sec 502)helliphelliphelliphelliphelliphelliphelliphellip 6232 79 11961 173 12000 b
Multi Family Housing Direct Loans (Sec 515)helliphelliphelliphelliphelliphelliphelliphelliphelliphellip 70 29 70 19 95 32 Guaranteed Loans (Sec 538)helliphelliphelliphelliphelliphelliphelliphellip 129 8 129 1 129 13
Very Low-Income Repair (Sec 504) Direct Loans helliphelliphelliphelliphelliphelliphelliphelliphelliphelliphelliphelliphelliphellip 34 9 34 4 34 6 Grants helliphelliphelliphelliphelliphelliphelliphelliphelliphelliphelliphelliphelliphelliphelliphelliphellip 32 32 32 32 31 31
All Other Direct Loanshelliphelliphelliphelliphelliphelliphelliphelliphelliphelliphellip 21 a 21 a 21 1 Grants and Payments
Rental Assistance (Sec 502 and 521)helliphelliphelliphelliphellip 903 903 980 980 966 966 Mutual and Self-Help (Sec 523)helliphelliphelliphelliphelliphelliphellip 39 39 42 42 37 37 Multi-Family Housing Revitalization helliphelliphelliphelliphellip 32 28 69 43 18 18 All Other Grant and Loan programshelliphelliphelliphelliphellip 10 10 14 14 9 9
Farm Labor Housing Program Direct Loans (Sec 514)helliphelliphelliphelliphelliphelliphelliphelliphelliphellip 22 9 27 10 27 10 Grants (Sec 516)helliphelliphelliphelliphelliphelliphelliphelliphelliphelliphelliphelliphellip 9 9 10 10 10 10
Community Facilities Programs Direct Loanshelliphelliphelliphelliphelliphelliphelliphelliphelliphelliphelliphelliphelliphelliphellip 295 17 295 4 295 4 Guaranteed Loanshelliphelliphelliphelliphelliphelliphelliphelliphelliphelliphelliphellip 206 6 206 7 206 8 Grants helliphelliphelliphelliphelliphelliphelliphelliphelliphelliphelliphelliphelliphelliphelliphelliphellip 41 41 45 45 30 30 Subtotal RHS Programshelliphelliphelliphelliphelliphelliphelliphelliphellip 9196 1294 15056 1424 15108 1250
Salaries and Expenseshelliphelliphelliphelliphelliphelliphelliphelliphelliphelliphelliphellip 460 460 469 469 455 455 Total Ongoing Discretionary Programshelliphelliphellip $9656 $1754 $15525 $1893 $15563 $1705
Recovery Act Single Family Housing
Direct (Sec 502)helliphelliphelliphelliphelliphelliphelliphelliphelliphellip 1563 65 0 0 0 0 Guaranteed Loans (Sec 502)helliphelliphelliphelliphelliphellip10111 129 0 0 0 0
Community Facility Programs Directhelliphelliphelliphelliphelliphelliphelliphelliphelliphelliphelliphelliphelliphellip 1136 24 0 0 0 0 Grantshelliphelliphelliphelliphelliphelliphelliphelliphelliphelliphelliphelliphelliphelliphellip 102 102 0 0 0 0
Total Recovery Act Programshelliphelliphelliphelliphelliphelliphelliphelliphellip12912 320 0 0 0 0 Total Discretionary Programshelliphelliphelliphelliphelliphelliphelliphelliphellip$22568 $2074 $15525 $1893 $15563 $1705
a Less than $05 million b The budget proposes a new fee structure similar to HUD with no cost to the government
64
RURAL DEVELOPMENT
Single Family Direct and Guaranteed Loan Programs The Single Family Housing program provides direct and guaranteed loans to low and moderate income families in rural areas RHS is the only Federal agency that provides direct loans for this purpose Direct loans are limited to families with incomes less than 80 percent of area median income The interest rate on these loans may be subsidized down to one percent interest Guaranteed loans are limited to families with incomes less than 115 percent of area median income The interest rate on these loans is negotiated between the borrower and the private lender Currently there is a one-time guarantee fee of 2 percent for new loans and 05 percent on loans for refinancing This guarantee fee can be financed as part of the loan amount so that it does not impose an up-front cost that some borrowers may not be able to pay
The 2011 budget provides for a $12 billion program level for direct loans about $79 million above 2010 and maintains the 2010 appropriated level of $12 billion for guaranteed loans These levels are expected to provide about 98993 homeownership opportunities a decrease from 2010 which reflects anticipated higher housing prices due to the improved economic conditions
The performance measure below displays the number of homeownership opportunities that Rural Development has provided during the fiscal year In the past these programs have received additional funding through supplemental appropriations for disaster relief efforts that affected the performance information The 2010 appropriation nearly doubled the amount of program funds that were typically provided in recent years While the appropriation for 2011 is maintained at the 2010 level the small reduction in performance can be attributed to anticipated higher housing prices due to the improved economic conditions as indicated above
Key Performance Measure 2006 2007 2008 2009 2010 2011 Homeownership opportunities provided 42172 43532 66574 55957 106030 98993
While the single family housing programs have experienced modest increases in defaults due to the current economic crisis the programs did not make or guarantee sub-prime loans during the years that led up to the crisis and remain financially sound Moreover the demand for these programs has increased as demonstrated by the rapid utilization of Recovery Act funding Accordingly USDA is proposing that the guaranteed loan program be adapted to reflect the high demand for this program by charging an annual fee in addition to the guarantee fee This annual fee at an estimated rate of 015 percent in 2011 would be distributed over the year in monthly payments This change in policy is consistent with that of HUD and the VA
The Recovery Act provided an additional $65 million in budget authority for direct loans sufficient to support about $16 billion in loans and $129 million in budget authority sufficient to support over $10 billion in guaranteed loans Recovery Act funding for both the direct and guaranteed loan programs is expected to provide more than 90000 homeownership opportunities Most of this funding was used in 2009
Multi-Family Housing Programs The Multi-Family Housing program provides financing for rental housing projects and rental assistance payments for low-income tenants of those projects
65
RURAL DEVELOPMENT
The portfolio of previously financed projects currently includes about 17000 projects that provide housing for about 460000 low-income tenants many of whom are elderly The average annual income of tenants is about $8000
In recent years USDA has focused on the revitalization of existing projects As part of this effort the outstanding debt on these projects was deferred and other incentives offered to sponsors in exchange for a commitment to seek private sector financing to revitalize their projects and remain in the program The 2011 budget reflects a change in policy toward new construction Accordingly the 2011 budget includes additional budget authority to increase the program level for Section 515 direct loans for multi-family housing from $70 million in 2010 to over $95 million in 2011 which is expected to be used for both new construction and rehabilitation of the existing portfolio The 2011 budget proposes to terminate funding for the revitalization demonstration program Section 538 guaranteed loans would be maintained at $129 million with additional budget authority being provided to accommodate an increase in subsidy costs The policy of no interest subsidy and charging no fees on guaranteed loans would be maintained
The multi-family housing voucher program would be continued at a level of $18 million This program provides one-year vouchers to protect the rents of tenants affected by projects leaving the program
Most multi-family housing projects that are financed with direct loans also receive Rental Assistance Payments The payments are used to reduce the rents of low income families to no more than 30 percent of their income These payments are made through contracts with project sponsors Providing funding for the renewal of expiring rental assistance payment contracts is essential to RHSrsquo efforts to protect the Governmentrsquos investment and ensure the projects are revitalized and remain in the program The 2011 budget includes $966 million to renew about 212000 expiring contracts and provide new contracts on both Section 515 and Farm Labor Housing The modest decrease in funding is due to improvements in the way the need for renewing expiring contracts is estimated
Other Housing Programs Rural Development offers a full array of supplemental housing programs such as Very-low Income Repair loans and grants Rural Housing Preservation Farm Labor Housing loans and grants and Self-Help Housing These programs are maintained at approximately the same program levels as in 2010
Community Facilities Loan and Grant Programs RHS also administers a Community Facilities program that provides funding for a wide range of essential Community Facilities Priority is given to health and public safety facilities The program serves rural communities of up to 20000 in population
The 2011 budget provides funding for $295 million in direct loans $206 million in loan guarantees and $30 million in grants all under the basic Community Facilities program The loan levels are the same as for 2010 while the grant level is $15 million lower due to the elimination of three small special interest community facilities programs namely Rural Community Development Initiative grants Tribal College grants and Economic Impact
66
RURAL DEVELOPMENT
Initiative grants Other RD programs are available to provide assistance similar to that offered by these programs
The performance measure below measures the percent of rural residents who are provided with improved essential community services such as health and safety facilities Program funding and performance is relatively consistent from year to year with the exception of 2007 The increase in performance resulted from a Presidential Initiative from the prior Administration to enable rural health facilities to upgrade record keeping systems to electronic medical records
Key Performance Measure 2006 2007 2008 2009 2010 2011 Percentage of customers who are provided access to new andor improved essential community facilities ndash Health Facilities 38 72 48 54 50 50
Safety Facilities 38 62 57 50 54 54
67
RURAL DEVELOPMENT
RURAL DEVELOPMENT SALARIES AND EXPENSES
Budget Authority (Dollars in Millions)
2009 2010 2011 Program Enacted Estimate Budget
Salaries and Expenses Appropriationhelliphelliphelliphelliphelliphelliphelliphelliphelliphelliphelliphelliphelliphelliphellip $193 $202 $232 Transfers Rural Electric and Telecomm Loan Programhelliphellip (39) (40) (38) Rural Housing Insurance Fund Programhelliphelliphelliphellip (460) (468) (455) Rural Development Loan Fund Programhelliphelliphelliphellip (5) (5) (5) Subtotal Transfershelliphelliphelliphelliphelliphelliphelliphelliphelliphelliphellip (504) (513) (498) Subtotal Salaries and Expenseshelliphelliphelliphelliphelliphelliphellip 697 715 730 Recovery Acthelliphelliphelliphelliphelliphelliphelliphelliphelliphelliphelliphelliphelliphelliphellip 131 0 0 Total Salaries and Expenseshelliphelliphelliphelliphelliphelliphelliphelliphelliphellip $828 $715 $730
The 2011 budget provides a total of $730 million for salaries and expenses related to carrying out RD programs This level includes an increase of $72 million for pay cost $12 million for refresh of the Common Computing Environment (CCE) and $14 million to support the development of the Regional Innovation Initiative
The 2011 budget includes $12 million for the RD portion of a Departmental effort to modernize and upgrade the IT infrastructure (also known as the Common Computing Environment (CCE)) for the Service Center Agencies (SCAs) This funding will be used to replace outdated components of the CCE many of which have exceeded their expected life cycles to reduce system vulnerabilities to failure and improve the performance and effectiveness of the shared infrastructure These improvements will allow the SCAs to better serve program participants with a more flexible and reliable IT infrastructure This funding will allow for the first system-wide refresh of the CCE since the infrastructure was implemented in 2000 In addition as the components of the CCE are replaced USDA will implement a right-sizing process whereby configuration changes will be made to better support the delivery of current and future programs As part of this process the Department will strive to improve system security reduce the long term cost of infrastructure services and improve service reliability
68
FOOD NUTRITION AND CONSUMER SERVICES
MISSION AND RELATIONSHIP TO STRATEGIC GOAL
A plentiful supply of safe and nutritious food is essential to the well-being of every family and the healthy development of every child in America Although most American households have access at all times to enough nutritious food for an active and healthy lifestyle too many households especially households with children do not have sufficient resources to ensure this access especially under the current economic conditions A recent report by the Department showed that in over 500000 families with children in 2008 one or more children simply do not get enough to eat Meaning they had to cut the size of their meals skip meals or even go whole days without food at some time during the year Too many children also have poor diets and gain excessive weight Recent data shows that the prevalence of obesity has increased over 10 percent to 17 percent for children between 6 and 19 years of age
The activities and funding of Food Nutrition and Consumer Services including the Food and Nutrition Service (FNS) and the Center for Nutrition Policy and Promotion (CNPP) support USDA Strategic Goal to ensure that all of Americarsquos children have access to safe nutritious and balanced meals FNS contributes significantly to two activities under this strategic goal including (1) increasing access to nutritious food and (2) promoting healthy diet and physical activity behaviors FNS also works to ensure that food is safe most notably for meals served through the Child Nutrition Programs and the agency is committed to increasing performance efficiency and alignment of USDA programs
The mission of FNS is to increase food security and reduce hunger in partnership with cooperating organizations by providing children and low-income people access to food a healthful diet and nutrition education in a manner that supports American agriculture and inspires public confidence The mission of CNPP is to improve the health of Americans by developing and promoting dietary guidance that links the best evidence-base scientific research to the nutrition needs of consumers In addition to providing access to nutritious food FNS also works to empower program participants with knowledge of the link between diet and health FNS administers the Departmentrsquos domestic nutrition assistance programs The Federal staff leverage their efforts by working with State and local partners to deliver nutrition assistance through the Supplemental Nutrition Assistance Program (formerly the Food Stamp Program) the Child Nutrition Programs ndash National School Lunch Program National School Breakfast Program and the Child and Adult Care Food Program and the Special Supplemental Nutrition Program for Women Infants and Children (WIC) and other programs serving specialized needs The Supplemental Nutrition Assistance Program provides basic assistance to help ensure low-income households have access to a secure and adequate diet The other programs target specific groups of people with specialized needs or in special settings Key performance measures for 2011 are to decrease the number of households with very low food security among children increase the percentage of eligible people participating in the Supplemental Nutrition Assistance Program increase the percentage of school children participating in the National School Lunch Program decrease the prevalence of obesity among children and adolescents improve Healthy Eating Index (HEI) scores for people in low-income households (under 130 percent of poverty level) and for the general population and increase the amount of Supplemental Nutrition Assistance Program benefits redeemed at farmers markets
69
FOOD NUTRITION AND CONSUMER SERVICES
FNS Budget Authority 900
800
700
600
500
400
300
200
100
00
WIC CNP SNAP ARRA FY 2009 FY 2010 FY 2011
ARRA amounts of less than $1 billion are not included
The 2011 budget provides funds for anticipated changes in participation and food cost inflation for the major programs It emphasizes improving access and operations in 2011 and improving the nutritional status of recipients Both FNS and the Center for Nutrition Policy and Promotion will continue efforts to promote healthy eating and active lifestyle behaviors in part by the continued use and promotion of MyPyramidgov and the Dietary Guidelines for Americans Additionally in 2011 USDA will coordinate with the Departments of Health and Human Services and Education to implement revise and refine plans and strategies for addressing the problem of childhood obesity
$Bill
ions
69 73 76 15 17 19
54 58 68
52 105
119
70
FOOD NUTRITION AND CONSUMER SERVICES
Food and Nutrition Service Budget Authority
(Dollars in Millions) 2009 2010 2011
Program Enacted Estimate Budget Discretionary Special Supplemental Nutrition Program (WIC) helliphelliphelliphelliphelliphelliphelliphelliphelliphelliphelliphellip $6860 $7257 $7603 Commodity Assistance Program Commodity Supplemental Food Programhelliphelliphelliphelliphelliphelliphelliphelliphelliphelliphelliphelliphelliphellip 160 171 177 The Emergency Food Assistance Program (TEFAP)
Soup Kitchens Food Bankshelliphelliphelliphelliphelliphelliphelliphelliphelliphelliphelliphelliphelliphelliphelliphelliphelliphelliphelliphellip 50 50 50 Infrastructure Grantshelliphelliphelliphelliphelliphelliphelliphelliphelliphelliphelliphelliphelliphelliphelliphelliphelliphelliphelliphelliphelliphellip 0 6 0
Farmers Market Nutrition Programhelliphelliphelliphelliphelliphelliphelliphelliphelliphelliphelliphelliphelliphelliphelliphelliphellip 20 20 20 Pacific Island Assistance and Disaster Assistancehelliphelliphelliphelliphelliphelliphelliphelliphelliphelliphellip 1 1 1 IT Modernization and Supporthelliphelliphelliphelliphelliphelliphelliphelliphelliphelliphelliphelliphelliphelliphelliphelliphelliphelliphellip 0 0 2 Nutrition Services Incentive Program ahelliphelliphelliphelliphelliphelliphelliphelliphelliphelliphelliphelliphelliphelliphellip 3 3 0
Total Commodity Assistance Programhelliphelliphelliphelliphelliphelliphelliphelliphelliphelliphelliphelliphelliphellip 234 251 250 Nutrition Programs Administrationhelliphelliphelliphelliphelliphelliphelliphelliphelliphelliphelliphelliphelliphelliphelliphelliphelliphellip 145 151 172
Total Ongoing Discretionary Programshelliphelliphelliphelliphelliphelliphelliphelliphelliphelliphelliphelliphelliphellip 7239 7659 8025 Recovery Act WIC Programhelliphelliphelliphelliphelliphelliphelliphelliphelliphelliphelliphelliphelliphelliphelliphelliphelliphelliphelliphelliphelliphelliphelliphelliphelliphellip 500 0 0 Commodity Assistance Programhelliphelliphelliphelliphelliphelliphelliphelliphelliphelliphelliphelliphelliphelliphelliphelliphelliphellip 150 0 0 Child Nutrition Programshelliphelliphelliphelliphelliphelliphelliphelliphelliphelliphelliphelliphelliphelliphelliphelliphelliphelliphelliphelliphellip 100 0 0
Total Recovery Acthelliphelliphelliphelliphelliphelliphelliphelliphelliphelliphelliphelliphelliphelliphelliphelliphelliphelliphelliphelliphelliphellip 750 0 0 Total Discretionary Programshelliphelliphelliphelliphelliphelliphelliphelliphelliphelliphelliphelliphelliphelliphelliphelliphelliphellip 7989 7659 8025
Mandatory Supplemental Nutrition Assistance Program (SNAP)helliphelliphelliphelliphelliphelliphelliphelliphelliphelliphellip 53970 58269 68207 Proposed Legislation bhelliphelliphelliphelliphelliphelliphelliphelliphelliphelliphelliphelliphelliphelliphelliphelliphelliphelliphelliphelliphelliphellip 0 11 36 Child Nutrition Programshelliphelliphelliphelliphelliphelliphelliphelliphelliphelliphelliphelliphelliphelliphelliphelliphelliphelliphelliphelliphelliphellip 15074 17034 18392 Reauthorization Proposalshelliphelliphelliphelliphelliphelliphelliphelliphelliphelliphelliphelliphelliphelliphelliphelliphelliphelliphelliphelliphellip 0 0 1000 Farm Bill Seniors Farmers Market Nutrition Program chelliphelliphelliphelliphelliphelliphelliphelliphelliphelliphelliphelliphellip 21 21 21 Recovery Act Supplemental Nutrition Assistance Programhelliphelliphelliphelliphelliphelliphelliphelliphelliphelliphelliphelliphelliphellip 5195 10460 11936 Supplemental SNAP State Administrative Expenseshelliphelliphelliphelliphelliphelliphelliphelliphelliphelliphelliphelliphelliphelliphelliphellip 0 400 0
Total Mandatory Programshelliphelliphelliphelliphelliphelliphelliphelliphelliphelliphelliphelliphelliphelliphelliphelliphelliphelliphellip 74260 86195 99592 Total FNShelliphelliphelliphelliphelliphelliphelliphelliphelliphelliphelliphelliphelliphelliphelliphelliphelliphelliphelliphelliphelliphelliphelliphelliphellip $82249 $93854 $107617
a Funds are transferred from the Department of Health and Human Services Administration on Aging b The budget also proposes to increase the asset limit to $10000 in SNAP but does not increase budget authority The funding is provided through a government-wide initiative c Funds are transferred from the Commodity Credit Corporation
71
FOOD NUTRITION AND CONSUMER SERVICES
The nutrition assistance programs work in concert to improve scores on cross-cutting performance measures of improved diet for the children and low-income people they serve
Key Performance Measure 2006 2007 2008 2009 2010 2011 Application and usage level of nutrition guidance tools (billions of pieces of nutrition guidance distributed) 15 26 32 35 30 39 Baseline 2006 = 15
People Served Through Nutrition Assistance Programs
433
WIC SNAP School Lunch
FY 2009 FY 2010 FY 2011
Supplemental Nutrition Assistance Program (SNAP) The 2011 budget anticipates an increase in participation on average of about 28 million recipients per month between 2010 and 2011 Since the Recovery Act increased the maximum allotment by 136 percent effective April 2009 and provided that the benefit remain constant until the statutory COLA for SNAP benefits exceeds that level the average benefit level in 2011 is expected to be about the same as it was in 2010 (and for several years afterwards) Increases in projected funding requirements thus reflect the anticipated increase in program participation and associated State administrative expenses
The Administration is working to establish a practical national asset limit floor across means-tested human services food and cash assistance programs Legislative language will be provided to raise current SNAP asset limits to $10000 from $2000 per household or $3000 for households including an elderly or disabled member This nationwide figure will streamline eligibility for families eligible for benefits from multiple programs and encourage families to
91
337 312
95
405
321
101
326
0
5
10
15
20
25
30
35
40
45
Peop
le S
erve
d (M
illio
ns)
72
FOOD NUTRITION AND CONSUMER SERVICES
save toward self-sufficiency In addition FNS will be proposing legislative language to provide for the exclusion of tax refunds in the month of receipt and for the following 12 months beginning in tax year 2009 for SNAP and all Federally funded means-tested programs Legislation is also being proposed to extend the Recovery Act provision that eliminates the time limits for able-bodied adults without dependents for an additional year for an one-time cost of $25 million
SNAP will continue to focus on encouraging all eligible persons to take advantage of program benefits with particular emphasis on reaching underserved populations such as the elderly Hispanics and the working poor For 2011 $6 million is included to expand the Healthy Incentives Pilot now under development which will demonstrate and evaluate the effect of financial incentives to purchase fruits and vegetables on the diets of SNAP participants Additionally $125 million is requested to test the impact of a community-wide approach that will use multiple means of communication and influence to raise the general awareness of healthy eating in a community shift social norms create more opportunities to make healthy food choices and reward such choices when made
To assist direct-to-consumer food sales $4 million is included to provide point of sale terminals to all farmersrsquo markets nationally that cannot currently redeem SNAP benefits Ensuring farmersrsquo markets have point of sales devices will substantially increase the redemption of SNAP benefits at these outlets Nutrition education continues to be a key part of the SNAP to help low-income households improve their nutrition levels
Key Performance Measure 2006 2007 2008 2009 2010 2011 Participation levels for the major Federal nutrition assistance programs (millions per month) Supplemental Nutrition Assistance Program 257 265 284 337 405 433
The Department is continuing its efforts to improve payment accuracy seeking to reach a payment accuracy rate of 95 percent in 2011 This will be achieved through working with stakeholders to implement best practices focusing particularly on error prone areas
Key Performance Measure 2006 2007 2008 2009 2010 2011 Improve SNAP payment accuracy rate Baseline 2001 = 913 942 944 950 950 950 950
The Administration is committed to ensuring an uninterrupted flow of benefits to program participants Since SNAP participation and costs are not fully predictable and can grow rapidly in a changing economic environment or in unexpected emergencies such as natural disasters the 2011 budget includes a $5 billion contingency reserve an increase of $2 billion over recent
73
FOOD NUTRITION AND CONSUMER SERVICES
years to be used in the event that program needs exceed current estimates The budget also proposes indefinite funding authority which would make additional funds available in the last four months of the fiscal year if program needs exceed the anticipated level
Child Nutrition Programs Ensuring access to food for children and improving their eating habits continues to be a priority The National School Lunch School Breakfast Summer Food Service Special Milk and Child and Adult Care Food Programs play a significant role in achieving this goal by assisting State and local governments in serving healthful nutritious meals and snacks to children in various settings with greatest emphasis on helping low-income children These programs assist children by subsidizing quality meals in participating schools and child care settings While children from all income levels receive some assistance from these programs most of the funding supports meals served to low-income children for free or at a greatly reduced price Child Nutrition Programs subsidies for meals at child care centers and family daycare homes help support child care a critical need for working families
To ensure the quality of the meals served in the school meals programs and the Child and Adult Care Food Program the Department entered into a three-year contract with the National Academiesrsquo Institute of Medicine (IOM) in February 2008 to convene a panel of experts to make recommendations for updating and revising the nutrition standards and meal requirements IOMrsquos recommendations released in October 2009 will be used to develop a regulatory proposal to make changes that will ensure that school meals do all they can to meet childrenrsquos nutritional needs foster healthy eating habits and safeguard childrenrsquos health Similarly schools that achieve recognition as HealthierUS Schools Challenge Schools achieve a high level of performance for school meal quality nutrition education and physical activity
The Administration is currently focused on the reauthorization of the Child Nutrition and WIC Programs programs which at some point in their lives touch most Americans - providing nutritious food nutrition education and connections to critical health services The Administration is proposing to add $1 billion in 2011 and a total of $10 billion over the next ten years for this priority Reauthorization reforms are a key strategy in the effort to eliminate childhood hunger by 2015 USDA will provide resources aimed at improving access to nutritious meals establishing high standards for the nutritional quality of food available in school exploring new strategies for reducing hunger and improving childrenrsquos food choices particularly for low-income children improve access to healthy fruits and vegetables reducing the prevalence of obesity by improving the diets of school children by teaching them to make wise food choices and improve program performance and integrity
For 2011 the Child Nutrition Programs are funded at a level that will support anticipated participation and food costs An increase of $2 million is sought for a Farm to School Tactical Team including both FNS and AMS staff that will support local and regional food systems by facilitating linkages between schools and their local food producers An increase of $8 million is included to measure erroneous payments in school meal programs to determine the progress made reducing erroneous payments Also $8 million is sought for a study of school lunch and breakfast meal costs This study is conducted every few years to ensure that decisions on reimbursement levels are informed by up-to-date high-quality information on the cost of producing meals and the sources and levels of revenues to cover those costs
74
FOOD NUTRITION AND CONSUMER SERVICES
The $5 million in annual funding for Hunger-Free Communities under Section 4405 of the Farm Bill will continue in 2011 Grants will focus on promotion outreach demonstration projects and technical assistance to support communities in exploring a significantly broader array of local strategies to prevent hunger primarily among children Further $700000 included in 2010 to expand the HealthierUS School Challenge will be continued in FY 2011 so work to encourage schools to take a leadership role in helping students learn to make healthier eating and lifestyle choices will continue Existing funds will also continue to help ensure the integrity of meals served increased training and technical assistance materials for the school food service community and increased Federal oversight of meals served
Key Performance Measure 2006 2007 2008 2009 2010 2011 Participation levels for the major Federal nutrition assistance programs (millions per day) National School Lunch Program 301 305 309 312 321 326 School Breakfast Program 81 83 87 110 117 122
WIC The WIC Program USDArsquos largest discretionary program helps improve the health and nutritional intake of low-income pregnant breast-feeding and postpartum women infants and children up to their fifth birthday WIC works by providing participants with vouchers redeemable for foods dense in nutrients known to be lacking in the diets of eligible groups and providing nutrition education and referrals to other important health and social services Nearly half of those born in the United States receive WIC benefits
The Presidentrsquos 2011 budget request proposes $76 billion for the WIC Program an increase of approximately $350 million above the 2010 level (excluding the Recovery Act funding) which will be augmented by larger than usual carryover balance from 2010 The Administration is committed to serving all eligible individuals seeking WIC benefits and expects the request to support a monthly average of 101 million participants Included in the request is an increase for breastfeeding promotion from $80 million to $83 million plus a doubling of funding for breastfeeding performance bonuses for States to $10 million Also $15 million for program evaluation and $60 million allocated specifically to help States improve their management information systems are continued in 2011 Further $10 million is provided to continue support for IT oversight and infrastructure and $5 million is provided to improve the application process and coordination with other programs The Recovery Act provided $500 million in additional funding for WIC $100 million for management information systems and $400 million in a contingency reserve to fund unanticipated participation costs available until the end of 2010
FNS is working with States to ensure effective implementation of the new WIC food packages as required in 2010 and will work to continue to improve overall nutritional intakes consistent with the 2010 Dietary Guidelines for Americans and increase breastfeeding rates Additionally resources are provided to increase the value of the fruit and vegetable voucher for children by $2 per family per month totaling $104 million annually Finally the budget provides for a
75
FOOD NUTRITION AND CONSUMER SERVICES
$250 million contingency fund to ensure sufficient resources for stable services should participation or food costs be higher than anticipated
Key Performance Measure 2006 2007 2008 2009 2010 2011 Participation levels for the major Federal nutrition assistance programs (millions per month) WIC Program (average) 81 83 87 91 95 101
Commodity Assistance Program (CAP) CAP distributes USDA commodities through several programs The Emergency Food Assistance Program (TEFAP) provides support to a network of food banks and other programs that assist households in need of immediate short-term food assistance TEFAP includes components of both discretionary and mandatory funding In addition the Recovery Act provided $150 million for TEFAP to increase food assistance to Americans in the economic crisis These funds were used to purchase additional commodities ($100 million) and to fund administrative costs associated with the distribution of the USDA commodities or privately-donated foods In 2011 for State and local program administration $50 million in discretionary funding is requested any part of which at State discretion may be used to purchase additional commodities Also note that under the Supplemental Nutrition Assistance Program account mandatory funding of $2465 million is provided to purchase TEFAP commodities
CAP includes funding for the Commodity Supplemental Food Program (CSFP) CSFP provides commodities to low-income elderly and pregnant postpartum and breastfeeding women infants and children up to age six The 2011 budget proposes $1768 million an increase of $54 million to offset expected cost increases due to inflation while supporting the current participation levels
In 2011 funding is requested for the Farmersrsquo Market Nutrition Program (FMNP) for women infants and children at the authorized level $20 million The FMNP provides WIC participants with vouchers to purchase fresh local fruits vegetables and herbs directly from farmers farmersrsquo markets and roadside stands In 2008 the FMNP provided coupons to 23 million WIC participants The participants redeemed their coupons at 5765 authorized farmers markets and roadside stands providing revenue to 16016 small family farmers The Seniors FMNP funded by CCC provided similar benefits to over 900000 low-income seniors In 2008 the Seniors FMNP involved over 15062 farmers at 5588 farmersrsquo markets roadside stands and community supported agriculture programs
Nutrition Programs Administration (NPA) Funding of $1721 million is requested for NPA to support Federal management and oversight of USDArsquos investment in nutrition assistance programs The budget includes an increase $52 million to enhance the Federal investment in program administration grantee oversight and protection of the integrity of program operations Participation in SNAP has gone from 172 million recipients per month in 2000 to 337 million participants a month and participation in WIC has grown from 72 million participants a month in 2000 to 91 million participants In addition FNS staff totals 1387 in 2010 to manage a
76
FOOD NUTRITION AND CONSUMER SERVICES
budget over $100 billion well below the 1800 on board in 2000 when the FNS budget was $326 billion
The request includes $9 million to increase efforts to implement scientific evidence-based nutrition guidance and guide effective nutrition education interventions in schools and communities and build and maintain education tools and systems that Americans can use to adopt behaviors that lead to more healthful eating and active lifestyles The 2010 Dietary Guidelines for Americans will be completed and released in 2010 along with enhancements to MyPyramid including interactive applications To help USDA meet its strategic objective to reduce obesity $7 million of this total will be used by CNPP obesity related nutrition education activities The remaining $2 million is needed to translate the recommendations and policy statements in the 2010 Dietary Guidelines for Americans into information that consumers and program administrators can use The Dietary Guidelines and MyPyramid are used to help establish food benefits for the programs and they are central to nutrition education and promotion programs government wide as well as private sector nutrition education and promotion
In addition to enhancing staff resources FNS seeks an additional $55 million to update and integrate its outdated financial management system to control over $100 billion in program funding and to ensure its internal computer infrastructure is operating with current hardware and software less vulnerable to cyber attacks Of this amount $35 million is needed to develop common business processes and financial management systems consistent with USDArsquos Financial Management Modernization Initiatives The $2 million will help expand use of IT tools to improve benefit delivery to program participants to streamline program administration for State and local program partners to improve nutrition education and to enhance program integrity The budget also includes $3 million to fund the Bill Emerson and Mickey Leland Hunger Fellowship programs USDA is directly requesting funds for these activities consistent with the provisions of the 2008 Farm Bill which established the Fellows programs within the Department to address hunger and poverty in the United States as well as international hunger and other humanitarian needs
USDArsquos ability to simplify and improve the programs increase program efforts to improve nutritional outcomes encourage healthy and nutritious diets and expand an obesity prevention campaign is fostered by the Federal administrative efforts supported by Nutrition Program Administration funds
77
FOOD NUTRITION AND CONSUMER SERVICES
Food and Nutrition Service Key Indicators
2009 2010 2011 Actual Estimate Budget
Average Participation Millions Supplemental Nutrition Assistance Program (per month)helliphellip 337 405 433 Free School Lunchhelliphelliphelliphelliphelliphelliphelliphelliphelliphelliphelliphelliphelliphelliphelliphelliphellip 162 184 190 Total School Lunch (per day)helliphelliphelliphelliphelliphelliphelliphelliphelliphelliphelliphelliphellip 312 321 326 Free School Breakfasthelliphelliphelliphelliphelliphelliphelliphelliphelliphelliphelliphelliphelliphelliphelliphellip 79 87 93 Total School Breakfast (per day)helliphelliphelliphelliphelliphelliphelliphelliphelliphelliphellip 110 117 122 WIC (per month)helliphelliphelliphelliphelliphelliphelliphelliphelliphelliphelliphelliphelliphelliphelliphelliphelliphellip 91 95 101 Commodity Supplemental Food Program (CSFP) WIC (per month)helliphelliphelliphelliphelliphelliphelliphelliphelliphelliphelliphelliphelliphelliphelliphelliphellip 002 002 002 Elderly (per month)helliphelliphelliphelliphelliphelliphelliphelliphelliphelliphelliphelliphelliphelliphelliphellip 044 056 058 Food Distribution Program on Indian Reservations (FDPIR) (per month)helliphelliphelliphelliphelliphelliphelliphelliphelliphellip 010 010 010 Unemployment Rate (percent)helliphelliphelliphelliphelliphelliphelliphelliphelliphelliphelliphellip 84 101 95 AveragePersonMonth Food Benefit in $ Supplemental Nutrition Assistance Programhelliphelliphelliphelliphelliphelliphellip $12445 $13293 $13276 WIChelliphelliphelliphelliphelliphelliphelliphelliphelliphelliphelliphelliphelliphelliphelliphelliphelliphelliphelliphelliphelliphelliphellip 4255 4398 4559 CSFP WIC (FNS Funded) ahelliphelliphelliphelliphelliphelliphelliphelliphelliphelliphelliphellip 2655 2800 2775 CSFP Elderly (FNS Funded) ahelliphelliphelliphelliphelliphelliphelliphelliphelliphelliphellip 1877 1947 1918 FDPIR (FNS Funded) ahelliphelliphelliphelliphelliphelliphelliphelliphelliphelliphelliphelliphelliphellip 5454 6042 6090 Per Meal Subsidies Including Commodities in $ b School Lunch Free helliphelliphelliphelliphelliphelliphelliphelliphelliphelliphelliphelliphelliphelliphelliphelliphelliphelliphelliphelliphelliphellip $280 $289 $293 Reduced Price helliphelliphelliphelliphelliphelliphelliphelliphelliphelliphelliphelliphelliphelliphelliphelliphelliphellip 239 248 253 Paid helliphelliphelliphelliphelliphelliphelliphelliphelliphelliphelliphelliphelliphelliphelliphelliphelliphelliphelliphelliphelliphellip 045 045 046 School Breakfast Free helliphelliphelliphelliphelliphelliphelliphelliphelliphelliphelliphelliphelliphelliphelliphelliphelliphelliphelliphelliphelliphellip 166 172 175 Paid helliphelliphelliphelliphelliphelliphelliphelliphelliphelliphelliphelliphelliphelliphelliphelliphelliphelliphelliphelliphelliphellip 025 026 026
a Excludes bonus commodities In 2009 an average of $326 $279 and $285 per month was added in bonus commodities for each participant monthly for CSFPWIC CSFPelderly and FDPIR respectively b Excludes bonus commodities
78
FOOD SAFETY
MISSION AREA AND RELATIONSHIP TO STRATEGIC GOAL
Foodborne illness is recognized as a significant public health problem in the United States which can have a more severe impact on children than healthy adults According to the Centers for Disease Control and Prevention approximately half of the reported foodborne illnesses occur in children These diseases can lead to short and long-term health consequences and sometimes can result in death USDA and other Federal agencies are working in cooperation to ensure that Americans have increased access to safe and healthy food
The Food Safety mission area is the public health mission area of USDA that is responsible for ensuring that the Nationrsquos commercial supply of meat poultry and processed egg products is safe wholesome and properly labeled and packaged This includes products produced domestically in Federally-inspected establishments as well as products imported from foreign countries Funds for the Food Safety mission area support USDA Strategic Goal to ensure that all of Americarsquos children have access to safe nutritious and balanced meals
The mission area includes the activities of the Food Safety and Inspection Service (FSIS) which provides Federal inspection of meat poultry and processed egg products establishments support for similar establishments under State inspection programs development and implementation of the Public Health Information System to enhance science-based data-driven inspections and determination of international equivalence of foreign systems FSIS coordinates the development of its policies with other USDA agencies and other Federal agencies including the Food and Drug Administration (FDA) the Environmental Protection Agency the Centers for Disease Control and Prevention as well as foreign governments and international organizations to ensure an integrated farm-to-table approach to food safety Furthermore the Secretary of Agriculture is the co-chair of the Presidentrsquos Food Safety Working Group (FSWG) created in March 2009 which brings together cabinet secretaries and senior officials to advise the President on issues pertaining to food safety
In addition to FSIS the Food Safety mission area includes the general oversight of the Office of the US Manager of Codex which is the major international mechanism for encouraging fair international trade in food while promoting the health and economic interests of consumers
79
FOOD SAFETY
Budget Authority (Dollars in Millions)
2009 2010 2011 Program Enacted Estimate Budget
Discretionary Federal Food Safety and Inspectionhelliphelliphelliphelliphelliphelliphelliphelliphelliphelliphelliphelliphelliphelliphellip $872 $903 $912 State Food Safety and Inspectionhelliphelliphelliphelliphelliphelliphelliphelliphelliphelliphelliphelliphelliphelliphelliphellip 65 66 65 International Food Safety and Inspectionhelliphelliphelliphelliphelliphelliphelliphelliphelliphelliphelliphellip 18 19 16 Public Health Data Communication Infrastructure Systemhelliphelliphelliphelliphelliphellip 13 27 40 Codex Alimentariushelliphelliphelliphelliphelliphelliphelliphelliphelliphelliphelliphelliphelliphelliphelliphelliphelliphelliphelliphelliphellip 4 4 4
Total Discretionary Programshelliphelliphelliphelliphelliphelliphelliphelliphelliphelliphelliphelliphelliphelliphellip 972 1019 1037
Mandatory Trust Funds (Voluntary Inspection Services)helliphelliphelliphelliphelliphelliphelliphelliphelliphelliphellip 11 9 9 User Fees (OvertimeHoliday Inspection Services)helliphelliphelliphelliphelliphelliphelliphellip (135) (122) (122)
Total FSIS Programshelliphelliphelliphelliphelliphelliphelliphelliphelliphelliphelliphelliphelliphelliphelliphelliphelliphelliphellip $983 $1028 $1046
Organizational Structure To accomplish its functions FSIS employees are located at approximately 6286 slaughtering and processing establishments and import houses and other Federally-regulated facilities Headquarters personnel are responsible for overseeing administration of the program and ensuring that scientific and technological developments are incorporated into inspection procedures The Codex Office reports to the Under Secretary of Food Safety and coordinates all government and non-government participation in the activities of the Codex Alimentarius Commission
Inspection Data Infrastructure and Outbreak Response To ensure that FSIS can support its approximately 8500 Federal in-plant and other frontline personnel the Federal share of State inspection programs and continue to improve the data infrastructure supporting the Nationrsquos food safety system the 2011 budget proposes a discretionary funding level of slightly more than $1 billion an increase of approximately $18 million over 2010 The budget provides the full amount necessary to meet regulatory responsibilities including pay costs and other necessary supporting costs and continues the upward trend in funding over the past decade
80
FOOD SAFETY
FSIS Budget Authority 1200
1000
800
600
400
200
0
Fiscal Year
The 2011 budget requests $40 million an increase of $13 million to continue the deployment and enhancement of the FSIS public-health information infrastructure The additional funds will allow for the purchase of critical equipment the expansion of telecommunications and broadband bandwidth capacity and the improvement of information gathering systems to enhance access of inspection personnel to centralized mission critical systems These new investments are critical to fully leverage the Public Health Information System recently developed by FSIS to enhance the agencyrsquos ability to collect analyze and present data to allow decision making based on relevant timely product and process data utilizing the best science available
In response to key findings of the Presidentrsquos FSWG a $43 million increase is requested for the inter-agency Federal-State Foodborne Disease Outbreak Response Team to allow FSIS to more quickly investigate and respond to outbreaks including faster detection of outbreaks and removal of products from commerce to prevent further illnesses Using these new funds additional staff will be hired to support illness investigation outbreakresponse coordination collaboration on multi-State investigations and proactive public health partner communication outreach In addition these new staff will support a Unified Incident Command System to facilitate communication and decision-making in an emergency a goal of the Presidentrsquos FSWG Taken together this initiative will enhance detection of outbreaks and likely allow for earlier detection of outbreaks which would result in more timely FSIS actions to prevent further illnesses
Similarly in support of key findings of the Presidentrsquos FSWG the 2011 budget proposes a $10 million increase for Baseline Studies and Hazard Analysis and Critical Control Points (HACCP) Verification Program Updates This increase above the 2010 level will allow FSIS to improve surveillance of foodborne pathogens of human-health concern in FSIS-regulated products through significant expansion of the HACCP regulatory sampling and to develop more timely estimates of pathogen prevalence in food products by conducting an additional traditional
$ M
illio
ns
2000 2001 2002 2003 2004 2005 2006 2007 2008 2009 2010 2011
81
FOOD SAFETY
baseline study Accurate timely prevalence estimates for pathogens in food products are critical for evaluation of existing prevention policies and the development of new regulatory strategies FSIS estimates a 25 percent increase in the accuracy of existing performance measures as a result of the proposed increase in HACCP sampling In addition with the ability to conduct a third baseline study in 2011 FSIS will be able to expand its data collection efforts to cover E coli O157H7 in lamb and sheep or Salmonella prevalence in sows and boars
Meat amp Poultry Slaughter Volume Inspected
60
55
50
45
Meat 40
Poultry
35
30
Fiscal Year
Combating Foodborne Illness FSIS is instrumental in helping reduce the level of foodborne illness by targeting common and dangerous pathogens for control In addition to its work ensuring safe and wholesome products are available to the consumer FSIS also conducts public education campaigns to inform consumers about safe food handling methods to decrease the likelihood of foodborne illness from products that were improperly stored handled andor prepared As part of the FSWG FSIS will conduct consumer focus group studies to measure consumer understanding of labeling and other public health messaging and develop new outreach and education strategies based on the results Also as part of the FSWG FSIS will collaborate with FDA to establish a preventative health campaign to increase outreach to clinicians public health professionals and consumers on actions to reduce the risk of foodborne illness
With the funding requested for 2011 FSIS expects to achieve the following performance measures
Bill
ions
of P
ound
s
00 01 02 03 04 05 06 07 08 09
82
Key Performance Measure Overall public exposure to Salmonella from broiler carcasses1
2006
45
2007
73
2008
83
2009
82 in Category
1
2010
90 in Category
1
2011
92 in Category
1
Total illnesses from all FSIS Regulated Products 645609 436343 380259 324175 268092 265411
Percent of establishments with a functional food defense plan2
Large Establishments Small Establishments
Very Small Establishments
NA NA NA
91 53 21
96 64 25
96 64 25
96 69 37
96 74 48
FOOD SAFETY
1The figures represent the proportion of establishments whose two most recent Salmonella test results are equal to or less than 50 percent of the FSIS performance standard for the product class These are the Category 1 establishments considered to have consistent process control As more establishments reach Category 1 status it is expected that fewer people will be exposed to Salmonella from classes of raw products regulated by FSIS
2Food Defense plans are written procedures that food processing establishments should follow to protect the food supply from intentional contamination with chemicals biological agents or other harmful substances Large establishments (ge500 employees) Small establishments (le 499 employees but gt 10) Very Small Establishments (lt10 employees or lt $25 million in annual sales)
FSIS continues to make improvements in its food safety policies and inspection of meat poultry and processed egg products For example FSIS implemented its new bench trim sampling program for E coli O157H7 to detect the pathogen with greater confidence in ground beef FSIS has also developed new pathogen reduction performance standards for control of Salmonella and Campylobacter bacteria in response to recommendations of the Presidents FSWG The goal set by FSIS is to have 90 percent of establishments meeting the new Salmonella standards by the end of calendar year 2010 Similarly FSIS will also post on its Web site compliance guidelines for poultry slaughter establishments including additional pre-harvest recommendations for controlling Salmonella and Campylobacter in poultry To measure the success of these food safety programs FSIS is collaborating with FDA and other FSWG members to develop performance metrics so that all the Federal agencies are consistently measuring success of their food safety programs
The 2008 Farm Bill made several amendments to statutes administered by FSIS and gave the agency other instructions As a result FSIS is developing new regulations to implement mandatory inspection for catfish a program for interstate shipment of State-inspected meat and poultry products requirements that would apply to inspected establishments for recall procedures for documenting process control (HACCP plan) reassessments and for notifying FSIS if they have reason to believe adulterated or misbranded product is in commerce Given the investment to date and the need for considerable stakeholder engagement and regulatory development before the adoption and implementation of a catfish inspection program a decrease
83
FOOD SAFETY
of $103 million from 2010 levels is proposed in the budget for catfish-related activities A level of $5 million for the program is adequate to meet inspection needs in 2011
User Fees and Trust Funds In 2011 FSIS estimates it will collect $131 million through existing user fee and trust fund activities for providing overtime holiday and voluntary inspection services Separately FSIS will submit legislative proposals that would permit two additional user fees in 2011 a user fee that would be collected from plants that have sample failures or require additional inspection activities stemming from a pattern of regulatory non-compliance and a Facility Application and Annual Renewal Activities user fee to cover the increased costs of services above and beyond basic inspection services provided to meat poultry or processed egg products establishments including those services related to compliance risk assessments hazard analyses inspection planning and inspections compliance review and enforcement information technology support product sampling and risk communication Total collections from these proposals are estimated at $4 million and $86 million respectively
84
NATURAL RESOURCES AND ENVIRONMENT
9
Discretionary Programs EQIP
MISSION AND RELATIONSHIP TO STRATEGIC GOALS
A healthy and prosperous America relies on the health of our natural resources and particularly our forests and agricultural working lands The health of Americarsquos 193 million acres of National forests and grasslands and 13 billion acres of farm ranch and private forest lands must be nurtured so that they continue to offer environmental benefits as a source of clean air clean and abundant water and wildlife habitat Americarsquos forests supply communities with clean abundant water shelter wildlife and help us mitigate and adapt to climate change Forests also help generate rural wealth through recreation and tourism through the creation of green jobs and through the production of wood products and energy They are a source of cultural heritage and are a national treasure
The mission of the Natural Resources and Environment area is to promote the conservation and sustainable use of natural resources on the Nations private lands and to sustain production of all the goods and services that the public demands of the national forests The mission area includes two agencies the Natural Resources Conservation Service (NRCS) and the Forest Service (FS)
The two agencies are the primary contributors to achieving the Strategic Goal that ensures our National Forests and private working lands are conserved restored and made more resilient to climate change while enhancing water resources This is accomplished through a variety of programs aimed at preserving and restoring our public and private lands protecting our water resources mitigating the effects of climate change and reducing the risk from catastrophic wildfires NRCS partners with state and local government agencies and private landowners and provides technical and financial assistance to help protect farm and ranch lands and private forestland FS oversees the management of the National Forest System
The NRE mission area primarily through NRCS also has responsibility for implementing most of the Conservation Title of the 2008 Farm Bill which in 2011 will enroll about 305 million acres at a total cost of about more than $3 billion
2011 Conservation Budget Total = $5952 Billion
Wetlands Reserve
All Other Conservation Mandatory
Reserve Programs 33 8
Conservation Stewardship
Programs 14
20 16
85
NATURAL RESOURCES AND ENVIRONMENT
Mill
ions
of A
cres
Farm Bill Conservation Programs Cumulative Acres Enrolled
350
300
250
200
704
267 413
314
564
302
183 23 368
237 346
338
347
75 35
361
204
1104 1312 1483 1652 1772 1897
925
All Other
150 CRP EQIP
100
50
0
2004 2005 2006 2007 2008 2009 2010 2011
86
NATURAL RESOURCES AND ENVIRONMENT
NATURAL RESOURCES CONSERVATION SERVICE (NRCS)
Budget Authority (Dollars in Millions)
2009 2010 2011 Program Enacted Estimate Budget
Discretionary Conservation Operations Conservation Technical Assistancehelliphelliphelliphelliphelliphelliphelliphelliphelliphelliphelliphellip $730 $762 $797 All Other Conservation Operations Programshelliphelliphelliphelliphelliphelliphelliphellip 123 126 127
Total Conservation Operationshelliphelliphelliphelliphelliphelliphelliphelliphelliphelliphelliphelliphellip 853 888 924 Watershed and Flood Prevention Operationshelliphelliphelliphelliphelliphelliphelliphelliphellip 24 30 0 Watershed Rehabilitation Programhelliphelliphelliphelliphelliphelliphelliphelliphelliphelliphelliphelliphellip 40 40 40 Resource Conservation and Developmenthelliphelliphelliphelliphelliphelliphelliphelliphelliphellip 51 51 0 Total Ongoing Discretionary Programshelliphelliphelliphelliphelliphelliphelliphelliphellip 968 1009 964
Recovery Act Watershed and Flood Prevention Operationshelliphelliphelliphelliphelliphelliphelliphelliphellip 290 0 0 Watershed Rehabilitation Programhelliphelliphelliphelliphelliphelliphelliphelliphelliphelliphelliphelliphellip 50 0 0 Total Recovery Act Programshelliphelliphelliphelliphelliphelliphelliphelliphelliphelliphelliphelliphellip 340 0 0 Total Discretionary Programshelliphelliphelliphelliphelliphelliphelliphelliphelliphelliphelliphelliphellip 1308 1009 964
Mandatory Farm Bill Programs Environmental Quality Incentives Programhelliphelliphelliphelliphelliphelliphelliphellip 1067 1180 1208 Wetlands Reserve Programhelliphelliphelliphelliphelliphelliphelliphelliphelliphelliphelliphelliphelliphelliphellip 436 613 502 Conservation Security Programhelliphelliphelliphelliphelliphelliphelliphelliphelliphelliphelliphellip 276 234 212 Conservation Stewardship Programhelliphelliphelliphelliphelliphelliphelliphelliphelliphelliphellip 9 469 629 Agricultural Water Enhancement Programhelliphelliphelliphelliphelliphelliphelliphellip 73 73 74 Farm and Ranch Lands Protection Programhelliphelliphelliphelliphelliphelliphelliphellip 121 150 160 Wildlife Habitat Incentives Programhelliphelliphelliphelliphelliphelliphelliphelliphelliphelliphellip 85 85 73 Grassland Reserve Programhelliphelliphelliphelliphelliphelliphelliphelliphelliphelliphelliphelliphelliphellip 48 101 79 Healthy Forest Reserve Programhelliphelliphelliphelliphelliphelliphelliphelliphelliphelliphelliphelliphellip 10 10 10 Chesapeake Bay Watershedhelliphelliphelliphelliphelliphelliphelliphelliphelliphelliphelliphelliphelliphelliphellip 23 43 72 Agricultural Management Assistance ahelliphelliphelliphelliphelliphelliphelliphelliphellip 15 15 10 Conservation Reserve Program Tech Assist (Reimb)helliphelliphelliphellip (56) (83) (124)
Total Farm Bill Programshelliphelliphelliphelliphelliphelliphelliphelliphelliphelliphelliphelliphelliphellip 2163 2973 3029
Total NRCS Programshelliphelliphelliphelliphelliphelliphelliphelliphelliphelliphelliphelliphelliphelliphelliphelliphellip $3471 $3982 $3993
a Total AMA program also includes funds provided to RMA and AMS
87
NATURAL RESOURCES AND ENVIRONMENT
The Presidentrsquos 2011 budget for NRCS strategically targets funding to high priority areas and effectively supports land conservation wildlife habitat improvement and wetland protection Funding is provided for conservation programs that focus on addressing the needs of priority landscapes in the most need of protection emphasize partnering with local constituents to efficiently implement programs and initiatives and contribute to efforts that address energy conservation renewable energy production and greenhouse gas emissions NRCS will continue to direct financial and technical assistance programs to land owners and users through the USDA Service Centers and through local conservation districts
Conservation Operations (CO) The 2011 budget proposes $924 million for CO which includes $797 million for conservation technical assistance (CTA) as well as $127 million for other CO activities including the Grazing Lands Conservation Initiative Soil Surveys Snow Surveys and Plant Materials Centers At this level the agency will continue to support locally-led cooperative conservation through the unique partnership that has been developed over the years with each conservation district and local stakeholders
The 2011 request for CTA includes an increase of $35 million over 2010 and a redirection of $374 million in Congressional earmarks This will enable NRCS to focus on the highest priority program areas such as improving and streamlining technical assistance delivery to farmers implementing Strategic Watershed Action Teams (SWAT) to target high priority watersheds in the most need of protection and updating the IT infrastructure or Common Computing Environment (CCE) Through CTA the budget projects that nearly 1300 comprehensive nutrient management plans will be applied 77 million will have conservation applied to improve soil quality and 146 million acres of grazing land and forest land will be protected as the result of conservation efforts The estimates reflect the initiative to focus activities on high priority watershed that provide the greatest environmental benefit
Key Performance Measure 2006 2007 2008 2009 2010 2011 CTA Comprehensive nutrient management plans applied (number of plans)
2269 1911 1745 1485 1300 1300
CTA Cropland with conservation applied to improve soil quality (millions of acres)
64 73 83 76 75 77
CTA Grazing land and forest land with conservation applied to protect and improve the resource base (millions of acres)
80 122 165 160 146 146
The budget includes $25 million for the SWAT initiative which will greatly increase the effectiveness of conservation programs Each SWAT will target an identified watershed for a period of 3 to 4 years with the intent of reaching 100 percent of the landowner base eligible for Farm Bill conservation program assistance The additive effect of planned and applied conservation practices would hasten environmental improvement while keeping production agriculture competitive and profitable
88
NATURAL RESOURCES AND ENVIRONMENT
The budget includes $35 million for NRCS to support the Departmentrsquos efforts to modernize and upgrade the CCE for the Service Center Agencies (SCAs) This funding will be used to replace outdated components of the CCE many of which have exceeded their expected life cycles reduce system vulnerabilities to failure and improve the performance and effectiveness of the shared infrastructure These improvements will allow the SCAs to better serve program participants with a more flexible and reliable IT infrastructure and enable the first system-wide refresh of the CCE since the infrastructure was implemented in 2000 In addition as the components of the CCE are replaced USDA will implement a right-sizing process whereby configuration changes will be made to better support the delivery of current and future programs As part of this process the Department will strive to improve system security reduce the long term cost of infrastructure services and improve service reliability Finally the CO budget includes a targeted fee proposal for conservation plans that is assumed to generate $19 million in revenue
Watershed and Flood Prevention Operations (WFPO) WFPO provides technical and financial assistance to local communities and sponsoring organizations to construct flood protection water supply and water quality improvement projects The 2011 budget proposes to terminate funding for this activity because earmarks prevent NRCS from prioritizing these projects on their merits and because benefits are highly localized and local sponsors are expected to assume a greater role in identifying and addressing water resource problems The Recovery Act provided $290 million in non-earmarked funds for this program in 2009 which supported over 195 projects representing more than 28000 acres in 36 States
Watershed Rehabilitation Program This program provides financial and technical assistance to communities for planning and financing the rehabilitation of Federally-constructed flood prevention dams that have reached the end of their design lives The budget includes $40 million in discretionary funds the same as 2010 for technical assistance to help local governments and private landowners plan the rehabilitation of those dams with the greatest potential for failure The Recovery Act provided $50 million for rehabilitation work in 2009 which supported more than two dozen projects in 11 States
Resource Conservation and Development (RCampD) As part of the Administrationrsquos continued commitment to fiscal responsibility the budget proposes to eliminate the RCampD program Begun in 1962 the program was intended to build community leadership skills through the establishment of RCampD councils that would access Federal State and local programs for the communityrsquos benefit After 47 years the program has matured to the point that this goal has been accomplished RCampD councils have developed sufficiently strong State and local ties to secure funding for their continued operation without Federal assistance A number of alternatives to RCampD support also exist including the use of other Federal State and local programs and existing avenues such as those provided through State Technical Committees
Environmental Quality Incentives Program (EQIP) The purpose of EQIP is to provide assistance to landowners who face serious natural resource challenges that impact soil water and related natural resources including grazing lands wetlands and wildlife habitat The 2011 budget proposes $12 billion for EQIP an increase of $28 million over 2010 This would enable nearly 43000 new contracts to participate in the program and would cover more than
89
NATURAL RESOURCES AND ENVIRONMENT
142 million acres The program will continue to emphasize land management practices such as the application of comprehensive nutrient management plans Consistent with the initiative to focus efforts in high priority areas EQIP enrollment acres are expected to fall due to targeting acres with the highest conservation benefit These acres often are relatively smaller farms Despite this reduction in acreage enrollment NRCS anticipates being able to maintain its key performance measures for EQIP (see table below) The Agricultural Water Enhancement Program (AWEP) which is operated under EQIP is funded at $74 million about $1 million more than the 2010 level AWEP promotes the conservation of ground and surface water and the improvement of water quality
EQIP Key Performance Measure 2006 2007 2008 2009 2010 2011 Comprehensive nutrient management plans applied (number of plans) 2774 2490 2520 2019 2000 2000
Cropland with conservation applied to improve soil quality (millions of acres)
34 53 56 48 50 50
Grazing land and forest land with conservation applied to protect and improve the resource base (millions of acres)
122 165 169 172 15 15
Chesapeake Bay Watershed Initiative The Chesapeake Bay Watershed Initiative provides producers conservation assistance through several USDA programs and is funded at $72 million or nearly $29 million more than the 2010 level This program helps agricultural producers improve water quality and quantity and restore enhance and preserve soil air and related resources in the Chesapeake Bay watershed through the implementation of conservation practices
Wetlands Reserve Program (WRP) WRP is a voluntary program in which landowners are paid to retire cropland from agricultural production if those lands are restored to wetlands and protected in most cases with a long-term or permanent easement Landowners receive fair market value for the land and are provided with cost-share assistance to cover the restoration expenses The 2008 Farm Bill authorized the program to enroll up to 3041200 acres through the end of fiscal year 2012 During 2009 funding was provided for WRP to enroll approximately 179000 acres and funding for 2010 allows for up to 250000 acres The 2011 budget request includes $502 million to enroll 192982 acres in 2011 During 2011 it is expected that 140000 acres of wetlands will be created restored or enhanced
Key Performance Measure 2006 2007 2008 2009 2010 2011
WRP Wetlands created 181979 149330 128860 106379 125000 140000restored or enhanced (acres)
90
NATURAL RESOURCES AND ENVIRONMENT
Conservation Security Program The Conservation Security Program was established in the 2002 Farm Bill and is a voluntary program that provides financial and technical assistance on Tribal and private agricultural working lands to support ongoing conservation stewardship The program provides payments to producers who maintain and enhance the condition of natural resources The program was not reauthorized in the 2008 Farm Bill The budget includes $212 million for the Conservation Security Program in 2011 in order to service existing contracts
Conservation Stewardship Program The 2008 Farm Bill replaced the Conservation Security Program with a new Conservation Stewardship Program which is distinguished from the old program in that it encourages participants to undertake new conservation activities in addition to maintaining and managing existing conservation activities Also the new program operates under an annual acreage limitation rather than a funding cap The budget proposes $629 million an increase of $160 million from 2010 for the program to enroll 12 million acres during 2011
Farm and Ranch Lands Protection Program (FRPP) Through this program the Federal Government facilitates and provides funding for the purchase of conservation easements or other interests in land for the purpose of protecting agricultural use and related conservation values by limiting nonagricultural uses of the land FRPP is carried out through existing State Tribal and local governments non-governmental organizations and local farmland protection programs The Farm and Ranch Lands Protection Program is funded at $160 million in 2011 an increase of $10 million over 2010 For 2011 NRCS has set a target to protect 45000 prime unique or important farmland acres from conversion via FRPP
Key Performance Measure 2006 2007 2008 2009 2010 2011
FRPP Prime unique or important farmland protected from conversion to non-agricultural uses by conservation easements acres
46909 38495 27401 38260 40000 45000
Wildlife Habitat Incentives Program (WHIP) The program provides financial and technical assistance to eligible participants to develop habitats for upland wildlife wetland wildlife threatened and endangered species and fish and other types of wildlife The purpose of the program is to create needed wildlife habitat that supports wildlife populations with local State and national significance The budget proposes funding for WHIP at $73 million in 2011 a reduction of $12 million from 2010 Although funding is reduced the Agency has established an ambitious goal for WHIP to contribute to the improvement of 400000 acres of non-Federal land for fish and wildlife habitat during 2011
91
NATURAL RESOURCES AND ENVIRONMENT
Key Performance Measure 2006 2007 2008 2009 2010 2011
WHIP Non-Federal land with conservation applied to improve 175543 388769 316896 335402 350000 400000 fish and wildlife habitat quality acres
Grasslands Reserve Program (GRP) GRP was authorized in the 2002 Farm Bill as a voluntary program to help landowners and operators restore and protect grassland including rangeland pastureland and certain other lands while maintaining the landsrsquo suitability for grazing Participants can enroll acreage in rental agreements with varying lengths or in long-term or permanent easements The program is jointly administered by NRCS and the Farm Service Agency (FSA) which has lead responsibility for rental agreement administration and financial activities NRCS has lead responsibility for technical issues and easement administration The program was initiated in 2003 and reached its statutory funding limit of $254 million in 2007 However the 2008 Farm Bill reauthorized the program for 2009-2012 and capped it at 12 million additional acres GRP is funded at $79 million for 2011 to enroll an additional 245830 acres
Conservation Reserve Program Technical Assistance NRCS provides technical support including land eligibility determinations conservation planning and practice implementation for the Conservation Reserve Program (CRP) The 2011 budget includes $124 million for CRP technical assistance CRP is administered by FSA The program status for 2011 is described on page 34
92
FOREST SERVICE (FS) Budget Authority
(Dollars in Millions) 2009 2010 2011
Program Enacted Estimate Estimate
NATURAL RESOURCES AND ENVIRONMENT
Discretionary Accounts Forest and Rangeland Researchhelliphelliphelliphelliphelliphelliphelliphelliphelliphelliphelliphelliphellip $296 $312 $304 State and Private Forestryhelliphelliphelliphelliphelliphelliphelliphelliphelliphelliphelliphelliphelliphelliphellip 266 308 322 National Forest System Integrated Resource Restoration Priority Watersheds and Job Stabilizationhelliphelliphelliphelliphelliphelliphellip 0 0 50 Collaborative Forest Landscape Restoration Fund ahelliphelliphellip 0 0 40 Restoration and Management of Ecosystemshelliphelliphelliphelliphelliphellip 652 668 604
Total Integrated Resource Restorationhelliphelliphelliphelliphelliphelliphellip 652 668 694 Recreation Heritage and Wildernesshelliphelliphelliphelliphelliphelliphelliphelliphelliphellip 278 285 293
Other NFS Activitieshelliphelliphelliphelliphelliphelliphelliphelliphelliphelliphelliphelliphelliphelliphelliphellip 580 598 599 Total NFShelliphelliphelliphelliphelliphelliphelliphelliphelliphelliphelliphelliphelliphelliphelliphelliphelliphelliphellip 1510 1551 1586 Wildland Fire Activities Preparednesshelliphelliphelliphelliphelliphelliphelliphelliphelliphelliphelliphelliphelliphelliphelliphelliphelliphelliphellip 675 675 1008 Suppression Suppression Activitieshelliphelliphelliphelliphelliphelliphelliphelliphelliphelliphelliphelliphelliphelliphellip 994 923 595 FLAME Fundhelliphelliphelliphelliphelliphelliphelliphelliphelliphelliphelliphelliphelliphelliphelliphelliphelliphellip 0 413 291 Wildland Fire Contingency Reservehelliphelliphelliphelliphelliphelliphelliphelliphellip 0 0 282
Total Suppressionhelliphelliphelliphelliphelliphelliphelliphelliphelliphelliphelliphelliphelliphelliphellip 994 1336 1168 Hazardous Fuels Reduction ahelliphelliphelliphelliphelliphelliphelliphelliphelliphelliphelliphelliphellip 328 340 349 Other Fire Operationshelliphelliphelliphelliphelliphelliphelliphelliphelliphelliphelliphelliphelliphelliphelliphellip 135 166 120 Total Wildland Fire Activitieshelliphelliphelliphelliphelliphelliphelliphelliphelliphelliphellip 2132 2517 2645 Capital Improvement and Maintenancehelliphelliphelliphelliphelliphelliphelliphelliphelliphellip 495 556 438 Land Acquisitionhelliphelliphelliphelliphelliphelliphelliphelliphelliphelliphelliphelliphelliphelliphelliphelliphelliphellip 51 65 75 Other Accountshelliphelliphelliphelliphelliphelliphelliphelliphelliphelliphelliphelliphelliphelliphelliphelliphelliphelliphellip 9 6 6 Subtotal Ongoing Discretionary helliphelliphelliphelliphelliphelliphelliphelliphelliphellip 4759 5315 5377
Emergency Supplemental Funding and Repaymentshelliphelliphelliphellip 200 0 0 Recovery Act
Capital Improvement and Maintenancehelliphelliphelliphelliphelliphelliphelliphelliphellip 650 0 0 Wildland Fire Managementhelliphelliphelliphelliphelliphelliphelliphelliphelliphelliphelliphelliphellip 500 0 0
Total Recovery Act Programshelliphelliphelliphelliphelliphelliphelliphelliphelliphelliphellip 1150 0 0 Total Discretionary helliphelliphelliphelliphelliphelliphelliphelliphelliphelliphelliphelliphelliphelliphellip $6109 $5315 $5377
a $10 million available for Collaborative Forest Landscape Restoration Fund from Hazardous Fuels Reduction in 2010
93
NATURAL RESOURCES AND ENVIRONMENT
Capital Improvement amp
Land Acquisition 1
All Other 13
Wildland Fire Management
43
Budget Authority (Dollars in Millions)
2009 2010 2011 Program Enacted Estimate Estimate
Mandatory Programs Permanent Appropriationshelliphelliphelliphelliphelliphelliphelliphelliphelliphelliphelliphelliphelliphellip $361 $349 $316 Secure Rural Schoolshelliphelliphelliphelliphelliphelliphelliphelliphelliphelliphelliphelliphelliphelliphelliphellip 395 387 348 Trust Fundshelliphelliphelliphelliphelliphelliphelliphelliphelliphelliphelliphelliphelliphelliphelliphelliphelliphelliphelliphellip 238 100 104
Total Mandatoryhelliphelliphelliphelliphelliphelliphelliphelliphelliphelliphelliphelliphelliphelliphelliphellip 994 836 768
Total Forest Service Budget Authorityhelliphelliphelliphelliphelliphelliphelliphellip $7103 $6151 $6145
2011 Forest Service Budget Authority Total = $61 Billion
National Forest System 26
State amp Private Forestry 5
Forest and Rangeland Research
5
Maintenance 7
The Forest Service (FS) with over 30000 staff years is the largest employer in USDA For 2011 the total request for FS ongoing discretionary activities is $54 billion an increase of $79 million over 2010 This budget will restore landscapes improve water quality reduce greenhouse gas emissions implement travel management plans and create green jobs Through targeted administrative savings in the Agencyrsquos cost pools FS will shift $52 million in administrative expenditures to programs Specifically $32 million of efficiencies in information technology and business processes will be borne by employing a centralized data center and other administrative service savings and a new automated contracting system for pre-suppression fire activities will generate $10 million in information technology savings A new automated Human Capital Management system will increase FSrsquo efficiency in handling worker claims by $10 million
94
NATURAL RESOURCES AND ENVIRONMENT
Forest and Rangeland Research For 2011 $304 million is proposed for Forest and Rangeland Research FS maintains the worlds largest forest research organization While its broad mission is to develop knowledge and technology needed to enhance the economic and environmental values of all of the Nations forests the program also supports the specific research needs that arise from managing the National Forest System (NFS) For example FS is using tools developed by this program to evaluate potential fire growth values at risk and cost-efficiency of firefighting on large wildland fire events The budget provides for the completion of a nation-wide comprehensive carbon inventory
State and Private Forestry (SampPF) Through SampPF programs FS addresses forest health concerns on Federal State and private lands A small decrease in Cooperative Fire funding is requested because in FY2011 assistance in preparing for wildfires will be focused to States and local governments that have established standards so that firefighters will be able to defend their communities safely For 2011 total funding for SampPF programs is proposed at $322 million an increase of $14 million above the 2010 level In line with the Presidentrsquos commitment to fully fund the Land and Water Conservation Fund by 2014 a $21 million increase is proposed in the Forest Legacy programmdasha program that cost-shares the purchase of conservation easements to protect nationally prioritized forest lands from development An increase of $1 million is also proposed for the creation of a Community Forest amp Open Space Conservation program to cost share fee-simple purchases of land as authorized by the 2008 Farm Bill The budget proposes an increase of $2 million to implement a competitive cost-share program for the strategic planting of trees for greenhouse gas reduction efforts in urban areas
National Forest System (NFS) FS manages over 193 million acres of public land in 44 States Puerto Rico and the Virgin Islands These lands known collectively as the NFS are managed for multiple uses on a sustained-use basis For 2011 total funding for NFS is proposed at approximately $16 billion a $35 million increase from the 2010 level The Agency has placed a focus on restoring forests for the benefit of watersheds forest health climate and vibrant local economies
bull The budget proposes a new line item ldquoIntegrated Resource Restorationrdquo which combines the Vegetation amp Watershed Management Wildlife amp Fisheries Habitat Management and Forest Products into a single line item This new line item better characterizes the scope of the work that the Agency intends to perform in 2011 Addressing the forest health crisis and restoring our forests will require integrating traditional timber management with other stewardship activities Indeed restoring our forests is not possible without a vibrant forestry sector This new line item will integrate timber management forest restoration biomass production and other stewardship activities on National Forest System lands and will support similar activities funded from other sources on adjacent Federal State and tribal lands This new line item is funded at $694 million which is an increase of $26 million above 2010
bull Within the Integrated Resource Restoration budget line item $40 million is provided for the Collaborative Forest Landscape Restoration Fund This fund will be used for ecological treatments authorized by the Forest Landscape Restoration Act of 2009 contributing to significantly improving watershed conditions creating landscapes that are
95
NATURAL RESOURCES AND ENVIRONMENT
more resilient to climate change and reducing fire risk These funds will be leveraged with local and private resources magnifying the benefits of Federal funding across forest landscapes
bull Within the Integrated Resource Restoration budget line item $50 million is provided for the new Priority Watersheds and Job Stabilization initiative Under this initiative watershed assessments will be conducted of all NFS lands integrating State forest resource assessments into the process Further the agency will use diverse stakeholder groups to prioritize watershed improvement work and a science-based monitoring program will be established to demonstrate a change in watershed condition
bull An increase of $5 million in Recreation is provided for implementation of the Agencyrsquos motor-vehicle-use maps developed as part of its travel management planning process
Wildland Fire Activities Through the Wildland Fire Activities FS protects life property and natural resources on NFS land and an additional 20 million acres on adjacent State and private lands through fee or reciprocal protection agreements For 2011 total funding for these activities is proposed at $26 billion which represents an increase of $128 million above the 2010 level As directed in the 2010 Interior Appropriations conference report to improve transparency FS realigned its suppression and preparedness costs resulting in $333 million being shifted from Suppression to Preparedness Funds are provided in fire preparedness for a minimum of 10480 firefighters The Wildland Fire budget contains $595 million for suppression activities $291 million for the FLAME fund for large-fire suppression activities and $282 million for a contingency reserve which would be used if suppression funds are exhausted In 2011 the agency will allocate $349 million for fuels reduction projects using a clear and accountable method for prioritizing potential projects that will be developed over the next three months The budget provides $15 million for the Forest Biomass for Energy Program and $5 million for the Community Wood Energy Program as authorized by the 2008 Farm Bill
96
NATURAL RESOURCES AND ENVIRONMENT
Key Performance Measure 2006 2007 2008 2009 2010 2011
Percentage of total National Forest System land base for which fire risk is reduced
11 19 21 30 30 31
through movement to a better condition class
Acres of WUI fuels treated to reduce the risk of
1590 1654 1940 1740 1470 1600
catastrophic fire
Percentage of acres treated in the WUI that have been
17 25 36 28 41 75
identified in Community Wildfire Protection Plans
Capital Improvement and Maintenance Capital Improvement and Maintenance funds construction maintenance and decommissioning of buildings recreation sites facilities roads and trails For 2011 total funding for these programs is proposed at $438 million which represents a decrease of $100 million from 2010 Most of the reduction comes from a reduction in funding for Roads activities While $168 million is provided for road maintenance and decommissioning no funding is provided for new road construction or upgrades to existing roads Roads funds will be focused on ldquoright-sizingrdquo the FS road system The budget provides $50 million for the Legacy Roads and Trails program
Land Acquisition The Land Acquisition program protects resources decreases administrative costs and increases visitor access to the National Forests and Grasslands by acquiring parcels of land for inclusion in the NFS For 2011 the budget proposes $75 million in total funding for this program The $10 million increase from 2010 reflects progress toward the Presidentrsquos goal of fully funding the Land and Water Conservation Fund by 2014 In 2011 FS will nationally prioritize the parcels it is considering for acquisition in a manner similar to the Forest Legacy program
97
MARKETING AND REGULATORY PROGRAMS
MISSION AND RELATIONSHIP TO STRATEGIC GOALS
2011 MRP Discretionary Budget Authority Total = $1019 Billion
AMS 10
APHIS 86
GIPSA 4
The economic vitality and quality of life in rural America and the US economy at large depends on a competitive efficient and productive agricultural system US agricultural producers are not simply farmers and ranchers they are often small business owners trying to survive and support their families and rural communities in a challenging global technologically advanced and competitive business environment In an era of market consolidation and intense competition these producers rely on fair and open access to markets and control over their decisions to thrive Agricultural producers also need to safeguard animal and plant resources against the introduction of foreign agricultural pests and diseases
The mission of Marketing and Regulatory Programs (MRP) is to facilitate and expand the domestic and international marketing of US agricultural products to help protect the agricultural sector from plant and animal health threats and to ensure humane care and treatment of certain animals These programs provide the basic infrastructure to improve agricultural market competitiveness for the overall benefit of both consumers and producers of American agriculture Thus the mission area contributes to all of USDArsquos Strategic Goals
USDA also plays a critical role in increasing prosperity and sustainability in our Nationrsquos agricultural system and rural communities Among other efforts MRP uses oversight activities to protect producers from unfair competition and unfair business practices and working with the Department of Justice MRP helps prevent anti-competitive behaviors across the agribusiness sector MRP also assists producers in management and marketing by providing market trend analysis and business and marketing tools This assistance includes developing and overseeing national standards for the production and handling of agricultural products labeled as organic in the National Organic Program among other items MRP programs also help increase the competitiveness of the agricultural sector by enhancing protection of the Nationrsquos agriculture from pests and diseases and increase the efficiency of production and domestic and international marketing of US commodities
98
MARKETING AND REGULATORY PROGRAMS
The Marketing and Regulatory Programs are administered by three agencies the Animal and Plant Health Inspection Service (APHIS) the Agricultural Marketing Service (AMS) and the Grain Inspection Packers and Stockyards Administration (GIPSA)
99
MARKETING AND REGULATORY PROGRAMS
ANIMAL AND PLANT HEALTH INSPECTION SERVICE (APHIS)
Budget Authority (Dollars in Millions)
2009 2010 2011 Program Enacted Estimate Budget
Discretionary Pest and Disease Exclusion Agricultural Quarantine Inspection (AQI) Appropriated helliphelliphelliphelliphelliphelliphelliphelliphelliphelliphelliphelliphelliphelliphelliphelliphelliphelliphellip $27 $29 $27 Fruit Fly Exclusion and Detectionhelliphelliphelliphelliphelliphelliphelliphelliphelliphelliphelliphellip 62 63 64 Overseas Technical and Trade Operationshelliphelliphelliphelliphelliphelliphelliphelliphellip 16 16 17 All Other Pest and Disease Exclusionhelliphelliphelliphelliphelliphelliphelliphelliphelliphelliphellip 55 59 51
Total Pest and Disease Exclusionhelliphelliphelliphelliphelliphelliphelliphelliphelliphelliphellip 160 167 159 Plant and Animal Health Monitoring Animal Health Monitoring and Surveillancehelliphelliphelliphelliphelliphelliphelliphellip 129 122 129 Animal and Plant Health Regulatory Enforcementhelliphelliphelliphelliphelliphelliphelliphelliphelliphelliphelliphelliphelliphelliphelliphelliphelliphelliphelliphellip 14 14 14 Avian Influenza helliphelliphelliphelliphelliphelliphelliphelliphelliphelliphelliphelliphelliphelliphelliphelliphelliphelliphellip 61 60 53 Emergency Management Systemshelliphelliphelliphelliphelliphelliphelliphelliphelliphelliphelliphellip 16 16 16 Pest Detectionhelliphelliphelliphelliphelliphelliphelliphelliphelliphelliphelliphelliphelliphelliphelliphelliphelliphelliphelliphellip 28 28 27 All Other Plant and Animal Health Monitoringhelliphelliphelliphelliphelliphelliphellip 8 9 8
Total Plant and Animal Health Monitoringhelliphelliphelliphelliphelliphelliphellip 256 249 247 Pest and Disease Management Emerging Plant Pestshelliphelliphelliphelliphelliphelliphelliphelliphelliphelliphelliphelliphelliphelliphelliphelliphellip 134 159 158 Wildlife Services Operationshelliphelliphelliphelliphelliphelliphelliphelliphelliphelliphelliphelliphelliphellip 76 78 71 All Other Pest and Disease Managementhelliphelliphelliphelliphelliphelliphelliphelliphellip 135 132 107
Total Pest and Disease Managementhelliphelliphelliphelliphelliphelliphelliphelliphelliphellip 345 369 336 Animal Carehelliphelliphelliphelliphelliphelliphelliphelliphelliphelliphelliphelliphelliphelliphelliphelliphelliphelliphelliphelliphellip 22 22 23 Biotechnology Regulatory Serviceshelliphelliphelliphelliphelliphelliphelliphelliphelliphelliphelliphellip 13 13 19 Veterinary Biologics and Diagnosticshelliphelliphelliphelliphelliphelliphelliphelliphelliphelliphellip 41 43 47 Other Scientific and Technical Serviceshelliphelliphelliphelliphelliphelliphelliphelliphelliphellip 30 32 29 PhysicalOperational Securityhelliphelliphelliphelliphelliphelliphelliphelliphelliphelliphelliphelliphelliphellip 6 6 6 Information Technology Infrastructurehelliphelliphelliphelliphelliphelliphelliphelliphelliphelliphellip 4 4 4 Total Salaries and Expenseshelliphelliphelliphelliphelliphelliphelliphelliphelliphelliphelliphelliphellip 877 905 870 Buildings and Facilitieshelliphelliphelliphelliphelliphelliphelliphelliphelliphelliphelliphelliphelliphelliphelliphelliphellip 5 5 5
Total Ongoing Activitieshelliphelliphelliphelliphelliphelliphelliphelliphelliphelliphelliphelliphelliphellip 881 910 875 Emergency Funding (CCC)helliphelliphelliphelliphelliphelliphelliphelliphelliphelliphelliphelliphelliphelliphellip 29 28 0
Total APHIS Discretionary Programshelliphelliphelliphelliphelliphelliphelliphelliphelliphelliphellip $910 $938 $875
100
MARKETING AND REGULATORY PROGRAMS
(Dollars in Millions)
2009 2010 2011 Program Enacted Estimate Budget
Mandatory Agricultural Quarantine Inspection (AQI) Fees ahelliphelliphelliphelliphelliphellip $147 $186 $190 Trust Fundshelliphelliphelliphelliphelliphelliphelliphelliphelliphelliphelliphelliphelliphelliphelliphelliphelliphelliphelliphelliphellip 17 14 14 Farm Bill
National Clean Plant Networkhelliphelliphelliphelliphelliphelliphelliphelliphelliphelliphelliphelliphellip 5 5 5 Plant Pest and Disease Managementhelliphelliphelliphelliphelliphelliphelliphelliphelliphelliphellip 12 45 50
Total Farm Bill Programshelliphelliphelliphelliphelliphelliphelliphelliphelliphelliphelliphelliphelliphellip 17 50 55 Total Mandatory Programshelliphelliphelliphelliphelliphelliphelliphelliphelliphelliphelliphelliphellip 181 250 259 Total APHIS Programshelliphelliphelliphelliphelliphelliphelliphelliphelliphelliphelliphelliphelliphellip $1091 $1188 $1134
a Total estimated collections are $498 million in 2010 and $508 million in 2011 Of the total $312 million and $318 million are transferred to the Department of Homeland Security in 2010 and 2011 respectively
APHIS works cooperatively with State and local agencies private groups and foreign governments to protect the safety of the Nationrsquos agriculture
The 2011 budget proposes an appropriation of about $875 million of which approximately $870 million is for salaries and expenses and about $5 million for buildings and facilities This total is a net decrease of about $35 million compared to 2010 In general the budget proposes a reallocation of resources from programs that have achieved success (eg cotton pests and screwworm) and for those which progress in eradication is not deemed feasible at this time (eg emerald ash borer) to those efforts where success in eradication may be feasible (eg Asian long-horned beetle and light brown apple moth) The budget also proposes the elimination of earmarks
APHIS supports the Departmentrsquos strategic goal to ensure children have access to safe nutritious and balanced meals Specifically APHIS and other agencies protect agricultural health by minimizing major diseases and pests This outcome is measured as the value of damage prevented and mitigated annually as a result of APHIS activities The measure indicates a decrease between fiscal years 2008 and 2009 as a result of the declining economyrsquos impact on the value of the commodities that are protected by these efforts
Key Performance Measure 2006 2007 2008 2009 2010 2011 Value of damage prevented and mitigated annually as a result of selected plant and animal health monitoring and surveillance efforts
NA 137 138 105 107 111
($ billions)
101
MARKETING AND REGULATORY PROGRAMS
Pest and Disease Exclusion The 2011 budget includes discretionary appropriations of $159 million for pest and disease exclusion The budget includes an increase of $09 million above the 2010 level to cover costs associated with the Foreign Service Pay Modernization Initiative and assist developing countries in strengthening their regulatory capacity to detect and address pests and diseases In recent years APHIS has been successful in driving the screwworm south The budget includes a decrease of $75 million below the 2010 level due to the full operation of a new sterile screwworm production facility closer to the present range of the screwworm In addition to discretionary funding APHIS collects user fees to provide technical support related to agricultural quarantine and inspections that occur at ports of entry These collections are shared with the Department of Homeland Securityrsquos Customs and Border Protection APHIS plans to retain $190 million in 2011
Plant and Animal Health Monitoring The budget requests $247 million for plant and animal health monitoring and surveillance In 2009 USDA collected stakeholder views on the National Animal Identification System (NAIS) through a variety of mechanisms (eg official Federal Registered-announced comment periods focus groups ongoing stakeholder input) This input will be used to revise the NAIS to better meet the needs of the animal agriculture community The requested $142 million will be essential in implementing an improved traceability system The budget requests a net reduction of about $7 million from the Avian Influenza line item due in part to having completed the stockpile of emergency response equipment and supplies The revised level of funding would continue to protect avian health
Pest and Disease Management Programs APHIS provides technical and financial support to help control or eradicate a variety of agricultural health threats This support is provided to various stakeholders ranging from individuals to States The 2011 budget requests $336 million for pest and disease management efforts This includes an increase of $16 million to address the Asian longhorned beetle in Massachusetts This also includes an increase of $10 million to continue efforts initiated with emergency funding to address the light brown apple moth The budget includes a decrease of about $14 million to account for successes in reducing acreage infested with boll weevil and pink bollworm Boll weevil eradication is projected by the end of fiscal year 2010 and the pink bollworm is projected to be eradicated by the end of fiscal year 2012 The budget includes a decrease of about $24 million within the emerald ash borer (EAB) program due to the limited eradication methods available and the need to devote limited resources to other pests where the likelihood of success is greater Due to these limited eradication methods APHIS will pursue a control strategy to minimize the current spread of the pest APHIS will continue survey work for EAB under a management strategy but not the costly tree removal that has been the center of the eradication strategy Tree removal has been ineffective at slowing the spread of EAB Methods development work will continue in 2011 with the possibility of developing an effective means of slowing and reversing the spread of this pest To combat any sudden urgent and unforeseen pest and disease outbreaks the Secretary retains authority to transfer funds from the CCC or other USDA accounts
Animal Care The 2011 budget proposes $23 million for Animal Welfare Act activities which is approximately the same as 2010 The budget requests $09 million for Horse Protection Act activities APHIS will submit legislative proposals to authorize the annual collection of about $12 million in user fees for Animal Welfare activities As recipients of Animal Welfare permits
102
MARKETING AND REGULATORY PROGRAMS
are the direct beneficiaries of animal welfare inspections the proposed user fee will place the cost of providing these services on the recipient rather than the US taxpayer
Scientific and Technical Services Within USDA APHIS has chief regulatory oversight of genetically modified organisms APHIS also develops methods and provides diagnostic support to prevent detect control and eradicate agricultural health threats APHIS as well works to prevent ineffective or harmful animal biologics (eg vaccines) from being marketed In addition APHIS provides Federal leadership in developing methods to address wildlife conflicts Several of these activities have been funded by earmarks which are eliminated in the 2011 budget The budget includes about $19 million an increase of about $6 million for Biotechnology Regulatory Services to assess the risk of genetically modified organisms As the number and complexity of proposed biotechnology products increase additional staff will be required to provide sufficient review This increase supports the Departmental priority of helping promote agricultural production and biotechnology exports by increasing the number of genetically engineered plant lines that are found to be safe by APHIS Finally APHIS will submit legislative proposals to authorize the annual collection of about $5 million in user fees for Biotechnology Regulatory Services activities and about $9 million in user fees for Veterinary Biologics activities As recipients of biotechnology permits and biologics licenses are the direct beneficiaries of many of the services provided by the respective division of APHIS the proposed user fee will place the cost of providing these services on the recipient rather than the US taxpayer
Key Performance Measure 2006 2007 2008 2009 2010 2011 Cumulative number of genetically engineered plant lines reviewed by USDA and found safe for use in the environment 70 73 78 80 85 100
Buildings and Facilities The budget requests $5 million for general repairs and maintenance of APHIS buildings This amount will be used for critical repairs at APHIS facilities
103
MARKETING AND REGULATORY PROGRAMS
AGRICULTURAL MARKETING SERVICE (AMS)
Budget Authority (Dollars in Millions)
2009 2010 2011 Program Enacted Estimate Budget
Discretionary Marketing Services Market Newshelliphelliphelliphelliphelliphelliphelliphelliphelliphelliphelliphelliphelliphelliphelliphelliphelliphelliphelliphelliphelliphelliphelliphellip $33 $34 $35 Egg Surveillance and Standardizationhelliphelliphelliphelliphelliphelliphelliphelliphelliphelliphelliphelliphelliphellip 8 8 8 Market Protection and Promotionhelliphelliphelliphelliphelliphelliphelliphelliphelliphelliphelliphelliphelliphelliphelliphellip 40 43 47 Wholesale Farmers and Alternative Market Developmenthelliphelliphelliphelliphelliphellip 3 3 4 Transportation Serviceshelliphelliphelliphelliphelliphelliphelliphelliphelliphelliphelliphelliphelliphelliphelliphelliphelliphelliphelliphellip 3 3 3
Total Marketing Serviceshelliphelliphelliphelliphelliphelliphelliphelliphelliphelliphelliphelliphelliphelliphelliphelliphelliphellip 87 91 97
Payments to States and Possessions Payments to Stateshelliphelliphelliphelliphelliphelliphelliphelliphelliphelliphelliphelliphelliphelliphelliphelliphelliphelliphelliphelliphelliphellip 2 2 3
Total Payments to States and Possessionshelliphelliphelliphelliphelliphelliphelliphelliphelliphelliphellip 2 2 3
Total Discretionary Programshelliphelliphelliphelliphelliphelliphelliphelliphelliphelliphelliphelliphelliphelliphelliphelliphelliphellip 89 93 100
Mandatory Funds for Strengthening Markets Income and Supply (Section 32) Commodity Program Expenseshelliphelliphelliphelliphelliphelliphelliphelliphelliphelliphelliphelliphelliphelliphelliphelliphellip 964 1056 982 Section 32 Administrative Funds
Marketing Agreements and Orders (MAampO)helliphelliphelliphelliphelliphelliphelliphelliphelliphelliphellip 17 20 20 Web-based Supply Chain Managementhelliphelliphelliphelliphelliphelliphelliphelliphelliphelliphelliphelliphellip 20 10 0 Commodity Purchase Serviceshelliphelliphelliphelliphelliphelliphelliphelliphelliphelliphelliphelliphelliphelliphelliphellip 11 12 13
Total Section 32 Administrative Fundshelliphelliphelliphelliphelliphelliphelliphelliphelliphelliphelliphellip 48 42 33 Total Section 32 Fundshelliphelliphelliphelliphelliphelliphelliphelliphelliphelliphelliphelliphelliphelliphelliphelliphelliphellip 1012 1098 1015
User Fees Perishable Agricultural Commodities Acthelliphelliphelliphelliphelliphelliphelliphelliphelliphelliphelliphelliphellip 7 7 7 Commodity Grading Serviceshelliphelliphelliphelliphelliphelliphelliphelliphelliphelliphelliphelliphelliphelliphelliphelliphellip 150 140 148
Total User Fee Funded Programshelliphelliphelliphelliphelliphelliphelliphelliphelliphelliphelliphelliphelliphelliphellip 157 147 155 Farm Bill Specialty Crop Block Grants (Sec 10109)helliphelliphelliphelliphelliphelliphelliphelliphelliphelliphelliphellip 49 55 55 Farmers Market Promotion Program (Sec 10106)helliphelliphelliphelliphelliphelliphelliphelliphellip 5 5 10 Agricultural Mgmt Assistance Organic Cost-Share (Sec 2801)helliphelliphelliphellip (2) (2) (2)
Total Farm Bill Programshelliphelliphelliphelliphelliphelliphelliphelliphelliphelliphelliphelliphelliphelliphelliphelliphellip 54 60 65
Total Mandatory Programshelliphelliphelliphelliphelliphelliphelliphelliphelliphelliphelliphelliphelliphelliphelliphellip 1223 1305 1235 Total AMS Programshelliphelliphelliphelliphelliphelliphelliphelliphelliphelliphelliphelliphelliphelliphelliphelliphelliphelliphelliphelliphellip $1312 $1398 $1335
The mission of AMS is to facilitate the competitive and efficient marketing of agricultural products in domestic and international markets while ensuring fair trading practices AMS programs benefit producers traders and consumers of US food and fiber products by promoting a strategic marketing perspective that adapts product and marketing decisions to
104
MARKETING AND REGULATORY PROGRAMS
consumer demands changing domestic and international marketing practices and new technology
AMS programs will play key roles in two initiatives The Wholesale Farmers and Alternative Market Development Program together with Rural Development programs will be part of the Government-wide Healthy Food Financing Initiative to support local and regional efforts to increase access to healthy food particularly for the development of grocery stores and other healthy food retailers in urban and rural food deserts and other underserved areas In a related effort the ldquoKnow Your Farmer Know Your Foodrdquo initiative will facilitate the development of local and regional food systems that better connect consumers with local farms create new income opportunities for farmers and place a greater focus on sustainable agricultural practices and nutritious local food Increases are proposed for the Wholesale Farmers and Alternative Market Development Program and the Federal-State Marketing Improvement Program to accomplish program objectives In addition the 2008 Farm Bill provides increased funding for the Farmers Market Promotion Program Some Section 32 funds (described below) will also be employed
Marketing Services AMS administers a variety of programs that enhance the marketing and distribution of agricultural products Activities include the dissemination of market information surveillance of shell egg handling operations development of commodity grade standards protection of producers from unfair marketing practices statistical sampling of commodities for microbiological contamination and pestici de residues development and enforcement of organic standards research and technical assistance aimed at improving efficiency of food marketing and distribution and pesticide recordkeeping
The 2011 budget includes $101 million an increase of $31 million above the 2010 level for the National Organic Program This increase includes $21 million for regulatory review enforcement and development of equivalency agreements plus a one-time increase of $1 million for assisting accredited certifying agents in achieving International Organization for Standardization (ISO) compliance to enhance compliance with program regulations and ensure the integrity of the organic label
In addition an increase of $03 million is in cluded for Market News to support the continuation of data collection and reporting of organic commodity information initiated with $35 million AMS received in 2008 Farm Bill funding
AMS will continue providing assistance to organic producers in specific states through the Agricultural Management Assistance Organic Certification Cost-Share program and using funds from the 2008 Farm Bill for organic producers and handlers nationally through the National Organic Certification Cost-Share Program Cost-share assistance is at a rate of 75 percent of certification costs up to a maximum of $750 per year
The budget includes $38 million an increase of about $09 million for the Wholesale Farmers and Alternative Market Development Program to improve access to local and regionally produced foods as part of the Departmentrsquos ldquoKnow Your Farmer Know Your Foodrdquo initiative
105
MARKETING AND REGULATORY PROGRAMS
Additional funds are included to enhance sampling under the Microbiological Data Program (about $03 million) and maintain effective testing levels of foods and drinking water under the Pesticide Data Program (about $09 million)
Payments to States and Possessions Under the Federal-State Marketing Improvement Program (FSMIP) AMS provides matching funds to State Departments of Agriculture for projects aimed at improving marketing efficiency reducing marketing costs for producers and lowering food costs for consumers The 2011 budget req uests a total of almost $3 million an increase of $13 million for the program nearly doubling of the 2010 funding level The new funding would be targeted to grants that focus on local food marketing opportunities and is part of the ldquoKnow Your Farmer Know Your Foodrdquo initiative
Section 32 Funds Section 32 of the Act of August 24 1935 authorizes the appropriation for each fiscal year of an amount equal to 30 percent of the gross receipts from duties collected under customs laws of the United States during the preceding calendar year These funds are used to encourage domestic consumption of non-price supported perishable commodities and re-establish farmersrsquo purchasing power through a variety of activities including purchases of such commodities and removal of surplus commodities from the marketplace for distribution to Federal nutrition assistance programs such as the National School Lunch Program diversion programs that bring production in line with demand and disaster assistance for producers Section 32 funds are also used to finance the administrative costs associated with the purchase of commodities and developing the specifications used for food procurement throughout the Federal government The 2011 budget request includes an increase of $055 million in Commodity Purchase Services to allow AMS to work with the Food and Nutrition Servicersquos Farm to School Tactical Team to better link local and regionally grown foods to school feeding programs The 2011 budget also proposes a rescission of $50 million in funds available for Section 32
Marketing agreements and orders help stabilize market prices and the supply of milk fruit vegetables and certain specialty crops The orders are administered locally by marketing order committees and market administrators Local activities are funded through assessments on regulated handlers Section 32 funds are used to finance Federal oversight activities for marketing agreements and orders at the national level
User Fee Programs AMS operates programs funded through license or user fees The Commodity Grading Services program provides voluntary commodity grading and classing services for dairy products fresh and processed fruits and vegetables meat and meat products poultry eggs tobacco and cotton In addition AMS enforces the Perishab le Agricultural Commodities Act (PACA) which prohibits unfair and fraudulent practices in the marketing of perishable agricultural commodities by regulating shippers distributors and retailers Full and prompt payment for fresh fruits and vegetables is a key objective of the program
2008 Farm Bill In addition to organic certification cost-sharing AMS will continue other programs at the enacted funding levels provided in the 2008 Farm Bill The Specialty Crop Block Grant Program provides funds to States solely to enhance the competitiveness of specialty crops Specialty crops are defined as fruits vegetables tree nuts dried fruits horticulture and
106
MARKETING AND REGULATORY PROGRAMS
nursery crops (including floriculture) AMS awarded approximately $49 million in specialty crop block grants during 2009 The Farm Bill made $55 million available for 2010 and 2011 Under the Farmersrsquo Market Promotion Program competitive grants are given to help improve and expand domestic farmersrsquo markets roadside stands community-supported agriculture programs agro-tourism activities and other direct producer-to-consumer market opportunities AMS awarded more than $45 million in grants during 2009 The Farm Bill made $5 million available in 2010 and $10 million in 2011
GRAIN INSPECTION PACKERS AND STOCKYARDS ADMINISTRATION (GIPSA)
Budget Authority (Dollars in Millions)
2009 2010 2011 Program Enacted Estimate Budget
Discretionary Salaries and Expenses Grain Regulatory Programhelliphelliphelliphelliphelliphelliphelliphelliphelliphelliphelliphelliphelliphellip $18 $18 $18 Packers and Stockyards Programhelliphelliphelliphelliphelliphelliphelliphelliphelliphelliphellip 22 24 26
Total Salaries and Expenseshelliphelliphelliphelliphelliphelliphelliphelliphelliphelliphelliphellip 40 42 44
Mandatory Inspection and Weighing User Feeshelliphelliphelliphelliphelliphelliphelliphelliphelliphellip (42) (42) (45) Total GIPSA Programshelliphelliphelliphelliphelliphelliphelliphelliphelliphelliphelliphelliphelliphellip $40 $42 $44
GIPSA establishes the official US standards for grain conducts official weighing and grain inspection activities and grades rice dry beans peas lentils and processed grain products The agency regulates and monitors the activities of dealers market agencies stockyard owners live poultry dealers packer buyers packers and swine contractors in order to detect prohibited unfair unjust discriminatory or deceptive and anti-competitive practices in the livestock meat and poultry industries The agency also reviews the fina ncial records of these entities to promote the financial integrity of the livestock meat and poultry industries As such its efforts help USDA enhance international competitiveness of American agriculture and the economic viability and sustainability of rural and farm economies
For 2011 the budget proposes a program level for salaries and expenses of about $89 million of which $45 million is from existing inspection and weighing user fees Of the appropriations request of $44 million about $18 million is devoted to the Grain Regulatory Program including standardization compliance and methods development activities and nearly $26 million to the Packers and Stockyards Program Separately GIPSA will submit a legislative proposal to authorize the collection of fees for the development of grain standards and to amend the Packers and Stockyards Act to provide authority to collect license fees to cover the cost of the program
107
MARKETING AND REGULATORY PROGRAMS
The 2011 budget includes an increase of approximately $18 million to further strengthen enforcement of the Packers and Stockyards Act With additional staff including attorneys GIPSA would bolster direct enforcement and promote greater voluntary compliance with the Act The increase would enable GIPSA to perform approximately 500 additional inspections and compliance reviews and increase industry compliance with the Packers and Stockyards Act to 85 percent
Key Performance Measure 2006 2007 2008 2009 2010 2011
Percent of industry compliance with the Packers and Stockyards Act NA 75 80 80 83 85
108
RESEARCH EDUCATION AND ECONOMICS
MISSION AND RELATIONSHIP TO STRATEGIC GOALS
2011 REE Budget Authority Total = $29 Billion
ARS 41
ERS 3
NASS 6
NIFA 50
Agricultural research is the key element in productivity increases which is central to economic growth in the agricultural sector and typically induces strong effects in other sectors Agricultural research ultimately leads to increased profitability for farmers reduced food costs and greater choice for consumers and improved management of the natural-resource base Major Studies have consistently found that the net social returns from public agricultural research in the United States are high estimated to be at least 35 percent annually Although agricultural research may seem to be an anachronism in todays urban society issues such as the safety of genetically engineered foods pathogens in the food supply and environmental problems make it as important as ever
The Research Education and Economics (REE) mission area provides Federal leadership for the discovery application and dissemination of information and technologies spanning the biological physical and social sciences through agricultural research education and extension activities and economic and statistical analysis which supports all of USDArsquos Strategic Goals The 2011 REE budget serves to ensure a safe sustainable and competitive US food and fiber system and healthy families and communities
REE provides research education and extension that support each of the Departmentrsquos four strategic goals through its intramural and competitive grant programs and through strengthening the capacity of institutions of higher education Through major funding initiatives REE will be the catalyst and premier provider of knowledge for US agriculture by focusing its resources on five key activities Enhance Rural Prosperity Lead Efforts to Mitigate and Adapt to Climate Change Support Agriculture Production in Food-Insecure Nations Increase Access to Nutritious Food and Protect Agricultural Health by Minimizing Major Diseases and Pests to Ensure Access to Safe Plentiful and Nutritious Food
109
RESEARCH EDUCATION AND ECONOMICS
REE responsibilities are carried out by four agencies the Agricultural Research Service conducts intramural research in the area of natural and biological sciences the Economic Research Service performs intramural economic and social science research the National Agricultural Statistics Service conducts the Census of Agriculture and provides the official current statistics on agricultural production and indicators of the economic and environmental welfare of the farm sector and the National Institute of Food and Agriculture partners with land grant and non-land grant colleges and universities in carrying out extramural research higher education and extension activities
110
RESEARCH EDUCATION AND ECONOMICS
AGRICULTURAL RESEARCH SERVICE (ARS)
Budget Authority (Dollars in Millions)
2009 2010 2011 Program Enacted Estimate Budget
Discretionary New ProductsProduct QualityValue Added $103 $105 $113 Livestock Production 80 81 85 Crop Production 199 208 220 Food Safety 106 108 114 Livestock Protection 75 79 83 Crop Protection 198 204 213 Human Nutrition 79 86 91 Environmental Stewardship 220 228 240
Total Research Programs 1060 1099 1159 National Agricultural Library 23 22 23 Repair and Maintenance of Facilities 17 17 18
Total Ongoing Programs 1100 1138 1200 Earmarked Projects 40 42 0
Total Research and Information Activities 1140 1180 1200 Buildings and Facilities 47 71 0
Total Ongoing Discretionary Programs 1187 1251 1200 Collaborative Research Program 3 0 0
Recovery Act Buildings and Facilities 176 0 0
Total Discretionary Programs 1366 1251 1200 Mandatory Trust Funds 24 24 24
Total ARS $1390 $1275 $1224
ARS conducts research to develop new scientific knowledge transfer technology to the private sector to solve technical agricultural problems of broad scope and high national priority and provide access to scientific data The agency also includes the National Agricultural Library the Nations major information resource in the food agricultural and natural resource sciences
111
RESEARCH EDUCATION AND ECONOMICS
2011 ARS Research Budget Authority Total = $12 Billion
Food Safety and Environmental
Product QualityValue
Added 10
Crops 36
Livestock 14
Nutrition 17
Stewardship 20
All Other 3
The 2011 budget requests approximately $12 billion for ARS research and information funding This is an increase of $20 million over the 2010 enacted level Further approximately $42 million in Congressional earmarks have been redirected to high-priority research initiatives including the following
New ProductsProduct QualityValue Added ARS research enhances the economic viability and competitiveness of US agriculture by (1) maintaining the quality of harvested agricultural commodities or enhancing their marketability and (2) expanding domestic and global market opportunities through the development of value-added food and non-food products and processes The 2011 budget provides an increase of $10 million for the establishment of Regional Biofuels Feedstocks Research and Demonstration Centers These five Centers will be managed by ARS and will coordinate efforts for research conducted by other agencies and departments to accelerate the development and deployment of dedicated energy feedstocks including perennial grasses and sustainable feedstock production systems for advanced biofuels suited for best participation within different regions across the nation
Livestock Production ARS conducts research that develops biotechnological methods to use animal germplasm and associated genetic and genomic repositories and databases to ensure an abundant and safe food supply Research also provides the knowledge to assess farm animal well-being reduce animal stress increase animal health and improve the international competitiveness and sustainability of US aquaculture The 2011 budget includes an increase of $3 million for research on breeding and germplasm improvement to enhance food production and security ARS will harness the expanding body of genomic information on beef and dairy cattle swine and trout to improve feed and production efficiency and animal health Information on the relationships between health nutrients growth and feed efficiency can be used to reduce inputs to animal production and optimize animal health and animal product quality characteristics The proposed research will have a wide range of applications including the selection of animals with improved growth efficiency and disease resistance and
112
RESEARCH EDUCATION AND ECONOMICS
the development of genetic-based performance prediction The 2011 budget also includes an increase of $2 million for genomic sequencing to characterize important traits for food animal production and fund research to identify genes that will improve the health growth and productivity of food animals Addressing animal health and feed efficiency is the key to meeting the demands of the growing population and preventing world hunger
Crop Production ARS safeguards and utilizes plant microbial and insect germplasm associated genetic and genomic databases and bioinformatic tools to ensure an abundant high quality safe and inexpensive supply of food feed fiber ornamentals and industrial products To further these goals the 2011 budget provides an increase of $43 million for crop breeding to enhance food production and security The proposed research will expand ARSrsquo capacity to improve genetic resources and cultivars for the benefit of US producers seed companies processors and consumers As a result the research will lead to improved germplasm and varieties with higher yields improved disease and pest resistance and resilience to weather extremes such as high temperature and drought The budget additionally includes an increase of $37 million for ARS to expand activities to identify acquire and secure unprotected genetic resources of plants insects and crop and veterinary associated microbes A broad spectrum of genetic diversity in the form of viable and well documented germplasm will be conserved Vulnerable or threatened genetic resources vital to national security will be safely stored and backed-up in secure facilities The 2011 budget proposes an additional $08 million to specifically address the need to protect the worldrsquos grain supply through grain disease research and conservation Preventing grain disease losses is critical in meeting the demands of a growing population The budget also includes an increase $08 million to support the activities of the World Food Prize Foundation which annually recognizes those who have advanced human development by improving the quantity quality or availability of the worldrsquos food supply
The budget provides an additional $1 million for developing local food systems for the urban Eastern Seaboard Region New research will assess the capacity to produce food locally that will meet the needs of a large urban population by examining the constraints imposed by environmental economic social and geographic factors This information will be used to assess local food production potential and economic viability and supports the Departmentrsquos Know Your Farmer Know Your Food Initiative Finally an increase of $05 million is proposed for research to determine the role of pathogens and other stress factors in Colony Collapse Disorder of honey bees and how to mitigate their effects
Food Safety ARS research helps to ensure that the food supply is safe for consumers and that food and feed meet foreign and domestic regulatory requirements This research also focuses on the reduction of the hazards of both introduced and naturally occurring toxins in foods and feed including pathogenic bacteria viruses parasites chemical contaminants mycotoxins and naturally occurring toxins produced by plants The 2011 budget includes an additional $5 million to enhance research to safeguard the Nationrsquos food supply from foodborne pathogens by developing and validating management practices to prevent pre-harvest pathogen contamination of produce and post-harvest strategies to eliminate pathogen contamination Research will also develop and validate detection and sensing technologies for pathogens toxins and chemical residues
113
RESEARCH EDUCATION AND ECONOMICS
Livestock Protection ARS conducts research to reduce economic losses from infectious genetic and metabolic diseases of livestock and poultry and to eliminate the losses to animal production and products caused by arthropod diseases and arthropod borne trauma This research also reduces the risk to humans from arthropod borne zoonotic diseases and enhances the safety of animal products The budget includes an increase of $3 million for improved animal protection to enhance food production and security Research will focus on the development of preventive measures to combat priority infectious diseases of livestock and poultry Specific projects include the development of new measures to control bovine tuberculosis and bovine respiratory diseases Furthermore diagnostics vaccines and biotherapeutics designed to convey disease resistance in genetically-defined animal populations will be produced As a result of this research catastrophic losses from new and emerging diseases will be avoided
Crop Protection ARS provides the knowledge to reduce losses caused by plant diseases by defining practices that are effective and affordable and that maintain environmental quality Research also provides the technology to manage pest populations below economic damage thresholds by the integration of environmentally compatible strategies that are based on an increased understanding of the pestrsquos biology and ecology The 2011 budget includes an increase of $48 million for crop protection research to expand grain crop germplasm collection enhancement and breeding programs Specific projects will focus on improving citrus germplasm to protect from citrus greening breeding oats wheat and barley to be resistant to Ug99 and other cereal rusts and breed legume germplasm with enhanced disease and pest protection Breeding and disease protection research will increase the production capacity of perennial grains and optimize perennial grain production systems Additionally sustainable agricultural systems will be developed through research on long-term crop rotation trials This research will expand the adoption of sustainable agricultural practices and address a critical aspect of world hunger by avoiding catastrophic losses from new and emerging cereal diseases The budget also includes an increase of $33 million for research on the Departmentrsquos scientific collections USDA has principal responsibility for safeguarding the Nationrsquos insect systematics collections which are needed for developing pest management strategies identifying new pollinators and the testing of natural enemies needed for biological control of insects and weeds Through this research crops and veterinary animals will be better protected from pests through biological control plant resistance and the development of other management tools
Human Nutrition ARS centers conduct basic and applied research to identify and understand how nutrients and other bioactive food components affect the health of diverse populations including children the elderly pregnant and lactating women and healthy adults The ultimate goal of this food-based agricultural research is to identify foods and diets coupled with genetics and physical activity that will sustain and promote health throughout life The 2011 budget proposes an increase of $64 million for research on childrenrsquos nutrition and health Obesity prevalence among adults and children in the US has tripled in the last 30 years During this time the Dietary Guidelines for Americans (DGA) have been issued by USDA in partnership with the Department of Health and Human Service Despite the DGA forming the basis for Federal food and nutrition policy and the requirement of USDA nutrition assistance programs to provide meals that meet the DGA few Americans have diets that come
114
RESEARCH EDUCATION AND ECONOMICS
close to the recommendations The proposed increase will fund a study to identify barriers and facilitators to following the DGA in multiple locations nationwide in children and adults and in three racial and ethnic groups New methods to motivate behavior change in eating and physical activity will result from this research Finally funds will be used to enhance the nutrition information available through wwwNutritiongov With most nutrition information aimed at adults ARS will significantly increase information about childrenrsquos healthy weight gain during growth and ways by which obesity can be prevented
Environmental Stewardship This broad area of research emphasizes the development of technology and scientific knowledge that will allow producers to manage conserve and protect the Nationrsquos soil water and air resources while optimizing agricultural productivity The 2011 budget proposes an additional $54 million to conduct research that will enhance American agriculturersquos adaptability to a changing global climate ARS will increase the resilience of crops so they can thrive in variable and extreme environments as well as focus on mitigating the effects of climate change by ensuring the availability of water through improved management Research will also develop production systems that will provide a sustainable balance of crop production carbon soil sequestration and net greenhouse gas emissions The budget also proposes an increase of $63 million for research which will develop sustainable agricultural practices through the integration of information and technologies leading to enhanced productivity profitability energy efficiency and natural resource stewardship for American farmers and ranchers New practices will be developed that utilize on-farm resources and natural processes which reduce the need for inputs and reduce production costs and risks The development of these improved agricultural systems will increase the long-term financial viability competitiveness and sustainability of farms and rural communities and increase food and fiber security for the US and the world
National Agricultural Library (NAL) NAL is one of four national libraries in the United States and provides access to scientific agricultural data NAL continues to expand its efforts to provide this information through the Internet thereby increasing the efficiency of its information management and delivery The budget proposes an increase of $15 million for developing information and tools on all facets of sustainable agriculture including information on sustainable and regenerative crop and livestock farming systems ecological pest management renewable energy options for farms direct marketing practices and community food systems organic production certification and marketing and crop and livestock diversification
Buildings and Facilities Repair and Modernization ARS has over 100 research facilities throughout the US and abroad many collocated with other USDA agencies and university partners The budget does not include funding for ARS building and facilities projects but rather provides an increase of $175 million for a review of USDA research facilities to develop a Department-wide capital improvement strategy to guide future investments consistent with priority program goals
115
RESEARCH EDUCATION AND ECONOMICS
NATIONAL INSTITUTE OF FOOD AND AGRICULTURE (NIFA)
Budget Authority (Dollars in Millions)
2009 2010 2011 Program Enacted Estimate Budget
Discretionary Research and Education Activities $691 $792 $839 Extension Activities 474 495 479 Integrated Activities 57 60 25 Native American Endowment Fund Interest 4 4 4
Total Ongoing Discretionary Programshelliphelliphelliphelliphelliphelliphelliphellip 1226 1351 1347 Mandatory Risk Management Education 5 5 5 Native American Endowment Fund 12 12 12 Hispanic-Serving Ag-Colleges Endowment Fund 0 0 10 Farm Bill
Biomass Research and Development 20 28 30 Organic Agriculture Research and Education Initiative 18 20 20 Healthy Urban Enterprise Development Center 1 1 1 Beginning Farmer and Rancher Development Program 18 19 19 Specialty Crop Research Initiative 50 50 50 Biodiesel Fuel Education Program (1) (1) (1) Community Food Projects (5) (5) (5) Total Farm Bill Programs 107 118 120
Total Mandatory Programs 124 135 147 Total NIFA $1350 $1486 $1494
NIFA formerly the Cooperative State Research Education and Extension Service has the primary responsibility for providing linkages between the Federal and State components of a broad-based national agricultural research extension and higher education system NIFA provides funding for projects conducted in partnership with the State Agricultural Experiment Stations the State Cooperative Extension System land grant universities colleges and other research and education institutions Federal funds are distributed to universities and institutions by statutory formula funding competitive awards and grants NIFA is responsible for administering USDAs primary competitive research grants program the Agriculture and Food Research Initiative (AFRI) which supports investigator-initiated research with strong potential to contribute to major breakthroughs in agricultural science
116
RESEARCH EDUCATION AND ECONOMICS
National Institute of Food and Agriculture Budget Authority
(Dollars in Millions) 2009 2010 2011
Program Enacted Estimate Budget Discretionary Formula Grants
Smith-Lever 3 (bampc)helliphelliphelliphelliphelliphelliphelliphelliphelliphelliphelliphelliphelliphelliphelliphelliphellip $289 $298 $298 Hatch Acthelliphelliphelliphelliphelliphelliphelliphelliphelliphelliphelliphelliphelliphelliphelliphelliphelliphelliphelliphelliphellip 207 215 215 1890 Research and Extensionhelliphelliphelliphelliphelliphelliphelliphelliphelliphelliphelliphelliphelliphellip 86 91 91 McIntire-Stennis Cooperative Forestryhelliphelliphelliphelliphelliphelliphelliphelliphelliphellip 28 29 29 Animal Health and Disease Researchhelliphelliphelliphelliphelliphelliphelliphelliphelliphelliphellip 3 3 3 Total Formula Grantshelliphelliphelliphelliphelliphelliphelliphelliphelliphelliphelliphelliphelliphelliphelliphellip 613 636 636
Agriculture and Food Research Initiativehelliphelliphelliphelliphelliphelliphelliphelliphelliphellip 202 262 429 Integrated Activities - Section 406helliphelliphelliphelliphelliphelliphelliphelliphelliphelliphelliphellip 42 45 0 Pest ControlManagement Activitieshelliphelliphelliphelliphelliphelliphelliphelliphelliphelliphellip 26 26 26 Sustainable Agriculture Federal-State Matching Grantshelliphelliphelliphellip 0 0 10 Sustainable Agriculture Research and Extensionhelliphelliphelliphelliphelliphelliphellip 19 19 20 Higher Education Programshelliphelliphelliphelliphelliphelliphelliphelliphelliphelliphelliphelliphelliphelliphellip 40 47 52 Native American Endowment Fund Interesthelliphelliphelliphelliphelliphelliphelliphelliphellip 4 4 4 Federally-Recognized Tribes Extension Programhelliphelliphelliphelliphelliphellip 3 3 5 1890 Facilitieshelliphelliphelliphelliphelliphelliphelliphelliphelliphelliphelliphelliphelliphelliphelliphelliphelliphelliphelliphellip 18 20 20 Extension Services at 1994 Institutionshelliphelliphelliphelliphelliphelliphelliphelliphelliphellip 3 4 5 Expanded Food and Nutrition Education Program (EFNEP)helliphellip 66 68 68 Federal Administrationhelliphelliphelliphelliphelliphelliphelliphelliphelliphelliphelliphelliphelliphelliphelliphelliphellip 17 18 18 Electronic Grants Administration Systemhelliphelliphelliphelliphelliphelliphelliphelliphelliphellip 2 2 5 Regional Diagnostic Networkhelliphelliphelliphelliphelliphelliphelliphelliphelliphelliphelliphelliphelliphellip 10 10 10 Veterinary Medical Services Acthelliphelliphelliphelliphelliphelliphelliphelliphelliphelliphelliphelliphellip 3 5 5 Other Research Extension and Integrated Programshelliphelliphelliphelliphellip 30 37 34
Subtotal Ongoing Discretionaryhelliphelliphelliphelliphelliphelliphelliphelliphelliphelliphelliphellip 1098 1206 1347 Earmarked Projects and Grantshelliphelliphelliphelliphelliphelliphelliphelliphelliphelliphelliphelliphelliphellip 128 141 0 Improved Nutritional Delivery of Food Assistance Grantshelliphelliphellip 0 4 0
Total Discretionary Programshelliphelliphelliphelliphelliphelliphelliphelliphelliphelliphelliphellip 1226 1351 1347 Mandatory Risk Management Education 5 5 5 Native American Endowment Fund 12 12 12 Hispanic-Serving Ag-Colleges Endowment Fund 0 0 10 Farm Bill Programs 107 118 120 Biodiesel Fuel Education Program (1) (1) (1) Community Food Projects (5) (5) (5)
Total NIFA $1350 $1486 $1494
117
RESEARCH EDUCATION AND ECONOMICS
2011 NIFA Budget Authority
$747 800 $731 $731 $704 700
600
500
400
300
200
100
0
Formula Competitive Earmarks
Does not include endowment funds
The 2011 budget requests approximately $135 billion in discretionary funding for NIFA While in total this amount is the same as the 2010 level it reflects a major redirection of funding priorities The Department has greatly increased funding of competitive grants maintained funding for capacity building through formula programs and eliminated $141 million in Congressional earmarks High-priority research initiatives include the following
Agriculture and Food Research Initiative (AFRI) AFRI is the Nationrsquos premier competitive peer-reviewed research program for fundamental and applied sciences in agriculture It is broad in scope with programs ranging from fundamental science to farm management and community issues The 2011 budget proposes a substantial increase in competitive research funding with $4288 million for AFRI an increase of $167 million over 2010 Included in this amount is an increase of $34 million for the Departmentrsquos alternative and renewable energy research initiative to develop high-quality cost-effective feedstocks for biofuel production that do not affect the food supply $50 million for global climate change research to develop mitigation capabilities and adaptive capacities for agricultural production $13 million for international food security to expand research education and extension efforts on plant and animal diseases that threaten public health and agricultural production $20 million for an integrated food safety research program which will improve our understanding of disease-causing microorganisms their products and naturally occurring contaminants in meats poultry seafood and fresh fruits and vegetables and $50 million in nutrition and obesity prevention research
Electronic Grants Administration With increased funding for AFRI a significant rise in the number of applications is anticipated requiring increased efficiency of the grant-making processes and systems Additionally the breadth and types of grants made will increase
$ M
illio
ns
$527 $604
$128 $141
2009 2010 2011
118
RESEARCH EDUCATION AND ECONOMICS
requiring the development of new grant management tools The 2011 budget proposes an increase of $3 million for improved grants management systems which will substantially lower the transaction costs of applying for an AFRI or other NIFA competitive grant while increasing proposal receipt and acceptance speeds and accuracy
Sustainable Agriculture Research and Education (SARE) Program SARE advances agricultural innovations that improve profitability environmental stewardship and quality of life As part of the Departmentrsquos Know Your Farmer Know Your Food Initiative the 2011 budget proposes an increase of $10 million for the creation of a new Federal-State Matching Grant SARE Program to assist in the establishment and enhancement of State sustainable agriculture research education and extension programs The matching requirement will leverage State or private funds and build the capabilities of American agriculture in becoming more productive and sustainable Additionally an increase of $076 million is proposed to support research and extension that will improve soil quality and carbon sequestration save energy and mitigate climate change as well as provide education and training for Cooperative Extension the Natural Resources Conservation Service and other agriculture professionals These program increases will bring total SARE funding to $30 million
Key Performance Measure 2006 2007 2008 2009 2010 2011 The number of farmers and ranchers that gained an economic environmental or quality-of-life benefit from a change in practice learned by participating in a SARE project 9610 10240 10849 11300 11800 12300
Hispanic-Serving Agricultural Colleges and Universities Endowment Fund With the Hispanic community being the fastest growing sector of the American population an investment in the Hispanic-Serving Agricultural Colleges and Universities (HSACU) is needed to ensure that these institutions can effectively compete for NIFA competitive grants Section 7129 of the 2008 Farm Bill authorized the establishment of an endowment fund for HSACU The 2011 budget proposes an increase of $10 million to establish the fund which will lead to significant and measurable advancement of Hispanic and other students in the food and agricultural sciences Funding will come from the annual interest generated by the Endowment
Extension Education on Tribal Lands and at 1994 Institutions The Federally-Recognized Tribes Extension Program supports extension agents who establish programs in agriculture community development families and societal issues facing Native Americans The budget proposes an increase of $23 million to more than double the number of tribes being served by extension and will be used to develop and deploy sustainable production practices Additionally the budget proposes an increase of $1 million for Extension Services at the 1994 Institutions to conduct an Expanded Food and Nutrition Education Program (EFNEP) pilot in a number of Native American communities through a competitive grant process The 1994 Institutions which have demonstrated initial success in providing nutrition education
119
RESEARCH EDUCATION AND ECONOMICS
would partner with 1862 Institutions with a strong EFNEP or other innovative program to provide culturally relevant nutrition education
Formula Funding NIFA provides formula funding for research and extension at 1862 1890 and 1994 land-grant institutions schools of forestry and schools of veterinary medicine The 2011 budget continues to maintain funding for these important capacity building programs at the 2010 enacted level This funding will allow institutions to sustain the matching requirement that by many of these programs have thereby allowing Federal funds to leverage non-Federal resources Programs include Hatch Act and Smith-Lever programs which fund research and extension at 1862 Institutions Evans-Allen 1890 Extension and the 1890 Facilities Grants program which fund agricultural research extension and the acquisition and improvement of facilities equipment and libraries at 1890 institutions including Tuskegee University and West Virginia State University the Tribal Colleges Endowment Fund which distributes the interest earned by an endowment and the Tribal Colleges Education Equity Grants Program which strengthens higher education instruction at the thirty-four 1994 land-grant institutions the McIntire-Stennis Cooperative Forestry Program which funds research on forests and related rangelands at eligible 1862 and 1890 land-grants and institutions offering training in the forestry sciences the Animal Health and Disease Research Program which funds research at accredited colleges of veterinary medicine and State Agricultural Experiment Stations that conduct animal health and disease research and the Expanded Food and Nutrition Education Program carried out by the 1862 and 1890 land-grant institutions to assist low-income individuals in acquiring the knowledge skills and changed-behavior necessary for nutritionally sound diets
1890 Land Grant Institutions The 2011 budget request maintains the historic funding levels for programs supporting 1890 land-grant institutions and includes approximately $91 million for 1890 research and extension formula programs -- $485 million for research and $427 million for extension Additionally the request includes $198 million for 1890 Facilities Grants and $183 million Capacity Building Grants at 1890 Institutions The budget for these programs reflects Administrationrsquos policy to maintain these important programs
Rural Revitalization through Education In support of the Presidentrsquos initiative to make education a national priority the budget proposes a total increase of $5 million for rural education to sustain rural communities This includes an increase of $25 million for the Secondary Education Two-Year Postsecondary Education and Ag in the K-12 Classroom (SPECA) Grants Program and $25 million for the Higher Education Institution Challenge (HEC) Grants Program With SPECA funds NIFA will focus on improving the economic health and viability of rural communities through the development of degree programs emphasizing new and emerging employment opportunities in agriscience and agribusiness fields With HEC funds NIFA will assist academic institutions in rural areas to prepare students for emerging science technology engineering and mathematics (STEM) opportunities
Veterinary Medicine Loan Repayment Program (VMLRP) The 2011 budget maintains funding for the VMLRP at the 2010 enacted level of $48 million The VMLRP will repay the
120
RESEARCH EDUCATION AND ECONOMICS
loans of veterinarians who agree to serve in geographic and veterinary practice areas that have a shortage of food animal veterinarians NIFA published the interim rule for the program on July 9 2009 which established the process and procedures for designating veterinarian shortage situations and administering the VMLRP
121
RESEARCH EDUCATION AND ECONOMICS
ECONOMIC RESEARCH SERVICE (ERS)
Budget Authority (Dollars in Millions)
2009 2010 2011 Program Enacted Estimate Budget
Economic Research Servicehelliphelliphelliphelliphelliphelliphelliphelliphelliphelliphelliphelliphelliphellip $80 $82 $87
ERS provides economic and other social science information and analysis on agriculture food the environment and rural development ERS produces such information and analyses to inform policy and program decisions made across the spectrum of USDA missions and supplies them in outlets that are also accessible to USDA stakeholders and the general public The 2011 budget requests approximately $87 million in program funding an increase of $8 million in program initiatives which is offset by $3 million in terminations of low-priority programs
Community Access to Local Foods The availability of fresh healthy local foods depends to a large extent on the local food environment and community characteristics Food choices are critically important to health outcomes and these choices are shaped or significantly influenced by these factors Therefore the budget proposes an increase of $2 million which supports the Departmentrsquos Know Your Farmer Know Your Food initiative to develop data and conduct economic research on the access to affordable and nutritious local foods in low-income communities With USDA playing a key role in developing policies that address diet and health this initiative will lead to a better understanding of how the Department can better support sustainable and healthy communities
Data Improvement As part of a government-wide data improvement program the 2011 budget includes an increase of $4 million to strengthen the Departmentrsquos statistical protocols and tools This includes a $2 million initiative to establish a structure among statistical agencies headed by ERS to improve data access develop tools for data processing and increase the utility of Federal data The 2011 budget also includes an increase of $2 million for an administrative data pilot project Administrative data information collected in conjunction with administering government programs provide an opportunity for increasing the statistical ability to understand and address critical policy issues The goal of this initial project will be (1) to understand how nutrition assistance and other government programs work together to provide a social safety net and (2) how nutrition assistance and health care policy work together to improve dietary and health outcomes
Data Integrity and Confidentiality As part of the Administrationrsquos expense cutting measures USDA will consolidate seven existing leases ERS will physically relocate from its current location as part of this move To maintain the integrity and confidentiality of its data at secure sites the budget proposes an increase of approximately $1 million for storage and security at separate locations with the ability to control and monitor access
122
RESEARCH EDUCATION AND ECONOMICS
NATIONAL AGRICULTURAL STATISTICS SERVICE (NASS)
Budget Authority (Dollars in Millions)
2009 2010 2011 Program Enacted Estimate Budget
Discretionary Agricultural Estimates $115 $124 $132 Census of Agriculture 37 38 33
Total Discretionary Programs $152 $162 $165
The mission of NASS is to provide timely accurate and useful statistics in service to US agriculture NASS statistics provide the information necessary to keep agricultural markets stable and efficient and to help maintain a consistency for all users of agricultural statistics The 2011 budget requests approximately $164 million in program funding This includes an increase of $63 million in initiatives which is offset by $51 million in terminations of low-priority programs which includes eliminating a land tenure survey that duplicates work being conducted under the Agricultural Resource Management Survey
County Estimates Program The agricultural estimation program provides a comprehensive set of unbiased data covering most agricultural commodities as well as economic environmental and rural demographic data As part of this program NASS has produced county-level statistics for selected commodities that impact billions of dollars of government payments The budget includes an increase of $5 million to improve the data quality of the County Estimates program which is used within the Department to administer crop insurance programs that provide US farmers a safety net ensuring protection against unstable growing conditions as well as crop revenue support programs emergency assistance payments and the Conservation Reserve Program
Climate Change Also within the agricultural estimation program an increase of $08 million is proposed that will allow NASS to enhance its remote sensing activities NASS continues to utilize advanced technologies to monitor agricultural acreage and production This initiative is proposed to increase the number of States in which cropland data is collected and provide NASS the ability to collect additional data on crop conditions as well as fill an important informational gap on soil moisture conditions and drought monitoring
Organic Agriculture Study Also within the agricultural estimation program an increase of $05 million is proposed that will allow NASS to develop an ongoing data series on organic production handling and distribution With this information USDA and others will be able to monitor the financial health and continued growth and evolution of this important sector
Census of Agriculture The 2011 budget includes funding to support the second year of the 2012 Census of Agriculturersquos five year cycle The Census of Agriculture provides comprehensive data on the agricultural economy with national State and county level details The census data are relied upon to measure trends and new developments in the agricultural sector
123
OFFICE OF THE SECRETARY
Budget Authority (Dollars in Millions)
2009 2010 2011 Program Enacted Estimate Budget
Discretionary Office of the Secretaryhelliphelliphelliphelliphelliphelliphelliphelliphelliphelliphelliphelliphelliphelliphellip $15 $19 $20 Healthy Food Financing Initiativehelliphelliphelliphelliphelliphelliphelliphelliphelliphelliphellip 0 0 35 Mandatory Trust Fundshelliphelliphelliphelliphelliphelliphelliphelliphelliphelliphelliphelliphelliphelliphelliphelliphelliphelliphelliphellip 1 1 1 Total OSEChelliphelliphelliphelliphelliphelliphelliphelliphelliphelliphelliphelliphelliphelliphelliphelliphelliphelliphelliphellip $16 $20 $56
OFFICE OF THE SECRETARY
The Office of the Secretary (OSEC) assisted by the Deputy Secretary the Subcabinet and members of their immediate staffs directs and coordinates the work of the Department This involves providing policy direction for all areas of the Department and maintaining liaisons with the Executive Office of the President members of Congress and the public The 2011 budget requests $20 million for OSEC to fund on-going policy leadership tribal consultation and cross-cutting trade and biotechnology activities Of this amount there is an increase of $2 million for the Office of Ecosystem Services and Markets within the Office of the Under Secretary for Natural Resources and Environment to coordinate USDA involvement in the development of market opportunities for services provided by American agriculture such as carbon sequestration and water conservation
Healthy Food Financing Initiative provides funding for a new multi-year Healthy Food Financing Initiative (HFFI) that will increase the availability of affordable healthy foods in underserved urban and rural communities particularly through the development or equipping of grocery stores and other healthy food retailers To support this initiative the Departments of Agriculture Health and Human Services and Treasury have partnered to make available over $400 million in financial and technical assistance to community development financial institutions other nonprofits public agencies and businesses with sound strategies for addressing the healthy food needs of communities These organizations will use Federal grants below-market rate loans loan guarantees and tax credits to attract private sector capital for an even greater investment in projects that increase access to fresh produce and other healthy foods The goal is to substantially reduce the number of food deserts in our nation over the next several years
Food deserts are communities in which residents do not have access to affordable and healthy food options Instead of supermarkets and grocery stores these communities are typically served by fast food restaurants and convenience stores that offer little if any healthy options This lack of access contributes to a poor diet and can lead to higher levels of obesity and other diet-related diseases such as diabetes and heart disease Most often these communities are economically distressed and less attractive under conventional financing to retailers of healthy food But effective local programs have shown that well-targeted financing and technical assistance can
124
OFFICE OF THE SECRETARY
create viable business outcomes and access to healthier food options Targeting federal financial assistance to these areas will not only increase the supply of healthy foods and create new markets for farmers but also create jobs and support broader development efforts to revitalize distressed communities
The 2011 budget requests an additional $35 million for financial and technical assistance including assistance made through the Intermediary Relending Program of the Rural Development mission area In addition $15 million would be reserved from specified accounts in the Rural Development and Marketing and Regulatory Program mission areas to provide additional support for the initiative Not more than 10 percent of the available funding for any one program would be subject to the reserve Through the initiative funds will be made available from a number of loan grant promotion and other programs to provide financial and technical assistance to support market planning and promotion efforts as well as infrastructure and operational improvements designed to stimulate consumer demand enhance marketing expand demand and retail outlets for farm products and increase availability of locally and regionally produced foods
125
DEPARTMENTAL ACTIVITIES
DEPARTMENTAL MANAGEMENT
Budget Authority (Dollars in Millions)
2009 2010 2011 Program Enacted Estimate Budget
Discretionary Office of Advocacy and Outreachhelliphelliphelliphelliphelliphelliphelliphelliphelliphelliphellip 0 $2 $7 Assistant SecretaryOffice of Civil Rightshelliphelliphelliphelliphelliphelliphelliphellip $22 24 25 Office of the Chief Financial Officerhelliphelliphelliphelliphelliphelliphelliphelliphelliphellip 6 7 7 Office of Budget and Program Analysishelliphelliphelliphelliphelliphelliphelliphelliphellip 9 9 9 Office of the Chief Information Officerhelliphelliphelliphelliphelliphelliphelliphelliphellip 18 62 64 Departmental Administrationhelliphelliphelliphelliphelliphelliphelliphelliphelliphelliphelliphelliphellip 27 28 31 Contracting and Acquisition Workforce Traininghelliphelliphelliphellip 0 0 6 Provincial Reconstruction Teamshelliphelliphelliphelliphelliphelliphelliphelliphelliphelliphellip 0 13 a Office of Homeland Securityhelliphelliphelliphelliphelliphelliphelliphelliphelliphelliphelliphellip 1 2 2 Agriculture Buildings and Facilitieshelliphelliphelliphelliphelliphelliphelliphelliphelliphellip 244 293 278 Hazardous Materials Managementhelliphelliphelliphelliphelliphelliphelliphelliphelliphelliphellip 5 5 5 Total Ongoing Discretionary Programshelliphelliphelliphelliphelliphelliphelliphellip 332 445 434 Recovery Act Agriculture Buildings and Facilitieshelliphelliphelliphelliphelliphelliphelliphelliphelliphellip 24 0 0 Total Discretionary Programshelliphelliphelliphelliphelliphelliphelliphelliphelliphelliphellip 356 445 434 Mandatory Farm Bill Biobased Markets Programhelliphelliphelliphelliphelliphelliphelliphelliphelliphelliphelliphelliphellip 2 2 2 Outreach for Socially Disadvantaged Farmers bhelliphelliphelliphelliphellip 15 20 20 Total Farm Bill Programshelliphelliphelliphelliphelliphelliphelliphelliphelliphelliphelliphelliphelliphellip 17 22 22 Total Departmental Managementhelliphelliphelliphelliphelliphelliphelliphelliphelliphellip $373 $467 $456
a Funded within the Foreign Agricultural Service b This program was administered by the National Institute of Food and Agriculture (NIFA) in 2009 at $15 million and transferred to the Office of Advocacy and Outreach in 2010
Departmental Management (DM) is responsible for providing coordination of all administrative functions and support for policy activities of the Department DM is leading the Departmentrsquos implementation of Management Initiatives to
bull Transform USDA into a model Federal agency for effective program delivery by enhancing leadership encouraging employee inclusion and focusing on improving customer and employee satisfaction
126
DEPARTMENTAL ACTIVITIES
bull Provide civil rights leadership to USDA employees applicants and customers by increasing the use of an early resolution process a form of alternative dispute resolution for civil rights and equal employment opportunity complaints reducing the inventory of program civil rights complaints and analyzing field operations for systemic improvements
bull Coordinate outreach efforts to increase access to USDA programs and services among women and minority farmers
bull Use resources more effectively by incorporating into the Departmentrsquos current management practices new strategies and policies that increase performance and encourage efficiency and alignment of activities to the Departmentrsquos strategic goals
bull Implement modern information technology systems and policies in a cost effective manner that improve program delivery along with internal and external communications capabilities to better serve USDA constituents
bull Maximize USDA ldquogreenrdquo operations by increasing the use of bio-preferred products and alternative energy increasing recycling and decreasing water and energy usage at USDA facilities
bull Improve Departmental emergency preparedness and security measures to protect USDA employees and the public to ensure the continued delivery of USDA products and services
bull Enhance human resources policies and practices to develop a USDA workforce that is more representative of the National population and has the necessary skills to ensure the continued and improved delivery of services by the Department
The 2011 budget proposes funding to maintain the staffing levels necessary to lead implementation of these initiatives and provide adequate service delivery by Departmental Management while addressing key policy issues related to outreach human resources procurement system improvements financial management and information technology security and capital investment These efforts are critical to making the Department an efficient effective and discrimination-free organization that delivers the best return on taxpayersrsquo investments
The Office of Advocacy and Outreach (OAO) was established by the 2008 Farm Bill to increase the accessibility of USDA programs to underserved constituents OAO activities include overseeing the Advisory Committees on Minority Farmers and Beginning Farmers and Ranchers administering the Outreach to Socially Disadvantaged Farmers Grant Program (section 2501 Program) overseeing the activities of the Office of Small Farms Coordination and the Farm Worker Coordinator managing the 1994 1890 and Hispanic Serving Institutions (HSI) Programs and coordinatingconducting other outreach functions The 2011 budget requests $7 million for OAO to carry out these responsibilities and the provisions of the Farm Bill related to outreach to beginning small and socially disadvantaged farmers ranchers and rural communities Of this amount $4 million is requested for agricultural labor grants authorized under section 14204 of the 2008 Farm Bill This program was funded through Rural
127
DEPARTMENTAL ACTIVITIES
Development in 2010 at the same level OAO will operate this program in 2011 to assist agricultural employers and farm workers by improving the supply stability safety and training of the agricultural labor force In addition to the requested funding OAO will receive $20 million provided by the 2008 Farm Bill for the 2501 Grants Program and an estimated $6 million in reimbursements for programs previously managed by the Office of Civil Rights (1890 and 1994 Programs) and the Agricultural Research Service (HSI Program)
The Assistant Secretary for Civil Rights and the Office of Civil Rights (OCR) provide policy guidance leadership coordination and training and complaint prevention and processing for the Department and the agencies OCRrsquos mission is to facilitate the fair and equitable treatment of USDA customers and employees and ensure the delivery and enforcement of civil rights programs and activities Through its efforts OCR strives to 1) foster a positive civil rights climate at USDA 2) process Equal Employment Opportunity (EEO) and program complaints in a timely efficient and cost effective manner 3) reduce and prevent EEO and program complaints through training and guidance and 4) offer alternative dispute resolution services The 2011 budget requests $24 million for OCR to meet the Administrationrsquos commitment to improving USDArsquos handling of civil rights matters An additional $09 million is requested to reflect the transfer of the Office of the Assistant Secretary for Civil Rights to Departmental Management from the Office of the Secretary
The Office of the Chief Financial Officer (OCFO) provides overall direction and leadership in the development of financial management policies and systems and produces the Departmentrsquos consolidated financial statements and Strategic Plan OCFO also oversees the provision of administrative accounting payroll and related systems for USDA and other agencies through operation of the National Finance Center The 2011 budget requests $7 million for OCFO to continue its leadership and oversight of the Departmentrsquos financial management process and implementation of the Federal Funding Accountability and Transparency Act the Improper Payments Information Act and Departmental travel and debarment and suspension policies
The Office of Budget and Program Analysis (OBPA) provides analyses and information to the Secretary and other senior policy officials to support informed decision-making regarding the Departmentrsquos programs and policies and budget legislative and regulatory actions OBPA also serves the key functions of providing information to the Office of Management and Budget and the Appropriations Committees related to the USDA budget and coordinating the Departmentrsquos implementation of the Farm Bill including providing relevant implementation and mandatory spending information to the Authorizing Committees The 2011 budget requests $9 million for OBPA for the continued delivery of analyses and support provided to USDA policy officials
The Office of the Chief Information Officer (OCIO) provides policy guidance leadership and coordination for the Departments information management technology investment and cyber security activities in support of USDA program delivery The 2011 budget requests $64 million for OCIO to fund on-going activities including efforts to improve the Departmentrsquos cyber security posture This request includes an increase of $2 million to expand a Department-wide cyber security initiative to address deficiencies in the USDA network and IT systems Through this initiative OCIO conducts network security assessments to identify system vulnerabilities and operates a Security Operations Center that provides continuous cyber security
128
DEPARTMENTAL ACTIVITIES
monitoring of the Departmentrsquos network Through the continued implementation of the initiative the Department will address critical vulnerabilities while establishing a multi-layer cyber security structure
Departmental Administration (DA) provides overall direction leadership and coordination for the Departmentrsquos management of human resources ethics property procurement facilities management small and disadvantaged business utilization programs and the regulatory hearing and administrative proceedings conducted by the Administrative Law Judges and the Judicial Officer The 2011 budget requests $31 million for DA including a $17 million increase to implement a human resources initiative in USDA that will build the capabilities of the Departmentrsquos workforce through leadership development and veteran hiring In addition the budget requests a decrease in DA of $13 million to reflect the transfer of the agriculture reconstruction and stabilization activities in Afghanistan and Iraq to FAS As these efforts support implementation of Presidential strategies by providing technical experts who serve as advisors to key government ministries and serve on civilian-military command units including Provincial Reconstruction Teams these international activities are best managed through FAS
DA also manages the BioPreferred Program as authorized in section 9002 of the Farm Bill as amended by the 2008 Farm Bill As part of this program DA is developing a USDA Certified Biobased Label that will allow manufacturers and vendors of qualifying biobased products market their products utilizing the label In support of the programrsquos implementation the budget requests $03 million to ensure the integrity and enforce compliance with the USDA Certified Biobased Labeling Program This funding will be used to establish an audit program through which DA can monitor the use of the biobased label in the market to ensure that vendors and manufacturers of biobased products are utilizing the label in accordance with program regulations In addition to the funding request USDA is also seeking legislative authority to assess monetary penalties for violations of the Biobased Labeling regulations to further ensure the programrsquos integrity and public trust in the label
In addition the 2011 budget requests $65 million to support a Government-wide Contracting and Acquisition Workforce Training initiative The requested funding will allow USDA to implement training recruitment and retention activities for the Departmentrsquos procurement workforce that is responsible for over $5 billion in annual procurement for the Department These workforce efforts along with procurement system improvements will allow USDA to achieve substantial cost savings and avoidances in the contracting and acquisition activities across all agencies
The Office of Homeland Security (OHS) provides a central homeland security oversight and assistance capability within USDA OHS is responsible for providing oversight and coordination of the Departmentrsquos preparation and response to matters of homeland security importance In addition OHS is responsible for providing the protective services for the Secretary and Deputy Secretary of Agriculture The 2011 budget requests $2 million for OHS to continue its leadership and coordination of Departmental security matters to ensure that USDA is prepared for potential threats or emergency situations
129
DEPARTMENTAL ACTIVITIES
The request for Agriculture Buildings and Facilities (Ag BampF) and Rental Payments for 2011 is $278 million The account provides funding for the rental payments to the General Services Administration (GSA) and security services payments to the Department of Homeland Security (DHS) This account is also responsible for all maintenance utilities and administration of the more than 25 million square feet in the two USDA headquarters buildings The 2011 budget includes $179 million for payments to GSA for rent and $14 million to DHS for building security The budget requests an increase of $14 million for a total of $28 million in 2011 to continue modernization of the Departmentrsquos South Building As the building houses over 5800 USDA employees it is critical that the facility be renovated to eliminate environmental hazards and to reduce overall energy consumption The renovation project will preserve and restore the historic features of the building replace antiquated heating and cooling systems plumbing and electrical systems eliminate environmental hazards such as asbestos and lead paint provide accommodations for persons with disabilities and create modern and efficient office space The 2011 budget also requests authority to use prior year unobligated balances to pay deficiencies incurred between 2004 and 2008
In addition the budget also proposes an increase of $04 million to implement provisions of the Departmentrsquos Employee Satisfaction and Wellness Program This funding will allow USDA to improve offerings to employees related to healthy eating options and physical fitness USDA employees and the over 100000 annual visitors to the South Building cafeteria would be educated on the importance of farmers and origins of the food being served while employees would benefit from improved fitness equipment and class offerings in the fitness center
The Hazardous Materials Management (HMM) Program provides for the efficient management and cleanup of hazardous materials on facilities and lands under the jurisdiction custody and control of the Department and the prevention of releases of hazardous substances from USDA facilities The 2011 budget requests $5 million for the HMM program to conduct cleanup and remediation activities to seek repayment from polluters for hazardous materials cleanup responsibilities and to assist the Department in meeting Federal environmental laws
130
DEPARTMENTAL ACTIVITIES
DEPARTMENTAL STAFF OFFICES
Budget Authority (Dollars in Millions)
2009 2010 2011 Program Enacted Estimate Budget
Discretionary Office of the Chief Economisthelliphelliphelliphelliphelliphelliphelliphelliphelliphelliphelliphellip $11 $13 $13 National Appeals Divisionhelliphelliphelliphelliphelliphelliphelliphelliphelliphelliphelliphelliphelliphellip 15 15 15 Office of Communicationshelliphelliphelliphelliphelliphelliphelliphelliphelliphelliphelliphelliphelliphellip 10 10 10 Office of the General Counselhelliphelliphelliphelliphelliphelliphelliphelliphelliphelliphelliphellip 42 44 46 Total Discretionary Programshelliphelliphelliphelliphelliphelliphelliphelliphelliphelliphellip 78 82 84 Mandatory Farm Bill Biodiesel Fuel Education Programhelliphelliphelliphelliphelliphelliphelliphelliphelliphellip 1 1 1
Total Mandatory Programshelliphelliphelliphelliphelliphelliphelliphelliphelliphelliphelliphellip 1 1 1
Total Departmental Staff Officeshelliphelliphelliphelliphelliphelliphelliphelliphelliphellip $79 $83 $85
The Departmental Staff Offices provide legal and economic support and communications coordination for the Departmentrsquos program activities These offices are vital to USDArsquos success in creating opportunities for Americarsquos farmers ranchers and rural communities by providing economic analyses and legal counsel to the Departmentrsquos policy officials and decision makers The 2011 budget proposes funding to ensure that these offices maintain the staffing levels needed to provide leadership oversight and coordination
The Office of the Chief Economist (OCE) advises the Secretary and Department officials on the economic implications of Department policies programs and proposed legislation and serves as the focal point for the Departmentrsquos economic intelligence analysis and review related to domestic and international food and agriculture markets OCE also provides advice and analysis on bioenergy new uses of agricultural products sustainable development agricultural labor and global climate change The 2011 budget requests $13 million for OCE to continue its support of USDA policy officials and the dissemination of agricultural economic information
The National Appeals Division (NAD) conducts evidentiary administrative appeal hearings and reviews arising from program operations of the Rural Development mission area the Farm Service Agency the Risk Management Agency and the Natural Resources Conservation Service The 2011 budget requests $15 million for NAD to continue activities to increase the fairness of program delivery by the Service Center Agencies
The Departmentrsquos Office of Communications (OC) provides leadership and coordination for the development of communication strategies for the Department and plays a critical role in disseminating information about USDArsquos programs to the general public The 2011 budget
131
DEPARTMENTAL ACTIVITIES
requests $10 million for OC to continue to develop effective communications strategies that make USDA programs and operations more open and transparent to the public
The Office of the General Counsel (OGC) provides legal oversight counsel and support to the Departmentrsquos agencies The 2011 budget requests $46 million for OGC including an increase of $15 million to ensure that OGC has the resources to conduct necessary training and travel and other activities for which funding has been reduced in recent years to cover salary expenses This funding will be used to maintain and improve OGC service delivery to the entire Department
132
OFFICE OF INSPECTOR GENERAL
OFFICE OF INSPECTOR GENERAL
Budget Authority (Dollars in Millions)
2009 2010 2011 Program Enacted Estimate Budget
Discretionary Ongoing Appropriationshelliphelliphelliphelliphelliphelliphelliphelliphelliphelliphelliphelliphelliphelliphellip $86 $89 $90 Recovery Act Fundinghelliphelliphelliphelliphelliphelliphelliphelliphelliphelliphelliphelliphelliphelliphellip 22 0 0 Total Office of Inspector Generalhelliphelliphelliphelliphelliphelliphelliphelliphelliphellip $108 $89 $90
The Office of Inspector General (OIG) conducts and supervises audits to prevent and detect fraud waste and abuse and to improve the effectiveness of USDA programs and operations As the law enforcement arm of USDA OIG also investigates criminal activity involving the Departmentrsquos programs and personnel The 2011 budget requests $90 million for OIG for audit and investigation review of the Departmentrsquos programs This funding includes an increase of $04 million to support the Council of Inspectors General for Integrity and Efficiency to coordinate Federal efforts to improve program delivery The Council was established under the authority of the Inspector General Reform Act of 2008 In addition an increase of $02 million is requested for training activities to ensure that OIG effectively meets professional training standards and necessary federal law enforcement requirements
133
APPENDIX
UNITED STATES DEPARTMENT OF AGRICULTURE (Dollars in Millions)
Budget Authority
Change 2009 2010 2011 2010 to
AGENCYPROGRAM Enacted Estimate Budget 2011 FARM AND FOREIGN AGRICULTURAL SERVICES Farm Service Agency Discretionary Programshelliphelliphelliphelliphelliphelliphelliphelliphelliphelliphelliphelliphelliphelliphelliphelliphelliphelliphelliphelliphelliphellip $1645 $2082 $1846 -$236 Mandatory Programs (excluding CCC)helliphelliphelliphelliphelliphelliphelliphelliphelliphelliphelliphelliphelliphelliphelliphellip 704 527 892 365
Recovery Acthelliphelliphelliphelliphelliphelliphelliphelliphelliphelliphelliphelliphelliphelliphelliphelliphelliphelliphelliphelliphelliphelliphelliphelliphelliphellip 120 230 0 -230 Other Supplementalshelliphelliphelliphelliphelliphelliphelliphelliphelliphelliphelliphelliphelliphelliphelliphelliphelliphelliphelliphelliphelliphelliphellip 71 0 0 0 Commodity Credit Corporation Programs (mandatory)helliphelliphelliphelliphelliphelliphelliphelliphelliphellip 13061 11819 11482 -337 Total Farm Service Agencyhelliphelliphelliphelliphelliphelliphelliphelliphelliphelliphelliphelliphelliphelliphelliphelliphelliphelliphelliphellip 15601 14658 14220 -438
Risk Management Agency Discretionary Programshelliphelliphelliphelliphelliphelliphelliphelliphelliphelliphelliphelliphelliphelliphelliphelliphelliphelliphelliphelliphelliphellip 77 80 83 3 Mandatory Programshelliphelliphelliphelliphelliphelliphelliphelliphelliphelliphelliphelliphelliphelliphelliphelliphelliphelliphelliphelliphelliphelliphellip 6767 6455 7613 1158 Total Risk Management Agencyhelliphelliphelliphelliphelliphelliphelliphelliphelliphelliphelliphelliphelliphelliphelliphelliphelliphellip 6844 6535 7696 1161
Foreign Agricultural Service Discretionary Programs (excluding PL 480)helliphelliphelliphelliphelliphelliphelliphelliphelliphelliphelliphelliphelliphellip 265 390 468 78 Mandatory Programshelliphelliphelliphelliphelliphelliphelliphelliphelliphelliphelliphelliphelliphelliphelliphelliphelliphelliphelliphelliphelliphelliphellip 584 439 386 -53 Recovery Acthelliphelliphelliphelliphelliphelliphelliphelliphelliphelliphelliphelliphelliphelliphelliphelliphelliphelliphelliphelliphelliphelliphelliphelliphelliphellip 25 90 22 -68 PL 480 (discretionary)helliphelliphelliphelliphelliphelliphelliphelliphelliphelliphelliphelliphelliphelliphelliphelliphelliphelliphelliphelliphelliphellip 1229 1693 1693 0 PL 480 (supplemental appropriations)helliphelliphelliphelliphelliphelliphelliphelliphelliphelliphelliphelliphelliphelliphelliphellip 1095 0 0 0
Total Foreign Agricultural Servicehelliphelliphelliphelliphelliphelliphelliphelliphelliphelliphelliphelliphelliphelliphelliphelliphellip 3198 2612 2569 -43 Total Farm and Foreign Agricultural Serviceshelliphelliphelliphelliphelliphelliphelliphelliphelliphelliphellip 25644 23805 24485 681
RURAL DEVELOPMENT Rural Utilities Service Discretionary Programshelliphelliphelliphelliphelliphelliphelliphelliphelliphelliphelliphelliphelliphelliphelliphelliphelliphelliphelliphelliphelliphellip 660 694 643 -51 Recovery Acthelliphelliphelliphelliphelliphelliphelliphelliphelliphelliphelliphelliphelliphelliphelliphelliphelliphelliphelliphelliphelliphelliphelliphelliphelliphellip 3804 0 0 0 Total Rural Utilities Servicehelliphelliphelliphelliphelliphelliphelliphelliphelliphelliphelliphelliphelliphelliphelliphelliphelliphelliphelliphellip 4464 694 643 -51
Rural Housing Service Discretionary Programshelliphelliphelliphelliphelliphelliphelliphelliphelliphelliphelliphelliphelliphelliphelliphelliphelliphelliphelliphelliphelliphellip 1754 1893 1705 -188 Recovery Acthelliphelliphelliphelliphelliphelliphelliphelliphelliphelliphelliphelliphelliphelliphelliphelliphelliphelliphelliphelliphelliphelliphelliphelliphelliphellip 320 0 0 0 Total Rural Housing Servicehelliphelliphelliphelliphelliphelliphelliphelliphelliphelliphelliphelliphelliphelliphelliphelliphelliphelliphellip 2074 1893 1705 -188
Rural Business - Cooperative Service Discretionary Programshelliphelliphelliphelliphelliphelliphelliphelliphelliphelliphelliphelliphelliphelliphelliphelliphelliphelliphelliphelliphelliphellip 132 190 205 15 Mandatory Programshelliphelliphelliphelliphelliphelliphelliphelliphelliphelliphelliphelliphelliphelliphelliphelliphelliphelliphelliphelliphelliphelliphellip 239 364 159 -205 Recovery Acthelliphelliphelliphelliphelliphelliphelliphelliphelliphelliphelliphelliphelliphelliphelliphelliphelliphelliphelliphelliphelliphelliphelliphelliphelliphellip 145 0 0 0 Total Rural Business - Cooperative Servicehelliphelliphelliphelliphelliphelliphelliphelliphelliphelliphelliphelliphellip 516 554 364 -190
Rural Development Salaries and Expenses Discretionary Programshelliphelliphelliphelliphelliphelliphelliphelliphelliphelliphelliphelliphelliphelliphelliphelliphelliphelliphelliphelliphelliphellip 193 202 232 30 Recovery Acthelliphelliphelliphelliphelliphelliphelliphelliphelliphelliphelliphelliphelliphelliphelliphelliphelliphelliphelliphelliphelliphelliphelliphelliphelliphellip 131 0 0 0 Total Salaries and Expenseshelliphelliphelliphelliphelliphelliphelliphelliphelliphelliphelliphelliphelliphelliphelliphelliphelliphelliphellip 324 202 232 30
Total Rural Developmenthelliphelliphelliphelliphelliphelliphelliphelliphelliphelliphelliphelliphelliphelliphelliphelliphelliphelliphellip 7378 3343 2944 -399 FOOD NUTRITION AND CONSUMER SERVICES Food and Nutrition Service Discretionary Programshelliphelliphelliphelliphelliphelliphelliphelliphelliphelliphelliphelliphelliphelliphelliphelliphelliphelliphelliphelliphelliphellip 7239 7659 8025 366 Mandatory Programshelliphelliphelliphelliphelliphelliphelliphelliphelliphelliphelliphelliphelliphelliphelliphelliphelliphelliphelliphelliphelliphelliphellip 69065 75335 87656 12321 Recovery Acthelliphelliphelliphelliphelliphelliphelliphelliphelliphelliphelliphelliphelliphelliphelliphelliphelliphelliphelliphelliphelliphelliphelliphelliphelliphellip 5945 10460 11936 1476 Other Supplementalshelliphelliphelliphelliphelliphelliphelliphelliphelliphelliphelliphelliphelliphelliphelliphelliphelliphelliphelliphelliphelliphelliphellip 0 400 0 -400
Total Food Nutrition and Consumer Serviceshelliphelliphelliphelliphelliphelliphelliphelliphelliphelliphellip 82249 93854 107617 13763 FOOD SAFETY Food Safety and Inspection Service Discretionary Programshelliphelliphelliphelliphelliphelliphelliphelliphelliphelliphelliphelliphelliphelliphelliphelliphelliphelliphelliphelliphelliphellip 972 1019 1037 18 Mandatory Programshelliphelliphelliphelliphelliphelliphelliphelliphelliphelliphelliphelliphelliphelliphelliphelliphelliphelliphelliphelliphelliphelliphellip 11 9 9 0
Total Food Safetyhelliphelliphelliphelliphelliphelliphelliphelliphelliphelliphelliphelliphelliphelliphelliphelliphelliphelliphelliphelliphelliphellip 983 1028 1046 18 NATURAL RESOURCES AND ENVIRONMENT Natural Resources Conservation Service Discretionary Programshelliphelliphelliphelliphelliphelliphelliphelliphelliphelliphelliphelliphelliphelliphelliphelliphelliphelliphelliphelliphelliphellip 968 1009 964 -45 Mandatory Programshelliphelliphelliphelliphelliphelliphelliphelliphelliphelliphelliphelliphelliphelliphelliphelliphelliphelliphelliphelliphelliphelliphellip 2163 2973 3029 56 Recovery Acthelliphelliphelliphelliphelliphelliphelliphelliphelliphelliphelliphelliphelliphelliphelliphelliphelliphelliphelliphelliphelliphelliphelliphelliphelliphellip 340 0 0 0 Total Natural Resources Conservation Servicehelliphelliphelliphelliphelliphelliphelliphelliphelliphelliphelliphellip 3471 3982 3993 11
134
APPENDIX
UNITED STATES DEPARTMENT OF AGRICULTURE (Dollars in Millions)
Budget Authority Change
2009 2010 2011 2010 to AGENCYPROGRAM Enacted Estimate Budget 2011
Forest Service Discretionary Programshelliphelliphelliphelliphelliphelliphelliphelliphelliphelliphelliphelliphelliphelliphelliphelliphelliphelliphelliphelliphelliphellip 4759 5315 5377 62 Mandatory Programshelliphelliphelliphelliphelliphelliphelliphelliphelliphelliphelliphelliphelliphelliphelliphelliphelliphelliphelliphelliphelliphelliphellip 994 836 768 -68 Recovery Acthelliphelliphelliphelliphelliphelliphelliphelliphelliphelliphelliphelliphelliphelliphelliphelliphelliphelliphelliphelliphelliphelliphelliphelliphelliphellip 1150 0 0 0 Other Supplementalshelliphelliphelliphelliphelliphelliphelliphelliphelliphelliphelliphelliphelliphelliphelliphelliphelliphelliphelliphelliphelliphelliphellip 200 0 0 0 Total Forest Servicehelliphelliphelliphelliphelliphelliphelliphelliphelliphelliphelliphelliphelliphelliphelliphelliphelliphelliphelliphelliphelliphelliphellip 7103 6151 6145 -6
Total Natural Resources and Environmenthelliphelliphelliphelliphelliphelliphelliphelliphelliphelliphelliphellip 10574 10133 10138 5 MARKETING AND REGULATORY PROGRAMS Animal and Plant Health Inspection Service Discretionary Programshelliphelliphelliphelliphelliphelliphelliphelliphelliphelliphelliphelliphelliphelliphelliphelliphelliphelliphelliphelliphelliphellip 881 910 875 -35 Mandatory Programshelliphelliphelliphelliphelliphelliphelliphelliphelliphelliphelliphelliphelliphelliphelliphelliphelliphelliphelliphelliphelliphelliphellip 181 250 259 9 Emergency Funding (CCC)helliphelliphelliphelliphelliphelliphelliphelliphelliphelliphelliphelliphelliphelliphelliphelliphelliphelliphelliphelliphellip 29 28 0 -28 Total Animal and Plant Health Inspection Servicehelliphelliphelliphelliphelliphelliphelliphelliphelliphelliphellip 1091 1188 1134 -54 Agricultural Marketing Service Discretionary Programshelliphelliphelliphelliphelliphelliphelliphelliphelliphelliphelliphelliphelliphelliphelliphelliphelliphelliphelliphelliphelliphellip 89 93 100 7 Mandatory Programshelliphelliphelliphelliphelliphelliphelliphelliphelliphelliphelliphelliphelliphelliphelliphelliphelliphelliphelliphelliphelliphelliphellip 1223 1305 1235 -70 Total Agricultural Marketing Servicehelliphelliphelliphelliphelliphelliphelliphelliphelliphelliphelliphelliphelliphelliphelliphellip 1312 1398 1335 -63 Grain Inspection Packers and Stockyards Administration Discretionary Programshelliphelliphelliphelliphelliphelliphelliphelliphelliphelliphelliphelliphelliphelliphelliphelliphelliphelliphelliphelliphelliphellip 40 42 44 2
Total Marketing and Regulatory Programshelliphelliphelliphelliphelliphelliphelliphelliphelliphelliphelliphellip 2443 2628 2513 -115 RESEARCH EDUCATION AND ECONOMICS Agricultural Research Service Discretionary Programshelliphelliphelliphelliphelliphelliphelliphelliphelliphelliphelliphelliphelliphelliphelliphelliphelliphelliphelliphelliphelliphellip 1190 1251 1200 -51 Mandatory Programshelliphelliphelliphelliphelliphelliphelliphelliphelliphelliphelliphelliphelliphelliphelliphelliphelliphelliphelliphelliphelliphelliphellip 24 24 24 0 Recovery Acthelliphelliphelliphelliphelliphelliphelliphelliphelliphelliphelliphelliphelliphelliphelliphelliphelliphelliphelliphelliphelliphelliphelliphelliphelliphellip 176 0 0 0 Total Agricultural Research Servicehelliphelliphelliphelliphelliphelliphelliphelliphelliphelliphelliphelliphelliphelliphelliphellip 1390 1275 1224 -51 National Institute of Food and Agriculture Discretionary Programshelliphelliphelliphelliphelliphelliphelliphelliphelliphelliphelliphelliphelliphelliphelliphelliphelliphelliphelliphelliphelliphellip 1226 1351 1347 -5 Mandatory Programshelliphelliphelliphelliphelliphelliphelliphelliphelliphelliphelliphelliphelliphelliphelliphelliphelliphelliphelliphelliphelliphelliphellip 124 135 147 12 Total National Institute of Food and Agriculturehelliphelliphelliphelliphelliphelliphelliphelliphelliphelliphelliphellip 1350 1486 1494 7 Economic Research Service Discretionary Programshelliphelliphelliphelliphelliphelliphelliphelliphelliphelliphelliphelliphelliphelliphelliphelliphelliphelliphelliphelliphelliphellip 80 82 87 5 National Agricultural Statistics Service Discretionary Programshelliphelliphelliphelliphelliphelliphelliphelliphelliphelliphelliphelliphelliphelliphelliphelliphelliphelliphelliphelliphelliphellip 152 162 165 3
Total Research Education and Economicshelliphelliphelliphelliphelliphelliphelliphelliphelliphelliphelliphellip 2972 3005 2970 -36 OTHER ACTIVITIES Departmental Activities Discretionary Programshelliphelliphelliphelliphelliphelliphelliphelliphelliphelliphelliphelliphelliphelliphelliphelliphelliphelliphelliphelliphelliphellip 425 546 573 27 Mandatory Programshelliphelliphelliphelliphelliphelliphelliphelliphelliphelliphelliphelliphelliphelliphelliphelliphelliphelliphelliphelliphelliphelliphellip 19 24 24 0 Recovery Acthelliphelliphelliphelliphelliphelliphelliphelliphelliphelliphelliphelliphelliphelliphelliphelliphelliphelliphelliphelliphelliphelliphelliphelliphelliphellip 24 0 0 0 Total Departmental Activitieshelliphelliphelliphelliphelliphelliphelliphelliphelliphelliphelliphelliphelliphelliphelliphelliphelliphelliphellip 468 570 597 27 Office of Inspector General Discretionary Programshelliphelliphelliphelliphelliphelliphelliphelliphelliphelliphelliphelliphelliphelliphelliphelliphelliphelliphelliphelliphelliphellip 86 89 90 1 Recovery Acthelliphelliphelliphelliphelliphelliphelliphelliphelliphelliphelliphelliphelliphelliphelliphelliphelliphelliphelliphelliphelliphelliphelliphelliphelliphellip 22 0 0 0 Total Office of Inspector Generalhelliphelliphelliphelliphelliphelliphelliphelliphelliphelliphelliphelliphelliphelliphelliphelliphellip 108 89 90 1
Total Departmental Activitieshelliphelliphelliphelliphelliphelliphelliphelliphelliphelliphelliphelliphelliphelliphelliphelliphellip 576 659 687 28
USDA SUB-TOTALhelliphelliphelliphelliphelliphelliphelliphelliphelliphelliphelliphelliphelliphelliphelliphelliphelliphelliphelliphelliphelliphellip $132819 $138455 $152400 $13945 Offsetting Receiptshelliphelliphelliphelliphelliphelliphelliphelliphelliphelliphelliphelliphelliphelliphelliphelliphelliphelliphelliphelliphelliphelliphelliphellip -4993 -2936 -3795 -859 USDA TOTALhelliphelliphelliphelliphelliphelliphelliphelliphelliphelliphelliphelliphelliphelliphelliphelliphelliphelliphelliphelliphelliphelliphelliphelliphelliphellip $127826 $135519 $148605 $13086
135
APPENDIX
UNITED STATES DEPARTMENT OF AGRICULTURE (Dollars in Millions)
Program Level
Change 2009 2010 2011 2010 to
AGENCYPROGRAM Enacted Estimate Budget 2011
FARM AND FOREIGN AGRICULTURAL SERVICES Farm Service Agency Farm Loan and Grant Programshelliphelliphelliphelliphelliphelliphelliphelliphelliphelliphelliphelliphelliphelliphellip $4551 $5140 $4797 -$343 Conservation and Other Programshelliphelliphelliphelliphelliphelliphelliphelliphelliphelliphelliphelliphelliphellip 2282 2359 2154 -205 Disaster Assistancehelliphelliphelliphelliphelliphelliphelliphelliphelliphelliphelliphelliphelliphelliphelliphelliphelliphelliphelliphellip 703 526 891 365 Commodity Programshelliphelliphelliphelliphelliphelliphelliphelliphelliphelliphelliphelliphelliphelliphelliphelliphelliphelliphellip 17679 18458 18315 -143 Commodity Credit Corporation Programshelliphelliphelliphelliphelliphelliphelliphelliphelliphelliphellip (25453) (26437) (26255) (-182) Salaries and Expenseshelliphelliphelliphelliphelliphelliphelliphelliphelliphelliphelliphelliphelliphelliphelliphelliphelliphelliphellip 1483 1570 1686 116 Total Farm Service Agencyhelliphelliphelliphelliphelliphelliphelliphelliphelliphelliphelliphelliphelliphelliphelliphellip 26699 28053 27843 -211
Risk Management Agency Administrative and Operating Expenseshelliphelliphelliphelliphelliphelliphelliphelliphelliphelliphelliphellip 77 80 83 3 Crop Insurance Fundhelliphelliphelliphelliphelliphelliphelliphelliphelliphelliphelliphelliphelliphelliphelliphelliphelliphelliphellip 7998 9556 11373 1817 Total Risk Management Agencyhelliphelliphelliphelliphelliphelliphelliphelliphelliphelliphelliphelliphelliphellip 8075 9636 11456 1820
Foreign Agricultural Service Export Credit Guaranteeshelliphelliphelliphelliphelliphelliphelliphelliphelliphelliphelliphelliphelliphelliphelliphelliphellip 5357 5500 5500 0 Market Development Programshelliphelliphelliphelliphelliphelliphelliphelliphelliphelliphelliphelliphelliphelliphellip 251 252 213 -39 Dairy Export Incentive Programhelliphelliphelliphelliphelliphelliphelliphelliphelliphelliphelliphelliphelliphelliphellip 19 10 0 -10 Foreign Food Assistancehelliphelliphelliphelliphelliphelliphelliphelliphelliphelliphelliphelliphelliphelliphelliphelliphellip 312 175 171 -4 Trade Adjustment Assistance for Farmershelliphelliphelliphelliphelliphelliphelliphelliphelliphelliphellip 25 90 22 -68 Salaries and Expenseshelliphelliphelliphelliphelliphelliphelliphelliphelliphelliphelliphelliphelliphelliphelliphelliphelliphelliphellip 311 527 398 -129 Total Foreign Agricultural Servicehelliphelliphelliphelliphelliphelliphelliphelliphelliphelliphelliphelliphelliphellip 6275 6554 6304 -250
Total Farm and Foreign Agricultural Serviceshelliphelliphelliphelliphelliphelliphelliphelliphellip 41049 44243 45603 1359
RURAL DEVELOPMENT Rural Utilities Service Loans and Grantshelliphelliphelliphelliphelliphelliphelliphelliphelliphelliphelliphelliphelliphelliphelliphelliphelliphelliphelliphellip 21722 9875 6833 -3042
Rural Housing Service Loans and Grantshelliphelliphelliphelliphelliphelliphelliphelliphelliphelliphelliphelliphelliphelliphelliphelliphelliphelliphelliphellip 22568 15525 15563 38
Rural Business - Cooperative Service Loans and Grantshelliphelliphelliphelliphelliphelliphelliphelliphelliphelliphelliphelliphelliphelliphelliphelliphelliphelliphelliphellip 3406 2328 1431 -897
Salaries and Expenseshelliphelliphelliphelliphelliphelliphelliphelliphelliphelliphelliphelliphelliphelliphelliphelliphelliphellip 324 202 232 30 Total Rural Developmenthelliphelliphelliphelliphelliphelliphelliphelliphelliphelliphelliphelliphelliphelliphelliphellip 48020 27930 24059 -3871
FOOD NUTRITION AND CONSUMER SERVICES Food and Nutrition Service Supplemental Nutrition Assistance Programhelliphelliphelliphelliphelliphelliphelliphelliphelliphelliphellip 51442 60413 63211 2798 Child Nutrition Programshelliphelliphelliphelliphelliphelliphelliphelliphelliphelliphelliphelliphelliphelliphelliphelliphelliphellip 15406 17299 18403 1104 Women Infants and Children (WIC)helliphelliphelliphelliphelliphelliphelliphelliphelliphelliphelliphelliphellip 6956 7746 8058 312 All Otherhelliphelliphelliphelliphelliphelliphelliphelliphelliphelliphelliphelliphelliphelliphelliphelliphelliphelliphelliphelliphelliphelliphelliphellip 408 423 442 19
Total Food Nutrition and Consumer Serviceshelliphelliphelliphelliphelliphelliphelliphellip 74212 85881 90114 4233
FOOD SAFETY Food Safety and Inspection Servicehelliphelliphelliphelliphelliphelliphelliphelliphelliphelliphelliphelliphellip 983 1028 1046 18
136
APPENDIX
UNITED STATES DEPARTMENT OF AGRICULTURE (Dollars in Millions)
Program Level Change
2009 2010 2011 2010 to AGENCYPROGRAM Enacted Estimate Budget 2011
NATURAL RESOURCES AND ENVIRONMENT Natural Resources Conservation Service Conservation Operationshelliphelliphelliphelliphelliphelliphelliphelliphelliphelliphelliphelliphelliphelliphelliphelliphellip 853 888 924 36 Watershed Programshelliphelliphelliphelliphelliphelliphelliphelliphelliphelliphelliphelliphelliphelliphelliphelliphelliphelliphellip 404 70 40 -30 Resource Conservation and Developmenthelliphelliphelliphelliphelliphelliphelliphelliphelliphellip 51 51 0 -51 Farm Security and Rural Investment Programshelliphelliphelliphelliphelliphelliphelliphellip 2163 2973 3029 56
Total Natural Resources Conservation Servicehelliphelliphelliphelliphelliphelliphelliphellip 3471 3982 3993 11
Forest Service National Forest Systemhelliphelliphelliphelliphelliphelliphelliphelliphelliphelliphelliphelliphelliphelliphelliphelliphelliphellip 1510 1551 1586 35 Forest and Rangeland Researchhelliphelliphelliphelliphelliphelliphelliphelliphelliphelliphelliphelliphelliphellip 296 312 304 -8 State and Private Forestryhelliphelliphelliphelliphelliphelliphelliphelliphelliphelliphelliphelliphelliphelliphelliphelliphellip 266 308 322 14 Wildland Fire Activitieshelliphelliphelliphelliphelliphelliphelliphelliphelliphelliphelliphelliphelliphelliphelliphelliphellip 2832 2517 2645 128 Capital Improvement and Maintenancehelliphelliphelliphelliphelliphelliphelliphelliphelliphelliphellip 1145 556 438 -118 Land Acquisitionhelliphelliphelliphelliphelliphelliphelliphelliphelliphelliphelliphelliphelliphelliphelliphelliphelliphelliphelliphellip 51 65 75 10 All Otherhelliphelliphelliphelliphelliphelliphelliphelliphelliphelliphelliphelliphelliphelliphelliphelliphelliphelliphelliphelliphelliphelliphellip 9 6 6 0
Total Discretionary Accountshelliphelliphelliphelliphelliphelliphelliphelliphelliphelliphelliphelliphelliphellip 6109 5315 5377 62 Mandatoryhelliphelliphelliphelliphelliphelliphelliphelliphelliphelliphelliphelliphelliphelliphelliphelliphelliphelliphelliphelliphelliphelliphellip 994 836 768 -68
Total Forest Servicehelliphelliphelliphelliphelliphelliphelliphelliphelliphelliphelliphelliphelliphelliphelliphelliphelliphellip 7103 6151 6145 -6 Total Natural Resources and Environmenthelliphelliphelliphelliphelliphelliphelliphelliphellip 10574 10133 10138 5
MARKETING AND REGULATORY PROGRAMS Animal and Plant Health Inspection Service Salaries and Expenseshelliphelliphelliphelliphelliphelliphelliphelliphelliphelliphelliphelliphelliphelliphelliphelliphelliphellip 877 905 870 -35 Emergency Fundinghelliphelliphelliphelliphelliphelliphelliphelliphelliphelliphelliphelliphelliphelliphelliphelliphelliphelliphellip 29 28 0 -28 Mandatoryhelliphelliphelliphelliphelliphelliphelliphelliphelliphelliphelliphelliphelliphelliphelliphelliphelliphelliphelliphelliphelliphelliphellip 181 250 259 9 Buildings and Facilitieshelliphelliphelliphelliphelliphelliphelliphelliphelliphelliphelliphelliphelliphelliphelliphelliphellip 5 5 5 0
Total Animal and Plant Health Inspection Servicehelliphelliphelliphelliphelliphellip 1092 1188 1134 -54 Agricultural Marketing Servicehelliphelliphelliphelliphelliphelliphelliphelliphelliphelliphelliphelliphelliphellip 300 300 320 20 Section 32 Fundshelliphelliphelliphelliphelliphelliphelliphelliphelliphelliphelliphelliphelliphelliphelliphelliphelliphelliphelliphellip 1012 1098 1015 -83 Grain Inspection Packers and Stockyards
Administrationhelliphelliphelliphelliphelliphelliphelliphelliphelliphelliphelliphelliphelliphelliphelliphelliphelliphelliphelliphellip 40 42 44 2 Total Marketing and Regulatory Programshelliphelliphelliphelliphelliphelliphelliphellip 2444 2628 2513 -115
RESEARCH EDUCATION AND ECONOMICS Agricultural Research Servicehelliphelliphelliphelliphelliphelliphelliphelliphelliphelliphelliphelliphelliphelliphellip 1390 1275 1224 -51 National Institute of Food and Agriculturehelliphelliphelliphelliphelliphelliphelliphelliphellip 1350 1486 1494 7 Economic Research Servicehelliphelliphelliphelliphelliphelliphelliphelliphelliphelliphelliphelliphelliphelliphelliphellip 80 82 87 5 National Agricultural Statistics Servicehelliphelliphelliphelliphelliphelliphelliphelliphelliphelliphellip 152 162 165 3
Total Research Education and Economicshelliphelliphelliphelliphelliphelliphelliphellip 2972 3005 2970 -36
OTHER ACTIVITIES
Office of the Secretaryhelliphelliphelliphelliphelliphelliphelliphelliphelliphelliphelliphelliphelliphelliphelliphelliphelliphellip 16 19 56 37 Departmental Managementhelliphelliphelliphelliphelliphelliphelliphelliphelliphelliphelliphelliphelliphelliphelliphellip 371 467 456 -11 Departmental Staff Officeshelliphelliphelliphelliphelliphelliphelliphelliphelliphelliphelliphelliphelliphelliphelliphelliphellip 80 84 86 2 Office of Inspector Generalhelliphelliphelliphelliphelliphelliphelliphelliphelliphelliphelliphelliphelliphelliphelliphellip 108 89 90 1
Total Other Activitieshelliphelliphelliphelliphelliphelliphelliphelliphelliphelliphelliphelliphelliphelliphelliphelliphellip 575 659 688 29 USDA Sub-Totalhelliphelliphelliphelliphelliphelliphelliphelliphelliphelliphelliphelliphelliphelliphelliphelliphelliphelliphelliphellip $180829 $175507 $177131 $1623
Receipts and Loan Repayments and Other Adjustmentshelliphelliphelliphelliphellip -4993 -2936 -3795 -859
USDA TOTALhelliphelliphelliphelliphelliphelliphelliphelliphelliphelliphelliphelliphelliphelliphelliphelliphelliphelliphelliphelliphellip $175836 $172571 $173336 $764
137
APPENDIX
UNITED STATES DEPARTMENT OF AGRICULTURE
Outlays
(Dollars in Millions)
2009 2010 2011 AGENCY Actual Estimate Budget
FARM AND FOREIGN AGRICULTURAL SERVICES Farm Service Agencyhelliphelliphelliphelliphelliphelliphelliphelliphelliphelliphelliphelliphelliphelliphelliphelliphelliphelliphellip $1890 $4657 $3169 Commodity Credit Corporation Programshelliphelliphelliphelliphelliphelliphelliphelliphelliphelliphellip 11443 11927 11435 Risk Management Agencyhelliphelliphelliphelliphelliphelliphelliphelliphelliphelliphelliphelliphelliphelliphelliphelliphellip 7962 7033 7637 Foreign Agricultural Servicehelliphelliphelliphelliphelliphelliphelliphelliphelliphelliphelliphelliphelliphelliphelliphelliphellip 321 419 496 PL 480helliphelliphelliphelliphelliphelliphelliphelliphelliphelliphelliphelliphelliphelliphelliphelliphelliphelliphelliphelliphelliphelliphelliphelliphellip 1601 1185 1537
RURAL DEVELOPMENT Salaries and Expenseshelliphelliphelliphelliphelliphelliphelliphelliphelliphelliphelliphelliphelliphelliphelliphelliphelliphelliphellip 38 297 238 Rural Utilities Servicehelliphelliphelliphelliphelliphelliphelliphelliphelliphelliphelliphelliphelliphelliphelliphelliphelliphelliphellip 29 613 598 Rural Housing Servicehelliphelliphelliphelliphelliphelliphelliphelliphelliphelliphelliphelliphelliphelliphelliphelliphelliphelliphellip 1519 1928 1335 Rural Business - Cooperative Servicehelliphelliphelliphelliphelliphelliphelliphelliphelliphelliphelliphelliphellip 133 285 387 Rural Empowerment ZonesEnterprise Communitieshelliphelliphelliphelliphelliphelliphellip 16 10 3
FOOD NUTRITION AND CONSUMER SERVICES Food and Nutrition Servicehelliphelliphelliphelliphelliphelliphelliphelliphelliphelliphelliphelliphelliphelliphelliphelliphellip 77848 97945 102410
NATURAL RESOURCES AND ENVIRONMENT Natural Resources Conservation Servicehelliphelliphelliphelliphelliphelliphelliphelliphelliphelliphelliphellip 2725 3525 3722 Forest Servicehelliphelliphelliphelliphelliphelliphelliphelliphelliphelliphelliphelliphelliphelliphelliphelliphelliphelliphelliphelliphelliphellip 5945 6881 6079
FOOD SAFETY Food Safety and Inspection Servicehelliphelliphelliphelliphelliphelliphelliphelliphelliphelliphelliphelliphelliphellip 963 1004 1031
RESEARCH EDUCATION AND ECONOMICS Agricultural Research Servicehelliphelliphelliphelliphelliphelliphelliphelliphelliphelliphelliphelliphelliphelliphelliphellip 1200 1272 1251 National Institute of Food and Agriculturehelliphelliphelliphelliphelliphelliphelliphelliphelliphelliphellip 1182 1483 1624 Economic Research Servicehelliphelliphelliphelliphelliphelliphelliphelliphelliphelliphelliphelliphelliphelliphelliphelliphellip 80 81 87 National Agricultural Statistics Servicehelliphelliphelliphelliphelliphelliphelliphelliphelliphelliphelliphellip 145 162 165
MARKETING AND REGULATORY PROGRAMS Animal and Plant Health Inspection Servicehelliphelliphelliphelliphelliphelliphelliphelliphelliphellip 1183 1328 1267 Agricultural Marketing Servicehelliphelliphelliphelliphelliphelliphelliphelliphelliphelliphelliphelliphelliphelliphellip 259 281 307
Section 32 Fundshelliphelliphelliphelliphelliphelliphelliphelliphelliphelliphelliphelliphelliphelliphelliphelliphelliphelliphelliphelliphellip 948 1098 1015 Grain Inspection Packers and Stockyards Administrationhelliphelliphelliphelliphellip 41 40 14
DEPARTMENTAL ACTIVITIES Office of the Secretaryhelliphelliphelliphelliphelliphelliphelliphelliphelliphelliphelliphelliphelliphelliphelliphelliphelliphelliphellip 11 19 43 Common Computing Environmenthelliphelliphelliphelliphelliphelliphelliphelliphelliphelliphelliphelliphelliphellip 6 16 0 Departmental Administrationhelliphelliphelliphelliphelliphelliphelliphelliphelliphelliphelliphelliphelliphelliphelliphellip 79 170 173 Agriculture Buildings and Facilitieshelliphelliphelliphelliphelliphelliphelliphelliphelliphelliphelliphelliphelliphellip 236 314 281 Hazardous Waste Managementhelliphelliphelliphelliphelliphelliphelliphelliphelliphelliphelliphelliphelliphelliphelliphellip 8 9 10 Office of the General Counselhelliphelliphelliphelliphelliphelliphelliphelliphelliphelliphelliphelliphelliphelliphelliphellip 40 44 46 Office of Inspector Generalhelliphelliphelliphelliphelliphelliphelliphelliphelliphelliphelliphelliphelliphelliphelliphelliphellip 84 95 96 Office of Communicationshelliphelliphelliphelliphelliphelliphelliphelliphelliphelliphelliphelliphelliphelliphelliphelliphellip 9 10 10 Executive Operations
Office of the Chief Economisthelliphelliphelliphelliphelliphelliphelliphelliphelliphelliphelliphelliphelliphelliphellip 12 14 14 National Appeals Divisionhelliphelliphelliphelliphelliphelliphelliphelliphelliphelliphelliphelliphelliphelliphelliphelliphellip 14 14 15
Working Capital Fundhelliphelliphelliphelliphelliphelliphelliphelliphelliphelliphelliphelliphelliphelliphelliphelliphelliphelliphellip 46 -25 0 Gifts and Bequestshelliphelliphelliphelliphelliphelliphelliphelliphelliphelliphelliphelliphelliphelliphelliphelliphelliphelliphelliphellip 1 1 1
Subtotalhelliphelliphelliphelliphelliphelliphelliphelliphelliphelliphelliphelliphelliphelliphelliphelliphelliphelliphelliphelliphelliphelliphelliphellip 118017 144135 146496 Offsetting Receiptshelliphelliphelliphelliphelliphelliphelliphelliphelliphelliphelliphelliphelliphelliphelliphelliphelliphelliphelliphelliphellip -3577 -2120 -749
TOTAL US DEPARTMENT OF AGRICULTUREhelliphelliphelliphelliphelliphellip $114440 $142015 $145747
138
APPENDIX
UNITED STATES DEPARTMENT OF AGRICULTURE
Discretionary Outlays
(Dollars in Millions)
2009 2010 2011 AGENCY Actual Estimate Budget
FARM AND FOREIGN AGRICULTURAL SERVICES Farm Service Agencyhelliphelliphelliphelliphelliphelliphelliphelliphelliphelliphelliphelliphelliphelliphelliphelliphelliphelliphellip $1872 $2354 $1940 Risk Management Agencyhelliphelliphelliphelliphelliphelliphelliphelliphelliphelliphelliphelliphelliphelliphelliphelliphellip 73 79 82 Foreign Agricultural Servicehelliphelliphelliphelliphelliphelliphelliphelliphelliphelliphelliphelliphelliphelliphelliphelliphellip 236 395 472 PL 480helliphelliphelliphelliphelliphelliphelliphelliphelliphelliphelliphelliphelliphelliphelliphelliphelliphelliphelliphelliphelliphelliphelliphelliphellip 2169 1504 1847 RURAL DEVELOPMENT Salaries and Expenseshelliphelliphelliphelliphelliphelliphelliphelliphelliphelliphelliphelliphelliphelliphelliphelliphelliphelliphellip 38 297 238 Rural Utilities Servicehelliphelliphelliphelliphelliphelliphelliphelliphelliphelliphelliphelliphelliphelliphelliphelliphelliphelliphellip 608 1248 1786 Rural Housing Servicehelliphelliphelliphelliphelliphelliphelliphelliphelliphelliphelliphelliphelliphelliphelliphelliphelliphelliphellip 1982 2297 2018 Rural Business - Cooperative Servicehelliphelliphelliphelliphelliphelliphelliphelliphelliphelliphelliphelliphellip 169 215 125 Rural Empowerment ZonesEnterprise Communitieshelliphelliphelliphelliphelliphelliphellip 16 10 3 FOOD NUTRITION AND CONSUMER SERVICES Food and Nutrition Servicehelliphelliphelliphelliphelliphelliphelliphelliphelliphelliphelliphelliphelliphelliphelliphelliphellip 7070 8725 8074 NATURAL RESOURCES AND ENVIRONMENT Natural Resources Conservation Servicehelliphelliphelliphelliphelliphelliphelliphelliphelliphelliphelliphellip 1141 1401 969 Forest Servicehelliphelliphelliphelliphelliphelliphelliphelliphelliphelliphelliphelliphelliphelliphelliphelliphelliphelliphelliphelliphelliphellip 5129 6007 5322 FOOD SAFETY Food Safety and Inspection Servicehelliphelliphelliphelliphelliphelliphelliphelliphelliphelliphelliphelliphelliphellip 956 995 1033 RESEARCH EDUCATION AND ECONOMICS Agricultural Research Servicehelliphelliphelliphelliphelliphelliphelliphelliphelliphelliphelliphelliphelliphelliphelliphellip 1178 1250 1227 National Institute of Food and Agriculturehelliphelliphelliphelliphelliphelliphelliphelliphelliphelliphellip 1140 1396 1542 Economic Research Servicehelliphelliphelliphelliphelliphelliphelliphelliphelliphelliphelliphelliphelliphelliphelliphelliphellip 80 81 87 National Agricultural Statistics Servicehelliphelliphelliphelliphelliphelliphelliphelliphelliphelliphelliphellip 145 162 165 MARKETING AND REGULATORY PROGRAMS Animal and Plant Health Inspection Servicehelliphelliphelliphelliphelliphelliphelliphelliphelliphellip 942 1085 1030 Agricultural Marketing Servicehelliphelliphelliphelliphelliphelliphelliphelliphelliphelliphelliphelliphelliphelliphellip 101 103 52 Grain Inspection Packers and Stockyards Administrationhelliphelliphelliphelliphellip 40 42 43
DEPARTMENTAL ACTIVITIES Office of the Secretaryhelliphelliphelliphelliphelliphelliphelliphelliphelliphelliphelliphelliphelliphelliphelliphelliphelliphelliphellip 11 19 43 Departmental Administrationhelliphelliphelliphelliphelliphelliphelliphelliphelliphelliphelliphelliphelliphelliphelliphellip 78 148 151 Agriculture Buildings and Facilitieshelliphelliphelliphelliphelliphelliphelliphelliphelliphelliphelliphelliphelliphellip 236 314 281 Hazardous Waste Managementhelliphelliphelliphelliphelliphelliphelliphelliphelliphelliphelliphelliphelliphelliphelliphellip 8 9 10 Office of the General Counselhelliphelliphelliphelliphelliphelliphelliphelliphelliphelliphelliphelliphelliphelliphelliphellip 40 44 46 Office of Inspector Generalhelliphelliphelliphelliphelliphelliphelliphelliphelliphelliphelliphelliphelliphelliphelliphelliphellip 84 95 96 Office of Communicationshelliphelliphelliphelliphelliphelliphelliphelliphelliphelliphelliphelliphelliphelliphelliphelliphellip 9 10 10 Executive Operations
Office of the Chief Economisthelliphelliphelliphelliphelliphelliphelliphelliphelliphelliphelliphelliphelliphelliphellip 11 13 13 National Appeals Divisionhelliphelliphelliphelliphelliphelliphelliphelliphelliphelliphelliphelliphelliphelliphelliphelliphellip 14 14 15 Common Computing Environmenthelliphelliphelliphelliphelliphelliphelliphelliphelliphelliphelliphelliphelliphellip 6 16 0 Working Capital Fundhelliphelliphelliphelliphelliphelliphelliphelliphelliphelliphelliphelliphelliphelliphelliphelliphelliphelliphellip 46 -25 0 Subtotalhelliphelliphelliphelliphelliphelliphelliphelliphelliphelliphelliphelliphelliphelliphelliphelliphelliphelliphelliphelliphelliphelliphelliphellip 25628 30303 28720 Offsetting Receiptshelliphelliphelliphelliphelliphelliphelliphelliphelliphelliphelliphelliphelliphelliphelliphelliphelliphelliphelliphelliphellip -58 -70 -78
TOTAL US DEPARTMENT OF AGRICULTUREhelliphelliphelliphelliphelliphellip $25570 $30233 $28642
139
APPENDIX
UNITED STATES DEPARTMENT OF AGRICULTURE
American Recovery and Reinvestment Act of 2009 (Dollars in Millions)
2009 - 2010 2011
AgencyProgram Available Estimate
DEPARTMENTAL ADMINISTRATION Agriculture Buildings and Facilities and Rental Paymentshelliphelliphelliphelliphelliphelliphellip $24 0
AGRICULTURAL RESEARCH SERVICE Buildings and Facilitieshelliphelliphelliphelliphelliphelliphelliphelliphelliphelliphelliphelliphelliphelliphelliphelliphelliphelliphelliphellip 176 0
OFFICE OF INSPECTOR GENERAL Oversight and Audithelliphelliphelliphelliphelliphelliphelliphelliphelliphelliphelliphelliphelliphelliphelliphelliphelliphelliphelliphelliphellip 22 0
FARM SERVICE AGENCY Salaries and Expenses - Information Technologyhelliphelliphelliphelliphelliphelliphelliphelliphelliphellip 50 0 Agricultural Credit Insurance Fund Program Account Farm Operating Direct Loanshelliphelliphelliphelliphelliphelliphelliphelliphelliphelliphelliphelliphelliphelliphelliphelliphellip 20 0 Loan Levelhelliphelliphelliphelliphelliphelliphelliphelliphelliphelliphelliphelliphelliphelliphelliphelliphelliphelliphelliphelliphelliphelliphellip (173) (0) Total FSAhelliphelliphelliphelliphelliphelliphelliphelliphelliphelliphelliphelliphelliphelliphelliphelliphelliphelliphelliphelliphelliphelliphelliphelliphellip 70 0
NATURAL RESOURCES CONSERVATION SERVICE Watershed and Flood Prevention Operationshelliphelliphelliphelliphelliphelliphelliphelliphelliphelliphelliphellip 290 0 Watershed Rehabilitation Programhelliphelliphelliphelliphelliphelliphelliphelliphelliphelliphelliphelliphelliphelliphelliphellip 50 0 Total NRCShelliphelliphelliphelliphelliphelliphelliphelliphelliphelliphelliphelliphelliphelliphelliphelliphelliphelliphelliphelliphelliphelliphelliphellip 340 0
RURAL DEVELOPMENT Salaries and Expenseshelliphelliphelliphelliphelliphelliphelliphelliphelliphelliphelliphelliphelliphelliphelliphelliphelliphelliphelliphelliphellip 131 a 0
Rural Business-Cooperative Service Rural Business and Industry Guaranteed Loans Programhelliphelliphelliphelliphelliphelliphellip 126 0 Loan Levelhelliphelliphelliphelliphelliphelliphelliphelliphelliphelliphelliphelliphelliphelliphelliphelliphelliphelliphelliphelliphelliphelliphellip (1572) (0) Rural Business Enterprise Grantshelliphelliphelliphelliphelliphelliphelliphelliphelliphelliphelliphelliphelliphelliphelliphellip 19 0 Total RBShelliphelliphelliphelliphelliphelliphelliphelliphelliphelliphelliphelliphelliphelliphelliphelliphelliphelliphelliphelliphelliphelliphelliphelliphellip 145 0
Rural Housing Service Rural Community Facilities Loans Programhelliphelliphelliphelliphelliphelliphelliphelliphelliphelliphelliphellip 24 0 Loan Levelhelliphelliphelliphelliphelliphelliphelliphelliphelliphelliphelliphelliphelliphelliphelliphelliphelliphelliphelliphelliphelliphelliphellip (1136) (0) Rural Community Facilities Grants Programhelliphelliphelliphelliphelliphelliphelliphelliphelliphelliphelliphellip 102 0 Section 502 Direct Single Family Housing Loan Programhelliphelliphelliphelliphelliphellip 65 0 Loan Levelhelliphelliphelliphelliphelliphelliphelliphelliphelliphelliphelliphelliphelliphelliphelliphelliphelliphelliphelliphelliphelliphelliphellip (1563) (0) Section 502 Guaranteed Single Family Housing Loan Programhelliphelliphelliphellip 129 0 Loan Levelhelliphelliphelliphelliphelliphelliphelliphelliphelliphelliphelliphelliphelliphelliphelliphelliphelliphelliphelliphelliphelliphelliphellip (10111) (0) Total RHShelliphelliphelliphelliphelliphelliphelliphelliphelliphelliphelliphelliphelliphelliphelliphelliphelliphelliphelliphelliphelliphelliphelliphellip 320 0
140
APPENDIX
American Recovery and Reinvestment Act of 2009 (Dollars in Millions)
2009 - 2010 2011
AgencyProgram Available Estimate
Rural Utilities Service Rural Water amp Waste Disposal Direct Loan Programhelliphelliphelliphelliphelliphelliphelliphellip 400 0
Loan Levelhelliphelliphelliphelliphelliphelliphelliphelliphelliphelliphelliphelliphelliphelliphelliphelliphelliphelliphelliphelliphelliphelliphellip (2154) (0) Rural Water amp Waste Disposal Grants Programhelliphelliphelliphelliphelliphelliphelliphelliphelliphellip 939 0 Distance Learning Telemedicine amp Broadband Grants Programhelliphelliphellip 1940 0 Distance Learning Telemedicine amp Broadband Loan Programhelliphelliphelliphellip 485 0
Loan Levelhelliphelliphelliphelliphelliphelliphelliphelliphelliphelliphelliphelliphelliphelliphelliphelliphelliphelliphelliphelliphelliphelliphellip (7160) (0) Total RUShelliphelliphelliphelliphelliphelliphelliphelliphelliphelliphelliphelliphelliphelliphelliphelliphelliphelliphelliphelliphelliphelliphelliphellip 3764 0
FOOD AND NUTRITION SERVICE WIC Management Information Systemshelliphelliphelliphelliphelliphelliphelliphelliphelliphelliphelliphelliphellip 100 0 WIC Contingency Fundhelliphelliphelliphelliphelliphelliphelliphelliphelliphelliphelliphelliphelliphelliphelliphelliphelliphelliphelliphellip 400 0
Total WIChelliphelliphelliphelliphelliphelliphelliphelliphelliphelliphelliphelliphelliphelliphelliphelliphelliphelliphelliphelliphelliphelliphelliphellip 500 0
Supplemental Nutrition Assistance Program Increased Benefitshelliphelliphelliphelliphelliphelliphelliphelliphelliphelliphelliphelliphelliphelliphelliphelliphelliphelliphelliphellip 15355 b 11936 State Administrative Expenseshelliphelliphelliphelliphelliphelliphelliphelliphelliphelliphelliphelliphelliphelliphelliphellip 290 0 FDPIR Administrative Expenseshelliphelliphelliphelliphelliphelliphelliphelliphelliphelliphelliphelliphelliphelliphellip 5 0 FNS Management and Oversighthelliphelliphelliphelliphelliphelliphelliphelliphelliphelliphelliphelliphelliphelliphellip 5 0
Total SNAPhelliphelliphelliphelliphelliphelliphelliphelliphelliphelliphelliphelliphelliphelliphelliphelliphelliphelliphelliphelliphelliphelliphellip 15655 11936 Child Nutrition Equipment Assistancehelliphelliphelliphelliphelliphelliphelliphelliphelliphelliphelliphelliphelliphellip 100 0
The Emergency Food Assistance Programhelliphelliphelliphelliphelliphelliphelliphelliphelliphelliphelliphellip 150 0
FOREST SERVICE Capital Improvement and Maintenancehelliphelliphelliphelliphelliphelliphelliphelliphelliphelliphelliphelliphelliphellip 650 0 Wildland Fire Managementhelliphelliphelliphelliphelliphelliphelliphelliphelliphelliphelliphelliphelliphelliphelliphelliphelliphellip 500 0
Total FShelliphelliphelliphelliphelliphelliphelliphelliphelliphelliphelliphelliphelliphelliphelliphelliphelliphelliphelliphelliphelliphelliphelliphelliphellip 1150 0
AGRICULTURAL DISASTER ASSISTANCE TRANSITION 2008 Transition Assistancehelliphelliphelliphelliphelliphelliphelliphelliphelliphelliphelliphelliphelliphelliphelliphelliphelliphellip 230 c 0
Aquaculture Assistance Grants (CCC Funds)helliphelliphelliphelliphelliphelliphelliphelliphelliphelliphellip 50 0 Total Disaster Assistancehelliphelliphelliphelliphelliphelliphelliphelliphelliphelliphelliphelliphelliphelliphelliphelliphelliphelliphellip 280 0
FOREIGN AGRICULTURAL SERVICE Trade Adjustment Assistance for Farmershelliphelliphelliphelliphelliphelliphelliphelliphelliphelliphelliphellip 180 22
RECAP Total USDA Discretionary Fundshelliphelliphelliphelliphelliphelliphelliphelliphelliphelliphelliphelliphelliphelliphellip 6942 0 Total USDA Mandatory Fundshelliphelliphelliphelliphelliphelliphelliphelliphelliphelliphelliphelliphelliphelliphelliphellip 16065 11958
Total USDAhelliphelliphelliphelliphelliphelliphelliphelliphelliphelliphelliphelliphelliphelliphelliphelliphelliphelliphelliphelliphelliphellip $23007 $11958
a The Act allows up to 3 percent of the funds provided to RD to be used for administrative costs b CBO scored at $198 billion over three years The impact of the Recovery Act on benefits will continue until the Thrifty Food Plan costs equal the provision made by the Recovery Act c CBO scored at $744 million over two years
141
APPENDIX
UNITED STATES DEPARTMENT OF AGRICULTURE Staff Years
2010 2011 Agency 2009 Estimate Budget
FARM AND FOREIGN AGRICULTURAL SERVICES Farm Service Agency 5042 5094 5104 Risk Management Agency 481 568 568 Foreign Agricultural Service 951 1006 1006
RURAL DEVELOPMENT Rural Development 5873 6100 6100
FOOD NUTRITION AND CONSUMER SERVICES Food and Nutrition Service 1269 1387 1443
NATURAL RESOURCES AND ENVIRONMENT Natural Resources Conservation Service 11186 14104 11565 Forest Service 34395 36760 35716
FOOD SAFETY Food Safety and Inspection Service 9460 9696 9727
RESEARCH EDUCATION AND ECONOMICS Agricultural Research Service 8268 8351 8433 National Institute of Food and Agriculture 376 440 440 Economic Research Service 389 399 409 National Agricultural Statistics Service 1093 1174 1175
MARKETING AND REGULATORY PROGRAMS Animal and Plant Health Inspection Service 7935 7888 7751 Agricultural Marketing Service 2815 2848 2848 Grain Inspection Packers amp Stockyards Administration 682 689 705
DEPARTMENTAL ACTIVITIES Office of the Secretary 63 101 96 Office of Advocacy and Outreach 0 45 50 Office of Civil Rights helliphelliphelliphelliphelliphelliphelliphelliphelliphelliphelliphelliphelliphelliphelliphelliphelliphelliphellip 130 140 140 Office of the Chief Financial Officer 1190 1363 1379 Office of Budget and Program Analysis 49 60 60 Office of the Chief Information Officer 937 1058 1058 Departmental Administration 519 575 539 Office of Homeland Security 15 19 19 Office of the Chief Economist 54 62 61 National Appeals Division 94 99 99 Office of Communications 82 98 98 Office of the Inspector General 550 600 600 Office of the General Counsel 302 318 318
Total USDA Federal Staffing 94201 101042 97507 FSA Non-Federal Staffing 9418 9425 9425 Total USDA Staffing 103619 110467 106932
This page corrects data included in the printed version of the 2011 Budget Summary
142
APPENDIX
Strategic Goal Help America promote agricultural production and biotechnology exports as America works to
increase food security
Budget Authority (Dollars in Millions)
2009 2010 2011 Program Enacted Estimate Budget
FARM AND FOREIGN AGRICULTURAL SERVICES Foreign Agricultural Servicehelliphelliphelliphelliphelliphelliphelliphelliphelliphelliphelliphellip $3021 $2302 $2320
Total FFAShelliphelliphelliphelliphelliphelliphelliphelliphelliphelliphelliphelliphelliphelliphelliphelliphelliphelliphelliphellip 3021 2302 2320
NATURAL RESOURCES AND ENVIRONMENT Natural Resources Conservation Servicehelliphelliphelliphelliphelliphelliphelliphellip 5 6 6 Total NREhelliphelliphelliphelliphelliphelliphelliphelliphelliphelliphelliphelliphelliphelliphelliphelliphelliphelliphelliphellip 5 6 6
MARKETING AND REGULATORY PROGRAMS Animal and Plant Health Inspection Servicehelliphelliphelliphelliphelliphellip 42 42 49
Agricultural Marketing Servicehelliphelliphelliphelliphelliphelliphelliphelliphelliphelliphellip 0 0 0 Total MRPhelliphelliphelliphelliphelliphelliphelliphelliphelliphelliphelliphelliphelliphelliphelliphelliphelliphelliphelliphellip 42 42 49
RESEARCH EDUCATION AND ECONOMICS Agricultural Research Servicehelliphelliphelliphelliphelliphelliphelliphelliphelliphelliphelliphellip 575 598 602 National Institute of Food and Agriculturehelliphelliphelliphelliphelliphelliphellip 157 178 161 Economic Research Servicehelliphelliphelliphelliphelliphelliphelliphelliphelliphelliphelliphelliphellip 20 20 21 National Agricultural Statistics Servicehelliphelliphelliphelliphelliphelliphelliphellip 0 0 1 Total REEhelliphelliphelliphelliphelliphelliphelliphelliphelliphelliphelliphelliphelliphelliphelliphelliphelliphelliphelliphellip 752 796 785
Totalhelliphelliphelliphelliphelliphelliphelliphelliphelliphelliphelliphelliphelliphelliphelliphelliphelliphelliphelliphelliphelliphellip $3820 $3146 $3160
143
APPENDIX
Strategic Goal Ensure that all of Americas children have access to safe nutritious and balanced meals
Budget Authority (Dollars in Millions)
2009 2010 2011 Program Enacted Estimate Budget
FOOD NUTRITION AND CONSUMER SERVICES Food and Nutrition Servicehelliphelliphelliphelliphelliphelliphelliphelliphelliphelliphelliphelliphellip $82249 $93854 $107617
FOOD SAFETY Food Safety and Inspection Servicehelliphelliphelliphelliphelliphelliphelliphelliphelliphellip 983 1028 1046
MARKETING AND REGULATORY PROGRAMS Animal and Plant Health Inspection Servicehelliphelliphelliphelliphelliphellip 860 939 915
Agricultural Marketing Servicehelliphelliphelliphelliphelliphelliphelliphelliphelliphelliphellip 504 674 615 Total MRPhelliphelliphelliphelliphelliphelliphelliphelliphelliphelliphelliphelliphelliphelliphelliphelliphelliphelliphelliphellip 1364 1613 1530
RESEARCH EDUCATION AND ECONOMICS Agricultural Research Servicehelliphelliphelliphelliphelliphelliphelliphelliphelliphelliphelliphellip 191 197 205 National Institute of Food and Agriculturehelliphelliphelliphelliphelliphelliphellip 230 248 233 Economic Research Servicehelliphelliphelliphelliphelliphelliphelliphelliphelliphelliphelliphelliphellip 21 22 24 National Agricultural Statistics Servicehelliphelliphelliphelliphelliphelliphelliphellip 3 8 8 Total REEhelliphelliphelliphelliphelliphelliphelliphelliphelliphelliphelliphelliphelliphelliphelliphelliphelliphelliphelliphellip 445 475 470
Totalhelliphelliphelliphelliphelliphelliphelliphelliphelliphelliphelliphelliphelliphelliphelliphelliphelliphelliphelliphelliphelliphellip $85041 $96970 $110663
144
APPENDIX
Strategic Goal Assist rural communities to create prosperity so they are self-sustaining repopulating and
economically thriving
Budget Authority (Dollars in Millions)
2009 2010 2011 Program Enacted Estimate Budget
FARM AND FOREIGN AGRICULTURAL SERVICES Farm Service Agencyhelliphelliphelliphelliphelliphelliphelliphelliphelliphelliphelliphelliphelliphelliphellip $12774 $11785 $11431
Foreign Agricultural Servicehelliphelliphelliphelliphelliphelliphelliphelliphelliphelliphelliphellip 759 851 721 Risk Management Agencyhelliphelliphelliphelliphelliphelliphelliphelliphelliphelliphelliphelliphellip 6844 6535 7696 Total FFAShelliphelliphelliphelliphelliphelliphelliphelliphelliphelliphelliphelliphelliphelliphelliphelliphelliphelliphelliphellip 20377 19171 19848
RURAL DEVELOPMENT Rural Business Servicehelliphelliphelliphelliphelliphelliphelliphelliphelliphelliphelliphelliphelliphelliphellip 518 556159 366
Rural Housing Servicehelliphelliphelliphelliphelliphelliphelliphelliphelliphelliphelliphelliphelliphelliphellip 2250 2078 1917 Rural Utilities Servicehelliphelliphelliphelliphelliphelliphelliphelliphelliphelliphelliphelliphelliphelliphellip 4479 709 661 Total RDhelliphelliphelliphelliphelliphelliphelliphelliphelliphelliphelliphelliphelliphelliphelliphelliphelliphelliphelliphelliphellip 7247 3343 2944
NATURAL RESOURCES AND ENVIRONMENT Natural Resources Conservation Servicehelliphelliphelliphelliphelliphelliphelliphellip 182 306 320
Forest Servicehelliphelliphelliphelliphelliphelliphelliphelliphelliphelliphelliphelliphelliphelliphelliphelliphelliphellip 1823 672 666 Total NREhelliphelliphelliphelliphelliphelliphelliphelliphelliphelliphelliphelliphelliphelliphelliphelliphelliphelliphelliphellip 2005 978 986
MARKETING AND REGULATORY PROGRAMS Animal and Plant Health Inspection Servicehelliphelliphelliphelliphelliphellip 103 106 99
Agricultural Marketing Servicehelliphelliphelliphelliphelliphelliphelliphelliphelliphelliphellip 807 723 725 Grain Inspection Packers and Stockyards Administrationhellip 40 42 44 Total MRPhelliphelliphelliphelliphelliphelliphelliphelliphelliphelliphelliphelliphelliphelliphelliphelliphelliphelliphelliphellip 950 871 868
RESEARCH EDUCATION AND ECONOMICS Agricultural Research Servicehelliphelliphelliphelliphelliphelliphelliphelliphelliphelliphelliphellip 398 246 178 National Institute of Food and Agriculturehelliphelliphelliphelliphelliphelliphellip 780 857 904 Economic Research Servicehelliphelliphelliphelliphelliphelliphelliphelliphelliphelliphelliphelliphellip 29 30 30 National Agricultural Statistics Servicehelliphelliphelliphelliphelliphelliphelliphellip 148 153 155 Total REEhelliphelliphelliphelliphelliphelliphelliphelliphelliphelliphelliphelliphelliphelliphelliphelliphelliphelliphelliphellip 1355 1286 1267
DEPARTMENTAL STAFF OFFICES Office of the Secretaryhelliphelliphelliphelliphelliphelliphelliphelliphelliphelliphelliphelliphelliphelliphellip 0 0 35
Office of the Chief Economisthelliphelliphelliphelliphelliphelliphelliphelliphelliphelliphelliphellip 6 6 6 Total Staff Officeshelliphelliphelliphelliphelliphelliphelliphelliphelliphelliphelliphelliphelliphelliphelliphelliphellip 6 6 41
Totalhelliphelliphelliphelliphelliphelliphelliphelliphelliphelliphelliphelliphelliphelliphelliphelliphelliphelliphelliphelliphelliphellip $31940 $25655 $25954
145
APPENDIX
Strategic Goal Ensure our national forests and private working lands are conserved restored and made more
resilient to climate change while enhancing our water resources Budget Authority
(Dollars in Millions) 2009 2010 2011
Program Enacted Estimate Budget FARM AND FOREIGN AGRICULTURAL SERVICES Farm Service Agencyhelliphelliphelliphelliphelliphelliphelliphelliphelliphelliphelliphelliphelliphelliphellip $2242 $2328 $2314
Foreign Agricultural Servicehelliphelliphelliphelliphelliphelliphelliphelliphelliphelliphelliphellip 3 3 3 Total FFAShelliphelliphelliphelliphelliphelliphelliphelliphelliphelliphelliphelliphelliphelliphelliphelliphelliphelliphelliphellip 2245 2331 2317
NATURAL RESOURCES AND ENVIRONMENT Natural Resources Conservation Servicehelliphelliphelliphelliphelliphelliphelliphellip 3284 3670 3667
Forest Servicehelliphelliphelliphelliphelliphelliphelliphelliphelliphelliphelliphelliphelliphelliphelliphelliphelliphellip 5280 5479 5479 Total NREhelliphelliphelliphelliphelliphelliphelliphelliphelliphelliphelliphelliphelliphelliphelliphelliphelliphelliphelliphellip 8564 9149 9146
MARKETING AND REGULATORY PROGRAMS Animal and Plant Health Inspection Servicehelliphelliphelliphelliphelliphellip 86 101 71 Total MRPhelliphelliphelliphelliphelliphelliphelliphelliphelliphelliphelliphelliphelliphelliphelliphelliphelliphelliphelliphellip 86 101 71
RESEARCH EDUCATION AND ECONOMICS Agricultural Research Servicehelliphelliphelliphelliphelliphelliphelliphelliphelliphelliphelliphellip 226 234 240 National Institute of Food and Agriculturehelliphelliphelliphelliphelliphelliphellip 183 199 196 Economic Research Servicehelliphelliphelliphelliphelliphelliphelliphelliphelliphelliphelliphelliphellip 10 11 11 National Agricultural Statistics Servicehelliphelliphelliphelliphelliphelliphelliphellip 1 1 1 Total REEhelliphelliphelliphelliphelliphelliphelliphelliphelliphelliphelliphelliphelliphelliphelliphelliphelliphelliphelliphellip 420 444 448
DEPARTMENTAL STAFF OFFICES Office of the Chief Economisthelliphelliphelliphelliphelliphelliphelliphelliphelliphelliphelliphellip 0 3 3 Hazardous Materials Managementhelliphelliphelliphelliphelliphelliphelliphelliphelliphellip 5 5 5
Total Staff Officeshelliphelliphelliphelliphelliphelliphelliphelliphelliphelliphelliphelliphelliphelliphelliphelliphellip 5 8 8
Totalhelliphelliphelliphelliphelliphelliphelliphelliphelliphelliphelliphelliphelliphelliphelliphelliphelliphelliphelliphelliphelliphelliphellip $11320 $12033 $11990
146
APPENDIX
Management Activities (Dollars in Millions)
2009 2010 2011 Program Enacted Estimate Budget
Departmental Activitieshelliphelliphelliphelliphelliphelliphelliphelliphelliphelliphelliphelliphelliphelliphellip $549 $626 $620 Total Management Activitieshelliphelliphelliphelliphelliphelliphelliphelliphelliphelliphelliphelliphellip $549 $626 $620
147
APPENDIX
Fee Proposals (Dollars in Millions)
2011 Agency and Program Budget Authority
Food Safety Food Safety and Inspection Service
User Fee Proposals bull Two user fees associated with the Food Safety and
Inspection Service are proposed One proposal would provide the authority to collect user fees from plants that require additional inspection activities because of performance failures such as retesting recalls or inspection activities linked to an outbreak A second proposal would provide authority to collect a Facility Application and Annual Renewal Activities user fee to cover the increased cost above those basic inspection services provided to meat poultry or processed egg products establishments Total collection from these proposals are estimated to be about $11 million in 2011
$0
Natural Resources and Environment Natural Resources Conservation Service
User Fee Proposal 0
bull The budget includes a targeted fee proposal for conservation plans development Total collections from these proposals are estimated to be $19 million
Marketing and Regulatory Programs Animal and Plant Health Inspection Service
User Fee Proposals 0
bull The budget proposal authorizes the Secretary of Agriculture to prescribe adjust and collect fees to cover the costs incurred for activities in relation to the review maintenance and inspections connected to licensing activities associated with the Animal Welfare Act Virus Serum Toxin Act and the Plant Protection Act The estimated fees would result in receipts of $195 million in 2011 which includes $9 million for animal care $675 million for veterinary biologics and $375 million for Biotechnology Regulatory Services
148
0
APPENDIX
Grain Inspection Packers and Stockyards Administration User Fee Proposal
bull The budget would establish a fee for grain standardization and a Packers and Stockyards license fee The proposal would result in approximately $29 million ($4 million and $25 million respectively)
149
APPENDIX
Proposed Budget-Related Legislation (Dollars in Millions)
2011 Agency and Program Budget Authority
Farm and Foreign Agricultural Services Commodity Credit Corporation
Payment Limitation -$1
bull The 2011 budget proposes to utilize the existing payment limitations from the 2008 Farm Bill but adjust the limits within them to achieve significant savings over 10 years Specifically the proposal would reduce the cap on Direct Payments and reduce the Adjusted Gross Income limitations USDA estimates that the sum of the above changes may save the government a total of roughly $23 billion over 10 years
Reduced Commodity Storage Payments -2
bull This proposal would eliminate cotton and peanut storage credits The credits allow producers to store their cotton and peanuts at the Governmentrsquos cost until prices rise Therefore storage credits have a negative impact on the amount of commodities on the market Because storage is covered by the Government producers may store their commodities for longer than necessary There is no reason the Government should be paying for the storage of cotton or peanuts particularly since it does not provide this assistance for other commodities
Foreign Agricultural Service Reform Market Access Program (MAP) -8
bull This proposal reduces annual funding for MAP by 20 percent in order to achieve deficit reduction savings Under the program funds are used to reimburse participating organizations for a portion of the costs of carrying out overseas marketing and promotional activities such as direct consumer promotions Historically more than 80 percent of MAP funding has been devoted to building export markets for high-value products including a wide range of specialty crops
This page corrects a statement included in the printed version of the 2011 Budget Summary
150
APPENDIX
Although funding for new MAP programming will be reduced by $40 million in 2011 outlay savings during the first year are estimated to be $4 million due to the slow rate of spend-out for the program
Food Nutrition and Consumer Services Food and Nutrition Service
Child Nutrition and WIC Reauthorization 1000
bull The budget proposes to add $10 billion over the next ten years for the reauthorization of the Child Nutrition and WIC Programs The proposals would (1) Improve access to nutritious meals particularly for low-income children (2) Improve access to healthy fruits and vegetables (3) Reduce the prevalence of obesity by improving the diets of school children and by teaching children to make wise food choices in and outside of school and (4) Improve program performance and integrity
Supplemental Nutrition Assistance Program 25
bull The budget proposes to add $25 million to extend the American Recovery and Reinvestment Act provision that eliminates the time limits for able-bodied adults without dependents for an additional year
Supplemental Nutrition Assistance Program 11
bull The budget proposes to exclude refundable tax credits from benefit and eligibility determination in the month of receipt and for the following 12 months
Supplemental Nutrition Assistance Program 0
bull The budget proposes to increase the asset limit to $10000 in SNAP but does not increase budget authority The funding is provided through a government-wide initiative
151
0
APPENDIX
Departmental Management Departmental Management
Penalties
bull The budget will include a proposal to assess penalties for misuse of the biopreferred label
152
- 01ContentsTablepdf
- 02Preface
- 03Overview
- 04Highlights by Goals
- 06FFAS
- 07RD
- 08FNS
- 09FSIS
- 10NRE
- 11MRP
- 12REE
-
- NATIONAL INSTITUTE OF FOOD AND AGRICULTURE (NIFA)
- NIFA formerly the Cooperative State Research Education and Extension Service has the primary responsibility for providing linkages between the Federal and State components of a broad-based national agricultural research extension and higher education system NIFA provides funding for projects conducted in partnership with the State Agricultural Experiment Stations the State Cooperative Extension System land grant universities colleges and other research and education institutions Federal funds are distributed to universities and institutions by statutory formula funding competitive awards and grants NIFA is responsible for administering USDAs primary competitive research grants program the Agriculture and Food Research Initiative (AFRI) which supports investigator-initiated research with strong potential to contribute to major breakthroughs in agricultural science
-
- 13OSEC
- 14DM
- 15All Other
- 16OIG
- 17APPENDIX
-

PREFACE
The budget is described in budget authority measures in most instances However there are some cases when other measures are used and the reader should take care to note which measure is being used Also note that the budget authority tables contained in this document reflect operating levels In addition performance goals reflect performance levels at ongoing funding levels and do not include the effect of supplemental including Recovery Act appropriations
Questions may be directed to the Office of Budget and Program Analysis via e-mail at bcaobpausdagov or telephone at (202) 720-6176
iv
OVERVIEW
Mission Statement USDA provides leadership on food agriculture natural resources and related issues based on sound public policy the best available science and efficient management
Vision Statement To help Americarsquos rural communities thrive and foster innovation as a result of expanded economic opportunities and sustainable agricultural production that nourishes Americarsquos children and the world and conserves the Nationrsquos natural resources
Strategic Plan Framework USDA is currently revising its Strategic Plan The 2011 budget request supports achievement of USDArsquos four strategic goals and management initiatives that describe the Departmentrsquos major programmatic policies and objectives that are expected to be the basis of the Departmentrsquos new Strategic Plan
2011 Funding Overview USDArsquos budget authority totals approximately $149 billion in 2011 The 2011 discretionary level is below the 2010 level and funds the Administrationrsquos most important priorities The decrease is primarily due to reductions in one-time funding such as earmarks supplementals rescissions and targeted program reductions The mandatory budget authority increases above 2010 are due primarily to an anticipated increase in nutrition assistance program participation and the impact of the Recovery Act on the Supplemental Nutrition Assistance Program food costs and crop assistance
USDA Budget Authority
160 $149
$67 $96 $108
$123
$26
$32 $27
$26
0
20
40
60
80
100
120
140
$ B
illio
ns
$93
$128 $135
2008 2009 2010 2011
Fiscal Year
Mandatory Discretionary
1
OVERVIEW
USDA Outlays $
Bill
ions
160 $142 $146 140
$115120
100 $90 80
60
40
20
0
$64
$26
$117
$29
$112
$30
$89
$26
2008 2009 2010 2011
Fiscal Year
Discretionary Mandatory
2011 Outlays
Farm and Commodity Programs
17
Nutrition Assistance
70
Conservation and Forestry
7
All Other 6
Includes Rural Development Research Food Safety and Marketing and Regulatory functions
2
OVERVIEW
USDArsquos total outlays for 2011 are estimated at $146 billion Roughly 80 percent of outlays about $117 billion in 2011 are associated with mandatory programs that provide services as required by law These include the majority of the nutrition assistance programs farm commodity programs export promotion programs and a number of conservation programs The increase in mandatory outlays in 2011 is primarily due to nutrition assistance and crop insurance The remaining 20 percent of outlays estimated at $29 billion in 2011 are associated with discretionary programs such as the Special Supplemental Nutrition Program for Women Infants and Children (WIC) rural development loans and grants research and education soil and water conservation technical assistance animal and plant health management of National Forests wildland fire and other Forest Service activities and domestic and international marketing assistance
For 2011 the Departmentrsquos budget process was organized around four program goals and an overarching management goal to improve collaboration among mission areas and agencies and to strengthen the effectiveness of USDA programs This budget presentation reflects the Departmentrsquos goal-based organizational budget process It should be noted that although agency programs and associated funding have been aligned with the four program goals many programs contribute to the achievement of multiple goals
An overview of the 2011 budget by strategic goal
Strategic Goal Help America promote agricultural production and biotechnology exports as America works to increase food security
bull Supports $23 billion to increase global food security through food assistance programs agricultural reconstruction and stabilization activities including $210 million for the McGovern-Dole International Food for Education and Child Nutrition Program
bull Requests $429 million the highest funding level ever for competitive grants through the Agriculture and Food Research Initiative while maintaining funding for formula grants Also the budget includes a 56 percent increase for the Sustainable Agriculture Research and Education (SARE) program aimed at helping farmers and ranchers adopt practices that are profitable environmentally sound and beneficial to communities
bull Requests $19 million an increase of 46 percent to strengthen regulatory oversight of biotechnology products and prevent regulated genetically engineered products from being co-mingled with non-regulated products
bull Increases funding for the National Organic Program by 45 percent to enhance enforcement ensure the integrity of the organic label and develop equivalency agreements to expand market access for US organic products
bull Includes a National Export Initiative that supports expanding export promotion activities as envisioned by this goal as well as spurring job creation and income growth for rural America under the strategic goal of assisting rural communities create prosperity
3
OVERVIEW
Strategic Goal Ensure that all of Americarsquos children have access to safe nutritious and balanced meals
bull Fully funds expected participation in nutrition assistance programs
bull Provides $10 billion over 10 years to strengthen the Child Nutrition and WIC programs through reforms aimed at improving program access establishing high standards for the nutritional quality of food available in schools exploring new strategies for reducing hunger and improving childrenrsquos food choices and improving program management
bull Proposes to raise current SNAP asset limits to streamline eligibility for families eligible for benefits from multiple programs and encourage families to save toward self-sufficiency This change would add $426 million to recipient benefits and SNAP program costs in 2011 with a 5-year total of $45 billion
bull Proposes to exclude lump sum tax credits from SNAP as part of a government-wide initiative for income support programs including Earned Income Child American Opportunity and Make Work Pay for 12 months following the month of receipt to prevent beneficiaries from experiencing a disruption in eligibility and benefits in the wake of new and refundable tax credits This change will increase recipient benefits and SNAP program costs about $11 million in 2011 with a 5-year total cost of $52 million Legislation is also being proposed to extend the Recovery Act provision that eliminates the time limits for able-bodied adults without dependents for an additional year for an one-time cost of $25 million
bull Provides over $1 billion for the Food Safety and Inspection Service including an increase of $27 million to more quickly identify and respond to outbreaks of foodborne illness as recommended by the Presidentrsquos Food Safety Working Group
Strategic Goal Assist rural communities to create prosperity so they are self-sustaining repopulating and economically thriving
bull Provides funding to support coordination of regional planning activities and establishes a set-aside that is roughly 5 percent of the funding about $280 million from approximately 20 existing programs that will be allocated competitively among regional pilot projects tailored to local needs and opportunities
bull Provides $50 million as part of the Administrationrsquos $400 million ldquoHealthy Food Financing Initiativerdquo to bring grocery stores and other healthy food retailers to underserved communities
bull Supports USDArsquos ldquoKnow Your Farmer Know Your Foodrdquo Initiative to facilitate the development of local and regional food systems that better connect consumers with local farms create new income opportunities for producers and place a greater focus on sustainable agricultural practices and nutritious local food
4
OVERVIEW
bull Requests $54 million for a National Export Initiative to expand export promotion activities that will spur job creation and income growth for rural America
bull Includes nearly $1 billion to foster the development of renewable energy
bull Fully funds the Voluntary Public Access and Habitat Incentive Program which encourages private landowners to voluntarily open their land to the public for hunting and fishing
bull Maintains a strong agriculture safety net through a system of income support disaster mitigation and farm loan programs Income support programs including direct and counter-cyclical payments and Average Crop Revenue Election (ACRE) payments are expected to total nearly $9 billion in 2011
bull Targets direct farm payments to those who needmdashand can most benefit frommdashassistance and reforms the crop insurance program by renegotiating the Governmentrsquos agreement with crop insurance companies
Strategic Goal Ensure our national forests and private working lands are conserved restored and made more resilient to climate change while enhancing our water resources
bull Increases funding for financial and technical assistance to support Farm Bill conservation programs to almost $5 billion that will improve water quality enroll almost 200000 additional acres of wetlands for restoration and reduce nutrient loading in the Chesapeake Bay Conservation activities will be targeted to priority landscapes through local state and Federal partnerships These priority landscapes may include the Bay-Delta region in California and the Upper Mississippi region These efforts will preserve and restore private lands protect water resources and mitigate the effects of climate change
bull Requests $50 million for the Presidentrsquos Watershed Improvement and Job Stabilization initiative through which the Forest Service will assess the condition of all of its watersheds prioritize them based on stakeholder input and the costs required to improve them and complete the highest priority projects to improve the condition of those watersheds
bull Accelerates the scale and pace of USDArsquos forest stewardship activities by transforming the Forest Service budget to take advantage of new tools to protect water resources and to make forests more resilient to climate change The budget provides full funding for the Forest Landscape Restoration Act and $30 million more for the Land and Water Conservation Fund
5
OVERVIEW
Management Initiatives
bull Provides $7 million for the Office of Advocacy and Outreach to increase the accessibility of USDA programs to underserved constituents and to carry out Farm Bill provisions concerning outreach to beginning small and socially disadvantaged farmers ranchers and rural communities Of this amount $4 million is for the agricultural labor grants program previously administered by Rural Development
bull Provides an increase of $83 million to support the Departmentrsquos multi-agency effort to modernize and upgrade the IT infrastructure The modernization effort will improve the ability of the Farm Service Agency Natural Resources Conservation Service and Rural Development to serve program participants This funding will allow for the first system-wide refresh of the Common Computing Environment (CCE) since the infrastructure was implemented in 2000
bull Requests $65 million to support a Government-wide Contracting and Acquisition Workforce Training initiative The requested funding will allow USDA to implement training recruitment and retention activities for the Departmentrsquos procurement workforce that is responsible for over $5 billion in annual procurement for the Department
6
HIGHLIGHTS BY GOALS
For 2011 the Departmentrsquos budget process was organized around four program goals and an overarching management goal to improve collaboration among mission areas and agencies and to strengthen the effectiveness of USDA programs This budget presentation reflects the Departmentrsquos goal-based organizational budget process It should be noted that although agency programs and associated funding have been aligned with the four program goals many programs contribute to the achievement of multiple goals
Highlights of the 2011 budget by strategic goal
STRATEGIC GOAL HELP AMERICA PROMOTE AGRICULTURAL PRODUCTION AND BIOTECHNOLOGY EXPORTS AS AMERICA WORKS TO INCREASE FOOD SECURITY
Global food insecurity affects people worldwide and the current economic downturn has exacerbated the problem Recent estimates from the United Nations Food and Agricultural Organization suggests that more than one billion people around the world are chronically hungry It is important to note that a significant percentage of that one billion is children In addition to ensuring that the worldrsquos children have enough to eat the United States has a strong interest in promoting strong agricultural systems in the developing world because failing agricultural systems and food shortages fuel political instability and diminish the economic vitality of developing nations Working with other Federal partners the Department is working towards reducing global food insecurity and increasing agriculture-led economic growth in developing countries USDArsquos capacity-building technical assistance and food assistance programs are effective tools for improving the capacity of countries to produce what they need and to make that food accessible to those who need it In addition USDA helps American farmers and ranchers use effective technologies and value-added products such as biotechnology to increase agricultural productivity and nutritional value of foods which can enhance food security around the world Key efforts are to (1) ensure that US agricultural resources contribute to enhanced global food security (2) enhance Americarsquos ability to develop and trade agricultural products derived from new technologies and (3) promote productive agricultural systems that enable food-insecure countries to feed themselves
Help America promote agricultural production and biotechnology exports as America works to increase food security
Budget Authority (Dollars in Millions)
2009 2010 2011 Program Enacted Estimate Budget
Farm and Foreign Agricultural Serviceshelliphelliphelliphelliphelliphelliphelliphelliphellip $3021 $2302 $2320 Natural Resources and Environmenthelliphelliphelliphelliphelliphelliphelliphelliphelliphellip 5 6 6 Marketing and Regulatory Programshelliphelliphelliphelliphelliphelliphelliphelliphelliphellip 42 42 49 Research Education and Economicshelliphelliphelliphelliphelliphelliphelliphelliphelliphellip 752 796 785 Totalhelliphelliphelliphelliphelliphelliphelliphelliphelliphelliphelliphelliphelliphelliphelliphelliphelliphelliphelliphelliphellip $3820 $3146 $3160
7
HIGHLIGHTS BY GOALS
Key Proposals for the 2011 Budget
bull Maintain funding for the McGovern-Dole International Food for Education and Child Nutrition Program The McGovern-Dole Program supports maternal infant and child nutrition programs in developing countries supporting food security and a healthy young population which in turn builds stable societies and increases national security The budget continues funding for the McGovern-Dole program at the 2010 enacted level of $2095 million Appropriated funding for the program was increased substantially in 2010 in order to help support additional school feeding and child nutrition programs and to bolster the Departmentrsquos contribution to supporting economic development and food security in developing countries The program is expected to assist an estimated 5 million women and children in 2011
bull Strengthen Agricultural Reconstruction and Stabilization Activities The budget provides $146 million to support the Departmentrsquos participation in reconstruction and stabilization activities primarily in Afghanistan and Iraq USDArsquos efforts support implementation of the Presidentrsquos strategies for these countries by providing technical experts who serve as advisors to key government ministries and serve on civilian-military command units including Provincial Reconstruction Teams working with farmers and local agricultural officials throughout the targeted countries During 2010 USDA is increasing the number of agricultural experts serving in Afghanistan from 14 to 64 Their work is essential for stabilizing strategic areas of the country building government capacity ensuring the successful management of assistance programs and addressing the issue of food insecurity It is estimated that as much as 80 percent of the Afghan population relies on agriculture for wages and sustenance Consistent with these efforts the Department has established a priority for increasing the number of Afghan provinces in which women and children are food secure from 10 to 14 by the end of 2011
bull Expand research to increase the adaptation of sustainable agricultural systems to farmerrancher and ecosystem needs The budget includes an increase of $11 million for Sustainable Agriculture Research and Education (SARE) programs bringing total funding to $30 million This includes $10 million for the creation of a new Federal-State Matching Grant program to assist in the establishment and enhancement of State sustainable agriculture research education and extension programs The matching requirement will leverage State or private funds SARE works to increase knowledge about and to help farmers and ranchers adopt practices that are profitable environmentally sound and beneficial to communities These competitive grants for sustainable agriculture research and education projects are awarded to scientists producers and others in order to solve problems in an interdisciplinary approach SARE grants also fund education and demonstration projects including the development of farmer-to-farmer networks Increased investment in SARE will provide American producers the tools necessary to ensure a profitable livelihood while protecting and conserving the Nationrsquos land and water resources Approximately 17000 farmers and ranchers will experience benefits by implementing innovative practices learned by participating in SARE
bull Strengthen Biotechnology Regulation The budget provides about $19 million for Biotechnology Regulatory Services within the Animal and Plant Health Inspection Service
8
HIGHLIGHTS BY GOALS
(APHIS) to assess the risks of forthcoming genetically modified organisms This is an increase of about $6 million compared to 2010 This funding will contribute to the Departmentrsquos objective of enhancing Americarsquos ability to develop and trade agricultural products derived from new technologies This includes working to prevent regulated genetically engineered products from being co-mingled with non-regulated products in commercial channels A strong regulatory system is needed to ensure the safe intr oduction of biotechnology products and to provide multiple agricultural production options
bull Maintain the integrity of the National Organic Program With sales of organic products increasing at close to 20 percent a year over the last decade additional resources are needed to ensure the integrity of the organic label As a result the 2011 budget includes an increase of $31 million for the National Organic Program almost a 45 percent increase above the 2010 funding level The increase includes $21 million for regulatory review enforcement and development of equivalency agreements plus a one-time increase of $1 million to assist accredited certifying agents enhance compliance with program regulations and ensure the integrity of the organic label which may lead to enhanced export opportunities In addition 2008 Farm Bill funds will continue to be used to provide cost share assistance for organic certification An increase of $03 million is requested for AMSrsquo Market News to continue vital data collection and repor ting of organic commodity information initiated with 2008 Farm Bill funding
bull Initiatives under other goals that promote agricultural production and exports As previously noted although agency programs and associated funding have been aligned with the four program goals many programs contribute to the achievement of multiple goals Additional initiatives that promote agricultural production and exports and the goal of assisting rural communities to create prosperity are discussed beginning on page 13 These initiatives include increasing the competitiveness of American agricultural exports maintaining a strong agricultural safety net modernizin g the farm program delivery system and ensuring fair and competitive agricultural markets
STRATEGIC GOAL ENSURE THAT ALL OF AMERICArsquoS C HILDREN HAVE ACCESS TO SAFE NUTRITIOUS AND BALANCED MEALS
A plentiful supply of safe and nutritious food is essential to the well-being of every family and the healthy development of every child in America A recent report by the Department showed that in over 500000 families with children in 2008 one or more children simply do not get enough to eat There is a growing body of evidence demonstrating that children who eat poorly or who engage in too little physical activity do not perform as well as they could academically and that improvements in nutrition and physical activity can result in improvements in academic performance Too many children also have poor diets and gain excessive weight Recent data shows that the prevalence of obesity has increased over 10 percent to 17 percent for children between 6 and 19 years of age There is also a paradox that hungry children are disproportionately prone to obesity Having poor access to healthy food contributes significantly to both of these problems The 2011 budget includes a $400 million Administration proposal to address these access issues
9
HIGHLIGHTS BY GOALS
Foodborne illness is recognized as a significant public health problem in the United States which can have a more severe impact on children than healthy adults According to the Centers for Disease Control and Prevention approximately half of the reported foodborne illnesses occur in children These illnesses can lead to short and long-term health consequences and sometimes death USDA and other Federal agencies are working in cooperation to ensure that Americarsquos children have increased access to safe and healthy food The end result will be healthier more active children who will be better able to succeed and live vital lives
USDA helps keep safe nutritious food accessible and affordable by preventing the entry and establishment of agricultural pests and diseases and minimizing production losses Safeguarding animal and plant resources against the introduction of foreign agricultural pests and diseases provides access to a diverse supply of fruits vegetables meat and poultry The Department detects and quickly responds to new invasive species and emerging agricultural and public health situations These efforts contribute to the overall agricultural health of the nations and the world
USDA supports and protects the Nationrsquos agricultural system and the consumers it serves by safeguarding the quality and wholesomeness of meat poultry and egg products providing nutrition assistance to children and low-income people who need it and proactively addressing and preventing loss and damage from pests and disease outbreaks Actions to support this goal include (1) helping put a healthy diet within reach of every American by increasing access to nutritious food (2) promoting healthy diet and physical activity behavior s (3) protecting public health by ensuring food is safe and (4) protecting agricultural health by minimizing major diseases and pests to ensure access to safe plentiful and nutritious food
Ensure that all of Americas children have access to safe nutritious and balanced meals
Budget Authority (Dollars in Millions)
2009 2010 2011 Program Enacted Estimate Budget
Food Nutrition and Consumer Serviceshelliphelliphelliphelliphelliphelliphelliphelliphellip $82249 $93854 $107617 Food Safetyhelliphelliphelliphelliphelliphelliphelliphelliphelliphelliphelliphelliphelliphelliphelliphelliphelliphelliphelliphellip 983 1028 1046 Marketing and Regulatory Programshelliphelliphelliphelliphelliphelliphelliphelliphelliphellip 1364 1613 1530 Research Education and Economicshelliphelliphelliphelliphelliphelliphelliphelliphelliphellip 445 479 470 Totalhelliphelliphelliphelliphelliphelliphelliphelliphelliphelliphelliphelliphelliphelliphelliphelliphelliphelliphelliphelliphellip $85041 $96974 $110663
Key Proposals for the 2011 Budget
bull Strengthen Child Nutrition and WIC programs Reauthorization of the Child Nutrition and the Special Supplemental Nutrition Program for Women Infants and Children (WIC) programs will provide significant opportunity to make available the resources needed to achieve the Presidentrsquos goal to eliminate childhood hunger by 2015 The Administration is proposing to add $10 billion over the next ten years for this effort These programs touch virtually every child in America by providing nutritious food and nutrition education to help them get the best start they can in life and connect them with critical health care services
10
HIGHLIGHTS BY GOALS
The Administrationrsquos proposals consistent with the recent National Academies Institute of Medicine (IOM) study would improve access to nutritious meals particularly for low-income children improve access to healthy fruits and vegetables reduce the prevalenc e of obesity by improving the diets of school children and by encouraging children to make wise food choices in and outside of school and improve program performance and integrity
bull Fully fund WIC WIC helps improve the health and nutritional intake of low-income pregnant breast-feeding and postpartum women infants and children up to their fifth birthday A record $76 billion is requested to ensure that all eligible women infants and children who want to participate can In addition significant increases are provided to foster increased breastfeeding including more funds for bonuses to States with high achievement in this important health priority The funding includes the resources necessary for State agencies to administer the program and to make good on the promise of the updated WIC food packages implemented beginning in FY 2010 The new food packages align with the Dietary Guidelines and infant feeding guidelines of the American Academy of Pediatrics to better promote breastfeeding increase participant rsquos consumption of fruits vegetables and whole grains and provide flexibility to accommodate cultural food preferences WIC funding will support over 10 million participants
bull Expand Supplemental Nutrition Assistance Program (SNAP) The Administration is working to establish a practical national asset limit floor across means-tested human services food and cash assistance programs Legislative language will be provided to raise current SNAP asset limits to $10000 from $2000 per household or $3000 for households including an elderly or disabled member This nationwide figure will streamline eligibility for families eligible for benefits from multiple programs and encourage families to save toward self-sufficiency This change would add $426 million to recipient benefits and SNAP program costs in 2011 with a 5-year total of $45 billion In addition FNS seeks to minimize eligibility churning and disruption caused when SNAP households receive lump sum tax refunds Legislative language will also provide for the exclusion of tax refunds in the month of receipt and for the following 12 months beginning in tax year 2009 for SNAP and all federally funded means-tested programs This will exclude lump sum tax credits including Earned Income Child American Opportunity and Make Work Pay for 12 months following the month of receipt This policy will prevent beneficiaries from experiencing a disruption in eligibility and benefits in the wake of new and refundable tax credits This change will increase recipient benefits and SNAP program costs about $11 million in 2011 with a 5-year total cost of $52 million Legislation is also bein g proposed to extend the Recovery Act provision that eliminates the time limits for able-bodied adults without dependents for an additional year for a one-time cost of $25 million
bull Strengthen administration and oversight of nutrition assistance programs Additional funding is needed to increase the staff available to improve access to nutrition assistance advance the public trust and enhance the nutritional quality of our nutrition assistance programs With rising program levels due to increased demand for nutrition assistance and rising public awareness of these significant outlays it is vital that the Food and Nutrition Service have sufficient staffing to maintain program oversight At the same time FNS is working to support the reauthorization of the Child Nutrition and WIC Programs implement the Child Nutrition Reauthorization extension programs develop proposals for the
11
HIGHLIGHTS BY GOALS
2012 Farm Bill and implement the school meal pattern regulations from the Institute of Medicine recommendations on a significantly compressed timeline FNS staff years have declined significantly from a peak of over 2700 down to less than 1300 in 2009 as program level has i ncreased significantly For 2011 the budget includes an increase of $52 million to enhance the Federal investment in program administration grantee oversight and program integrity
bull Improve nutrition education and promotion resources To ensure USDA makes progress on its strategic objectives to decrease the prevalence of obesity among children and adolescents and to improve the quality of the diets measured by the Healthy Eating Index (HEI) scores for people in low-income households (under 130 of poverty level) and for the general population the budget includes an increase of $9 million The increase will allow USDA to significantly increase development of scientific-evidence-based nutrition guidance that provides the basis for nutrition education and promotion provided by our public and private sector partners Updated Dietary Guidelines for Americans will be completed in 2010 along with enhancements to MyPyramid including interactive applications The increased funding will be used to create effective nutrition education inte rventions for schools and communities and broaden and maintain tools and systems that Americans can use to adopt behaviors that lead to more healthful eating and active lifestyles
bull Strengthen the food safety infrastructure The budget includes $1 billion for the Food Safety and Inspection Service an increase of $18 million over 2010 and funds recommendations of the Presidentrsquos Food Safety Working Group (FSWG) and other initiatives aimed at improving USDArsquos public health infrastructure Effective food safety inspections and enforcement depend upon timely quality data and analysis To ensure inspectors have the information they need the Department has invested in an automated system to alert inspectors about potential food safety problems and give them greater and more timely access to establishment performance data The Presidentrsquos budget includes a request of $40 million an increase of $13 million to continue the deployment and enhancement of the FSIS public health information infrastructure Additionally in support of key findings of the Presidentrsquos FSWG USDA will hire more epidemiologists to improve investigations of foodborne illness and outbreaks in coordination with State officials to develop ldquotrace backrdquo tools and improve record-keeping Similarly the 2011 budget proposes a $10 million increase for Baseline Studies and Hazard Analysis and Critical Control Points (HACCP) Verification Program Updates This increase above the 2010 level will allow FSIS to improve surveillance of foodborne pathogens of human-health concern in FSIS-regulated products through significant expansion of the HACCP regulatory sampling and to develop more timely estimates of pathogen prevalence in food products Accurate timely prevalence estimates for pathogens in food products are critical for evaluation of existing prevention policies and the development of new regulatory strategies These new investments will enhance FSISrsquo ability to collect analyze and present data to allow decision making based on relevant timely product and process data utilizing the best science available and respond to foodborne illness outbreaks more effectively and efficiently to better protect consumers and help industry recover faster
bull Minimize the impact of major animal and plant diseases and pests As part of the Departmentrsquos goal to ensure children have access to safe nutritious and balanced meals
12
HIGHLIGHTS BY GOALS
APHIS and other agencies protect agricultural health by minimizing major diseases and pests APHIS activities that contribute to this goal include pest and disease exclusion plant and animal health monitoring response to outbreaks of foreign plant and animal threats and management of endemic pest and diseases Of note the 2011 budget includes $11 million to continue efforts initiated with emergency funding to address the light brown apple moth (LBAM) This is an increase of $10 million compared to 2010 The LBAM is an invasive pest that attacks a wide variety of plants of agricultural or horticultural significance APHIS estimates the pest could cause annual production losses up to $1 billion if allowed to spread
bull Expand food safety research The safety of the food supply continues to be a vital public health priority Therefore USDA research continually works to meet the evolving threats to the Nationrsquos food supply The Departmentrsquos research focuses on the reduction of the hazards of introduced and naturally occurring toxins in foods and feed including pathogenic bacteria viruses parasites chemical contaminants mycotoxins and naturally occurring toxins produced by plants As part of an integrated food safety research initiative the budget proposes an increase of $25 million $20 million through NIFArsquos Agriculture and Food Research Initiative competitive program and an additional $5 million for ARS food safety research These initiatives will strengthen surveillance and epidemiology program s control food pathogens in the preharvest stage develop innovative interventions strategies to eliminate pathogens and contaminants and ensure postharvest safety and quality
bull Increase the level of obesity prevention research The increasing prevalence of overweight and obesity is unprecedented in US history and is a major cause of escalating health care costs and a predisposition of Americans to cardiovascular disease Type 2 diabetes and several cancers There is a critical need for effective proven methods for the prevention of weight gain as an important step for reducing overall obesity and overweight in the population The 2011 budget includes an increase of $50 million for research through the Agriculture and Food Research Initiative competitive grant program that will focus on identifying behavioral factors that influence obesity and conducting nutrition research that leads to the development of effective programs to prevent obesity AFRI funding will also focus research on addressing the micronutrient content of new food crops and improving the nutritional value of staple crops fruits and vegetables through plant breeding leading to greater access to healthy foods
STRATEGIC GOAL ASSIST RURAL COMMUNITIES TO CREATE PROSPERITY SO THEY ARE SELF-SUSTAINING REPOPULATING AND ECONOMICALLY THRIVING
The economic downturn has impacted many sectors and areas of the Nation including rural America At this time there remains high poverty in sparsely populated rural areas which is reflected in higher mortality rates for children higher unemployment and declining populations Since the beginning of the economic slowdown rural residents have experienced a greater decline in real income compared to other parts of the Nation Some factors contributing to this include lower rural educational attainment less competition for workers among rural employers and fewer highly skilled jobs in the rural occupational mix Given these challenges it is not surprising that over 51 percent of rural counties lost population and that a majority of farm families rely on a significant amount of off-farm income to meet their needs However an
13
HIGHLIGHTS BY GOALS
energetic and creative citizenry is looking for new ways to spur rural economic activity to create prosperity and strengthen the economic foundations of their communities Rural communities and businesses are implementing innovative technologies and modernizing infrastructure to create jobs develop new markets and increase competitiveness while conserving the Nationrsquos natural resources and providing a safe sufficient and nutritious food supply for the country and the world As a leading advocate for rural America USDA is at the forefront of developing the technology and tools necessary to transform rural America to take advantage of new opportunities
The Department supports rural communities and enhances quality of life for rural residents by improving their economic opportunities community infrastructure environmental health and the sustainability of agricultural production The common goal is to help create thriving rural communities where people want to live and raise families and where the children have economic opportunities and a bright future USDA will support this goal with actions to support a competitive agricultural system create livable communities and enhance rural prosperity The cornerstone of these efforts include five pillars of success which are (1) increasing access to broadband and continuous business creation (2) facilitating sustainable renewable energy development (3) developing regional food systems (4) capitalizing on climate change opportunities and (5) generating and retaining jobs through recreation and natural resource restoration conservation and management
Assist rural communities to create prosperity so they are self-sustaining repopulating and economically thriving
Budget Authority (Dollars in Millions)
2009 2010 2011 Program Enacted Estimate Budget
Farm and Foreign Agricultural Serviceshelliphelliphelliphelliphelliphelliphelliphelliphellip Rural Developmenthelliphelliphelliphelliphelliphelliphelliphelliphelliphelliphelliphelliphelliphelliphelliphelliphellip Natural Resources and Environmenthelliphelliphelliphelliphelliphelliphelliphelliphelliphellip Marketing and Regulatory Programshelliphelliphelliphelliphelliphelliphelliphelliphelliphellip Research Education and Economicshelliphelliphelliphelliphelliphelliphelliphelliphelliphellip Office of the Secretaryhelliphelliphelliphelliphelliphelliphelliphelliphelliphelliphelliphelliphelliphelliphelliphellip Office of the Chief Economisthelliphelliphelliphelliphelliphelliphelliphelliphelliphelliphelliphelliphellip
$20378 7247 2005
950 1355
0 6
$19171 3343
978 871
1286 0 6
$19848 2944
986 868
1267 35 6
Totalhelliphelliphelliphelliphelliphelliphelliphelliphelliphelliphelliphelliphellip helliphelliphelliphelliphelliphelliphellip hellip $31941 $25655 $25954
Key Proposals for the 2011 Budget
Multi-Agency Initiatives
bull Increase the prosperity of rural communities by strategically investing in regional innovation In recent years rural communities have been losing population have a growing income disparity with urban communities and have an aging workforce To increase prosperity USDA proposes to establish a Regional Innovation Initiative to focus on the
14
HIGHLIGHTS BY GOALS
planning and coordination of USDA and other sources of assistance for rural communities The initiative recognizes that individual communities are often affected by linkages to the other communities within regions and that working together can produce more prosperity for all By creating a regional focus and increasing collaboration with other Federal agencies USDA resources will have a larger impact enabling greater wealth creation quality of life improvements and sustainability USDA will implement a strategy that includes substantial technical assistance to enable rural regions to develop regional strategic plans Several USDA agencies will participate in the initiative including agencies from the Rural Development Marketing and Regulatory Programs and Natural Resources and Environment mission areas Beginning in 2010 USDA intends to explore its current authorities to demonstrate the potential for this approach The 2011 budget includes $14 million in Rural Development to support coordination of regional planning activities It also includes a general provision to provide a 5 percent set-aside of the funding for several USDA programs This set aside will facilitate funding for proje cts that are part of a regional strategy subject to projects meeting the eligibility requirements for the individual programs The set-aside would amount to over $135 million in budget authority which would be sufficient to support a program level of about $280 million
bull Provide incentives for food entrepreneurs to establish or expand markets and grocery stores to make healthy foods available to underserved Americans The 2011 Budget provides funding for a new multi-year multi-agency Healthy Food Financing Initiative that will increase the availability of affordable healthy foods in underserved urban and rural communities particularly through the development or equipping of grocery stores and other healthy food retailers The Departments of Agriculture Health and Human Services and Treasury will partner to make available over $400 million in financial and technical assistance to community development financial institutions other nonprofits public agencies and businesses with sound strategies for addressing the healthy food needs of communities The USDA budget includes a total of $50 million for the initiative These funds will be made available for a number of loan grant promotion and other programs that provide financial and technical assistance to support market p lanning and promotion efforts as well as infrastructure and operational improvements designed to stimulate consumer demand enhance marketing expand demand and retail outlets for farm products and increase availability of locally and regionally produced foods
bull Increase economic opportunities for producers by developing local and regional food systems USDArsquos ldquoKnow Your Farmer Know Your Foodrdquo initiative will facilitate the development of local and regional food systems that better connect consumers with local farms create new income opportunities for farmers and place a greater focus on sustainable agricultural practices and nutritious local food An increased emphasis on regional food systems will have direct and significant benefits to rural communities USDA will work to promote local and regional distribution and utilize existing strategic partnerships to levera ge local food systems USDA will also work more closely with local purchasers institutional purchasers and other regional stakeholders to create regional support systems This effort will leverage funding and program expertise from every mission area of the Department
15
HIGHLIGHTS BY GOALS
bull Promote the development of renewable energy to support energy independence and a healthier environment USDA promotes rural Americarsquos leadership in the research development and sustainability of renewable energy and energy efficiency in order to effectively reduce Americarsquos dependence on foreign oil and reduce greenhouse gas emissions USDA programs make it economically feasible for farmers ranchers and other rural small businesses to invest in alternative energy production and energy-saving activities Through funding opportunities in the form of payments grants loans and loan guarantees USDA is committed to developing clean energy sources promoting energy efficiency and curbing the effects of climate change The 2011 budget supports renewable energy development through commercialization and research This support will create jobs help establish businesses and improve economic prosperity in rural areas The budget includes funding for programs with specific energy-related purposes including the Rural Energy for America Program (REAP) and the Biorefinery Assistance Program to add to the mandatory funding provided through the 2008 Farm Bill Funding for several business programs including the Business and Industry Loan Guarantee Program and Value-Added Grants will be available for green energy projects Funding for the Homeownership Loan and Loan Guarantee programs will provide financing for more energy efficient homes In support of the Presidentrsquos commitment made at the 2009 G20 Summit the budget will target Electric Loan Program financing to alternative energy and end subsidies for the generation of electricity using fossil fuel Finally the budget includes an increase of $34 million for a comprehensive research program in alternative and renewable energy within the Agriculture and Food Research Initiativersquos competitive grant program This will advance the development of dedicated sustainable feedstocks and feedstock production systems which will not impact the food supply
bull Make rural America a better place to live USDA seeks not only to enhance the opportunities necessary for rural families to thrive economically but also to improve the living conditions in rural communities so that they are places where people can thrive USDA provides the resources and expertise necessary to rebuild the infrastructure of small communities ensuring that rural residents have decent housing and home-ownership opportunities clean water adequate systems for handling waste and vital community facilities including critical health-care centers schools and public safety departments For 2011 the budget supports $12 billion for rural home ownership by establishing a fee structure consistent with other Federal housing programs that will eliminate the subsidy costs for all new guaranteed loans Furthermore the budget includes a loan level increase of over $25 million to provide funding to support additional multi-family housing for very-low and low income families In 2011 the budget supports $16 billion in program level to provide over 14 million rural households with new or improved water and waste disposal facilities
A healthy environment is also an essential ingredient for thriving sustainable rural communities and rural quality of life For 2011 the Conservation Stewardship Program (CSP) will serve a key rol e in improving and maintaining the quality of surface water and groundwater in order to protect human health support a healthy environment and enable the productive use of land The FY 2011 budget funds CSP at approximately $630 million and nearly half or $315 million is targeted towards conservation planning and implementation to meet this strategic goal
16
HIGHLIGHTS BY GOALS
Improving agricultural education is critical to retaining young people in rural America The 2011 budget includes a number of investments in education including $10 million for the Hispanic-Serving Agricultural Colleges and Universities Endowment Fund The annual interest earnings from the Endowment Fund will be used to enhance education in agricultural sciences and related disciplines by building educational capacity at these institutions in the areas of curricula design faculty development and student recruitment and retention Additionally increased funding of $23 million is proposed in 2011 for expanding extension education programs on Indian Reservations and Tribal jurisdictions through the Federally-Recognized Tribes Extension Program and an increase of $1 million is required for Tribal Colleges Extension Services at all 1994 land-grant institutions to address the nutrition education needs of Native American s The budget also includes an increase of $5 million to support the next generation of agricultural scientists in the workforce by working with higher-education institutions to develop education and training programs with strong science technology engineering and math curriculums and increase enrollment in secondary and two-year post-secondary programs
Other Proposals
bull Increase the competitiveness of American agricultural exports Agricultural trade contributes directly to the prosperity of local and regional economies across rural America through higher commodity prices and increased sales USDA estimates that every $1 billion worth of agricultural exports supports 9000 jobs and generates an additional $14 billion in economic activity At the same time however foreign trade barriers limit exports thereby reducing farm income and preventing job growth in the agricultural sector The 2011 budget supports the National Export Initiative by providing increased funding of $54 million for the Foreign Agricultural Service (FAS) to support activities that will help to bolster the level of US agricultural exports and thereby contribute to enhanced rural prosperity and employment Of the funding provided $10 million will be used to expand FAS exporter assistance and in-country promotion activities and to meet higher operating costs at FAS overseas posts The initiative also includes $345 million to supplement funding for the Foreign Market Development (Cooperator) Program and $9 million for the Technical Assistance for Specialty Crops (TASC) Program Funding for the Cooperator and TASC programs will be in addition to that provided by the Commodity Credit Corporation and will double the overall level of funding for both programs in 2011
bull Maintain a strong agriculture safety net The 2011 budget maintains strong support for American farmers and ranchers through a system of income support disaster mitigation and farm loan programs Income support programs including direct and counter-cyclical payments and Average Crop Revenue Election payments are expected to total nearly $9 billion in 2011 The budget proposes modest reductions in the current cap on direct payments and a three-year phased reduction in farm program average Adjusted Gross Income eligibility limits for large farmers and wealthy landowners These adjustments in current program limits would affect only a very small portion of the farm program participants without disturbing the foundation of the current safety net for productive family farmers Disaster mitigation programs include the Supplemental Agricultural Disaster Assistance (SADA) programs and the Federal crop insurance program FY 2011 assistance under the SADA programs is expected to total about $14 billion while net indemnities (gross
17
HIGHLIGHTS BY GOALS
indemnities minus producer premium) under the Federal crop insurance program are expected to total about $46 billion Farm loan programs including direct and guarantee d farm ownership operating and conservation loans and Indian fractionated land loans are expected to total over $47 billion in 2011 The budget proposes $5 million increase in funding for the county estimates data collected by the National Agricultural Statistics Service Improving the quality of this data will enhance the integrity of the farm programs
bull Create new economic opportunities for American agriculture through environmental services markets To support the Departmentrsquos efforts of creating economic opportunities in rural America the 2011 budget includes activities to expand market opportunities for farmers ranchers and forest landowners Although climate change is a critical challenge facing the agricultural and forestry communities proposed legislation to respond to that challenge may create significant economic opportunities To take advantage of these opportunities USDA is seeking $2 million to support the Office of Ecosystem Services and Markets to provide analysis and establish guidelines for participation of agriculture producers and forest landowners in potential offset markets under a carbon cap and trade system These guidelines will also support market opportunities in the provision of other ecosystem services beyond carbon sequestration such as wildlife habitat preservation and water quality management Through the development of these guidelines USDA will strive to expand opportunities in rural America to create prosperity while conserving natural resources
bull Continue modernization of the farm program delivery system Continued progress needs to be made in modernizing IT systems critical to the delivery of farm service programs These systems support the delivery of over $9 billion of farm program benefits to 14 million producers Several initiatives are underway to streamline business processes and transition them away from an antiquated legacy IT system to a 21st century IT system When fully implemented these new delivery processes will expedite the delivery of all farm programs including the 2008 Farm Bill programs An increase of $953 million is proposed to support these modernization efforts This amount consists of $393 million directed toward the multi-year MIDAS initiative to streamline business processes for farm program delivery $20 million to convert software and transition applications from outmoded legacy systems to new web-based technologies and $36 million to support an $83 million multi-agency effort to refresh the aging hardware supporting the Common Computing Environment in order to maintain system reliability
bull Create National Forest recreation and forestry job opportunities USDA natural resources conservation restoration and land management programs generate economic value by attracting tourism and recreation visitors and sustaining green jobs including work restoring or creating trails and facilities providing camping boating and outfitter and guide services and supporting associated retail businesses The 2011 Forest Service (FS) recreation budget includes an increase of $5 million to ensure the National Forest roads that provide recreation opportunities to the public match the FSrsquo newly created motor-vehicle-use maps The FS budget also contains $50 million for the Presidentrsquos new Pr iority Watersheds and Job Stabilization initiative A main focus of this initiative will be creating and preserving jobs After conducting a prioritization assessment FS will use stewardship contracts (10 years in length) to produce long-term jobs across the Nation Moreover the agency will leverage outside sources to create jobs for youth in rural areas
18
HIGHLIGHTS BY GOALS
bull Ensure fair and competitive agricultural markets The 2011 budget includes an increase of $18 million to further streng then enforcement of the Packers and Stockyards Act With additional staff and legal support the Grain Inspection Packers and Stockyards Administration will bolster direct enforcement and promote greater voluntary compliance with the Act Current staffing levels are insufficient to address the growing need for regulatory and audit activities
STRATEGIC GOAL ENSURE OUR NATIONAL FORESTS AND PRIVATE WORKING LANDS ARE CONSERVED RESTORED AND MADE MORE RESILIENT TO CLIMATE CHANGE WHILE ENHANCING OUR WATER RESOURCES
A healthy and prosperous America relies on the health of our natural resources and particularly our forests and agricultural working lands The health of Americarsquos forests farmers ranchers and grasslands must be nurtured so that they continue to offer environmental benefits as a source of clean air clean and abundant water and wild life habitat Americarsquos forests supply communities with clean abundant water shelter wildlife and help us mitigate and adapt toclimate change Forests also help generate rural wealth through recreation and tourism through the creation of green jobs and through the production of wood products and energy They are a source of cultural heritage and are a national treasure
USDA plays a pivotal role in protecting and restoring these lands while making them more resilient to threats and enhancing our natural resources USDA partners with private landowners to help protect the Nationrsquos 13 billion acres of farm ranch and private forestlands As public land stewards USDA works to conserve and restore 193 million acres of National Forests and Grasslands in the National Forest System Through these programs USDA partners with other Federal agencies tribal and state governments and non-governmental organizations to assist land and natural resource managers and to connect people to the Nationrsquos magnificent lands USDA agencies provide technical financial and planning assistance to public and private partners USDArsquos data banks research and innovations give landowners and managers access to the latest science and technology to make informed decisions and implement conservation practices USDA also connects forest and farm landowners with emergent markets for ecosystem services so that they can reap the economic and environmental benefits of good stewardship This goal will be supported with actions to (1) Restore and conserve the Nationrsquos forests farms ranches and grasslands (2) Lead efforts to mitigate and adapt to climate change (3) Protect and enhance Americarsquos water resources and (4) Reduce risk from catastrophic wildfire and restore fire to its appropriate place on the landscape
19
HIGHLIGHTS BY GOALS
Ensure our national forests and private working lands are conserved restored and made more resilient to climate change while enhancing our water resources
Budget Authority (Dollars in Millions)
2009 2010 2011 Program Enacted Estimate Budget
Farm and Foreign Agricultural Serviceshelliphelliphelliphelliphelliphelliphelliphelliphellip $2245 $2331 $2317 Natural Resources and Environmenthelliphelliphelliphelliphelliphelliphelliphelliphelliphellip 8564 9149 9146 Marketing and Regulatory Programshelliphelliphelliphelliphelliphelliphelliphelliphelliphellip 86 101 71 Research Education and Economicshelliphelliphelliphelliphelliphelliphelliphelliphelliphellip 420 444 448 Office of the Chief Economisthelliphelliphelliphelliphelliphelliphelliphelliphelliphelliphelliphelliphellip 0 3 3 Hazardous Materials Managementhelliphelliphelliphelliphelliphelliphelliphelliphelliphelliphellip 5 5 5 Totalhelliphelliphelliphelliphelliphelliphelliphelliphelliphelliphelliphelliphelliphelliphelliphelliphelliphelliphelliphelliphellip $11320 $12033 $11990
Key Proposals for the 2011 Budget
Multi-Agency Initiatives
bull Expand funding for financial and technical assistance to support Farm Bill conservation programs The budget includes record levels of support for Farm Bill conservation programs bringing total funding to about $5 billion an increase of $42 million Recognizing the need for judicious allocation of these conservation resources the budget reflects a strategic targeting of high priority programs current workforce and workload capacity and efforts to ensure financial integrity and cost effectiveness This level of funding will also ensure beneficial results from investments in conservation The Conservation Reserve Program is funded at $196 billion about the same level as 2010 to support total enrollment of more than 30 million acres The Environmental Quality Incentives Program (EQIP) which is vital to ensuring that agricultural lands are effectively managed to support both agricultural production and conservation is funded at $121 billion an increase of $28 million over 2010 The Chesapeake Bay Watershed Initiative which is operated under EQIP will be funded at a level of $72 million an increase of $29 million over 2010 to help agricultural producers install conservation practices in the Chesapeake Bay watershed Funding for the newly operational Conservation Stewardship Program will be increased by $160 million to a total of $629 million which will enroll 12 million new acres in the program as well as support prior year contracts Wetlands are among the most productive ecosystems in the world that provide countless economic and environmental benefits to local communities The Wetlands Reserve Program which is one of the principal programs that support wetlands preservation and restoration is funded at $502 million in 2011 This will enable enrollment of nearly 193000 new acres into the program a level well above recent year enrollments
bull Enhance the protection of the Nationrsquos water supply To accelerate progress in protecting and enhancing the Nationrsquos water supply strategic conservation efforts are called for that identify the priority landscapes most in need of attention the critical acres within those
20
HIGHLIGHTS BY GOALS
landscapes and the high impact target (HIT) practices that will deliver the greatest benefit The 2011 budget supports efforts by the Natural Resources Conservation Service and the Forest Service to achieve the Departmentrsquos priority for accelerating the protection of clean abundant water resources by implementing HIT practices on 15 million acres of agricultural lands and 15 million acres of National Forests in priority landscapes HIT practices are those conservation measures identified by the Department to have the most significant impact on improving or conserving land and water resources Priority land scapes may include the Chesapeake Bay Upper Mississippi River Delta Lower Mississippi River Delta the Sierra Nevada the Front Range of Colorado and the California Bay Delta
Other Proposals
bull Improve targeting of conservation technical and financial assistance The 2011 budget proposes an innovative new approach to improving the Departmentrsquos strategic investment in conservation by establishing and deploying Strategic Watershed Action Teams in high priority watersheds that would help plan and apply conservation practices in a defined landscape The budget includes an increase of $25 million to support up to 35 teams of five NRCS employees each to target an identified watershed for a period of 3 to 4 years with the intent of reaching 100 percent of the landowner base eligible for Farm Bill conservation program assistance The additive effect of planned and applied conservation practices would hasten environmental improvement while keeping production agriculture competitive and profitable This initiative should greatly increase the environmental cost-effectiveness of NRCS technical and financial assistance programs It will also improve the agencyrsquos coordination with the Forest Service as that agency seeks to adopt a more landscape-scale approach to leverage its natural resource programs and to conserve and restore forestland and grassland
bull Increase support for the Land and Water Conservation Fund (LWCF) The LWCF is a special account created in 1964 and has been the principal federal source of monies to acquire new recreation lands Forest Service is one of four federal agencies to receive a portion of these funds The fund accumulates revenues from designated sources and they become available only after Congress appropriates them In line with the Presidentrsquos commitment t o fully fund the LWCF by 2014 the Forest Servicersquos Forest Legacy program and Land Acquisition program have proposed increases of $21 million and $10 million respectively
bull Improve National Forest System (NFS) watersheds Protecting Americarsquos supply of clean and abundant water is among the most crucial environmental challenges of the 21st Century Water is essential for life and vital to our prosperity this precious resource is the foundation for healthy ecosystems sustainable agricultural and forest production livable communities and viable industry The Forest Service has placed a focus on improving the health of its watersheds restoring ecosystem functions and increasing forestsrsquo resiliency to climate change The budget proposes a new line item ldquoIntegrated Resource Restorationrdquo that better characterizes the scope of the work that the Agency intends to perform in 2011 This line item is funded at $694 million of which $40 million is provided for the Collaborative Forest Landscape Restoration Fund and $50 million is provided for the Presidentrsquos new Priority Watersheds and Job Stabilization initiative Under this initiative rapid watershed
21
HIGHLIGHTS BY GOALS
assessments will be conducted of all NFS lands the agency will prioritize watershed improvement work and work that can demonstrate a change in watershed condition will be funded in a variety of watersheds across the country
bull Support Climate Change Mitigation and Adaptation USDA provides leadership to help landowners and communities adapt to climate change impacts that are already appearing These include changing water flow availability and quality changing weather patterns and ambient temperatures increased fire risk increased threats from insects and disease and changing habitat and climatic zones USDA conducts research that contributes to the development of climate change mitigation and adaptation tools and technologies and USDA outreach and extension networks make them available to farmers ranchers and land managers The 2011 budget includes an increase of $50 million within the Agriculture and Food Research Initiative competitive grants program for global climate change r esearch to develop mitigation capabilities and adaptive capacities for agricultural production
MANAGEMENT INITIATIVES
To support achievement of its strategic goals USDA is working to transform itself into a model organization By strengthening management operations and engaging employees USDA will improve customer services increase employment satisfaction and develop and implement strategies to enhance leadership performance diversity and inclusion The transformation will result in process improvements and increased perfo rmance USDA has identified the following eight management initiatives to support this effort
bull Engage USDA Employees to Transform USDA into a Model Agency USDA will continue to generate opportunities to listen to employeesrsquo concerns and ideas and to design and implement beneficial systemic changes to processes that affect employee satisfaction and human resources
bull Provide Civil Rights Services to Agriculture Employees and Customers The Departmentrsquos leadership has established civil rights as one of its top priorities To be successful all USDA employees must be committed to making USDA a model in the Federal Government for respecting the civil rights of its employees and constituents
bull Coordinate Outreach and Improve Consultation and Collaboration Efforts to Increase Access to USDA Programs and Services USDA will ensure that all Americans have equal and fair access to key USDA programs and services
bull Leverage USDA Departmental Management to Increase Performance Efficiency and Alignment USDA will expand the use of performance metrics to track areas of success and those needing improvement across the Department This information will allow agency decision makers to align resources to achieve the highest outcome
bull Optimize Information Technology (IT) Policy and Applications The Department is working to improve the effective delivery of programs and services to its constituents applicants and customers by deploying broadband creating an enterprise platform that
22
HIGHLIGHTS BY GOALS
enables open communication channels ensuring the protection of mission-critical operations and customer data and supporting portfolio views for managing across organization and geographic boundaries
bull Optimize USDA ldquoGreenrdquo or Sustainable Operations One of the Presidentrsquos top priorities for all Federal agencies is to establish an integrated strategy to work towards sustainability and to achieve reduction of greenhouse gas emissions As a steward of natural resources USDA is committed to achieving these goals and will focus its efforts towards sustainable operations
bull Enhance USDA Homeland Security and Emergency Preparedness to Protect USDA Employees and the Public USDA is working to enhance homeland security and emergency activities to provide a coordinated national effort to protect American agriculture and rural communities from intentional harm
bull Enhance the USDA Human Resources Process to Recruit and Hire Skilled Diverse Individuals to Meet the Program Needs of USDA USDA is reforming its hiring process to ensure a streamlined user-friendly environment for both the applicant and the hiring manager which will lead to the identification and selection of the most talented and competent workforce possible In doing so the Department will experience increased diversity while addressing current and future skills gaps
Key Proposals for the 2011 Budget
bull Enhance human resource capabilities As part of its efforts to transform USDA into a model organization Departmental Management (DM) is leading an initiative to respond to the Departmentrsquos human resources challenges As part of this initiative DM will focus on improving leadership development labor relations human resources accountability and veterans and other special employment programs This initiative will allow USDA to develop a workforce capable of leading the Department as it implements the strategic goals set forth by the Administration
bull Expand Program Participation of Underserved Constituents To address the need for better outreach to underserved program participant groups USDA is proposing to expand the Office of Advocacy and Outreach (OAO) in the 2011 budget through an increase of $5 million Of this amount $4 million is requested for agricultural labor grants authorized under section 14204 of the 2008 Farm Bill This program was funded through Rural Development in 2010 at the same level As part of this proposal USDA is requesting funding that will allow OAO to adequately conduct its activities related to overseeing the Advisory Committees on Minority Farmers and Beginning Farmers and Ranchers administration of the Outreach to Socially Disadvantaged Farmers Grant Program (section 2501 Program) overseeing the activities of the Office of Small Farms Coordination and the Farm Worker Coordinator managing t he 1994 1890 and Hispanic Serving Institutions Programs and other outreach functions
bull Improve service center agency IT infrastructure The 2011 budget includes $83 million to support the Departmentrsquos multi-agency effort to modernize and upgrade the IT
23
HIGHLIGHTS BY GOALS
infrastructure (also known as the Common Computing Environment (CCE)) for the Service Center Agencies (SCAs) These funds are requested in FSA NRCS and RD The proposed funding will be used to replace outdated components of the CCE many of which have exceeded their expected life cycles to reduce system vulnerabilities to failure and improve the performance and effectiveness of the shared infrastructure These improvements will allow the SCAs to better serve program participants with a more flexible and reliable IT infrastructure This funding will allow for the first system-wide refresh of the CCE since the infrastructure was implemented in 2000 In addition as the components of the CCE are replaced USDA will implement a right-sizing process whereby configuration changes will be made to better support the delivery of current and future programs As part of this process the Department will strive to improve system security reduce the long term cost of infrastructure services and improve service reliability
bull Enhance Acquisition Workforce Capabilities The 2011 budget requests $65 million to support a Government-wide Contracting and Acquisition Workforce Training initiative The requested funding will allow USDA to implement training recruitment and retention activities for the Departmentrsquos procurement workforce that is responsible for over $5 billion in annual procurement for the Department These workforce efforts along with procurement system improvements will allow USDA to achieve substantial cost savings and cost avoidances in the contracting and acquisition activities across all agencies
24
FARM AND FOREIGN AGRICULTURAL SERVICES
MISSION AND RELATIONSHIP TO STRATEGIC GOALS
The Farm and Foreign Agricultural Services (FFAS) mission area has responsibility for the delivery of programs and services which focus on supporting a sustainable and competitive US agricultural system The US agricultural sector produces $300 billion worth of farm products providing a major foundation for prosperity in rural areas as well as a critical element of the nationrsquos economy FFAS also plays an important role in the protection and enhancement of the Nationrsquos natural resource base and environment Thus the area contributes to multiple USDA Strategic Goals Specifically to assist rural communities create prosperity the FFAS mission area engages in the following activities (1) supports a strong farm financial safety net and (2) promotes the vitality of rural America by improving access to international markets providing credit guarantees for US farm exports supporting industry efforts to develop new markets and promoting better international acceptance of the products of biotechnology In support of ensuring private working lands are preserved the FFAS area (1) protects watershed health to ensure clean and abundant water and (2) enhances soil quality to maintain productive working cropland Finally in support of agricultural production and biotechnology it promotes the international acceptance of new technologies including biotechnology and promotes sustainable productive agricultural systems and trade in developing countries to enhance global food security
The work of the FFAS mission area is carried out by its three agencies the Farm Service Agency (FSA) Risk Management Agency (RMA) and Foreign Agricultural Service (FAS)
FARM SERVICE AGENCY (FSA)
FSA supports the delivery of farm credit disaster assistance and commodity and related programs and also administers some of the USDA conservation programs FSA provides administrative support for the Commodity Credit Corporation (CCC) which funds most of the commodity export and some of the conservation programs of USDA To deliver its programs FSA operates an extensive network of local Service Centers
Farm Loans Programs Program Level
$ M
illio
ns
3500
3000
2500
2000
1500
1000
500
0
$1952 $2599
$1895
$3245
$1578
$3219
FY 2009 FY 2010 FY 2011
Direct Guaranteed
25
FARM AND FOREIGN AGRICULTURAL SERVICES
Farm Service Agency Budget Authority
(Dollars in Millions) 2009 2010 2011
Program Enacted Estimate Budget Discretionary FSA Salaries and Expenses Salaries and Expenses (Direct Appropriation)helliphelliphelliphelliphelliphelliphellip $1170 $1254 $1365 Transfers from Program Accountshelliphelliphelliphelliphelliphelliphelliphelliphelliphelliphellip (313) (316) (321) Total Salaries and Expenseshelliphelliphelliphelliphelliphelliphelliphelliphelliphelliphelliphelliphellip (1483) (1570) (1686) Agricultural Credit Insurance Fund Program Account Transfer to FSA Salaries and Expenseshelliphelliphelliphelliphelliphelliphelliphelliphellip 309 313 318 Loan Subsidyhelliphelliphelliphelliphelliphelliphelliphelliphelliphelliphelliphelliphelliphelliphelliphelliphelliphelliphelliphellip 219 141 151 Loan Program Expenseshelliphelliphelliphelliphelliphelliphelliphelliphelliphelliphelliphelliphelliphelliphellip 8 8 8 Total Agricultural Credit Insurance Fund Program Accounthellip 536 462 477 State Mediation Grantshelliphelliphelliphelliphelliphelliphelliphelliphelliphelliphelliphelliphelliphelliphelliphellip 4 4 4 Grassroots Source Water Protection Programhelliphelliphelliphelliphelliphelliphellip 5 5 0 Reforestation Pilot Programhelliphelliphelliphelliphelliphelliphelliphelliphelliphelliphelliphelliphelliphellip 1 1 0 Durum Wheat Quality Programhelliphelliphelliphelliphelliphelliphelliphelliphelliphelliphelliphelliphellip 0 3 0 Geographically Disadvantaged Farmers and Ranchershelliphelliphelliphellip 0 3 0 Total Ongoing Discretionary Programshelliphelliphelliphelliphelliphelliphelliphelliphellip 1716 1732 1846 Dairy Price Supporthelliphelliphelliphelliphelliphelliphelliphelliphelliphelliphelliphelliphelliphelliphelliphelliphellip 0 350 0
Total Discretionary Programshelliphelliphelliphelliphelliphelliphelliphelliphelliphelliphelliphellip 1716 2082 1846 Recovery Act FSA Salaries and Expenseshelliphelliphelliphelliphelliphelliphelliphelliphelliphelliphelliphelliphelliphellip 50 0 0 Agricultural Credit Insurance Fund (Subsidy)helliphelliphelliphelliphelliphelliphellip 20 0 0 Total Recovery Acthelliphelliphelliphelliphelliphelliphelliphelliphelliphelliphelliphelliphelliphelliphelliphellip 70 0 0 Total Discretionary Programshelliphelliphelliphelliphelliphelliphelliphelliphelliphelliphelliphellip 1786 2082 1846 Mandatory Dairy Indemnity Programhelliphelliphelliphelliphelliphelliphelliphelliphelliphelliphelliphelliphelliphelliphellip 1 1 1 Agricultural Disaster Relief Fundhelliphelliphelliphelliphelliphelliphelliphelliphelliphelliphelliphellip 703 526 891 Recovery Act Supplemental Agricultural Disaster Assistancehelliphelliphelliphelliphelliphellip 0 230 0 Aquaculture Assistance Grantshelliphelliphelliphelliphelliphelliphelliphelliphelliphelliphelliphelliphellip 50 0 0 Total Recovery Acthelliphelliphelliphelliphelliphelliphelliphelliphelliphelliphelliphelliphelliphelliphelliphellip 50 230 0 Total Mandatory Programshelliphelliphelliphelliphelliphelliphelliphelliphelliphelliphelliphelliphellip 754 757 892 Total Farm Service Agencyhelliphelliphelliphelliphelliphelliphelliphelliphelliphelliphelliphelliphellip $2540 $2839 $2738
26
FARM AND FOREIGN AGRICULTURAL SERVICES
Farm Service Agency Agricultural Credit Insurance Fund
Farm Loan and Grant Programs Program Level (PL) and Budget Authority (BA)
(Dollars in Millions) 2009
Enacted Program PL BA
Farm Operating Loans Guaranteed Unsubsidizedhelliphelliphelliphelliphelliphelliphellip $1160 $29 Guaranteed Subsidizedhelliphelliphelliphelliphelliphelliphelliphelliphellip 150 21 Directhelliphelliphelliphelliphelliphelliphelliphelliphelliphelliphelliphelliphelliphelliphellip 685 81
Total Operating Loanshelliphelliphelliphelliphelliphelliphellip 1995 131 Farm Ownership Loans Guaranteed Unsubsidizedhelliphelliphelliphelliphelliphelliphellip 1239 4 Directhelliphelliphelliphelliphelliphelliphelliphelliphelliphelliphelliphelliphelliphelliphellip 200 13
Total Ownership Loanshelliphelliphelliphelliphelliphelliphellip 1439 17 Indian Land Acquisition Loanshelliphelliphelliphelliphelliphellip 4 a Boll Weevil Eradicationhelliphelliphelliphelliphelliphelliphelliphelliphellip 100 0 Conservation Loans Guaranteedhelliphelliphelliphelliphelliphelliphelliphelliphelliphelliphelliphellip 0 0 Directhelliphelliphelliphelliphelliphelliphelliphelliphelliphelliphelliphelliphelliphelliphellip 0 0 Total Conservation Loanshelliphelliphelliphelliphelliphellip 0 0 Indian Fractionated Land Loanshelliphelliphelliphelliphellip 0 0
Total Ongoing Farm Loan Programshelliphellip 3538 148
Supplemental Appropriations Farm Operating Loans Guaranteed Unsubsidizedhelliphelliphelliphelliphelliphellip 50 1 Directhelliphelliphelliphelliphelliphelliphelliphelliphelliphelliphelliphelliphellip 400 47 Total Operating Loanshelliphelliphelliphelliphelliphellip 450 48 Farm Ownership Loans Directhelliphelliphelliphelliphelliphelliphelliphelliphelliphelliphelliphelliphellip 360 23 Total Ownership Loanshelliphelliphelliphelliphellip 360 23
Recovery Act Direct Farm Operating Loanshelliphelliphelliphelliphellip 173 20 Total Farm Loan Programshelliphelliphelliphelliphelliphellip 4521 239 Emergency Loans bhelliphelliphelliphelliphelliphelliphelliphelliphelliphellip 30 4 Total Farm Loan and Grant Programshellip $4551 $243
2010 Estimate
PL BA
$1500 $35 170 24
1000 47
2670 106
1500 6 650 27
2150 33 4 0
100 0
75 a 75 1
150 1 10 1
5084 141
0 0 0 0 0 0
0 0 0 0
0 0 5084 141
56 2 $5140 $143
2011 Budget
PL BA
$1500 $35144 20900 55
2544 110
1500 6475 33
1975 39 2 0
60 0
75 a75 2
150 2 10 a
4741 151
0 00 00 0
0 00 0
0 04741 151
56 6$4797 $157
a Less than $05 million b From funds carried over from prior years
27
FARM AND FOREIGN AGRICULTURAL SERVICES
Farm Loan and Grant Programs The farm credit programs are an important safety net for Americarsquos farmers by providing a source of credit when they are temporarily unable to obtain credit from commercial sources The value of this safety net was demonstrated in 2009 when in response to the growing global economic and financial crisis FSA received supplemental appropriations and Recovery Act funding to bring the total funding for the farm credit programs in that year to $45 billion In 2010 in order to meet the growing demands in the farm credit programs total funding increased to $51 billion The 2011 budget supports funding for over $47 billion in direct and guaranteed loans The Administration expects that financial and economic conditions will improve and that commercial lending in rural areas will begin returning to prior levels Therefore a modest decline in the demand for direct and guaranteed loans is assumed
A portion of both direct and guaranteed farm operating and ownership loan funds is targeted to socially disadvantaged borrowers based on county level demographic data Although the statutory targets vary by loan program and county on average about 14 percent of loan funds are targeted to socially disadvantaged borrowers These targeted funds serve over 17 percent of the disadvantaged groups noted below Therefore a key performance measure for the farm credit programs is the percentage of beginning farmers racial and ethnic minority farmers and women farmers financed by FSA The target for 2011 will be to further increase the proportion of these borrowers that are served by FSA credit programs
Key Performance Measure 2006 2007 2008 2009 2010 2011 Percentage of beginning farmers racial and ethnic minority farmers and women farmers financed by FSA (Percent) 155 159 162 174 175 180
The 2011 budget proposes loan levels that are generally reflective of the ongoing financial crisis however some modest reductions are proposed in light of the expected recovery of the US and global economies For farm operating loans the 2011 budget provides $900 million for direct loans and over $16 billion for guaranteed loans These loan levels will serve an estimated 22500 farmers about 15000 of whom will receive direct loans and 7500 of whom will receive guarantees The availability of farm operating loans provides farmers with short term credit to finance the costs of continuing or improving their farming operations such as purchasing seed fertilizer livestock feed equipment and other supplies For farm ownership loans the 2011 budget provides $475 million in direct loans and $15 billion for guaranteed loans The 2011 levels will provide about 7100 people with the opportunity to either acquire their own farm or keep an existing one About 2800 borrowers will receive direct loans and 4300 will receive guaranteed loans
The 2011 budget assumes $56 million in loan level will be available for emergency loans due to carryover from prior years The 2011 budget assumes the demand for Indian land acquisition loans will be lower as a result of the new Indian Fractionated Land loans program Program level funding for the boll weevil eradication loan program is reduced to $60 million compared to $100 million in 2010 Eradication efforts have successfully eliminated the boll weevil from many cotton producing areas and as a result it is anticipated that demand for boll weevil eradication loans will decline
28
FARM AND FOREIGN AGRICULTURAL SERVICES
Funding for State mediation grants is maintained at $4 million These grants are made to States to help support certified programs that provide alternative dispute resolution on a wide variety of agricultural issues Mediation benefits family farmers including many low-income and socially disadvantaged farmers who because of mediation are often able to resolve credit and other issues and remain on the farm
Commodity Credit Corporation Budget Authority
(Dollars in Millions) 2009 2010 2011
Program Enacted Estimate Budget Mandatory Commodity Credit Corporation Fundhelliphelliphelliphelliphelliphelliphelliphelliphelliphelliphelliphellip $12111 $10859 $10522 Tobacco Trust Fundhelliphelliphelliphelliphelliphelliphelliphelliphelliphelliphelliphelliphelliphelliphelliphelliphelliphelliphellip 950 960 960
Total Mandatory Programshelliphelliphelliphelliphelliphelliphelliphelliphelliphelliphelliphelliphelliphelliphellip 13061 11819 11482 Total Commodity Credit Corporationhelliphelliphelliphelliphelliphelliphelliphelliphelliphelliphellip $13061 $11819 $11482
Commodity Credit Corporation The Commodity Credit Corporation (CCC) provides funding for commodity programs administered by FSA and many Farm Bill programs such as the conservation programs administered by FSA and the Natural Resources Conservation Service (NRCS) and export programs administered by FAS CCC borrows funds needed to finance these programs from the US Treasury and repays the borrowings with interest from receipts and from appropriations provided by Congress The commodity programs are critical components of the farm safety net serving to expand domestic market opportunities and provide risk management and financial tools to farmers and ranchers The CCC also handles the Tobacco Trust Fund which provides transition payments to former producers and owners of quotas under the former tobacco price support and quota program
29
FARM AND FOREIGN AGRICULTURAL SERVICES
Commodity Credit Corporation Net Outlays
(Dollars in Millions) 2009 2010 2011
Program Enacted Estimate Budget Commodity Programs Marketing Assistance Loans and Price Supporthelliphelliphelliphelliphelliphelliphellip $3499 $2278 $127 Direct Paymentshelliphelliphelliphelliphelliphelliphelliphelliphelliphelliphelliphelliphelliphelliphelliphelliphelliphelliphellip 5222 5144 4963
ACREhelliphelliphelliphelliphelliphelliphelliphelliphelliphelliphelliphelliphelliphelliphelliphelliphelliphelliphelliphelliphelliphelliphellip 0 0 734 Countercyclical Paymentshelliphelliphelliphelliphelliphelliphelliphelliphelliphelliphelliphelliphelliphelliphellip 731 1079 749 Loan Deficiency Paymentshelliphelliphelliphelliphelliphelliphelliphelliphelliphelliphelliphelliphelliphelliphellip 145 183 24 Milk Income Loss Contract Paymentshelliphelliphelliphelliphelliphelliphelliphelliphelliphelliphellip 757 225 100 Cotton User Marketing Payments and Cotton Economic Adjustment Assistance Paymentshelliphelliphelliphelliphellip 85 74 82 Noninsured Crop Disaster Assistance Programhelliphelliphelliphelliphelliphelliphellip 62 122 124 Tobacco Payments to Producers ahelliphelliphelliphelliphelliphelliphelliphelliphelliphelliphelliphellip 953 960 960 Biomass Crop Assistance Programhelliphelliphelliphelliphelliphelliphelliphelliphelliphelliphelliphellip 2 263 479 Farm Storage Facility Loanshelliphelliphelliphelliphelliphelliphelliphelliphelliphelliphelliphelliphelliphellip 14 10 4 Purchases and Saleshelliphelliphelliphelliphelliphelliphelliphelliphelliphelliphelliphelliphelliphelliphelliphelliphelliphellip -1730 -1703 -97 Processing Storage and Transportationhelliphelliphelliphelliphelliphelliphelliphelliphelliphellip 20 32 6 Operating Expenseshelliphelliphelliphelliphelliphelliphelliphelliphelliphelliphelliphelliphelliphelliphelliphelliphelliphellip 40 14 6 Interest Expenditureshelliphelliphelliphelliphelliphelliphelliphelliphelliphelliphelliphelliphelliphelliphelliphelliphellip -17 -2 42 Change in Working Capitalhelliphelliphelliphelliphelliphelliphelliphelliphelliphelliphelliphelliphelliphelliphellip -806 250 250
Otherhelliphelliphelliphelliphelliphelliphelliphelliphelliphelliphelliphelliphelliphelliphelliphelliphelliphelliphelliphelliphelliphelliphellip -42 449 437 Total Commodity Programs Baselinehelliphelliphelliphelliphelliphelliphelliphelliphelliphellip 8935 9378 8990 Conservation Programs Conservation Reserve Programhelliphelliphelliphelliphelliphelliphelliphelliphelliphelliphelliphelliphellip 1916 1973 1958 Emergency Forestry Conservation Reserve Programhelliphelliphelliphelliphelliphelliphelliphelliphelliphelliphelliphelliphelliphelliphelliphelliphelliphellip 10 19 14 Voluntary Public Access and Incentives Programhelliphelliphelliphelliphelliphelliphelliphelliphelliphelliphelliphelliphelliphelliphelliphelliphellip 0 17 17 Total Conservation Programshelliphelliphelliphelliphelliphelliphelliphelliphelliphelliphelliphelliphellip 1926 2009 1989 Export Programs Quality Samples Programhelliphelliphelliphelliphelliphelliphelliphelliphelliphelliphelliphelliphelliphelliphellip 1 2 2 Market Access Program (MAP)helliphelliphelliphelliphelliphelliphelliphelliphelliphelliphelliphellip 219 194 200 Foreign Market Development (Cooperator) Programhelliphelliphelliphelliphellip 36 34 35 Technical Assistance for Specialty Crops Programhelliphelliphelliphelliphellip 2 5 8 Emerging Markets Programhelliphelliphelliphelliphelliphelliphelliphelliphelliphelliphelliphelliphelliphelliphellip 3 8 8 Dairy Export Incentive Programhelliphelliphelliphelliphelliphelliphelliphelliphelliphelliphelliphelliphellip 1 25 3
30
FARM AND FOREIGN AGRICULTURAL SERVICES
Commodity Credit Corporation Net Outlays
(Dollars in Millions) 2009 2010 2011
Program Enacted Estimate Budget Food for Progress Programhelliphelliphelliphelliphelliphelliphelliphelliphelliphelliphelliphelliphelliphelliphellip 226 148 148 Local and Regional Commodity Procurement Pilot Programhelliphellip 0 15 25 Export Credithelliphelliphelliphelliphelliphelliphelliphelliphelliphelliphelliphelliphelliphelliphelliphelliphelliphelliphelliphellip 80 83 23
Otherhelliphelliphelliphelliphelliphelliphelliphelliphelliphelliphelliphelliphelliphelliphelliphelliphelliphelliphelliphelliphelliphellip 17 30 23 Total Export Programshelliphelliphelliphelliphelliphelliphelliphelliphelliphelliphelliphelliphelliphelliphellip 585 544 475 Subtotal CCChelliphelliphelliphelliphelliphelliphelliphelliphelliphelliphelliphelliphelliphelliphelliphelliphelliphelliphellip 11446 11931 11454 Pre-credit Reform Loan Repaymentshelliphelliphelliphelliphelliphelliphelliphelliphelliphelliphellip -4 -4 -8 CCC Baselinehelliphelliphelliphelliphelliphelliphelliphelliphelliphelliphelliphelliphelliphelliphelliphelliphelliphelliphelliphelliphellip 11442 11927 11446 Proposed Legislation
Reduce MAP by 20helliphelliphelliphelliphelliphelliphelliphelliphelliphelliphelliphelliphelliphelliphelliphellip 0 0 -8 Farm Programs Savingshelliphelliphelliphelliphelliphelliphelliphelliphelliphelliphelliphelliphelliphelliphelliphellip 0 0 -3
Total CCChelliphelliphelliphelliphelliphelliphelliphelliphelliphelliphelliphelliphelliphelliphelliphelliphelliphelliphelliphellip $11442 $11927 $11435
a CCC payments are offset by receipts from the Tobacco Trust Fund
Changes over the last decade in commodity disaster and conservation programs due to policy weather and market conditions have dramatically changed the level mix and variability of CCC outlays CCC net outlays have declined from a record high of $323 billion in 2000 to to $114 billion in 2008 reflecting higher prices for most commodities resulting from increased demand for bioenergy production and strong export demand Outlays in 2009 which included the impact of 2008 Farm Bill provisions were $114 billion They reflected reduced disaster payments offset by greater outlays for dairy support programs and for the cotton program both of which are affected by lower market prices and initiatives to enhance dairy price supports Estimated outlays for 2010 rose to $119 billion partly as a result of the newly implemented Biomass Crop Assistance Program (BCAP) The 2011 estimate declines to $114 billion as higher prices are expected to reduce cotton program outlays from marketing assistance loans The 2008 Farm Bill also ended the use of commodity certificate transactions for marketing assistance loan repayments The impact is reflected in the reduction in CCC sales and purchases in 2011 as producers could no longer purchase certificates for use in loan repayments
Commodity Programs Commodity loan and income support programs constitute the majority of CCC outlays These programs provide a major portion of the farm safety net including protection against adverse market fluctuations hence outlays for many of these programs vary significantly from year to year as market conditions change The commodity programs are mandated by provisions of the 2008 Farm Bill The programs include direct payments to producers of feed grains wheat upland cotton rice soybeans other oilseeds and peanuts The direct payments based on historical program acreage and yields are set by law and do not vary with market prices or current plantings The 2008 Farm Bill also provided counter-cyclical payments for producers of the above crops when market prices decline below specified target prices In addition the 2008 Farm Bill authorized revenue-based counter-cyclical payments (ACRE) as an alternative to the traditional price-based counter-cyclical payments Sign-up for
31
FARM AND FOREIGN AGRICULTURAL SERVICES
the new ACRE program began April 27 2009 and continued to August 14 2009 to give producers ample time to decide whether to participate in ACRE or remain in the traditional direct and counter-cyclical payment program About 17 million farms are enrolled in the direct and counter-cyclical payment programs The 2011 budget proposes modest reductions in the current cap on direct payments and a three year phased reduction in farm program average Adjusted Gross Income (AGI) eligibility limits for large farmers and wealthy landowners These adjustments in current program limits would affect only a very small portion of the farm program participants without disturbing the foundation of the current safety net for productive family farmers In addition the budget proposes elimination of commodity storage payments in the marketing assistance loan program for cotton and peanuts The Department is prepared to work with Congress and stakeholders as these proposals are being considered
The CCC marketing assistance loan (MAL) program is available to producers of commodities eligible for direct and counter-cyclical payments as well as for wool mohair honey and pulses CCC marketing assistance loans provide interim financing to eligible producers allowing them to delay selling their crop at harvest when prices are typically at their lowest When market prices decline these loans may be repaid at rates below the loan rate thus providing benefits which help offset the effect of lower market returns
32
FARM AND FOREIGN AGRICULTURAL SERVICES
Commodity Credit Corporation Commodity Program Net Outlays
(Dollars in Millions) 2009 2010 2011
Program Enacted Estimate Budget Commodity Feed Grainshelliphelliphelliphelliphelliphelliphelliphelliphelliphelliphelliphelliphelliphelliphelliphelliphelliphelliphelliphellip $2458 $2451 $2645 Wheathelliphelliphelliphelliphelliphelliphelliphelliphelliphelliphelliphelliphelliphelliphelliphelliphelliphelliphelliphelliphelliphellip 1224 1299 1425 Ricehelliphelliphelliphelliphelliphelliphelliphelliphelliphelliphelliphelliphelliphelliphelliphelliphelliphelliphelliphelliphelliphelliphellip 411 558 429 Upland and Extra Long Staple Cottonhelliphelliphelliphelliphelliphelliphelliphelliphellip 2213 2387 1552 Tobacco ahelliphelliphelliphelliphelliphelliphelliphelliphelliphelliphelliphelliphelliphelliphelliphelliphelliphelliphelliphellip -172 0 0 Dairyhelliphelliphelliphelliphelliphelliphelliphelliphelliphelliphelliphelliphelliphelliphelliphelliphelliphelliphelliphelliphelliphellip 994 343 362 Soybeans and Productshelliphelliphelliphelliphelliphelliphelliphelliphelliphelliphelliphelliphelliphelliphellip 611 585 624 Minor Oilseedshelliphelliphelliphelliphelliphelliphelliphelliphelliphelliphelliphelliphelliphelliphelliphelliphelliphellip 23 22 25 Peanutshelliphelliphelliphelliphelliphelliphelliphelliphelliphelliphelliphelliphelliphelliphelliphelliphelliphelliphelliphelliphellip 98 90 132 Sugarhelliphelliphelliphelliphelliphelliphelliphelliphelliphelliphelliphelliphelliphelliphelliphelliphelliphelliphelliphelliphelliphellip b 0 0 Honeyhelliphelliphelliphelliphelliphelliphelliphelliphelliphelliphelliphelliphelliphelliphelliphelliphelliphelliphelliphelliphelliphellip -1 b b Wool and Mohairhelliphelliphelliphelliphelliphelliphelliphelliphelliphelliphelliphelliphelliphelliphelliphelliphellip 9 7 7 Vegetable Oil Productshelliphelliphelliphelliphelliphelliphelliphelliphelliphelliphelliphelliphelliphelliphellip 28 49 30 Other Commoditieshelliphelliphelliphelliphelliphelliphelliphelliphelliphelliphelliphelliphelliphelliphelliphelliphellip 57 -8 5
Subtotal Assistance To Farmershelliphelliphelliphelliphelliphelliphelliphelliphelliphellip 7953 7783 7236 Other chelliphelliphelliphelliphelliphelliphelliphelliphelliphelliphelliphelliphelliphelliphelliphelliphelliphelliphelliphelliphellip 982 1596 1754 Commodity Programs Baselinehelliphelliphelliphelliphelliphelliphelliphelliphelliphelliphelliphellip 8936 9379 8990 Proposed Legislation - Farm Programs Savingshelliphelliphelliphelliphelliphellip 0 0 -3 Total Commodity Programshelliphelliphelliphelliphelliphelliphelliphelliphelliphelliphelliphellip $8936 $9379 $8987
a Reflects impact of offsetting receipts from Tobacco Trust Fund b Less than $05 million c Includes working capital interest operating expenses reimbursable agreements and an adjustment for Food for Progress commodity purchases
33
FARM AND FOREIGN AGRICULTURAL SERVICES
Commodity Credit Corporation Conservation Programs
Budget Authority (Dollars in Millions)
2009 2010 2011 Program Enacted Estimate Budget
Conservation Reserve Programhelliphelliphelliphelliphelliphelliphelliphelliphelliphelliphelliphellip $1934 $1973 $1958 Emergency Forestry Conservation Reserve Programhelliphelliphellip 10 19 14 Voluntary Public Access and Habitat Incentives Programhellip 0 17 17
Total Conservation Programshelliphelliphelliphelliphelliphelliphelliphelliphelliphelliphellip $1944 $2009 $1989
Conservation Programs The Farm Bill also provides authority for conservation programs The focus of USDA conservation programs administered by NRCS and FSA is to assist producers in using environmentally sound management systems for agricultural production to meet food and fiber needs of the Nation FSA administers the Conservation Reserve Program (CRP) and the Emergency Forestry Conservation Reserve Program (EFCRP) which are CCC programs in addition to the Emergency Conservation Program (ECP) All other USDA cost-share and easement conservation programs such as the Environment al Quality Incentives Program Wetlands Reserve Program and the Conservation Stewardship Program are administered by NRCS These programs are described beginning on page 85
The purpose of CRP is to assist farm owners and operators in conserving and improving soil water air and wildlife resources b y retirin g environmentally se sitive landn from a gricultural production and keeping it under long-term resource-conserving cover CRP participants enroll acreage for periods of 10 to 15 years in return for annual rental payments along with cost-share and technical assistance for installing approved conservation practices
Among multiple environmental benefits a key performance measure for the CRP program is the number of restored wetland acres Restored wetland acreage serves as a filter barrier reducing sediments and agricultural run-off from reaching drinking water supplies
Key Performance Measure 2006 2007 2008 20091 20102 20112
CRP restored wetland acreage (million acres) 203 208 198 204 199 199
1 The 2009 increase in CRP Wetland acres enrollment was due to increased incentives for certain wetland practices and surge in general signup acres reenrolled into wetland practices 2 Recent commodity price increases especially soybeans will likely reduce landowner willingness to retire cropland into CRP In addition the enrollment authority for CRP decreased to 32 million acres starting in FY 2010
Acreage that counts toward CRPrsquos total enrollment cap includes acres enrolled through scheduled general signups and those enrolled through a continuous non-competitive signup that has been underway since September 1996 with the purpose of enrolling land in filter strips riparian buffers and other high priority conservation and environmental enhancement practices Continuous signup acreage also includes enrollment under the Conservation Reserve
34
FARM AND FOREIGN AGRICULTURAL SERVICES
Enhancement Program (CREP) that is designed to target program benefits to address specific local and regional conservation problems At this time 32 States have approved CREP agreements
CRP enrollment totaled 338 million acres at the end of 2009 with over 85 percent of the acreage having been enrolled under scheduled general signups A general signup of 10 million acres was held in 2006 however no general signup has been held since then The budget projects that total enrolled acreage may decrease to 314 million acres by the end of FY 2010 The budget assumes a potential general signup in 2010 could add up to 29 million general signup acres allowing a cumulative enrollment of 302 million CRP acres by the end of 2011 CRP is limited to a maximum of 32 million acres by the 2008 Farm Bill
Under ECP the Department shares the cost of carrying out practices to assist and encourage farmers to rehabilitate farmland damaged by natural disasters In particular it addresses those problems which represent damage that is unusual and would not recur frequently in the same area and if left untreated would (1) impair or endanger the land (2) materially affect the productive capacity of the land (3) be so costly to rehabilitate that Federal assistance would be required to return the land to productive agricultural use For the past several years this program has been funded through emergency supplemental appropriations The budget is proposing no new funding for the ECP in 2011 since funding needs are difficult to predict in advance
Biomass Crop Assistance Program (BCAP) In 2009 the first phase of the BCAP as mandated by the 2008 Farm Bill was implemented This provision provides matching payments for the collection harvest storage and transportation of biomass material to approved energy conversion facilities Beginning in 2010 the program will provide financial assistance for the establishment and maintenance of crops for bioenergy production once regulations are completed The program will then continue into 2011 and beyond
Supplemental Agricultural Disaster Assistance
Outlays
(Dollars in Millions) 2009 2010 2011
Program Enacted Estimate Budget Supplemental Revenue Assistance Payments 0 $945 $865 Livestock Indemnity Paymentshelliphelliphelliphelliphelliphelliphelliphelliphelliphelliphelliphelliphelliphelliphelliphelliphelliphelliphellip $3 69 69 Livestock Forage Disaster Program 0 409 409 Emergency Assistance for Livestock Honey Bees and Farm-Raised Fishhelliphellip 0 100 50 Tree Assistance Program helliphelliphelliphelliphelliphelliphelliphelliphelliphelliphelliphelliphelliphelliphelliphelliphelliphelliphelliphelliphellip 0 5 5
Subtotal Supplemental Agricultural Disaster Assistance helliphelliphelliphelliphelliphellip 3 1528 1398 Recovery Act SURE Paymentshelliphelliphelliphelliphelliphelliphelliphelliphelliphelliphelliphelliphelliphelliphelliphelliphellip 0 207 23
Total Supplemental Agricultural Disaster Assistance helliphelliphelliphelliphelliphelliphelliphellip $3 $1735 $1421
35
FARM AND FOREIGN AGRICULTURAL SERVICES
Supplemental Agricultural Disaster Assistance The 2008 Farm Bill authorized five new disaster assistance programs FSA administers the five new disaster programs however unlike prior ad hoc disaster programs the new disaster assistance programs are funded through the Agricultural Disaster Relief Trust Fund (Trust Fund) rather than through CCC The Trust Fund receives funding equivalent to 308 percent of the amounts received under the Harmonized Tariff Schedule of the United States Actual assistance levels will depend on the extent of producersrsquo qualifying needs
The Supplemental Revenue Assistance Payments Program (SURE) provides assistance to eligible crop producers on farms in primary and contiguous disaster counties designated by the Secretary of Agriculture or in other counties in which weather-related losses exceeded 50 percent of the normal production for that year The Livestock Indemnity Program (LIP) provides assistance to eligible livestock producers on farms that have incurred livestock death losses in excess of normal mortality rates due to adverse weather during the calendar year The Livestock Forage Program (LFP) provides assistance to eligible livestock producers for grazing losses for covered livestock due to drought conditions or fire The Emergency Livestock Assistance Program (ELAP) provides assistance to eligible producers of livestock (inc luding horses) honey bees and farm-raised fish for losses not covered under the other disaster programs The Tree Assistance Program (TAP) provides assistance to eligible orchardists and nursery tree growers that planted trees for commercial sale (including Christmas trees) for losses resulting from a natural disaster The Recovery Act provided an estimated $230 million of additional disaster assistance through the above programs for producers who suffered losses in crop year 2008 but had not yet paid the crop insurance related fees necessary to become eligible
Dairy and Other Appropriated Assistance The 2010 Appropriations Act included $350 million for additional assistance for dairy producers A total of $290 million was provided for payments to dairy producers and $60 million for purchases of dairy products for distribution to the needy Other additional assistance in 2010 provided by the Appropriations Act includes support for a durum wheat quality program and support for geographically disadvantaged producers No funds are requested for these activities in the 2011 Budget
In addition the Recovery Act provided $50 million for Aquaculture Grants which are intended to compensate aquaculture growers for high feed costs during the 2008 fiscal year The grants were administered as block grants to the States which in turn provide the assistance to eligible growers Under the provisions of the Recovery Act producers who receive assistance under the Aquaculture Grants program will be unable to receive assistance under ELAP for the same losses
36
FARM AND FOREIGN AGRICULTURAL SERVICES
Farm Service Agency Staff Years
2009 2010 2011 Program Enacted Estimate Budget
helliphelliphelliphelliphelliphelliphelliphelliphelliphelliphelliphelliphelliphelliphelliphelliphelliphelliphelliphelliphelliphellipFederal 5042 5094 5104 Non-Federal Permanent Full-Timehelliphelliphelliphelliphelliphelliphelliphelliphelliphelliphelliphelliphelliphelliphelliphellip 8673 8775 8775 Temporaryhelliphelliphelliphelliphelliphelliphelliphelliphelliphelliphelliphelliphelliphelliphelliphelliphelliphelliphelliphellip 745 650 650
Total Non-Federalhelliphelliphelliphelliphelliphelliphelliphelliphelliphelliphelliphelliphelliphelliphelliphellip 9418 9425 9425 Total FSA Staff Yearshelliphelliphelliphelliphelliphelliphelliphelliphelliphelliphelliphelliphelliphellip 14460 14519 14529
Salaries and Expenses The 2011 budget proposes a level of $1686 billion to support 5104 Federal staff years and 9425 non-Federal staff years Total estimated staff years will be increased by 10 over the 2010 level to provide for increased IT modernization project management The budget includes funding to support ongoing operational needs based on current programs and the current delivery system
Information Technology (IT) Modernization and Stabilization The Farm Service Agency relies on one of the oldest information technology systems (hardware and software) within the Department of Agriculture Billions of dollars of annual farm program payments conservation payments and loans to producers mandated b y the 2008 Farm Bill and other legislation are dependent upon the continued viability of this antiquated IT system FSA must upgrade the aging technology infrastructure and equipment which is creating inefficiencies and threatening the delivery of fundamental services to producers
At the present time producers looking to sign up for programs are often confronted by lines long delays and inefficiencies County office personnel are often required to use two computers on different operating systems to sign a producer up for a single program These two computers one relying on the outdated legacy system and one relying on a modern web-based system are unable to communicate with each other forcing the county office personnel to enter data into multiple systems or manually transfer data maintained in one system to the other This causes sign-up delays and significantly increases the likelihood of data entry errors that can lead to improper payments
Further the outmoded IT systems of the Farm Service Agency are highly vulnerable to security breaches because inadequate data storage capacity requires sensitive producer data and financial information to be uploaded into mainframe computers from physical media sent from county offices across the country rather than electronically An independent review conducted pursuant to Section 1618 of the 2008 Farm Bill also concluded that ldquoModernization will bring significant benefits such as improvements in cost efficiency producer access fraud mitigation staff efficiency and morale More fundamentally Modernization will replace the aging platforms that are difficult to maintain and incapable of supporting the fiduciary requirements that FSA faces today and will continue to face in the futurerdquo
37
FARM AND FOREIGN AGRICULTURAL SERVICES
The 2011 Budget proposes an increase of $953 million to fund critical IT replacement and modernization projects to support core FSA operations Of this amount $393 million is proposed for continued implementation of the MIDAS initiative (Modernize and Innovate the Delivery of Agricultural Systems) which is a comprehensive project to streamline the existing complicated business processes that support mandated farm programs and provide a modern IT infrastructure to operate the programs The 2011 proposal builds on funding included in the FY 2010 appropriation to continue this multi-year effort Development of MIDAS is an extensive effort which will result in a secure modern IT system capable of supporting web-based program delivery The system will also provide linkages with the Departmentrsquos new financial management system The proposed 2011 funding includes $1 million for increased staffing to ensure appropriate contract oversight and management of this complex project
A second component of the IT proposal is a $20 million increase needed for conversion of FSA software to shift program applications from the current obsolete system to the new IT system Existing program software that is essential to delivery of FSA rsquos core programs is written for the outmoded mainframe IT system and needs to be converted for use with modern web-based systems Funds will support this conversion of program delivery applications for use with the new system
Further the budget proposes a $36 million increase in FSA to support the Departmentrsquos efforts to modernize and upgrade the Common Computing Environment (CCE) for the Service Center Agencies (SCAs) This funding will be used to replace outdated components of the IT infrastructure many of which have exceeded their expected life cycles in order to reduce system vulnerabilities to failure and improve the performance and effectiveness of the shared infrastructure These improvements will allow the SCAs to better serve program participants with a more flexible and reliable IT infrastructure This funding will allow for the first system-wide refresh of the CCE since the infrastructure was implemented in 2000 In addition as the components of the CCE are replaced USDA will implement a right-sizing process whereby configuration changes will be made to better support the delivery of current and future programs As part of this process the Department will strive to improve system security reduce the long term cost of infrastructure services and improve service reliability
A key performance measure for Modernization efforts is the percentage of program benefits delivered directly by the county office using web-enabled technologies and not utilizing outmoded legacy systems This will enable more timely more accurate and reliable delivery of benefits to producers as the newer technologies are phased in
Key Performance Measure 2006 2007 2008 2009 2010 2011 Maintain or increase percentage of program benefits delivered through a Web environment (percent) 33 33 33 33 50 70
38
FARM AND FOREIGN AGRICULTURAL SERVICES
RISK MANAGEMENT AGENCY (RMA)
Program Level (Dollars in Millions)
2009 2010 2011 Program Enacted Estimate Budget
SUMMARY OF GOVERNMENT COSTS Discretionary Administrative and Operating Expenseshelliphelliphelliphelliphelliphelliphelliphelliphellip $77 $80 $83 Mandatory Delivery and Other Administrative Expenses ahelliphelliphelliphelliphellip 1654 1642 1770 Gross Indemnities bhelliphelliphelliphelliphelliphelliphelliphelliphelliphelliphelliphelliphelliphelliphelliphellip 8416 7669 8249 Underwriting Gains c helliphelliphelliphelliphelliphelliphelliphelliphelliphelliphelliphelliphelliphelliphellip 1963 1168 1202 Farm Bill Agricultural Management Assistancehelliphelliphelliphelliphellip (6) (6) (6)
Subtotal Crop Insurance Program Levelhelliphelliphelliphelliphelliphelliphellip 12033 10479 11221 Less Producer Premium and Administration Feeshelliphellip -4211 -3577 -3606
Total Government Costshelliphelliphelliphelliphelliphelliphelliphelliphelliphelliphelliphelliphellip $7899 $6982 $7698
a Includes reimbursements to private companies and certain costs for research development and other activities b The amount of premium subsidy paid by the Federal government is not reflected in the table above The budget for the Federal Crop Insurance Program assumes a crop year loss ratio (gross indemnititestotal premium) of 10 However the fiscal year loss ratio could be higher or lower than 10 due to differences in the timeing of cash flows and participation rates from year to year Nevertheless the amount of premium subsidy may be approximated in the table above by subtracting producer premium and administrative fees from gross indemnities c Payments to private insurance companies
Discretionary funds for the Federal Crop Insurance Program cover Federal salaries and related expenses to manage the program The 2011 budget includes about $83 million for these costs compared to about $80 million for 2010 The increase includes $07 million for pay costs to maintain current staffing levels and $20 million for increasing costs necessary to maintain the existing IT infrastructure
The Federal Crop Insurance Program provides an important safety net that protects producers from a wide range of risks caused by natural disasters as well as the risk of price fluctuations In recent years an increasing proportion of risk protection has been provided by revenue insurance which protects against both a loss of yield and price declines The Federal Crop Insurance Program is a critical component of the farm safety net
A key performance measure for the Federal Crop Insurance Program is the total value of crops protected or total liabilities The following table presents both actual liabilities and normalized liabilities which account for the effects of changes in commodity prices Commodity prices are a key external factor which can significantly affect performance measurements for the crop insurance program
39
Key Performance Measures 2006 2007 2008 2009 2010 2011 Value of FCIC risk protection coverage provided through FCIC sponsored insurance ($Billions) $499 $673 $899 $904 $814 $839 Normalized value of FCIC risk protection coverage provided through FCIC sponsored insurance ($Billions) $481 $507 $515 $514 $519 $524
FARM AND FOREIGN AGRICULTURAL SERVICES
For the 2010 crop year the Federal Crop Insurance Program is expected to provide about $814 billion in risk protection on about 286 million acres This represents about 80 percent of the Nationrsquos acres planted to principal crops In 2009 about 70 percent of the liabilities were covered under revenue products which provide protection against both a loss of yield and a decline in commodity prices
Participation in the Federal Crop Insurance Program by producers is voluntary however participation is encouraged through premium subsidies In addition participation in the Federal Crop Insurance Program is required in order to participate in the supplemental agricultural disaster assistance programs authorized in the 2008 Farm Bill Crop insurance is delivered to producers through private insurance companies that share in the risk of loss and opportunity for gain The companies are reimbursed for their delivery expenses and receive underwriting gains in years of favorable loss experience The costs associated with the Federal Crop Insurance Program include premium subsidies indemnity payments (in excess of premiums) underwriting gains paid to private companies reimbursements to private companies for delivery expenses and other authorized expenditures
The Standard Reinsurance Agreement (SRA) is the contract between USDA and the private insurance companies which contains many of the financial terms and conditions for participation in the Federal Crop Insurance Program The 2008 Farm Bill authorized USDA to renegotiate the SRA for the 2011 crop year and every 5 years thereafter In December 2009 USDA announced that it was cancelling the current SRA and would renegotiate the agreement with the companies for the 2011 crop year USDA expects to complete the negotiation process by July 1 2010 the start of the 2011 crop year Through the renegotiation process USDA intends to align administrative and operating subsidies paid to insurance companies closer to actual delivery costs provide a reasonable rate of return to the insurance companies equalize reinsurance performance across States to more effectively reach under-served producers commodities and areas and improve program integrity
In preparation for these negotiations RMA contracted with an internationally known company Milliman Inc to review historical rates of return and determine what a reasonable rate of return is for the crop insurance industry RMA data shows that annual insurance industry payments have doubled from $18 billion in 2006 to an estimated $38 billion in 2009 based on the terms of the existing SRA Meanwhile the number of total policies dropped slightly from 13 million in 2000 to 11 million in 2008 The changes being proposed will help protect farmers from higher costs improve access to crop insurance and provide greater protection from crop losses The new agreement will also provide insurance companies with greater flexibility for their operations
40
FARM AND FOREIGN AGRICULTURAL SERVICES
and financial incentives to increase service to underserved producers and areas while ensuring that taxpayers are well-served by the program USDA expects to have in place a stronger Federal Crop Insurance Program that helps producers better manage their risk and that serves farmers in every region of the country and to complete the negotiation process by July 1 2010 the start of the 2011 crop year
The performance for the Federal Crop Insurance Program is tracked on a crop year basis which spans multiple fiscal years As a result the table on page 39 reflects certain assumptions about the fiscal year in which the crop year costs andor revenues will fall Furthermore the amount of liabilities covered by the Federal Crop Insurance Program is strongly influenced by changing commodity prices
Actual indemnities for fiscal year 2009 reflect crop year 2008 losses which were paid out in fiscal year 2009 plus crop year 2009 losses which were paid out in fiscal year 2009 The relatively low actual indemnities for fiscal year 2009 reflect the low loss ratios experienced in the 2008 and 2009 The actual loss ratio for crop year 2008 was a low 088 Losses for crop year 2009 are not yet finalized however the statutory target used for budgetary purposes is 10
Estimated indemnities for fiscal year 2010 reflect about 65 percent of the estimated losses for crop year 2009 plus 35 percent of the estimated losses for crop year 2010 Losses for crop years 2010 and 2011 reflect an estimated loss ratio of 10 Estimated indemnities for fiscal year 2011 are calculated in the same manner as 2010
There is a one year lag between crop year underwriting gains and the fiscal year in which they are paid out Consequently the underwriting gains for fiscal year 2009 reflect the low loss ratio experienced for crop year 2008 The underwriting gain totals for fiscal years 2010 and 2011 reflects the assumption that the loss ratio in crop years 2009 and 2010 will be 10
In fiscal year 2009 the actual total Government cost for the Federal Crop Insurance Program was about $79 billion Of this amount about $42 billion was for net indemnities to producers (gross indemnities minus producer paid premiums) The remaining amount of about $36 billion was for payments to the private insurance companies to deliver the program
41
FARM AND FOREIGN AGRICULTURAL SERVICES
FOREIGN AGRICULTURAL SERVICE (FAS)
FAS administers a variety of programs that are designed to facilitate access to international markets and thereby help to support a competitive US agricultural system FAS also carries out activities that promote productive agricultural systems in developing countries and contribute to increased trade and enhanced global food security Working bilaterally and with international organizations FAS encourages the development of transparent and science-based regulatory systems that allow for the safe development and use of agricultural goods derived from new technologies
National Export Initiative
120
100 $97
FAS Export Promotion Activities
80
FMDP - Foreign Market Development Program -- Discretionary Funding 2011
TASC - Technical Assistance for 60 Specialty Crops Program -- Discretionary
Funding 2011
FMDP - Foreign Market Development Program -- Mandatory CCC Funding $41 $42
40 TASC - Technical Assistance for Specialty Crops Program -- Mandatory CCC Funding
20
0 7 8 9
34 34 34
9
35
10
2009 2010 2011
Fiscal Year
$ M
illio
ns
42
FARM AND FOREIGN AGRICULTURAL SERVICES
Foreign Agricultural Service Budget Authority
(Dollars in Millions) 2009 2010 2011
Program Enacted Estimate Budget Discretionary FAS Salaries and Expenses Salaries and Expenses (Direct Appropriation)helliphelliphelliphelliphelliphelliphelliphellip $165 $180 $201 Agricultural Reconstruction and Stabilization helliphelliphelliphelliphelliphelliphellip 0 0 15 Foreign Market Development (Cooperator) Programhelliphelliphelliphellip 0 0 35 Technical Assistance for Specialty Crops Programhelliphelliphelliphelliphellip 0 0 9 Transfer from CCC Export Credit Program Accounthelliphelliphelliphelliphellip (5) (6) (7) Total FAS Salaries and Expenseshelliphelliphelliphelliphelliphelliphelliphelliphelliphelliphelliphellip (170) (187) (265) Foreign Food Assistance McGovern-Dole International Food for Education Programhelliphellip 100 210 210
PL 480 Title II Donationshelliphelliphelliphelliphelliphelliphelliphelliphelliphelliphelliphelliphelliphelliphellip 1226 1690 1690 PL 480 Title II Supplemental Fundinghelliphelliphelliphelliphelliphelliphelliphelliphellip 1095 0 0
Total PL 480 Title II Donationshelliphelliphelliphelliphelliphelliphelliphelliphelliphelliphellip 2321 1690 1690 PL 480 Title I Program Account
Transfer to Farm Service Agency Salaries and Expenseshelliphelliphellip 3 3 3 Commodity Credit Corporation Export Credit Program Account Transfer to FSA and FAS Salaries and Expenseshelliphelliphelliphelliphelliphellip (5) (7) (7) Total Discretionary Programshelliphelliphelliphelliphelliphelliphelliphelliphelliphelliphelliphelliphellip 2589 2083 2161 Mandatory Quality Samples Programhelliphelliphelliphelliphelliphelliphelliphelliphelliphelliphelliphelliphelliphelliphelliphellip 2 2 2 Farm Bill Market Development Programs Foreign Market Development (Cooperator) Programhelliphelliphelliphellip 34 34 34 Technical Assistance for Specialty Crops Programhelliphelliphelliphelliphellip 7 8 9 Market Access Programhelliphelliphelliphelliphelliphelliphelliphelliphelliphelliphelliphelliphelliphelliphelliphellip 200 200 160 Emerging Markets Programhelliphelliphelliphelliphelliphelliphelliphelliphelliphelliphelliphelliphelliphellip 10 10 10 Dairy Export Incentive Programhelliphelliphelliphelliphelliphelliphelliphelliphelliphelliphelliphelliphellip 19 10 0 Foreign Food Assistance McGovern-Dole International Food for Education Programhelliphellip 84 0 0 Food for Progress - CCC Funded helliphelliphelliphelliphelliphelliphelliphelliphelliphelliphelliphellip 216 150 146 Bill Emerson Humanitarian Trusthelliphelliphelliphelliphelliphelliphelliphelliphelliphelliphelliphellip 7 a a Local and Regional Commodity Procurement Pilot Programhellip 5 25 25 Total Farm Bill Programshelliphelliphelliphelliphelliphelliphelliphelliphelliphelliphelliphelliphelliphelliphellip 582 437 384 Recovery Act Trade Adjustment Assistance for Farmershelliphelliphelliphelliphelliphelliphelliphelliphellip 25 90 22 Total Mandatory Programshelliphelliphelliphelliphelliphelliphelliphelliphelliphelliphelliphelliphelliphellip 609 529 408 Total Foreign Agricultural Servicehelliphelliphelliphelliphelliphelliphelliphelliphelliphelliphellip $3198 $2612 $2569
a Assets of the Trust can be released any time the Administrator of the US Agency for International Development determines that PL 480 Title II funding for emergency needs is inadequate to meet those needs in any fiscal year
43
FARM AND FOREIGN AGRICULTURAL SERVICES
Foreign Agricultural Service CCC Export Credit Programs
Program Level (PL) and Budget Authority (BA) (Dollars in Millions)
2009 2010 2011 Enacted Estimate Budget
Program PL BA PL BA PL BA GSM-102 Guaranteeshelliphelliphelliphelliphelliphelliphelliphelliphelliphellip $5357 $40 $5400 0 $5400 0 Facilities Financing Guaranteeshelliphelliphelliphelliphelliphellip 0 0 100 $11 100 $18 Total CCC Export Credithelliphelliphelliphelliphelliphelliphellip $5357 $40 $5500 $11 $5500 $18
CCC Export Credit Guarantee Programs The CCC export credit guarantee programs administered by FAS in conjunction with FSA provide payment guarantees for the commercial financing of US agricultural exports These programs facilitate exports to buyers in countries where credit is necessary to maintain or increase US sales
The budget includes an overall program level of $55 billion for CCC export credit guarantees in 2011 This estimate reflects the level of sales expected to be registered under the export credit guarantee programs However the actual level of programming could vary from this estimate depending upon program demand market conditions and other relevant factors during the course of the year
Of the total program level for export credit guarantees expected to be issued by CCC in 2011 $54 billion will be made available under the GSM-102 program which provides guarantees on commercial export credit extended with short-term repayment terms (up to 3 years)
The budget also includes an estimated program level of $100 million for facility financing guarantees in 2011 Under this activity CCC provides guarantees to facilitate the financing of goods and services exported from the United States to improve or establish agriculture-related facilities in emerging markets By supporting such facilities these guarantees enhance sales of US agricultural products to countries where demand is constricted due to inadequate storage processing or handling capabilities
International Federal credit programs have traditionally used government-wide assumptions about defaults and recoveries but are now encouraged to develop program specific assumptions For GSM-102 guarantees program specific recovery assumptions were incorporated into the subsidy calculation for the 2009 budget and program specific assumptions about defaults were incorporated in the 2010 budget Because actual program performance and expectations for the future differ from the government-wide assumptions used in previous years the changes to these two factors have resulted in substantially reduced subsidy rates for the program Due to a lack of historical program data government-wide assumptions continue to be used for the subsidy estimate for the facilities guarantee program
Quality Samples Program Funding for the Quality Samples Program is maintained at the 2010 level of about $25 million Under this program CCC provides funding to assist private entities
44
FARM AND FOREIGN AGRICULTURAL SERVICES
to furnish samples of US agricultural products to foreign importers in order to overcome trade and marketing obstacles The program which is carried out under the authority of the CCC Charter Act provides foreign importers with a better understanding and appreciation of the characteristics of US agricultural products
Market Development Programs FAS administers a number of programs in partnership with private sector cooperator organizations that support the development maintenance and expansion of commercial export markets for US agricultural commodities and products The 2011 budget proposes a series of adjustments in the funding levels for these programs to reflect the changing nature of agricultural trade competition
The budget increases funding for the Foreign Market Development (Cooperator) Program to $69 million in 2011 This includes $345 million to be provided by CCC consistent with provisions of the 2008 Farm Bill and an additional $345 million of discretionary funding to be provided in the FAS salaries and expenses account as part of the National Export Initiative Under this program cost-share assistance is provided to nonprofit commodity and agricultural trade associations to support overseas market development activities that are designed to remove long-term impediments to increased US trade These activities include technical assistance trade servicing and market research Annual funding for the Cooperator Program has remained relatively unchanged since the early 1980s which has discouraged new organizations from participating and new types of activities from being undertaken The priority of the Cooperator Program is the pursuit of export market gains that require longer term initiatives and resource commitments Increasing the funding level in 2011 will provide the opportunity to broaden international acceptance of the products of biotechnology which account for a third of our agricultural exports today and will account for even more in the future as well as to take advantage of emerging market opportunities that require long term market development investment
For the Technical Assistance for Specialty Crops (TASC) Program the budget includes total funding of $18 million consisting of $9 million of CCC funding and $9 million of discretionary funding provided in the FAS salaries and expenses account Similar to the Cooperator Program funding for TASC will be increased in 2011 as part of the National Export Initiative TASC is designed to address unique barriers that prohibit or threaten the export of US specialty crops Under the program grants are provided to assist US organizations in activities designed to overcome sanitary phytosanitary or related technical barriers to trade Increased funding for the program reflects the growing importance of specialty crops for US agricultural export growth and the contribution the program has made in resolving numerous trade barriers that have restricted trade
The budget provides funding of $160 million for the Market Access Program (MAP) This program reimburses participating organizations for a portion of the cost of carrying out overseas marketing and promotional activities such as consumer promotions MAP participants include nonprofit agricultural trade organizations State-regional trade groups cooperatives and private companies that qualify as small businesses Annual MAP funding has grown substantially since 2001 when the program level was $90 million Although the 2011 MAP funding level is
45
FARM AND FOREIGN AGRICULTURAL SERVICES
reduced from 2010 it still provides a program level that is nearly 80 percent above 2001 reflecting the recent strong expansion in programming
The budget maintains funding for the Emerging Markets Program at $10 million consistent with provisions of the 2008 Farm Bill The program authorizes CCC funding to be made available to carry out technical assistance activities that promote the export of US agricultural products and address technical barriers to trade in emerging markets Many types of technical assistance activities are eligible for funding including feasibility studies market research industry sector assessments specialized training and business workshops
Dairy Export Incentive Program Under the Dairy Export Incentive Program (DEIP) CCC funds are used to make bonus payments to exporters of US agricultural commodities to enable them to be price competitive and thereby make sales in targeted overseas markets where competitor countries are making subsidized sales
Because of global market conditions including falling international dairy prices and the reinstitution of dairy export subsidies by the European Union DEIP was reactivated in May 2009 and $19 million of bonuses were awarded under the program during 2009 Global market conditions are expected to improve gradually with the United States once again regaining its competitive position in export dairy markets Based on that assumption the budget includes a projected program level of $10 million for DEIP in 2010 and no funding for 2011 However should conditions warrant CCC funding can continue to be made available to the program up to the maximum annual level authorized under US commitments to the World Trade Organization
Foreign Food Assistance The United States plays a leading role in global efforts to alleviate hunger and malnutrition and enhance world food security through international food aid activities USDA contributes to these efforts by carrying out a variety of food aid programs which support economic growth and development in recipient countries
McGovern-Dole International Food for Education and Child Nutrition Program The McGovern-Dole International Food for Education and Child Nutrition Program provides for the donation of US agricultural commodities and associated financial and technical assistance to carry out preschool and school feeding programs in foreign countries Maternal infant and child nutrition programs also are authorized under the program Its purpose is to reduce the incidence of hunger and malnutrition and improve literacy and primary education These measures contribute to a healthy literate workforce that can support a more prosperous sustainable economy and ensure long-term food security
The 2011 budget continues funding for the McGovern-Dole program at the 2010 enacted level of $2095 million Appropriated funding for the program was increased substantially in 2010 in order to help support additional school feeding and child nutrition programs and to bolster the Departmentrsquos contribution to supporting economic development and food security in developing countries The program is expected to assist an estimated 5 million women and children in 2011
46
FARM AND FOREIGN AGRICULTURAL SERVICES
Food for Peace Act (PL 480) Assistance provided under the authority of the Food for Peace Act is a primary means by which the United States provides foreign food assistance Also known as PL 480 the assistance is authorized to be provided through two program authorities
bull Title I provides for sales of US agricultural commodities to developing country governments and private entities through concessional financing agreements and for donations through Food for Progress grant agreements The Title I program is administered by FAS
bull Title II provides for donations of humanitarian food assistance to needy people in foreign countries in response to malnutrition famine and other extraordinary relief requirements and to meet economic development needs that address food security The assistance is provided primarily through private voluntary organizations cooperatives or international organizations mainly the World Food Program (WFP) of the United Nations The Title II program is administered by the US Agency for International Development (USAID)
For 2011 the budget provides funding of nearly $17 billion for PL 480 Title II food assistance unchanged from the 2010 enacted level Last yearrsquos budget increased base funding for Title II programming by 38 percent over the previous year in order to bolster resources available for emergency needs enhance global food security and restore US leadership in global development efforts The 2011 budget maintains funding at that level in further support of those objectives
The budget includes no funding for Title I credit sales and grants
Food for Progress The Food for Progress Act of 1985 authorizes US agricultural commodities to be provided to developing countries and emerging democracies that have made commitments to introduce and expand free enterprise in their agricultural economies Statutory authority for the program was extended in the 2008 Farm Bill
Food for Progress agreements can be entered into with foreign governments private voluntary organizations nonprofit agricultural organizations cooperatives or intergovernmental organizations Agreements currently provide for the commodities to be supplied on grant terms
The Food for Progress authorizing statute provides for the use of CCC funding for commodity procurement transportation and associated non-commodity costs for the program
The 2011 budget assumes that $146 million of CCC funding will be used to support the Food for Progress program which is expected to support approximately 170000 metric tons of commodity assistance
Bill Emerson Humanitarian Trust The Bill Emerson Humanitarian Trust (the Trust) is a commodity andor monetary reserve designed to ensure that the United States can meet its international food assistance commitments under PL 480 Title II Substantial changes in the statutory authorities for the Trust were included in the 2008 Farm Bill These included revisions easing the criteria for release of commodities and funds from the Trust As revised the Trustrsquos
47
FARM AND FOREIGN AGRICULTURAL SERVICES
assets can now be released any time the Administrator of USAID determines that PL 480 Title II funding for emergency needs is inadequate to meet those needs in any fiscal year The revisions also removed the annual cap on the amount of commodities and funds that can be released
When a release from the Trust is authorized the Trustrsquos assets (whether commodities or funds) cover all commodity costs associated with the release All non-commodity costs including ocean freight charges internal transportation storage and handling overseas and certain administrative costs are paid for by CCC
During 2009 $7 million of assistance was provided using the Trustrsquos authority To date in 2010 no assistance has been provided and as of December 31 2009 the Trust held $315 million of cash and no commodities
Local and Regional Commodity Procurement Pilot Program The 2008 Farm Bill authorizes and provides CCC funding for a limited field-based pilot program of local and regional procurement of food aid commodities for distribution overseas Under the program which is authorized through 2012 grants are provided to private voluntary organizations cooperatives and WFP that undertake the procurement activities During 2009 FAS issued guidelines that govern operation of the pilot program and nearly $5 million of grants were awarded to the World Food Program for procurement projects in Mali Malawi and Tanzania Commodities purchased included sorghum millet beans and corn Consistent with provisions of the Farm Bill the budget provides $25 million for the pilot program in 2010 and 2011
In conjunction with an evaluation of USDA foreign food assistance programs FAS has developed a long-term performance measure that is intended to gauge the effectiveness of USDA food aid programs in improving food security in low income countries The ldquofood aid targeting effectiveness measurerdquo assesses how effective the targeting of USDA food aid programs is in addressing the food distribution gap in the most food insecure countries The Economic Research Service calculates the ratio using its Food Security Assessment Model which measures food security based on estimations of food gaps in 71 of the worldrsquos poorest countries Food gaps represent the difference between projected food availability and targeted food consumption
Because USDA food assistance programs contribute to multiple objectives including filling nutritional gaps agricultural development and childhood education performance results can vary from year to year depending upon which countries receive assistance The results will be highest in years when food is directly distributed and the country has a food distribution system that gets food to the neediest This occurred in 2008 when countries receiving assistance to meet nutritional development and educational needs had large nutritional gaps which caused a significant increase in the Food Aid Targeting Effectiveness measure
2006 2007 2008 2009 2010 2011Key Performance Measure
Food Aid Targeting 30-35 38 57 49 37 38Effectiveness (Percent)
48
FARM AND FOREIGN AGRICULTURAL SERVICES
Trade Adjustment Assistance for Farmers The Recovery Act reauthorized the Trade Adjustment Assistance (TAA) for Farmers program that was originally authorized by the Trade Act of 2002 Statutory authority for the original program had expired in December 2007 As revised by the Recovery Act USDA is now authorized to provide assistance to eligible producers of raw agricultural commodities and fishermen when production in the most recent marketing year yields less than 85 percent of the average national price production quantity value of production or cash receipts for such commodity for the 3 preceding marketing years and increases in imports contributed importantly to such declines as determined by the Secretary
TAA for Farmers provides producers of raw agricultural commodities and fishermen who have been adversely affected by import competition free technical assistance the reimbursement of certain travel and per diem costs associated with training and cash benefits of up to $12000 linked to the development and implementation of approved business adjustment plans The program covers farmers livestock producers fish farmers and fishermen competing with like or directly competitive imported products
During 2009 $25 million of TAA funding was obligated for the costs of implementing the revised program including the costs of contracting for the provision of technical assistance over a multi-year period As authorized by the Recovery Act the budget assumes annual funding of $90 million for the program for 2010 and $225 million for 2011 Statutory authority for the TAA for Farmers program expires on December 31 2010
49
FARM AND FOREIGN AGRICULTURAL SERVICES
Foreign Agricultural Service Salaries and Expenses (Dollars in Millions)
2009 2010 2011 Program Enacted Estimate Budget
Agricultural Exportshelliphelliphelliphelliphelliphelliphelliphelliphelliphelliphelliphelliphelliphelliphelliphelliphellip $112 $123 $182 New Technologieshelliphelliphelliphelliphelliphelliphelliphelliphelliphelliphelliphelliphelliphelliphelliphelliphellip 21 23 24 Food Securityhelliphelliphelliphelliphelliphelliphelliphelliphelliphelliphelliphelliphelliphelliphelliphelliphelliphelliphellip 34 38 41 Climate Changehelliphelliphelliphelliphelliphelliphelliphelliphelliphelliphelliphelliphelliphelliphelliphelliphelliphellip 3 3 3 Agricultural Reconstruction and Stablizationhelliphelliphelliphelliphelliphelliphellip 0 0 15
Total Appropriated Programshelliphelliphelliphelliphelliphelliphelliphelliphelliphelliphellip 170 187 265 FAS Computer Facility and Other IRM Costs Funded by CCChelliphelliphelliphelliphelliphelliphelliphelliphelliphelliphelliphelliphelliphelliphelliphelliphellip 20 24 21 Development Assistance Programs Funded by AID and Other Organizationshelliphelliphelliphelliphelliphelliphelliphelliphelliphelliphelliphellip 67 66 66 Agricultural Reconstruction and Stablization Activities funded by USAID and the Dept of Statehelliphelliphelliphelliphelliphelliphelliphelliphelliphelliphellip 19 209 18 Other Reimbursable Agreementshelliphelliphelliphelliphelliphelliphelliphelliphelliphelliphelliphellip 35 41 28
Total Reimbursable Program Activityhelliphelliphelliphelliphelliphelliphelliphellip 141 340 133 Total FAS Salaries and Expenseshelliphelliphelliphelliphelliphelliphelliphelliphelliphellip $311 $527 $398
Agricultural exports make a critical contribution to the prosperity of local and regional economies across rural America through increased sales and higher commodity prices Every $1 billion worth of agricultural exports supports an estimated 9000 jobs and $14 billion in economy activity Because of this important role the Department has established a high priority performance goal that by the end of 2011 it will reduce non-tariff trade barriers for five major export markets and increase US agricultural exports by $2 billion per year
Biotechnology crops and derived products are a significant portion of US agricultural exports However concerns about these products have prompted some countries to establish regulatory barriers to trade in biotechnology products as well as other measures that limit the technologyrsquos potential to help meet food security needs In a concerted and strategic effort to address these barriers FAS will play a key role in implementing a formal USDA Strategy for Facilitating the Export of Genetically Engineered Agricultural Commodities FAS will work under this coordinated approach with other agencies within USDA and elsewhere in the government as well as with allies worldwide to help address these trade barriers as well as to help other nations understand how biotechnology may help address the global challenges of food security energy security and climate change
A key component of FASrsquo work to facilitate access to overseas markets is compliance monitoring and enforcement of existing trade agreements to ensure full and fair access to overseas markets for Am erican producers and exporters Each year FAS personnel in Washington and at overseas posts monitor compliance and when necessary intervene with
50
FARM AND FOREIGN AGRICULTURAL SERVICES
foreign governments on behalf of US exporters w ho face market access difficulties as a result of unfair and illegal trade barriers Increasingly in recent years these barriers have involved Sanitary and Phytosanitary (SPS) measures As tariffs have come down globally SPS measures to protect human animal and plan t health have become more prominent barriers to trade and have required significantly enhanced efforts by FAS in collaboration with other USDA agencies to address and resolve
There can be considerable year-to-year variability in the dollar value o f tr ade preserved particularly in the case of SPS measures and t echn ical barriers to trade such as biotechnology-related trade measures Biotechnology-related me asures in particular affect major US export commodities such as rice corn soybeans and cotton and the economic significance of a single trade disruption with a major market can be substantial High commodity prices can also affect the annual level of trade preserved This variability is evident in the substantially higher value of trade preserved during 2008 and 2009 The threat to US agricultural exports from non-science based SPS barriers continues to grow and can impact billions of dollars of our trade USDA actions in 2008 and 2009 maintained soybean exports to China worth $63 billion in 2008 and $74 billion in 2009
Key Performance Measure Dollar value of agriculture trade preserved through trade agreement negotiation monitoring and enforcement ($ Billions)
2006 2007 2008 2009 2010 2011
Non-SPS Activities a $07 $05 $04 $05 $05
Value of trade preserved annually through USDA staff interventions leading to resolution of barriers created by SPS or Technical Barrier to Trade measures ($ Billions)
SPS-Related Activities b 26 $26
25 $32
73 $78
95 $99
36 $41
40 $45
a Less than $50 million b In 2008 and 2009 includes soybean exports to China
FAS conducts its activities and programs through offices in Washington DC and at 97 overseas locations The overseas offices represent and advocate for US agricultural interests provide reporting on agricultural policies production and trade for about 150 countries assist US exporters trade groups and State export marketing officials in their trade promotion efforts and help to implement technical assistance and trade capacity building programs that contribute to increased food security
51
FARM AND FOREIGN AGRICULTURAL SERVICES
The budget provides an appropriated funding level of $265 million for FAS activities in 2011 an increase of $79 million above the 2010 enacted level Of particular note increased funding is provided to expand export promotion activities maintain the agencyrsquos overseas presence at current levels and improve information technology (IT) network support at its overseas offices
Export Promotion The budget includes $54 million in discretionary funding for trade expansion activities as part of the National Export Initiative that is designed to spur economic growth and employment opportunities This includes an increase of $10 million to expand FAS exporter assistance and in-country promotion activities and to meet higher operating costs at FAS overseas posts The initiative also includes $345 million to supplement funding for the Foreign Market Development (Cooperator) Program and $9 million for the Technical Assistance for Specialty Crops (TASC) Program Funding for the Cooperator and TASC programs will be in addition to that provided by CCC and will double the overall level of funding available to both programs in 2011 Funding is increased for the Cooperator Program in order to broaden the opportunity for program participation and to support new innovative pr ogram activities The expansion in TASC funding reflects the growing importance of specialty crops for US agricultural export growth and the success TASC has had in helping to resolve numerous trade barriers
Overseas Administrative Costs The budget provides $34 million for increased payments to the Department of State for administrative services provided at overseas posts FAS has no administrative staff overseas and therefore relies on the Department of State and other agencies for the provision of those services
Overseas IT Network Support An increase of $4 million is provided for FAS to contract with the Department of State for overseas IT network support and maintenance This will allow FAS to take advantage of the secure information system infrastructure that is operated and maintained by the State Department and ensure that sensitive agency information is fully protected
Cochran and Borlaug Fellowship Programs The budget provides increased funding of $15 million for the Cochran and Borlaug Fellowship Programs These programs provide training and collaborative research opportunities in the United States for foreign agricultural researchers policy officials and other agricultural specialists and thereby help to advance US government food security and trade policy objectives Among other things the additional funding will enable an expansion of programs in Afghanistan and Pakistan to train agricultural extension agents veterinary officials and researchers in support of agricultural growth and development It will also allow for additional training in support of food security objectives in sub-Saharan African countries as well as Haiti Under our proposals as many as 680 individuals will be able to participate in and benefit from these programs
Agricultural Reconstruction and Stabilization The FAS budget also includes $146 million to support the Departmentrsquos participation in reconstruction and stabilization activities including Provincial Reconstruction Teams (PRTs) primarily in Afghanistan and Iraq Of this $13 million is moved from Departmental Management where it was funded in the 2010 appropriations act During the past year FAS has assumed full management of the operational and policy components of USDArsquos reconstruction and stabilization activities FAS also
52
FARM AND FOREIGN AGRICULTURAL SERVICES
coordinates closely with the Department of State which sets overall operational and administrative policies for activities in those two countries Transferring the funding for these activities to FAS provides for more efficient operations and is consistent with how the Department is now managing them Funding for these activities is increased by $16 million over the 2010 level to provide for an expansion of activities in Afghanistan and to meet higher operating costs
USDA is supporting implementation of the Presidentrsquos strategies for Afghanistan and Iraq by providing technical experts who serve as advisors to key government ministries and serve on civilian-military command units including PRTs working with farmers and local agricultural officials throughout the countries During 2010 USDA is increasing the number of agricultural advisors serving in Afghanistan from 14 to 64 Their work is essential for stabilizing strategic areas of the country building government capacity ensuring the successful management of assistance programs and addressing the issue of food insecurity Consistent with these efforts the Department has established a high priority performance goal of increasing the number of Afghan provinces in which women and children are food secure from 10 to 14 by the end of 2011
In addition the budget includes an estimated $133 million in funding to be made available to FAS through reimbursable agreements The largest components of this are funding for technical assistance training and research activities that FAS carries out overseas on behalf of USAID foreign governments and international organizations and agricultural reconstruction and stabilization activities that are funded by USAID and the Department of State Although funded by other agencies these activities are an important component of the Departmentrsquos efforts to support economic development and enhance food security in developing countries
53
RURAL DEVELOPMENT
Rural Housing 62
MISSION AND RELATIONSHIP TO STRATEGIC GOAL
Rural communities and businesses are implementing innovative technologies and modernizing infrastructure to create jobs develop new markets and increase competitiveness while conserving the Nationrsquos natural resources and providing a safe sufficient and nutritious food supply for the country and the world As a leading advocate for rural America USDA is at the forefront of developing the technology and tools necessary to transform rural America to take advantage of new opportunities All of the funding for USDArsquos Rural Development (RD) programs contributes to the Strategic Goal assisting rural communities to create prosperity by providing financial and technical assistance to rural residents businesses and private and public entities for a broad range of purposes that bring prosperity and better living to Rural America These programs are grouped within three agencies (1) the Rural Business-Cooperative Service (RBS) which provides assistance for the development of business and industry including small businesses and is currently implementing new loan guarantee and payment programs specifically designed for renewable energy and energy improvement projects (2) the Rural Utilities Service (RUS) which provides assistance for water and waste disposal rural electric and telecommunications including broadband access and (3) the Rural Housing Service (RHS) which provides assistance for home ownership multi-family housing and essential community facilities such as health and public safety infrastructure
Rural Development 2011 Program Level - $ 24 Billion
Rural Business 7
Salaries and Expenses
3
Rural Utilities 28
The type of assistance offered includes direct loans loan guarantees grants and technical assistance Some programs provide assistance to intermediaries that make loans or provide technical assistance to the ultimate beneficiaries Several of the programs require or encourage recipients to contribute their own resources or obtain third-party financing to support the total cost of projects in which case these programs leverage the Governmentrsquos support with private sector financing
The cost of programs that provide direct or guaranteed loans depends upon a number of factors including what prevailing interest rates are whether the interest rate on the loans is subsidized by
54
RURAL DEVELOPMENT
the Government whether there are fees and how much risk of loss is involved In the tables the budget authority for each program reflects the cost to the government to support the loan level Several of the loan programs operate at little or no cost to the Government These programs account for most of the financial assistance that RD provides They also impose a responsibility on RD to ensure that these loans are repaid within the parameters reflected in the subsidy rates applied at the time the loans were made
RD delivers its programs through a network of approximately 450 area offices and 47 State offices a centralized servicing center and finance office in St Louis Missouri and a national office
The 2011 budget includes about $29 billion in budget authority to support a program level of $24 billion in loans grants and other assistance This level of support reflects a strong commitment to Rural America It also reflects new policy directions including support for regional planning and collaboration rural and urban access to healthy foods rural homeownership and a reduction in the Nationrsquos dependence on fossil fuels
55
RURAL DEVELOPMENT
RURAL BUSINESS - COOPERATIVE SERVICE (RBS)
Program Level (PL) and Budget Authority (BA) (Dollars in Millions)
2009 2010 2011 Enacted Estimate Budget
Program PL BA PL BA PL BA Discretionary Business and Industry Guaranteed Loans helliphelliphelliphelliphelliphelliphelliphellip $993 $43 $993 $53 $942 $40 Rural Business Enterprise Grantshelliphelliphelliphelliphelliphelliphelliphelliphelliphelliphellip 39 39 39 39 39 39 Rural Business Opportunity Grantshelliphelliphelliphelliphelliphelliphelliphelliphelliphellip 5 5 5 5 3 3 Intermediary Relending Programhelliphelliphelliphelliphelliphelliphelliphelliphelliphelliphellip 34 14 34 8 36 14
Rural Economic Development Direct Loanshelliphelliphelliphelliphelliphelliphelliphelliphelliphelliphelliphelliphelliphelliphelliphelliphelliphellip 36 0 33 0 33 0 Grantshelliphelliphelliphelliphelliphelliphelliphelliphelliphelliphelliphelliphelliphelliphelliphelliphelliphelliphelliphelliphellip 10 0 10 0 10 0 Rural Microentrepreneur Assistance Program (Sec 6022) Guaranteed Loanshelliphelliphelliphelliphelliphelliphelliphelliphelliphelliphelliphelliphelliphelliphelliphellip 0 0 12 3 24 7 Grantshelliphelliphelliphelliphelliphelliphelliphelliphelliphelliphelliphelliphelliphelliphelliphelliphelliphelliphelliphelliphellip 0 0 3 3 1 1 Rural Cooperative Development Grantshelliphelliphelliphelliphelliphelliphelliphellip 9 9 14 14 20 20 Biorefinery Assistance Program (Sec 9003)helliphelliphelliphelliphelliphelliphellip 0 0 0 0 50 17 Value-added Ag Product Market Development helliphelliphelliphelliphellip 4 4 20 20 20 20 Rural Energy for America Program (Sec 9007) Guaranteed Loanshelliphelliphelliphelliphelliphelliphelliphelliphelliphelliphelliphelliphelliphelliphelliphellip 26 2 144 20 12 5 Grantshelliphelliphelliphelliphelliphelliphelliphelliphelliphelliphelliphelliphelliphelliphelliphelliphelliphelliphelliphelliphellip 3 3 20 20 34 34 EZEChelliphelliphelliphelliphelliphelliphelliphelliphelliphelliphelliphelliphelliphelliphelliphelliphelliphelliphelliphelliphellip 8 8 0 0 0 0 Subtotal RBS Programshelliphelliphelliphelliphelliphelliphelliphelliphelliphelliphelliphelliphelliphellip 1167 127 1327 185 1224 200 Salaries and Expenseshelliphelliphelliphelliphelliphelliphelliphelliphelliphelliphelliphelliphelliphelliphelliphellip 5 5 5 5 5 5 Total Ongoing Programshelliphelliphelliphelliphelliphelliphelliphelliphelliphelliphelliphelliphellip 1172 132 1332 190 1229 205 Recovery Act
Business and Industry Guaranteed Loanshelliphelliphelliphelliphelliphellip 1572 126 0 0 0 0 Rural Business Enterprise Grantshelliphelliphelliphelliphelliphelliphelliphelliphellip 19 19 0 0 0 0
Total Recovery Act Programshelliphelliphelliphelliphelliphelliphelliphelliphelliphelliphelliphellip 1591 145 0 0 0 0 Total Discretionary Programshelliphelliphelliphelliphelliphelliphelliphelliphelliphelliphelliphellip 2763 277 1332 190 1229 205 Mandatory Farm Bill
Biorefinery Assistance Guaranteed Loans (Sec 9003)hellip 225 75 691 245 0 0 Rural Energy for America Loans (Sec 9007)helliphelliphelliphellip 275 27 213 29 73 34 Rural Energy for America Grants (Sec 9007)helliphelliphelliphellip 28 28 31 31 36 36 Repowering Assistance Payments (Sec 9004)helliphelliphelliphellip 35 35 0 0 0 0 Bioenergy for Advanced Biofuels (Sec 9005)helliphelliphelliphellip 55 55 55 55 85 85 Value-added Ag Product Market Development helliphelliphellip 15 15 0 0 0 0 Rural Microentrepreneur Assist Loans (Sec 6022)helliphellip 9 3 3 1 6 2 Rural Microentrepreneur Assist Grants (Sec 6022)hellip 1 1 3 3 2 2
Total Mandatory Programshelliphelliphelliphelliphelliphelliphelliphelliphelliphelliphelliphelliphellip 643 239 996 364 202 159 Total RBS Programshelliphelliphelliphelliphelliphelliphelliphelliphelliphelliphelliphelliphelliphelliphellip$3406 $516 $2328 $554 $1431 $364
56
RURAL DEVELOPMENT
RBS administers RDrsquos rural business and cooperative services programs The primary purpose of these programs is to promote economic development
Healthy Food Financing Initiative This initiative is designed to support local and regional efforts to increase access to healthy foods particularly for the development of grocery stores and other healthy food retailers in urban and rural food deserts and other underserved areas Several RD programs are included in this initiative and are expected to be utilized to provide financing for grocery stores and other related infrastructure
Regional Innovation The 2011 budget also includes an initiative to establish a Regional Innovation Initiative to focus on the planning and coordination of USDA and other sources of assistance for rural communities This initiative recognizes that individual communities are often affected by linkages to the other communities within regions and that working together can produce more prosperity for all RD is expected to provide leadership for this initiative although several other USDA agencies are expected to participate The budget includes $14 million to fund coordination of this initiative under the salaries and expenses account
Business and Industry Guarantee Loan Program The Business and Industry (BampI) loan guarantee program the largest program level of the RBS programs provides protection against loan losses so that lenders are willing to extend credit to establish expand or modernize rural businesses The tightening rural credit markets have brought a renewed interest in the BampI program The 2011 budget supports a program level of over $900 million in BampI loan guarantees almost the same as the 2010 level The 2011 budget also proposes to increase the one-time fee on BampI guaranteed loans from up to 2 percent in 2010 to up to 3 percent in 2011 This increase is needed because increased defaults have raised the subsidy cost of the program The BampI program is expected to provide support for the Regional Innovation and Healthy Food Financing initiatives
The Recovery Act provided $126 million in budget authority that supports $16 billion in program level for BampI guarantees A significant portion of the funding provided by the Recovery Act remains available throughout 2010
Rural Business Enterprise Grant Program The Rural Business Enterprise Grant program provides grants for rural projects that finance and facilitate development of small and emerging rural businesses The 2011 budget provides $39 million for grants the same level as 2010 The program is also expected to support the Regional Innovation and Healthy Food Financing initiatives
Rural Business Opportunity Grant Program The Rural Business Opportunity Grant program promotes sustainable economic development in rural communities with exceptional needs through training and technical assistance for business development entrepreneurs and economic development officials and to assist with economic development planning The 2011 budget provides almost $3 million for grants the same level as 2010
Intermediary Relending Program The Intermediary Relending program provides one percent interest direct loans to entities that relend to rural businesses at a higher interest rate and use their
57
RURAL DEVELOPMENT
interest earnings to pay for their administrative expenses and develop capital reserves The 2011 budget supports a program level of $36 million in direct loans under this program about $2 million more than 2010 The program is also expected to provide support for the Regional Innovation and Healthy Food Financing initiatives
Rural Microentrepreneur Assistance Program Under this new program one percent direct loans and grants are made to microenterprise development organizations (MDOrsquos) The loans will be used to establish reserves for relending to microentrepreneurs and the grants are made to the MDOrsquos which may relend a portion to provide training operational support business planning and market development assistance The 2011 budget includes $8 million in discretionary funding This funding will support $24 million in loans and about $1 million in grants Including the $4 million in mandatory funding the total funding available in 2011 for this program is $30 million in loans and $3 million in grants
Rural Cooperative Development Grant Program The 2011 budget includes $20 million for this program a $6 million increase over 2010 The additional funding will be used to support locally produced distribution systems and the development of new cooperatives Cooperatives assisted by this program serve many small and minority producers
Value-Added Producer Grants The 2011 budget maintains the Value-Added Producer Grants program at the 2010 level of $20 million The program provides grants for a wide range of value-added projects including those that change the physical state of agricultural products or the way such products are marketed Ten percent of the funding is reserved for mid-tier marketing chains
Rural Energy for America Program (Section 9007) RBS has operated a renewable energy loan and grant program for the purchase of renewable energy systems and energy efficiency improvements since the passage of the 2002 Farm Bill Section 9007 of the Farm Bill implemented the Rural Energy for America Program (REAP) REAP provides similar assistance as its predecessor program the Renewable Energy and Energy Efficiency Improvement Program however REAP can now offer funding for energy audits and feasibility studies The Farm Bill provides mandatory funding that will support a program level of $73 million in loans and $36 million in grants for 2011 about $135 million below the 2010 level In addition the 2011 budget supports a discretionary program level of $12 million in loan guarantees and $34 million in grants a reduction of $132 million in program level and an increase of $14 million in grants from the 2010 level
Biorefinery Assistance Program (Section 9003) RBS now has the capability to guarantee loan funds for biorefineries up to $250 million per project Rural Development has approved three loans for biorefineries under a Notice of Funding Availability that was published in November of 2008 and is currently developing permanent regulations for the program The 2008 Farm Bill provided funding in 2008 and 2009 to support over $900 million in loan guarantees and authorizes additional funds for 2009 through 2012 The 2011 budget requests $17 million in discretionary funding to support a program level of $50 million for these facilities With this funding the total available for Section 9003 Program is over $950 million
58
RURAL DEVELOPMENT
All the funding for RD programs is expected to save or create jobs however only the business programs collect data on jobs rather than use a common multiplier to estimate them The table below reflects performance for 2009 and projections for 2010 and 2011 The projections are subject to change
Key Performance Measure 2006 2007 2008 2009 2010 2011 Number of jobs created or saved through USDA financing of businesses 71715 72710 72907 68969 72369 73224
Note Performance includes other RBS loan and grant programs that were not identified in the text
59
RURAL DEVELOPMENT
RURAL UTILITIES SERVICE (RUS)
Program Level (PL) and Budget Authority (BA) (Dollars in Millions)
2009 2010 2011 Program Enacted Estimate Budget
PL BA PL BA PL BA Discretionary Electric Programs Direct Loanshelliphelliphelliphelliphelliphelliphelliphelliphelliphelliphelliphelliphellip $6600 a $7100 0 $4100 0
Telecommunications Programs Direct Loanshelliphelliphelliphelliphelliphelliphelliphelliphelliphelliphelliphelliphellip 690 a 690 0 690 0
Distance Learning and Telemedicine Programs Grantshelliphelliphelliphelliphelliphelliphelliphelliphelliphelliphelliphelliphelliphelliphelliphellip 35 $35 38 $38 30 $30
Broadband Programs Direct Loanshelliphelliphelliphelliphelliphelliphelliphelliphelliphelliphelliphelliphellip 400 16 400 29 400 22 Grantshelliphelliphelliphelliphelliphelliphelliphelliphelliphelliphelliphelliphelliphelliphelliphellip 13 13 18 18 18 18
High Energy Costs Grants helliphelliphelliphelliphelliphelliphelliphellip 18 18 18 18 0 0 Water and Waste Disposal Programs Direct Loanshelliphelliphelliphelliphelliphelliphelliphelliphelliphelliphelliphelliphellip 1095 142 1022 77 1036 89 Guaranteed Loans helliphelliphelliphelliphelliphelliphelliphelliphelliphelliphellip 75 0 75 0 75 0 Grants helliphelliphelliphelliphelliphelliphelliphelliphelliphelliphelliphelliphelliphelliphelliphellip 397 397 474 474 446 446 Subtotal Water and Wastehelliphelliphelliphelliphelliphelliphellip 1567 539 1571 551 1557 535 Subtotal RUS programshelliphelliphelliphelliphelliphelliphelliphellip 9323 621 9835 654 6795 605
Salaries and Expenseshelliphelliphelliphelliphelliphelliphelliphelliphelliphelliphellip 39 39 40 40 38 38
Total Ongoing Discretionary Programshelliphellip 9362 660 9875 694 6833 643
Recovery Act Broadband Programs
Direct Loanhelliphelliphelliphelliphelliphelliphelliphelliphelliphelliphellip 7160 485 0 0 0 0 Grantshelliphelliphelliphelliphelliphelliphelliphelliphelliphelliphelliphelliphelliphellip 1940 1940 0 0 0 0
Water and Waste Programs Direct Loanshelliphelliphelliphelliphelliphelliphelliphelliphelliphelliphellip 2154 273 0 0 0 0 Grantshelliphelliphelliphelliphelliphelliphelliphelliphelliphelliphelliphelliphellip 1106 1106 0 0 0 0
Total Recovery Act Programshelliphelliphelliphelliphelliphellip 12360 3804 0 0 0 0 Total RUS Programshelliphelliphelliphelliphelliphelliphelliphellip $21722 $4464 $9875 $694 $6833 $643
a Less than $05 million
Electric and Telecommunications Programs The Electric and Telecommunications programs administered by RUS provide loans to establish expand and modernize vital components of the infrastructure of rural America They are long-standing programs that brought electric and telecommunication services to rural America and ensured universal service for the Nation While most borrowers have some access to private credit markets the programs help to leverage private sector investments as well as fill credit gaps that still exist for some rural areas and borrowers In addition the programs facilitate the financing of improvements to facilities that
60
RURAL DEVELOPMENT
RUS financed in the past and still holds a lien There are a number of ways USDArsquos electric program can be used to support energy conservation and efficiency projects The 2008 Farm Bill amended the Rural Electrification Act (REA) to make electric program funding available for these purposes Loans can be made to electric cooperatives that in turn offer rebates or provide loans to their customers for energy conservation and efficiency projects There is also a provision in the REA to provide deferments on certain electric loans for these purposes The Rural Economic Development Loan and Grant (REDLG) program that is administered by RBS also provides funding for electric cooperatives that may be used to support energy conservation and efficiency projects
The 2011 budget reflects the Presidentrsquos 2009 G20 commitment to phase out fossil fuels subsidies Consistent with this commitment no loan funds are provided for new construction of base or peak load generation from coal or natural gas Loan funds will be used only for the transmission and distribution of electricity carbon capture projects and the generation of electricity from renewable sources including wind The budget supports $41 billion in loans for these purposes which is expected to be sufficient to meet the demand Loans for nuclear power generation will continue to be handled by the Department of Energy
The performance indicator identifies the number of borrowerssubscribers receiving new andor improved electric service The reduction in performance is directly attributed to the reduction in program level to meet the Presidentrsquos G20 commitment to reduce fossil fuel subsidies This measure includes the improvement of existing facilities as many facilities are improved several times over their estimated useful life which results in a larger number of people being served than actually live in the service territories
Key Performance Measure 2006 2007 2008 2009 2010 2011 Number of borrowerssubscribers receiving new andor improved electric facilities (millions)
82 58 81 98 61 38
The 2011 budget also supports $690 million in telecommunications loans which is the same as 2010 and also expected to be sufficient to meet demand These loans are used for the improvement and construction of telecommunication facilities that meet broadband standards although they are not meant to be used for all broadband purposes
The performance indicator displays performance information for the traditional telecommunications and broadband loan programs Program funding has been maintained at the same level in recent years and performance for the program has remained constant
61
Key Performance Measure 2006 2007 2008 2009 2010 2011
Number of borrowerssubscribers receiving new or improved telecommunication services (millions)
030 036 078 019 035 035
RURAL DEVELOPMENT
BroadbandDistance Learning and Telemedicine The ongoing Broadband program is similar to the Broadband program that is currently active under the Recovery Act The Distance Learning and Telemedicine Grant Program is designed specifically to assist rural communities that would otherwise be without access to learning and medical services over the Internet
The 2011 budget includes $70 million in funding to support $418 million in broadband loans and grants and $30 million in grants under the Distance Learning and Telemedicine program The overall reduction of $78 million in funding from 2010 reflects termination of the grants for analog conversion and the healthcare services grants
Staff resources are currently being fully utilized administering the Broadband program authorized by the Recovery Act which provided $25 billion in budget authority for broadband loans and grants This effort is being coordinated with the Federal Communications Commission and National Telecommunications and Information Administration It is anticipated the Recovery Act funding will be fully utilized in 2010
New regulations to implement the 2008 Farm Bill modifications in the ongoing program are expected to improve the performance of the program by providing better focus on rural areas that lack access to existing providers and by strengthening the financial integrity of the loan making process
High Energy Cost Grants The intent of this program is to provide funding for energy and other rural development purposes in areas that have high energy costs No funding is provided for this program because only a limited number of States can qualify and the purposes of the program can be met through other RD programs
Water and Waste Disposal Program The Water and Waste Disposal Program provides financing for rural communities to establish expand or modernize water treatment and waste disposal facilities These facilities provide safe drinking water and sanitary waste disposal for residential users and help communities thrive by attracting new business Projects are designed for energy efficiency and water conservation
Eligibility is limited to communities of 10000 or less in population that are unable to obtain credit elsewhere In addition financing is available only to those communities with low median household income levels Priority is given to public entities serving areas with less than 5500 population and applying for loans to restore a deteriorating water system or improve enlarge or modify an inadequate waste facility Grants are limited to a maximum of 75 percent of project costs Program regulations stipulate that the grant amount should only be as much as necessary to bring the user rates down to a reasonable level for the area Water and Waste Disposal grant and
62
RURAL DEVELOPMENT
loan funds are usually combined based on the income levels and user costs Grants are also provided for solid waste disposal and technical assistance and training
The 2011 budget provides $535 million in budget authority to support over $1 billion in direct loans $75 million in guaranteed loans and $446 million in grants for a total program level of about $16 billion This level is approximately the same as the 2010 appropriated level
The performance indicator measures the number of borrowerssubscribers receiving new or improved service from water facilities funded by Rural Development The 2008 Farm Bill provided an additional $300 million in funding in 2008 that attributed to the increase in performance In recent years the Water and Waste Disposal Program has received a similar appropriation and program performance has remain consistent with the level of program activity
Key Performance Measure 2006 2007 2008 2009 2010 2011
Number of borrowerssubscribers receiving new or improved service from agency funded water facility (millions)
17 13 44 34 14 14
The Recovery Act provided an additional $13 billion in budget authority sufficient to support $33 billion in loans and grants for reducing the backlog of applications This funding is expected to be fully utilized by the end of 2010
63
RURAL DEVELOPMENT
RURAL HOUSING SERVICE (RHS)
Program Level (PL) and Budget Authority (BA) (Dollars in Millions)
2009 2010 2011 Enacted Estimate Budget
Program PL BA PL BA PL BA Discretionary Single Family Housing
Direct Loans (Sec 502)helliphelliphelliphelliphelliphelliphelliphelliphelliphellip $1121 $75 $1121 $40 $1200 $75 Guaranteed Loans (Sec 502)helliphelliphelliphelliphelliphelliphelliphellip 6232 79 11961 173 12000 b
Multi Family Housing Direct Loans (Sec 515)helliphelliphelliphelliphelliphelliphelliphelliphelliphellip 70 29 70 19 95 32 Guaranteed Loans (Sec 538)helliphelliphelliphelliphelliphelliphelliphellip 129 8 129 1 129 13
Very Low-Income Repair (Sec 504) Direct Loans helliphelliphelliphelliphelliphelliphelliphelliphelliphelliphelliphelliphelliphellip 34 9 34 4 34 6 Grants helliphelliphelliphelliphelliphelliphelliphelliphelliphelliphelliphelliphelliphelliphelliphelliphellip 32 32 32 32 31 31
All Other Direct Loanshelliphelliphelliphelliphelliphelliphelliphelliphelliphelliphellip 21 a 21 a 21 1 Grants and Payments
Rental Assistance (Sec 502 and 521)helliphelliphelliphelliphellip 903 903 980 980 966 966 Mutual and Self-Help (Sec 523)helliphelliphelliphelliphelliphelliphellip 39 39 42 42 37 37 Multi-Family Housing Revitalization helliphelliphelliphelliphellip 32 28 69 43 18 18 All Other Grant and Loan programshelliphelliphelliphelliphellip 10 10 14 14 9 9
Farm Labor Housing Program Direct Loans (Sec 514)helliphelliphelliphelliphelliphelliphelliphelliphelliphellip 22 9 27 10 27 10 Grants (Sec 516)helliphelliphelliphelliphelliphelliphelliphelliphelliphelliphelliphelliphellip 9 9 10 10 10 10
Community Facilities Programs Direct Loanshelliphelliphelliphelliphelliphelliphelliphelliphelliphelliphelliphelliphelliphelliphellip 295 17 295 4 295 4 Guaranteed Loanshelliphelliphelliphelliphelliphelliphelliphelliphelliphelliphelliphellip 206 6 206 7 206 8 Grants helliphelliphelliphelliphelliphelliphelliphelliphelliphelliphelliphelliphelliphelliphelliphelliphellip 41 41 45 45 30 30 Subtotal RHS Programshelliphelliphelliphelliphelliphelliphelliphelliphellip 9196 1294 15056 1424 15108 1250
Salaries and Expenseshelliphelliphelliphelliphelliphelliphelliphelliphelliphelliphelliphellip 460 460 469 469 455 455 Total Ongoing Discretionary Programshelliphelliphellip $9656 $1754 $15525 $1893 $15563 $1705
Recovery Act Single Family Housing
Direct (Sec 502)helliphelliphelliphelliphelliphelliphelliphelliphelliphellip 1563 65 0 0 0 0 Guaranteed Loans (Sec 502)helliphelliphelliphelliphelliphellip10111 129 0 0 0 0
Community Facility Programs Directhelliphelliphelliphelliphelliphelliphelliphelliphelliphelliphelliphelliphelliphellip 1136 24 0 0 0 0 Grantshelliphelliphelliphelliphelliphelliphelliphelliphelliphelliphelliphelliphelliphelliphellip 102 102 0 0 0 0
Total Recovery Act Programshelliphelliphelliphelliphelliphelliphelliphelliphellip12912 320 0 0 0 0 Total Discretionary Programshelliphelliphelliphelliphelliphelliphelliphelliphellip$22568 $2074 $15525 $1893 $15563 $1705
a Less than $05 million b The budget proposes a new fee structure similar to HUD with no cost to the government
64
RURAL DEVELOPMENT
Single Family Direct and Guaranteed Loan Programs The Single Family Housing program provides direct and guaranteed loans to low and moderate income families in rural areas RHS is the only Federal agency that provides direct loans for this purpose Direct loans are limited to families with incomes less than 80 percent of area median income The interest rate on these loans may be subsidized down to one percent interest Guaranteed loans are limited to families with incomes less than 115 percent of area median income The interest rate on these loans is negotiated between the borrower and the private lender Currently there is a one-time guarantee fee of 2 percent for new loans and 05 percent on loans for refinancing This guarantee fee can be financed as part of the loan amount so that it does not impose an up-front cost that some borrowers may not be able to pay
The 2011 budget provides for a $12 billion program level for direct loans about $79 million above 2010 and maintains the 2010 appropriated level of $12 billion for guaranteed loans These levels are expected to provide about 98993 homeownership opportunities a decrease from 2010 which reflects anticipated higher housing prices due to the improved economic conditions
The performance measure below displays the number of homeownership opportunities that Rural Development has provided during the fiscal year In the past these programs have received additional funding through supplemental appropriations for disaster relief efforts that affected the performance information The 2010 appropriation nearly doubled the amount of program funds that were typically provided in recent years While the appropriation for 2011 is maintained at the 2010 level the small reduction in performance can be attributed to anticipated higher housing prices due to the improved economic conditions as indicated above
Key Performance Measure 2006 2007 2008 2009 2010 2011 Homeownership opportunities provided 42172 43532 66574 55957 106030 98993
While the single family housing programs have experienced modest increases in defaults due to the current economic crisis the programs did not make or guarantee sub-prime loans during the years that led up to the crisis and remain financially sound Moreover the demand for these programs has increased as demonstrated by the rapid utilization of Recovery Act funding Accordingly USDA is proposing that the guaranteed loan program be adapted to reflect the high demand for this program by charging an annual fee in addition to the guarantee fee This annual fee at an estimated rate of 015 percent in 2011 would be distributed over the year in monthly payments This change in policy is consistent with that of HUD and the VA
The Recovery Act provided an additional $65 million in budget authority for direct loans sufficient to support about $16 billion in loans and $129 million in budget authority sufficient to support over $10 billion in guaranteed loans Recovery Act funding for both the direct and guaranteed loan programs is expected to provide more than 90000 homeownership opportunities Most of this funding was used in 2009
Multi-Family Housing Programs The Multi-Family Housing program provides financing for rental housing projects and rental assistance payments for low-income tenants of those projects
65
RURAL DEVELOPMENT
The portfolio of previously financed projects currently includes about 17000 projects that provide housing for about 460000 low-income tenants many of whom are elderly The average annual income of tenants is about $8000
In recent years USDA has focused on the revitalization of existing projects As part of this effort the outstanding debt on these projects was deferred and other incentives offered to sponsors in exchange for a commitment to seek private sector financing to revitalize their projects and remain in the program The 2011 budget reflects a change in policy toward new construction Accordingly the 2011 budget includes additional budget authority to increase the program level for Section 515 direct loans for multi-family housing from $70 million in 2010 to over $95 million in 2011 which is expected to be used for both new construction and rehabilitation of the existing portfolio The 2011 budget proposes to terminate funding for the revitalization demonstration program Section 538 guaranteed loans would be maintained at $129 million with additional budget authority being provided to accommodate an increase in subsidy costs The policy of no interest subsidy and charging no fees on guaranteed loans would be maintained
The multi-family housing voucher program would be continued at a level of $18 million This program provides one-year vouchers to protect the rents of tenants affected by projects leaving the program
Most multi-family housing projects that are financed with direct loans also receive Rental Assistance Payments The payments are used to reduce the rents of low income families to no more than 30 percent of their income These payments are made through contracts with project sponsors Providing funding for the renewal of expiring rental assistance payment contracts is essential to RHSrsquo efforts to protect the Governmentrsquos investment and ensure the projects are revitalized and remain in the program The 2011 budget includes $966 million to renew about 212000 expiring contracts and provide new contracts on both Section 515 and Farm Labor Housing The modest decrease in funding is due to improvements in the way the need for renewing expiring contracts is estimated
Other Housing Programs Rural Development offers a full array of supplemental housing programs such as Very-low Income Repair loans and grants Rural Housing Preservation Farm Labor Housing loans and grants and Self-Help Housing These programs are maintained at approximately the same program levels as in 2010
Community Facilities Loan and Grant Programs RHS also administers a Community Facilities program that provides funding for a wide range of essential Community Facilities Priority is given to health and public safety facilities The program serves rural communities of up to 20000 in population
The 2011 budget provides funding for $295 million in direct loans $206 million in loan guarantees and $30 million in grants all under the basic Community Facilities program The loan levels are the same as for 2010 while the grant level is $15 million lower due to the elimination of three small special interest community facilities programs namely Rural Community Development Initiative grants Tribal College grants and Economic Impact
66
RURAL DEVELOPMENT
Initiative grants Other RD programs are available to provide assistance similar to that offered by these programs
The performance measure below measures the percent of rural residents who are provided with improved essential community services such as health and safety facilities Program funding and performance is relatively consistent from year to year with the exception of 2007 The increase in performance resulted from a Presidential Initiative from the prior Administration to enable rural health facilities to upgrade record keeping systems to electronic medical records
Key Performance Measure 2006 2007 2008 2009 2010 2011 Percentage of customers who are provided access to new andor improved essential community facilities ndash Health Facilities 38 72 48 54 50 50
Safety Facilities 38 62 57 50 54 54
67
RURAL DEVELOPMENT
RURAL DEVELOPMENT SALARIES AND EXPENSES
Budget Authority (Dollars in Millions)
2009 2010 2011 Program Enacted Estimate Budget
Salaries and Expenses Appropriationhelliphelliphelliphelliphelliphelliphelliphelliphelliphelliphelliphelliphelliphelliphellip $193 $202 $232 Transfers Rural Electric and Telecomm Loan Programhelliphellip (39) (40) (38) Rural Housing Insurance Fund Programhelliphelliphelliphellip (460) (468) (455) Rural Development Loan Fund Programhelliphelliphelliphellip (5) (5) (5) Subtotal Transfershelliphelliphelliphelliphelliphelliphelliphelliphelliphelliphellip (504) (513) (498) Subtotal Salaries and Expenseshelliphelliphelliphelliphelliphelliphellip 697 715 730 Recovery Acthelliphelliphelliphelliphelliphelliphelliphelliphelliphelliphelliphelliphelliphelliphellip 131 0 0 Total Salaries and Expenseshelliphelliphelliphelliphelliphelliphelliphelliphelliphellip $828 $715 $730
The 2011 budget provides a total of $730 million for salaries and expenses related to carrying out RD programs This level includes an increase of $72 million for pay cost $12 million for refresh of the Common Computing Environment (CCE) and $14 million to support the development of the Regional Innovation Initiative
The 2011 budget includes $12 million for the RD portion of a Departmental effort to modernize and upgrade the IT infrastructure (also known as the Common Computing Environment (CCE)) for the Service Center Agencies (SCAs) This funding will be used to replace outdated components of the CCE many of which have exceeded their expected life cycles to reduce system vulnerabilities to failure and improve the performance and effectiveness of the shared infrastructure These improvements will allow the SCAs to better serve program participants with a more flexible and reliable IT infrastructure This funding will allow for the first system-wide refresh of the CCE since the infrastructure was implemented in 2000 In addition as the components of the CCE are replaced USDA will implement a right-sizing process whereby configuration changes will be made to better support the delivery of current and future programs As part of this process the Department will strive to improve system security reduce the long term cost of infrastructure services and improve service reliability
68
FOOD NUTRITION AND CONSUMER SERVICES
MISSION AND RELATIONSHIP TO STRATEGIC GOAL
A plentiful supply of safe and nutritious food is essential to the well-being of every family and the healthy development of every child in America Although most American households have access at all times to enough nutritious food for an active and healthy lifestyle too many households especially households with children do not have sufficient resources to ensure this access especially under the current economic conditions A recent report by the Department showed that in over 500000 families with children in 2008 one or more children simply do not get enough to eat Meaning they had to cut the size of their meals skip meals or even go whole days without food at some time during the year Too many children also have poor diets and gain excessive weight Recent data shows that the prevalence of obesity has increased over 10 percent to 17 percent for children between 6 and 19 years of age
The activities and funding of Food Nutrition and Consumer Services including the Food and Nutrition Service (FNS) and the Center for Nutrition Policy and Promotion (CNPP) support USDA Strategic Goal to ensure that all of Americarsquos children have access to safe nutritious and balanced meals FNS contributes significantly to two activities under this strategic goal including (1) increasing access to nutritious food and (2) promoting healthy diet and physical activity behaviors FNS also works to ensure that food is safe most notably for meals served through the Child Nutrition Programs and the agency is committed to increasing performance efficiency and alignment of USDA programs
The mission of FNS is to increase food security and reduce hunger in partnership with cooperating organizations by providing children and low-income people access to food a healthful diet and nutrition education in a manner that supports American agriculture and inspires public confidence The mission of CNPP is to improve the health of Americans by developing and promoting dietary guidance that links the best evidence-base scientific research to the nutrition needs of consumers In addition to providing access to nutritious food FNS also works to empower program participants with knowledge of the link between diet and health FNS administers the Departmentrsquos domestic nutrition assistance programs The Federal staff leverage their efforts by working with State and local partners to deliver nutrition assistance through the Supplemental Nutrition Assistance Program (formerly the Food Stamp Program) the Child Nutrition Programs ndash National School Lunch Program National School Breakfast Program and the Child and Adult Care Food Program and the Special Supplemental Nutrition Program for Women Infants and Children (WIC) and other programs serving specialized needs The Supplemental Nutrition Assistance Program provides basic assistance to help ensure low-income households have access to a secure and adequate diet The other programs target specific groups of people with specialized needs or in special settings Key performance measures for 2011 are to decrease the number of households with very low food security among children increase the percentage of eligible people participating in the Supplemental Nutrition Assistance Program increase the percentage of school children participating in the National School Lunch Program decrease the prevalence of obesity among children and adolescents improve Healthy Eating Index (HEI) scores for people in low-income households (under 130 percent of poverty level) and for the general population and increase the amount of Supplemental Nutrition Assistance Program benefits redeemed at farmers markets
69
FOOD NUTRITION AND CONSUMER SERVICES
FNS Budget Authority 900
800
700
600
500
400
300
200
100
00
WIC CNP SNAP ARRA FY 2009 FY 2010 FY 2011
ARRA amounts of less than $1 billion are not included
The 2011 budget provides funds for anticipated changes in participation and food cost inflation for the major programs It emphasizes improving access and operations in 2011 and improving the nutritional status of recipients Both FNS and the Center for Nutrition Policy and Promotion will continue efforts to promote healthy eating and active lifestyle behaviors in part by the continued use and promotion of MyPyramidgov and the Dietary Guidelines for Americans Additionally in 2011 USDA will coordinate with the Departments of Health and Human Services and Education to implement revise and refine plans and strategies for addressing the problem of childhood obesity
$Bill
ions
69 73 76 15 17 19
54 58 68
52 105
119
70
FOOD NUTRITION AND CONSUMER SERVICES
Food and Nutrition Service Budget Authority
(Dollars in Millions) 2009 2010 2011
Program Enacted Estimate Budget Discretionary Special Supplemental Nutrition Program (WIC) helliphelliphelliphelliphelliphelliphelliphelliphelliphelliphelliphellip $6860 $7257 $7603 Commodity Assistance Program Commodity Supplemental Food Programhelliphelliphelliphelliphelliphelliphelliphelliphelliphelliphelliphelliphelliphellip 160 171 177 The Emergency Food Assistance Program (TEFAP)
Soup Kitchens Food Bankshelliphelliphelliphelliphelliphelliphelliphelliphelliphelliphelliphelliphelliphelliphelliphelliphelliphelliphelliphellip 50 50 50 Infrastructure Grantshelliphelliphelliphelliphelliphelliphelliphelliphelliphelliphelliphelliphelliphelliphelliphelliphelliphelliphelliphelliphelliphellip 0 6 0
Farmers Market Nutrition Programhelliphelliphelliphelliphelliphelliphelliphelliphelliphelliphelliphelliphelliphelliphelliphelliphellip 20 20 20 Pacific Island Assistance and Disaster Assistancehelliphelliphelliphelliphelliphelliphelliphelliphelliphelliphellip 1 1 1 IT Modernization and Supporthelliphelliphelliphelliphelliphelliphelliphelliphelliphelliphelliphelliphelliphelliphelliphelliphelliphelliphellip 0 0 2 Nutrition Services Incentive Program ahelliphelliphelliphelliphelliphelliphelliphelliphelliphelliphelliphelliphelliphelliphellip 3 3 0
Total Commodity Assistance Programhelliphelliphelliphelliphelliphelliphelliphelliphelliphelliphelliphelliphelliphellip 234 251 250 Nutrition Programs Administrationhelliphelliphelliphelliphelliphelliphelliphelliphelliphelliphelliphelliphelliphelliphelliphelliphelliphellip 145 151 172
Total Ongoing Discretionary Programshelliphelliphelliphelliphelliphelliphelliphelliphelliphelliphelliphelliphelliphellip 7239 7659 8025 Recovery Act WIC Programhelliphelliphelliphelliphelliphelliphelliphelliphelliphelliphelliphelliphelliphelliphelliphelliphelliphelliphelliphelliphelliphelliphelliphelliphelliphellip 500 0 0 Commodity Assistance Programhelliphelliphelliphelliphelliphelliphelliphelliphelliphelliphelliphelliphelliphelliphelliphelliphelliphellip 150 0 0 Child Nutrition Programshelliphelliphelliphelliphelliphelliphelliphelliphelliphelliphelliphelliphelliphelliphelliphelliphelliphelliphelliphelliphellip 100 0 0
Total Recovery Acthelliphelliphelliphelliphelliphelliphelliphelliphelliphelliphelliphelliphelliphelliphelliphelliphelliphelliphelliphelliphelliphellip 750 0 0 Total Discretionary Programshelliphelliphelliphelliphelliphelliphelliphelliphelliphelliphelliphelliphelliphelliphelliphelliphelliphellip 7989 7659 8025
Mandatory Supplemental Nutrition Assistance Program (SNAP)helliphelliphelliphelliphelliphelliphelliphelliphelliphelliphellip 53970 58269 68207 Proposed Legislation bhelliphelliphelliphelliphelliphelliphelliphelliphelliphelliphelliphelliphelliphelliphelliphelliphelliphelliphelliphelliphelliphellip 0 11 36 Child Nutrition Programshelliphelliphelliphelliphelliphelliphelliphelliphelliphelliphelliphelliphelliphelliphelliphelliphelliphelliphelliphelliphelliphellip 15074 17034 18392 Reauthorization Proposalshelliphelliphelliphelliphelliphelliphelliphelliphelliphelliphelliphelliphelliphelliphelliphelliphelliphelliphelliphelliphellip 0 0 1000 Farm Bill Seniors Farmers Market Nutrition Program chelliphelliphelliphelliphelliphelliphelliphelliphelliphelliphelliphelliphellip 21 21 21 Recovery Act Supplemental Nutrition Assistance Programhelliphelliphelliphelliphelliphelliphelliphelliphelliphelliphelliphelliphelliphellip 5195 10460 11936 Supplemental SNAP State Administrative Expenseshelliphelliphelliphelliphelliphelliphelliphelliphelliphelliphelliphelliphelliphelliphelliphellip 0 400 0
Total Mandatory Programshelliphelliphelliphelliphelliphelliphelliphelliphelliphelliphelliphelliphelliphelliphelliphelliphelliphelliphellip 74260 86195 99592 Total FNShelliphelliphelliphelliphelliphelliphelliphelliphelliphelliphelliphelliphelliphelliphelliphelliphelliphelliphelliphelliphelliphelliphelliphelliphellip $82249 $93854 $107617
a Funds are transferred from the Department of Health and Human Services Administration on Aging b The budget also proposes to increase the asset limit to $10000 in SNAP but does not increase budget authority The funding is provided through a government-wide initiative c Funds are transferred from the Commodity Credit Corporation
71
FOOD NUTRITION AND CONSUMER SERVICES
The nutrition assistance programs work in concert to improve scores on cross-cutting performance measures of improved diet for the children and low-income people they serve
Key Performance Measure 2006 2007 2008 2009 2010 2011 Application and usage level of nutrition guidance tools (billions of pieces of nutrition guidance distributed) 15 26 32 35 30 39 Baseline 2006 = 15
People Served Through Nutrition Assistance Programs
433
WIC SNAP School Lunch
FY 2009 FY 2010 FY 2011
Supplemental Nutrition Assistance Program (SNAP) The 2011 budget anticipates an increase in participation on average of about 28 million recipients per month between 2010 and 2011 Since the Recovery Act increased the maximum allotment by 136 percent effective April 2009 and provided that the benefit remain constant until the statutory COLA for SNAP benefits exceeds that level the average benefit level in 2011 is expected to be about the same as it was in 2010 (and for several years afterwards) Increases in projected funding requirements thus reflect the anticipated increase in program participation and associated State administrative expenses
The Administration is working to establish a practical national asset limit floor across means-tested human services food and cash assistance programs Legislative language will be provided to raise current SNAP asset limits to $10000 from $2000 per household or $3000 for households including an elderly or disabled member This nationwide figure will streamline eligibility for families eligible for benefits from multiple programs and encourage families to
91
337 312
95
405
321
101
326
0
5
10
15
20
25
30
35
40
45
Peop
le S
erve
d (M
illio
ns)
72
FOOD NUTRITION AND CONSUMER SERVICES
save toward self-sufficiency In addition FNS will be proposing legislative language to provide for the exclusion of tax refunds in the month of receipt and for the following 12 months beginning in tax year 2009 for SNAP and all Federally funded means-tested programs Legislation is also being proposed to extend the Recovery Act provision that eliminates the time limits for able-bodied adults without dependents for an additional year for an one-time cost of $25 million
SNAP will continue to focus on encouraging all eligible persons to take advantage of program benefits with particular emphasis on reaching underserved populations such as the elderly Hispanics and the working poor For 2011 $6 million is included to expand the Healthy Incentives Pilot now under development which will demonstrate and evaluate the effect of financial incentives to purchase fruits and vegetables on the diets of SNAP participants Additionally $125 million is requested to test the impact of a community-wide approach that will use multiple means of communication and influence to raise the general awareness of healthy eating in a community shift social norms create more opportunities to make healthy food choices and reward such choices when made
To assist direct-to-consumer food sales $4 million is included to provide point of sale terminals to all farmersrsquo markets nationally that cannot currently redeem SNAP benefits Ensuring farmersrsquo markets have point of sales devices will substantially increase the redemption of SNAP benefits at these outlets Nutrition education continues to be a key part of the SNAP to help low-income households improve their nutrition levels
Key Performance Measure 2006 2007 2008 2009 2010 2011 Participation levels for the major Federal nutrition assistance programs (millions per month) Supplemental Nutrition Assistance Program 257 265 284 337 405 433
The Department is continuing its efforts to improve payment accuracy seeking to reach a payment accuracy rate of 95 percent in 2011 This will be achieved through working with stakeholders to implement best practices focusing particularly on error prone areas
Key Performance Measure 2006 2007 2008 2009 2010 2011 Improve SNAP payment accuracy rate Baseline 2001 = 913 942 944 950 950 950 950
The Administration is committed to ensuring an uninterrupted flow of benefits to program participants Since SNAP participation and costs are not fully predictable and can grow rapidly in a changing economic environment or in unexpected emergencies such as natural disasters the 2011 budget includes a $5 billion contingency reserve an increase of $2 billion over recent
73
FOOD NUTRITION AND CONSUMER SERVICES
years to be used in the event that program needs exceed current estimates The budget also proposes indefinite funding authority which would make additional funds available in the last four months of the fiscal year if program needs exceed the anticipated level
Child Nutrition Programs Ensuring access to food for children and improving their eating habits continues to be a priority The National School Lunch School Breakfast Summer Food Service Special Milk and Child and Adult Care Food Programs play a significant role in achieving this goal by assisting State and local governments in serving healthful nutritious meals and snacks to children in various settings with greatest emphasis on helping low-income children These programs assist children by subsidizing quality meals in participating schools and child care settings While children from all income levels receive some assistance from these programs most of the funding supports meals served to low-income children for free or at a greatly reduced price Child Nutrition Programs subsidies for meals at child care centers and family daycare homes help support child care a critical need for working families
To ensure the quality of the meals served in the school meals programs and the Child and Adult Care Food Program the Department entered into a three-year contract with the National Academiesrsquo Institute of Medicine (IOM) in February 2008 to convene a panel of experts to make recommendations for updating and revising the nutrition standards and meal requirements IOMrsquos recommendations released in October 2009 will be used to develop a regulatory proposal to make changes that will ensure that school meals do all they can to meet childrenrsquos nutritional needs foster healthy eating habits and safeguard childrenrsquos health Similarly schools that achieve recognition as HealthierUS Schools Challenge Schools achieve a high level of performance for school meal quality nutrition education and physical activity
The Administration is currently focused on the reauthorization of the Child Nutrition and WIC Programs programs which at some point in their lives touch most Americans - providing nutritious food nutrition education and connections to critical health services The Administration is proposing to add $1 billion in 2011 and a total of $10 billion over the next ten years for this priority Reauthorization reforms are a key strategy in the effort to eliminate childhood hunger by 2015 USDA will provide resources aimed at improving access to nutritious meals establishing high standards for the nutritional quality of food available in school exploring new strategies for reducing hunger and improving childrenrsquos food choices particularly for low-income children improve access to healthy fruits and vegetables reducing the prevalence of obesity by improving the diets of school children by teaching them to make wise food choices and improve program performance and integrity
For 2011 the Child Nutrition Programs are funded at a level that will support anticipated participation and food costs An increase of $2 million is sought for a Farm to School Tactical Team including both FNS and AMS staff that will support local and regional food systems by facilitating linkages between schools and their local food producers An increase of $8 million is included to measure erroneous payments in school meal programs to determine the progress made reducing erroneous payments Also $8 million is sought for a study of school lunch and breakfast meal costs This study is conducted every few years to ensure that decisions on reimbursement levels are informed by up-to-date high-quality information on the cost of producing meals and the sources and levels of revenues to cover those costs
74
FOOD NUTRITION AND CONSUMER SERVICES
The $5 million in annual funding for Hunger-Free Communities under Section 4405 of the Farm Bill will continue in 2011 Grants will focus on promotion outreach demonstration projects and technical assistance to support communities in exploring a significantly broader array of local strategies to prevent hunger primarily among children Further $700000 included in 2010 to expand the HealthierUS School Challenge will be continued in FY 2011 so work to encourage schools to take a leadership role in helping students learn to make healthier eating and lifestyle choices will continue Existing funds will also continue to help ensure the integrity of meals served increased training and technical assistance materials for the school food service community and increased Federal oversight of meals served
Key Performance Measure 2006 2007 2008 2009 2010 2011 Participation levels for the major Federal nutrition assistance programs (millions per day) National School Lunch Program 301 305 309 312 321 326 School Breakfast Program 81 83 87 110 117 122
WIC The WIC Program USDArsquos largest discretionary program helps improve the health and nutritional intake of low-income pregnant breast-feeding and postpartum women infants and children up to their fifth birthday WIC works by providing participants with vouchers redeemable for foods dense in nutrients known to be lacking in the diets of eligible groups and providing nutrition education and referrals to other important health and social services Nearly half of those born in the United States receive WIC benefits
The Presidentrsquos 2011 budget request proposes $76 billion for the WIC Program an increase of approximately $350 million above the 2010 level (excluding the Recovery Act funding) which will be augmented by larger than usual carryover balance from 2010 The Administration is committed to serving all eligible individuals seeking WIC benefits and expects the request to support a monthly average of 101 million participants Included in the request is an increase for breastfeeding promotion from $80 million to $83 million plus a doubling of funding for breastfeeding performance bonuses for States to $10 million Also $15 million for program evaluation and $60 million allocated specifically to help States improve their management information systems are continued in 2011 Further $10 million is provided to continue support for IT oversight and infrastructure and $5 million is provided to improve the application process and coordination with other programs The Recovery Act provided $500 million in additional funding for WIC $100 million for management information systems and $400 million in a contingency reserve to fund unanticipated participation costs available until the end of 2010
FNS is working with States to ensure effective implementation of the new WIC food packages as required in 2010 and will work to continue to improve overall nutritional intakes consistent with the 2010 Dietary Guidelines for Americans and increase breastfeeding rates Additionally resources are provided to increase the value of the fruit and vegetable voucher for children by $2 per family per month totaling $104 million annually Finally the budget provides for a
75
FOOD NUTRITION AND CONSUMER SERVICES
$250 million contingency fund to ensure sufficient resources for stable services should participation or food costs be higher than anticipated
Key Performance Measure 2006 2007 2008 2009 2010 2011 Participation levels for the major Federal nutrition assistance programs (millions per month) WIC Program (average) 81 83 87 91 95 101
Commodity Assistance Program (CAP) CAP distributes USDA commodities through several programs The Emergency Food Assistance Program (TEFAP) provides support to a network of food banks and other programs that assist households in need of immediate short-term food assistance TEFAP includes components of both discretionary and mandatory funding In addition the Recovery Act provided $150 million for TEFAP to increase food assistance to Americans in the economic crisis These funds were used to purchase additional commodities ($100 million) and to fund administrative costs associated with the distribution of the USDA commodities or privately-donated foods In 2011 for State and local program administration $50 million in discretionary funding is requested any part of which at State discretion may be used to purchase additional commodities Also note that under the Supplemental Nutrition Assistance Program account mandatory funding of $2465 million is provided to purchase TEFAP commodities
CAP includes funding for the Commodity Supplemental Food Program (CSFP) CSFP provides commodities to low-income elderly and pregnant postpartum and breastfeeding women infants and children up to age six The 2011 budget proposes $1768 million an increase of $54 million to offset expected cost increases due to inflation while supporting the current participation levels
In 2011 funding is requested for the Farmersrsquo Market Nutrition Program (FMNP) for women infants and children at the authorized level $20 million The FMNP provides WIC participants with vouchers to purchase fresh local fruits vegetables and herbs directly from farmers farmersrsquo markets and roadside stands In 2008 the FMNP provided coupons to 23 million WIC participants The participants redeemed their coupons at 5765 authorized farmers markets and roadside stands providing revenue to 16016 small family farmers The Seniors FMNP funded by CCC provided similar benefits to over 900000 low-income seniors In 2008 the Seniors FMNP involved over 15062 farmers at 5588 farmersrsquo markets roadside stands and community supported agriculture programs
Nutrition Programs Administration (NPA) Funding of $1721 million is requested for NPA to support Federal management and oversight of USDArsquos investment in nutrition assistance programs The budget includes an increase $52 million to enhance the Federal investment in program administration grantee oversight and protection of the integrity of program operations Participation in SNAP has gone from 172 million recipients per month in 2000 to 337 million participants a month and participation in WIC has grown from 72 million participants a month in 2000 to 91 million participants In addition FNS staff totals 1387 in 2010 to manage a
76
FOOD NUTRITION AND CONSUMER SERVICES
budget over $100 billion well below the 1800 on board in 2000 when the FNS budget was $326 billion
The request includes $9 million to increase efforts to implement scientific evidence-based nutrition guidance and guide effective nutrition education interventions in schools and communities and build and maintain education tools and systems that Americans can use to adopt behaviors that lead to more healthful eating and active lifestyles The 2010 Dietary Guidelines for Americans will be completed and released in 2010 along with enhancements to MyPyramid including interactive applications To help USDA meet its strategic objective to reduce obesity $7 million of this total will be used by CNPP obesity related nutrition education activities The remaining $2 million is needed to translate the recommendations and policy statements in the 2010 Dietary Guidelines for Americans into information that consumers and program administrators can use The Dietary Guidelines and MyPyramid are used to help establish food benefits for the programs and they are central to nutrition education and promotion programs government wide as well as private sector nutrition education and promotion
In addition to enhancing staff resources FNS seeks an additional $55 million to update and integrate its outdated financial management system to control over $100 billion in program funding and to ensure its internal computer infrastructure is operating with current hardware and software less vulnerable to cyber attacks Of this amount $35 million is needed to develop common business processes and financial management systems consistent with USDArsquos Financial Management Modernization Initiatives The $2 million will help expand use of IT tools to improve benefit delivery to program participants to streamline program administration for State and local program partners to improve nutrition education and to enhance program integrity The budget also includes $3 million to fund the Bill Emerson and Mickey Leland Hunger Fellowship programs USDA is directly requesting funds for these activities consistent with the provisions of the 2008 Farm Bill which established the Fellows programs within the Department to address hunger and poverty in the United States as well as international hunger and other humanitarian needs
USDArsquos ability to simplify and improve the programs increase program efforts to improve nutritional outcomes encourage healthy and nutritious diets and expand an obesity prevention campaign is fostered by the Federal administrative efforts supported by Nutrition Program Administration funds
77
FOOD NUTRITION AND CONSUMER SERVICES
Food and Nutrition Service Key Indicators
2009 2010 2011 Actual Estimate Budget
Average Participation Millions Supplemental Nutrition Assistance Program (per month)helliphellip 337 405 433 Free School Lunchhelliphelliphelliphelliphelliphelliphelliphelliphelliphelliphelliphelliphelliphelliphelliphelliphellip 162 184 190 Total School Lunch (per day)helliphelliphelliphelliphelliphelliphelliphelliphelliphelliphelliphelliphellip 312 321 326 Free School Breakfasthelliphelliphelliphelliphelliphelliphelliphelliphelliphelliphelliphelliphelliphelliphelliphellip 79 87 93 Total School Breakfast (per day)helliphelliphelliphelliphelliphelliphelliphelliphelliphelliphellip 110 117 122 WIC (per month)helliphelliphelliphelliphelliphelliphelliphelliphelliphelliphelliphelliphelliphelliphelliphelliphelliphellip 91 95 101 Commodity Supplemental Food Program (CSFP) WIC (per month)helliphelliphelliphelliphelliphelliphelliphelliphelliphelliphelliphelliphelliphelliphelliphelliphellip 002 002 002 Elderly (per month)helliphelliphelliphelliphelliphelliphelliphelliphelliphelliphelliphelliphelliphelliphelliphellip 044 056 058 Food Distribution Program on Indian Reservations (FDPIR) (per month)helliphelliphelliphelliphelliphelliphelliphelliphelliphellip 010 010 010 Unemployment Rate (percent)helliphelliphelliphelliphelliphelliphelliphelliphelliphelliphelliphellip 84 101 95 AveragePersonMonth Food Benefit in $ Supplemental Nutrition Assistance Programhelliphelliphelliphelliphelliphelliphellip $12445 $13293 $13276 WIChelliphelliphelliphelliphelliphelliphelliphelliphelliphelliphelliphelliphelliphelliphelliphelliphelliphelliphelliphelliphelliphelliphellip 4255 4398 4559 CSFP WIC (FNS Funded) ahelliphelliphelliphelliphelliphelliphelliphelliphelliphelliphelliphellip 2655 2800 2775 CSFP Elderly (FNS Funded) ahelliphelliphelliphelliphelliphelliphelliphelliphelliphelliphellip 1877 1947 1918 FDPIR (FNS Funded) ahelliphelliphelliphelliphelliphelliphelliphelliphelliphelliphelliphelliphelliphellip 5454 6042 6090 Per Meal Subsidies Including Commodities in $ b School Lunch Free helliphelliphelliphelliphelliphelliphelliphelliphelliphelliphelliphelliphelliphelliphelliphelliphelliphelliphelliphelliphelliphellip $280 $289 $293 Reduced Price helliphelliphelliphelliphelliphelliphelliphelliphelliphelliphelliphelliphelliphelliphelliphelliphelliphellip 239 248 253 Paid helliphelliphelliphelliphelliphelliphelliphelliphelliphelliphelliphelliphelliphelliphelliphelliphelliphelliphelliphelliphelliphellip 045 045 046 School Breakfast Free helliphelliphelliphelliphelliphelliphelliphelliphelliphelliphelliphelliphelliphelliphelliphelliphelliphelliphelliphelliphelliphellip 166 172 175 Paid helliphelliphelliphelliphelliphelliphelliphelliphelliphelliphelliphelliphelliphelliphelliphelliphelliphelliphelliphelliphelliphellip 025 026 026
a Excludes bonus commodities In 2009 an average of $326 $279 and $285 per month was added in bonus commodities for each participant monthly for CSFPWIC CSFPelderly and FDPIR respectively b Excludes bonus commodities
78
FOOD SAFETY
MISSION AREA AND RELATIONSHIP TO STRATEGIC GOAL
Foodborne illness is recognized as a significant public health problem in the United States which can have a more severe impact on children than healthy adults According to the Centers for Disease Control and Prevention approximately half of the reported foodborne illnesses occur in children These diseases can lead to short and long-term health consequences and sometimes can result in death USDA and other Federal agencies are working in cooperation to ensure that Americans have increased access to safe and healthy food
The Food Safety mission area is the public health mission area of USDA that is responsible for ensuring that the Nationrsquos commercial supply of meat poultry and processed egg products is safe wholesome and properly labeled and packaged This includes products produced domestically in Federally-inspected establishments as well as products imported from foreign countries Funds for the Food Safety mission area support USDA Strategic Goal to ensure that all of Americarsquos children have access to safe nutritious and balanced meals
The mission area includes the activities of the Food Safety and Inspection Service (FSIS) which provides Federal inspection of meat poultry and processed egg products establishments support for similar establishments under State inspection programs development and implementation of the Public Health Information System to enhance science-based data-driven inspections and determination of international equivalence of foreign systems FSIS coordinates the development of its policies with other USDA agencies and other Federal agencies including the Food and Drug Administration (FDA) the Environmental Protection Agency the Centers for Disease Control and Prevention as well as foreign governments and international organizations to ensure an integrated farm-to-table approach to food safety Furthermore the Secretary of Agriculture is the co-chair of the Presidentrsquos Food Safety Working Group (FSWG) created in March 2009 which brings together cabinet secretaries and senior officials to advise the President on issues pertaining to food safety
In addition to FSIS the Food Safety mission area includes the general oversight of the Office of the US Manager of Codex which is the major international mechanism for encouraging fair international trade in food while promoting the health and economic interests of consumers
79
FOOD SAFETY
Budget Authority (Dollars in Millions)
2009 2010 2011 Program Enacted Estimate Budget
Discretionary Federal Food Safety and Inspectionhelliphelliphelliphelliphelliphelliphelliphelliphelliphelliphelliphelliphelliphelliphellip $872 $903 $912 State Food Safety and Inspectionhelliphelliphelliphelliphelliphelliphelliphelliphelliphelliphelliphelliphelliphelliphelliphellip 65 66 65 International Food Safety and Inspectionhelliphelliphelliphelliphelliphelliphelliphelliphelliphelliphelliphellip 18 19 16 Public Health Data Communication Infrastructure Systemhelliphelliphelliphelliphelliphellip 13 27 40 Codex Alimentariushelliphelliphelliphelliphelliphelliphelliphelliphelliphelliphelliphelliphelliphelliphelliphelliphelliphelliphelliphelliphellip 4 4 4
Total Discretionary Programshelliphelliphelliphelliphelliphelliphelliphelliphelliphelliphelliphelliphelliphelliphellip 972 1019 1037
Mandatory Trust Funds (Voluntary Inspection Services)helliphelliphelliphelliphelliphelliphelliphelliphelliphelliphellip 11 9 9 User Fees (OvertimeHoliday Inspection Services)helliphelliphelliphelliphelliphelliphelliphellip (135) (122) (122)
Total FSIS Programshelliphelliphelliphelliphelliphelliphelliphelliphelliphelliphelliphelliphelliphelliphelliphelliphelliphelliphellip $983 $1028 $1046
Organizational Structure To accomplish its functions FSIS employees are located at approximately 6286 slaughtering and processing establishments and import houses and other Federally-regulated facilities Headquarters personnel are responsible for overseeing administration of the program and ensuring that scientific and technological developments are incorporated into inspection procedures The Codex Office reports to the Under Secretary of Food Safety and coordinates all government and non-government participation in the activities of the Codex Alimentarius Commission
Inspection Data Infrastructure and Outbreak Response To ensure that FSIS can support its approximately 8500 Federal in-plant and other frontline personnel the Federal share of State inspection programs and continue to improve the data infrastructure supporting the Nationrsquos food safety system the 2011 budget proposes a discretionary funding level of slightly more than $1 billion an increase of approximately $18 million over 2010 The budget provides the full amount necessary to meet regulatory responsibilities including pay costs and other necessary supporting costs and continues the upward trend in funding over the past decade
80
FOOD SAFETY
FSIS Budget Authority 1200
1000
800
600
400
200
0
Fiscal Year
The 2011 budget requests $40 million an increase of $13 million to continue the deployment and enhancement of the FSIS public-health information infrastructure The additional funds will allow for the purchase of critical equipment the expansion of telecommunications and broadband bandwidth capacity and the improvement of information gathering systems to enhance access of inspection personnel to centralized mission critical systems These new investments are critical to fully leverage the Public Health Information System recently developed by FSIS to enhance the agencyrsquos ability to collect analyze and present data to allow decision making based on relevant timely product and process data utilizing the best science available
In response to key findings of the Presidentrsquos FSWG a $43 million increase is requested for the inter-agency Federal-State Foodborne Disease Outbreak Response Team to allow FSIS to more quickly investigate and respond to outbreaks including faster detection of outbreaks and removal of products from commerce to prevent further illnesses Using these new funds additional staff will be hired to support illness investigation outbreakresponse coordination collaboration on multi-State investigations and proactive public health partner communication outreach In addition these new staff will support a Unified Incident Command System to facilitate communication and decision-making in an emergency a goal of the Presidentrsquos FSWG Taken together this initiative will enhance detection of outbreaks and likely allow for earlier detection of outbreaks which would result in more timely FSIS actions to prevent further illnesses
Similarly in support of key findings of the Presidentrsquos FSWG the 2011 budget proposes a $10 million increase for Baseline Studies and Hazard Analysis and Critical Control Points (HACCP) Verification Program Updates This increase above the 2010 level will allow FSIS to improve surveillance of foodborne pathogens of human-health concern in FSIS-regulated products through significant expansion of the HACCP regulatory sampling and to develop more timely estimates of pathogen prevalence in food products by conducting an additional traditional
$ M
illio
ns
2000 2001 2002 2003 2004 2005 2006 2007 2008 2009 2010 2011
81
FOOD SAFETY
baseline study Accurate timely prevalence estimates for pathogens in food products are critical for evaluation of existing prevention policies and the development of new regulatory strategies FSIS estimates a 25 percent increase in the accuracy of existing performance measures as a result of the proposed increase in HACCP sampling In addition with the ability to conduct a third baseline study in 2011 FSIS will be able to expand its data collection efforts to cover E coli O157H7 in lamb and sheep or Salmonella prevalence in sows and boars
Meat amp Poultry Slaughter Volume Inspected
60
55
50
45
Meat 40
Poultry
35
30
Fiscal Year
Combating Foodborne Illness FSIS is instrumental in helping reduce the level of foodborne illness by targeting common and dangerous pathogens for control In addition to its work ensuring safe and wholesome products are available to the consumer FSIS also conducts public education campaigns to inform consumers about safe food handling methods to decrease the likelihood of foodborne illness from products that were improperly stored handled andor prepared As part of the FSWG FSIS will conduct consumer focus group studies to measure consumer understanding of labeling and other public health messaging and develop new outreach and education strategies based on the results Also as part of the FSWG FSIS will collaborate with FDA to establish a preventative health campaign to increase outreach to clinicians public health professionals and consumers on actions to reduce the risk of foodborne illness
With the funding requested for 2011 FSIS expects to achieve the following performance measures
Bill
ions
of P
ound
s
00 01 02 03 04 05 06 07 08 09
82
Key Performance Measure Overall public exposure to Salmonella from broiler carcasses1
2006
45
2007
73
2008
83
2009
82 in Category
1
2010
90 in Category
1
2011
92 in Category
1
Total illnesses from all FSIS Regulated Products 645609 436343 380259 324175 268092 265411
Percent of establishments with a functional food defense plan2
Large Establishments Small Establishments
Very Small Establishments
NA NA NA
91 53 21
96 64 25
96 64 25
96 69 37
96 74 48
FOOD SAFETY
1The figures represent the proportion of establishments whose two most recent Salmonella test results are equal to or less than 50 percent of the FSIS performance standard for the product class These are the Category 1 establishments considered to have consistent process control As more establishments reach Category 1 status it is expected that fewer people will be exposed to Salmonella from classes of raw products regulated by FSIS
2Food Defense plans are written procedures that food processing establishments should follow to protect the food supply from intentional contamination with chemicals biological agents or other harmful substances Large establishments (ge500 employees) Small establishments (le 499 employees but gt 10) Very Small Establishments (lt10 employees or lt $25 million in annual sales)
FSIS continues to make improvements in its food safety policies and inspection of meat poultry and processed egg products For example FSIS implemented its new bench trim sampling program for E coli O157H7 to detect the pathogen with greater confidence in ground beef FSIS has also developed new pathogen reduction performance standards for control of Salmonella and Campylobacter bacteria in response to recommendations of the Presidents FSWG The goal set by FSIS is to have 90 percent of establishments meeting the new Salmonella standards by the end of calendar year 2010 Similarly FSIS will also post on its Web site compliance guidelines for poultry slaughter establishments including additional pre-harvest recommendations for controlling Salmonella and Campylobacter in poultry To measure the success of these food safety programs FSIS is collaborating with FDA and other FSWG members to develop performance metrics so that all the Federal agencies are consistently measuring success of their food safety programs
The 2008 Farm Bill made several amendments to statutes administered by FSIS and gave the agency other instructions As a result FSIS is developing new regulations to implement mandatory inspection for catfish a program for interstate shipment of State-inspected meat and poultry products requirements that would apply to inspected establishments for recall procedures for documenting process control (HACCP plan) reassessments and for notifying FSIS if they have reason to believe adulterated or misbranded product is in commerce Given the investment to date and the need for considerable stakeholder engagement and regulatory development before the adoption and implementation of a catfish inspection program a decrease
83
FOOD SAFETY
of $103 million from 2010 levels is proposed in the budget for catfish-related activities A level of $5 million for the program is adequate to meet inspection needs in 2011
User Fees and Trust Funds In 2011 FSIS estimates it will collect $131 million through existing user fee and trust fund activities for providing overtime holiday and voluntary inspection services Separately FSIS will submit legislative proposals that would permit two additional user fees in 2011 a user fee that would be collected from plants that have sample failures or require additional inspection activities stemming from a pattern of regulatory non-compliance and a Facility Application and Annual Renewal Activities user fee to cover the increased costs of services above and beyond basic inspection services provided to meat poultry or processed egg products establishments including those services related to compliance risk assessments hazard analyses inspection planning and inspections compliance review and enforcement information technology support product sampling and risk communication Total collections from these proposals are estimated at $4 million and $86 million respectively
84
NATURAL RESOURCES AND ENVIRONMENT
9
Discretionary Programs EQIP
MISSION AND RELATIONSHIP TO STRATEGIC GOALS
A healthy and prosperous America relies on the health of our natural resources and particularly our forests and agricultural working lands The health of Americarsquos 193 million acres of National forests and grasslands and 13 billion acres of farm ranch and private forest lands must be nurtured so that they continue to offer environmental benefits as a source of clean air clean and abundant water and wildlife habitat Americarsquos forests supply communities with clean abundant water shelter wildlife and help us mitigate and adapt to climate change Forests also help generate rural wealth through recreation and tourism through the creation of green jobs and through the production of wood products and energy They are a source of cultural heritage and are a national treasure
The mission of the Natural Resources and Environment area is to promote the conservation and sustainable use of natural resources on the Nations private lands and to sustain production of all the goods and services that the public demands of the national forests The mission area includes two agencies the Natural Resources Conservation Service (NRCS) and the Forest Service (FS)
The two agencies are the primary contributors to achieving the Strategic Goal that ensures our National Forests and private working lands are conserved restored and made more resilient to climate change while enhancing water resources This is accomplished through a variety of programs aimed at preserving and restoring our public and private lands protecting our water resources mitigating the effects of climate change and reducing the risk from catastrophic wildfires NRCS partners with state and local government agencies and private landowners and provides technical and financial assistance to help protect farm and ranch lands and private forestland FS oversees the management of the National Forest System
The NRE mission area primarily through NRCS also has responsibility for implementing most of the Conservation Title of the 2008 Farm Bill which in 2011 will enroll about 305 million acres at a total cost of about more than $3 billion
2011 Conservation Budget Total = $5952 Billion
Wetlands Reserve
All Other Conservation Mandatory
Reserve Programs 33 8
Conservation Stewardship
Programs 14
20 16
85
NATURAL RESOURCES AND ENVIRONMENT
Mill
ions
of A
cres
Farm Bill Conservation Programs Cumulative Acres Enrolled
350
300
250
200
704
267 413
314
564
302
183 23 368
237 346
338
347
75 35
361
204
1104 1312 1483 1652 1772 1897
925
All Other
150 CRP EQIP
100
50
0
2004 2005 2006 2007 2008 2009 2010 2011
86
NATURAL RESOURCES AND ENVIRONMENT
NATURAL RESOURCES CONSERVATION SERVICE (NRCS)
Budget Authority (Dollars in Millions)
2009 2010 2011 Program Enacted Estimate Budget
Discretionary Conservation Operations Conservation Technical Assistancehelliphelliphelliphelliphelliphelliphelliphelliphelliphelliphelliphellip $730 $762 $797 All Other Conservation Operations Programshelliphelliphelliphelliphelliphelliphelliphellip 123 126 127
Total Conservation Operationshelliphelliphelliphelliphelliphelliphelliphelliphelliphelliphelliphelliphellip 853 888 924 Watershed and Flood Prevention Operationshelliphelliphelliphelliphelliphelliphelliphelliphellip 24 30 0 Watershed Rehabilitation Programhelliphelliphelliphelliphelliphelliphelliphelliphelliphelliphelliphelliphellip 40 40 40 Resource Conservation and Developmenthelliphelliphelliphelliphelliphelliphelliphelliphelliphellip 51 51 0 Total Ongoing Discretionary Programshelliphelliphelliphelliphelliphelliphelliphelliphellip 968 1009 964
Recovery Act Watershed and Flood Prevention Operationshelliphelliphelliphelliphelliphelliphelliphelliphellip 290 0 0 Watershed Rehabilitation Programhelliphelliphelliphelliphelliphelliphelliphelliphelliphelliphelliphelliphellip 50 0 0 Total Recovery Act Programshelliphelliphelliphelliphelliphelliphelliphelliphelliphelliphelliphelliphellip 340 0 0 Total Discretionary Programshelliphelliphelliphelliphelliphelliphelliphelliphelliphelliphelliphelliphellip 1308 1009 964
Mandatory Farm Bill Programs Environmental Quality Incentives Programhelliphelliphelliphelliphelliphelliphelliphellip 1067 1180 1208 Wetlands Reserve Programhelliphelliphelliphelliphelliphelliphelliphelliphelliphelliphelliphelliphelliphelliphellip 436 613 502 Conservation Security Programhelliphelliphelliphelliphelliphelliphelliphelliphelliphelliphelliphellip 276 234 212 Conservation Stewardship Programhelliphelliphelliphelliphelliphelliphelliphelliphelliphelliphellip 9 469 629 Agricultural Water Enhancement Programhelliphelliphelliphelliphelliphelliphelliphellip 73 73 74 Farm and Ranch Lands Protection Programhelliphelliphelliphelliphelliphelliphelliphellip 121 150 160 Wildlife Habitat Incentives Programhelliphelliphelliphelliphelliphelliphelliphelliphelliphelliphellip 85 85 73 Grassland Reserve Programhelliphelliphelliphelliphelliphelliphelliphelliphelliphelliphelliphelliphelliphellip 48 101 79 Healthy Forest Reserve Programhelliphelliphelliphelliphelliphelliphelliphelliphelliphelliphelliphelliphellip 10 10 10 Chesapeake Bay Watershedhelliphelliphelliphelliphelliphelliphelliphelliphelliphelliphelliphelliphelliphelliphellip 23 43 72 Agricultural Management Assistance ahelliphelliphelliphelliphelliphelliphelliphelliphellip 15 15 10 Conservation Reserve Program Tech Assist (Reimb)helliphelliphelliphellip (56) (83) (124)
Total Farm Bill Programshelliphelliphelliphelliphelliphelliphelliphelliphelliphelliphelliphelliphelliphellip 2163 2973 3029
Total NRCS Programshelliphelliphelliphelliphelliphelliphelliphelliphelliphelliphelliphelliphelliphelliphelliphelliphellip $3471 $3982 $3993
a Total AMA program also includes funds provided to RMA and AMS
87
NATURAL RESOURCES AND ENVIRONMENT
The Presidentrsquos 2011 budget for NRCS strategically targets funding to high priority areas and effectively supports land conservation wildlife habitat improvement and wetland protection Funding is provided for conservation programs that focus on addressing the needs of priority landscapes in the most need of protection emphasize partnering with local constituents to efficiently implement programs and initiatives and contribute to efforts that address energy conservation renewable energy production and greenhouse gas emissions NRCS will continue to direct financial and technical assistance programs to land owners and users through the USDA Service Centers and through local conservation districts
Conservation Operations (CO) The 2011 budget proposes $924 million for CO which includes $797 million for conservation technical assistance (CTA) as well as $127 million for other CO activities including the Grazing Lands Conservation Initiative Soil Surveys Snow Surveys and Plant Materials Centers At this level the agency will continue to support locally-led cooperative conservation through the unique partnership that has been developed over the years with each conservation district and local stakeholders
The 2011 request for CTA includes an increase of $35 million over 2010 and a redirection of $374 million in Congressional earmarks This will enable NRCS to focus on the highest priority program areas such as improving and streamlining technical assistance delivery to farmers implementing Strategic Watershed Action Teams (SWAT) to target high priority watersheds in the most need of protection and updating the IT infrastructure or Common Computing Environment (CCE) Through CTA the budget projects that nearly 1300 comprehensive nutrient management plans will be applied 77 million will have conservation applied to improve soil quality and 146 million acres of grazing land and forest land will be protected as the result of conservation efforts The estimates reflect the initiative to focus activities on high priority watershed that provide the greatest environmental benefit
Key Performance Measure 2006 2007 2008 2009 2010 2011 CTA Comprehensive nutrient management plans applied (number of plans)
2269 1911 1745 1485 1300 1300
CTA Cropland with conservation applied to improve soil quality (millions of acres)
64 73 83 76 75 77
CTA Grazing land and forest land with conservation applied to protect and improve the resource base (millions of acres)
80 122 165 160 146 146
The budget includes $25 million for the SWAT initiative which will greatly increase the effectiveness of conservation programs Each SWAT will target an identified watershed for a period of 3 to 4 years with the intent of reaching 100 percent of the landowner base eligible for Farm Bill conservation program assistance The additive effect of planned and applied conservation practices would hasten environmental improvement while keeping production agriculture competitive and profitable
88
NATURAL RESOURCES AND ENVIRONMENT
The budget includes $35 million for NRCS to support the Departmentrsquos efforts to modernize and upgrade the CCE for the Service Center Agencies (SCAs) This funding will be used to replace outdated components of the CCE many of which have exceeded their expected life cycles reduce system vulnerabilities to failure and improve the performance and effectiveness of the shared infrastructure These improvements will allow the SCAs to better serve program participants with a more flexible and reliable IT infrastructure and enable the first system-wide refresh of the CCE since the infrastructure was implemented in 2000 In addition as the components of the CCE are replaced USDA will implement a right-sizing process whereby configuration changes will be made to better support the delivery of current and future programs As part of this process the Department will strive to improve system security reduce the long term cost of infrastructure services and improve service reliability Finally the CO budget includes a targeted fee proposal for conservation plans that is assumed to generate $19 million in revenue
Watershed and Flood Prevention Operations (WFPO) WFPO provides technical and financial assistance to local communities and sponsoring organizations to construct flood protection water supply and water quality improvement projects The 2011 budget proposes to terminate funding for this activity because earmarks prevent NRCS from prioritizing these projects on their merits and because benefits are highly localized and local sponsors are expected to assume a greater role in identifying and addressing water resource problems The Recovery Act provided $290 million in non-earmarked funds for this program in 2009 which supported over 195 projects representing more than 28000 acres in 36 States
Watershed Rehabilitation Program This program provides financial and technical assistance to communities for planning and financing the rehabilitation of Federally-constructed flood prevention dams that have reached the end of their design lives The budget includes $40 million in discretionary funds the same as 2010 for technical assistance to help local governments and private landowners plan the rehabilitation of those dams with the greatest potential for failure The Recovery Act provided $50 million for rehabilitation work in 2009 which supported more than two dozen projects in 11 States
Resource Conservation and Development (RCampD) As part of the Administrationrsquos continued commitment to fiscal responsibility the budget proposes to eliminate the RCampD program Begun in 1962 the program was intended to build community leadership skills through the establishment of RCampD councils that would access Federal State and local programs for the communityrsquos benefit After 47 years the program has matured to the point that this goal has been accomplished RCampD councils have developed sufficiently strong State and local ties to secure funding for their continued operation without Federal assistance A number of alternatives to RCampD support also exist including the use of other Federal State and local programs and existing avenues such as those provided through State Technical Committees
Environmental Quality Incentives Program (EQIP) The purpose of EQIP is to provide assistance to landowners who face serious natural resource challenges that impact soil water and related natural resources including grazing lands wetlands and wildlife habitat The 2011 budget proposes $12 billion for EQIP an increase of $28 million over 2010 This would enable nearly 43000 new contracts to participate in the program and would cover more than
89
NATURAL RESOURCES AND ENVIRONMENT
142 million acres The program will continue to emphasize land management practices such as the application of comprehensive nutrient management plans Consistent with the initiative to focus efforts in high priority areas EQIP enrollment acres are expected to fall due to targeting acres with the highest conservation benefit These acres often are relatively smaller farms Despite this reduction in acreage enrollment NRCS anticipates being able to maintain its key performance measures for EQIP (see table below) The Agricultural Water Enhancement Program (AWEP) which is operated under EQIP is funded at $74 million about $1 million more than the 2010 level AWEP promotes the conservation of ground and surface water and the improvement of water quality
EQIP Key Performance Measure 2006 2007 2008 2009 2010 2011 Comprehensive nutrient management plans applied (number of plans) 2774 2490 2520 2019 2000 2000
Cropland with conservation applied to improve soil quality (millions of acres)
34 53 56 48 50 50
Grazing land and forest land with conservation applied to protect and improve the resource base (millions of acres)
122 165 169 172 15 15
Chesapeake Bay Watershed Initiative The Chesapeake Bay Watershed Initiative provides producers conservation assistance through several USDA programs and is funded at $72 million or nearly $29 million more than the 2010 level This program helps agricultural producers improve water quality and quantity and restore enhance and preserve soil air and related resources in the Chesapeake Bay watershed through the implementation of conservation practices
Wetlands Reserve Program (WRP) WRP is a voluntary program in which landowners are paid to retire cropland from agricultural production if those lands are restored to wetlands and protected in most cases with a long-term or permanent easement Landowners receive fair market value for the land and are provided with cost-share assistance to cover the restoration expenses The 2008 Farm Bill authorized the program to enroll up to 3041200 acres through the end of fiscal year 2012 During 2009 funding was provided for WRP to enroll approximately 179000 acres and funding for 2010 allows for up to 250000 acres The 2011 budget request includes $502 million to enroll 192982 acres in 2011 During 2011 it is expected that 140000 acres of wetlands will be created restored or enhanced
Key Performance Measure 2006 2007 2008 2009 2010 2011
WRP Wetlands created 181979 149330 128860 106379 125000 140000restored or enhanced (acres)
90
NATURAL RESOURCES AND ENVIRONMENT
Conservation Security Program The Conservation Security Program was established in the 2002 Farm Bill and is a voluntary program that provides financial and technical assistance on Tribal and private agricultural working lands to support ongoing conservation stewardship The program provides payments to producers who maintain and enhance the condition of natural resources The program was not reauthorized in the 2008 Farm Bill The budget includes $212 million for the Conservation Security Program in 2011 in order to service existing contracts
Conservation Stewardship Program The 2008 Farm Bill replaced the Conservation Security Program with a new Conservation Stewardship Program which is distinguished from the old program in that it encourages participants to undertake new conservation activities in addition to maintaining and managing existing conservation activities Also the new program operates under an annual acreage limitation rather than a funding cap The budget proposes $629 million an increase of $160 million from 2010 for the program to enroll 12 million acres during 2011
Farm and Ranch Lands Protection Program (FRPP) Through this program the Federal Government facilitates and provides funding for the purchase of conservation easements or other interests in land for the purpose of protecting agricultural use and related conservation values by limiting nonagricultural uses of the land FRPP is carried out through existing State Tribal and local governments non-governmental organizations and local farmland protection programs The Farm and Ranch Lands Protection Program is funded at $160 million in 2011 an increase of $10 million over 2010 For 2011 NRCS has set a target to protect 45000 prime unique or important farmland acres from conversion via FRPP
Key Performance Measure 2006 2007 2008 2009 2010 2011
FRPP Prime unique or important farmland protected from conversion to non-agricultural uses by conservation easements acres
46909 38495 27401 38260 40000 45000
Wildlife Habitat Incentives Program (WHIP) The program provides financial and technical assistance to eligible participants to develop habitats for upland wildlife wetland wildlife threatened and endangered species and fish and other types of wildlife The purpose of the program is to create needed wildlife habitat that supports wildlife populations with local State and national significance The budget proposes funding for WHIP at $73 million in 2011 a reduction of $12 million from 2010 Although funding is reduced the Agency has established an ambitious goal for WHIP to contribute to the improvement of 400000 acres of non-Federal land for fish and wildlife habitat during 2011
91
NATURAL RESOURCES AND ENVIRONMENT
Key Performance Measure 2006 2007 2008 2009 2010 2011
WHIP Non-Federal land with conservation applied to improve 175543 388769 316896 335402 350000 400000 fish and wildlife habitat quality acres
Grasslands Reserve Program (GRP) GRP was authorized in the 2002 Farm Bill as a voluntary program to help landowners and operators restore and protect grassland including rangeland pastureland and certain other lands while maintaining the landsrsquo suitability for grazing Participants can enroll acreage in rental agreements with varying lengths or in long-term or permanent easements The program is jointly administered by NRCS and the Farm Service Agency (FSA) which has lead responsibility for rental agreement administration and financial activities NRCS has lead responsibility for technical issues and easement administration The program was initiated in 2003 and reached its statutory funding limit of $254 million in 2007 However the 2008 Farm Bill reauthorized the program for 2009-2012 and capped it at 12 million additional acres GRP is funded at $79 million for 2011 to enroll an additional 245830 acres
Conservation Reserve Program Technical Assistance NRCS provides technical support including land eligibility determinations conservation planning and practice implementation for the Conservation Reserve Program (CRP) The 2011 budget includes $124 million for CRP technical assistance CRP is administered by FSA The program status for 2011 is described on page 34
92
FOREST SERVICE (FS) Budget Authority
(Dollars in Millions) 2009 2010 2011
Program Enacted Estimate Estimate
NATURAL RESOURCES AND ENVIRONMENT
Discretionary Accounts Forest and Rangeland Researchhelliphelliphelliphelliphelliphelliphelliphelliphelliphelliphelliphelliphellip $296 $312 $304 State and Private Forestryhelliphelliphelliphelliphelliphelliphelliphelliphelliphelliphelliphelliphelliphelliphellip 266 308 322 National Forest System Integrated Resource Restoration Priority Watersheds and Job Stabilizationhelliphelliphelliphelliphelliphelliphellip 0 0 50 Collaborative Forest Landscape Restoration Fund ahelliphelliphellip 0 0 40 Restoration and Management of Ecosystemshelliphelliphelliphelliphelliphellip 652 668 604
Total Integrated Resource Restorationhelliphelliphelliphelliphelliphelliphellip 652 668 694 Recreation Heritage and Wildernesshelliphelliphelliphelliphelliphelliphelliphelliphelliphellip 278 285 293
Other NFS Activitieshelliphelliphelliphelliphelliphelliphelliphelliphelliphelliphelliphelliphelliphelliphelliphellip 580 598 599 Total NFShelliphelliphelliphelliphelliphelliphelliphelliphelliphelliphelliphelliphelliphelliphelliphelliphelliphelliphellip 1510 1551 1586 Wildland Fire Activities Preparednesshelliphelliphelliphelliphelliphelliphelliphelliphelliphelliphelliphelliphelliphelliphelliphelliphelliphelliphellip 675 675 1008 Suppression Suppression Activitieshelliphelliphelliphelliphelliphelliphelliphelliphelliphelliphelliphelliphelliphelliphellip 994 923 595 FLAME Fundhelliphelliphelliphelliphelliphelliphelliphelliphelliphelliphelliphelliphelliphelliphelliphelliphelliphellip 0 413 291 Wildland Fire Contingency Reservehelliphelliphelliphelliphelliphelliphelliphelliphellip 0 0 282
Total Suppressionhelliphelliphelliphelliphelliphelliphelliphelliphelliphelliphelliphelliphelliphelliphellip 994 1336 1168 Hazardous Fuels Reduction ahelliphelliphelliphelliphelliphelliphelliphelliphelliphelliphelliphelliphellip 328 340 349 Other Fire Operationshelliphelliphelliphelliphelliphelliphelliphelliphelliphelliphelliphelliphelliphelliphelliphellip 135 166 120 Total Wildland Fire Activitieshelliphelliphelliphelliphelliphelliphelliphelliphelliphelliphellip 2132 2517 2645 Capital Improvement and Maintenancehelliphelliphelliphelliphelliphelliphelliphelliphelliphellip 495 556 438 Land Acquisitionhelliphelliphelliphelliphelliphelliphelliphelliphelliphelliphelliphelliphelliphelliphelliphelliphelliphellip 51 65 75 Other Accountshelliphelliphelliphelliphelliphelliphelliphelliphelliphelliphelliphelliphelliphelliphelliphelliphelliphelliphellip 9 6 6 Subtotal Ongoing Discretionary helliphelliphelliphelliphelliphelliphelliphelliphelliphellip 4759 5315 5377
Emergency Supplemental Funding and Repaymentshelliphelliphelliphellip 200 0 0 Recovery Act
Capital Improvement and Maintenancehelliphelliphelliphelliphelliphelliphelliphelliphellip 650 0 0 Wildland Fire Managementhelliphelliphelliphelliphelliphelliphelliphelliphelliphelliphelliphelliphellip 500 0 0
Total Recovery Act Programshelliphelliphelliphelliphelliphelliphelliphelliphelliphelliphellip 1150 0 0 Total Discretionary helliphelliphelliphelliphelliphelliphelliphelliphelliphelliphelliphelliphelliphelliphellip $6109 $5315 $5377
a $10 million available for Collaborative Forest Landscape Restoration Fund from Hazardous Fuels Reduction in 2010
93
NATURAL RESOURCES AND ENVIRONMENT
Capital Improvement amp
Land Acquisition 1
All Other 13
Wildland Fire Management
43
Budget Authority (Dollars in Millions)
2009 2010 2011 Program Enacted Estimate Estimate
Mandatory Programs Permanent Appropriationshelliphelliphelliphelliphelliphelliphelliphelliphelliphelliphelliphelliphelliphellip $361 $349 $316 Secure Rural Schoolshelliphelliphelliphelliphelliphelliphelliphelliphelliphelliphelliphelliphelliphelliphelliphellip 395 387 348 Trust Fundshelliphelliphelliphelliphelliphelliphelliphelliphelliphelliphelliphelliphelliphelliphelliphelliphelliphelliphelliphellip 238 100 104
Total Mandatoryhelliphelliphelliphelliphelliphelliphelliphelliphelliphelliphelliphelliphelliphelliphelliphellip 994 836 768
Total Forest Service Budget Authorityhelliphelliphelliphelliphelliphelliphelliphellip $7103 $6151 $6145
2011 Forest Service Budget Authority Total = $61 Billion
National Forest System 26
State amp Private Forestry 5
Forest and Rangeland Research
5
Maintenance 7
The Forest Service (FS) with over 30000 staff years is the largest employer in USDA For 2011 the total request for FS ongoing discretionary activities is $54 billion an increase of $79 million over 2010 This budget will restore landscapes improve water quality reduce greenhouse gas emissions implement travel management plans and create green jobs Through targeted administrative savings in the Agencyrsquos cost pools FS will shift $52 million in administrative expenditures to programs Specifically $32 million of efficiencies in information technology and business processes will be borne by employing a centralized data center and other administrative service savings and a new automated contracting system for pre-suppression fire activities will generate $10 million in information technology savings A new automated Human Capital Management system will increase FSrsquo efficiency in handling worker claims by $10 million
94
NATURAL RESOURCES AND ENVIRONMENT
Forest and Rangeland Research For 2011 $304 million is proposed for Forest and Rangeland Research FS maintains the worlds largest forest research organization While its broad mission is to develop knowledge and technology needed to enhance the economic and environmental values of all of the Nations forests the program also supports the specific research needs that arise from managing the National Forest System (NFS) For example FS is using tools developed by this program to evaluate potential fire growth values at risk and cost-efficiency of firefighting on large wildland fire events The budget provides for the completion of a nation-wide comprehensive carbon inventory
State and Private Forestry (SampPF) Through SampPF programs FS addresses forest health concerns on Federal State and private lands A small decrease in Cooperative Fire funding is requested because in FY2011 assistance in preparing for wildfires will be focused to States and local governments that have established standards so that firefighters will be able to defend their communities safely For 2011 total funding for SampPF programs is proposed at $322 million an increase of $14 million above the 2010 level In line with the Presidentrsquos commitment to fully fund the Land and Water Conservation Fund by 2014 a $21 million increase is proposed in the Forest Legacy programmdasha program that cost-shares the purchase of conservation easements to protect nationally prioritized forest lands from development An increase of $1 million is also proposed for the creation of a Community Forest amp Open Space Conservation program to cost share fee-simple purchases of land as authorized by the 2008 Farm Bill The budget proposes an increase of $2 million to implement a competitive cost-share program for the strategic planting of trees for greenhouse gas reduction efforts in urban areas
National Forest System (NFS) FS manages over 193 million acres of public land in 44 States Puerto Rico and the Virgin Islands These lands known collectively as the NFS are managed for multiple uses on a sustained-use basis For 2011 total funding for NFS is proposed at approximately $16 billion a $35 million increase from the 2010 level The Agency has placed a focus on restoring forests for the benefit of watersheds forest health climate and vibrant local economies
bull The budget proposes a new line item ldquoIntegrated Resource Restorationrdquo which combines the Vegetation amp Watershed Management Wildlife amp Fisheries Habitat Management and Forest Products into a single line item This new line item better characterizes the scope of the work that the Agency intends to perform in 2011 Addressing the forest health crisis and restoring our forests will require integrating traditional timber management with other stewardship activities Indeed restoring our forests is not possible without a vibrant forestry sector This new line item will integrate timber management forest restoration biomass production and other stewardship activities on National Forest System lands and will support similar activities funded from other sources on adjacent Federal State and tribal lands This new line item is funded at $694 million which is an increase of $26 million above 2010
bull Within the Integrated Resource Restoration budget line item $40 million is provided for the Collaborative Forest Landscape Restoration Fund This fund will be used for ecological treatments authorized by the Forest Landscape Restoration Act of 2009 contributing to significantly improving watershed conditions creating landscapes that are
95
NATURAL RESOURCES AND ENVIRONMENT
more resilient to climate change and reducing fire risk These funds will be leveraged with local and private resources magnifying the benefits of Federal funding across forest landscapes
bull Within the Integrated Resource Restoration budget line item $50 million is provided for the new Priority Watersheds and Job Stabilization initiative Under this initiative watershed assessments will be conducted of all NFS lands integrating State forest resource assessments into the process Further the agency will use diverse stakeholder groups to prioritize watershed improvement work and a science-based monitoring program will be established to demonstrate a change in watershed condition
bull An increase of $5 million in Recreation is provided for implementation of the Agencyrsquos motor-vehicle-use maps developed as part of its travel management planning process
Wildland Fire Activities Through the Wildland Fire Activities FS protects life property and natural resources on NFS land and an additional 20 million acres on adjacent State and private lands through fee or reciprocal protection agreements For 2011 total funding for these activities is proposed at $26 billion which represents an increase of $128 million above the 2010 level As directed in the 2010 Interior Appropriations conference report to improve transparency FS realigned its suppression and preparedness costs resulting in $333 million being shifted from Suppression to Preparedness Funds are provided in fire preparedness for a minimum of 10480 firefighters The Wildland Fire budget contains $595 million for suppression activities $291 million for the FLAME fund for large-fire suppression activities and $282 million for a contingency reserve which would be used if suppression funds are exhausted In 2011 the agency will allocate $349 million for fuels reduction projects using a clear and accountable method for prioritizing potential projects that will be developed over the next three months The budget provides $15 million for the Forest Biomass for Energy Program and $5 million for the Community Wood Energy Program as authorized by the 2008 Farm Bill
96
NATURAL RESOURCES AND ENVIRONMENT
Key Performance Measure 2006 2007 2008 2009 2010 2011
Percentage of total National Forest System land base for which fire risk is reduced
11 19 21 30 30 31
through movement to a better condition class
Acres of WUI fuels treated to reduce the risk of
1590 1654 1940 1740 1470 1600
catastrophic fire
Percentage of acres treated in the WUI that have been
17 25 36 28 41 75
identified in Community Wildfire Protection Plans
Capital Improvement and Maintenance Capital Improvement and Maintenance funds construction maintenance and decommissioning of buildings recreation sites facilities roads and trails For 2011 total funding for these programs is proposed at $438 million which represents a decrease of $100 million from 2010 Most of the reduction comes from a reduction in funding for Roads activities While $168 million is provided for road maintenance and decommissioning no funding is provided for new road construction or upgrades to existing roads Roads funds will be focused on ldquoright-sizingrdquo the FS road system The budget provides $50 million for the Legacy Roads and Trails program
Land Acquisition The Land Acquisition program protects resources decreases administrative costs and increases visitor access to the National Forests and Grasslands by acquiring parcels of land for inclusion in the NFS For 2011 the budget proposes $75 million in total funding for this program The $10 million increase from 2010 reflects progress toward the Presidentrsquos goal of fully funding the Land and Water Conservation Fund by 2014 In 2011 FS will nationally prioritize the parcels it is considering for acquisition in a manner similar to the Forest Legacy program
97
MARKETING AND REGULATORY PROGRAMS
MISSION AND RELATIONSHIP TO STRATEGIC GOALS
2011 MRP Discretionary Budget Authority Total = $1019 Billion
AMS 10
APHIS 86
GIPSA 4
The economic vitality and quality of life in rural America and the US economy at large depends on a competitive efficient and productive agricultural system US agricultural producers are not simply farmers and ranchers they are often small business owners trying to survive and support their families and rural communities in a challenging global technologically advanced and competitive business environment In an era of market consolidation and intense competition these producers rely on fair and open access to markets and control over their decisions to thrive Agricultural producers also need to safeguard animal and plant resources against the introduction of foreign agricultural pests and diseases
The mission of Marketing and Regulatory Programs (MRP) is to facilitate and expand the domestic and international marketing of US agricultural products to help protect the agricultural sector from plant and animal health threats and to ensure humane care and treatment of certain animals These programs provide the basic infrastructure to improve agricultural market competitiveness for the overall benefit of both consumers and producers of American agriculture Thus the mission area contributes to all of USDArsquos Strategic Goals
USDA also plays a critical role in increasing prosperity and sustainability in our Nationrsquos agricultural system and rural communities Among other efforts MRP uses oversight activities to protect producers from unfair competition and unfair business practices and working with the Department of Justice MRP helps prevent anti-competitive behaviors across the agribusiness sector MRP also assists producers in management and marketing by providing market trend analysis and business and marketing tools This assistance includes developing and overseeing national standards for the production and handling of agricultural products labeled as organic in the National Organic Program among other items MRP programs also help increase the competitiveness of the agricultural sector by enhancing protection of the Nationrsquos agriculture from pests and diseases and increase the efficiency of production and domestic and international marketing of US commodities
98
MARKETING AND REGULATORY PROGRAMS
The Marketing and Regulatory Programs are administered by three agencies the Animal and Plant Health Inspection Service (APHIS) the Agricultural Marketing Service (AMS) and the Grain Inspection Packers and Stockyards Administration (GIPSA)
99
MARKETING AND REGULATORY PROGRAMS
ANIMAL AND PLANT HEALTH INSPECTION SERVICE (APHIS)
Budget Authority (Dollars in Millions)
2009 2010 2011 Program Enacted Estimate Budget
Discretionary Pest and Disease Exclusion Agricultural Quarantine Inspection (AQI) Appropriated helliphelliphelliphelliphelliphelliphelliphelliphelliphelliphelliphelliphelliphelliphelliphelliphelliphelliphellip $27 $29 $27 Fruit Fly Exclusion and Detectionhelliphelliphelliphelliphelliphelliphelliphelliphelliphelliphelliphellip 62 63 64 Overseas Technical and Trade Operationshelliphelliphelliphelliphelliphelliphelliphelliphellip 16 16 17 All Other Pest and Disease Exclusionhelliphelliphelliphelliphelliphelliphelliphelliphelliphelliphellip 55 59 51
Total Pest and Disease Exclusionhelliphelliphelliphelliphelliphelliphelliphelliphelliphelliphellip 160 167 159 Plant and Animal Health Monitoring Animal Health Monitoring and Surveillancehelliphelliphelliphelliphelliphelliphelliphellip 129 122 129 Animal and Plant Health Regulatory Enforcementhelliphelliphelliphelliphelliphelliphelliphelliphelliphelliphelliphelliphelliphelliphelliphelliphelliphelliphelliphellip 14 14 14 Avian Influenza helliphelliphelliphelliphelliphelliphelliphelliphelliphelliphelliphelliphelliphelliphelliphelliphelliphelliphellip 61 60 53 Emergency Management Systemshelliphelliphelliphelliphelliphelliphelliphelliphelliphelliphelliphellip 16 16 16 Pest Detectionhelliphelliphelliphelliphelliphelliphelliphelliphelliphelliphelliphelliphelliphelliphelliphelliphelliphelliphelliphellip 28 28 27 All Other Plant and Animal Health Monitoringhelliphelliphelliphelliphelliphelliphellip 8 9 8
Total Plant and Animal Health Monitoringhelliphelliphelliphelliphelliphelliphellip 256 249 247 Pest and Disease Management Emerging Plant Pestshelliphelliphelliphelliphelliphelliphelliphelliphelliphelliphelliphelliphelliphelliphelliphelliphellip 134 159 158 Wildlife Services Operationshelliphelliphelliphelliphelliphelliphelliphelliphelliphelliphelliphelliphelliphellip 76 78 71 All Other Pest and Disease Managementhelliphelliphelliphelliphelliphelliphelliphelliphellip 135 132 107
Total Pest and Disease Managementhelliphelliphelliphelliphelliphelliphelliphelliphelliphellip 345 369 336 Animal Carehelliphelliphelliphelliphelliphelliphelliphelliphelliphelliphelliphelliphelliphelliphelliphelliphelliphelliphelliphelliphellip 22 22 23 Biotechnology Regulatory Serviceshelliphelliphelliphelliphelliphelliphelliphelliphelliphelliphelliphellip 13 13 19 Veterinary Biologics and Diagnosticshelliphelliphelliphelliphelliphelliphelliphelliphelliphelliphellip 41 43 47 Other Scientific and Technical Serviceshelliphelliphelliphelliphelliphelliphelliphelliphelliphellip 30 32 29 PhysicalOperational Securityhelliphelliphelliphelliphelliphelliphelliphelliphelliphelliphelliphelliphelliphellip 6 6 6 Information Technology Infrastructurehelliphelliphelliphelliphelliphelliphelliphelliphelliphelliphellip 4 4 4 Total Salaries and Expenseshelliphelliphelliphelliphelliphelliphelliphelliphelliphelliphelliphelliphellip 877 905 870 Buildings and Facilitieshelliphelliphelliphelliphelliphelliphelliphelliphelliphelliphelliphelliphelliphelliphelliphelliphellip 5 5 5
Total Ongoing Activitieshelliphelliphelliphelliphelliphelliphelliphelliphelliphelliphelliphelliphelliphellip 881 910 875 Emergency Funding (CCC)helliphelliphelliphelliphelliphelliphelliphelliphelliphelliphelliphelliphelliphelliphellip 29 28 0
Total APHIS Discretionary Programshelliphelliphelliphelliphelliphelliphelliphelliphelliphelliphellip $910 $938 $875
100
MARKETING AND REGULATORY PROGRAMS
(Dollars in Millions)
2009 2010 2011 Program Enacted Estimate Budget
Mandatory Agricultural Quarantine Inspection (AQI) Fees ahelliphelliphelliphelliphelliphellip $147 $186 $190 Trust Fundshelliphelliphelliphelliphelliphelliphelliphelliphelliphelliphelliphelliphelliphelliphelliphelliphelliphelliphelliphelliphellip 17 14 14 Farm Bill
National Clean Plant Networkhelliphelliphelliphelliphelliphelliphelliphelliphelliphelliphelliphelliphellip 5 5 5 Plant Pest and Disease Managementhelliphelliphelliphelliphelliphelliphelliphelliphelliphelliphellip 12 45 50
Total Farm Bill Programshelliphelliphelliphelliphelliphelliphelliphelliphelliphelliphelliphelliphelliphellip 17 50 55 Total Mandatory Programshelliphelliphelliphelliphelliphelliphelliphelliphelliphelliphelliphelliphellip 181 250 259 Total APHIS Programshelliphelliphelliphelliphelliphelliphelliphelliphelliphelliphelliphelliphelliphellip $1091 $1188 $1134
a Total estimated collections are $498 million in 2010 and $508 million in 2011 Of the total $312 million and $318 million are transferred to the Department of Homeland Security in 2010 and 2011 respectively
APHIS works cooperatively with State and local agencies private groups and foreign governments to protect the safety of the Nationrsquos agriculture
The 2011 budget proposes an appropriation of about $875 million of which approximately $870 million is for salaries and expenses and about $5 million for buildings and facilities This total is a net decrease of about $35 million compared to 2010 In general the budget proposes a reallocation of resources from programs that have achieved success (eg cotton pests and screwworm) and for those which progress in eradication is not deemed feasible at this time (eg emerald ash borer) to those efforts where success in eradication may be feasible (eg Asian long-horned beetle and light brown apple moth) The budget also proposes the elimination of earmarks
APHIS supports the Departmentrsquos strategic goal to ensure children have access to safe nutritious and balanced meals Specifically APHIS and other agencies protect agricultural health by minimizing major diseases and pests This outcome is measured as the value of damage prevented and mitigated annually as a result of APHIS activities The measure indicates a decrease between fiscal years 2008 and 2009 as a result of the declining economyrsquos impact on the value of the commodities that are protected by these efforts
Key Performance Measure 2006 2007 2008 2009 2010 2011 Value of damage prevented and mitigated annually as a result of selected plant and animal health monitoring and surveillance efforts
NA 137 138 105 107 111
($ billions)
101
MARKETING AND REGULATORY PROGRAMS
Pest and Disease Exclusion The 2011 budget includes discretionary appropriations of $159 million for pest and disease exclusion The budget includes an increase of $09 million above the 2010 level to cover costs associated with the Foreign Service Pay Modernization Initiative and assist developing countries in strengthening their regulatory capacity to detect and address pests and diseases In recent years APHIS has been successful in driving the screwworm south The budget includes a decrease of $75 million below the 2010 level due to the full operation of a new sterile screwworm production facility closer to the present range of the screwworm In addition to discretionary funding APHIS collects user fees to provide technical support related to agricultural quarantine and inspections that occur at ports of entry These collections are shared with the Department of Homeland Securityrsquos Customs and Border Protection APHIS plans to retain $190 million in 2011
Plant and Animal Health Monitoring The budget requests $247 million for plant and animal health monitoring and surveillance In 2009 USDA collected stakeholder views on the National Animal Identification System (NAIS) through a variety of mechanisms (eg official Federal Registered-announced comment periods focus groups ongoing stakeholder input) This input will be used to revise the NAIS to better meet the needs of the animal agriculture community The requested $142 million will be essential in implementing an improved traceability system The budget requests a net reduction of about $7 million from the Avian Influenza line item due in part to having completed the stockpile of emergency response equipment and supplies The revised level of funding would continue to protect avian health
Pest and Disease Management Programs APHIS provides technical and financial support to help control or eradicate a variety of agricultural health threats This support is provided to various stakeholders ranging from individuals to States The 2011 budget requests $336 million for pest and disease management efforts This includes an increase of $16 million to address the Asian longhorned beetle in Massachusetts This also includes an increase of $10 million to continue efforts initiated with emergency funding to address the light brown apple moth The budget includes a decrease of about $14 million to account for successes in reducing acreage infested with boll weevil and pink bollworm Boll weevil eradication is projected by the end of fiscal year 2010 and the pink bollworm is projected to be eradicated by the end of fiscal year 2012 The budget includes a decrease of about $24 million within the emerald ash borer (EAB) program due to the limited eradication methods available and the need to devote limited resources to other pests where the likelihood of success is greater Due to these limited eradication methods APHIS will pursue a control strategy to minimize the current spread of the pest APHIS will continue survey work for EAB under a management strategy but not the costly tree removal that has been the center of the eradication strategy Tree removal has been ineffective at slowing the spread of EAB Methods development work will continue in 2011 with the possibility of developing an effective means of slowing and reversing the spread of this pest To combat any sudden urgent and unforeseen pest and disease outbreaks the Secretary retains authority to transfer funds from the CCC or other USDA accounts
Animal Care The 2011 budget proposes $23 million for Animal Welfare Act activities which is approximately the same as 2010 The budget requests $09 million for Horse Protection Act activities APHIS will submit legislative proposals to authorize the annual collection of about $12 million in user fees for Animal Welfare activities As recipients of Animal Welfare permits
102
MARKETING AND REGULATORY PROGRAMS
are the direct beneficiaries of animal welfare inspections the proposed user fee will place the cost of providing these services on the recipient rather than the US taxpayer
Scientific and Technical Services Within USDA APHIS has chief regulatory oversight of genetically modified organisms APHIS also develops methods and provides diagnostic support to prevent detect control and eradicate agricultural health threats APHIS as well works to prevent ineffective or harmful animal biologics (eg vaccines) from being marketed In addition APHIS provides Federal leadership in developing methods to address wildlife conflicts Several of these activities have been funded by earmarks which are eliminated in the 2011 budget The budget includes about $19 million an increase of about $6 million for Biotechnology Regulatory Services to assess the risk of genetically modified organisms As the number and complexity of proposed biotechnology products increase additional staff will be required to provide sufficient review This increase supports the Departmental priority of helping promote agricultural production and biotechnology exports by increasing the number of genetically engineered plant lines that are found to be safe by APHIS Finally APHIS will submit legislative proposals to authorize the annual collection of about $5 million in user fees for Biotechnology Regulatory Services activities and about $9 million in user fees for Veterinary Biologics activities As recipients of biotechnology permits and biologics licenses are the direct beneficiaries of many of the services provided by the respective division of APHIS the proposed user fee will place the cost of providing these services on the recipient rather than the US taxpayer
Key Performance Measure 2006 2007 2008 2009 2010 2011 Cumulative number of genetically engineered plant lines reviewed by USDA and found safe for use in the environment 70 73 78 80 85 100
Buildings and Facilities The budget requests $5 million for general repairs and maintenance of APHIS buildings This amount will be used for critical repairs at APHIS facilities
103
MARKETING AND REGULATORY PROGRAMS
AGRICULTURAL MARKETING SERVICE (AMS)
Budget Authority (Dollars in Millions)
2009 2010 2011 Program Enacted Estimate Budget
Discretionary Marketing Services Market Newshelliphelliphelliphelliphelliphelliphelliphelliphelliphelliphelliphelliphelliphelliphelliphelliphelliphelliphelliphelliphelliphelliphelliphellip $33 $34 $35 Egg Surveillance and Standardizationhelliphelliphelliphelliphelliphelliphelliphelliphelliphelliphelliphelliphelliphellip 8 8 8 Market Protection and Promotionhelliphelliphelliphelliphelliphelliphelliphelliphelliphelliphelliphelliphelliphelliphelliphellip 40 43 47 Wholesale Farmers and Alternative Market Developmenthelliphelliphelliphelliphelliphellip 3 3 4 Transportation Serviceshelliphelliphelliphelliphelliphelliphelliphelliphelliphelliphelliphelliphelliphelliphelliphelliphelliphelliphelliphellip 3 3 3
Total Marketing Serviceshelliphelliphelliphelliphelliphelliphelliphelliphelliphelliphelliphelliphelliphelliphelliphelliphelliphellip 87 91 97
Payments to States and Possessions Payments to Stateshelliphelliphelliphelliphelliphelliphelliphelliphelliphelliphelliphelliphelliphelliphelliphelliphelliphelliphelliphelliphelliphellip 2 2 3
Total Payments to States and Possessionshelliphelliphelliphelliphelliphelliphelliphelliphelliphelliphellip 2 2 3
Total Discretionary Programshelliphelliphelliphelliphelliphelliphelliphelliphelliphelliphelliphelliphelliphelliphelliphelliphelliphellip 89 93 100
Mandatory Funds for Strengthening Markets Income and Supply (Section 32) Commodity Program Expenseshelliphelliphelliphelliphelliphelliphelliphelliphelliphelliphelliphelliphelliphelliphelliphelliphellip 964 1056 982 Section 32 Administrative Funds
Marketing Agreements and Orders (MAampO)helliphelliphelliphelliphelliphelliphelliphelliphelliphelliphellip 17 20 20 Web-based Supply Chain Managementhelliphelliphelliphelliphelliphelliphelliphelliphelliphelliphelliphelliphellip 20 10 0 Commodity Purchase Serviceshelliphelliphelliphelliphelliphelliphelliphelliphelliphelliphelliphelliphelliphelliphelliphellip 11 12 13
Total Section 32 Administrative Fundshelliphelliphelliphelliphelliphelliphelliphelliphelliphelliphelliphellip 48 42 33 Total Section 32 Fundshelliphelliphelliphelliphelliphelliphelliphelliphelliphelliphelliphelliphelliphelliphelliphelliphelliphellip 1012 1098 1015
User Fees Perishable Agricultural Commodities Acthelliphelliphelliphelliphelliphelliphelliphelliphelliphelliphelliphelliphellip 7 7 7 Commodity Grading Serviceshelliphelliphelliphelliphelliphelliphelliphelliphelliphelliphelliphelliphelliphelliphelliphelliphellip 150 140 148
Total User Fee Funded Programshelliphelliphelliphelliphelliphelliphelliphelliphelliphelliphelliphelliphelliphelliphellip 157 147 155 Farm Bill Specialty Crop Block Grants (Sec 10109)helliphelliphelliphelliphelliphelliphelliphelliphelliphelliphelliphellip 49 55 55 Farmers Market Promotion Program (Sec 10106)helliphelliphelliphelliphelliphelliphelliphelliphellip 5 5 10 Agricultural Mgmt Assistance Organic Cost-Share (Sec 2801)helliphelliphelliphellip (2) (2) (2)
Total Farm Bill Programshelliphelliphelliphelliphelliphelliphelliphelliphelliphelliphelliphelliphelliphelliphelliphelliphellip 54 60 65
Total Mandatory Programshelliphelliphelliphelliphelliphelliphelliphelliphelliphelliphelliphelliphelliphelliphelliphellip 1223 1305 1235 Total AMS Programshelliphelliphelliphelliphelliphelliphelliphelliphelliphelliphelliphelliphelliphelliphelliphelliphelliphelliphelliphelliphellip $1312 $1398 $1335
The mission of AMS is to facilitate the competitive and efficient marketing of agricultural products in domestic and international markets while ensuring fair trading practices AMS programs benefit producers traders and consumers of US food and fiber products by promoting a strategic marketing perspective that adapts product and marketing decisions to
104
MARKETING AND REGULATORY PROGRAMS
consumer demands changing domestic and international marketing practices and new technology
AMS programs will play key roles in two initiatives The Wholesale Farmers and Alternative Market Development Program together with Rural Development programs will be part of the Government-wide Healthy Food Financing Initiative to support local and regional efforts to increase access to healthy food particularly for the development of grocery stores and other healthy food retailers in urban and rural food deserts and other underserved areas In a related effort the ldquoKnow Your Farmer Know Your Foodrdquo initiative will facilitate the development of local and regional food systems that better connect consumers with local farms create new income opportunities for farmers and place a greater focus on sustainable agricultural practices and nutritious local food Increases are proposed for the Wholesale Farmers and Alternative Market Development Program and the Federal-State Marketing Improvement Program to accomplish program objectives In addition the 2008 Farm Bill provides increased funding for the Farmers Market Promotion Program Some Section 32 funds (described below) will also be employed
Marketing Services AMS administers a variety of programs that enhance the marketing and distribution of agricultural products Activities include the dissemination of market information surveillance of shell egg handling operations development of commodity grade standards protection of producers from unfair marketing practices statistical sampling of commodities for microbiological contamination and pestici de residues development and enforcement of organic standards research and technical assistance aimed at improving efficiency of food marketing and distribution and pesticide recordkeeping
The 2011 budget includes $101 million an increase of $31 million above the 2010 level for the National Organic Program This increase includes $21 million for regulatory review enforcement and development of equivalency agreements plus a one-time increase of $1 million for assisting accredited certifying agents in achieving International Organization for Standardization (ISO) compliance to enhance compliance with program regulations and ensure the integrity of the organic label
In addition an increase of $03 million is in cluded for Market News to support the continuation of data collection and reporting of organic commodity information initiated with $35 million AMS received in 2008 Farm Bill funding
AMS will continue providing assistance to organic producers in specific states through the Agricultural Management Assistance Organic Certification Cost-Share program and using funds from the 2008 Farm Bill for organic producers and handlers nationally through the National Organic Certification Cost-Share Program Cost-share assistance is at a rate of 75 percent of certification costs up to a maximum of $750 per year
The budget includes $38 million an increase of about $09 million for the Wholesale Farmers and Alternative Market Development Program to improve access to local and regionally produced foods as part of the Departmentrsquos ldquoKnow Your Farmer Know Your Foodrdquo initiative
105
MARKETING AND REGULATORY PROGRAMS
Additional funds are included to enhance sampling under the Microbiological Data Program (about $03 million) and maintain effective testing levels of foods and drinking water under the Pesticide Data Program (about $09 million)
Payments to States and Possessions Under the Federal-State Marketing Improvement Program (FSMIP) AMS provides matching funds to State Departments of Agriculture for projects aimed at improving marketing efficiency reducing marketing costs for producers and lowering food costs for consumers The 2011 budget req uests a total of almost $3 million an increase of $13 million for the program nearly doubling of the 2010 funding level The new funding would be targeted to grants that focus on local food marketing opportunities and is part of the ldquoKnow Your Farmer Know Your Foodrdquo initiative
Section 32 Funds Section 32 of the Act of August 24 1935 authorizes the appropriation for each fiscal year of an amount equal to 30 percent of the gross receipts from duties collected under customs laws of the United States during the preceding calendar year These funds are used to encourage domestic consumption of non-price supported perishable commodities and re-establish farmersrsquo purchasing power through a variety of activities including purchases of such commodities and removal of surplus commodities from the marketplace for distribution to Federal nutrition assistance programs such as the National School Lunch Program diversion programs that bring production in line with demand and disaster assistance for producers Section 32 funds are also used to finance the administrative costs associated with the purchase of commodities and developing the specifications used for food procurement throughout the Federal government The 2011 budget request includes an increase of $055 million in Commodity Purchase Services to allow AMS to work with the Food and Nutrition Servicersquos Farm to School Tactical Team to better link local and regionally grown foods to school feeding programs The 2011 budget also proposes a rescission of $50 million in funds available for Section 32
Marketing agreements and orders help stabilize market prices and the supply of milk fruit vegetables and certain specialty crops The orders are administered locally by marketing order committees and market administrators Local activities are funded through assessments on regulated handlers Section 32 funds are used to finance Federal oversight activities for marketing agreements and orders at the national level
User Fee Programs AMS operates programs funded through license or user fees The Commodity Grading Services program provides voluntary commodity grading and classing services for dairy products fresh and processed fruits and vegetables meat and meat products poultry eggs tobacco and cotton In addition AMS enforces the Perishab le Agricultural Commodities Act (PACA) which prohibits unfair and fraudulent practices in the marketing of perishable agricultural commodities by regulating shippers distributors and retailers Full and prompt payment for fresh fruits and vegetables is a key objective of the program
2008 Farm Bill In addition to organic certification cost-sharing AMS will continue other programs at the enacted funding levels provided in the 2008 Farm Bill The Specialty Crop Block Grant Program provides funds to States solely to enhance the competitiveness of specialty crops Specialty crops are defined as fruits vegetables tree nuts dried fruits horticulture and
106
MARKETING AND REGULATORY PROGRAMS
nursery crops (including floriculture) AMS awarded approximately $49 million in specialty crop block grants during 2009 The Farm Bill made $55 million available for 2010 and 2011 Under the Farmersrsquo Market Promotion Program competitive grants are given to help improve and expand domestic farmersrsquo markets roadside stands community-supported agriculture programs agro-tourism activities and other direct producer-to-consumer market opportunities AMS awarded more than $45 million in grants during 2009 The Farm Bill made $5 million available in 2010 and $10 million in 2011
GRAIN INSPECTION PACKERS AND STOCKYARDS ADMINISTRATION (GIPSA)
Budget Authority (Dollars in Millions)
2009 2010 2011 Program Enacted Estimate Budget
Discretionary Salaries and Expenses Grain Regulatory Programhelliphelliphelliphelliphelliphelliphelliphelliphelliphelliphelliphelliphelliphellip $18 $18 $18 Packers and Stockyards Programhelliphelliphelliphelliphelliphelliphelliphelliphelliphelliphellip 22 24 26
Total Salaries and Expenseshelliphelliphelliphelliphelliphelliphelliphelliphelliphelliphelliphellip 40 42 44
Mandatory Inspection and Weighing User Feeshelliphelliphelliphelliphelliphelliphelliphelliphelliphellip (42) (42) (45) Total GIPSA Programshelliphelliphelliphelliphelliphelliphelliphelliphelliphelliphelliphelliphelliphellip $40 $42 $44
GIPSA establishes the official US standards for grain conducts official weighing and grain inspection activities and grades rice dry beans peas lentils and processed grain products The agency regulates and monitors the activities of dealers market agencies stockyard owners live poultry dealers packer buyers packers and swine contractors in order to detect prohibited unfair unjust discriminatory or deceptive and anti-competitive practices in the livestock meat and poultry industries The agency also reviews the fina ncial records of these entities to promote the financial integrity of the livestock meat and poultry industries As such its efforts help USDA enhance international competitiveness of American agriculture and the economic viability and sustainability of rural and farm economies
For 2011 the budget proposes a program level for salaries and expenses of about $89 million of which $45 million is from existing inspection and weighing user fees Of the appropriations request of $44 million about $18 million is devoted to the Grain Regulatory Program including standardization compliance and methods development activities and nearly $26 million to the Packers and Stockyards Program Separately GIPSA will submit a legislative proposal to authorize the collection of fees for the development of grain standards and to amend the Packers and Stockyards Act to provide authority to collect license fees to cover the cost of the program
107
MARKETING AND REGULATORY PROGRAMS
The 2011 budget includes an increase of approximately $18 million to further strengthen enforcement of the Packers and Stockyards Act With additional staff including attorneys GIPSA would bolster direct enforcement and promote greater voluntary compliance with the Act The increase would enable GIPSA to perform approximately 500 additional inspections and compliance reviews and increase industry compliance with the Packers and Stockyards Act to 85 percent
Key Performance Measure 2006 2007 2008 2009 2010 2011
Percent of industry compliance with the Packers and Stockyards Act NA 75 80 80 83 85
108
RESEARCH EDUCATION AND ECONOMICS
MISSION AND RELATIONSHIP TO STRATEGIC GOALS
2011 REE Budget Authority Total = $29 Billion
ARS 41
ERS 3
NASS 6
NIFA 50
Agricultural research is the key element in productivity increases which is central to economic growth in the agricultural sector and typically induces strong effects in other sectors Agricultural research ultimately leads to increased profitability for farmers reduced food costs and greater choice for consumers and improved management of the natural-resource base Major Studies have consistently found that the net social returns from public agricultural research in the United States are high estimated to be at least 35 percent annually Although agricultural research may seem to be an anachronism in todays urban society issues such as the safety of genetically engineered foods pathogens in the food supply and environmental problems make it as important as ever
The Research Education and Economics (REE) mission area provides Federal leadership for the discovery application and dissemination of information and technologies spanning the biological physical and social sciences through agricultural research education and extension activities and economic and statistical analysis which supports all of USDArsquos Strategic Goals The 2011 REE budget serves to ensure a safe sustainable and competitive US food and fiber system and healthy families and communities
REE provides research education and extension that support each of the Departmentrsquos four strategic goals through its intramural and competitive grant programs and through strengthening the capacity of institutions of higher education Through major funding initiatives REE will be the catalyst and premier provider of knowledge for US agriculture by focusing its resources on five key activities Enhance Rural Prosperity Lead Efforts to Mitigate and Adapt to Climate Change Support Agriculture Production in Food-Insecure Nations Increase Access to Nutritious Food and Protect Agricultural Health by Minimizing Major Diseases and Pests to Ensure Access to Safe Plentiful and Nutritious Food
109
RESEARCH EDUCATION AND ECONOMICS
REE responsibilities are carried out by four agencies the Agricultural Research Service conducts intramural research in the area of natural and biological sciences the Economic Research Service performs intramural economic and social science research the National Agricultural Statistics Service conducts the Census of Agriculture and provides the official current statistics on agricultural production and indicators of the economic and environmental welfare of the farm sector and the National Institute of Food and Agriculture partners with land grant and non-land grant colleges and universities in carrying out extramural research higher education and extension activities
110
RESEARCH EDUCATION AND ECONOMICS
AGRICULTURAL RESEARCH SERVICE (ARS)
Budget Authority (Dollars in Millions)
2009 2010 2011 Program Enacted Estimate Budget
Discretionary New ProductsProduct QualityValue Added $103 $105 $113 Livestock Production 80 81 85 Crop Production 199 208 220 Food Safety 106 108 114 Livestock Protection 75 79 83 Crop Protection 198 204 213 Human Nutrition 79 86 91 Environmental Stewardship 220 228 240
Total Research Programs 1060 1099 1159 National Agricultural Library 23 22 23 Repair and Maintenance of Facilities 17 17 18
Total Ongoing Programs 1100 1138 1200 Earmarked Projects 40 42 0
Total Research and Information Activities 1140 1180 1200 Buildings and Facilities 47 71 0
Total Ongoing Discretionary Programs 1187 1251 1200 Collaborative Research Program 3 0 0
Recovery Act Buildings and Facilities 176 0 0
Total Discretionary Programs 1366 1251 1200 Mandatory Trust Funds 24 24 24
Total ARS $1390 $1275 $1224
ARS conducts research to develop new scientific knowledge transfer technology to the private sector to solve technical agricultural problems of broad scope and high national priority and provide access to scientific data The agency also includes the National Agricultural Library the Nations major information resource in the food agricultural and natural resource sciences
111
RESEARCH EDUCATION AND ECONOMICS
2011 ARS Research Budget Authority Total = $12 Billion
Food Safety and Environmental
Product QualityValue
Added 10
Crops 36
Livestock 14
Nutrition 17
Stewardship 20
All Other 3
The 2011 budget requests approximately $12 billion for ARS research and information funding This is an increase of $20 million over the 2010 enacted level Further approximately $42 million in Congressional earmarks have been redirected to high-priority research initiatives including the following
New ProductsProduct QualityValue Added ARS research enhances the economic viability and competitiveness of US agriculture by (1) maintaining the quality of harvested agricultural commodities or enhancing their marketability and (2) expanding domestic and global market opportunities through the development of value-added food and non-food products and processes The 2011 budget provides an increase of $10 million for the establishment of Regional Biofuels Feedstocks Research and Demonstration Centers These five Centers will be managed by ARS and will coordinate efforts for research conducted by other agencies and departments to accelerate the development and deployment of dedicated energy feedstocks including perennial grasses and sustainable feedstock production systems for advanced biofuels suited for best participation within different regions across the nation
Livestock Production ARS conducts research that develops biotechnological methods to use animal germplasm and associated genetic and genomic repositories and databases to ensure an abundant and safe food supply Research also provides the knowledge to assess farm animal well-being reduce animal stress increase animal health and improve the international competitiveness and sustainability of US aquaculture The 2011 budget includes an increase of $3 million for research on breeding and germplasm improvement to enhance food production and security ARS will harness the expanding body of genomic information on beef and dairy cattle swine and trout to improve feed and production efficiency and animal health Information on the relationships between health nutrients growth and feed efficiency can be used to reduce inputs to animal production and optimize animal health and animal product quality characteristics The proposed research will have a wide range of applications including the selection of animals with improved growth efficiency and disease resistance and
112
RESEARCH EDUCATION AND ECONOMICS
the development of genetic-based performance prediction The 2011 budget also includes an increase of $2 million for genomic sequencing to characterize important traits for food animal production and fund research to identify genes that will improve the health growth and productivity of food animals Addressing animal health and feed efficiency is the key to meeting the demands of the growing population and preventing world hunger
Crop Production ARS safeguards and utilizes plant microbial and insect germplasm associated genetic and genomic databases and bioinformatic tools to ensure an abundant high quality safe and inexpensive supply of food feed fiber ornamentals and industrial products To further these goals the 2011 budget provides an increase of $43 million for crop breeding to enhance food production and security The proposed research will expand ARSrsquo capacity to improve genetic resources and cultivars for the benefit of US producers seed companies processors and consumers As a result the research will lead to improved germplasm and varieties with higher yields improved disease and pest resistance and resilience to weather extremes such as high temperature and drought The budget additionally includes an increase of $37 million for ARS to expand activities to identify acquire and secure unprotected genetic resources of plants insects and crop and veterinary associated microbes A broad spectrum of genetic diversity in the form of viable and well documented germplasm will be conserved Vulnerable or threatened genetic resources vital to national security will be safely stored and backed-up in secure facilities The 2011 budget proposes an additional $08 million to specifically address the need to protect the worldrsquos grain supply through grain disease research and conservation Preventing grain disease losses is critical in meeting the demands of a growing population The budget also includes an increase $08 million to support the activities of the World Food Prize Foundation which annually recognizes those who have advanced human development by improving the quantity quality or availability of the worldrsquos food supply
The budget provides an additional $1 million for developing local food systems for the urban Eastern Seaboard Region New research will assess the capacity to produce food locally that will meet the needs of a large urban population by examining the constraints imposed by environmental economic social and geographic factors This information will be used to assess local food production potential and economic viability and supports the Departmentrsquos Know Your Farmer Know Your Food Initiative Finally an increase of $05 million is proposed for research to determine the role of pathogens and other stress factors in Colony Collapse Disorder of honey bees and how to mitigate their effects
Food Safety ARS research helps to ensure that the food supply is safe for consumers and that food and feed meet foreign and domestic regulatory requirements This research also focuses on the reduction of the hazards of both introduced and naturally occurring toxins in foods and feed including pathogenic bacteria viruses parasites chemical contaminants mycotoxins and naturally occurring toxins produced by plants The 2011 budget includes an additional $5 million to enhance research to safeguard the Nationrsquos food supply from foodborne pathogens by developing and validating management practices to prevent pre-harvest pathogen contamination of produce and post-harvest strategies to eliminate pathogen contamination Research will also develop and validate detection and sensing technologies for pathogens toxins and chemical residues
113
RESEARCH EDUCATION AND ECONOMICS
Livestock Protection ARS conducts research to reduce economic losses from infectious genetic and metabolic diseases of livestock and poultry and to eliminate the losses to animal production and products caused by arthropod diseases and arthropod borne trauma This research also reduces the risk to humans from arthropod borne zoonotic diseases and enhances the safety of animal products The budget includes an increase of $3 million for improved animal protection to enhance food production and security Research will focus on the development of preventive measures to combat priority infectious diseases of livestock and poultry Specific projects include the development of new measures to control bovine tuberculosis and bovine respiratory diseases Furthermore diagnostics vaccines and biotherapeutics designed to convey disease resistance in genetically-defined animal populations will be produced As a result of this research catastrophic losses from new and emerging diseases will be avoided
Crop Protection ARS provides the knowledge to reduce losses caused by plant diseases by defining practices that are effective and affordable and that maintain environmental quality Research also provides the technology to manage pest populations below economic damage thresholds by the integration of environmentally compatible strategies that are based on an increased understanding of the pestrsquos biology and ecology The 2011 budget includes an increase of $48 million for crop protection research to expand grain crop germplasm collection enhancement and breeding programs Specific projects will focus on improving citrus germplasm to protect from citrus greening breeding oats wheat and barley to be resistant to Ug99 and other cereal rusts and breed legume germplasm with enhanced disease and pest protection Breeding and disease protection research will increase the production capacity of perennial grains and optimize perennial grain production systems Additionally sustainable agricultural systems will be developed through research on long-term crop rotation trials This research will expand the adoption of sustainable agricultural practices and address a critical aspect of world hunger by avoiding catastrophic losses from new and emerging cereal diseases The budget also includes an increase of $33 million for research on the Departmentrsquos scientific collections USDA has principal responsibility for safeguarding the Nationrsquos insect systematics collections which are needed for developing pest management strategies identifying new pollinators and the testing of natural enemies needed for biological control of insects and weeds Through this research crops and veterinary animals will be better protected from pests through biological control plant resistance and the development of other management tools
Human Nutrition ARS centers conduct basic and applied research to identify and understand how nutrients and other bioactive food components affect the health of diverse populations including children the elderly pregnant and lactating women and healthy adults The ultimate goal of this food-based agricultural research is to identify foods and diets coupled with genetics and physical activity that will sustain and promote health throughout life The 2011 budget proposes an increase of $64 million for research on childrenrsquos nutrition and health Obesity prevalence among adults and children in the US has tripled in the last 30 years During this time the Dietary Guidelines for Americans (DGA) have been issued by USDA in partnership with the Department of Health and Human Service Despite the DGA forming the basis for Federal food and nutrition policy and the requirement of USDA nutrition assistance programs to provide meals that meet the DGA few Americans have diets that come
114
RESEARCH EDUCATION AND ECONOMICS
close to the recommendations The proposed increase will fund a study to identify barriers and facilitators to following the DGA in multiple locations nationwide in children and adults and in three racial and ethnic groups New methods to motivate behavior change in eating and physical activity will result from this research Finally funds will be used to enhance the nutrition information available through wwwNutritiongov With most nutrition information aimed at adults ARS will significantly increase information about childrenrsquos healthy weight gain during growth and ways by which obesity can be prevented
Environmental Stewardship This broad area of research emphasizes the development of technology and scientific knowledge that will allow producers to manage conserve and protect the Nationrsquos soil water and air resources while optimizing agricultural productivity The 2011 budget proposes an additional $54 million to conduct research that will enhance American agriculturersquos adaptability to a changing global climate ARS will increase the resilience of crops so they can thrive in variable and extreme environments as well as focus on mitigating the effects of climate change by ensuring the availability of water through improved management Research will also develop production systems that will provide a sustainable balance of crop production carbon soil sequestration and net greenhouse gas emissions The budget also proposes an increase of $63 million for research which will develop sustainable agricultural practices through the integration of information and technologies leading to enhanced productivity profitability energy efficiency and natural resource stewardship for American farmers and ranchers New practices will be developed that utilize on-farm resources and natural processes which reduce the need for inputs and reduce production costs and risks The development of these improved agricultural systems will increase the long-term financial viability competitiveness and sustainability of farms and rural communities and increase food and fiber security for the US and the world
National Agricultural Library (NAL) NAL is one of four national libraries in the United States and provides access to scientific agricultural data NAL continues to expand its efforts to provide this information through the Internet thereby increasing the efficiency of its information management and delivery The budget proposes an increase of $15 million for developing information and tools on all facets of sustainable agriculture including information on sustainable and regenerative crop and livestock farming systems ecological pest management renewable energy options for farms direct marketing practices and community food systems organic production certification and marketing and crop and livestock diversification
Buildings and Facilities Repair and Modernization ARS has over 100 research facilities throughout the US and abroad many collocated with other USDA agencies and university partners The budget does not include funding for ARS building and facilities projects but rather provides an increase of $175 million for a review of USDA research facilities to develop a Department-wide capital improvement strategy to guide future investments consistent with priority program goals
115
RESEARCH EDUCATION AND ECONOMICS
NATIONAL INSTITUTE OF FOOD AND AGRICULTURE (NIFA)
Budget Authority (Dollars in Millions)
2009 2010 2011 Program Enacted Estimate Budget
Discretionary Research and Education Activities $691 $792 $839 Extension Activities 474 495 479 Integrated Activities 57 60 25 Native American Endowment Fund Interest 4 4 4
Total Ongoing Discretionary Programshelliphelliphelliphelliphelliphelliphelliphellip 1226 1351 1347 Mandatory Risk Management Education 5 5 5 Native American Endowment Fund 12 12 12 Hispanic-Serving Ag-Colleges Endowment Fund 0 0 10 Farm Bill
Biomass Research and Development 20 28 30 Organic Agriculture Research and Education Initiative 18 20 20 Healthy Urban Enterprise Development Center 1 1 1 Beginning Farmer and Rancher Development Program 18 19 19 Specialty Crop Research Initiative 50 50 50 Biodiesel Fuel Education Program (1) (1) (1) Community Food Projects (5) (5) (5) Total Farm Bill Programs 107 118 120
Total Mandatory Programs 124 135 147 Total NIFA $1350 $1486 $1494
NIFA formerly the Cooperative State Research Education and Extension Service has the primary responsibility for providing linkages between the Federal and State components of a broad-based national agricultural research extension and higher education system NIFA provides funding for projects conducted in partnership with the State Agricultural Experiment Stations the State Cooperative Extension System land grant universities colleges and other research and education institutions Federal funds are distributed to universities and institutions by statutory formula funding competitive awards and grants NIFA is responsible for administering USDAs primary competitive research grants program the Agriculture and Food Research Initiative (AFRI) which supports investigator-initiated research with strong potential to contribute to major breakthroughs in agricultural science
116
RESEARCH EDUCATION AND ECONOMICS
National Institute of Food and Agriculture Budget Authority
(Dollars in Millions) 2009 2010 2011
Program Enacted Estimate Budget Discretionary Formula Grants
Smith-Lever 3 (bampc)helliphelliphelliphelliphelliphelliphelliphelliphelliphelliphelliphelliphelliphelliphelliphelliphellip $289 $298 $298 Hatch Acthelliphelliphelliphelliphelliphelliphelliphelliphelliphelliphelliphelliphelliphelliphelliphelliphelliphelliphelliphelliphellip 207 215 215 1890 Research and Extensionhelliphelliphelliphelliphelliphelliphelliphelliphelliphelliphelliphelliphelliphellip 86 91 91 McIntire-Stennis Cooperative Forestryhelliphelliphelliphelliphelliphelliphelliphelliphelliphellip 28 29 29 Animal Health and Disease Researchhelliphelliphelliphelliphelliphelliphelliphelliphelliphelliphellip 3 3 3 Total Formula Grantshelliphelliphelliphelliphelliphelliphelliphelliphelliphelliphelliphelliphelliphelliphelliphellip 613 636 636
Agriculture and Food Research Initiativehelliphelliphelliphelliphelliphelliphelliphelliphelliphellip 202 262 429 Integrated Activities - Section 406helliphelliphelliphelliphelliphelliphelliphelliphelliphelliphelliphellip 42 45 0 Pest ControlManagement Activitieshelliphelliphelliphelliphelliphelliphelliphelliphelliphelliphellip 26 26 26 Sustainable Agriculture Federal-State Matching Grantshelliphelliphelliphellip 0 0 10 Sustainable Agriculture Research and Extensionhelliphelliphelliphelliphelliphelliphellip 19 19 20 Higher Education Programshelliphelliphelliphelliphelliphelliphelliphelliphelliphelliphelliphelliphelliphelliphellip 40 47 52 Native American Endowment Fund Interesthelliphelliphelliphelliphelliphelliphelliphelliphellip 4 4 4 Federally-Recognized Tribes Extension Programhelliphelliphelliphelliphelliphellip 3 3 5 1890 Facilitieshelliphelliphelliphelliphelliphelliphelliphelliphelliphelliphelliphelliphelliphelliphelliphelliphelliphelliphelliphellip 18 20 20 Extension Services at 1994 Institutionshelliphelliphelliphelliphelliphelliphelliphelliphelliphellip 3 4 5 Expanded Food and Nutrition Education Program (EFNEP)helliphellip 66 68 68 Federal Administrationhelliphelliphelliphelliphelliphelliphelliphelliphelliphelliphelliphelliphelliphelliphelliphelliphellip 17 18 18 Electronic Grants Administration Systemhelliphelliphelliphelliphelliphelliphelliphelliphelliphellip 2 2 5 Regional Diagnostic Networkhelliphelliphelliphelliphelliphelliphelliphelliphelliphelliphelliphelliphelliphellip 10 10 10 Veterinary Medical Services Acthelliphelliphelliphelliphelliphelliphelliphelliphelliphelliphelliphelliphellip 3 5 5 Other Research Extension and Integrated Programshelliphelliphelliphelliphellip 30 37 34
Subtotal Ongoing Discretionaryhelliphelliphelliphelliphelliphelliphelliphelliphelliphelliphelliphellip 1098 1206 1347 Earmarked Projects and Grantshelliphelliphelliphelliphelliphelliphelliphelliphelliphelliphelliphelliphelliphellip 128 141 0 Improved Nutritional Delivery of Food Assistance Grantshelliphelliphellip 0 4 0
Total Discretionary Programshelliphelliphelliphelliphelliphelliphelliphelliphelliphelliphelliphellip 1226 1351 1347 Mandatory Risk Management Education 5 5 5 Native American Endowment Fund 12 12 12 Hispanic-Serving Ag-Colleges Endowment Fund 0 0 10 Farm Bill Programs 107 118 120 Biodiesel Fuel Education Program (1) (1) (1) Community Food Projects (5) (5) (5)
Total NIFA $1350 $1486 $1494
117
RESEARCH EDUCATION AND ECONOMICS
2011 NIFA Budget Authority
$747 800 $731 $731 $704 700
600
500
400
300
200
100
0
Formula Competitive Earmarks
Does not include endowment funds
The 2011 budget requests approximately $135 billion in discretionary funding for NIFA While in total this amount is the same as the 2010 level it reflects a major redirection of funding priorities The Department has greatly increased funding of competitive grants maintained funding for capacity building through formula programs and eliminated $141 million in Congressional earmarks High-priority research initiatives include the following
Agriculture and Food Research Initiative (AFRI) AFRI is the Nationrsquos premier competitive peer-reviewed research program for fundamental and applied sciences in agriculture It is broad in scope with programs ranging from fundamental science to farm management and community issues The 2011 budget proposes a substantial increase in competitive research funding with $4288 million for AFRI an increase of $167 million over 2010 Included in this amount is an increase of $34 million for the Departmentrsquos alternative and renewable energy research initiative to develop high-quality cost-effective feedstocks for biofuel production that do not affect the food supply $50 million for global climate change research to develop mitigation capabilities and adaptive capacities for agricultural production $13 million for international food security to expand research education and extension efforts on plant and animal diseases that threaten public health and agricultural production $20 million for an integrated food safety research program which will improve our understanding of disease-causing microorganisms their products and naturally occurring contaminants in meats poultry seafood and fresh fruits and vegetables and $50 million in nutrition and obesity prevention research
Electronic Grants Administration With increased funding for AFRI a significant rise in the number of applications is anticipated requiring increased efficiency of the grant-making processes and systems Additionally the breadth and types of grants made will increase
$ M
illio
ns
$527 $604
$128 $141
2009 2010 2011
118
RESEARCH EDUCATION AND ECONOMICS
requiring the development of new grant management tools The 2011 budget proposes an increase of $3 million for improved grants management systems which will substantially lower the transaction costs of applying for an AFRI or other NIFA competitive grant while increasing proposal receipt and acceptance speeds and accuracy
Sustainable Agriculture Research and Education (SARE) Program SARE advances agricultural innovations that improve profitability environmental stewardship and quality of life As part of the Departmentrsquos Know Your Farmer Know Your Food Initiative the 2011 budget proposes an increase of $10 million for the creation of a new Federal-State Matching Grant SARE Program to assist in the establishment and enhancement of State sustainable agriculture research education and extension programs The matching requirement will leverage State or private funds and build the capabilities of American agriculture in becoming more productive and sustainable Additionally an increase of $076 million is proposed to support research and extension that will improve soil quality and carbon sequestration save energy and mitigate climate change as well as provide education and training for Cooperative Extension the Natural Resources Conservation Service and other agriculture professionals These program increases will bring total SARE funding to $30 million
Key Performance Measure 2006 2007 2008 2009 2010 2011 The number of farmers and ranchers that gained an economic environmental or quality-of-life benefit from a change in practice learned by participating in a SARE project 9610 10240 10849 11300 11800 12300
Hispanic-Serving Agricultural Colleges and Universities Endowment Fund With the Hispanic community being the fastest growing sector of the American population an investment in the Hispanic-Serving Agricultural Colleges and Universities (HSACU) is needed to ensure that these institutions can effectively compete for NIFA competitive grants Section 7129 of the 2008 Farm Bill authorized the establishment of an endowment fund for HSACU The 2011 budget proposes an increase of $10 million to establish the fund which will lead to significant and measurable advancement of Hispanic and other students in the food and agricultural sciences Funding will come from the annual interest generated by the Endowment
Extension Education on Tribal Lands and at 1994 Institutions The Federally-Recognized Tribes Extension Program supports extension agents who establish programs in agriculture community development families and societal issues facing Native Americans The budget proposes an increase of $23 million to more than double the number of tribes being served by extension and will be used to develop and deploy sustainable production practices Additionally the budget proposes an increase of $1 million for Extension Services at the 1994 Institutions to conduct an Expanded Food and Nutrition Education Program (EFNEP) pilot in a number of Native American communities through a competitive grant process The 1994 Institutions which have demonstrated initial success in providing nutrition education
119
RESEARCH EDUCATION AND ECONOMICS
would partner with 1862 Institutions with a strong EFNEP or other innovative program to provide culturally relevant nutrition education
Formula Funding NIFA provides formula funding for research and extension at 1862 1890 and 1994 land-grant institutions schools of forestry and schools of veterinary medicine The 2011 budget continues to maintain funding for these important capacity building programs at the 2010 enacted level This funding will allow institutions to sustain the matching requirement that by many of these programs have thereby allowing Federal funds to leverage non-Federal resources Programs include Hatch Act and Smith-Lever programs which fund research and extension at 1862 Institutions Evans-Allen 1890 Extension and the 1890 Facilities Grants program which fund agricultural research extension and the acquisition and improvement of facilities equipment and libraries at 1890 institutions including Tuskegee University and West Virginia State University the Tribal Colleges Endowment Fund which distributes the interest earned by an endowment and the Tribal Colleges Education Equity Grants Program which strengthens higher education instruction at the thirty-four 1994 land-grant institutions the McIntire-Stennis Cooperative Forestry Program which funds research on forests and related rangelands at eligible 1862 and 1890 land-grants and institutions offering training in the forestry sciences the Animal Health and Disease Research Program which funds research at accredited colleges of veterinary medicine and State Agricultural Experiment Stations that conduct animal health and disease research and the Expanded Food and Nutrition Education Program carried out by the 1862 and 1890 land-grant institutions to assist low-income individuals in acquiring the knowledge skills and changed-behavior necessary for nutritionally sound diets
1890 Land Grant Institutions The 2011 budget request maintains the historic funding levels for programs supporting 1890 land-grant institutions and includes approximately $91 million for 1890 research and extension formula programs -- $485 million for research and $427 million for extension Additionally the request includes $198 million for 1890 Facilities Grants and $183 million Capacity Building Grants at 1890 Institutions The budget for these programs reflects Administrationrsquos policy to maintain these important programs
Rural Revitalization through Education In support of the Presidentrsquos initiative to make education a national priority the budget proposes a total increase of $5 million for rural education to sustain rural communities This includes an increase of $25 million for the Secondary Education Two-Year Postsecondary Education and Ag in the K-12 Classroom (SPECA) Grants Program and $25 million for the Higher Education Institution Challenge (HEC) Grants Program With SPECA funds NIFA will focus on improving the economic health and viability of rural communities through the development of degree programs emphasizing new and emerging employment opportunities in agriscience and agribusiness fields With HEC funds NIFA will assist academic institutions in rural areas to prepare students for emerging science technology engineering and mathematics (STEM) opportunities
Veterinary Medicine Loan Repayment Program (VMLRP) The 2011 budget maintains funding for the VMLRP at the 2010 enacted level of $48 million The VMLRP will repay the
120
RESEARCH EDUCATION AND ECONOMICS
loans of veterinarians who agree to serve in geographic and veterinary practice areas that have a shortage of food animal veterinarians NIFA published the interim rule for the program on July 9 2009 which established the process and procedures for designating veterinarian shortage situations and administering the VMLRP
121
RESEARCH EDUCATION AND ECONOMICS
ECONOMIC RESEARCH SERVICE (ERS)
Budget Authority (Dollars in Millions)
2009 2010 2011 Program Enacted Estimate Budget
Economic Research Servicehelliphelliphelliphelliphelliphelliphelliphelliphelliphelliphelliphelliphelliphellip $80 $82 $87
ERS provides economic and other social science information and analysis on agriculture food the environment and rural development ERS produces such information and analyses to inform policy and program decisions made across the spectrum of USDA missions and supplies them in outlets that are also accessible to USDA stakeholders and the general public The 2011 budget requests approximately $87 million in program funding an increase of $8 million in program initiatives which is offset by $3 million in terminations of low-priority programs
Community Access to Local Foods The availability of fresh healthy local foods depends to a large extent on the local food environment and community characteristics Food choices are critically important to health outcomes and these choices are shaped or significantly influenced by these factors Therefore the budget proposes an increase of $2 million which supports the Departmentrsquos Know Your Farmer Know Your Food initiative to develop data and conduct economic research on the access to affordable and nutritious local foods in low-income communities With USDA playing a key role in developing policies that address diet and health this initiative will lead to a better understanding of how the Department can better support sustainable and healthy communities
Data Improvement As part of a government-wide data improvement program the 2011 budget includes an increase of $4 million to strengthen the Departmentrsquos statistical protocols and tools This includes a $2 million initiative to establish a structure among statistical agencies headed by ERS to improve data access develop tools for data processing and increase the utility of Federal data The 2011 budget also includes an increase of $2 million for an administrative data pilot project Administrative data information collected in conjunction with administering government programs provide an opportunity for increasing the statistical ability to understand and address critical policy issues The goal of this initial project will be (1) to understand how nutrition assistance and other government programs work together to provide a social safety net and (2) how nutrition assistance and health care policy work together to improve dietary and health outcomes
Data Integrity and Confidentiality As part of the Administrationrsquos expense cutting measures USDA will consolidate seven existing leases ERS will physically relocate from its current location as part of this move To maintain the integrity and confidentiality of its data at secure sites the budget proposes an increase of approximately $1 million for storage and security at separate locations with the ability to control and monitor access
122
RESEARCH EDUCATION AND ECONOMICS
NATIONAL AGRICULTURAL STATISTICS SERVICE (NASS)
Budget Authority (Dollars in Millions)
2009 2010 2011 Program Enacted Estimate Budget
Discretionary Agricultural Estimates $115 $124 $132 Census of Agriculture 37 38 33
Total Discretionary Programs $152 $162 $165
The mission of NASS is to provide timely accurate and useful statistics in service to US agriculture NASS statistics provide the information necessary to keep agricultural markets stable and efficient and to help maintain a consistency for all users of agricultural statistics The 2011 budget requests approximately $164 million in program funding This includes an increase of $63 million in initiatives which is offset by $51 million in terminations of low-priority programs which includes eliminating a land tenure survey that duplicates work being conducted under the Agricultural Resource Management Survey
County Estimates Program The agricultural estimation program provides a comprehensive set of unbiased data covering most agricultural commodities as well as economic environmental and rural demographic data As part of this program NASS has produced county-level statistics for selected commodities that impact billions of dollars of government payments The budget includes an increase of $5 million to improve the data quality of the County Estimates program which is used within the Department to administer crop insurance programs that provide US farmers a safety net ensuring protection against unstable growing conditions as well as crop revenue support programs emergency assistance payments and the Conservation Reserve Program
Climate Change Also within the agricultural estimation program an increase of $08 million is proposed that will allow NASS to enhance its remote sensing activities NASS continues to utilize advanced technologies to monitor agricultural acreage and production This initiative is proposed to increase the number of States in which cropland data is collected and provide NASS the ability to collect additional data on crop conditions as well as fill an important informational gap on soil moisture conditions and drought monitoring
Organic Agriculture Study Also within the agricultural estimation program an increase of $05 million is proposed that will allow NASS to develop an ongoing data series on organic production handling and distribution With this information USDA and others will be able to monitor the financial health and continued growth and evolution of this important sector
Census of Agriculture The 2011 budget includes funding to support the second year of the 2012 Census of Agriculturersquos five year cycle The Census of Agriculture provides comprehensive data on the agricultural economy with national State and county level details The census data are relied upon to measure trends and new developments in the agricultural sector
123
OFFICE OF THE SECRETARY
Budget Authority (Dollars in Millions)
2009 2010 2011 Program Enacted Estimate Budget
Discretionary Office of the Secretaryhelliphelliphelliphelliphelliphelliphelliphelliphelliphelliphelliphelliphelliphelliphellip $15 $19 $20 Healthy Food Financing Initiativehelliphelliphelliphelliphelliphelliphelliphelliphelliphelliphellip 0 0 35 Mandatory Trust Fundshelliphelliphelliphelliphelliphelliphelliphelliphelliphelliphelliphelliphelliphelliphelliphelliphelliphelliphelliphellip 1 1 1 Total OSEChelliphelliphelliphelliphelliphelliphelliphelliphelliphelliphelliphelliphelliphelliphelliphelliphelliphelliphelliphellip $16 $20 $56
OFFICE OF THE SECRETARY
The Office of the Secretary (OSEC) assisted by the Deputy Secretary the Subcabinet and members of their immediate staffs directs and coordinates the work of the Department This involves providing policy direction for all areas of the Department and maintaining liaisons with the Executive Office of the President members of Congress and the public The 2011 budget requests $20 million for OSEC to fund on-going policy leadership tribal consultation and cross-cutting trade and biotechnology activities Of this amount there is an increase of $2 million for the Office of Ecosystem Services and Markets within the Office of the Under Secretary for Natural Resources and Environment to coordinate USDA involvement in the development of market opportunities for services provided by American agriculture such as carbon sequestration and water conservation
Healthy Food Financing Initiative provides funding for a new multi-year Healthy Food Financing Initiative (HFFI) that will increase the availability of affordable healthy foods in underserved urban and rural communities particularly through the development or equipping of grocery stores and other healthy food retailers To support this initiative the Departments of Agriculture Health and Human Services and Treasury have partnered to make available over $400 million in financial and technical assistance to community development financial institutions other nonprofits public agencies and businesses with sound strategies for addressing the healthy food needs of communities These organizations will use Federal grants below-market rate loans loan guarantees and tax credits to attract private sector capital for an even greater investment in projects that increase access to fresh produce and other healthy foods The goal is to substantially reduce the number of food deserts in our nation over the next several years
Food deserts are communities in which residents do not have access to affordable and healthy food options Instead of supermarkets and grocery stores these communities are typically served by fast food restaurants and convenience stores that offer little if any healthy options This lack of access contributes to a poor diet and can lead to higher levels of obesity and other diet-related diseases such as diabetes and heart disease Most often these communities are economically distressed and less attractive under conventional financing to retailers of healthy food But effective local programs have shown that well-targeted financing and technical assistance can
124
OFFICE OF THE SECRETARY
create viable business outcomes and access to healthier food options Targeting federal financial assistance to these areas will not only increase the supply of healthy foods and create new markets for farmers but also create jobs and support broader development efforts to revitalize distressed communities
The 2011 budget requests an additional $35 million for financial and technical assistance including assistance made through the Intermediary Relending Program of the Rural Development mission area In addition $15 million would be reserved from specified accounts in the Rural Development and Marketing and Regulatory Program mission areas to provide additional support for the initiative Not more than 10 percent of the available funding for any one program would be subject to the reserve Through the initiative funds will be made available from a number of loan grant promotion and other programs to provide financial and technical assistance to support market planning and promotion efforts as well as infrastructure and operational improvements designed to stimulate consumer demand enhance marketing expand demand and retail outlets for farm products and increase availability of locally and regionally produced foods
125
DEPARTMENTAL ACTIVITIES
DEPARTMENTAL MANAGEMENT
Budget Authority (Dollars in Millions)
2009 2010 2011 Program Enacted Estimate Budget
Discretionary Office of Advocacy and Outreachhelliphelliphelliphelliphelliphelliphelliphelliphelliphelliphellip 0 $2 $7 Assistant SecretaryOffice of Civil Rightshelliphelliphelliphelliphelliphelliphelliphellip $22 24 25 Office of the Chief Financial Officerhelliphelliphelliphelliphelliphelliphelliphelliphelliphellip 6 7 7 Office of Budget and Program Analysishelliphelliphelliphelliphelliphelliphelliphelliphellip 9 9 9 Office of the Chief Information Officerhelliphelliphelliphelliphelliphelliphelliphelliphellip 18 62 64 Departmental Administrationhelliphelliphelliphelliphelliphelliphelliphelliphelliphelliphelliphelliphellip 27 28 31 Contracting and Acquisition Workforce Traininghelliphelliphelliphellip 0 0 6 Provincial Reconstruction Teamshelliphelliphelliphelliphelliphelliphelliphelliphelliphelliphellip 0 13 a Office of Homeland Securityhelliphelliphelliphelliphelliphelliphelliphelliphelliphelliphelliphellip 1 2 2 Agriculture Buildings and Facilitieshelliphelliphelliphelliphelliphelliphelliphelliphelliphellip 244 293 278 Hazardous Materials Managementhelliphelliphelliphelliphelliphelliphelliphelliphelliphelliphellip 5 5 5 Total Ongoing Discretionary Programshelliphelliphelliphelliphelliphelliphelliphellip 332 445 434 Recovery Act Agriculture Buildings and Facilitieshelliphelliphelliphelliphelliphelliphelliphelliphelliphellip 24 0 0 Total Discretionary Programshelliphelliphelliphelliphelliphelliphelliphelliphelliphelliphellip 356 445 434 Mandatory Farm Bill Biobased Markets Programhelliphelliphelliphelliphelliphelliphelliphelliphelliphelliphelliphelliphellip 2 2 2 Outreach for Socially Disadvantaged Farmers bhelliphelliphelliphelliphellip 15 20 20 Total Farm Bill Programshelliphelliphelliphelliphelliphelliphelliphelliphelliphelliphelliphelliphelliphellip 17 22 22 Total Departmental Managementhelliphelliphelliphelliphelliphelliphelliphelliphelliphellip $373 $467 $456
a Funded within the Foreign Agricultural Service b This program was administered by the National Institute of Food and Agriculture (NIFA) in 2009 at $15 million and transferred to the Office of Advocacy and Outreach in 2010
Departmental Management (DM) is responsible for providing coordination of all administrative functions and support for policy activities of the Department DM is leading the Departmentrsquos implementation of Management Initiatives to
bull Transform USDA into a model Federal agency for effective program delivery by enhancing leadership encouraging employee inclusion and focusing on improving customer and employee satisfaction
126
DEPARTMENTAL ACTIVITIES
bull Provide civil rights leadership to USDA employees applicants and customers by increasing the use of an early resolution process a form of alternative dispute resolution for civil rights and equal employment opportunity complaints reducing the inventory of program civil rights complaints and analyzing field operations for systemic improvements
bull Coordinate outreach efforts to increase access to USDA programs and services among women and minority farmers
bull Use resources more effectively by incorporating into the Departmentrsquos current management practices new strategies and policies that increase performance and encourage efficiency and alignment of activities to the Departmentrsquos strategic goals
bull Implement modern information technology systems and policies in a cost effective manner that improve program delivery along with internal and external communications capabilities to better serve USDA constituents
bull Maximize USDA ldquogreenrdquo operations by increasing the use of bio-preferred products and alternative energy increasing recycling and decreasing water and energy usage at USDA facilities
bull Improve Departmental emergency preparedness and security measures to protect USDA employees and the public to ensure the continued delivery of USDA products and services
bull Enhance human resources policies and practices to develop a USDA workforce that is more representative of the National population and has the necessary skills to ensure the continued and improved delivery of services by the Department
The 2011 budget proposes funding to maintain the staffing levels necessary to lead implementation of these initiatives and provide adequate service delivery by Departmental Management while addressing key policy issues related to outreach human resources procurement system improvements financial management and information technology security and capital investment These efforts are critical to making the Department an efficient effective and discrimination-free organization that delivers the best return on taxpayersrsquo investments
The Office of Advocacy and Outreach (OAO) was established by the 2008 Farm Bill to increase the accessibility of USDA programs to underserved constituents OAO activities include overseeing the Advisory Committees on Minority Farmers and Beginning Farmers and Ranchers administering the Outreach to Socially Disadvantaged Farmers Grant Program (section 2501 Program) overseeing the activities of the Office of Small Farms Coordination and the Farm Worker Coordinator managing the 1994 1890 and Hispanic Serving Institutions (HSI) Programs and coordinatingconducting other outreach functions The 2011 budget requests $7 million for OAO to carry out these responsibilities and the provisions of the Farm Bill related to outreach to beginning small and socially disadvantaged farmers ranchers and rural communities Of this amount $4 million is requested for agricultural labor grants authorized under section 14204 of the 2008 Farm Bill This program was funded through Rural
127
DEPARTMENTAL ACTIVITIES
Development in 2010 at the same level OAO will operate this program in 2011 to assist agricultural employers and farm workers by improving the supply stability safety and training of the agricultural labor force In addition to the requested funding OAO will receive $20 million provided by the 2008 Farm Bill for the 2501 Grants Program and an estimated $6 million in reimbursements for programs previously managed by the Office of Civil Rights (1890 and 1994 Programs) and the Agricultural Research Service (HSI Program)
The Assistant Secretary for Civil Rights and the Office of Civil Rights (OCR) provide policy guidance leadership coordination and training and complaint prevention and processing for the Department and the agencies OCRrsquos mission is to facilitate the fair and equitable treatment of USDA customers and employees and ensure the delivery and enforcement of civil rights programs and activities Through its efforts OCR strives to 1) foster a positive civil rights climate at USDA 2) process Equal Employment Opportunity (EEO) and program complaints in a timely efficient and cost effective manner 3) reduce and prevent EEO and program complaints through training and guidance and 4) offer alternative dispute resolution services The 2011 budget requests $24 million for OCR to meet the Administrationrsquos commitment to improving USDArsquos handling of civil rights matters An additional $09 million is requested to reflect the transfer of the Office of the Assistant Secretary for Civil Rights to Departmental Management from the Office of the Secretary
The Office of the Chief Financial Officer (OCFO) provides overall direction and leadership in the development of financial management policies and systems and produces the Departmentrsquos consolidated financial statements and Strategic Plan OCFO also oversees the provision of administrative accounting payroll and related systems for USDA and other agencies through operation of the National Finance Center The 2011 budget requests $7 million for OCFO to continue its leadership and oversight of the Departmentrsquos financial management process and implementation of the Federal Funding Accountability and Transparency Act the Improper Payments Information Act and Departmental travel and debarment and suspension policies
The Office of Budget and Program Analysis (OBPA) provides analyses and information to the Secretary and other senior policy officials to support informed decision-making regarding the Departmentrsquos programs and policies and budget legislative and regulatory actions OBPA also serves the key functions of providing information to the Office of Management and Budget and the Appropriations Committees related to the USDA budget and coordinating the Departmentrsquos implementation of the Farm Bill including providing relevant implementation and mandatory spending information to the Authorizing Committees The 2011 budget requests $9 million for OBPA for the continued delivery of analyses and support provided to USDA policy officials
The Office of the Chief Information Officer (OCIO) provides policy guidance leadership and coordination for the Departments information management technology investment and cyber security activities in support of USDA program delivery The 2011 budget requests $64 million for OCIO to fund on-going activities including efforts to improve the Departmentrsquos cyber security posture This request includes an increase of $2 million to expand a Department-wide cyber security initiative to address deficiencies in the USDA network and IT systems Through this initiative OCIO conducts network security assessments to identify system vulnerabilities and operates a Security Operations Center that provides continuous cyber security
128
DEPARTMENTAL ACTIVITIES
monitoring of the Departmentrsquos network Through the continued implementation of the initiative the Department will address critical vulnerabilities while establishing a multi-layer cyber security structure
Departmental Administration (DA) provides overall direction leadership and coordination for the Departmentrsquos management of human resources ethics property procurement facilities management small and disadvantaged business utilization programs and the regulatory hearing and administrative proceedings conducted by the Administrative Law Judges and the Judicial Officer The 2011 budget requests $31 million for DA including a $17 million increase to implement a human resources initiative in USDA that will build the capabilities of the Departmentrsquos workforce through leadership development and veteran hiring In addition the budget requests a decrease in DA of $13 million to reflect the transfer of the agriculture reconstruction and stabilization activities in Afghanistan and Iraq to FAS As these efforts support implementation of Presidential strategies by providing technical experts who serve as advisors to key government ministries and serve on civilian-military command units including Provincial Reconstruction Teams these international activities are best managed through FAS
DA also manages the BioPreferred Program as authorized in section 9002 of the Farm Bill as amended by the 2008 Farm Bill As part of this program DA is developing a USDA Certified Biobased Label that will allow manufacturers and vendors of qualifying biobased products market their products utilizing the label In support of the programrsquos implementation the budget requests $03 million to ensure the integrity and enforce compliance with the USDA Certified Biobased Labeling Program This funding will be used to establish an audit program through which DA can monitor the use of the biobased label in the market to ensure that vendors and manufacturers of biobased products are utilizing the label in accordance with program regulations In addition to the funding request USDA is also seeking legislative authority to assess monetary penalties for violations of the Biobased Labeling regulations to further ensure the programrsquos integrity and public trust in the label
In addition the 2011 budget requests $65 million to support a Government-wide Contracting and Acquisition Workforce Training initiative The requested funding will allow USDA to implement training recruitment and retention activities for the Departmentrsquos procurement workforce that is responsible for over $5 billion in annual procurement for the Department These workforce efforts along with procurement system improvements will allow USDA to achieve substantial cost savings and avoidances in the contracting and acquisition activities across all agencies
The Office of Homeland Security (OHS) provides a central homeland security oversight and assistance capability within USDA OHS is responsible for providing oversight and coordination of the Departmentrsquos preparation and response to matters of homeland security importance In addition OHS is responsible for providing the protective services for the Secretary and Deputy Secretary of Agriculture The 2011 budget requests $2 million for OHS to continue its leadership and coordination of Departmental security matters to ensure that USDA is prepared for potential threats or emergency situations
129
DEPARTMENTAL ACTIVITIES
The request for Agriculture Buildings and Facilities (Ag BampF) and Rental Payments for 2011 is $278 million The account provides funding for the rental payments to the General Services Administration (GSA) and security services payments to the Department of Homeland Security (DHS) This account is also responsible for all maintenance utilities and administration of the more than 25 million square feet in the two USDA headquarters buildings The 2011 budget includes $179 million for payments to GSA for rent and $14 million to DHS for building security The budget requests an increase of $14 million for a total of $28 million in 2011 to continue modernization of the Departmentrsquos South Building As the building houses over 5800 USDA employees it is critical that the facility be renovated to eliminate environmental hazards and to reduce overall energy consumption The renovation project will preserve and restore the historic features of the building replace antiquated heating and cooling systems plumbing and electrical systems eliminate environmental hazards such as asbestos and lead paint provide accommodations for persons with disabilities and create modern and efficient office space The 2011 budget also requests authority to use prior year unobligated balances to pay deficiencies incurred between 2004 and 2008
In addition the budget also proposes an increase of $04 million to implement provisions of the Departmentrsquos Employee Satisfaction and Wellness Program This funding will allow USDA to improve offerings to employees related to healthy eating options and physical fitness USDA employees and the over 100000 annual visitors to the South Building cafeteria would be educated on the importance of farmers and origins of the food being served while employees would benefit from improved fitness equipment and class offerings in the fitness center
The Hazardous Materials Management (HMM) Program provides for the efficient management and cleanup of hazardous materials on facilities and lands under the jurisdiction custody and control of the Department and the prevention of releases of hazardous substances from USDA facilities The 2011 budget requests $5 million for the HMM program to conduct cleanup and remediation activities to seek repayment from polluters for hazardous materials cleanup responsibilities and to assist the Department in meeting Federal environmental laws
130
DEPARTMENTAL ACTIVITIES
DEPARTMENTAL STAFF OFFICES
Budget Authority (Dollars in Millions)
2009 2010 2011 Program Enacted Estimate Budget
Discretionary Office of the Chief Economisthelliphelliphelliphelliphelliphelliphelliphelliphelliphelliphelliphellip $11 $13 $13 National Appeals Divisionhelliphelliphelliphelliphelliphelliphelliphelliphelliphelliphelliphelliphelliphellip 15 15 15 Office of Communicationshelliphelliphelliphelliphelliphelliphelliphelliphelliphelliphelliphelliphelliphellip 10 10 10 Office of the General Counselhelliphelliphelliphelliphelliphelliphelliphelliphelliphelliphelliphellip 42 44 46 Total Discretionary Programshelliphelliphelliphelliphelliphelliphelliphelliphelliphelliphellip 78 82 84 Mandatory Farm Bill Biodiesel Fuel Education Programhelliphelliphelliphelliphelliphelliphelliphelliphelliphellip 1 1 1
Total Mandatory Programshelliphelliphelliphelliphelliphelliphelliphelliphelliphelliphelliphellip 1 1 1
Total Departmental Staff Officeshelliphelliphelliphelliphelliphelliphelliphelliphelliphellip $79 $83 $85
The Departmental Staff Offices provide legal and economic support and communications coordination for the Departmentrsquos program activities These offices are vital to USDArsquos success in creating opportunities for Americarsquos farmers ranchers and rural communities by providing economic analyses and legal counsel to the Departmentrsquos policy officials and decision makers The 2011 budget proposes funding to ensure that these offices maintain the staffing levels needed to provide leadership oversight and coordination
The Office of the Chief Economist (OCE) advises the Secretary and Department officials on the economic implications of Department policies programs and proposed legislation and serves as the focal point for the Departmentrsquos economic intelligence analysis and review related to domestic and international food and agriculture markets OCE also provides advice and analysis on bioenergy new uses of agricultural products sustainable development agricultural labor and global climate change The 2011 budget requests $13 million for OCE to continue its support of USDA policy officials and the dissemination of agricultural economic information
The National Appeals Division (NAD) conducts evidentiary administrative appeal hearings and reviews arising from program operations of the Rural Development mission area the Farm Service Agency the Risk Management Agency and the Natural Resources Conservation Service The 2011 budget requests $15 million for NAD to continue activities to increase the fairness of program delivery by the Service Center Agencies
The Departmentrsquos Office of Communications (OC) provides leadership and coordination for the development of communication strategies for the Department and plays a critical role in disseminating information about USDArsquos programs to the general public The 2011 budget
131
DEPARTMENTAL ACTIVITIES
requests $10 million for OC to continue to develop effective communications strategies that make USDA programs and operations more open and transparent to the public
The Office of the General Counsel (OGC) provides legal oversight counsel and support to the Departmentrsquos agencies The 2011 budget requests $46 million for OGC including an increase of $15 million to ensure that OGC has the resources to conduct necessary training and travel and other activities for which funding has been reduced in recent years to cover salary expenses This funding will be used to maintain and improve OGC service delivery to the entire Department
132
OFFICE OF INSPECTOR GENERAL
OFFICE OF INSPECTOR GENERAL
Budget Authority (Dollars in Millions)
2009 2010 2011 Program Enacted Estimate Budget
Discretionary Ongoing Appropriationshelliphelliphelliphelliphelliphelliphelliphelliphelliphelliphelliphelliphelliphelliphellip $86 $89 $90 Recovery Act Fundinghelliphelliphelliphelliphelliphelliphelliphelliphelliphelliphelliphelliphelliphelliphellip 22 0 0 Total Office of Inspector Generalhelliphelliphelliphelliphelliphelliphelliphelliphelliphellip $108 $89 $90
The Office of Inspector General (OIG) conducts and supervises audits to prevent and detect fraud waste and abuse and to improve the effectiveness of USDA programs and operations As the law enforcement arm of USDA OIG also investigates criminal activity involving the Departmentrsquos programs and personnel The 2011 budget requests $90 million for OIG for audit and investigation review of the Departmentrsquos programs This funding includes an increase of $04 million to support the Council of Inspectors General for Integrity and Efficiency to coordinate Federal efforts to improve program delivery The Council was established under the authority of the Inspector General Reform Act of 2008 In addition an increase of $02 million is requested for training activities to ensure that OIG effectively meets professional training standards and necessary federal law enforcement requirements
133
APPENDIX
UNITED STATES DEPARTMENT OF AGRICULTURE (Dollars in Millions)
Budget Authority
Change 2009 2010 2011 2010 to
AGENCYPROGRAM Enacted Estimate Budget 2011 FARM AND FOREIGN AGRICULTURAL SERVICES Farm Service Agency Discretionary Programshelliphelliphelliphelliphelliphelliphelliphelliphelliphelliphelliphelliphelliphelliphelliphelliphelliphelliphelliphelliphelliphellip $1645 $2082 $1846 -$236 Mandatory Programs (excluding CCC)helliphelliphelliphelliphelliphelliphelliphelliphelliphelliphelliphelliphelliphelliphelliphellip 704 527 892 365
Recovery Acthelliphelliphelliphelliphelliphelliphelliphelliphelliphelliphelliphelliphelliphelliphelliphelliphelliphelliphelliphelliphelliphelliphelliphelliphelliphellip 120 230 0 -230 Other Supplementalshelliphelliphelliphelliphelliphelliphelliphelliphelliphelliphelliphelliphelliphelliphelliphelliphelliphelliphelliphelliphelliphelliphellip 71 0 0 0 Commodity Credit Corporation Programs (mandatory)helliphelliphelliphelliphelliphelliphelliphelliphelliphellip 13061 11819 11482 -337 Total Farm Service Agencyhelliphelliphelliphelliphelliphelliphelliphelliphelliphelliphelliphelliphelliphelliphelliphelliphelliphelliphelliphellip 15601 14658 14220 -438
Risk Management Agency Discretionary Programshelliphelliphelliphelliphelliphelliphelliphelliphelliphelliphelliphelliphelliphelliphelliphelliphelliphelliphelliphelliphelliphellip 77 80 83 3 Mandatory Programshelliphelliphelliphelliphelliphelliphelliphelliphelliphelliphelliphelliphelliphelliphelliphelliphelliphelliphelliphelliphelliphelliphellip 6767 6455 7613 1158 Total Risk Management Agencyhelliphelliphelliphelliphelliphelliphelliphelliphelliphelliphelliphelliphelliphelliphelliphelliphelliphellip 6844 6535 7696 1161
Foreign Agricultural Service Discretionary Programs (excluding PL 480)helliphelliphelliphelliphelliphelliphelliphelliphelliphelliphelliphelliphelliphellip 265 390 468 78 Mandatory Programshelliphelliphelliphelliphelliphelliphelliphelliphelliphelliphelliphelliphelliphelliphelliphelliphelliphelliphelliphelliphelliphelliphellip 584 439 386 -53 Recovery Acthelliphelliphelliphelliphelliphelliphelliphelliphelliphelliphelliphelliphelliphelliphelliphelliphelliphelliphelliphelliphelliphelliphelliphelliphelliphellip 25 90 22 -68 PL 480 (discretionary)helliphelliphelliphelliphelliphelliphelliphelliphelliphelliphelliphelliphelliphelliphelliphelliphelliphelliphelliphelliphelliphellip 1229 1693 1693 0 PL 480 (supplemental appropriations)helliphelliphelliphelliphelliphelliphelliphelliphelliphelliphelliphelliphelliphelliphelliphellip 1095 0 0 0
Total Foreign Agricultural Servicehelliphelliphelliphelliphelliphelliphelliphelliphelliphelliphelliphelliphelliphelliphelliphelliphellip 3198 2612 2569 -43 Total Farm and Foreign Agricultural Serviceshelliphelliphelliphelliphelliphelliphelliphelliphelliphelliphellip 25644 23805 24485 681
RURAL DEVELOPMENT Rural Utilities Service Discretionary Programshelliphelliphelliphelliphelliphelliphelliphelliphelliphelliphelliphelliphelliphelliphelliphelliphelliphelliphelliphelliphelliphellip 660 694 643 -51 Recovery Acthelliphelliphelliphelliphelliphelliphelliphelliphelliphelliphelliphelliphelliphelliphelliphelliphelliphelliphelliphelliphelliphelliphelliphelliphelliphellip 3804 0 0 0 Total Rural Utilities Servicehelliphelliphelliphelliphelliphelliphelliphelliphelliphelliphelliphelliphelliphelliphelliphelliphelliphelliphelliphellip 4464 694 643 -51
Rural Housing Service Discretionary Programshelliphelliphelliphelliphelliphelliphelliphelliphelliphelliphelliphelliphelliphelliphelliphelliphelliphelliphelliphelliphelliphellip 1754 1893 1705 -188 Recovery Acthelliphelliphelliphelliphelliphelliphelliphelliphelliphelliphelliphelliphelliphelliphelliphelliphelliphelliphelliphelliphelliphelliphelliphelliphelliphellip 320 0 0 0 Total Rural Housing Servicehelliphelliphelliphelliphelliphelliphelliphelliphelliphelliphelliphelliphelliphelliphelliphelliphelliphelliphellip 2074 1893 1705 -188
Rural Business - Cooperative Service Discretionary Programshelliphelliphelliphelliphelliphelliphelliphelliphelliphelliphelliphelliphelliphelliphelliphelliphelliphelliphelliphelliphelliphellip 132 190 205 15 Mandatory Programshelliphelliphelliphelliphelliphelliphelliphelliphelliphelliphelliphelliphelliphelliphelliphelliphelliphelliphelliphelliphelliphelliphellip 239 364 159 -205 Recovery Acthelliphelliphelliphelliphelliphelliphelliphelliphelliphelliphelliphelliphelliphelliphelliphelliphelliphelliphelliphelliphelliphelliphelliphelliphelliphellip 145 0 0 0 Total Rural Business - Cooperative Servicehelliphelliphelliphelliphelliphelliphelliphelliphelliphelliphelliphelliphellip 516 554 364 -190
Rural Development Salaries and Expenses Discretionary Programshelliphelliphelliphelliphelliphelliphelliphelliphelliphelliphelliphelliphelliphelliphelliphelliphelliphelliphelliphelliphelliphellip 193 202 232 30 Recovery Acthelliphelliphelliphelliphelliphelliphelliphelliphelliphelliphelliphelliphelliphelliphelliphelliphelliphelliphelliphelliphelliphelliphelliphelliphelliphellip 131 0 0 0 Total Salaries and Expenseshelliphelliphelliphelliphelliphelliphelliphelliphelliphelliphelliphelliphelliphelliphelliphelliphelliphelliphellip 324 202 232 30
Total Rural Developmenthelliphelliphelliphelliphelliphelliphelliphelliphelliphelliphelliphelliphelliphelliphelliphelliphelliphelliphellip 7378 3343 2944 -399 FOOD NUTRITION AND CONSUMER SERVICES Food and Nutrition Service Discretionary Programshelliphelliphelliphelliphelliphelliphelliphelliphelliphelliphelliphelliphelliphelliphelliphelliphelliphelliphelliphelliphelliphellip 7239 7659 8025 366 Mandatory Programshelliphelliphelliphelliphelliphelliphelliphelliphelliphelliphelliphelliphelliphelliphelliphelliphelliphelliphelliphelliphelliphelliphellip 69065 75335 87656 12321 Recovery Acthelliphelliphelliphelliphelliphelliphelliphelliphelliphelliphelliphelliphelliphelliphelliphelliphelliphelliphelliphelliphelliphelliphelliphelliphelliphellip 5945 10460 11936 1476 Other Supplementalshelliphelliphelliphelliphelliphelliphelliphelliphelliphelliphelliphelliphelliphelliphelliphelliphelliphelliphelliphelliphelliphelliphellip 0 400 0 -400
Total Food Nutrition and Consumer Serviceshelliphelliphelliphelliphelliphelliphelliphelliphelliphelliphellip 82249 93854 107617 13763 FOOD SAFETY Food Safety and Inspection Service Discretionary Programshelliphelliphelliphelliphelliphelliphelliphelliphelliphelliphelliphelliphelliphelliphelliphelliphelliphelliphelliphelliphelliphellip 972 1019 1037 18 Mandatory Programshelliphelliphelliphelliphelliphelliphelliphelliphelliphelliphelliphelliphelliphelliphelliphelliphelliphelliphelliphelliphelliphelliphellip 11 9 9 0
Total Food Safetyhelliphelliphelliphelliphelliphelliphelliphelliphelliphelliphelliphelliphelliphelliphelliphelliphelliphelliphelliphelliphelliphellip 983 1028 1046 18 NATURAL RESOURCES AND ENVIRONMENT Natural Resources Conservation Service Discretionary Programshelliphelliphelliphelliphelliphelliphelliphelliphelliphelliphelliphelliphelliphelliphelliphelliphelliphelliphelliphelliphelliphellip 968 1009 964 -45 Mandatory Programshelliphelliphelliphelliphelliphelliphelliphelliphelliphelliphelliphelliphelliphelliphelliphelliphelliphelliphelliphelliphelliphelliphellip 2163 2973 3029 56 Recovery Acthelliphelliphelliphelliphelliphelliphelliphelliphelliphelliphelliphelliphelliphelliphelliphelliphelliphelliphelliphelliphelliphelliphelliphelliphelliphellip 340 0 0 0 Total Natural Resources Conservation Servicehelliphelliphelliphelliphelliphelliphelliphelliphelliphelliphelliphellip 3471 3982 3993 11
134
APPENDIX
UNITED STATES DEPARTMENT OF AGRICULTURE (Dollars in Millions)
Budget Authority Change
2009 2010 2011 2010 to AGENCYPROGRAM Enacted Estimate Budget 2011
Forest Service Discretionary Programshelliphelliphelliphelliphelliphelliphelliphelliphelliphelliphelliphelliphelliphelliphelliphelliphelliphelliphelliphelliphelliphellip 4759 5315 5377 62 Mandatory Programshelliphelliphelliphelliphelliphelliphelliphelliphelliphelliphelliphelliphelliphelliphelliphelliphelliphelliphelliphelliphelliphelliphellip 994 836 768 -68 Recovery Acthelliphelliphelliphelliphelliphelliphelliphelliphelliphelliphelliphelliphelliphelliphelliphelliphelliphelliphelliphelliphelliphelliphelliphelliphelliphellip 1150 0 0 0 Other Supplementalshelliphelliphelliphelliphelliphelliphelliphelliphelliphelliphelliphelliphelliphelliphelliphelliphelliphelliphelliphelliphelliphelliphellip 200 0 0 0 Total Forest Servicehelliphelliphelliphelliphelliphelliphelliphelliphelliphelliphelliphelliphelliphelliphelliphelliphelliphelliphelliphelliphelliphelliphellip 7103 6151 6145 -6
Total Natural Resources and Environmenthelliphelliphelliphelliphelliphelliphelliphelliphelliphelliphelliphellip 10574 10133 10138 5 MARKETING AND REGULATORY PROGRAMS Animal and Plant Health Inspection Service Discretionary Programshelliphelliphelliphelliphelliphelliphelliphelliphelliphelliphelliphelliphelliphelliphelliphelliphelliphelliphelliphelliphelliphellip 881 910 875 -35 Mandatory Programshelliphelliphelliphelliphelliphelliphelliphelliphelliphelliphelliphelliphelliphelliphelliphelliphelliphelliphelliphelliphelliphelliphellip 181 250 259 9 Emergency Funding (CCC)helliphelliphelliphelliphelliphelliphelliphelliphelliphelliphelliphelliphelliphelliphelliphelliphelliphelliphelliphelliphellip 29 28 0 -28 Total Animal and Plant Health Inspection Servicehelliphelliphelliphelliphelliphelliphelliphelliphelliphelliphellip 1091 1188 1134 -54 Agricultural Marketing Service Discretionary Programshelliphelliphelliphelliphelliphelliphelliphelliphelliphelliphelliphelliphelliphelliphelliphelliphelliphelliphelliphelliphelliphellip 89 93 100 7 Mandatory Programshelliphelliphelliphelliphelliphelliphelliphelliphelliphelliphelliphelliphelliphelliphelliphelliphelliphelliphelliphelliphelliphelliphellip 1223 1305 1235 -70 Total Agricultural Marketing Servicehelliphelliphelliphelliphelliphelliphelliphelliphelliphelliphelliphelliphelliphelliphelliphellip 1312 1398 1335 -63 Grain Inspection Packers and Stockyards Administration Discretionary Programshelliphelliphelliphelliphelliphelliphelliphelliphelliphelliphelliphelliphelliphelliphelliphelliphelliphelliphelliphelliphelliphellip 40 42 44 2
Total Marketing and Regulatory Programshelliphelliphelliphelliphelliphelliphelliphelliphelliphelliphelliphellip 2443 2628 2513 -115 RESEARCH EDUCATION AND ECONOMICS Agricultural Research Service Discretionary Programshelliphelliphelliphelliphelliphelliphelliphelliphelliphelliphelliphelliphelliphelliphelliphelliphelliphelliphelliphelliphelliphellip 1190 1251 1200 -51 Mandatory Programshelliphelliphelliphelliphelliphelliphelliphelliphelliphelliphelliphelliphelliphelliphelliphelliphelliphelliphelliphelliphelliphelliphellip 24 24 24 0 Recovery Acthelliphelliphelliphelliphelliphelliphelliphelliphelliphelliphelliphelliphelliphelliphelliphelliphelliphelliphelliphelliphelliphelliphelliphelliphelliphellip 176 0 0 0 Total Agricultural Research Servicehelliphelliphelliphelliphelliphelliphelliphelliphelliphelliphelliphelliphelliphelliphelliphellip 1390 1275 1224 -51 National Institute of Food and Agriculture Discretionary Programshelliphelliphelliphelliphelliphelliphelliphelliphelliphelliphelliphelliphelliphelliphelliphelliphelliphelliphelliphelliphelliphellip 1226 1351 1347 -5 Mandatory Programshelliphelliphelliphelliphelliphelliphelliphelliphelliphelliphelliphelliphelliphelliphelliphelliphelliphelliphelliphelliphelliphelliphellip 124 135 147 12 Total National Institute of Food and Agriculturehelliphelliphelliphelliphelliphelliphelliphelliphelliphelliphelliphellip 1350 1486 1494 7 Economic Research Service Discretionary Programshelliphelliphelliphelliphelliphelliphelliphelliphelliphelliphelliphelliphelliphelliphelliphelliphelliphelliphelliphelliphelliphellip 80 82 87 5 National Agricultural Statistics Service Discretionary Programshelliphelliphelliphelliphelliphelliphelliphelliphelliphelliphelliphelliphelliphelliphelliphelliphelliphelliphelliphelliphelliphellip 152 162 165 3
Total Research Education and Economicshelliphelliphelliphelliphelliphelliphelliphelliphelliphelliphelliphellip 2972 3005 2970 -36 OTHER ACTIVITIES Departmental Activities Discretionary Programshelliphelliphelliphelliphelliphelliphelliphelliphelliphelliphelliphelliphelliphelliphelliphelliphelliphelliphelliphelliphelliphellip 425 546 573 27 Mandatory Programshelliphelliphelliphelliphelliphelliphelliphelliphelliphelliphelliphelliphelliphelliphelliphelliphelliphelliphelliphelliphelliphelliphellip 19 24 24 0 Recovery Acthelliphelliphelliphelliphelliphelliphelliphelliphelliphelliphelliphelliphelliphelliphelliphelliphelliphelliphelliphelliphelliphelliphelliphelliphelliphellip 24 0 0 0 Total Departmental Activitieshelliphelliphelliphelliphelliphelliphelliphelliphelliphelliphelliphelliphelliphelliphelliphelliphelliphelliphellip 468 570 597 27 Office of Inspector General Discretionary Programshelliphelliphelliphelliphelliphelliphelliphelliphelliphelliphelliphelliphelliphelliphelliphelliphelliphelliphelliphelliphelliphellip 86 89 90 1 Recovery Acthelliphelliphelliphelliphelliphelliphelliphelliphelliphelliphelliphelliphelliphelliphelliphelliphelliphelliphelliphelliphelliphelliphelliphelliphelliphellip 22 0 0 0 Total Office of Inspector Generalhelliphelliphelliphelliphelliphelliphelliphelliphelliphelliphelliphelliphelliphelliphelliphelliphellip 108 89 90 1
Total Departmental Activitieshelliphelliphelliphelliphelliphelliphelliphelliphelliphelliphelliphelliphelliphelliphelliphelliphellip 576 659 687 28
USDA SUB-TOTALhelliphelliphelliphelliphelliphelliphelliphelliphelliphelliphelliphelliphelliphelliphelliphelliphelliphelliphelliphelliphelliphellip $132819 $138455 $152400 $13945 Offsetting Receiptshelliphelliphelliphelliphelliphelliphelliphelliphelliphelliphelliphelliphelliphelliphelliphelliphelliphelliphelliphelliphelliphelliphelliphellip -4993 -2936 -3795 -859 USDA TOTALhelliphelliphelliphelliphelliphelliphelliphelliphelliphelliphelliphelliphelliphelliphelliphelliphelliphelliphelliphelliphelliphelliphelliphelliphelliphellip $127826 $135519 $148605 $13086
135
APPENDIX
UNITED STATES DEPARTMENT OF AGRICULTURE (Dollars in Millions)
Program Level
Change 2009 2010 2011 2010 to
AGENCYPROGRAM Enacted Estimate Budget 2011
FARM AND FOREIGN AGRICULTURAL SERVICES Farm Service Agency Farm Loan and Grant Programshelliphelliphelliphelliphelliphelliphelliphelliphelliphelliphelliphelliphelliphelliphellip $4551 $5140 $4797 -$343 Conservation and Other Programshelliphelliphelliphelliphelliphelliphelliphelliphelliphelliphelliphelliphelliphellip 2282 2359 2154 -205 Disaster Assistancehelliphelliphelliphelliphelliphelliphelliphelliphelliphelliphelliphelliphelliphelliphelliphelliphelliphelliphelliphellip 703 526 891 365 Commodity Programshelliphelliphelliphelliphelliphelliphelliphelliphelliphelliphelliphelliphelliphelliphelliphelliphelliphelliphellip 17679 18458 18315 -143 Commodity Credit Corporation Programshelliphelliphelliphelliphelliphelliphelliphelliphelliphelliphellip (25453) (26437) (26255) (-182) Salaries and Expenseshelliphelliphelliphelliphelliphelliphelliphelliphelliphelliphelliphelliphelliphelliphelliphelliphelliphelliphellip 1483 1570 1686 116 Total Farm Service Agencyhelliphelliphelliphelliphelliphelliphelliphelliphelliphelliphelliphelliphelliphelliphelliphellip 26699 28053 27843 -211
Risk Management Agency Administrative and Operating Expenseshelliphelliphelliphelliphelliphelliphelliphelliphelliphelliphelliphellip 77 80 83 3 Crop Insurance Fundhelliphelliphelliphelliphelliphelliphelliphelliphelliphelliphelliphelliphelliphelliphelliphelliphelliphelliphellip 7998 9556 11373 1817 Total Risk Management Agencyhelliphelliphelliphelliphelliphelliphelliphelliphelliphelliphelliphelliphelliphellip 8075 9636 11456 1820
Foreign Agricultural Service Export Credit Guaranteeshelliphelliphelliphelliphelliphelliphelliphelliphelliphelliphelliphelliphelliphelliphelliphelliphellip 5357 5500 5500 0 Market Development Programshelliphelliphelliphelliphelliphelliphelliphelliphelliphelliphelliphelliphelliphelliphellip 251 252 213 -39 Dairy Export Incentive Programhelliphelliphelliphelliphelliphelliphelliphelliphelliphelliphelliphelliphelliphelliphellip 19 10 0 -10 Foreign Food Assistancehelliphelliphelliphelliphelliphelliphelliphelliphelliphelliphelliphelliphelliphelliphelliphelliphellip 312 175 171 -4 Trade Adjustment Assistance for Farmershelliphelliphelliphelliphelliphelliphelliphelliphelliphelliphellip 25 90 22 -68 Salaries and Expenseshelliphelliphelliphelliphelliphelliphelliphelliphelliphelliphelliphelliphelliphelliphelliphelliphelliphelliphellip 311 527 398 -129 Total Foreign Agricultural Servicehelliphelliphelliphelliphelliphelliphelliphelliphelliphelliphelliphelliphelliphellip 6275 6554 6304 -250
Total Farm and Foreign Agricultural Serviceshelliphelliphelliphelliphelliphelliphelliphelliphellip 41049 44243 45603 1359
RURAL DEVELOPMENT Rural Utilities Service Loans and Grantshelliphelliphelliphelliphelliphelliphelliphelliphelliphelliphelliphelliphelliphelliphelliphelliphelliphelliphelliphellip 21722 9875 6833 -3042
Rural Housing Service Loans and Grantshelliphelliphelliphelliphelliphelliphelliphelliphelliphelliphelliphelliphelliphelliphelliphelliphelliphelliphelliphellip 22568 15525 15563 38
Rural Business - Cooperative Service Loans and Grantshelliphelliphelliphelliphelliphelliphelliphelliphelliphelliphelliphelliphelliphelliphelliphelliphelliphelliphelliphellip 3406 2328 1431 -897
Salaries and Expenseshelliphelliphelliphelliphelliphelliphelliphelliphelliphelliphelliphelliphelliphelliphelliphelliphelliphellip 324 202 232 30 Total Rural Developmenthelliphelliphelliphelliphelliphelliphelliphelliphelliphelliphelliphelliphelliphelliphelliphellip 48020 27930 24059 -3871
FOOD NUTRITION AND CONSUMER SERVICES Food and Nutrition Service Supplemental Nutrition Assistance Programhelliphelliphelliphelliphelliphelliphelliphelliphelliphelliphellip 51442 60413 63211 2798 Child Nutrition Programshelliphelliphelliphelliphelliphelliphelliphelliphelliphelliphelliphelliphelliphelliphelliphelliphelliphellip 15406 17299 18403 1104 Women Infants and Children (WIC)helliphelliphelliphelliphelliphelliphelliphelliphelliphelliphelliphelliphellip 6956 7746 8058 312 All Otherhelliphelliphelliphelliphelliphelliphelliphelliphelliphelliphelliphelliphelliphelliphelliphelliphelliphelliphelliphelliphelliphelliphelliphellip 408 423 442 19
Total Food Nutrition and Consumer Serviceshelliphelliphelliphelliphelliphelliphelliphellip 74212 85881 90114 4233
FOOD SAFETY Food Safety and Inspection Servicehelliphelliphelliphelliphelliphelliphelliphelliphelliphelliphelliphelliphellip 983 1028 1046 18
136
APPENDIX
UNITED STATES DEPARTMENT OF AGRICULTURE (Dollars in Millions)
Program Level Change
2009 2010 2011 2010 to AGENCYPROGRAM Enacted Estimate Budget 2011
NATURAL RESOURCES AND ENVIRONMENT Natural Resources Conservation Service Conservation Operationshelliphelliphelliphelliphelliphelliphelliphelliphelliphelliphelliphelliphelliphelliphelliphelliphellip 853 888 924 36 Watershed Programshelliphelliphelliphelliphelliphelliphelliphelliphelliphelliphelliphelliphelliphelliphelliphelliphelliphelliphellip 404 70 40 -30 Resource Conservation and Developmenthelliphelliphelliphelliphelliphelliphelliphelliphelliphellip 51 51 0 -51 Farm Security and Rural Investment Programshelliphelliphelliphelliphelliphelliphelliphellip 2163 2973 3029 56
Total Natural Resources Conservation Servicehelliphelliphelliphelliphelliphelliphelliphellip 3471 3982 3993 11
Forest Service National Forest Systemhelliphelliphelliphelliphelliphelliphelliphelliphelliphelliphelliphelliphelliphelliphelliphelliphelliphellip 1510 1551 1586 35 Forest and Rangeland Researchhelliphelliphelliphelliphelliphelliphelliphelliphelliphelliphelliphelliphelliphellip 296 312 304 -8 State and Private Forestryhelliphelliphelliphelliphelliphelliphelliphelliphelliphelliphelliphelliphelliphelliphelliphelliphellip 266 308 322 14 Wildland Fire Activitieshelliphelliphelliphelliphelliphelliphelliphelliphelliphelliphelliphelliphelliphelliphelliphelliphellip 2832 2517 2645 128 Capital Improvement and Maintenancehelliphelliphelliphelliphelliphelliphelliphelliphelliphelliphellip 1145 556 438 -118 Land Acquisitionhelliphelliphelliphelliphelliphelliphelliphelliphelliphelliphelliphelliphelliphelliphelliphelliphelliphelliphelliphellip 51 65 75 10 All Otherhelliphelliphelliphelliphelliphelliphelliphelliphelliphelliphelliphelliphelliphelliphelliphelliphelliphelliphelliphelliphelliphelliphellip 9 6 6 0
Total Discretionary Accountshelliphelliphelliphelliphelliphelliphelliphelliphelliphelliphelliphelliphelliphellip 6109 5315 5377 62 Mandatoryhelliphelliphelliphelliphelliphelliphelliphelliphelliphelliphelliphelliphelliphelliphelliphelliphelliphelliphelliphelliphelliphelliphellip 994 836 768 -68
Total Forest Servicehelliphelliphelliphelliphelliphelliphelliphelliphelliphelliphelliphelliphelliphelliphelliphelliphelliphellip 7103 6151 6145 -6 Total Natural Resources and Environmenthelliphelliphelliphelliphelliphelliphelliphelliphellip 10574 10133 10138 5
MARKETING AND REGULATORY PROGRAMS Animal and Plant Health Inspection Service Salaries and Expenseshelliphelliphelliphelliphelliphelliphelliphelliphelliphelliphelliphelliphelliphelliphelliphelliphelliphellip 877 905 870 -35 Emergency Fundinghelliphelliphelliphelliphelliphelliphelliphelliphelliphelliphelliphelliphelliphelliphelliphelliphelliphelliphellip 29 28 0 -28 Mandatoryhelliphelliphelliphelliphelliphelliphelliphelliphelliphelliphelliphelliphelliphelliphelliphelliphelliphelliphelliphelliphelliphelliphellip 181 250 259 9 Buildings and Facilitieshelliphelliphelliphelliphelliphelliphelliphelliphelliphelliphelliphelliphelliphelliphelliphelliphellip 5 5 5 0
Total Animal and Plant Health Inspection Servicehelliphelliphelliphelliphelliphellip 1092 1188 1134 -54 Agricultural Marketing Servicehelliphelliphelliphelliphelliphelliphelliphelliphelliphelliphelliphelliphelliphellip 300 300 320 20 Section 32 Fundshelliphelliphelliphelliphelliphelliphelliphelliphelliphelliphelliphelliphelliphelliphelliphelliphelliphelliphelliphellip 1012 1098 1015 -83 Grain Inspection Packers and Stockyards
Administrationhelliphelliphelliphelliphelliphelliphelliphelliphelliphelliphelliphelliphelliphelliphelliphelliphelliphelliphelliphellip 40 42 44 2 Total Marketing and Regulatory Programshelliphelliphelliphelliphelliphelliphelliphellip 2444 2628 2513 -115
RESEARCH EDUCATION AND ECONOMICS Agricultural Research Servicehelliphelliphelliphelliphelliphelliphelliphelliphelliphelliphelliphelliphelliphelliphellip 1390 1275 1224 -51 National Institute of Food and Agriculturehelliphelliphelliphelliphelliphelliphelliphelliphellip 1350 1486 1494 7 Economic Research Servicehelliphelliphelliphelliphelliphelliphelliphelliphelliphelliphelliphelliphelliphelliphelliphellip 80 82 87 5 National Agricultural Statistics Servicehelliphelliphelliphelliphelliphelliphelliphelliphelliphelliphellip 152 162 165 3
Total Research Education and Economicshelliphelliphelliphelliphelliphelliphelliphellip 2972 3005 2970 -36
OTHER ACTIVITIES
Office of the Secretaryhelliphelliphelliphelliphelliphelliphelliphelliphelliphelliphelliphelliphelliphelliphelliphelliphelliphellip 16 19 56 37 Departmental Managementhelliphelliphelliphelliphelliphelliphelliphelliphelliphelliphelliphelliphelliphelliphelliphellip 371 467 456 -11 Departmental Staff Officeshelliphelliphelliphelliphelliphelliphelliphelliphelliphelliphelliphelliphelliphelliphelliphelliphellip 80 84 86 2 Office of Inspector Generalhelliphelliphelliphelliphelliphelliphelliphelliphelliphelliphelliphelliphelliphelliphelliphellip 108 89 90 1
Total Other Activitieshelliphelliphelliphelliphelliphelliphelliphelliphelliphelliphelliphelliphelliphelliphelliphelliphellip 575 659 688 29 USDA Sub-Totalhelliphelliphelliphelliphelliphelliphelliphelliphelliphelliphelliphelliphelliphelliphelliphelliphelliphelliphelliphellip $180829 $175507 $177131 $1623
Receipts and Loan Repayments and Other Adjustmentshelliphelliphelliphelliphellip -4993 -2936 -3795 -859
USDA TOTALhelliphelliphelliphelliphelliphelliphelliphelliphelliphelliphelliphelliphelliphelliphelliphelliphelliphelliphelliphelliphellip $175836 $172571 $173336 $764
137
APPENDIX
UNITED STATES DEPARTMENT OF AGRICULTURE
Outlays
(Dollars in Millions)
2009 2010 2011 AGENCY Actual Estimate Budget
FARM AND FOREIGN AGRICULTURAL SERVICES Farm Service Agencyhelliphelliphelliphelliphelliphelliphelliphelliphelliphelliphelliphelliphelliphelliphelliphelliphelliphelliphellip $1890 $4657 $3169 Commodity Credit Corporation Programshelliphelliphelliphelliphelliphelliphelliphelliphelliphelliphellip 11443 11927 11435 Risk Management Agencyhelliphelliphelliphelliphelliphelliphelliphelliphelliphelliphelliphelliphelliphelliphelliphelliphellip 7962 7033 7637 Foreign Agricultural Servicehelliphelliphelliphelliphelliphelliphelliphelliphelliphelliphelliphelliphelliphelliphelliphelliphellip 321 419 496 PL 480helliphelliphelliphelliphelliphelliphelliphelliphelliphelliphelliphelliphelliphelliphelliphelliphelliphelliphelliphelliphelliphelliphelliphelliphellip 1601 1185 1537
RURAL DEVELOPMENT Salaries and Expenseshelliphelliphelliphelliphelliphelliphelliphelliphelliphelliphelliphelliphelliphelliphelliphelliphelliphelliphellip 38 297 238 Rural Utilities Servicehelliphelliphelliphelliphelliphelliphelliphelliphelliphelliphelliphelliphelliphelliphelliphelliphelliphelliphellip 29 613 598 Rural Housing Servicehelliphelliphelliphelliphelliphelliphelliphelliphelliphelliphelliphelliphelliphelliphelliphelliphelliphelliphellip 1519 1928 1335 Rural Business - Cooperative Servicehelliphelliphelliphelliphelliphelliphelliphelliphelliphelliphelliphelliphellip 133 285 387 Rural Empowerment ZonesEnterprise Communitieshelliphelliphelliphelliphelliphelliphellip 16 10 3
FOOD NUTRITION AND CONSUMER SERVICES Food and Nutrition Servicehelliphelliphelliphelliphelliphelliphelliphelliphelliphelliphelliphelliphelliphelliphelliphelliphellip 77848 97945 102410
NATURAL RESOURCES AND ENVIRONMENT Natural Resources Conservation Servicehelliphelliphelliphelliphelliphelliphelliphelliphelliphelliphelliphellip 2725 3525 3722 Forest Servicehelliphelliphelliphelliphelliphelliphelliphelliphelliphelliphelliphelliphelliphelliphelliphelliphelliphelliphelliphelliphelliphellip 5945 6881 6079
FOOD SAFETY Food Safety and Inspection Servicehelliphelliphelliphelliphelliphelliphelliphelliphelliphelliphelliphelliphelliphellip 963 1004 1031
RESEARCH EDUCATION AND ECONOMICS Agricultural Research Servicehelliphelliphelliphelliphelliphelliphelliphelliphelliphelliphelliphelliphelliphelliphelliphellip 1200 1272 1251 National Institute of Food and Agriculturehelliphelliphelliphelliphelliphelliphelliphelliphelliphelliphellip 1182 1483 1624 Economic Research Servicehelliphelliphelliphelliphelliphelliphelliphelliphelliphelliphelliphelliphelliphelliphelliphelliphellip 80 81 87 National Agricultural Statistics Servicehelliphelliphelliphelliphelliphelliphelliphelliphelliphelliphelliphellip 145 162 165
MARKETING AND REGULATORY PROGRAMS Animal and Plant Health Inspection Servicehelliphelliphelliphelliphelliphelliphelliphelliphelliphellip 1183 1328 1267 Agricultural Marketing Servicehelliphelliphelliphelliphelliphelliphelliphelliphelliphelliphelliphelliphelliphelliphellip 259 281 307
Section 32 Fundshelliphelliphelliphelliphelliphelliphelliphelliphelliphelliphelliphelliphelliphelliphelliphelliphelliphelliphelliphelliphellip 948 1098 1015 Grain Inspection Packers and Stockyards Administrationhelliphelliphelliphelliphellip 41 40 14
DEPARTMENTAL ACTIVITIES Office of the Secretaryhelliphelliphelliphelliphelliphelliphelliphelliphelliphelliphelliphelliphelliphelliphelliphelliphelliphelliphellip 11 19 43 Common Computing Environmenthelliphelliphelliphelliphelliphelliphelliphelliphelliphelliphelliphelliphelliphellip 6 16 0 Departmental Administrationhelliphelliphelliphelliphelliphelliphelliphelliphelliphelliphelliphelliphelliphelliphelliphellip 79 170 173 Agriculture Buildings and Facilitieshelliphelliphelliphelliphelliphelliphelliphelliphelliphelliphelliphelliphelliphellip 236 314 281 Hazardous Waste Managementhelliphelliphelliphelliphelliphelliphelliphelliphelliphelliphelliphelliphelliphelliphelliphellip 8 9 10 Office of the General Counselhelliphelliphelliphelliphelliphelliphelliphelliphelliphelliphelliphelliphelliphelliphelliphellip 40 44 46 Office of Inspector Generalhelliphelliphelliphelliphelliphelliphelliphelliphelliphelliphelliphelliphelliphelliphelliphelliphellip 84 95 96 Office of Communicationshelliphelliphelliphelliphelliphelliphelliphelliphelliphelliphelliphelliphelliphelliphelliphelliphellip 9 10 10 Executive Operations
Office of the Chief Economisthelliphelliphelliphelliphelliphelliphelliphelliphelliphelliphelliphelliphelliphelliphellip 12 14 14 National Appeals Divisionhelliphelliphelliphelliphelliphelliphelliphelliphelliphelliphelliphelliphelliphelliphelliphelliphellip 14 14 15
Working Capital Fundhelliphelliphelliphelliphelliphelliphelliphelliphelliphelliphelliphelliphelliphelliphelliphelliphelliphelliphellip 46 -25 0 Gifts and Bequestshelliphelliphelliphelliphelliphelliphelliphelliphelliphelliphelliphelliphelliphelliphelliphelliphelliphelliphelliphellip 1 1 1
Subtotalhelliphelliphelliphelliphelliphelliphelliphelliphelliphelliphelliphelliphelliphelliphelliphelliphelliphelliphelliphelliphelliphelliphelliphellip 118017 144135 146496 Offsetting Receiptshelliphelliphelliphelliphelliphelliphelliphelliphelliphelliphelliphelliphelliphelliphelliphelliphelliphelliphelliphelliphellip -3577 -2120 -749
TOTAL US DEPARTMENT OF AGRICULTUREhelliphelliphelliphelliphelliphellip $114440 $142015 $145747
138
APPENDIX
UNITED STATES DEPARTMENT OF AGRICULTURE
Discretionary Outlays
(Dollars in Millions)
2009 2010 2011 AGENCY Actual Estimate Budget
FARM AND FOREIGN AGRICULTURAL SERVICES Farm Service Agencyhelliphelliphelliphelliphelliphelliphelliphelliphelliphelliphelliphelliphelliphelliphelliphelliphelliphelliphellip $1872 $2354 $1940 Risk Management Agencyhelliphelliphelliphelliphelliphelliphelliphelliphelliphelliphelliphelliphelliphelliphelliphelliphellip 73 79 82 Foreign Agricultural Servicehelliphelliphelliphelliphelliphelliphelliphelliphelliphelliphelliphelliphelliphelliphelliphelliphellip 236 395 472 PL 480helliphelliphelliphelliphelliphelliphelliphelliphelliphelliphelliphelliphelliphelliphelliphelliphelliphelliphelliphelliphelliphelliphelliphelliphellip 2169 1504 1847 RURAL DEVELOPMENT Salaries and Expenseshelliphelliphelliphelliphelliphelliphelliphelliphelliphelliphelliphelliphelliphelliphelliphelliphelliphelliphellip 38 297 238 Rural Utilities Servicehelliphelliphelliphelliphelliphelliphelliphelliphelliphelliphelliphelliphelliphelliphelliphelliphelliphelliphellip 608 1248 1786 Rural Housing Servicehelliphelliphelliphelliphelliphelliphelliphelliphelliphelliphelliphelliphelliphelliphelliphelliphelliphelliphellip 1982 2297 2018 Rural Business - Cooperative Servicehelliphelliphelliphelliphelliphelliphelliphelliphelliphelliphelliphelliphellip 169 215 125 Rural Empowerment ZonesEnterprise Communitieshelliphelliphelliphelliphelliphelliphellip 16 10 3 FOOD NUTRITION AND CONSUMER SERVICES Food and Nutrition Servicehelliphelliphelliphelliphelliphelliphelliphelliphelliphelliphelliphelliphelliphelliphelliphelliphellip 7070 8725 8074 NATURAL RESOURCES AND ENVIRONMENT Natural Resources Conservation Servicehelliphelliphelliphelliphelliphelliphelliphelliphelliphelliphelliphellip 1141 1401 969 Forest Servicehelliphelliphelliphelliphelliphelliphelliphelliphelliphelliphelliphelliphelliphelliphelliphelliphelliphelliphelliphelliphelliphellip 5129 6007 5322 FOOD SAFETY Food Safety and Inspection Servicehelliphelliphelliphelliphelliphelliphelliphelliphelliphelliphelliphelliphelliphellip 956 995 1033 RESEARCH EDUCATION AND ECONOMICS Agricultural Research Servicehelliphelliphelliphelliphelliphelliphelliphelliphelliphelliphelliphelliphelliphelliphelliphellip 1178 1250 1227 National Institute of Food and Agriculturehelliphelliphelliphelliphelliphelliphelliphelliphelliphelliphellip 1140 1396 1542 Economic Research Servicehelliphelliphelliphelliphelliphelliphelliphelliphelliphelliphelliphelliphelliphelliphelliphelliphellip 80 81 87 National Agricultural Statistics Servicehelliphelliphelliphelliphelliphelliphelliphelliphelliphelliphelliphellip 145 162 165 MARKETING AND REGULATORY PROGRAMS Animal and Plant Health Inspection Servicehelliphelliphelliphelliphelliphelliphelliphelliphelliphellip 942 1085 1030 Agricultural Marketing Servicehelliphelliphelliphelliphelliphelliphelliphelliphelliphelliphelliphelliphelliphelliphellip 101 103 52 Grain Inspection Packers and Stockyards Administrationhelliphelliphelliphelliphellip 40 42 43
DEPARTMENTAL ACTIVITIES Office of the Secretaryhelliphelliphelliphelliphelliphelliphelliphelliphelliphelliphelliphelliphelliphelliphelliphelliphelliphelliphellip 11 19 43 Departmental Administrationhelliphelliphelliphelliphelliphelliphelliphelliphelliphelliphelliphelliphelliphelliphelliphellip 78 148 151 Agriculture Buildings and Facilitieshelliphelliphelliphelliphelliphelliphelliphelliphelliphelliphelliphelliphelliphellip 236 314 281 Hazardous Waste Managementhelliphelliphelliphelliphelliphelliphelliphelliphelliphelliphelliphelliphelliphelliphelliphellip 8 9 10 Office of the General Counselhelliphelliphelliphelliphelliphelliphelliphelliphelliphelliphelliphelliphelliphelliphelliphellip 40 44 46 Office of Inspector Generalhelliphelliphelliphelliphelliphelliphelliphelliphelliphelliphelliphelliphelliphelliphelliphelliphellip 84 95 96 Office of Communicationshelliphelliphelliphelliphelliphelliphelliphelliphelliphelliphelliphelliphelliphelliphelliphelliphellip 9 10 10 Executive Operations
Office of the Chief Economisthelliphelliphelliphelliphelliphelliphelliphelliphelliphelliphelliphelliphelliphelliphellip 11 13 13 National Appeals Divisionhelliphelliphelliphelliphelliphelliphelliphelliphelliphelliphelliphelliphelliphelliphelliphelliphellip 14 14 15 Common Computing Environmenthelliphelliphelliphelliphelliphelliphelliphelliphelliphelliphelliphelliphelliphellip 6 16 0 Working Capital Fundhelliphelliphelliphelliphelliphelliphelliphelliphelliphelliphelliphelliphelliphelliphelliphelliphelliphelliphellip 46 -25 0 Subtotalhelliphelliphelliphelliphelliphelliphelliphelliphelliphelliphelliphelliphelliphelliphelliphelliphelliphelliphelliphelliphelliphelliphelliphellip 25628 30303 28720 Offsetting Receiptshelliphelliphelliphelliphelliphelliphelliphelliphelliphelliphelliphelliphelliphelliphelliphelliphelliphelliphelliphelliphellip -58 -70 -78
TOTAL US DEPARTMENT OF AGRICULTUREhelliphelliphelliphelliphelliphellip $25570 $30233 $28642
139
APPENDIX
UNITED STATES DEPARTMENT OF AGRICULTURE
American Recovery and Reinvestment Act of 2009 (Dollars in Millions)
2009 - 2010 2011
AgencyProgram Available Estimate
DEPARTMENTAL ADMINISTRATION Agriculture Buildings and Facilities and Rental Paymentshelliphelliphelliphelliphelliphelliphellip $24 0
AGRICULTURAL RESEARCH SERVICE Buildings and Facilitieshelliphelliphelliphelliphelliphelliphelliphelliphelliphelliphelliphelliphelliphelliphelliphelliphelliphelliphelliphellip 176 0
OFFICE OF INSPECTOR GENERAL Oversight and Audithelliphelliphelliphelliphelliphelliphelliphelliphelliphelliphelliphelliphelliphelliphelliphelliphelliphelliphelliphelliphellip 22 0
FARM SERVICE AGENCY Salaries and Expenses - Information Technologyhelliphelliphelliphelliphelliphelliphelliphelliphelliphellip 50 0 Agricultural Credit Insurance Fund Program Account Farm Operating Direct Loanshelliphelliphelliphelliphelliphelliphelliphelliphelliphelliphelliphelliphelliphelliphelliphelliphellip 20 0 Loan Levelhelliphelliphelliphelliphelliphelliphelliphelliphelliphelliphelliphelliphelliphelliphelliphelliphelliphelliphelliphelliphelliphelliphellip (173) (0) Total FSAhelliphelliphelliphelliphelliphelliphelliphelliphelliphelliphelliphelliphelliphelliphelliphelliphelliphelliphelliphelliphelliphelliphelliphelliphellip 70 0
NATURAL RESOURCES CONSERVATION SERVICE Watershed and Flood Prevention Operationshelliphelliphelliphelliphelliphelliphelliphelliphelliphelliphelliphellip 290 0 Watershed Rehabilitation Programhelliphelliphelliphelliphelliphelliphelliphelliphelliphelliphelliphelliphelliphelliphelliphellip 50 0 Total NRCShelliphelliphelliphelliphelliphelliphelliphelliphelliphelliphelliphelliphelliphelliphelliphelliphelliphelliphelliphelliphelliphelliphelliphellip 340 0
RURAL DEVELOPMENT Salaries and Expenseshelliphelliphelliphelliphelliphelliphelliphelliphelliphelliphelliphelliphelliphelliphelliphelliphelliphelliphelliphelliphellip 131 a 0
Rural Business-Cooperative Service Rural Business and Industry Guaranteed Loans Programhelliphelliphelliphelliphelliphelliphellip 126 0 Loan Levelhelliphelliphelliphelliphelliphelliphelliphelliphelliphelliphelliphelliphelliphelliphelliphelliphelliphelliphelliphelliphelliphelliphellip (1572) (0) Rural Business Enterprise Grantshelliphelliphelliphelliphelliphelliphelliphelliphelliphelliphelliphelliphelliphelliphelliphellip 19 0 Total RBShelliphelliphelliphelliphelliphelliphelliphelliphelliphelliphelliphelliphelliphelliphelliphelliphelliphelliphelliphelliphelliphelliphelliphelliphellip 145 0
Rural Housing Service Rural Community Facilities Loans Programhelliphelliphelliphelliphelliphelliphelliphelliphelliphelliphelliphellip 24 0 Loan Levelhelliphelliphelliphelliphelliphelliphelliphelliphelliphelliphelliphelliphelliphelliphelliphelliphelliphelliphelliphelliphelliphelliphellip (1136) (0) Rural Community Facilities Grants Programhelliphelliphelliphelliphelliphelliphelliphelliphelliphelliphelliphellip 102 0 Section 502 Direct Single Family Housing Loan Programhelliphelliphelliphelliphelliphellip 65 0 Loan Levelhelliphelliphelliphelliphelliphelliphelliphelliphelliphelliphelliphelliphelliphelliphelliphelliphelliphelliphelliphelliphelliphelliphellip (1563) (0) Section 502 Guaranteed Single Family Housing Loan Programhelliphelliphelliphellip 129 0 Loan Levelhelliphelliphelliphelliphelliphelliphelliphelliphelliphelliphelliphelliphelliphelliphelliphelliphelliphelliphelliphelliphelliphelliphellip (10111) (0) Total RHShelliphelliphelliphelliphelliphelliphelliphelliphelliphelliphelliphelliphelliphelliphelliphelliphelliphelliphelliphelliphelliphelliphelliphellip 320 0
140
APPENDIX
American Recovery and Reinvestment Act of 2009 (Dollars in Millions)
2009 - 2010 2011
AgencyProgram Available Estimate
Rural Utilities Service Rural Water amp Waste Disposal Direct Loan Programhelliphelliphelliphelliphelliphelliphelliphellip 400 0
Loan Levelhelliphelliphelliphelliphelliphelliphelliphelliphelliphelliphelliphelliphelliphelliphelliphelliphelliphelliphelliphelliphelliphelliphellip (2154) (0) Rural Water amp Waste Disposal Grants Programhelliphelliphelliphelliphelliphelliphelliphelliphelliphellip 939 0 Distance Learning Telemedicine amp Broadband Grants Programhelliphelliphellip 1940 0 Distance Learning Telemedicine amp Broadband Loan Programhelliphelliphelliphellip 485 0
Loan Levelhelliphelliphelliphelliphelliphelliphelliphelliphelliphelliphelliphelliphelliphelliphelliphelliphelliphelliphelliphelliphelliphelliphellip (7160) (0) Total RUShelliphelliphelliphelliphelliphelliphelliphelliphelliphelliphelliphelliphelliphelliphelliphelliphelliphelliphelliphelliphelliphelliphelliphellip 3764 0
FOOD AND NUTRITION SERVICE WIC Management Information Systemshelliphelliphelliphelliphelliphelliphelliphelliphelliphelliphelliphelliphellip 100 0 WIC Contingency Fundhelliphelliphelliphelliphelliphelliphelliphelliphelliphelliphelliphelliphelliphelliphelliphelliphelliphelliphelliphellip 400 0
Total WIChelliphelliphelliphelliphelliphelliphelliphelliphelliphelliphelliphelliphelliphelliphelliphelliphelliphelliphelliphelliphelliphelliphelliphellip 500 0
Supplemental Nutrition Assistance Program Increased Benefitshelliphelliphelliphelliphelliphelliphelliphelliphelliphelliphelliphelliphelliphelliphelliphelliphelliphelliphelliphellip 15355 b 11936 State Administrative Expenseshelliphelliphelliphelliphelliphelliphelliphelliphelliphelliphelliphelliphelliphelliphelliphellip 290 0 FDPIR Administrative Expenseshelliphelliphelliphelliphelliphelliphelliphelliphelliphelliphelliphelliphelliphelliphellip 5 0 FNS Management and Oversighthelliphelliphelliphelliphelliphelliphelliphelliphelliphelliphelliphelliphelliphelliphellip 5 0
Total SNAPhelliphelliphelliphelliphelliphelliphelliphelliphelliphelliphelliphelliphelliphelliphelliphelliphelliphelliphelliphelliphelliphelliphellip 15655 11936 Child Nutrition Equipment Assistancehelliphelliphelliphelliphelliphelliphelliphelliphelliphelliphelliphelliphelliphellip 100 0
The Emergency Food Assistance Programhelliphelliphelliphelliphelliphelliphelliphelliphelliphelliphelliphellip 150 0
FOREST SERVICE Capital Improvement and Maintenancehelliphelliphelliphelliphelliphelliphelliphelliphelliphelliphelliphelliphelliphellip 650 0 Wildland Fire Managementhelliphelliphelliphelliphelliphelliphelliphelliphelliphelliphelliphelliphelliphelliphelliphelliphelliphellip 500 0
Total FShelliphelliphelliphelliphelliphelliphelliphelliphelliphelliphelliphelliphelliphelliphelliphelliphelliphelliphelliphelliphelliphelliphelliphelliphellip 1150 0
AGRICULTURAL DISASTER ASSISTANCE TRANSITION 2008 Transition Assistancehelliphelliphelliphelliphelliphelliphelliphelliphelliphelliphelliphelliphelliphelliphelliphelliphelliphellip 230 c 0
Aquaculture Assistance Grants (CCC Funds)helliphelliphelliphelliphelliphelliphelliphelliphelliphelliphellip 50 0 Total Disaster Assistancehelliphelliphelliphelliphelliphelliphelliphelliphelliphelliphelliphelliphelliphelliphelliphelliphelliphelliphellip 280 0
FOREIGN AGRICULTURAL SERVICE Trade Adjustment Assistance for Farmershelliphelliphelliphelliphelliphelliphelliphelliphelliphelliphelliphellip 180 22
RECAP Total USDA Discretionary Fundshelliphelliphelliphelliphelliphelliphelliphelliphelliphelliphelliphelliphelliphelliphellip 6942 0 Total USDA Mandatory Fundshelliphelliphelliphelliphelliphelliphelliphelliphelliphelliphelliphelliphelliphelliphelliphellip 16065 11958
Total USDAhelliphelliphelliphelliphelliphelliphelliphelliphelliphelliphelliphelliphelliphelliphelliphelliphelliphelliphelliphelliphelliphellip $23007 $11958
a The Act allows up to 3 percent of the funds provided to RD to be used for administrative costs b CBO scored at $198 billion over three years The impact of the Recovery Act on benefits will continue until the Thrifty Food Plan costs equal the provision made by the Recovery Act c CBO scored at $744 million over two years
141
APPENDIX
UNITED STATES DEPARTMENT OF AGRICULTURE Staff Years
2010 2011 Agency 2009 Estimate Budget
FARM AND FOREIGN AGRICULTURAL SERVICES Farm Service Agency 5042 5094 5104 Risk Management Agency 481 568 568 Foreign Agricultural Service 951 1006 1006
RURAL DEVELOPMENT Rural Development 5873 6100 6100
FOOD NUTRITION AND CONSUMER SERVICES Food and Nutrition Service 1269 1387 1443
NATURAL RESOURCES AND ENVIRONMENT Natural Resources Conservation Service 11186 14104 11565 Forest Service 34395 36760 35716
FOOD SAFETY Food Safety and Inspection Service 9460 9696 9727
RESEARCH EDUCATION AND ECONOMICS Agricultural Research Service 8268 8351 8433 National Institute of Food and Agriculture 376 440 440 Economic Research Service 389 399 409 National Agricultural Statistics Service 1093 1174 1175
MARKETING AND REGULATORY PROGRAMS Animal and Plant Health Inspection Service 7935 7888 7751 Agricultural Marketing Service 2815 2848 2848 Grain Inspection Packers amp Stockyards Administration 682 689 705
DEPARTMENTAL ACTIVITIES Office of the Secretary 63 101 96 Office of Advocacy and Outreach 0 45 50 Office of Civil Rights helliphelliphelliphelliphelliphelliphelliphelliphelliphelliphelliphelliphelliphelliphelliphelliphelliphelliphellip 130 140 140 Office of the Chief Financial Officer 1190 1363 1379 Office of Budget and Program Analysis 49 60 60 Office of the Chief Information Officer 937 1058 1058 Departmental Administration 519 575 539 Office of Homeland Security 15 19 19 Office of the Chief Economist 54 62 61 National Appeals Division 94 99 99 Office of Communications 82 98 98 Office of the Inspector General 550 600 600 Office of the General Counsel 302 318 318
Total USDA Federal Staffing 94201 101042 97507 FSA Non-Federal Staffing 9418 9425 9425 Total USDA Staffing 103619 110467 106932
This page corrects data included in the printed version of the 2011 Budget Summary
142
APPENDIX
Strategic Goal Help America promote agricultural production and biotechnology exports as America works to
increase food security
Budget Authority (Dollars in Millions)
2009 2010 2011 Program Enacted Estimate Budget
FARM AND FOREIGN AGRICULTURAL SERVICES Foreign Agricultural Servicehelliphelliphelliphelliphelliphelliphelliphelliphelliphelliphelliphellip $3021 $2302 $2320
Total FFAShelliphelliphelliphelliphelliphelliphelliphelliphelliphelliphelliphelliphelliphelliphelliphelliphelliphelliphelliphellip 3021 2302 2320
NATURAL RESOURCES AND ENVIRONMENT Natural Resources Conservation Servicehelliphelliphelliphelliphelliphelliphelliphellip 5 6 6 Total NREhelliphelliphelliphelliphelliphelliphelliphelliphelliphelliphelliphelliphelliphelliphelliphelliphelliphelliphelliphellip 5 6 6
MARKETING AND REGULATORY PROGRAMS Animal and Plant Health Inspection Servicehelliphelliphelliphelliphelliphellip 42 42 49
Agricultural Marketing Servicehelliphelliphelliphelliphelliphelliphelliphelliphelliphelliphellip 0 0 0 Total MRPhelliphelliphelliphelliphelliphelliphelliphelliphelliphelliphelliphelliphelliphelliphelliphelliphelliphelliphelliphellip 42 42 49
RESEARCH EDUCATION AND ECONOMICS Agricultural Research Servicehelliphelliphelliphelliphelliphelliphelliphelliphelliphelliphelliphellip 575 598 602 National Institute of Food and Agriculturehelliphelliphelliphelliphelliphelliphellip 157 178 161 Economic Research Servicehelliphelliphelliphelliphelliphelliphelliphelliphelliphelliphelliphelliphellip 20 20 21 National Agricultural Statistics Servicehelliphelliphelliphelliphelliphelliphelliphellip 0 0 1 Total REEhelliphelliphelliphelliphelliphelliphelliphelliphelliphelliphelliphelliphelliphelliphelliphelliphelliphelliphelliphellip 752 796 785
Totalhelliphelliphelliphelliphelliphelliphelliphelliphelliphelliphelliphelliphelliphelliphelliphelliphelliphelliphelliphelliphelliphellip $3820 $3146 $3160
143
APPENDIX
Strategic Goal Ensure that all of Americas children have access to safe nutritious and balanced meals
Budget Authority (Dollars in Millions)
2009 2010 2011 Program Enacted Estimate Budget
FOOD NUTRITION AND CONSUMER SERVICES Food and Nutrition Servicehelliphelliphelliphelliphelliphelliphelliphelliphelliphelliphelliphelliphellip $82249 $93854 $107617
FOOD SAFETY Food Safety and Inspection Servicehelliphelliphelliphelliphelliphelliphelliphelliphelliphellip 983 1028 1046
MARKETING AND REGULATORY PROGRAMS Animal and Plant Health Inspection Servicehelliphelliphelliphelliphelliphellip 860 939 915
Agricultural Marketing Servicehelliphelliphelliphelliphelliphelliphelliphelliphelliphelliphellip 504 674 615 Total MRPhelliphelliphelliphelliphelliphelliphelliphelliphelliphelliphelliphelliphelliphelliphelliphelliphelliphelliphelliphellip 1364 1613 1530
RESEARCH EDUCATION AND ECONOMICS Agricultural Research Servicehelliphelliphelliphelliphelliphelliphelliphelliphelliphelliphelliphellip 191 197 205 National Institute of Food and Agriculturehelliphelliphelliphelliphelliphelliphellip 230 248 233 Economic Research Servicehelliphelliphelliphelliphelliphelliphelliphelliphelliphelliphelliphelliphellip 21 22 24 National Agricultural Statistics Servicehelliphelliphelliphelliphelliphelliphelliphellip 3 8 8 Total REEhelliphelliphelliphelliphelliphelliphelliphelliphelliphelliphelliphelliphelliphelliphelliphelliphelliphelliphelliphellip 445 475 470
Totalhelliphelliphelliphelliphelliphelliphelliphelliphelliphelliphelliphelliphelliphelliphelliphelliphelliphelliphelliphelliphelliphellip $85041 $96970 $110663
144
APPENDIX
Strategic Goal Assist rural communities to create prosperity so they are self-sustaining repopulating and
economically thriving
Budget Authority (Dollars in Millions)
2009 2010 2011 Program Enacted Estimate Budget
FARM AND FOREIGN AGRICULTURAL SERVICES Farm Service Agencyhelliphelliphelliphelliphelliphelliphelliphelliphelliphelliphelliphelliphelliphelliphellip $12774 $11785 $11431
Foreign Agricultural Servicehelliphelliphelliphelliphelliphelliphelliphelliphelliphelliphelliphellip 759 851 721 Risk Management Agencyhelliphelliphelliphelliphelliphelliphelliphelliphelliphelliphelliphelliphellip 6844 6535 7696 Total FFAShelliphelliphelliphelliphelliphelliphelliphelliphelliphelliphelliphelliphelliphelliphelliphelliphelliphelliphelliphellip 20377 19171 19848
RURAL DEVELOPMENT Rural Business Servicehelliphelliphelliphelliphelliphelliphelliphelliphelliphelliphelliphelliphelliphelliphellip 518 556159 366
Rural Housing Servicehelliphelliphelliphelliphelliphelliphelliphelliphelliphelliphelliphelliphelliphelliphellip 2250 2078 1917 Rural Utilities Servicehelliphelliphelliphelliphelliphelliphelliphelliphelliphelliphelliphelliphelliphelliphellip 4479 709 661 Total RDhelliphelliphelliphelliphelliphelliphelliphelliphelliphelliphelliphelliphelliphelliphelliphelliphelliphelliphelliphelliphellip 7247 3343 2944
NATURAL RESOURCES AND ENVIRONMENT Natural Resources Conservation Servicehelliphelliphelliphelliphelliphelliphelliphellip 182 306 320
Forest Servicehelliphelliphelliphelliphelliphelliphelliphelliphelliphelliphelliphelliphelliphelliphelliphelliphelliphellip 1823 672 666 Total NREhelliphelliphelliphelliphelliphelliphelliphelliphelliphelliphelliphelliphelliphelliphelliphelliphelliphelliphelliphellip 2005 978 986
MARKETING AND REGULATORY PROGRAMS Animal and Plant Health Inspection Servicehelliphelliphelliphelliphelliphellip 103 106 99
Agricultural Marketing Servicehelliphelliphelliphelliphelliphelliphelliphelliphelliphelliphellip 807 723 725 Grain Inspection Packers and Stockyards Administrationhellip 40 42 44 Total MRPhelliphelliphelliphelliphelliphelliphelliphelliphelliphelliphelliphelliphelliphelliphelliphelliphelliphelliphelliphellip 950 871 868
RESEARCH EDUCATION AND ECONOMICS Agricultural Research Servicehelliphelliphelliphelliphelliphelliphelliphelliphelliphelliphelliphellip 398 246 178 National Institute of Food and Agriculturehelliphelliphelliphelliphelliphelliphellip 780 857 904 Economic Research Servicehelliphelliphelliphelliphelliphelliphelliphelliphelliphelliphelliphelliphellip 29 30 30 National Agricultural Statistics Servicehelliphelliphelliphelliphelliphelliphelliphellip 148 153 155 Total REEhelliphelliphelliphelliphelliphelliphelliphelliphelliphelliphelliphelliphelliphelliphelliphelliphelliphelliphelliphellip 1355 1286 1267
DEPARTMENTAL STAFF OFFICES Office of the Secretaryhelliphelliphelliphelliphelliphelliphelliphelliphelliphelliphelliphelliphelliphelliphellip 0 0 35
Office of the Chief Economisthelliphelliphelliphelliphelliphelliphelliphelliphelliphelliphelliphellip 6 6 6 Total Staff Officeshelliphelliphelliphelliphelliphelliphelliphelliphelliphelliphelliphelliphelliphelliphelliphelliphellip 6 6 41
Totalhelliphelliphelliphelliphelliphelliphelliphelliphelliphelliphelliphelliphelliphelliphelliphelliphelliphelliphelliphelliphelliphellip $31940 $25655 $25954
145
APPENDIX
Strategic Goal Ensure our national forests and private working lands are conserved restored and made more
resilient to climate change while enhancing our water resources Budget Authority
(Dollars in Millions) 2009 2010 2011
Program Enacted Estimate Budget FARM AND FOREIGN AGRICULTURAL SERVICES Farm Service Agencyhelliphelliphelliphelliphelliphelliphelliphelliphelliphelliphelliphelliphelliphelliphellip $2242 $2328 $2314
Foreign Agricultural Servicehelliphelliphelliphelliphelliphelliphelliphelliphelliphelliphelliphellip 3 3 3 Total FFAShelliphelliphelliphelliphelliphelliphelliphelliphelliphelliphelliphelliphelliphelliphelliphelliphelliphelliphelliphellip 2245 2331 2317
NATURAL RESOURCES AND ENVIRONMENT Natural Resources Conservation Servicehelliphelliphelliphelliphelliphelliphelliphellip 3284 3670 3667
Forest Servicehelliphelliphelliphelliphelliphelliphelliphelliphelliphelliphelliphelliphelliphelliphelliphelliphelliphellip 5280 5479 5479 Total NREhelliphelliphelliphelliphelliphelliphelliphelliphelliphelliphelliphelliphelliphelliphelliphelliphelliphelliphelliphellip 8564 9149 9146
MARKETING AND REGULATORY PROGRAMS Animal and Plant Health Inspection Servicehelliphelliphelliphelliphelliphellip 86 101 71 Total MRPhelliphelliphelliphelliphelliphelliphelliphelliphelliphelliphelliphelliphelliphelliphelliphelliphelliphelliphelliphellip 86 101 71
RESEARCH EDUCATION AND ECONOMICS Agricultural Research Servicehelliphelliphelliphelliphelliphelliphelliphelliphelliphelliphelliphellip 226 234 240 National Institute of Food and Agriculturehelliphelliphelliphelliphelliphelliphellip 183 199 196 Economic Research Servicehelliphelliphelliphelliphelliphelliphelliphelliphelliphelliphelliphelliphellip 10 11 11 National Agricultural Statistics Servicehelliphelliphelliphelliphelliphelliphelliphellip 1 1 1 Total REEhelliphelliphelliphelliphelliphelliphelliphelliphelliphelliphelliphelliphelliphelliphelliphelliphelliphelliphelliphellip 420 444 448
DEPARTMENTAL STAFF OFFICES Office of the Chief Economisthelliphelliphelliphelliphelliphelliphelliphelliphelliphelliphelliphellip 0 3 3 Hazardous Materials Managementhelliphelliphelliphelliphelliphelliphelliphelliphelliphellip 5 5 5
Total Staff Officeshelliphelliphelliphelliphelliphelliphelliphelliphelliphelliphelliphelliphelliphelliphelliphelliphellip 5 8 8
Totalhelliphelliphelliphelliphelliphelliphelliphelliphelliphelliphelliphelliphelliphelliphelliphelliphelliphelliphelliphelliphelliphelliphellip $11320 $12033 $11990
146
APPENDIX
Management Activities (Dollars in Millions)
2009 2010 2011 Program Enacted Estimate Budget
Departmental Activitieshelliphelliphelliphelliphelliphelliphelliphelliphelliphelliphelliphelliphelliphelliphellip $549 $626 $620 Total Management Activitieshelliphelliphelliphelliphelliphelliphelliphelliphelliphelliphelliphelliphellip $549 $626 $620
147
APPENDIX
Fee Proposals (Dollars in Millions)
2011 Agency and Program Budget Authority
Food Safety Food Safety and Inspection Service
User Fee Proposals bull Two user fees associated with the Food Safety and
Inspection Service are proposed One proposal would provide the authority to collect user fees from plants that require additional inspection activities because of performance failures such as retesting recalls or inspection activities linked to an outbreak A second proposal would provide authority to collect a Facility Application and Annual Renewal Activities user fee to cover the increased cost above those basic inspection services provided to meat poultry or processed egg products establishments Total collection from these proposals are estimated to be about $11 million in 2011
$0
Natural Resources and Environment Natural Resources Conservation Service
User Fee Proposal 0
bull The budget includes a targeted fee proposal for conservation plans development Total collections from these proposals are estimated to be $19 million
Marketing and Regulatory Programs Animal and Plant Health Inspection Service
User Fee Proposals 0
bull The budget proposal authorizes the Secretary of Agriculture to prescribe adjust and collect fees to cover the costs incurred for activities in relation to the review maintenance and inspections connected to licensing activities associated with the Animal Welfare Act Virus Serum Toxin Act and the Plant Protection Act The estimated fees would result in receipts of $195 million in 2011 which includes $9 million for animal care $675 million for veterinary biologics and $375 million for Biotechnology Regulatory Services
148
0
APPENDIX
Grain Inspection Packers and Stockyards Administration User Fee Proposal
bull The budget would establish a fee for grain standardization and a Packers and Stockyards license fee The proposal would result in approximately $29 million ($4 million and $25 million respectively)
149
APPENDIX
Proposed Budget-Related Legislation (Dollars in Millions)
2011 Agency and Program Budget Authority
Farm and Foreign Agricultural Services Commodity Credit Corporation
Payment Limitation -$1
bull The 2011 budget proposes to utilize the existing payment limitations from the 2008 Farm Bill but adjust the limits within them to achieve significant savings over 10 years Specifically the proposal would reduce the cap on Direct Payments and reduce the Adjusted Gross Income limitations USDA estimates that the sum of the above changes may save the government a total of roughly $23 billion over 10 years
Reduced Commodity Storage Payments -2
bull This proposal would eliminate cotton and peanut storage credits The credits allow producers to store their cotton and peanuts at the Governmentrsquos cost until prices rise Therefore storage credits have a negative impact on the amount of commodities on the market Because storage is covered by the Government producers may store their commodities for longer than necessary There is no reason the Government should be paying for the storage of cotton or peanuts particularly since it does not provide this assistance for other commodities
Foreign Agricultural Service Reform Market Access Program (MAP) -8
bull This proposal reduces annual funding for MAP by 20 percent in order to achieve deficit reduction savings Under the program funds are used to reimburse participating organizations for a portion of the costs of carrying out overseas marketing and promotional activities such as direct consumer promotions Historically more than 80 percent of MAP funding has been devoted to building export markets for high-value products including a wide range of specialty crops
This page corrects a statement included in the printed version of the 2011 Budget Summary
150
APPENDIX
Although funding for new MAP programming will be reduced by $40 million in 2011 outlay savings during the first year are estimated to be $4 million due to the slow rate of spend-out for the program
Food Nutrition and Consumer Services Food and Nutrition Service
Child Nutrition and WIC Reauthorization 1000
bull The budget proposes to add $10 billion over the next ten years for the reauthorization of the Child Nutrition and WIC Programs The proposals would (1) Improve access to nutritious meals particularly for low-income children (2) Improve access to healthy fruits and vegetables (3) Reduce the prevalence of obesity by improving the diets of school children and by teaching children to make wise food choices in and outside of school and (4) Improve program performance and integrity
Supplemental Nutrition Assistance Program 25
bull The budget proposes to add $25 million to extend the American Recovery and Reinvestment Act provision that eliminates the time limits for able-bodied adults without dependents for an additional year
Supplemental Nutrition Assistance Program 11
bull The budget proposes to exclude refundable tax credits from benefit and eligibility determination in the month of receipt and for the following 12 months
Supplemental Nutrition Assistance Program 0
bull The budget proposes to increase the asset limit to $10000 in SNAP but does not increase budget authority The funding is provided through a government-wide initiative
151
0
APPENDIX
Departmental Management Departmental Management
Penalties
bull The budget will include a proposal to assess penalties for misuse of the biopreferred label
152
- 01ContentsTablepdf
- 02Preface
- 03Overview
- 04Highlights by Goals
- 06FFAS
- 07RD
- 08FNS
- 09FSIS
- 10NRE
- 11MRP
- 12REE
-
- NATIONAL INSTITUTE OF FOOD AND AGRICULTURE (NIFA)
- NIFA formerly the Cooperative State Research Education and Extension Service has the primary responsibility for providing linkages between the Federal and State components of a broad-based national agricultural research extension and higher education system NIFA provides funding for projects conducted in partnership with the State Agricultural Experiment Stations the State Cooperative Extension System land grant universities colleges and other research and education institutions Federal funds are distributed to universities and institutions by statutory formula funding competitive awards and grants NIFA is responsible for administering USDAs primary competitive research grants program the Agriculture and Food Research Initiative (AFRI) which supports investigator-initiated research with strong potential to contribute to major breakthroughs in agricultural science
-
- 13OSEC
- 14DM
- 15All Other
- 16OIG
- 17APPENDIX
-