fy 2011 ryan white part a application · • comprehensive portrayal of lac hiv service delivery...
TRANSCRIPT

FY 2011 Ryan White Part A Application
Juhua WuCare Grants ManagerLos Angeles County Department of Public HealthOffice of AIDS Programs and Policy
Commission on HIV Monthly MeetingJanuary 13, 2011

Part A Application
• Annual competitive application• Basis for Ryan White Part A supplemental
award• 1/3 of total Part A award since 2006
Reauthorization• Comprehensive Portrayal of LAC HIV
service delivery system and its challenges

Title I/Part A Award History
$0.00
$5,000,000.00
$10,000,000.00
$15,000,000.00
$20,000,000.00
$25,000,000.00
$30,000,000.00
$35,000,000.00
$40,000,000.00
$45,000,000.00
2004 2005 2006 2007 2008 2009 2010
MAI
Total Part A
Total

FY 2011 Application Timeframe
• HRSA released program guidance– August 16, 2010
• Application due date– October 18, 2010
• OAPP submitted application– October 18, 2010
• Anticipated Award Announcement– March 2011

HRSA Emphases for FY 2011
• National HIV/AIDS Strategy– Reduce number of people who become
infected with HIV– Increase access; optimize health outcomes– Reduce HIV-related health disparities
• Assure access to primary care and medication
– No less than 75% of Part A funds for core medical services

HRSA Emphases for FY 2011
• Early identification of Individuals with HIV/AIDS (EIIHA)
– Unaware of HIV status– Strategy, plan, and data
• Guidelines and requirements for monitoring grantees and providers (national monitoring standards)

HRSA Emphases for FY 2011
• Other standing principles– Estimate and address unmet need– Quality management– Third party reimbursement– Cultural and linguistic competency; health
literacy

What’s Different in FY 2011
• Page limit = 90• Significant additional requirements in
contents– New section (EIIHA)– New requirements within existing sections
• Changes in scoring point distribution

Application Scoring GuideFY 2011 Narrative Sections Points
1. Demonstrated Need 34
2. EIIHA 33
2. Access to Care and Plan for FY 2011 8
3. Grantee Administration 10
4. Planning and Resource Allocations 5
5. Budget and Maintenance of Effort 5
6. Clinical Quality Management 5
Total 100

Application Scoring Guide
*Point distribution is based on supplemental guidance released after the Ryan White Extension Act of 2009 was signed into law in October 2009.
FY 2011 Narrative Sections FY 2011 FY 2010*
1. Demonstrated Need 34 34
2. EIIHA 33 34
3. Access to Care and Plan for FY 2011 8 9
4. Grantee Administration 10 5
5. Planning and Resource Allocations 5 10
6. Budget and Maintenance of Effort 5 2
7. Clinical Quality Management 5 6
Total 100 100

Demonstrated Need –HIV/AIDS Epidemiology
• People living with AIDS– 24,845 as of 12/31/2009*
• People living with HIV (non-AIDS)– 19,225 reported as of 12/31/2009*– 24,845 estimated using 1:1 = HIV: AIDS ratio– 26,292 from State OA unmet need datasets
• New AIDS cases reported in 2008, 2009– 2,002*
*HIV Epidemiology Program HIV/AIDS Reporting System (eHARS) cases reported as of August 31, 2010.

Demonstrated Need –HIV/AIDS Epidemiology
• Overall HIV/AIDS prevalenceLiving AIDS Cases 24,845Living HIV Cases 24,845* – 26,292Undiagnosed Cases 13,000*Total prevalence 62,000 – 65,000*
*Estimates

Demonstrated Need –HIV/AIDS Epidemiology
• Disproportionate Impacted populations– MSM– African Americans– Homeless– Formerly Incarcerated Individuals– Transgender Individuals
*Estimates

Demonstrated Need –HIV/AIDS Epidemiology
• Service Gaps– Populations Underrepresented in the Ryan
White Program• Whites; Men; Older Adults
– Level of Service Gaps• Based on LACHNA findings• Oral health; housing; unmet need; those unaware of
HIV status
*Estimates

Demonstrated Need –Impact of Co-morbidities
• Impact of Co-morbidities on the Cost and Complexity of Providing Care
– Sexually Transmitted Infections– Homelessness– Lack of Health Insurance– Poverty (≤ 300% FPL)
• Additional Contributing Factors– Tuberculosis, hepatitis, mental
illness, substance abuse

Demonstrated Need –Cost and Complexity of Care
• Complexity of care indicators• Impact on service delivery of formerly
incarcerated individuals• Trends in services and fiscal resources as
a result of state and local funding cuts

Demonstrated Need –Cost and Complexity of Care
Indicator General Population
RW FY 2009 Clients
RW FY 2009 Formerly
Incarcerated Clients*
CDC-defined AIDS 0.2% 55.5% 54.9%
Mental Illness 10.3% 38.9% 44.0%
Homelessness 0.9% 6.4% 19.3%
Poverty (<100% FPL) 20.8% 64.6% 85.8%
No insurance 28.9% 61.2% 61.7%
*Clients who reported a history of incarceration within the last two years.

Demonstrated Need –Impact of Part A Funding
• Availability of other public funding• Coordination of services and funding
streams– Other Ryan White programs– Other federal, state, and local resources
• Medi-Cal, Medicare and Medicare Part D, SCHIP, VA, HOPWA, CDC, Services for Women and Children, Social Service Programs, Substance Abuse and Mental Health Services
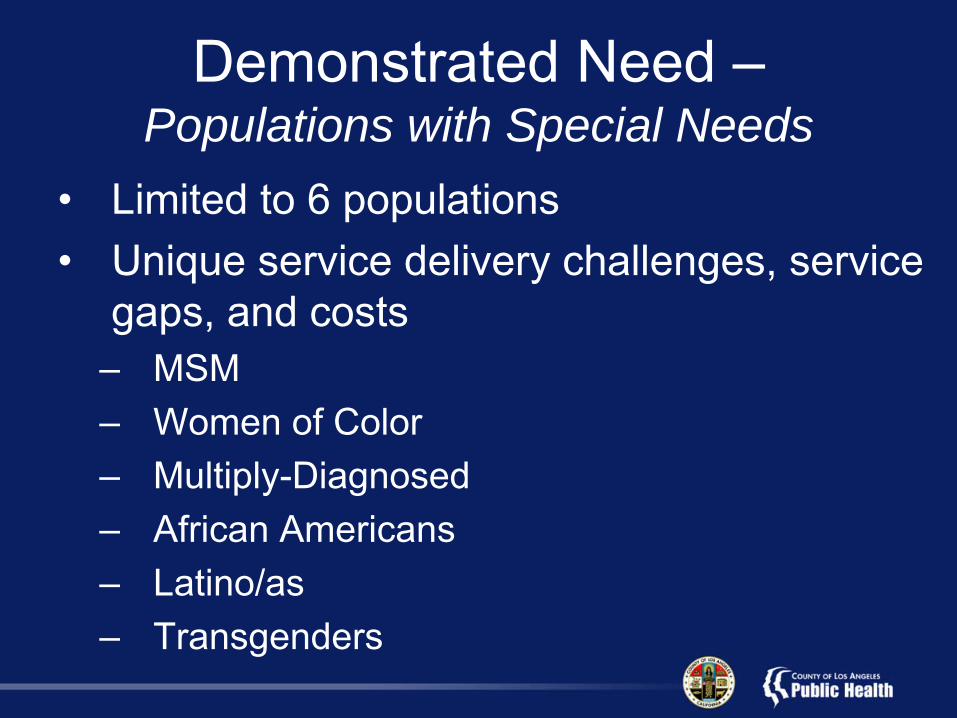
Demonstrated Need –Populations with Special Needs
• Limited to 6 populations• Unique service delivery challenges, service
gaps, and costs– MSM– Women of Color– Multiply-Diagnosed– African Americans– Latino/as– Transgenders

Demonstrated Need –Unique Service Delivery Challenges
• Coordination across vast geographic variations and population diversity
• Leveraging resources during extreme economic decline and state budget crisis
• Increasingly complex HIV treatment and chronic disease care

Demonstrated Need –Impact of Ryan White Funding Decline
• Impact of Ryan White Formula Funding Decline
• Planning Council Response

Demonstrated Need –Unmet Need
• Unmet Need Trend 2007-2009
2007 2008 2009
Total PLWHA 51,150 53,683 53,228
Total Unmet Need 19,977 19,898 18,761
Percent Unmet Need 39.1% 37.1% 35.2%
Note: unmet need is defined as not receiving a viral load, CD4 test, or anti-retroviral therapy in a 12-month period.

Demonstrated Need –Unmet Need
• Assessment of Unmet Need– Demographics and location
• Laboratory test and eHARS data• LACHNA data
– Service needs, gaps and barriers– Efforts to find HIV+ individuals not in care
and enter them in care• Various Countywide Testing Initiatives• Provider activities

Demonstrated Need –Unmet Need
• Assessment of Unmet Need– Use of unmet need framework in
planning/decision-making– Populations disproportionately out of care
• Women, transgender• Youth• African Americans, Latino/a, API• IDU
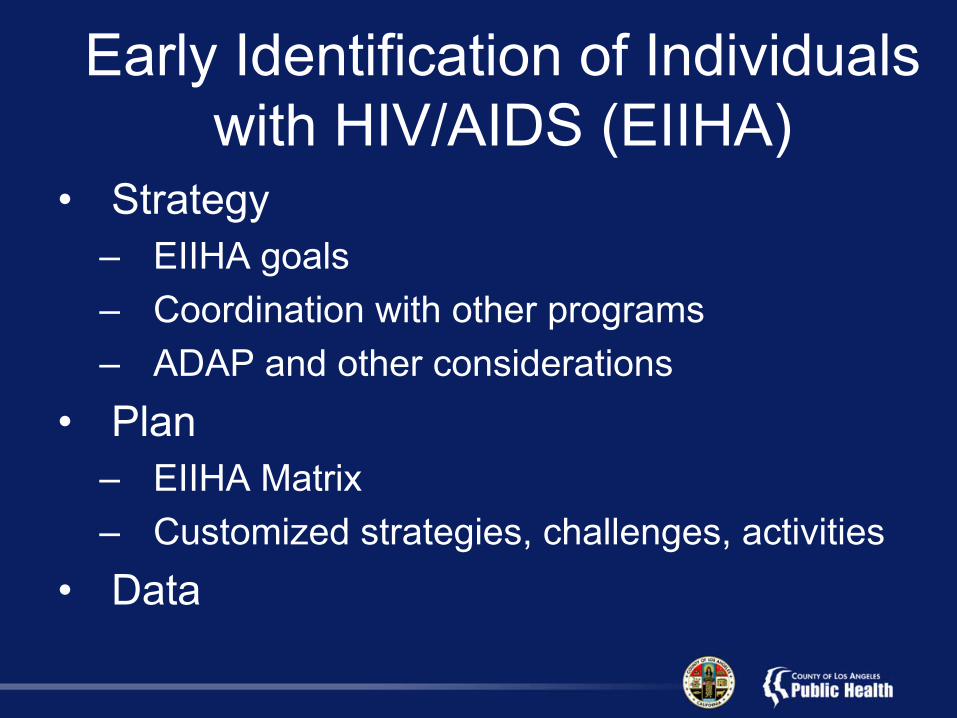
Early Identification of Individuals with HIV/AIDS (EIIHA)
• Strategy– EIIHA goals– Coordination with other programs– ADAP and other considerations
• Plan– EIIHA Matrix– Customized strategies, challenges, activities
• Data

EIIHA - Strategy
• EIIHA goals– Normalize HIV testing
• Hybrid model vs. BRG model• HIV screening as routine health care
– Target HIV testing using epidemiologic evidence
• Geo-mapping– Achieve 95% disclosure and linkage to care

EIIHA - Strategy
• Coordination– RW Part B– CDC; local STD, TB, Communicable Disease
Programs; HIV Epi; Public Health Lab– Corrections; hospitals; communities and
CBOs– Incorporating strategies into RFPs– Consideration of ADAP/medication resources– Role of early intervention programs

EIIHA - Plan• EIIHA Matrix
1. All individuals unaware of their HIV Status (HIV- positive and HIV-negative) in Los Angeles County
2A. Individuals NOT tested for HIV 2B. Individuals tested for HIV
3A. Men
3B. Women
3C. Partners of HIV-positive individuals
3D. Youth (13-24 years old)
3E. Incarcerated and post-released individuals
3F. Individuals uninformed of test results
Note: See Part A application Attachment 9 for detailed description for each subgroup. 1. Unaware of HIV status here indicates either not tested for HIV in the past 12 months or tested for HIV but received no results, including positive or negative results and confirmatory results. 2. Subpopulations are not mutually exclusive from each other.
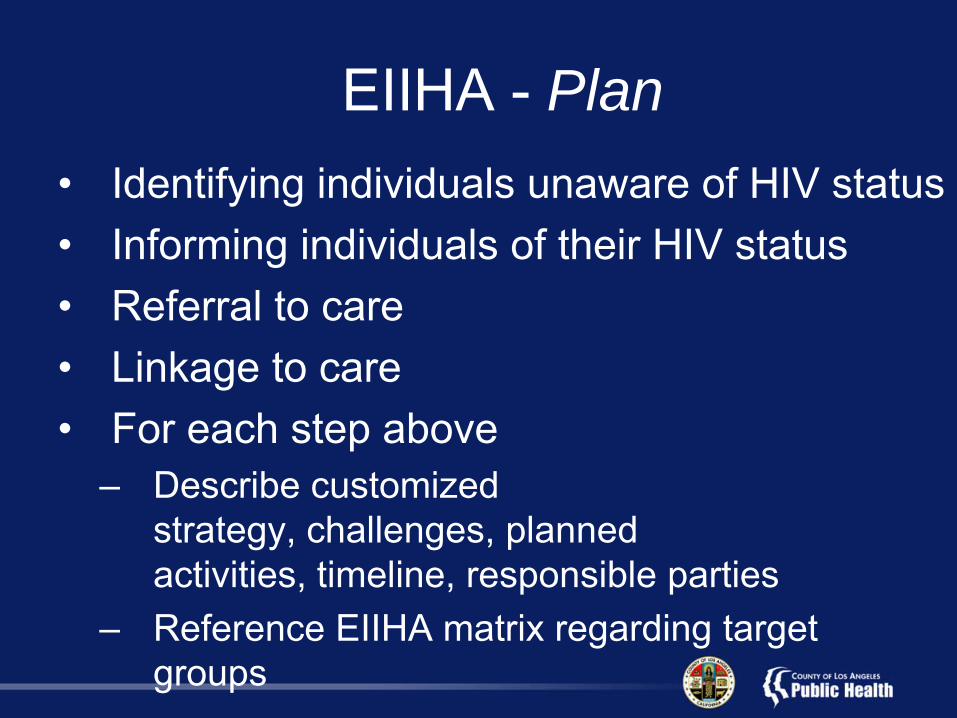
EIIHA - Plan• Identifying individuals unaware of HIV status• Informing individuals of their HIV status• Referral to care• Linkage to care• For each step above
– Describe customized strategy, challenges, planned activities, timeline, responsible parties
– Reference EIIHA matrix regarding target groups

EIIHA - Plan• Strategies/activities to identify individuals
unaware of HIV status– “Erase Doubt” social marketing campaign– Routine testing in health care facilities– Routine testing in County jails– Targeted testing in high burden areas– Community events; health fairs– Multiple morbidities testing– Partner services

EIIHA - Plan• Strategies/activities to identify individuals
unaware of HIV status (cont’d)– Perinatal testing and training– Social network testing– Rapid testing algorithm– Public health/STD clinic testing– Early intervention services– HIV nucleic acid amplification testing– Commercial sex venue testing

EIIHA - Plan• Strategies/activities for referral and
linkage– Performance based reimbursement– HIV LA– HIV rapid testing algorithm– Early intervention services– Transitional case management– Peer navigator intervention
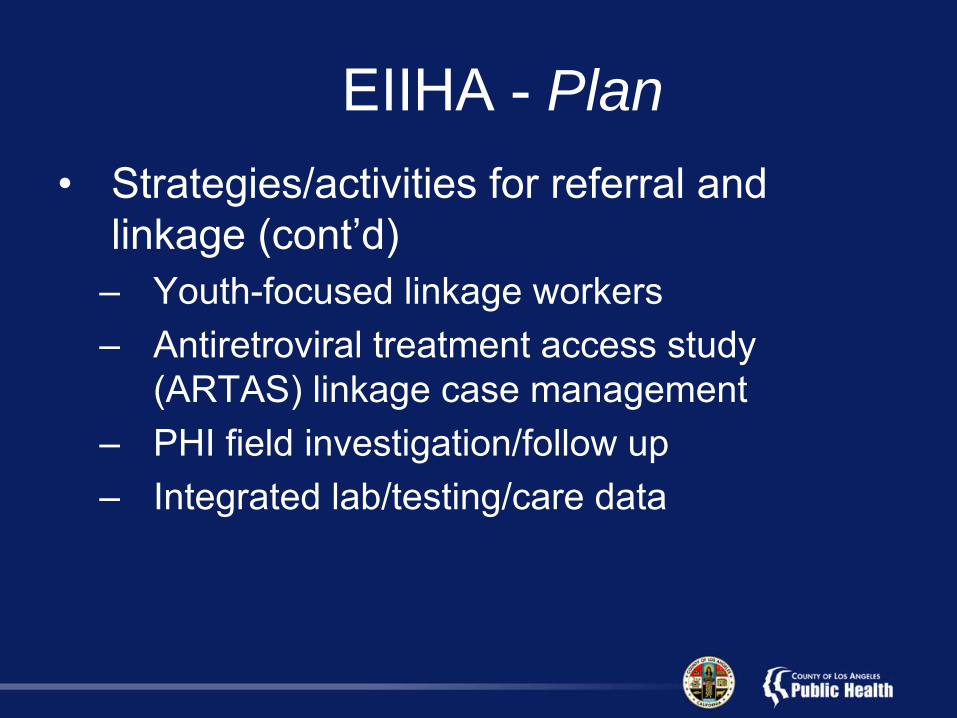
EIIHA - Plan• Strategies/activities for referral and
linkage (cont’d)– Youth-focused linkage workers– Antiretroviral treatment access study
(ARTAS) linkage case management– PHI field investigation/follow up– Integrated lab/testing/care data
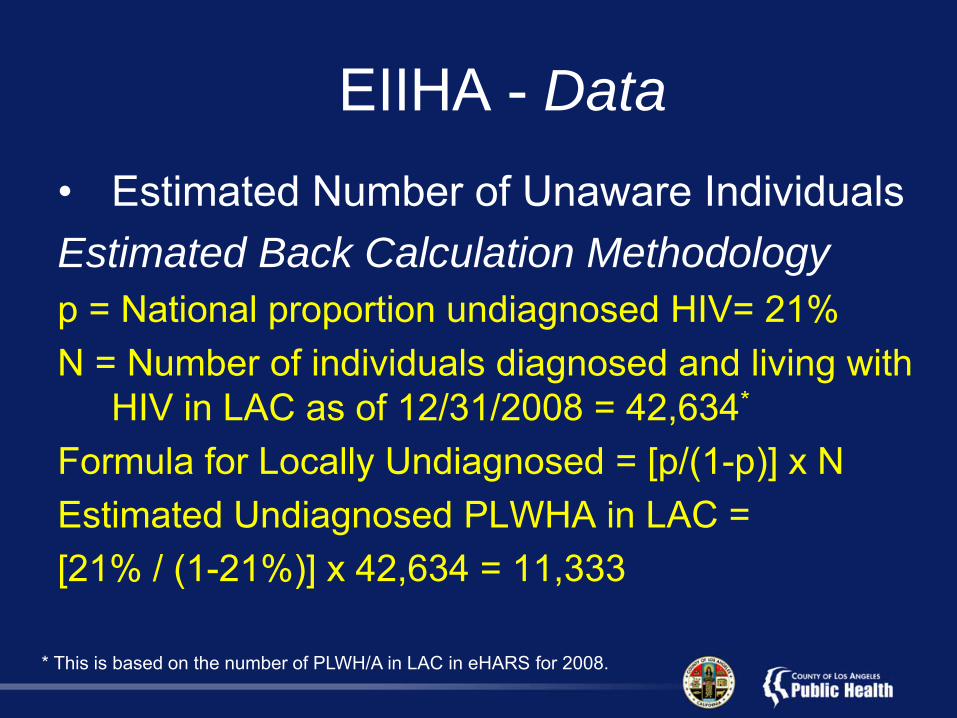
EIIHA - Data• Estimated Number of Unaware Individuals Estimated Back Calculation Methodologyp = National proportion undiagnosed HIV= 21%N = Number of individuals diagnosed and living with
HIV in LAC as of 12/31/2008 = 42,634*
Formula for Locally Undiagnosed = [p/(1-p)] x NEstimated Undiagnosed PLWHA in LAC = [21% / (1-21%)] x 42,634 = 11,333
* This is based on the number of PLWH/A in LAC in eHARS for 2008.

EIIHA - Data• Total Number of HIV Tests in 2009*
– Total HIV tests conducted = 73,356• 87.4% informed of HIV status• 12.6% un-informed of HIV status
– Total HIV-positive tests = 773• 71.2% informed of HIV status• 28.8% un-informed of HIV status
Note: positive results are counted as informed only when the results are confirmed, not preliminary. Un-informed is defined as no documented confirmed positive HIV test results.*includes only public funded HIV tests through OAPP and the STD program.
Access to Care and FY 2011 Plan• Continuum of HIV/AIDS Care• FY 2011 implementation plan• Needs assessment, comprehensive
plan, service priorities and implementation plan
• Core services not allocated RW funds• Increase access• Address needs of emerging populations• Keep PLWHA engaged in care
Access to Care and FY 2011 Plan• Promote parity in terms of
geography, quality, comprehensiveness, and cultural appropriateness
• Assuring culturally and linguistically appropriate services
• Relevance to Healthy People 2010• Resource allocations to WICY• Use of MAI funding

Grantee Administration• Program Organization and Org. Chart• Grantee Accountability
– Distribution and tracking of Ryan White Part A funds
– Fiscal and program monitoring– Process of corrective actions– Technical assistance types and frequency– Audit findings and provider compliance

Grantee Administration• Grantee Accountability (cont’d)
– Reporting and reconciling program expenditures
– Process for receiving invoices and issuing payment
– Fiscal staff accountability• Role and responsibilities• Coordination between fiscal and program staff

Grantee Administration• Third Party Reimbursement
– Process, documentation, and monitoring• Administrative Assessment by the Planning
Councils– Results and recommendations– Grantee response
Planning and Allocation• Letter of Assurance from Co-Chairs• Priorities Setting and Resource Allocation
Process– Description of process– Needs of people not in care– Needs of people unaware– Needs of people historically underserved– How PLWHA were involved
Planning and Allocation• Priorities Setting and Resource Allocation
Process– How data were used to make priority and
allocation decisions• Epi data, cost data, unmet need data• Data related to individuals unaware of HIV status
– PC process to address funding fluctuations– MAI funding

Planning and Allocation• Funding for Core Medical Services
– FY 2011 Allocation Table– At least 75% of funds allocated to core
medical services

Budget and MOE• FY 2011 Budget Request
– $49,812,316 (MAI included)– Grantee Administration* 10%– Quality Management 5%– Direct Services 85%
*Includes Planning Council Support

Budget and MOE• Maintenance of Effort (MOE)
– New HRSA policy guidance August 2009– Local contributions for FY 2008 and FY 2009– List of core medical and support service
budget elements– Tracking system to be used

Clinical Quality Management• Clinical Quality Management (CQM) Program
– CQM structure, mission, and goals• Staff roles and resources
– Internal Administrative Agency CQM process– Assessing quality of services by providers– Performance indicators/outcome measures– CQM program implementation, monitoring and
evaluation

Clinical Quality Management• Clinical Quality Management (CQM)
Program– How MAI outcomes data are being used– Plan/activities of using data to show improved
clinical health outcomes

Clinical Quality Management• CQM Data Collection and Results
– Client data reporting to HRSA• Capability, system used, process
– CQM data collected and results– CQM data review and validation– How data have been used to improve or
change service delivery• For planning councils; CQI projects

Contact InformationJuhua Wu
Office of AIDS Programs and Policy600 South Commonwealth Avenue, 10th Floor
Los Angeles, California 90005-4001Phone: (213) 351-8150
Fax: (213) 381-8023E-mail: [email protected]
This presentation is available atwww.publichealth.lacounty.gov/aids