fy 2020-21 independent fiscal office
TRANSCRIPT

Official Revenue Estimate
FY 2020-21Independent Fiscal Office
June 22, 2020

Solid PA Growth Prior to Pandemic
June 22, 2020 1
Year-Over-Year Growth Rate or Change
2019.2 2019.3 2019.4 2020.1
Real GDP 2.1% 1.9% 2.3% n.a.
Wages-Salaries 4.7% 3.5% 4.3% 3.7%
Net New Jobs (000s) 53.1 54.7 48.2 51.4
FHFA Home Price Index 4.9% 4.8% 5.3% n.a.
Zillow Home Sales (nsa) -1.4% -0.1% 1.5% 6.3%
Per Capita Consumer Debt 4.3% 3.5% 3.7% 3.8%
Revenues Through March (exclude COVID-19)
+$165 million over estimate
Note: Figures for 2020.1 for Net New Jobs and Home Sales are for January and February only.Source: U.S. Bureau of Economic Analysis, U.S. Bureau of Labor Statistics, FHFA, NY Federal Reserve Board and Zillow.

Pandemic Timeline and Mitigation Efforts
June 22, 2020 2
February 29 First U.S. death from COVID-19 declared
March 6 First PA COVID-19 infection identified
March 13 President declares national emergency
March 16 PA schools closed for two weeks
March 18 First PA death from COVID-19 declared
March 23 PA non-life-sustaining businesses closed
April 1 Stay-at-home orders all counties
April 9 PA schools closed remainder of year
May 8-29 57 counties enter yellow status (partial reopen)
June 5 All counties in yellow status
End of June All counties in green status (except Lebanon)

COVID-19 Moves Economy into Recession
June 22, 2020 3
COVID-19 2018 2019 2020 2021
Real GDP 2.6% 2.3% -5.6% 5.5%
Wages-Salaries 4.3% 4.2% -3.2% 5.0%
Net Job Gains (000s) 68.9 55.5 -453.0 309.7
Philadelphia CPI-U 1.3% 2.0% 0.5% 1.5%
Great Recession 2007 2008 2009 2010
Real GDP 3.4% 1.9% -2.9% 2.8%
Wages-Salaries 5.3% 2.7% -2.3% 2.0%
Net Job Gains (000s) 42.1 1.4 -184.1 5.1
Philadelphia CPI-U 2.2% 3.4% -0.4% 2.0%
Source: U.S. Bureau of Labor Statistics, U.S. Bureau of Economic Analysis. Forecasts by IFO.

National Forecasts Are More Pessimistic
June 22, 2020 4
Annual Growth Rate or Change
IHS Markit 2019 2020 2021 2022
Real GDP 2.3% -7.3% 5.1% 4.6%
Wages-Salaries 4.6% -9.0% 7.7% 7.5%
Unemployment Rate 3.7 14.9 13.5 9.5
Net Payroll Jobs 1.4% -13.5% 4.3% 7.3%
Congressional Budget Office 2019 2020 2021 2022
Real GDP 2.3% -6.0% 4.4% n.a.
Wages-Salaries 4.6% -6.1% 4.9% n.a.
Unemployment Rate 3.7 11.5 9.3 n.a.
Net Payroll Jobs 1.4% -9.4% 3.0% n.a.
Note: IHS Markit forecast released May 12. CBO released May 19.

Large Injection of Federal Monies
June 22, 2020 5
Estimate Estimate
Individual Provisions Federal Grants
Economic Impact Payments $10.8 State Governments $5.9
State UC Payments 6.0 Local Governments 2.4
Federal UC Payments 14.7 Healthcare Providers 2.1
SNAP 0.4 Educational Institutions 0.5
Business Provisions
Business Tax Cuts 4.6
Delay Employer Payroll Taxes 10.8 Total $78.7
PPP Forgivable Loans 20.5
Note: Billions of dollars. Federal UC Payments include FPUC, PUA and 13 week extension.

FPUC – Federal Pandemic UC ($600/wk bonus)
PA weekly UC benefits range from $68 to $572 Average benefit is $330 | ~50% wage replacement rate for most
Extra $600 per week up to 16 weeks, regardless of prior earnings
$12/hr wage earner moves from ~50% to ~175% replacement rate
High share of claimants are low-wage or part-time Replacement rate for them is far above 100%
Same holds for Pandemic Unemployment Assistance (PUA) filers
Estimate assumes 1.57 million PA residents receive FPUC Average of 13 weeks | $11.5 billion | ~$700 million per week
What happens when payments end in July?
June 22, 2020 6
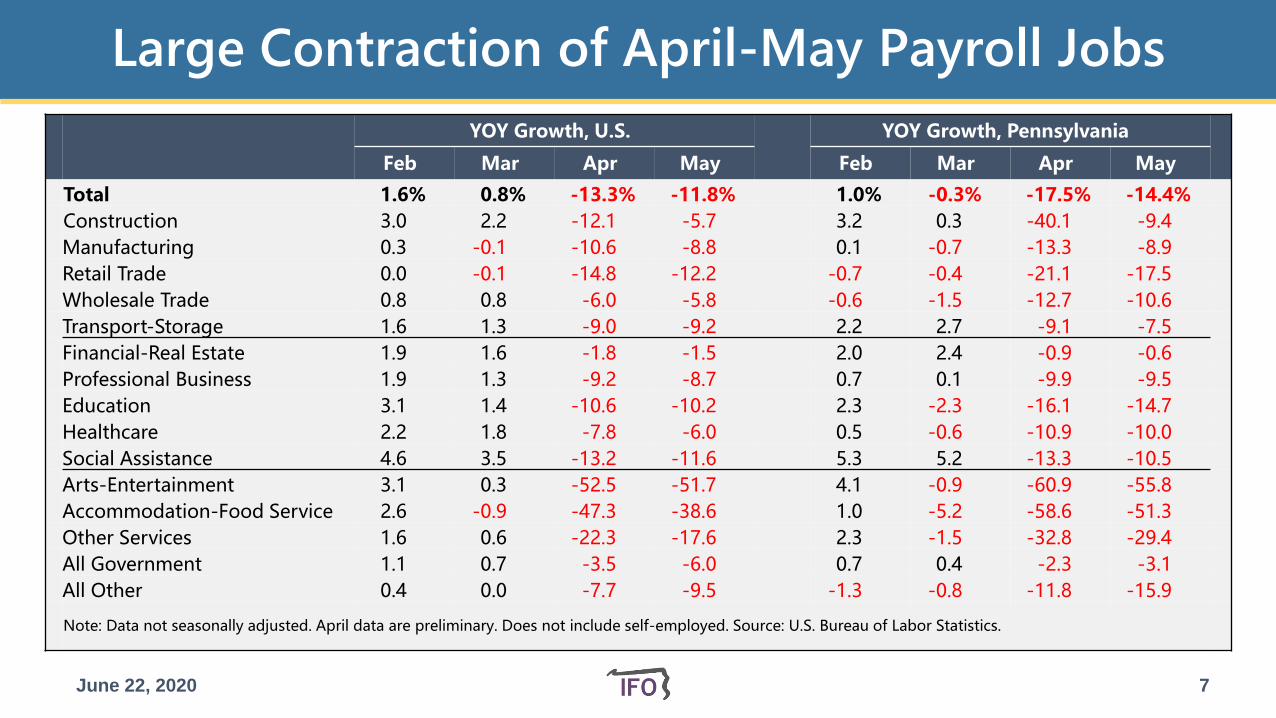
Large Contraction of April-May Payroll Jobs
June 22, 2020 7
YOY Growth, U.S. YOY Growth, Pennsylvania
Feb Mar Apr May Feb Mar Apr May
Total 1.6% 0.8% -13.3% -11.8% 1.0% -0.3% -17.5% -14.4%
Construction 3.0 2.2 -12.1 -5.7 3.2 0.3 -40.1 -9.4
Manufacturing 0.3 -0.1 -10.6 -8.8 0.1 -0.7 -13.3 -8.9
Retail Trade 0.0 -0.1 -14.8 -12.2 -0.7 -0.4 -21.1 -17.5
Wholesale Trade 0.8 0.8 -6.0 -5.8 -0.6 -1.5 -12.7 -10.6
Transport-Storage 1.6 1.3 -9.0 -9.2 2.2 2.7 -9.1 -7.5
Financial-Real Estate 1.9 1.6 -1.8 -1.5 2.0 2.4 -0.9 -0.6
Professional Business 1.9 1.3 -9.2 -8.7 0.7 0.1 -9.9 -9.5
Education 3.1 1.4 -10.6 -10.2 2.3 -2.3 -16.1 -14.7
Healthcare 2.2 1.8 -7.8 -6.0 0.5 -0.6 -10.9 -10.0
Social Assistance 4.6 3.5 -13.2 -11.6 5.3 5.2 -13.3 -10.5
Arts-Entertainment 3.1 0.3 -52.5 -51.7 4.1 -0.9 -60.9 -55.8
Accommodation-Food Service 2.6 -0.9 -47.3 -38.6 1.0 -5.2 -58.6 -51.3
Other Services 1.6 0.6 -22.3 -17.6 2.3 -1.5 -32.8 -29.4
All Government 1.1 0.7 -3.5 -6.0 0.7 0.4 -2.3 -3.1
All Other 0.4 0.0 -7.7 -9.5 -1.3 -0.8 -11.8 -15.9
Note: Data not seasonally adjusted. April data are preliminary. Does not include self-employed. Source: U.S. Bureau of Labor Statistics.

Some Subsectors Hit Hard, but a Few Gain
June 22, 2020 8
YOY Growth, U.S. YOY Growth, Pennsylvania
Feb Mar Apr May Feb Mar Apr May
Full-Service Restaurants 2.5% -5.3% -65.6% n.a. -1.1% -8.1% -79.5% -65.2%
Amusements-Gaming 3.9 0.0 -56.4 -54.8% 1.5 -1.3 -70.7 -59.1
Personal Care-Laundry 1.2 -3.1 -54.8 -43.0 3.0 -4.2 -64.7 -56.5
Dentist Offices 1.3 -2.6 -55.1 -29.8 n.a. n.a. n.a. n.a.
Child Care 3.1 -0.4 -33.1 -29.0 2.5 0.8 -43.5 -28.3
Employment Services -0.1 -1.1 -27.4 -26.0 -7.0 -10.3 -26.1 -22.5
Couriers and Messengers 6.4% 5.8% 5.3% 8.3% 7.9% 6.7% 3.7% 6.7%
Federal Government 1.9 2.6 2.1 1.6 1.4 2.5 2.5 2.1
Note: Data are not seasonally adjusted. May data are preliminary. Does not include self-employed.Source: U.S. Bureau of Labor Statistics, Current Employment Statistics and State and Area Employment.

Annual Change in Payroll Jobs (000s)
June 22, 2020 9
2018 2019 2020
Construction 6.6 5.2 -48.0
Manufacturing 8.0 4.1 -33.9
Wholesale-Retail -2.6 -10.3 -70.1
Transport-Storage 8.7 8.8 -8.2
Administration-Waste Management 2.4 2.9 -29.3
Education 1.9 0.3 -12.6
Healthcare 13.6 6.9 -26.4
Social Assistance 13.8 14.2 -6.2
Arts and Entertainment 1.0 3.0 -31.6
Accommodation-Food Service 4.2 3.3 -134.2
All Government -0.5 3.7 -15.7
All Other 11.7 13.3 -36.9
Total 68.9 55.5 -453.0
Note: Excludes self-employed and independent contractors. Source: U.S. Bureau of Labor Statistics. 2020 is a forecast by IFO.

Profits and Capital Income Contract
June 22, 2020 10
Great Recession COVID-19 Pandemic
2007 2008 2009 2010 2019 2020 2021
Net Profits (Pass Through) 15% 8% -10% 8% 5% -15% 6%
Capital Gains 26% -40% -39% 73% 8% -20% 13%
Dividends 35% -30% -35% 14% 8% -20% 13%
U.S. Corporate Profits -10% -11% -14% 37% -3% -20% 13%
S&P 500 Index 5% -39% 24% 10% 20% -2% n.a.
Note: Net Profits include income reported by independent contractors, sole proprietors, partners and S corporation shareholders on the state taxreturn. Capital Gains and Dividends are growth rates from state tax return. Corporate profits include all C and S corporation profits and excludeforeign profits and financial firms. S&P 500 Index uses December average or June 2020 average.

Forecast Assumes Quick Recovery from 2020 Q2
June 22, 2020 11
Change or Growth from Prior Year
2020.1 2020.2 2020.3 2020.4 2021.1
Wages-Salaries 3.7% -9.8% -4.8% -1.9% -0.9%
Payroll Jobs (000s) 30 -950 -555 -295 -170
Note: Payroll Jobs exclude independent contractors and self-employed. Job loss includes seasonal workers and those whocannot file for unemployment compensation.Sources: Value for 2020.1 jobs from the U.S. Bureau of Labor Statistics.

Miscellaneous Economic Notes
Programs largely offset lost wage income CY 2020 lost wages ~$26 billion | ~$1 to $2 billion in tip income
Federal and state UC = $20.7 billion | impact payments = $10.8 billion
COVID-19 not directly comparable to Great Recession No obvious bubble, although stock market appears overvalued
Consumers not overextended | strong housing and labor market
Some key forecast assumptions Consumers largely revert to old spending patterns
No second outbreak that causes business closures | no vaccine
Schools reopen in fall
June 22, 2020 12

FY 2019-20 Revised Estimate
June 22, 2020 13
IFOOfficial
Non-COVIDImpact Shifts
COVID-19 Impact
IFORevised
General Fund $35,518 $235 -$1,995 -$1,745 $32,013
Corp. Net Income 3,458 -27 -350 -270 2,811
Gross Receipts 1,211 -95 0 0 1,116
Sales - Non-Motor 9,996 93 -135 -645 9,309
Sales - Motor Vehicle 1,548 13 0 -245 1,316
PIT - Withholding 10,793 24 0 -310 10,506
PIT - Other 3,751 40 -1,415 -120 2,256
All Tobacco 1,083 -9 0 -25 1,049
All Other Tax 3,057 123 -70 -125 2,985
All Non-Tax 622 73 -25 -5 665
Note: Dollar amounts are in millions. PIT is personal income tax.

Personal Income Tax Notes
Withholding performs much better than expected
For April and May, YOY withholding growth rate is ~-7.0%
But payroll employment down ~17% for April
Due to types of workers affected: lower wage and part-time
Quarterly and annual payments delayed to July 15
March and June quarterly, April 15 final payment | ~$1.4 billion shift
Taxpayers can delay employer share of federal payroll taxes
Delay 50% to no later than Dec 2021 and 50% no later than Dec 2022
IFO estimates ~$10.8 billion shifted
June 22, 2020 14

Sales and Use Tax Notes
Sales tax holds up well despite massive job loss Injection of federal monies to state economy Evidence that consumers are shifting spending patterns No dining out | more home improvement, internet shopping, fast food
May revenues provide some optimism Non-motor vehicle collections down ~20% Motor vehicle revenues pick up | April -89%, May -62% YOY Anticipate pent-up demand for personal care services, cars, etc.
Can consumers maintain pace of spending? $600 weekly FPUC payments end in July Mortgage and rent payments in arrears | how bad is it?
June 22, 2020 15

Initial Revenue Estimate FY 2020-21
June 22, 2020 16
Amount Shifts Adjusted Growth Adjusted
General Fund $35,874 -$1,995 $33,879 0.4% -0.7%
Corp. Net Income 3,188 -350 2,838 -10.2
Gross Receipts 1,005 0 1,005 -9.9
Sales - Non-Motor 9,893 -135 9,758 3.3 2.1
Sales - Motor Vehicle 1,559 0 1,559 18.5
PIT - Withholding 10,767 0 10,767 2.5
PIT - Other 4,612 -1,415 3,197 -12.9
All Tobacco 1,008 0 1,008 -3.9
All Other Tax 3,175 -70 3,105 1.6
All Non-Tax 667 -25 642 -7.0
Note: Dollar amounts are in millions. PIT is personal income tax. Adjusted growth rate controls for the $115 million transfer fromnon-motor sales tax to Tobacco Settlement Fund for FY 2019-20.

Lottery Sales Growth Tanks in April, Rebounds in May
June 22, 2020 17
January February March April May
Instants -4% 8% -2% -11% 30%
Numbers -3 3 -9 -9 9
In-State Lotto 7 13 -33 -33 45
Multistate Lotto 49 -27 -74 -30 -27
iLottery 62 73 61 113 109
Keno/Xpress Sports 14 20 -10 -37 -27
Total 0 5 -17 -14 21
Note: Growth rates for May are based on weekly Lottery sales reports.

Lottery Sales and Revenues
June 22, 2020 18
Amounts Growth Rate
18-19 19-20 20-21 18-19 19-20 20-21
Total Sales $4,885 $5,131 $5,435 15.7% 5.0% 5.9%
Instants 3,093 3,238 3,315 5.2 4.7 2.4
Multistate Lotto 507 269 423 19.4 -47.0 57.5
In-State Lotto 272 253 255 8.6 -7.0 0.7
Numbers 575 569 556 1.3 -1.1 -2.3
iLottery 381 740 822 n.a. 93.9 11.2
All Other 57 63 64 193.5 10.7 1.7
Net Revenues 1,931 2,022 1,863 7.9 4.7 -7.9
Note: Millions of dollars.

Motor License Fund
COVID-19 reduces FY 19-20 revenues by ~$105 million
Full-month closure reduces gasoline consumption by ~40%
Diesel more moderately affected
Licenses and fees largely unaffected
Expiration dates for March, April and May extended to June 30
Some shift of revenue to next fiscal year (~$65 million)
FY 20-21 projection is flat from FY 19-20
Assumes gasoline consumption falls by ~10% from historical levels
More telecommuting, less travel, fewer social events
June 22, 2020 19

Wrap Up and Looking Forward
Initial jobs impact from virus/mitigation largely known However, do not know shape or pace of recovery
Overall, revenues are holding up better than expected
Is economy in a temporary bubble? Extra $600/week ends in mid- to late-July | windfall for some workers
PPP loans/grants buys limited time for businesses
One-time purchases to enable telecommuting
Lack of seasonal sales still to be absorbed going forward
Permanent hit to the economy, lower productive capacity
Non-financial wealth eliminated | labor force shrinks
June 22, 2020 20
