fy 2020 annual performance report (apr) - cpsc.gov
TRANSCRIPT

U .S . Consumer Product Safety Commiss ion
Fiscal Year 2020 Annual Performance Report
January 19, 2021
CPSC Stands for Safety

An electronic version of this document is available at:
www.cpsc.gov/about-cpsc/agency-reports/performance-and-budget

About this Report This document is the U.S. Consumer Product Safety Commission’s (CPSC’s) FY 2020 Annual Performance Report (APR). An electronic version of this report is available on the agency’s website at: www.cpsc.gov/about-cpsc/agency-reports/performance-and-budget.
The FY 2020 APR satisfies the annual performance reporting requirements of the GPRA Modernization Act of 2010 (GPRAMA), as well as Office of Management and Budget (OMB) Circular No. A-11 (Preparation, Submission, and Execution of the Budget).
The FY 2020 APR provides information on results achieved by CPSC programs during FY 2020 and progress made toward performance targets established for key performance measures. The performance measures indicate progress toward Strategic Goals and Strategic Objectives contained in the CPSC’s Strategic Plan. Highlights of performance, in addition to challenges, are presented.
Overview of the Agency The U.S. Consumer Product Safety Commission (CPSC) is an independent federal regulatory agency, created in 1972, by the Consumer Product Safety Act (CPSA). In addition to the CPSA, as amended by the Consumer Product Safety Improvement Act of 2008 (CPSIA), and Public Law No. 112-28, the CPSC administers other laws, such as the Federal Hazardous Substances Act, the Flammable Fabrics Act, the Poison Prevention Packaging Act, the Refrigerator Safety Act, the Virginia Graeme Baker Pool and Spa Safety Act, the Child Safety Protection Act, the Labeling of Hazardous Art Materials Act, the Children’s Gasoline Burn Prevention Act, the Drywall Safety Act of 2012, and the Child Nicotine Poisoning Prevention Act.
The CPSC has jurisdiction over thousands of types of consumer products used in and around the home, in recreation, and in schools, from children’s toys, to portable gas generators and toasters. Although the CPSC’s regulatory purview is quite broad, a number of product categories fall outside the CPSC’s jurisdiction.1
1 Product categories, such as automobiles and boats; alcohol, tobacco, and firearms; foods, drugs, cosmetics, and medical devices; and pesticides, are regulated by other federal agencies.

Message from the Acting Chairman
The U.S. Consumer Product Safety Commission’s FY 2020 Annual Performance Report (APR) is a comprehensive account of performance results achieved by our programs for the period of October 1, 2019 through September 30, 2020. These programs serve the Agency’s mission of “Keeping Consumers Safe” as we strive for “a nation free from unreasonable risks of injury and death associated with consumer products.”
I commend all CPSC staff for their accomplishments and contributions to our mission this past year. Due to the COVID-19 pandemic, our employees began teleworking full-time in March 2020. Once personal protective equipment (PPE) became available, some staff returned to port and lab operations. I am particularly grateful that our employees have adapted well to the challenges of working remotely and safely under the conditions brought about by the pandemic.
I am pleased to confirm that, in FY 2020, the performance data presented in this report are reasonably complete, accurate, and reliable. I look forward to continuing to work with my fellow Commissioners and the CPSC staff in setting Agency priorities and achieving meaningful results in the year ahead.
Robert S. Adler
Acting Chairman
January 19, 2021

Table of Contents
Agency and Mission Information CPSC Organizational Structure..................................................................................................................................................................... 1 CPSC Strategic Plan Summary ..................................................................................................................................................................... 2
Performance Results
Performance Summary: An Overview ..................................................................................................................................................... 4 CPSC Key Performance Measures: FY 2020 Results Summary ............................................................................................ .5 Performance Summary by Strategic Goal Strategic Goal 1: Workforce …………………………………………… .......................................................................................... …………7 Strategic Goal 2: Prevention ……………………………………………......................................................................................... …………9 Strategic Goal 3: Response …………………………………………….......................................................................................... …………12 Strategic Goal 4: Communication …………………………………………… ..........................................................................…………14
Other Information
Agency Priorities & Management Challenges ................................................................................................................................ 16 Cross-Agency Collaborations ..................................................................................................................................................................... 17 Evaluation and Research ................................................................................................................................................................................ 21
Appendices
Appendix A: CPSC Performance: Verification & Validation of Performance Data ............................................ 26
Appendix B: Changes to FY 2020 Performance Measures ................................................................................................. 27
Appendix C: Detailed Information on FY 2020 Performance Measures ................................................................... 29
Appendix D: Acronyms ................................................................................................................................................................................. 56

2 0 2 0 AP R | J a n u a r y 2 0 2 1 A g e n c y a n d M i s s i o n I n f o r m a t i o n
C P S C | P a g e 1
CPSC Organizational Structure
The CPSC is a bipartisan commission that is authorized to consist of five members appointed by the President with the advice and consent of the Senate. The Chairman is the principal executive officer of the Commission, which convenes at meetings that are open to the public. The chart below depicts the CPSC’s organizational structure during the majority of the FY 2020 reporting period of October 1, 2019 through September 30, 2020. Previous Acting Chair Ann Marie Buerkle completed her tenure on October 26, 2019, leaving a vacancy on the Commission. Effective October 1, 2019, at the start of FY 2020, Robert S. Adler assumed the role of Acting Chairman. As of the publication of this document, the Commission has four members.
Commissioner
Peter A. Feldman Commissioner Dana Baiocco
Acting Chairman Robert S. Adler
Commissioner Elliot F. Kaye
Commissioner (vacant)

2 0 2 0 AP R | J a n u a r y 2 0 2 1 A g e n c y a n d M i s s i o n I n f o r m a t i o n
C P S C | P a g e 2
CPSC Strategic Plan Summary
The agency’s Strategic Plan lays out the CPSC’s approach to achieving the mission of keeping consumers safe, with the overarching vision of a nation free from unreasonable risks of injury and death from consumer products. Each of the four Strategic Goals is supported by Strategic Objectives. A suite of performance measures with annual targets is used to monitor progress toward the Strategic Objectives and Strategic Goals.

2 0 2 0 AP R | J a n u a r y 2 0 2 1 P e r f o r m a n c e R e s u l t s
C P S C | P a g e 3
This page intentionally left blank.

2 0 2 0 AP R | J a n u a r y 2 0 2 1 P e r f o r m a n c e R e s u l t s
C P S C | P a g e 4
Performance Summary: An Overview
During FY 2020, the CPSC tracked 25 performance measures—all with established performance targets for FY 2020—to gauge progress toward the agency’s Strategic Goals and Strategic Objectives. The CPSC met performance targets for 18 of the 25 performance measures and did not meet performance targets for five measures. Results were not available for two measures that require information from the Federal Employee Viewpoint Survey (FEVS); those measures will be reported in the CPSC’s next agency-level report after the 2020 FEVS results are made available.
The FY 2020 results for the key performance measures are organized by Strategic Goal (Figure 2) and by CPSC functional component (Figure 3).
Figure 1: A snapshot of the CPSC’s FY 2020 Key Performance Measures
Figure 2 (left): Summary of FY 2020 Results Key Performance Measures by Strategic Goal
Figure 3 (right): Summary of FY 2020 Results
Key Performance Measures by Functional Component

2 0 2 0 AP R | J a n u a r y 2 0 2 1 P e r f o r m a n c e R e s u l t s
C P S C | P a g e 5
CPSC Key Performance Measures: FY 2020 Results Summary
Strategic Goal 1: Workforce Cultivate the most effective consumer product safety workforce
Strategic Objective (SO), Key Performance Measure (KM)
Program Office
Actuals 2020 Target
2016 2017 2018 2019 2020 2020 Target
Target met?
SO 1.1 Enhance effective strategic human capital planning and alignment
2020KM1.1.02 Percentage of full-time equivalents (FTEs) utilized
Human Resources
-- -- 97% 98% 95% 96%
SO 1.2 Foster a culture of continuous development
2020KM1.2.01 Percentage of employees satisfied with opportunities to improve their skills (as reported in the Federal Employee Viewpoint Survey)
-- 72.5% 68.1% 65.8% Not Avail.2 70% N/A
SO 1.3 Attract and recruit a talented and diverse workforce
2020KM1.3.01 Percentage of hiring managers trained on recruitment
-- 56.1% 82.6% 85.5% 89.7% 80%
SO 1.4 Increase employee engagement
2020KM1.4.01 High-performing Federal Workforce - Employee Engagement Index Score
70% 73% 69% 66% Not
Avail.3 70% N/A
Strategic Goal 2: Prevention Prevent hazardous products from reaching consumers
Strategic Objective (SO), Key Performance Measure (KM)
Program Office
Actuals 2020 Target
2016 2017 2018 2019 2020 2020 Target
Target met?
SO 2.1 Improve identification and assessment of hazards to consumers
2020KM2.1.01 Percentage of consumer product-related incident reports warranting follow-up actions
Hazard Identification
-- 25% 26% 23% 20% 25% 2020KM2.1.02 Number of hazard characterization annual reports completed on consumer product-related fatalities, injuries, and/or losses for specific hazards
11 11 10 11 11 11
2020KM2.1.03 Percentage of consumer product-related injury cases correctly captured at NEISS hospitals
91% 92.4% 93% 89.5% 90.6% 90%
SO 2.2 Lead efforts to improve the safety of consumer products before they reach the marketplace
2020KM2.2.01 Number of voluntary standards activities in which CPSC staff actively participates Hazard
Identification
71 76 77 74 78 78 2020KM2.2.02 Number of candidates for rulemaking prepared for Commission consideration
10 18 19 14 144 12 2020KM2.2.07 Percentage of firms that are engaged with timely establishment inspection after being identified as a repeat offender
Import Surveillance -- -- 73% 90% 83% 75%
2020KM2.2.08 Recalls per Billion Dollars in Consumer Product Imports for Top 50 Import Sources Countries or Administrative Areas
International Programs -- -- -- -- 0.21 < 0.33
SO 2.3 Increase capability to identify and stop imported hazardous consumer products
2020KM2.3.01 Percentage of consumer product imports, identified as high-risk, examined at import
Import Surveillance
-- 88.5% 89% 86% 80% 80% 2020KM2.3.02 Percentage of import shipments processed through the Risk Assessment Methodology (RAM) system that are cleared within 1 business day
99.8% 99.8% 99.8% 99.8% 99.9% 99%
2020KM2.3.04 Number of import examinations completed 36,523 38,726 41,117 39,010 18,561 32,000
2 The U.S. Office of Personnel Management (OPM) postponed its launch of the annual 2020 FEVS (actual survey period: September 24, 2020 through November 5, 2020). Results for the two measures are not available as of the publication of this document. 3 Ibid. 4 In FY 2020, CPSC staff prepared 14 rulemaking packages for Commission consideration—7 were from the original 12 planned candidates for rulemaking, and the other 7 were in response to emerging requirements. The remaining 5 planned rulemaking candidates that were not completed in FY 2020 are as follows, of which 4 were deferred to FY 2021 due to COVID-19: FR-Adjudicative Rules (completed as an SNPR, instead of planned FR); NPR-Clothing Storage Units Tip-Over (deferred); FR-Freedom of Information Act Fee Update (deferred); DFR-Lab Accreditation IBR Update (deferred); and FR-Table Saws (deferred).

2 0 2 0 AP R | J a n u a r y 2 0 2 1 P e r f o r m a n c e R e s u l t s
C P S C | P a g e 6
Strategic Goal 3: Response Respond quickly to address hazardous consumer products both in the marketplace and with consumers
Strategic Objective (SO), Key Performance Measure (KM)
Program Office
Actuals 2020 Target 2016 2017 2018 2019 2020 2020
Target Target met?
SO 3.1 Rapidly identify hazardous consumer products for enforcement action
2020KM3.1.01 Percentage of cases for which a preliminary determination is made within 85 business days of the case opening
Compliance
-- 74% 75% 12.5% 83.3% 65% 2020KM3.1.02 Percentage of cases for which a compliance determination of a regulatory violation is made within 35 business days of sample collection (excludes fireworks)
-- 87% 88.8% 85.1% 89.2%5 85%
2020KM3.1.03 Percentage of fireworks cases for which a compliance determination of a regulatory violation is made within 70 business days of sample collection
-- -- -- -- 42.9% 85%
SO 3.2 Minimize further exposure to hazardous consumer products
2020KM3.2.02 Percentage of cases for which a firm is notified of a regulatory violation within 40 business days from sample collection (excludes fireworks)
Compliance
-- 86% 87.2% 85.5% 85.6%6 85%
2020KM3.2.03 Percentage of Fast-Track cases with corrective actions initiated within 20 business days of case opening
99.1% 98% 95.9% 97.4% 96.5% 90% 2020KM3.2.04 Percentage of cases for which a corrective action is accepted within 90 business days of preliminary determination
-- -- 92.7% 76.9% 71.4% 60%
2020KM3.2.05 Percentage of fireworks cases for which a firm is notified of a regulatory violation within 75 business days from sample collection
-- -- -- -- 42.9% 85%
SO 3.3 Improve consumer response to consumer product recalls
2020KM3.3.01 Recall effectiveness rate for all consumer product recalls
Compliance -- 41% 17.4% 21.4% 32.6% 25%
Strategic Goal 4: Communication Communicate useful information quickly and effectively to better inform decisions
Strategic Objective (SO), Key Performance Measure (KM)
Program Office
Actuals 2020 Target 2016 2017 2018 2019 2020 2020
Target Target met?
SO 4.1 Improve usefulness and availability of consumer product safety information
2020KM4.1.02 Number of engagements with CPSC safety messaging on social media channels by stakeholders (in thousands)
Communications -- 285 831 1,468 12,095 840
SO 4.2 Increase dissemination of useful consumer product safety information
2020KM4.2.04 Number of national media placements of CPSC stories
Communications
-- -- -- -- 12 6
2020KM4.2.05 Percentage of recall press releases issued in 22 business days or less from first draft
-- -- -- -- 63% 60%
SO 4.3 Increase and enhance collaboration with stakeholders
(None)7
5 Fireworks cases were disaggregated from this measure in FY 2020 and captured by a new measure—KM 3.1.03. 6 Fireworks cases were disaggregated from this measure in FY 2020 and captured by a new measure—KM 3.2.05. 7 The CPSC’s FY 2020 Request to Congress (published March 2019) included one key measure (KM 4.3.01) under Strategic Objective (SO) 4.3. In October 2019, the Commission voted to discontinue KM 4.3.01 in FY 2020. As such, there were no key measures under SO 4.3 for FY 2020.

2 0 2 0 AP R | J a n u a r y 2 0 2 1 P e r f o r m a n c e R e s u l t s
C P S C | P a g e 7
Performance Summary by Strategic Goal
Strategic Goal 1: Workforce Cultivate the most effective consumer product safety workforce
Challenges Having a highly trained, diverse, and engaged workforce is critical to meeting the dynamic challenges of the consumer product safety landscape and to achieving the CPSC’s life-saving mission. Agency staff’s knowledge about product safety, commitment to the agency’s mission, and “can-do” attitude make achieving the CPSC mission possible. The CPSC’s key Workforce challenges are:
• Having a workforce with the knowledge, skills, and abilities to meet new, innovative, and emerging product safety challenges;
• Aligning personnel resources to agency priorities; • Maintaining a global presence to address global marketplace issues; • Increasing employee engagement; • Strengthening knowledge transfer through employee cross-training,
and succession planning; and • Having adequate resources to keep pace with the evolving
marketplace and emerging hazards. Strategies
The CPSC’s approach to cultivating an effective workforce involves enhancing human capital planning and alignment, increasing opportunities for professional development, and improving recruitment strategies to attract talented, diverse, and committed staff. The strategy also emphasizes increasing employee engagement by promoting and rewarding staff innovation and creativity, increasing managers’ commitment to fostering employee engagement in the workplace, and promoting a healthy work-life balance.
Table 1
Strategic Objective (SO) / Key Performance Measure (KM) Actuals / Trend line 2020 Target
SO 1.1 Enhance effective strategic human capital planning and alignment
2020KM1.1.02 Percentage of full-time equivalents (FTEs) utilized
2016 2017 2018 2019 2020 2020 Target
Target met?
-- --
97% 98% 95%
96%
SO 1.2 Foster a culture of continuous development
2020KM1.2.01 Percentage of employees satisfied with opportunities to improve their skills (as reported in the Federal Employee Viewpoint Survey)
2016 2017 2018 2019 2020 2020 Target
Target met?
-- 72.5% 68.1% 65.8%
Not Avail.8 70% N/A
8 The U.S. Office of Personnel Management (OPM) postponed its launch of the annual 2020 FEVS (actual survey period: September 24, 2020 through November 5, 2020). Results for the two measures are not available as of the publication of this document.
Figure 4: A snapshot of Strategic Goal 1 performance measures (4 total)

2 0 2 0 AP R | J a n u a r y 2 0 2 1 P e r f o r m a n c e R e s u l t s
C P S C | P a g e 8
Table 1 (continued)
Strategic Objective (SO) / Key Performance Measure (KM) Actuals / Trend line 2020 Target
SO 1.3 Attract and recruit a talented and diverse workforce
2020KM1.3.01 Percentage of hiring managers trained on recruitment
2016 2017 2018 2019 2020 2020 Target
Target met?
--
56.1% 82.6% 85.5% 89.7%
80%
SO 1.4 Increase employee engagement
2020KM1.4.01 High-performing Federal Workforce - Employee Engagement Index Score
2016 2017 2018 2019 2020 2020 Target
Target met?
70% 73% 69% 66% Not
Avail.9 70% N/A
FY 2020 Results
The CPSC exceeded FY 2020 targets for one of the four key performance measures under Strategic Goal 1. Selected FY 2020 achievements under Strategic Goal 1 include:
• Trained more than 89 percent of hiring managers on the recruitment process to attract and recruit a talented, diverse, and highly effective workforce;
• Trained 100 percent of managers on effective performance management to help them retain the best talent, engage and reward top performers, and properly address poor performance;
• Kicked off initiatives to increase employee engagement. The “Integrating New Employees to CPSC” program consists of the Chairman hosting monthly Meet & Greets with new employees and a CPSC 101 presentation during onboarding. The new agency newsletter and the program, What’s On Your Mind? are new communication tools for employees and agency leadership. The program provides a mechanism for employees to ask questions anonymously, offer suggestions, and provide feedback. Submissions and management responses are then shared with all employees on the agency’s intranet site.
The agency did not meet FY 2020 targets for one of the four key performance measures under Strategic Goal 1:
o Key Measure 1.1.02—Percentage of full-time equivalents (FTEs) utilized: The CPSC did not meet the target because the COVID-19 pandemic impacted recruiting, interviewing, and onboarding. The agency mitigated the issue by developing new hiring and onboarding procedures for CPSC’s virtual workplace, falling short of the annual target by only 1 percent.
FY 2020 results were not available for two of the four key measures under Strategic Goal 1. Results for these measures require information from the Federal Employee Viewpoint Survey (FEVS) and will be reported in the CPSC’s next agency-level report after the 2020 FEVS results are made available:
o Key Measure 1.2.01—Percentage of employees satisfied with opportunities to improve their skills (as reported in the Federal Employee Viewpoint Survey)
o Key Measure 1.4.01—High-Performing Federal Workforce - Employee Engagement Index Score
Additional analysis and explanation for each performance measure is included in Appendix C.
9 Ibid.

2 0 2 0 AP R | J a n u a r y 2 0 2 1 P e r f o r m a n c e R e s u l t s
C P S C | P a g e 9
Strategic Goal 2: Prevention Prevent hazardous products from reaching consumers Challenges The CPSC is charged with protecting the public from unreasonable risks of injury and death from a vast array of consumer products supplied through expanding global markets. Efforts to increase manufacturing of safe consumer products, combined with improved mechanisms to identify hazardous products before they enter the marketplace, are the most effective ways to prevent hazardous products from reaching consumers. The CPSC’s key challenges to Prevention are:
• Providing surveillance for the myriad consumer products imported and domestically manufactured under the CPSC’s jurisdiction;
• Advancing data analysis and research capabilities to identify existing and potential emerging consumer product hazards that pose the greatest risks;
• Keeping pace with evolving injury data collection, manufacturer-to-consumer supply chain, and technology associated with consumer products;
• Working with affected stakeholders to address product hazards and product hazards resulting from new technologies (e.g., Internet of Things);
• Helping develop voluntary standards and adopting mandatory regulations; and • Identifying, researching, and informing the public about chemical or chronic hazards in consumer
products.
Strategies The CPSC uses several means to try to prevent injury or harm from consumer products by: (1) working at the national and international level to help ensure that hazards are appropriately addressed by voluntary standards or mandatory regulations; (2) providing technical information to industry to support voluntary standards development; and (3) allocating inspection, surveillance, and enforcement resources effectively to identify and remove hazardous products from the marketplace.
Table 2
Strategic Objective (SO) / Key Performance Measure (KM) Actuals / Trend line 2020 Target
SO 2.1 Improve identification and assessment of hazards to consumers
2020KM2.1.01 Percentage of consumer product-related incident reports warranting follow-up actions
2016 2017 2018 2019 2020 2020 Target
Target met?
--
25% 26% 23% 20%
25%
2020KM2.1.02 Number of hazard characterization annual reports completed on consumer product-related fatalities, injuries, and/or losses for specific hazards
2016 2017 2018 2019 2020 2020 Target
Target met?
11 11 10 11 11
11
Figure 5: A snapshot of Strategic Goal 2 performance measures (10 total)

2 0 2 0 AP R | J a n u a r y 2 0 2 1 P e r f o r m a n c e R e s u l t s
C P S C | P a g e 1 0
Strategic Objective (SO) / Key Performance Measure (KM) Actuals / Trend line 2020 Target
SO 2.1 (continued)
2020KM2.1.03 Percentage of consumer product-related injury cases correctly captured at NEISS hospitals
2016 2017 2018 2019 2020 2020 Target
Target met?
91% 92.4% 93% 89.5% 90.6% 90%
SO 2.2 Lead efforts to improve the safety of consumer products before they reach the marketplace
2020KM2.2.01 Number of voluntary standards activities in which CPSC staff actively participates
2016 2017 2018 2019 2020 2020 Target
Target met?
71 76 77 74 78
78
2020KM2.2.02 Number of candidates for rulemaking prepared for Commission consideration
2016 2017 2018 2019 2020 2020 Target
Target met?
10 18 19 14 1410
12
2020KM2.2.07 Percentage of firms that are engaged with timely establishment inspection after being identified as a repeat offender
2016 2017 2018 2019 2020 2020 Target
Target met?
-- --
73% 90% 83%
75%
2020KM2.2.08 Recalls per Billion Dollars in Consumer Product Imports for Top 50 Import Sources Countries or Administrative Areas
2016 2017 2018 2019 2020 2020 Target
Target met?
-- -- -- -- 0.21 < 0.33
SO 2.3 Increase capability to identify and stop imported hazardous consumer products
2020KM2.3.01 Percentage of consumer product imports, identified as high-risk, examined at import
2016 2017 2018 2019 2020 2020 Target
Target met?
--
88.5% 89% 86% 80%
80%
2020KM2.3.02 Percentage of import shipments processed through the Risk Assessment Methodology (RAM) system that are cleared within 1 business day
2016 2017 2018 2019 2020 2020 Target
Target met?
99.8% 99.8% 99.8% 99.8% 99.9%
99%
2020KM2.3.04 Number of import examinations completed
2016 2017 2018 2019 2020 2020 Target
Target met?
36,523 38,726 41,117 39,010 18,561
32,000
10 In FY 2020, CPSC staff prepared 14 rulemaking packages for Commission consideration—7 were from the original 12 planned candidates for rulemaking, and the other 7 were in response to emerging requirements. The remaining 5 planned rulemaking candidates that were not completed in FY 2020 are as follows, of which 4 were deferred to FY 2021 due to COVID-19: FR-Adjudicative Rules (completed as an SNPR, instead of planned FR); NPR-Clothing Storage Units Tip-Over (deferred); FR-Freedom of Information Act Fee Update (deferred); DFR-Lab Accreditation IBR Update (deferred); and FR-Table Saws (deferred).

2 0 2 0 AP R | J a n u a r y 2 0 2 1 P e r f o r m a n c e R e s u l t s
C P S C | P a g e 1 1
FY 2020 Results
The CPSC exceeded targets for eight of the 10 key performance measures under Strategic Goal 2. Selected FY 2020 achievements under Strategic Goal 2 include:
• To address potential emerging hazards, the CPSC established and filled new positions: a Chief Technologist—focused on emerging artificial intelligence (AI) and machine learning (ML) technologies in consumer products—and a Chief Analytics Officer—focused on how AI and ML can improve CPSC’s data analysis. For the possible emerging hazard from products making use of the Internet of Things11 (IoT), the CPSC developed a plan to establish the capability for testing software embedded in consumer products, including connected products.
• CPSC conducted an e-Commerce Assessment to forecast e-Commerce trends, understand CPSC’s current capabilities relative to e-Commerce, and identify other stakeholder practices. Results of the Assessment provided the agency with a foundational understanding that sets the stage for CPSC’s long-term planning to addressing e-Commerce challenges.
• CPSC actively participated in 78 voluntary standards activities, collaborating with industry leaders, consumer advocates, and other stakeholders to improve consensus voluntary standards across a wide range of consumer products.
• The agency developed a new “Online Clearinghouse” to provide stakeholders with self-service, open access to CPSC incident data.
• CPSC participated as vice-chair of the Organisation for Economic Cooperation and Development’s (OECD) Working Party on Consumer Product Safety (WPCPS), which completed a comprehensive set of best practices to improve consumer product safety, replacing six OECD Legal Instruments from the 1970s and 1980s. The document emphasizes the importance of good data, communication between governments and businesses, and attention to emerging issues such as e-Commerce, IoT, AI, holiday lights, mattresses, and toys.12
The agency did not meet FY 2020 targets for two of the 10 key performance measures under Strategic Goal 2:
o Key Measure 2.1.01—Percentage of consumer product-related incident reports warranting follow-up actions: The CPSC did not meet the target because most of the data received by the CPSC through incident reports are not actionable, warranting no follow-up actions. Starting in FY 2021, this measure was discontinued—the measure did not add much utility to CPSC’s ability to improve the identification and assessment of hazards to consumers.
o Key Measure 2.3.04—Number of import examinations completed: Due to the COVID-19 pandemic, all CPSC employees began teleworking full-time in March 2020, which continued through nearly the remainder of the fiscal year. During this period, import examinations were conducted remotely by CPSC’s port investigators through collaboration with U.S Customs and Border Protection (CBP) officers, a process that permitted only certain product types to be screened. As a result, the agency was unable to meet its FY 2020 target for this measure.
Additional analysis and explanation for each performance measure is included in Appendix C.
11 Internet of Things (IoT), as it relates to consumer products, refers to an environment in which consumer products are connected to the Internet or other devices/products that are connected to the Internet. This type of connectivity is capable of introducing potential safety issues/hazards. The growth of IoT-related products is a challenge for the CPSC and its stakeholders. 12 To view the document, please visit https://legalinstruments.oecd.org/en/instruments/OECD-LEGAL-0459. For definitions of “OECD Legal Instruments,” please visit: www.oecd.org/legal/legal-instruments.htm.

2 0 2 0 AP R | J a n u a r y 2 0 2 1 P e r f o r m a n c e R e s u l t s
C P S C | P a g e 1 2
Strategic Goal 3: Response Respond quickly to address hazardous consumer products both in the marketplace and with consumers
Challenges The CPSC learns about potential consumer product hazards from many sources, including incident reports, consumer complaints, the agency’s Hotline (1-800-638-2772), www.SaferProducts.gov, Internet reports, and company reports. Additionally, field staff investigates reports of incidents and injuries; conducts inspections of manufacturers, importers, and retailers; and identifies potential regulatory violations and product hazards. When potential product defects are identified, the CPSC must act quickly to address the most hazardous consumer products that have made their way into the marketplace or into the hands of consumers. The CPSC’s key Response challenges are:
• Addressing trends in retailing and e-Commerce, such as the prevalence of online sellers or other direct manufacturer-to-consumer marketing, as well as sales through third party platform providers;
• Working within a global supply chain, which creates complex monitoring challenges; • Collecting, integrating, and analyzing data to identify high-risk hazards for appropriate action; • Advancing agency data-sharing through use of an integrated, enterprise-wide approach; and • Improving the monitoring and effectiveness of consumer product recalls.
Strategies The CPSC’s strategy involves improving the effectiveness of the procedures used to process and analyze incoming product hazard-related data, and aligning resources so that the agency can act upon the information and quickly remove potentially hazardous products from the marketplace. The strategy also involves improving the recall monitoring process and working with industry to increase consumer awareness of product recalls as they occur. To achieve this strategic goal, the CPSC works toward improving consumer response to consumer product recalls. The CPSC works with consumers, recalling firms, retailers, and other interested parties to reach consumers affected by recalls. The agency works to improve the effectiveness of product recalls by expanding the CPSC’s use of social media, urging
recalling firms to use social media to broaden the notice of recalls, and conducting consumer focus group research on why and when consumers respond to recalls, among other techniques.
Table 3
Strategic Objective (SO) / Key Performance Measure (KM) Actuals / Trend line 2020 Target
SO 3.1 Rapidly identify hazardous consumer products for enforcement action
2020KM3.1.01 Percentage of cases for which a preliminary determination is made within 85 business days of the case opening
2016 2017 2018 2019 2020 2020 Target
Target met?
--
74% 75% 12.5% 83.3%
65%
2020KM3.1.02 Percentage of cases for which a compliance determination of a regulatory violation is made within 35 business days of sample collection (excludes fireworks)
*Fireworks cases were disaggregated from this measure in FY 2020 and captured by a new measure—KM 3.1.03.
2016 2017 2018 2019 2020 2020 Target
Target met?
-- 87% 88.8% 85.1%
89.2%* 85%
2020KM3.1.03 Percentage of cases for which a compliance determination of a regulatory violation is made within 35 business days of sample collection
2016 2017 2018 2019 2020 2020 Target
Target met?
-- -- -- -- 42.9% 85%
Figure 6: A snapshot of Strategic Goal 3 performance measures (8 total)

2 0 2 0 AP R | J a n u a r y 2 0 2 1 P e r f o r m a n c e R e s u l t s
C P S C | P a g e 1 3
Strategic Objective (SO) / Key Performance Measure (KM) Actuals / Trend line 2020 Target
SO 3.2 Minimize further exposure to hazardous consumer products
2020KM3.2.02 Percentage of cases for which a firm is notified of a regulatory violation within 40 business days from sample collection (excludes fireworks)
*Fireworks cases were disaggregated from this measure in FY 2020 and captured by a new measure—KM 3.2.05.
2016 2017 2018 2019 2020 2020 Target
Target met?
-- 86% 87.2% 85.5%
85.6%* 85%
2020KM3.2.03 Percentage of Fast-Track cases with corrective actions initiated within 20 business days of case opening
2016 2017 2018 2019 2020 2020 Target
Target met?
99.1% 98% 95.9% 97.4% 96.5%
90%
2020KM3.2.04 Percentage of cases for which a corrective action is accepted within 90 business days of preliminary determination
2016 2017 2018 2019 2020 2020 Target
Target met?
-- -- 92.7% 76.9% 71.4%
60%
2020KM3.2.05 Percentage of fireworks cases for which a firm is notified of a regulatory violation within 75 business days from sample collection
2016 2017 2018 2019 2020 2020 Target
Target met?
-- -- -- -- 42.9% 85% SO 3.3 Improve consumer response to consumer product recalls
2020KM3.3.01 Recall effectiveness rate for all consumer product recalls
2016 2017 2018 2019 2020 2020 Target
Target met?
--
41% 17.4% 21.4% 32.6%
25%
FY 2020 Results The CPSC exceeded FY 2020 targets for six of the eight key performance measures under Strategic Goal 3. Selected FY 2020 achievements under Strategic Goal 3 include:
• Staff completed 500 establishment inspections of firms for compliance with CPSC’s laws and regulations. • CPSC worked with firms to conduct 240 voluntary recalls, involving approximately 2.1 million units being
removed from the marketplace and the hands of consumers. • Staff contacted approximately 8,900 Internet firms and individuals who were offering for sale banned or
previously recalled consumer products via Internet websites, preventing approximately 18,500 recalled or banned product units from being re-sold.
• CPSC cited 1,706 products for regulatory violations,13 and staff negotiated 183 corrective action plans (CAPs) to address hazardous consumer products, resulting in removal of these hazardous products from the distribution chain.
The agency did not meet FY 2020 targets for two of the eight performance measures under Strategic Goal 3: o Key Measure 3.1.03—Percentage of fireworks cases for which a compliance determination of a regulatory
violation is made within 70 business days of sample collection: This was a new measure in FY 2020; it was established to track only fireworks cases and was disaggregated from its original measure (KM 3.1.02). The CPSC did not meet the target because the COVID-19 pandemic prevented staff from working full-time in the laboratory to perform testing from March 2020 through most of the remainder of the fiscal year. As a result, the number of days between sample collection and a compliance determination based on lab testing results was affected.
o Key Measure 3.2.05—Percentage of fireworks cases for which a firm is notified of a regulatory violation within 75 business days from sample collection: This was a new measure in 2020; it was established to track only fireworks cases and was disaggregated from its original measure (KM 3.2.02). The CPSC did not meet the target because testing of the fireworks cases was delayed during FY 2020 (see explanation under KM 3.1.03 above), impacting the result for this measure.
Additional analysis and explanation for each performance measure is included in Appendix C.
13 This number includes products cited by the Office of Compliance and the Office of Import Surveillance.
Table 3 (continued)

2 0 2 0 AP R | J a n u a r y 2 0 2 1 P e r f o r m a n c e R e s u l t s
C P S C | P a g e 1 4
Strategic Goal 4: Communication Communicate useful information quickly and effectively to better inform decisions
Challenges Consumers, safety advocates, industry, and government regulators need high-quality information about consumer product safety. Consumers need safety information to make more informed decisions for themselves and their families. Safety advocates rely on accurate data to shape their policy recommendations. Industry needs information to stay in compliance with safety requirements. Foreign regulators and state and local government agencies also need high-quality information to establish new safety requirements that advance consumer safety. These diverse audiences have different information needs and respond to different methods of communication. The CPSC’s key Communication challenges are:
• Strengthening the CPSC’s collaboration with all stakeholders to improve communication;
• Updating knowledge management strategies and adopting advanced communication tools and channels to improve consistency, reliability, accessibility, and timeliness of information provided to stakeholders and internally among CPSC staff;
• Improving CPSC messaging and outreach to affected populations, including underserved, low-income, and minority communities and families; and
• Managing the communication about consumer products that pose unreasonable risks of injury and death. Strategies
The CPSC uses a wide array of communication channels and strategies to provide timely, targeted information about consumer product safety to the public, industry, and other stakeholders. The agency disseminates safety messages through workshops and training sessions; listserv messages; press releases; public service announcements and video news releases; newspaper, radio, and TV interviews; and increasingly, social media, including Facebook, Twitter, and blogs, while adhering to disclosure protocols. The CPSC strives to improve the usefulness and availability of safety messages by collecting and analyzing data and designing and applying new and innovative communication tools. Dissemination of more useful and timely
consumer product safety information will result in a stronger agency brand, the ability to communicate in mobile environments, and the ability to explore micro-targeting to reach the most at-risk populations. An additional element of the CPSC’s strategy involves strengthening collaborations with stakeholder groups, including other government agencies and nonprofit organizations. This may include collaboration on information and education campaigns on product safety.
Figure 7: A snapshot of Strategic Goal 4 performance measures (3 total)

2 0 2 0 AP R | J a n u a r y 2 0 2 1 P e r f o r m a n c e R e s u l t s
C P S C | P a g e 1 5
Table 4
Strategic Objective (SO) / Key Performance Measure (KM) Actuals / Trend line 2020 Target
SO 4.1 Improve usefulness and availability of consumer product safety information
2020KM4.1.02 Number of engagements with CPSC safety messaging on social media channels by stakeholders (in thousands)
2016 2017 2018 2019 2020 2020 Target
Target met?
--
285 831 1,468 12,095
840
SO 4.2 Increase dissemination of useful consumer product safety information
2020KM4.2.04 Number of national media placements of CPSC stories
2016 2017 2018 2019 2020 2020 Target
Target met?
-- -- -- -- 12 6
2020KM4.2.05 Percentage of recall press releases issued in 22 business days or less from first draft
2016 2017 2018 2019 2020 2020 Target
Target met?
-- -- -- -- 63% 60%
SO 4.3 Increase and enhance collaboration with stakeholders
(None)
*The CPSC’s FY 2020 Request to Congress (published March 2019) included one key measure (KM 4.3.01) under Strategic Objective (SO) 4.3. In October 2019, the Commission voted to discontinue KM 4.3.01 in FY 2020. As such, there were no key measures under SO 4.3 for FY 2020.
FY 2020 Results
The CPSC exceeded FY 2020 targets for all three key performance measures under Strategic Goal 4. Selected FY 2020 achievements under Strategic Goal 4 include:
• The agency significantly increased the number of engagements by consumers and others with CPSC’s social media messages on all CPSC social media accounts (@USCPSC), including Twitter, Facebook, and Instagram by more than 700 percent, from 1.47 million in FY 2019 to more than 12 million engagements in FY 2020.
• CPSC improved CPSC’s “Regulatory Robot,” an interactive resource to help small businesses identify applicable safety requirements, so it is now available in Spanish for all consumer products. Previously, the Robot was only available in Spanish for a limited number of product types.
• CPSC staff conducted webinar training entitled, “Safety 101 and Importing Overview,” which included a regulatory update, an overview of CPSC’s importing requirements, and video demonstrations of field-screening used at U.S. ports of entry. Three hundred fifty importers, custom brokers, and small businesses attended the training.
• The agency completed a survey to evaluate effectiveness of Anchor It!, which is CPSC’s national public education campaign aimed at preventing furniture and TV tip-overs from killing and seriously injuring children. A key finding from the survey was many parents or caregivers who did not anchor furniture (e.g., dressers) based their decision on a belief that it is not necessary to do so, as long as they are watching their children. The CPSC released a new public service announcement video, titled, “Even When You’re Watching,” which was informed by the survey. Additional recommendations from the findings will be used to improve future tip-over prevention messaging.
Additional analysis and explanation for each performance measure is included in Appendix C.

2 0 2 0 AP R | J a n u a r y 2 0 2 1 O t h e r I n f o r m a t i o n
C P S C | P a g e 1 6
Agency Priorities & Management Challenges
Agency Priority: Focus on Risk The CPSC prioritizes its resources on the products with the highest consumer product safety risks. The CPSC accomplishes this by using data to guide decisions and policy; working with standards development organizations to develop voluntary standards; and adopting mandatory standards as necessary. To advance data-based decision-making, the CPSC invests in analytical tools and technology and expand its data sources. The CPSC continues to build on its pilot initiative on artificial intelligence (AI) and machine learning (ML) methods and technologies to improve the ability to identify hazardous products and injury severity. The agency also continues development of an integrated data management and storage capability strategy through implementation of best practices of data governance. These efforts expand and improve CPSC’s capabilities to identify and analyze emerging hazards.
Agency Priority: Robust Compliance and Enforcement The CPSC vigorously enforces compliance with mandatory regulations and works actively to remove defective products through recalls or other corrective actions. When necessary, the CPSC litigates to secure a mandatory recall. Compliance
activities focus on the timely investigation of reports of hazardous consumer products and entail marketplace surveillance, including a heightened emphasis on e-Commerce activity, to ensure that hazardous products do not enter or remain in the distribution chain.
Agency Priority: Increased Import Surveillance The CPSC continues to support import surveillance by operating, maintaining, and developing the Risk Assessment Methodology (RAM) system to identify and stop noncompliant imported products from entering the U.S. marketplace. The CPSC accomplishes this by allocating and expanding full-time staff to conduct inspections and clear compliant cargo quickly at the highest-volume ports of entry and by beginning to address the challenge of risk-assessing and interdicting the significant volume of e-Commerce shipments under its jurisdiction.
Management Challenges Management challenges identified by the CPSC’s Inspector General are detailed on pp. 63–72 of the FY 2020 Agency Financial Report (AFR), which can be found at: www.cpsc.gov/about-cpsc/agency-reports/performance-and-budget.
2 0 2 0 AP R | J a n u a r y 2 0 2 1 O t h e r I n f o r m a t i o n
C P S C | P a g e 1 7
Cross-Agency Collaboration
Collaboration with GSA on Enterprise Data Analytics Strategy The CPSC has an extremely wide jurisdictional scope, encompassing roughly 15,000 categories of consumer products found in homes, stores, schools, and recreational settings. As such, the agency collects and analyzes large volumes of structured and unstructured data from a wide variety of sources, including hospitals, consumer incident reports, businesses, other federal agencies, among others. As the volume and sources of data expand, the CPSC’s limited resources have become inadequate to maintain the advanced capability necessary to analyze such large and varied amounts of data. This limitation impedes the agency’s ability to effectively identify or assess hazard patterns and prevent harm from reaching consumers. In FY 2019, the CPSC established an Interagency Agreement (IAA) with the General Services Administration’s (GSA) IT Modernization Centers of Excellence (CoE) to formulate a multiyear Enterprise Data Analytics Strategy (EDAS). The EDAS provides the basis for structured incremental improvements to enable the CPSC to extract maximum value from its large amounts of mission-facing data. The EDAS was delivered from GSA to the CPSC in February 2020. The CPSC has since pursued construction of a Data Lake that would allow for computing and collaborating in a cloud environment to enhance security and processing power.
Collaboration with Federal Agencies on Data Collection Through NEISS The CPSC uses the National Electronic Injury Surveillance System (NEISS) to collect information on consumer product-related injuries occurring in the United States that are treated in hospital emergency rooms. This unique CPSC system provides statistically valid national estimates of injuries from a probability sample of hospital emergency rooms. NEISS is a critical component of the CPSC’s data-driven approach to identifying emerging trends and consumer product hazards. NEISS data are available to anyone with an Internet connection.14
14 To access NEISS data, please visit: www.cpsc.gov/en/research--statistics/NEISS-injury-data
The CPSC has collaborated successfully with other federal agencies to collect injury data through NEISS on non-consumer product-related injuries. Examples of CPSC’s FY 2020 collaborations include: • Centers for Disease Control and Prevention
(CDC): To collect comprehensive data on trauma-related injuries. These data make up the nonfatal injury component of the CDC’s Web-based Injury Statistics Query and Reporting System15 (WISQARS),TM an interactive, online database used by researchers, public health professionals, and the public.
• National Center for Injury Prevention and Control (NCIPC): To conduct NEISS studies of data on nonfatal injuries associated with interpersonal violence and assaults, firearms, and self-inflicted violence.
• National Institute for Occupational Safety and Health (NIOSH): To collect data on nonfatal occupational injuries. The data can be accessed through NIOSH’s online database—Work-Related Injury Statistics Query System (Work-RISQS).16
• National Highway Traffic Safety Administration (NHTSA): To collect data on non-crash injuries.
Collaboration with CBP on Import Surveillance The CPSC has collaborated successfully with U.S. Customs and Border Protection (CBP) since 2008 to improve surveillance and screening of imported consumer products. Section 222 of the CPSIA directed the CPSC to create a Risk Assessment Methodology (RAM) to identify products imported into the United States that are most likely to violate consumer product safety statutes and regulations or that contain a defect that constitutes a substantial product hazard. The CPSC uses a RAM system, which integrates data collected by CBP with data used in CPSC systems, to identify high-risk imports that might violate a CPSC statute or regulation. The CPSC has investigators who are stationed at select U.S. ports of entry working side-by-side with CBP officers to identify and interdict noncompliant consumer products and prevent them from entering the United States. In addition, the CPSC collaborates with CBP at the Commercial
15 www.cdc.gov/injury/wisqars/index.html 16 wwwn.cdc.gov/wisards/workrisqs

2 0 2 0 AP R | J a n u a r y 2 0 2 1 O t h e r I n f o r m a t i o n
C P S C | P a g e 1 8
Targeting and Analysis Center (CTAC), which serves as a central location for coordinating import safety targeting efforts with CBP in support of agency enforcement plans. In FY 2020, the agency conducted approximately 18,500 import examinations of consumer product shipments at U.S. ports of entry.
Collaboration with Federal Agencies and Other Stakeholders on the Internet of Things The Internet of Things (IoT), as it relates to consumer products, refers to an environment in which consumer products are connected to the Internet or other devices or products that are connected to the Internet. This type of connectivity is capable of introducing potential safety issues or hazards. The growth of IoT-related products is a challenge for the CPSC and its stakeholders. To address this challenge, in FY 2020, the CPSC collaborated with other federal agencies, foreign governments, and a wide range of stakeholders to address the safety of Internet-connected products, including: • Leading an Interagency Working Group on
Consumer Product Safety of Internet-Connected Products. Participating agencies include the National Cybersecurity Center of Excellence (NCCoE) of the National Institute of Standards and Technology (NIST), the Federal Trade Commission (FTC), the U.S. Food and Drug Administration (FDA), the Federal Communications Commission (FCC), the Department of Energy (DOE), and the Department of Homeland Security (DHS).
• Developing expertise and in-house capabilities for Internet-connected products and participating in development of voluntary consensus standards;
• Participating on IoT panels at the International Consumer Product Health and Safety (ICPHSO) annual conference;
• Completed an IAA with NIST’s NCCoE on workforce development.
Collaboration with Federal Agencies and Other Stakeholders on Micromobility Products “Micromobility products” (e-scooters, e-bicycles, and hoverboards) are an emerging mode of
personal transportation. Micromobility products can occupy space alongside bicycles on dedicated bike lanes or paths, but they are not intended for sidewalks with pedestrians or for vehicle-occupied roads with cars and trucks. These products are popular with consumers because they are convenient for short-distance travel. In FY 2020, the CPSC collaborated with other federal agencies and a wide range of stakeholders to address the safety of micromobility products, including:
• Hosting a webinar forum on the safety of consumer micromobility products. The purpose of the event was to bring stakeholders together to exchange information on enhancing the safety of three specific consumer micromobility products: e-scooters, e-bicycles, and hoverboards. There were 19 presentations over the course of the day, split into five sessions: Data, Standards Development, Best Practices for Enhancing Safety, Micromobility Design and Research, and Policy and Consumer Safety.
• Participating in micromobility voluntary standards developments with UL and ASTM.
• Participated in the Federal Highway Administration’s (FHWA) Office of Planning, Environment, and Realty and the U.S. Department of Transportation’s (DOT) Volpe Center interviews to identify the perspectives of partners across the DOT and other Federal agencies for coordination and collaboration on micromobility issues.
Collaboration with Federal Agencies on Nanotechnology The CPSC has collaborated successfully with other federal agencies through the National Nanotechnology Initiative (NNI), a White House-led $27 billion initiative that involves 20 federal agencies working in the emerging field of nanotechnology. There is a critical need for focused research on consumer product applications of nanomaterials and their potential risks to consumers. Given the CPSC’s size and budget, partnering has been a key element in achieving mission success. • Collaboration with NNCO: Since FY 2003, the
CPSC’s collaborative activities with the NNI have produced more than 50 reports and publications, in addition to voluntary standards resulting from CPSC-funded research that

2 0 2 0 AP R | J a n u a r y 2 0 2 1 O t h e r I n f o r m a t i o n
C P S C | P a g e 1 9
addresses nanomaterial hazards in consumer products.
• Collaboration with EPA and NIOSH on 3-D Printing: Technical improvements and cost reductions of 3-D printing have made the technology become more widely available, allowing for consumers to print products for children and the home. However, printing filaments used in certain 3-D printers contain nanomaterials. The CPSC has been collaborating successfully with the Environmental Protection Agency (EPA) and NIOSH since FY 2018. o EPA – Assessing Emission Characteristics Phase I: In FY 2018, phase I of the
collaborative work with EPA was initiated to study potential health hazards associated with 3-D printing.
Phase II and Phase III: The Phase II work, which was initiated in FY 2019, helped inform the work initiated in FY 2020 for the final phase III (i.e., “Quantifying the Composition and Release of Organic and Inorganic Chemicals and Materials from Fused Deposition Modeling [FDM] Printer Filaments, Waste, and Printed Objects”).
Utilizing Research Results: Results from this research will provide a much-needed baseline data set that quantifies the chemicals and materials present in filaments, consumer products, and waste generated from the FDM printing processes. It will provide quantitative information on the release of chemicals and inorganic materials during the FDM printing process, as well as from consumer products and waste created from that process. Finally, the results will determine the suitability of filament materials for various print applications (fragility, ability to generate small parts). This information is critical for identifying the hazards associated with FDM printing, the potential for exposure to chemicals or materials created during or liberated from FDM print processes or products, and the overall risk of FDM printing processes using various filament types.
o NIOSH – Assessing Health Effects The NIOSH Phase II studies, initiated in FY
2019, built on the Phase I work that assessed the potential for respiratory toxicity induced by emissions from 3-D printers using acrylonitrile butadiene styrene (ABS), poly-lactic acid (PLA), and polycarbonate (PC) filaments with and without multi-walled carbon nanotubes (MWCNTs). The Phase II studies focus on 3-D printing systems that use other types of engineered nanoparticles and the potential for systemic toxicity from exposure to the emissions from these 3-D printer systems.
Collaboration with Federal Agencies on Chemical Hazards As a small agency, the CPSC benefits greatly from collaborating with other federal agencies. The CPSC participates in a number of significant interagency committees or groups that address chemical hazards, including: • The President’s Task Force on Children’s
Environmental Health (CEHTF); • Interagency Coordinating Committee for the
Validation of Alternative Methods (ICCVAM); • Toxic Substances Control Act (TSCA)
Interagency Testing Committee (ITC) • National Toxicology Program (NTP), run by the
U.S. Department of Health and Human Services (HHS);
• Federal Interagency Committee on Indoor Air Quality (CIAQ);
• White House Policy Coordinating Committee (PCC) Technical Working Group (TWG) on Per- and Polyfluoroalkyl Substances (PFAS);
• National Cancer Advisory Board (NCAB), run by the National Cancer Institute; and
• NNI’s Nanotechnology Environmental and Health Implications (NEHI) Working Group.
Collaboration with Federal Agencies on Shared Services The CPSC’s operating model is designed around the use of shared services to lower costs, improve service delivery, and benefit from economies of scale not necessarily available to a small agency. The CPSC leveraged the following shared services in FY 2020:

2 0 2 0 AP R | J a n u a r y 2 0 2 1 O t h e r I n f o r m a t i o n
C P S C | P a g e 2 0
• Financial Management, Travel, and Acquisitions Systems and Services: Provided by Department of Treasury’s Administrative Resource Center (ARC) within the Bureau of the Fiscal Service. The CPSC procures hosting and application management services from ARC, which uses an Oracle-based financial reporting system for accounting and travel management services. The CPSC also uses the Procurement Request Information System Management (PRISM) through ARC’s services platform, which is fully interfaced with Oracle for real-time contracting actions and awarding.
• Payroll and Related Human Resource (HR) System Services: Provided by the Interior Business Center (IBC) of the U.S. Department of the Interior (DOI).
• Grants Management Services: Provided by the Denali Commission to manage CPSC’s Pool Safely Grant Program (PSGP), in accordance with the Virginia Graeme Baker Pool and Spa Safety Act (VGB Act).
• Federal Docket Management System (FDMS): Provided by the EPA for implementation, use, operation, and management of the FDMS, the centralized electronic docket management system for federal agency users. The FDMS services a wide array of routinely performed regulatory activities to the public through www.Regulations.gov, which is the public-facing website of FDMS that offers citizens the opportunity to search, view, download, and submit comments on federal notices and rules.

2 0 2 0 AP R | J a n u a r y 2 0 2 1 O t h e r I n f o r m a t i o n
C P S C | P a g e 2 1
Evaluation and Research
Key Performance Measures The CPSC has identified a core set of 25 key performance measures that describe progress in implementing the Strategic Plan. The key performance measures are tools for monitoring and reporting progress toward the agency’s strategic goals and strategic objectives, and they facilitate using evidence in agency management and resource decisions. The key performance measures are supplemented by additional operating performance measures, which track lower-level project and program outcomes and outputs, and are used for internal management and decision-making. Additional internal milestones are set and monitored to track implementation progress.
Strategic Data Review Meetings The CPSC implements a number of different mechanisms to review financial and performance information and to manage programs during the fiscal year. The Office of the Chief Financial Officer (CFO) produces a monthly report for senior managers’ use, which summarizes the status of the agency’s financial resources and human capital. Financial data presented in the report include the current fiscal year’s annual funding level, cumulative allowances, cumulative funds obligated, and expended obligations, as well as information on onboard staffing levels. Another helpful agency practice has been conducting a Mid-Year review process, during which the annual operating budget is examined for potential adjustments, based on new information or emerging priorities of the agency.
The agency also conducts periodic Strategic Data Reviews (SDRs). The SDRs are strategic, data-driven planning and performance progress reviews attended by the CPSC’s senior managers. The SDRs provide a forum for managers to focus on annual planning to achieve performance goals and strategic objectives and to refresh program priorities and funding requirements. Forward-looking planning decisions are informed by assessing progress toward performance measure targets and achieving agency performance goals and strategic objectives, and reviewing relevant evaluation information. Managers discuss constraints or problems, and identify any needed
modifications to programs going forward. Program risks are also discussed, and mitigation strategies are developed.
Evaluation and Research The CPSC uses research, analysis, and program assessments to inform management decisions, drive improvements in program delivery and effectiveness, and update future strategies and program formulation. The CPSC’s Office of the Inspector General (OIG) audits, evaluates, reviews, and investigates the agency’s programs and operations. The U.S. Government Accountability Office (GAO) also conducts performance audits and analyses, and makes recommendations to help improve CPSC’s practices, policies, and programs. In addition, the CPSC performs targeted reviews of internal controls to determine whether processes should be modified to strengthen and improve operations. Finally, the CPSC conducts research, and reviews and assesses the effectiveness and efficiency of specific programs supporting the strategic goals in the Strategic Plan, as appropriate. The CPSC is committed to using the findings from research and evaluation to improve programs and strategies and make progress toward strategic goals and strategic objectives. Examples of CPSC’s FY 2020 evaluation and research efforts include:
Enterprise Data Analytics: The volume of the incoming data to the CPSC has been increasing over the years, making manual processing of data less viable. In addition, the current CPSC environment includes siloed data sources that are dedicated to the systems and applications they serve, which makes data sharing across the agency difficult and limits the agency’s ability to deploy modern data analytics and business intelligence tools. These issues necessitate an effective, on-demand, cross-system data exchange, as data analytics are becoming more critical for data-driven decision making throughout the agency.
• Background: To expand CPSC’s analytics capability, in FY 2019, the CPSC partnered with the GSA’s IT Modernization Centers of Excellence (CoE) to formulate and establish a multi-year Enterprise Data Analytics Strategy (EDAS) and Implementation Plan (see p. 17 for

2 0 2 0 AP R | J a n u a r y 2 0 2 1 O t h e r I n f o r m a t i o n
C P S C | P a g e 2 2
information on the Interagency Agreement with GSA). The CPSC expects to take a stepwise, incremental approach to improving its data analytics and business intelligence environment.
• FY 2020 Results: In FY 2020, the CPSC completed its first Use Case pilot initiative of the multi-year EDAS to expand CPSC’s analytics capability. The goal of the pilot was to address the challenges created by processing the high volume of incoming retailer data, a labor-intensive effort that currently involves manual review of the data by CPSC staff to classify the type of product and the severity of any injury. The pilot used machine learning (ML)—an analytics functionality that replicates human decision-making, analysis, and processing—to classify this data. As a result of the pilot, the agency gained great insight into the potential for automating the classification of incident reports, and the results will help inform and refine the CPSC’s EDAS and other potential Use Cases in the coming years. In addition to the pilot, the CPSC also expanded the use of machine learning for quality assurance checks for agency data, helping to automate this labor-intensive process.
e-Commerce: The digital marketplace has grown rapidly, which has resulted in a significant global shift from the traditional consumer product distribution chain (e.g., retail stores) to online shopping.17 Consequently, a large volume of low-value, potentially noncompliant or hazardous shipments of foreign-manufactured products are now being shipped directly to consumers in the United States. CPSC staff estimates the value of e-Commerce shipments the CPSC regulates will reach $415 billion by calendar year 2023, representing nearly 38 percent of the total value of imports under CPSC’s jurisdiction.
• CPSC Constraints: The CPSC’s import surveillance operational structure has been organized for the traditional import environment—to scan for high-value shipments that arrive at traditional U.S. ports of entry; those shipments are typically intended for businesses (e.g., distributors or retailers), which, for instance, would offer for sale to the
17 The number of Americans shopping online increased nearly four-fold from 22 percent to 79 percent between 2000 and 2018. Reference: www.cbp.gov/sites/default/files/assets/documents/2018-Mar/CBP-E-Commerce-Strategic-Plan_0.pdf
consumer individual products from their imported shipments.
• Addressing e-Commerce Challenges: To address e-Commerce challenges, the CPSC developed a vision for more effective identification, enforcement, and deterrence of trade violations in the e-Commerce environment. The CPSC identified key resource gaps, which have been introduced by e-Commerce. Additionally, the agency assessed the impacts of e-Commerce on CPSC’s import enforcement.
o e-Commerce Assessment: The first major effort undertaken by the CPSC to address e-Commerce challenges was the FY 2019 e-Commerce Assessment. 18 The resulting report identified CPSC’s current capabilities in addressing e-Commerce shipments arriving at U.S. ports. The study also estimated the expected volume and location of where those shipments would arrive in the next 5 years—it was estimated that 55 million e-Commerce shipments under CPSC’s jurisdiction will enter the United States in calendar year 2023. Results from the study directly informed the FY 2020 follow-on work—e-Commerce Concept of Operations and Implementation Plan (CONOPS), which provides a roadmap from an Import Surveillance perspective for how the CPSC can address e-Commerce risks in the long-term.
o FY 2020 e-Commerce Concept of Operations and Implementation Plan (CONOPS): Completed in FY 2020, the CONOPS is a 5-year implementation plan that can serve to guide the CPSC in determining the various resources needed to identify and interdict high-risk e-Commerce shipments, as well as to guide the agency’s strategy to address e-Commerce risks. The CPSC expects the implementation of the CONOPS to significantly improve the agency’s ability to identify potentially noncompliant and dangerous e-Commerce shipments and stop those shipments from reaching consumers.
18 A detailed report on the E-commerce Study can be found at: www.cpsc.gov/s3fs-public/CPSC%20e-Commerce%20Assessment%20Report.pdf?B.5pu7oFYPRJsokNjHygmRyZVo0tpPmE

2 0 2 0 AP R | J a n u a r y 2 0 2 1 O t h e r I n f o r m a t i o n
C P S C | P a g e 2 3
Business Process Review: The marketplace for consumer products under CPSC’s jurisdiction has been evolving, including expansion of the digital marketplace, along with emerging new technologies that consumers are being exposed to on a daily basis. To keep pace with the evolving marketplace, the CPSC needs to adapt its compliance and enforcement operations.
• Background: In FY 2020, the CPSC completed its Business Process Review (BPR), which was phase I of CPSC’s IT Modernization of the Integrated Field System (IFS). The IFS is CPSC’s compliance and enforcement database system that contains information about field activities, regulated products compliance, and recalls. IT Modernization of the IFS is a multi-year, internal collaborative effort to modernize the agency’s case management system for regulatory enforcement work.
• FY 2020 Results: The agency’s FY 2020 work on the BPR involved assessment of CPSC’s current regulatory compliance and enforcement business processes and systems. The agency evaluated results of the BPR and made resource recommendations on two key components of the IT Modernization of the IFS effort— a business efficiency plan and an IT systems development plan for the IFS database. Findings from the BPR (i.e., phase I) will help inform phase II of the IT Modernization of IFS effort.
CPSC’s “Anchor It!” – Campaign Effectiveness Survey: “Anchor It!” is CPSC’s national public education campaign, aimed at preventing furniture and TV tip-overs from killing and seriously injuring children. Tip-overs are a significant hidden hazard in the home; even when adults are in the same room with children, dangerous tip-overs can occur. The annual average number of injuries associated with tip-overs is approximately 25,500.19 Since year 2000, there have been more than 570 fatalities associated with tip-overs; tragically, 82 percent of those fatalities involved children.20
• Background: To evaluate effectiveness of the “Anchor It!” campaign, in FY 2018, the CPSC
19 According to CPSC’s National Electronic Injury Surveillance System’s (NEISS) data, the annual average number of emergency department-treated injuries from years 2017 to 2019 is 25,500. 20 Between 2000 and 2019, the CPSC received 571 reports of tipover-related fatalities. Of the 571 reported fatalities, 469 (82%) involved children
initiated work on the survey to conduct a comprehensive research study21 of attitudes and behaviors about furniture and TV anchoring among parents and caregivers. Two key objectives of the survey were: (1) To assess consumer awareness, recognition, and behavior change as a result of the “Anchor It!” campaign (2) To assess knowledge, attitudes, and awareness around TV and furniture tip-overs and anchoring, including comprehension of hazards, risks, and remedies.
• FY 2020—Survey Completion and Findings: o The CPSC completed the “Anchor It!”
effectiveness survey in FY 2020. The survey found that most consumer respondents—80 percent—are aware that unanchored furniture can tip over, and 82 percent are aware that tip-overs can lead to injuries and deaths. Awareness does not always turn into action, however. Of those surveyed, 47 percent say they have ever anchored a TV in their home, while 55 percent have ever anchored their furniture. Parents are more likely to anchor than caregivers.
o A key finding from the survey was many parents or caregivers who did not anchor furniture (e.g., dressers) based their decision on a belief that it is not necessary to do so, as long as they are watching their children.
• Utilizing Survey Results: Understanding knowledge, awareness, and perceptions from various levels of consumers and other stakeholders helps give a well-rounded picture of the campaign. Findings from the survey will help shape recommendations and enhance CPSC’s messaging of the campaign in the future, so consumers are made aware that tip-overs can be prevented and lives can be saved.
Chemical Hazards-Related Research—Organohalogens (OFRs): The CPSC conducts research on toxicity, human exposure, and health risks of organohalogens, a diverse group of chemical classes, that may be found in a wide variety of consumer products. Assessing OFRs together, as multiple classes, allows CPSC to assess
of ages 1 month to 14 years. 21 To see a full report of the survey results, please visit: https://www.cpsc.gov/s3fs-public/CPSC-Anchor-It-Campaign-Effectiveness-Survey-Main-Report_Final_9_2_2020....pdf?gC1No.oOO2FEXV9wmOtdJVAtacRLHIMK

2 0 2 0 AP R | J a n u a r y 2 0 2 1 O t h e r I n f o r m a t i o n
C P S C | P a g e 2 4
how different OFR classes have been used in different consumer products. • Background: In response to Petition HP15-1, the
Commission voted to grant the petition and directed staff to initiate several activities. In FY 2019, the CPSC received a scoping and feasibility study of OFRs from the National Academies of Sciences, Engineering, and Medicine (NASEM), entitled, “A Class Approach to Hazard Assessment of Organohalogen Flame Retardants.” The NASEM study provided a plan for identifying and applying accepted scientific methods for assessing the toxicity of OFRs as a class, to be used by the CPSC in its rulemaking efforts. The NASEM identified 14 OFR subclasses that would need to be evaluated separately. The CPSC has been working to implement the research and assessment recommendations proposed by the NASEM in its 2019 report.
• FY 2020 Results: In FY 2020, based upon the evaluation of the NAS study, CPSC staff developed a briefing package entitled, “Project Plan: Organohalogen Flame Retardant Chemicals Assessment,” which describes the approach to scope and conduct risk assessments for OFRs in consumer products. The work completed in FY 2020 will inform follow-on work to begin to implement CPSC staff’s plan to assess the potential risks of the OFR subclasses in consumer products.
Chemical Hazards-Related Research—Other Chemicals: The CPSC also conducts research on toxicity, human exposure, and health risks of thousands of other chemicals found in consumer products.
• Phthalates Alternatives: In FY 2020, the CPSC continued reviewing toxicology studies for use in evaluating potential risks associated with the chemical compounds being used by industry as alternatives to regulated phthalates.
• Alternative Toxicological Methods: In FY 2020, the CPSC collaborated extensively with the Interagency Coordinating Committee for the Validation of Alternative Methods (ICCVAM). The CPSC’s FY 2020 collaborative work includes:
22 www.oecd.org/chemicalsafety/testing/oecd-guidelines-testing-chemicals-
o Continuing participation as members of numerous working groups for the ICCVAM.
o Participating in the new ICCVAM working group on metrics.
o Continuing work with NIST on validating the Electrophilic Allergen Screening Assay (EASA) assay (i.e., a scientific testing procedure to detect or identify skin sensitizers, which are substances found in consumer products and have the potential to cause Allergic Contact Dermatitis [ACD]); the work was performed in cooperation with ICCVAM, the National Toxicology Program Interagency Center for the Evaluation of Alternative Toxicological Methods (NICEATM), NIST, the U.S. Food and Drug Administration (FDA), and the Department of Defense (DoD). The CPSC evaluated a measurement science approach to characterize uncertainty, variability, and potential biases in the EASA assay and prepared a presentation that summarizes the measurement science approach for the American Society of Cellular and Computational Toxicology annual meeting.
o Continuing participation in an international effort to collect human predictive patch test data for more than 100 substances and apply decision tree and weight-of-evidence approaches to resolve ambiguity and discordance in individual tests. This work is to support the evaluation of defined approaches for skin sensitization proposed for inclusion in a new Organisation for Economic Co-operation and Development (OECD) guideline.
o Participated on the Validation Management Team for an alternative test method for evaluating ocular irritation. The team’s evaluation on the validation of this test method was published in the peer-reviewed journal, Cutaneous and Ocular Toxicology, in FY 2020.
o Reviewed numerous documents for ICCVAM, such as testing procedures, guidance documents and OECD Test Guidelines Programme22 documents.
related-documents.htm

2 0 2 0 AP R | J a n u a r y 2 0 2 1 O t h e r I n f o r m a t i o n
C P S C | P a g e 2 5
Importance of Data and Evidence in Determining Program Priorities As a data-driven agency, the CPSC regularly collects and analyzes a wide range of data from multiple sources that are relevant to its mission. The CPSC uses that information to shape program strategies and select priorities. For example, the
CPSC systematically reviews and analyzes data on injury and death incidents related to consumer products to develop the CPSC’s hazard-mitigation strategies. The CPSC receives data from multiple sources, including NEISS, death certificates, Medical Examiner and Coroners Alert Project (MECAP) reports, incident reports, and www.SaferProducts.gov, among other sources.
2 0 2 0 AP R | J a n u a r y 2 0 2 1 A p p e n d i c e s
C P S C | P a g e 2 6
Appendix A CPSC Performance: Verification & Validation of Performance Data
The CPSC requires complete, accurate, and reliable performance data to assess agency progress toward its strategic objectives and performance goals, and to make good management decisions. The CPSC’s approach to verification and validation (V&V) of performance data, intended to improve accuracy and reliability, is based upon the following:
(1) The agency develops performance measures through its strategic planning and annual performance planning processes.
(2) The CPSC’s functional components follow a standard reporting procedure to document detailed information for each performance measure in an internal agency database. This information includes, but is not limited to:
• performance measure definition, • rationale for the performance measure, • source of the data, • data collection and computation methods,
and • data limitations.
(3) The agency’s major functional components are responsible for assessing the completeness, consistency, timeliness, and quality of the data for their key performance measures, as well as identifying any data limitations. Managers of major functional components responsible for reporting key measures certify that procedures for ensuring performance data quality have been followed, and that the reported results are reasonably complete, accurate, and reliable.
(4) In addition to the self-assessments and certification statements completed by functional components, year-end results for key performance measures are reviewed by CPSC’s
Office of Financial Management, Planning, and Evaluation (EXFM) team and approved by management before they are published in agency documents. Furthermore, EXFM also conducts an in-depth V&V review of each key performance measure within a 2-year cycle, following established operating procedures. In FY 2020, EXFM independently assessed 11 key performance measures out of 25 from across the agency’s major functional components for quality and accuracy of the year-end reported performance results.
(5) The CPSC also conducts periodic Strategic Data Review (SDR) meetings, where managers of major functional components analyze progress toward performance measure targets and broader progress toward achieving the agency’s strategic objectives and performance goals. Program risks are also discussed, and mitigation strategies are developed.
(6) Managers of major functional components within the CPSC also submit annual Statements of Assurance (SoA) on the operating effectiveness of general- and program-level internal controls for their areas of responsibility. Those SoAs identify any known deficiencies or weaknesses in program-level internal controls where they exist, including any issues with the quality of program data.
These procedures help to provide assurance that performance data reported by the agency are sufficiently complete, accurate, and reliable, as appropriate to intended use, and that internal controls are maintained and functioning as intended.

2 0 2 0 AP R | J a n u a r y 2 0 2 1 A p p e n d i c e s
C P S C | P a g e 2 7
4
Appendix B Changes to FY 2020 Performance Measures
In accordance with OMB Circular No. A-11 guidance, this section of the FY 2020 APR summarizes changes to FY 2020 performance measures that occurred between the publication of the FY 2020 Performance Budget Request (PBR) (published March 2019) and this document, the FY 2020 APR (January 2021). Changes to the performance measures resulted from the enactment of the CPSC’s FY 2020 annual appropriations and implementation of the CPSC’s FY 2020 Operating Plan (published October 2019).
The table below indicates whether the FY 2020 measure was discontinued, revised, replaced, or added since the FY 2020 PBR publication. Any changes made to the performance measure’s annual target are included in the “FY 2020 Target” columns.
FY 2020 Performance Measure Statement FY 2020 Target
FY 2020 PBR
FY 2020 APR
PBR and APR: 2020KM1.2.01: Percentage of employees satisfied with opportunities to improve their skills (as reported in the Federal Employee Viewpoint Survey)
74% 70%
PBR: 2020KM1.4.01: Federal Employee Viewpoint Survey Employee Engagement Index Score
APR – Revised to: 2020KM1.4.01: High-performing Federal Workforce – Employee Engagement Index Score
75% 70%
PBR: 2020KM2.1.04: Number of collaborations established or maintained with other organizations to work on nanotechnology research or issues affecting consumer products APR – Discontinued
3 Discon-tinued
PBR and APR: 2020KM2.2.01: Number of voluntary standards activities in which CPSC staff actively participates
72 78
PBR and APR: 2020KM2.2.02: Number of candidates for rulemaking prepared for Commission consideration
7 12
PBR: Not included APR - Added: 2020KM2.2.08 Recalls per Billion Dollars in Consumer Product Imports for Top 50 Import Sources Countries or Administrative Areas
< 0.33
PBR: 2020KM3.1.02: Percentage of cases for which a compliance determination of a regulatory violation is made within 35 business days of sample collection APR – Replaced with:
• 2020KM3.1.02: Percentage of cases for which a compliance determination of a regulatory violation is made within 35 business days of sample collection (excludes fireworks); and
• 2020KM3.1.03: Percentage of fireworks cases for which a compliance determination of a regulatory violation is made within 70 business days of sample collection
85%
85%
85%
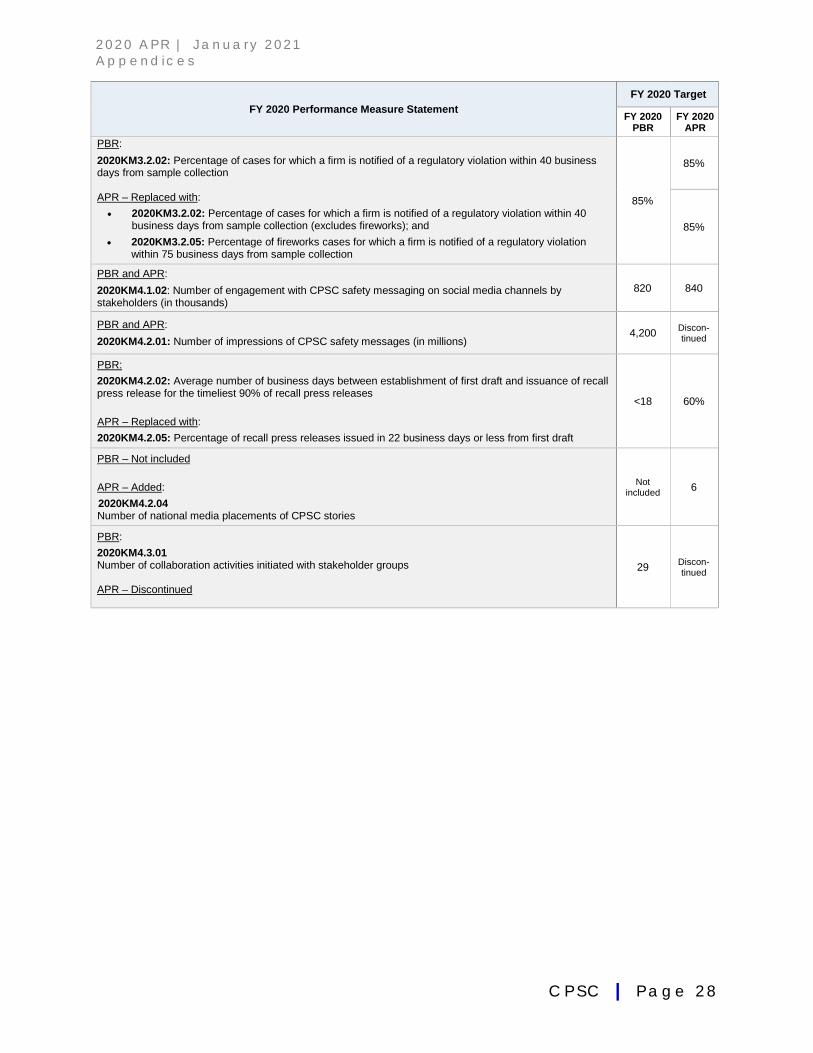
2 0 2 0 AP R | J a n u a r y 2 0 2 1 A p p e n d i c e s
C P S C | P a g e 2 8
FY 2020 Performance Measure Statement FY 2020 Target
FY 2020 PBR
FY 2020 APR
PBR:
2020KM3.2.02: Percentage of cases for which a firm is notified of a regulatory violation within 40 business days from sample collection APR – Replaced with:
• 2020KM3.2.02: Percentage of cases for which a firm is notified of a regulatory violation within 40 business days from sample collection (excludes fireworks); and
• 2020KM3.2.05: Percentage of fireworks cases for which a firm is notified of a regulatory violation within 75 business days from sample collection
85%
85%
85%
PBR and APR:
2020KM4.1.02: Number of engagement with CPSC safety messaging on social media channels by stakeholders (in thousands)
820 840
PBR and APR:
2020KM4.2.01: Number of impressions of CPSC safety messages (in millions) 4,200 Discon-
tinued
PBR: 2020KM4.2.02: Average number of business days between establishment of first draft and issuance of recall press release for the timeliest 90% of recall press releases APR – Replaced with: 2020KM4.2.05: Percentage of recall press releases issued in 22 business days or less from first draft
<18 60%
PBR – Not included APR – Added: 2020KM4.2.04 Number of national media placements of CPSC stories
Not included 6
PBR: 2020KM4.3.01 Number of collaboration activities initiated with stakeholder groups APR – Discontinued
29 Discon-tinued

2 0 2 0 AP R | J a n u a r y 2 0 2 1 A p p e n d i c e s
C P S C | P a g e 2 9
Appendix C Detailed Information on FY 2020 Performance Measures
This section presents detailed information on the 25 key performance measures for FY 2020. The CPSC’s FY 2020 Operating Plan includes FY 2020 performance measures and annual targets, used for tracking progress toward achieving the strategic goals and strategic objectives outlined in the agency’s strategic plan.
Navigation: The performance measures are organized by strategic goal. For each performance measure, this appendix shows key information from the data fields listed in the CPSC’s centralized Performance Management Database (PMD). Each quarter, the CPSC’s functional components are responsible for reporting actual progress for each performance measure in the PMD. The following are the data fields listed in this appendix for each performance measure:
Name of Data Field Description
Control ID A unique identifier assigned to each performance measure. • Note: An asterisk symbol (*) following the Control ID indicates that the performance
measure has been verified and validated. For more information on CPSC’s procedures on Verification & Validation (V&V) of performance data, refer to Appendix A on p. 26.
Program The CPSC’s functional component that is responsible for the performance measure.
Strategic Goal The strategic goal from the CPSC’s Strategic Plan associated with the performance measure.
Strategic Objective The strategic objective from the CPSC’s Strategic Plan associated with the performance measure.
Performance Measure Statement
A measurable value that indicates the state or level of the targeted result.
Definition of Performance Measure
A clear description of the indicator, with enough specificity that different individuals can collect and report the same information for the measure.
Rationale for Performance Measure
A description of why the performance measure was selected; how it tracks progress toward the associated strategic objective; and how the information will be useful for management.
2016–2020 Actuals; Target met?
FY 2020 target and historical actual values for the performance measure and indication of whether the FY 2020 target was met.

2 0 2 0 AP R | J a n u a r y 2 0 2 1 A p p e n d i c e s
C P S C | P a g e 3 0
Name of Data Field Description
Analysis This field may include:
• An explanation of how progress toward meeting the annual target for this performance measure contributes to progress toward meeting the strategic objective;
• Annual target:
o If the FY 2020 target was met, a description of the key elements that contributed to success in meeting the target
o If the FY 2020 target was not met, a description of the issues/obstacles that impeded success in meeting the target
o If data for FY 2020 result are not available, the reason(s) for the unavailability, and the expected date that the data will become available; and
• Discussion of the trend result: positive, negative, or steady; expectations for trend over time.
Plan(s) for Improving Performance
If applicable, a description of action(s) to be implemented to improve performance in future years.
Data Source Identification of data source(s) with enough specificity, so that the same source(s) can be used for the performance measure over time.
Data Collection Method and Computation
Detailed description of the collection and computation method, so that it can be replicated consistently over time, and by different personnel.
Data Limitations and Implications of the Reported Results
Identification of any known data limitations, including a description of the limitations, the impact limitations may have on measuring progress toward the annual target and/or the related performance goal or strategic objective, and the actions that will be taken to correct the limitations.

2 0 2 0 AP R | J a n u a r y 2 0 2 1 A p p e n d i c e s
C P S C | P a g e 3 1
Control ID Program
2020KM1.1.02* Human Resources
Strategic Goal
Goal 1: Workforce
Strategic Objective
1.1: Enhance effective strategic human capital planning and alignment
Performance Measure Statement
Percentage of full-time equivalents (FTEs) utilized
Definition of Performance Measure
The total number of on-board FTEs, divided by the CPSC’s authorized FTE ceiling for the fiscal year
Rationale for Performance Measure
The FTE utilization rate serves as an important workforce planning tool to guide the CPSC in assessing current/projected future skill gaps and changing/reshaping of the agency’s workforce that might be needed to meet the agency’s mission.
2016 Actual 2017 Actual 2018 Actual 2019 Actual 2020 Actual 2020 Target Target Met?
-- -- 97% 98% 95% 96% Analysis
The target was 96 percent; the FY 2020 actual result was 95 percent. The CPSC did not meet the target. The COVID-19 pandemic and working remotely have impacted recruiting, interviewing, and onboarding. The agency developed remote interviewing, new hiring and onboarding procedures for the CPSC’s virtual workplace, but still fell short of the annual target by 1 percent.
Plan(s) for Improving Performance
The agency provided Human Capital Data to hiring managers for successful workforce planning and recruitment, incorporated feedback to improve quarterly reports, updated dashboard with requested reporting functionality, and plans to continue efforts for strategic workforce and succession planning to maintain the FTE utilization rate.
Data Source
Quarterly 113G Reports, from the Federal Personnel and Payroll System (FPPS). The FPPS is a database system administered by CPSC’s Shared Services Provider—Interior Business Center (IBC) of the U.S. Department of Interior (DOI).
Data Collection Method and Computation
From the quarterly 113G report as of year end, divide the Grand Total Employment (cumulative column) by CPSC’s authorized FTE ceiling for the fiscal year.
Data Limitations and Implications of the Reported Results
The measure tracks only straight time hours.

2 0 2 0 AP R | J a n u a r y 2 0 2 1 A p p e n d i c e s
C P S C | P a g e 3 2
Control ID Program
2020KM1.2.01* Human Resources
Strategic Goal
Goal 1: Workforce
Strategic Objective
1.2: Foster a culture of continuous development
Performance Measure Statement
Percentage of employees satisfied with opportunities to improve their skills (as reported in the Federal Employee Viewpoint Survey)
Definition of Performance Measure
The percentage of positive responses for Question 1—“I am given a real opportunity to improve my skills in my organization.”—from the annual FEVS administered by OPM is computed as follows: The number of employees who responded “satisfied” or “highly satisfied,” divided by the number of employees who responded to the question.
Rationale for Performance Measure
FEVS results for Question 1 are an indicator of how well the agency fosters a culture of continuous development by providing oppotunities and encouraging professional development.
2016 Actual 2017 Actual 2018 Actual 2019 Actual 2020 Actual 2020 Target Target Met?
-- 72.5% 68.1% 65.8% Result not available 70% N/A
Analysis
The result for this measure is not available. The U.S. Office of Personnel Management (OPM) postponed its launch of the annual 2020 FEVS, which was administered from September 24, 2020 through November 5, 2020. To improve employee satisfaction, the agency revised its training plans and fully implemented them in the remote environment and, since March, training participant rates for agency-sponsored training was higher than ever with 97% of courses filled to capacitiy.
Plan(s) for Improving Performance
The CPSC will explore new opportunities for remote learning, market the coaching program, and continue to provide training to employees to develop their Individual Development Plan (IDP).
Data Source
Annual FEVS, administered by OPM
Data Collection Method and Computation
Data are collected through OPM’s annual FEVS link sent out via email to all permanent employees. The responses are calculated by OPM. The positive responses include both the “highly satisfied” and “satisfied” employee responses for Question 1 of the FEVS survey instrument.
Data Limitations and Implications of the Reported Results
Not applicable

2 0 2 0 AP R | J a n u a r y 2 0 2 1 A p p e n d i c e s
C P S C | P a g e 3 3
Control ID Program
2020KM1.3.01 Human Resources
Strategic Goal
Goal 1: Workforce
Strategic Objective
1.3: Attract and recruit a talented and diverse workforce
Performance Measure Statement
Percentage of hiring managers trained on recruitment
Definition of Performance Measure
The CPSC provided recruitment training (segments on interviewing and reference checking) to all selecting officials at CPSC (all supervisors, managers and executives) during FY 2020. The performance measure tracked the percentage of CPSC selecting officials who completed the training segments during the fiscal year (the number of CPSC selecting officials who completed the training segments during the fiscal year divided by the total number of CPSC selecting officials).
Rationale for Performance Measure
CPSC selecting officials received training in assessment tools and targeted recruitment authorities to ensure that they have the tools necessary to recruit a talented and diverse workforce. To recruit the best talent, hiring managers need to focus on the vacancy announcement and assessment to get the best applicants for selection. This comprehensive training provided selecting officials with the tools to develop assessments that will ensure that the most talented applicants are considered.
2016 Actual 2017 Actual 2018 Actual 2019 Actual 2020 Actual 2020Target Target Met?
-- 56.1% 82.6% 85.5% 89.7% 80% Analysis
The FY 2020 result was 89.7%, exceeding the annual target of 80%. The training topic on Interviewing and Conducting Referencing Checks was of interest to, and well-received by, selecting officials. We also noticed a slight increase in the average score of hiring managers satisfied with applicant listing, from 8.275 in FY 2019, to 8.5 in FY 2020, out of a score of 10.
Plan(s) for Improving Performance
In FY 2020, the CPSC developed a plan to increase hiring managers’ participation in the hiring process, and in FY 2021, will execute the plan from FY 2020, by working on remote hiring practices and guidance, preparing for virtual job fairs and outreach events, as well as offering training sessions on recruitment topics of interest.
Data Source
Tracking spreadsheet
Data Collection Method and Computation
The CPSC uses sign-in sheets, provided at each training session, to update the tracking spreadsheet and the selecting officials’ learning histories to verify attendance at trainings. The spreadsheet lists all selecting officials who have completed training on Targeted Assessment and Recruitment Training.
Data Limitations and Implications of the Reported Results
The measure only reports whether the managers were trained. The measure does not capture whether the training is effectively implemented by the managers to improve the quality of recruiting.

2 0 2 0 AP R | J a n u a r y 2 0 2 1 A p p e n d i c e s
C P S C | P a g e 3 4
Control ID Program
2020KM1.4.01* Human Resources
Strategic Goal
Goal 1: Workforce
Strategic Objective
1.4: Increase employee engagement
Performance Measure Statement
High-performing Federal Workforce - Employee Engagement Index Score
Definition of Performance Measure
The Employee Engagement Index (EEI) score, developed and computed by OPM, is a measure of work environment conditions that are conducive to employee engagement. The index consists of three factors: (1) Leaders Lead, (2) Supervisors, and (3) Intrinsic Work Experience. Each factor reflects a different aspect of an engaging work environment. The EEI includes results for 15 different questions from the FEVS, which together, are designed to measure overall employee engagement.
Rationale for Performance Measure
According to OPM’s definition, “employee engagement” is described as an employee’s sense of purpose. It is evident in their display of dedication, persistence, and effort in their work, or overall commitment to their organization and its mission. An agency that engages its employees ensures a work environment where each employee contributes to the success of the agency while reaching his or her full potential. Engaged employees contribute significantly to the success of the CPSC and the federal government as a whole.
2016 Actual 2017 Actual 2018 Actual 2019 Actual 2020 Actual 2020 Target Target Met?
70% 73% 69% 66% Result not available 70% N/A
Analysis
The result for this measure is not available. The U.S. Office of Personnel Management (OPM) postponed its launch of the annual 2020 FEVS, which was administered from September 24, 2020 through November 5, 2020. The agency executed its plans to improve its performance by implementing the President’s Management Agenda (PMA) Agency Improvement Plan, and focused on the Leaders Lead portion of the Employee Engagement Index. Other employee engagement examples include:
• Completed training on performance management and telework for employees; • Implemented wellness plan such as fitness center upgrades, personal training plans and virtual work-life
balance sessions; and • Implemented the bottom 20% in the FEVS action plan, such as the What’s On Your Mind? Initiative, to let
CPSC’s management team know your questions, ideas or suggestions; and Walk in Your Shoes pilot program to provide employees an opportunity to “shadow” a host employee and learn what they do.
Plan(s) for Improving Performance
The agency will continue employee engagement efforts, especially where improvement is needed, when the 2020 FEVS results are made available.
Data Source
Annual FEVS, administered by OPM
Data Collection Method and Computation
Data are collected through OPM’s annual FEVS link sent out via email to all permanent CPSC employees. The EEI score is based on data from responses to 15 different questions on the FEVS survey instrument.
Data Limitations and Implications of the Reported Results
Not applicable

2 0 2 0 AP R | J a n u a r y 2 0 2 1 A p p e n d i c e s
C P S C | P a g e 3 5
Control ID Program
2020KM2.1.01* Hazard Identification
Strategic Goal
Goal 2: Prevention
Strategic Objective
2.1: Improve identification and assessment of hazards to consumers
Performance Measure Statement
Percentage of consumer product-related incident reports warranting follow-up actions
Definition of Performance Measure Integrated Product Teams (IPTs), consisted of subject-matter experts from various organizations within CPSC and organized by type of hazard, receive incident reports through the Consumer Product Safety Risk Management System (CPSRMS), and determine whether follow-up actions, such as in-depth investigations or enforcement actions, are warranted.
Rationale for Performance Measure
Improved quality and specificity of hazard information included in incident reports makes them more informative and useful. The percentage of incident reports that warrant follow-up actions provides an indication of the extent to which incident reports contain improved information.
2016 Actual 2017 Actual 2018 Actual 2019 Actual 2020 Actual 2020 Target Target Met?
-- 25% 26% 23% 20% 25% Analysis The FY 2020 actual result was 20%, falling short of the target of 25%. The CPSC did not meet the target because most of the data received by the CPSC through incident reports are not actionable, warranting no follow-up actions.
Although the CPSC fell short of the annual target, the agency had a successful FY 2020 pilot program of a new, improved approach of CPSC’s Integrated Product Teams (IPTs), which are organized by type of hazard and consist of subject-matter experts from across the agency who review incoming incident report data. Success of the new, improved IPT approach was attributed to staff-developed algorithms that analyze changes in incident reports over time. Plan(s) for Improving Performance Starting in FY 2021, this measure will be discontinued. The measure was initially established to demonstrate the large amount of incident report data needed to be processed by the CPSC to obtain a small amount of data that are actionable. This measure did not add much utility to CPSC’s ability to improve the identification and assessment of hazards to consumers.
Even though the measure will be discontinued, the CPSC will continue with the work previously tracked under this measure—intaking and processing data submitted through incoming incident reports. The CPSC expects the new, improved IPT approach to improve the identification and assessment of hazards to consumers. Data Source
CPSRMS
Data Collection Method and Computation
Incident reports received through CPSRMS are queried using statistical computer software to compute the proportions of each disposition assigned. Incident reports with the status of either, “Compliance Action” or “Possible Further Action,” are tallied and then divided by the total number of incident reports with all statuses.
Data Limitations and Implications of the Reported Results
Incidents are reported to the agency by the public, manufacturers, retailers, or other stakeholders. Often, an incident report is not useful or meaningful because it lacks sufficient detail to be informative.

2 0 2 0 AP R | J a n u a r y 2 0 2 1 A p p e n d i c e s
C P S C | P a g e 3 6
Control ID Program
2020KM2.1.02 Hazard Identification
Strategic Goal
Goal 2: Prevention
Strategic Objective
2.1: Improve identification and assessment of hazards to consumers
Performance Measure Statement
Number of hazard characterization annual reports completed on consumer product-related fatalities, injuries, and/or losses for specific hazards
Definition of Performance Measure
The number of milestone hazard characterization statistical reports produced for specified product-related hazards or categories. These reports characterize the number of reported fatalities and estimated injuries and trends.
Rationale for Performance Measure
This key measure tracks an element of the CPSC’s strategy for improved hazard identification by scanning the marketplace to determine whether previously identified significant hazards exist in similar products. Annual reports presenting statistics on the numbers of reported deaths and estimates of emergency department-treated, product-related injuries for specific product-related hazards or categories allow for trend assessments and inform management decisions, along with information and education campaigns.
2016 Actual 2017 Actual 2018 Actual 2019 Actual 2020 Actual 2020 Target Target Met?
11 11 10 11 11 11 Analysis
The FY 2020 actual result was 11 annual reports, meeting the annual target of 11 reports.
Plan(s) for Improving Performance
The CPSC plans to work on 11 reports in FY 2021, adding a report on senior safety and continuing the Off-Road Vehicle Report initiated in FY 2020.
Data Source
Report postings for Assistant Executive Director (AED) review (Form 122) on CPSC’s internal administrative system.
Data Collection Method and Computation
The agency prepares reports on consumer product-related fatalities, injuries, and/or losses for specific hazards annually. This is a count of the number of hazard characterization reports posted for AED review (Form 122) on CPSC’s internal document-sharing system during the fiscal year.
Data Limitations and Implications of the Reported Results
This measure tracks the number of completed reports. It does not measure the quality of the reports.

2 0 2 0 AP R | J a n u a r y 2 0 2 1 A p p e n d i c e s
C P S C | P a g e 3 7
Control ID Program 2020KM2.1.03 Hazard Identification
Strategic Goal Goal : Prevention
Strategic Objective 2.1: Improve identification and assessment of hazards to consumers
Performance Measure Statement
Percentage of consumer product-related injury cases correctly captured at NEISS hospitals
Definition of Performance Measure A weighted average of the percentage of consumer product-related injury cases correctly captured at a sample of hospitals participating in the National Electronic Injury Surveillance System (NEISS) (where the percentage at each sampled hospital is calculated as: the number of product-related injury cases captured by the NEISS coder, divided by the number of product-related cases captured by a CPSC auditor).
Rationale for Performance Measure Evaluation visits are conducted at NEISS hospitals to determine the percentage of reported consumer product-related cases captured correctly by hospital coders, indicating the quality of consumer product-related incident data from the hospitals.
2016 Actual 2017 Actual 2018 Actual 2019 Actual 2020 Actual 2020 Target Target Met? 91% 92.4% 93% 89.5% 90.6% 90%
Analysis The FY 2020 result was 90.6%, exceeding the target of 90%. Before the COVID-19 pandemic, the CPSC was monitoring performance under this key measure by conducting on-site evaluation visits at NEISS hospitals to determine whether coders at those hospitals are capturing the reportable cases correctly. Due to the pandemic, evaluation visits had to be performed remotely. Plan(s) for Improving Performance
To improve future performance, the CPSC will provide training and continue working with the larger or newer hospitals that had poor evaluations, to help improve their capture rate.
Data Source NEISS Administrative Records System (NARS) Data Collection Method and Computation Audit results from each NEISS hospital visit are captured in NARS. Calculate 1 percentage (p) across all the NEISS hospitals that were evaluated during the fiscal year as: p = (∑i(Ni*(ni(coder))/ (si))/ ∑i(Ni*(ni(cpsc))/ (si))) where Ni is the annual number of emergency department-treated cases at the ith NEISS hospital, (si) is the number of cases in sample drawn by the CPSC auditor at the ith NEISS hospital, and ni(coder) and ni(cpsc) are as defined below. During a hospital audit, between 200 and 300 emergency department records are sampled, and the number of product-related cases in the sample are determined. These cases are then compared to the number of product-related cases in the sample, as captured by the NEISS coder. The hospital’s capture metric is estimated as:
(ni(coder))/ (ni(cpsc)) where ni(coder) is the number of product-related cases in the sample of cases (si) as determined by the coder for the ith NEISS hospital; and ni(cpsc) is the number of product-related cases in the sample (si), as determined by the CPSC auditor. The performance metric is then estimated across audited NEISS hospitals as a weighted estimate of the individual hospital metrics.
Data Limitations and Implications of the Reported Results
Findings and guidance for improving the capture rate are provided to the NEISS coder. If capture rates are lower than expected, a second audit may be performed during the year.

2 0 2 0 AP R | J a n u a r y 2 0 2 1 A p p e n d i c e s
C P S C | P a g e 3 8
Control ID Program 2020KM2.2.01 Hazard Identification
Strategic Goal Goal 2: Prevention
Strategic Objective 2.2: Lead efforts to improve the safety of consumer products before they reach the marketplace Performance Measure Statement Number of voluntary standards activities in which CPSC staff actively participates
Definition of Performance Measure CPSC staff provides technical support and monitors voluntary safety standards activities, which are tracked in the Voluntary Standards Tracking Activity Report (V-STAR). A voluntary standard is a prescribed set of rules, conditions, or requirements relating to the safety of consumer products found in the home, schools, and/or recreation areas, which, by itself, imposes no obligation regarding use. In the case of CPSC staff support, a voluntary consumer product safety standard is generally developed using ASTM International (ASTM), Underwriters Laboratories Inc. (UL), or another standards developing organization that is accredited by the American National Standards Institute (ANSI). These voluntary standards may be incorporated, in whole or in part, into CPSC rules, such as rules for durable infant or toddler products, as set forth in the Danny Keysar Child Product Safety Notification Act. Active participation by CPSC extends beyond attendance at meetings, and it may include, among other things, any one or more of the following: providing injury data and hazard analyses; encouraging the development of a voluntary safety standard; identifying specific risks of injury; performing research; developing health science data; performing laboratory technical assistance; providing information on a proposed rulemaking; and taking other actions that the Commission, in a particular situation, determines may be appropriate. A list of these activities can be found at 16 CFR §1031.7.
Rationale for Performance Measure
The CPSC works to minimize hazardous defects through increased participation in voluntary standards activities. The CPSC’s statutory authority requires the agency to rely on voluntary standards, rather than promulgate mandatory standards, if compliance with a voluntary standard would eliminate or adequately reduce the risk of injury identified, and it is likely that there will be substantial compliance with the voluntary standard. 2016 Actual 2017 Actual 2018 Actual 2019 Actual 2020 Actual 2020 Target Target Met?
71 76 77 74 78 78 Analysis
The CPSC met its target by being actively involved in the development of voluntary standards for 78 different products. Twenty-seven new or revised voluntary safety standards were approved in FY 2020. Detailed activities covering these products are published in the VSTAR issued twice a year, in the: (1) Mid-Year Report, and (2) Annual Report, which can be located at: www.cpsc.gov/Regulations-Laws--Standards/Voluntary-Standards.
Plan(s) for Improving Performance
With the new Voluntary Standards Specialist onboard, more attention can be given to voluntary standards work progress and to stay on top of the next actions associated with the voluntary standards.
Data Source
CPSC Voluntary Standards (VS) database, where calendar notices and VS documents are stored. An activity-tracking spreadsheet is also updated regularly.
Data Collection Method and Computation It is a simple count of products that have had voluntary standards activities. Each product that has at least one activity is counted as one. These activities are reported in the bi-annual Voluntary Standards Tracking Activity Report (V-STAR).
Data Limitations and Implications of the Reported Results The CPSC’s participation in voluntary standards activities is an ongoing process that depends on the activities of the voluntary standards committees and the Commission’s priorities. The level of CPSC participation in developing voluntary standards also varies from product to product.

2 0 2 0 AP R | J a n u a r y 2 0 2 1 A p p e n d i c e s
C P S C | P a g e 3 9
Control ID Program
2020KM2.2.02 Hazard Identification
Strategic Goal
Goal 2: Prevention
Strategic Objective
2.2: Lead efforts to improve the safety of consumer products before they reach the marketplace
Performance Measure Statement
Number of candidates for rulemaking prepared for Commission consideration
Definition of Performance Measure
The number of rulemaking briefing packages submitted by CPSC staff for the Commission's consideration
Rationale for Performance Measure
Safety standards address hazards associated with the use of consumer products. Consumer products that have been designed and manufactured to mandatory safety standards help prevent future hazards from occurring.
2016 Actual 2017 Actual 2018 Actual 2019 Actual 2020 Actual 2020 Target Target Met?
10 18 19 14 14 12 Analysis
The CPSC exceeded the FY 2020 target by completing 14 rulemaking packages. The 7 rulemaking packages from the original 12 planned candidates were: Direct Final Rule (DFR)–Non-Full-Size Cribs and Play Yards 112-28 Update; DFR–Toddler Beds 112-28 Update; Supplemental Notice of Proposed Rulemaking (SNPR)–Infant Sleep Products; Final Rule (FR)–Burden Reduction Manufactured Fibers; FR–Gates and Other Enclosures; NPR–Crib Mattresses (include Supplemental and Aftermarket); and NPR–Mattress 16 CFR Part 1632 Surface Testing Exemptions and SRM Cigarette Reference Update. The 7 rulemaking packages in response to emerging requirements were: SNPR–Adjudicative Rules; DFR–Children’s Portable Bed Rails 112-28; DFR—Sling Carriers; DFR–Children’s Folding Chairs 112-28; DFR–Handheld Infant Carriers 112-28; FR–Handheld Infant Carriers; and FR–APSP-16 (“APSP” stands for “Association of Pool and Spa Professionals”).
Plan(s) for Improving Performance While meeting the FY 2020 target, CPSC’s Office of Hazard Identification & Reduction has adapted plans to minimize disruption from the COVID-19 pandemic, and it has had success at operating at the National Product Testing and Evaluation Center (NPTEC) once personal protective equipment (PPE) was procured, which enabled safe lab testing. Data Source
Postings on the CPSC’s website: www.cpsc.gov/newsroom/FOIA/commission-briefing-packages.
Data Collection Method and Computation
Count the number of rulemaking briefing packages (ANPR, DFR, NPR, and FR) posted to: www.cpsc.gov.
Data Limitations and Implications of the Reported Results
This measure reflects the number of rulemaking candidates prepared for the Commission and not necessarily whether they have been approved by the Commission. It also tracks workload accomplishments and does not provide information about the potential safety improvements expected to result from those rulemakings.

2 0 2 0 AP R | J a n u a r y 2 0 2 1 A p p e n d i c e s
C P S C | P a g e 4 0
Control ID Program
2020KM2.2.07* Import Surveillance
Strategic Goal
Goal 2: Prevention
Strategic Objective
2.2: Lead efforts to improve the safety of consumer products before they reach the marketplace
Performance Measure Statement
Percentage of firms that are engaged with timely establishment inspection after being identified as a repeat offender
Definition of Performance Measure
Firms with a history of repeated violations are subject to the requirements of an establishment inspection (EI). This performance measure tracks the percentage of firms that engage in an EI in a timely manner. “Timely” means that the firm engages in an EI within 60 calendar days of the EI assignment date determined by the CPSC.
Rationale for Performance Measure
EIs provide the CPSC an opportunity to help firms with a history of repeated violation to comply with applicable CPSC requirements.
2016 Actual 2017 Actual 2018 Actual 2019 Actual 2020 Actual 2020 Target Target Met?
-- -- 73% 90% 83% 75% Analysis The FY 2020 result was 83%, exceeding the annual target of 75%. Conducting establishment inspections of firms that are repeat offenders is an important part of the agency’s Import Surveillance program because it helps increase the firms’ compliance with CPSC regulations, thereby promoting product safety. However, establishment inspections cannot be executed remotely, and on-site presence of CPSC staff is required to perform those duties. Plan(s) for Improving Performance The agency will continue to prioritize performing establishment inspections of repeat offenders. The CPSC expects to maintain the level of performance that has been captured by this performance measure, provided staff are able to resume conducting on-site establishment inspections. Data Source
Data sources: (1) International Trade Data System/Risk Assessment Methodology (ITDS/RAM) Exam Logbook (2) Integrated Field System (IFS)
Data Collection Method and Computation
Data on repeat offenders (firms with history of repeated violation) are extracted from the IFS system. The IFS, which is also a system used by CPSC staff to record/retrieve inspection cases, is then used to assign/track EI cases for the repeat offenders.
Computation steps: • Calculate the numerator: Count the total number of firms that are engaged in an EI in a timely manner (within 60
calendar days of EI date assigned by CPSC in the IFS) during the fiscal year. • Calculate the denominator: Count the total number of firms that were assigned EI cases during the fiscal year. • Divide the numerator by the denominator to yield the actual result.
Data Limitations and Implications of the Reported Results
It is technically possible for a supervisor to make adjustments to the EI assignment date in the IFS in response to scheduling complications.

2 0 2 0 AP R | J a n u a r y 2 0 2 1 A p p e n d i c e s
C P S C | P a g e 4 1
Control ID Program
2020KM2.2.08 International Programs
Strategic Goal
Goal 2: Prevention
Strategic Objective
2.2: Lead efforts to improve the safety of consumer products before they reach the marketplace
Performance Measure Statement
Recalls per Billion Dollars in Consumer Product Imports for Top 50 Import Sources Countries or Administrative Areas
Definition of Performance Measure
This measure tracks the number of annual recalls per each billion dollars of the total value of consumer products imported from the top 50 import sources, countries, or administrative areas.
Rationale for Performance Measure
2016 Actual 2017 Actual 2018 Actual 2019 Actual 2020 Actual 2020 Target Target Met?
-- -- -- -- 0.21 < 0.33 Analysis
The FY 2020 result was 0.21 recalls per billion dollars, which is below the threshold annual target of 0.33 recalls per billion dollars.
Plan(s) for Improving Performance
The actual result far exceeded the target. EXIP will continue to base its international outreach activities on analysis of import and recalls data, as well as information on production and hazard trends.
Data Source
There are two data sources: • CPSC’s Office of Compliance and Enforcement (EXC) – Provides recall data. • U.S. International Trade Commission (USITC) – Provides trade/import data, which is annually tabulated
by the Directorate of Economic Analysis, under CPSC’s Office of Hazard Identification and Reduction (EXHR).
Data Collection Method and Computation
The result is calculated by dividing the numerator (the number of recalls) by the denominator (the aggregate annual dollar value of consumer product imports from the top 50 import sources, countries, or administrative areas). The numerator (the number of recalls) is obtained by:
• Querying CPSC’s Dynamic Case System. Then data are entered to a spreadsheet.
The denominator (the aggregate annual dollar value of consumer product imports, on a Cost-Insurance-Freight [CIF] basis) is obtained by:
• Tabulating dollar values of imported products, reported with North American Industry Classification System (NAICS) codes on the USITC DataWeb (https://dataweb.usitc.gov), deemed more likely to include products under the CPSC’s jurisdiction.
• The data are then entered into a spreadsheet.
The final annual result is then calculated in Excel, by dividing the numerator by the denominator. Data Limitations and Implications of the Reported Results
Calculating the annual result requires the CPSC to use Department of Commerce trade/import data that are 2 years old, which are the latest data available. For consistency, recall data (from EXC), used in calculating the annual result, are also 2 years old.

2 0 2 0 AP R | J a n u a r y 2 0 2 1 A p p e n d i c e s
C P S C | P a g e 4 2
Control ID Program
2020KM2.3.01 Import Surveillance
Strategic Goal
Goal 2: Prevention
Strategic Objective
2.3: Increase capability to identify and stop imported hazardous consumer products
Performance Measure Statement
Percentage of consumer product imports, identified as high-risk, examined at import
Definition of Performance Measure
The percentage of examined entries identified through CPSC’s Targeting program is computed as the number of targeted entries with logbook exams, divided by the number of targeted entries from CPSC’s Targeting program entered into the International Trade Data System (ITDS)/RAM Inbox.
Rationale for Performance Measure
Targeting identifies characteristics in import shipments that are associated with elevated inherent product risks.
2016 Actual 2017 Actual 2018 Actual 2019 Actual 2020 Actual 2020 Target Target Met?
-- 88.5% 89% 86% 80% 80% Analysis
The FY 2020 result was 80%, meeting the annual target of 80%. This indicates that the CPSC’s Import Surveillance Targeting program is effective in identifying and examining high-risk shipments.
Plan(s) for Improving Performance
The agency will continue to prioritize examining high-risk shipments. The CPSC expects to maintain the level of performance that has been captured by this performance measure, assuming CPSC’s Targeting program continues to be supported.
Data Source
ITDS/RAM Inbox and Exam Logbook
Data Collection Method and Computation
Computation steps: • Calculate the numerator: Count the total number of targeted entries with logbook exams. • Calculate the denominator: Count the total number of targeted entries from CPSC’s Targeting program entered
into ITDS/RAM Inbox. • Divide the numerator by the denominator to yield the actual result.
Data Limitations and Implications of the Reported Results
Examinations data depend on recording by different personnel at different locations.

2 0 2 0 AP R | J a n u a r y 2 0 2 1 A p p e n d i c e s
C P S C | P a g e 4 3
Control ID Program
2020KM2.3.02* Import Surveillance
Strategic Goal
Goal 2: Prevention
Strategic Objective
2.3: Increase capability to identify and stop imported hazardous consumer products
Performance Measure Statement
Percentage of import shipments processed through the Risk Assessment Methodology (RAM) system that are cleared within 1 business day
Definition of Performance Measure
Number of shipments (entry lines) cleared within 1 business day, divided by the total number of shipments (entry lines) processed through the RAM system
Rationale for Performance Measure
The percentage of import shipments the CPSC clears within 1 business day is a measure of how successful the CPSC is at expeditiously processing compliant imports of consumer products and facilitating legitimate trade.
2016 Actual 2017 Actual 2018 Actual 2019 Actual 2020 Actual 2020 Target Target Met?
99.8% 99.8% 99.8% 99.8% 99.9% 99% Analysis
The FY 2020 result was 99.9%, exceeding the FY 2020 target of 99%.This indicates that the CPSC’s import surveillance work is conducted efficiently, and compliant imports are released quickly.
Plan(s) for Improving Performance
The agency will use a similar approach from past years to maintain the level of performance that has been captured by this performance measure.
Data Source
ITDS/RAM Inbox
Data Collection Method and Computation
The status of each entry the CPSC acted on is recorded in the ITDS/RAM system (i.e., "May Proceed," or "CBP Hold Request"). Entries of import shipments that are recorded by CPSC as “May Proceed,” or “Scored,” are considered “Cleared” by CPSC. "Scored" shipments are cleared within 1 business day because no action was taken by the CPSC to stop the cargo from entering commerce. Computation steps:
• Calculate the numerator: Count the total number of shipments (entry lines) cleared within 1 business day. • Calculate the denominator: Count the total number of shipments (entry lines) processed through the RAM
system. • Divide the numerator by the denominator to yield the actual result.
Data Limitations and Implications of the Reported Results
No known data limitations.

2 0 2 0 AP R | J a n u a r y 2 0 2 1 A p p e n d i c e s
C P S C | P a g e 4 4
Control ID Program
2020KM2.3.04* Import Surveillance
Strategic Goal
Goal 2: Prevention
Strategic Objective
2.3: Increase capability to identify and stop imported hazardous consumer products
Performance Measure Statement
Number of import examinations completed
Definition of Performance Measure
Number of examinations conducted by the CPSC on imported consumer products to verify compliance with CPSC rules, regulations, and bans. Each exam is for one product.
Rationale for Performance Measure
The total number of import examinations CPSC performs is a measure of surveillance at U.S. ports to reduce entry of unsafe consumer products.
2016 Actual 2017 Actual 2018 Actual 2019 Actual 2020 Actual 2020 Target Target Met?
36,523 38,726 41,117 39,010 18,561 32,000
Analysis The FY 2020 result was 18,561 exams; the target was 32,000. The CPSC did not meet the target. Due to the COVID-19 pandemic, all CPSC employees began teleworking full-time in March 2020, which continued through the remainder of the fiscal year. As a result, import examinations, which normally require CPSC port investigators to be on-site at the ports, were significantly impacted. Even though the CPSC fell short of its target, CPSC port investigators continued conducting exams after the pandemic started. The CPSC has a long-standing partnership with the U.S. Customs and Border Protection (CBP), which enabled CPSC port investigators to conduct the exams remotely by collaborating with CBP officers at ports, at which CPSC port investigators are normally co-located, through video meetings, phone calls, and emails. Because only certain product types can be screened through the remote exam program, the total number of exams conducted in FY 2020 was significantly lower, compared to prior years. Plan(s) for Improving Performance
The measure reflects CPSC’s capability to examine shipments. The targeted level of performance depends upon import surveillance personnel co-located at ports to examine shipments.
Data Source
Import Exam Logbook
Data Collection Method and Computation
The CPSC records all import examinations it performs in the Import Exam Logbook. This performance measure captures the sum of the number of products with exam dates for the reporting period (fiscal year).
Data Limitations and Implications of the Reported Results
The Office of Import Surveillance (EXIS) conducts data quality checks to ensure import exams are recorded in the Import Exam Logbook. Examination data depend on recording by different personnel at different locations.

2 0 2 0 AP R | J a n u a r y 2 0 2 1 A p p e n d i c e s
C P S C | P a g e 4 5
Control ID Program
2020KM3.1.01* Compliance & Field
Strategic Goal
Goal 3: Response
Strategic Objective
3.1: Rapidly identify hazardous consumer products for enforcement action
Performance Measure Statement
Percentage of cases for which a preliminary determination is made within 85 business days of the case opening
Definition of Performance Measure
The number of cases for which a preliminary determination (PD) has been made within the fiscal year and that was made within 85 business days of the case opening date, divided by the number of cases for which a PD has been made within the fiscal year. PD is the determination made by a panel of managers regarding whether there is enough evidence to preliminarily determine that a substantial potential hazard exists. A case opening is when a case is entered into Dynamic Case Management (DCM) System, which then generates a Case Creation date. This measure excludes Fast-Track cases.
Rationale for Performance Measure
This performance measure is an indicator of the timeliness of CPSC case work. Making PDs efficiently contributes to timely recalls for noncompliant and defective products.
2016 Actual 2017 Actual 2018 Actual 2019 Actual 2020 Actual 2020 Target Target Met?
-- 74% 75% 12.5% 83.3% 65%
Analysis
The target was 65%; FY 2020 actual result was 83.3%. The CPSC met the target. Effective January 2020, EXC’s former Defects Division has been replaced with a new Enforcement and Litigation Division, responsible for substantial product hazard investigations, administrative litigation, and civil penalty work. This new division integrates attorneys at the line and supervisory levels working to strengthen EXC’s ability to efficiently and effectively make analytically sound substantial product hazard determinations.
Plan(s) for Improving Performance
EXC is evaluating possible changes to this measure for FY 2022 to account for complex cases that may require significantly more time (and resources) before reaching a PD.
Data Source
CPSC’s Dynamic Case Management (DCM) System
Data Collection Method and Computation
Data are collected from DCM on all Compliance Action-initiated cases and non-Fast-Track reported cases that went to PD involving products under hazard categories A, B, or C. These classification categories are based on the severity of the most likely injury resulting from the hazard, and the likelihood that such injury will occur. The number of business days is calculated as the number of business days between the Case Creation Date and the PD Date. See also Definition of Performance Measure field above for the computation of this measure.
Data Limitations and Implications of the Reported Results
Results may differ slightly due to updates, edits, or corrections to case data that may occur after the team lead completes fiscal year-end run of data and reports the results.

2 0 2 0 AP R | J a n u a r y 2 0 2 1 A p p e n d i c e s
C P S C | P a g e 4 6
Control ID Program
2020KM3.1.02* Compliance & Field
Strategic Goal
Goal 3: Response
Strategic Objective
3.1: Rapidly identify hazardous consumer products for enforcement action
Performance Measure Statement
Percentage of cases for which a compliance determination of a regulatory violation is made within 35 business days of sample collection (excludes fireworks)
Definition of Performance Measure
The number of cases for which a sample is determined to have a regulatory violation within the fiscal year and the determination was made within 35 business days of the date of the sample collection (excludes fireworks), divided by the number of cases for which a sample is determined to have a regulatory violation within the fiscal year. Samples collected in the field and at the ports are sent to the CPSC’s National Product Testing and Evaluation Center (NPTEC) for analysis; and often, CPSC technical experts conduct additional technical analysis to determine whether a product violates CPSC standards.
Rationale for Performance Measure
This performance measure is an indicator of the timeliness of CPSC regulatory case work. Making determinations of a regulatory violation more quickly contributes to the efficiency and speed of recalls for noncompliant products.
2016 Actual 2017 Actual 2018 Actual 2019 Actual 2020 Actual 2020 Target Target Met?
-- 87% 88.8% 85.1% 89.2%23 85% Analysis
The CPSC met the FY 2020 target of 85%; the actual result was 89.2%, which now excludes fireworks cases because those cases have unique processes.
Plan(s) for Improving Performance
The CPSC completed work on a Business Process Review (BPR) (phase I of IT Modernization of the IFS) to modernize its enforcement business processes, and based on the results, will develop a business efficiency plan and analyze alternatives to develop an improved platform to replace or enhance the Integrated Field System (IFS), which is CPSC’s database system that stores information about field activities, regulated products compliance, and recalls.
Data Source
CPSC’s Integrated Field System (IFS)
Data Collection Method and Computation
IFS tracks the date of sample collection and the date of regulatory violation determination. An ad hoc report in the system runs the computation. See also Definition of Performance Measure field above for the computation of this measure.
Data Limitations and Implications of the Reported Results
Results may differ slightly, due to updates, edits, or corrections to case data that may occur after the team lead completes the fiscal year-end run of data and reports the results.
23 Fireworks cases were disaggregated from this measure and captured by KM 3.1.03, a new FY 2020 measure.

2 0 2 0 AP R | J a n u a r y 2 0 2 1 A p p e n d i c e s
C P S C | P a g e 4 7
Control ID Program
2020KM3.1.03* Compliance & Field
Strategic Goal
Goal 3: Response
Strategic Objective
3.1: Rapidly identify hazardous consumer products for enforcement action
Performance Measure Statement
Percentage of firework cases for which a compliance determination of a regulatory violation is made within 70 business days of sample collection
Definition of Performance Measure
The number of cases for which a fireworks sample is determined to have a regulatory violation within the fiscal year and the determination was made within 70 business days of the date of the sample collection, divided by the number of cases for which a sample is determined to have a regulatory violation within the fiscal year. Fireworks samples collected in the field and at the ports are sent to the CPSC’s National Product Testing and Evaluation Center (NPTEC) for analysis; and often, CPSC technical experts conduct additional technical analysis to determine whether a product violates CPSC standards.
Rationale for Performance Measure
This performance measure is an indicator of the timeliness of CPSC regulatory case work. Making determinations of a regulatory violation more quickly contributes to the efficiency and speed of recalls for noncompliant products.
2016 Actual 2017 Actual 2018 Actual 2019 Actual 2020 Actual 2020 Target Target Met?
-- -- -- -- 42.9% 85% Analysis
This was a new measure in FY 2020; it was established to track only fireworks cases and was disaggregated from its original measure (KM 3.1.02). The target was 85%; the FY 2020 actual result was 42.9%. The CPSC did not meet the target because the COVID-19 pandemic prevented staff from working full-time in the laboratory to perform testing from March 2020 through most of the remainder of the fiscal year. As a result, the number of days between sample collection and a compliance determination based on lab testing results was affected.
Plan(s) for Improving Performance
Performance should improve as COVID-19 limitations dissipate.
Data Source
CPSC’s Integrated Field System (IFS)
Data Collection Method and Computation
IFS tracks the date of sample collection and the date of regulatory violation determination. An ad hoc report in the system runs the computation. See also Definition of Performance Measure field above for the computation of this measure.
Data Limitations and Implications of the Reported Results
Results may differ slightly, due to updates, edits, or corrections to case data that may occur after the team lead completes the fiscal year-end run of data and reports the results.

2 0 2 0 AP R | J a n u a r y 2 0 2 1 A p p e n d i c e s
C P S C | P a g e 4 8
Control ID Program
2020KM3.2.02 Compliance & Field
Strategic Goal
Goal 3: Response
Strategic Objective
3.2: Minimize further exposure to hazardous consumer products
Performance Measure Statement
Percentage of cases for which a firm is notified of a regulatory violation within 40 business days from sample collection (excludes fireworks)
Definition of Performance Measure
The number of cases for which a firm was first notified of a violation within the fiscal year and was notified within 40 business days of the date a sample was collected (excludes fireworks), divided by the number of cases for which a firm was first notified of a violation within the fiscal year. The firm is initially notified of a violation via phone or email, and written confirmation is obtained and the date is entered into IFS under Notify Date. However, if written confirmation is not obtained, the Notice of Violation (NOV)24 date will serve as the date of the first form of notification.
Rationale for Performance Measure
This performance measure is an indicator of the timeliness of CPSC’s notice to firms of violations resulting from sample collection.
2016 Actual 2017 Actual 2018 Actual 2019 Actual 2020 Actual 2020 Target Target Met?
-- 86% 87.2% 85.5% 85.6%25 85% Analysis
The CPSC met the FY 2020 target of 85%; the actual result was 85.6%, which now excludes fireworks cases because those cases have unique processes.
Plan(s) for Improving Performance
The CPSC completed work on a Business Process Review (BPR) (phase I of IT Modernization of the IFS) to modernize its enforcement business processes, and based on the results, will develop a business efficiency plan and analyze alternatives to develop an improved platform to replace or enhance the Integrated Field System, which is CPSC’s database system that stores information about field activities, as well as regulated products compliance and recalls.
Data Source
CPSC’s Integrated Field System (IFS)
Data Collection Method and Computation
IFS tracks the date of sample collection and the date of company notification. An ad hoc report in the system runs the computation. See also Definition of Performance Measure field above for the computation of this measure.
Data Limitations and Implications of the Reported Results
Results may differ slightly, due to updates, edits, or corrections to case data that may occur, after the team lead completes the fiscal year-end run of data and reports the results.
24 A Notice of Violation (NOV) is issued when a firm has violated a mandatory standard. NOVs are issued by the Office of Compliance (EXC) and, starting in FY 2020, are also issued by the Office of Import Surveillance on behalf of EXC. 25 Fireworks cases were disaggregated from this measure and captured by KM 3.2.05, a new FY 2020 measure.

2 0 2 0 AP R | J a n u a r y 2 0 2 1 A p p e n d i c e s
C P S C | P a g e 4 9
Control ID Program
2020KM3.2.03 Compliance & Field
Strategic Goal
Goal 3: Response
Strategic Objective
3.2: Minimize further exposure to hazardous consumer products
Performance Measure Statement
Percentage of Fast-Track cases with corrective actions initiated within 20 business days of case opening
Definition of Performance Measure
The number of Fast-Track cases with a Corrective Action Plan (CAP) Accept date within the fiscal year for which a firm had a Stop Sale date within 20 business days of the Case Opening date, divided by the number of Fast-Track cases with a CAP Accept date within the fiscal year. A Case Opening is when a case is entered into the DCM System, which then generates a Case Creation date. A Stop Sale date is the date when notice was given to stop sale or distribution of affected products, and is considered to be the date a corrective action was initiated.
Rationale for Performance Measure
Industry has an opportunity to participate in a streamlined recall process through the Fast-Track Product Recall Program, which is designed to remove potentially dangerous products from the marketplace more quickly and save the company and the CPSC time and resources. To potentially take advantage of the Fast-Track program, a firm must, among other steps, commit to implementing a sufficient consumer-level voluntary recall within 20 business days of the case opening. Increased timeliness of processing these cases contributes to the efficiency and speed of recalls for noncompliant and defective consumer products.
2016 Actual 2017Actual 2018 Actual 2019 Actual 2020 Actual 2020 Target Target Met?
99.1% 98% 95.9%26 97.4% 96.5% 90% Analysis
The CPSC exceeded the FY 2020 target of 90%; the actual result was 96.5%.
Plan(s) for Improving Performance
In FY 2021, with stakeholder input, the agency will continue developingf a new online portal to improve the user experience for stakeholders seeking to participate in Fast-Track recall cases.
Data Source
CPSC’s Dynamic Case Management (DCM) System
Data Collection Method and Computation
The CPSC collects data from DCM on all Fast-Track reported cases where the firm stopped sale. See also Definition of Performance Measure field above for the computation of this measure.
Data Limitations and Implications of the Reported Results This measure accounted for corrective action taken by a firm (i.e., product discontinued or stop sale issued) that occurred prior to the Case Opening date on DCM resulting in the computation of negative days. There are cases in this category—where a Stop Sale date happened prior to the Case Open date—meaning that the cases were already met before the cases were even opened on DCM. On a separate note, results may differ slightly due to updates, edits, or corrections to case data that may occur, after the team lead completes the fiscal year-end run of data and reports the results.
26 A new computation method, as a result of an audit recommendation by CPSC’s Office of the Inspector General, was implemented in FY 2018. The actual results since FY 2018 are not comparable to those prior to FY 2018.

2 0 2 0 AP R | J a n u a r y 2 0 2 1 A p p e n d i c e s
C P S C | P a g e 5 0
Control ID Program
2020KM3.2.04* Compliance & Field
Strategic Goal
Goal 3: Response
Strategic Objective
3.2: Minimize further exposure to hazardous consumer products
Performance Measure Statement
Percentage of cases for which a corrective action is accepted within 90 business days of preliminary determination
Definition of Performance Measure
The number of cases for which a Corrective Action Plan (CAP) was accepted within the fiscal year, and it was accepted within 90 business days of the PD date, divided by the number of cases for which a CAP has been accepted within the fiscal year where a PD is made. PD is the determination made by a panel of managers about whether there is enough evidence to preliminarily determine the existence of a substantial potential hazard. This measure is limited to cases with hazard priority A, B and C, and excludes Fast-Track cases.
Rationale for Performance Measure
This performance measure tracks the timeliness of the CPSC’s negotiation of CAPs with companies. More timely negotiation of CAPs contribute to the efficiency and speed of recalls for noncompliant and defective products.
2016 Actual 2017 Actual 2018 Actual 2019 Actual 2020 Actual 2020 Target Target Met?
-- -- 92.7% 76.9% 71.4% 60% Analysis
The CPSC exceeded the FY 2020 target of 60%; the actual result was 71.4%, which was lower than the two prior years’ results. This number may fluctuate depending on the number of more complex, contested matters in a given year. Effective January 2020, EXC’s former Defects Division has been replaced with a new Enforcement and Litigation Division, responsible for substantial product hazard investigations, administrative litigation, and civil penalty work. This new division integrates attorneys at the line and supervisory levels, which will strengthen EXC’s ability to efficiently and effectively make analytically sound substantial product hazard determinations and negotiate CAPs.
Plan(s) for Improving Performance
Starting in FY 2021, this measure will be replaced with a new measure to better reflect effective work on substantial hazard matters.
Data Source
CPSC’s Dynamic Case Management (DCM) System
Data Collection Method and Computation
The CPSC collects data from DCM on all Compliance Action (CA) initiated cases and non-Fast-Track Reported (RP) cases, where a CAP is accepted. See also Definition of Performance Measure field above for the computation of this measure.
Data Limitations and Implications of the Reported Results
Results may differ slightly, due to updates, edits, or corrections to case data that may occur, after the team lead completes the fiscal year-end run of data and reports the results.

2 0 2 0 AP R | J a n u a r y 2 0 2 1 A p p e n d i c e s
C P S C | P a g e 5 1
Control ID Program
2020KM3.2.05 Compliance & Field
Strategic Goal
Goal 3: Response
Strategic Objective
3.2: Minimize further exposure to hazardous consumer products
Performance Measure Statement
Percentage of fireworks cases for which a firm is notified of a regulatory violation within 75 business days from sample collection
Definition of Performance Measure
The number of fireworks cases for which a firm was first notified of a violation within the fiscal year and was notified within 75 business days of the date a sample was collected, divided by the number of cases for which a firm was first notified of a violation within the fiscal year. The firm is initially notified of a violation via phone or email, and written confirmation is obtained and the date is entered into IFS under Notify Date. However, if written confirmation is not obtained, the Notice of Violation (NOV) date will serve as the date of the first form of notification.
Rationale for Performance Measure
This performance measure is an indicator of the timeliness of CPSC’s notice to firms of violations resulting from sample collection.
2016 Actual 2017 Actual 2018 Actual 2019 Actual 2020 Actual 2020 Target Target Met?
-- -- -- -- 42.9% 85%
Analysis
This was a new measure in FY 2020; it was established to track only fireworks cases and was disaggregated from its original measure (KM 3.2.02). The target was 85 percent; the FY 2020 actual result was 42.9 percent. The CPSC did not meet the target because the COVID-19 pandemic prevented staff from working full-time in the laboratory to perform testing from March 2020 through most of the remainder of the fiscal year. As a result, the number of days between sample collection and regulatory violation notification was affected.
Plan(s) for Improving Performance
Performance should improve as COVID-19 limitations dissipate.
Data Source
CPSC’s Integrated Field System (IFS)
Data Collection Method and Computation
IFS tracks the date of sample collection and the date of company notification. An ad hoc report in the system runs the computation. See also Definition of Performance Measure field above for the computation of this measure.
Data Limitations and Implications of the Reported Results
Results may differ slightly, due to updates, edits, or corrections to case data that may occur, after the team lead completes the fiscal year-end run of data and reports the results.

2 0 2 0 AP R | J a n u a r y 2 0 2 1 A p p e n d i c e s
C P S C | P a g e 5 2
Control ID Program
2020KM3.3.01 Compliance & Field
Strategic Goal
Goal 3: Response
Strategic Objective
3.3: Improve consumer response to consumer product recalls
Performance Measure Statement
Recall effectiveness rate for all consumer product recalls
Definition of Performance Measure
Total number recalled products within the fiscal year that were corrected, divided by the total number of products recalled within the fiscal year. The CPSC deems a case to be closed when the last action is taken via reports of significant improvement and collection of recall products, a decision is made not to do a recall, or for other unique reasons or circumstances.
Rationale for Performance Measure
The performance measure is intended to improve understanding of the overall effectiveness of product recalls at all levels, including products at the manufacturer, distributor, retailer, and consumer levels. Typically, recalls of consumer products are conducted voluntarily by firms that work with the CPSC to develop a CAP that will protect the public from potentially unsafe products. Recalls include a notice to the public and some remedial measures, such as a repair, a replacement of the product, or a refund to the purchaser.
2016 Actual 2017 Actual 2018 Actual 2019 Actual 2020 Actual 2020 Target Target Met?
-- 41% 17.4% 21.4% 32.6% 25% Analysis
The target was 25%; the FY 2020 actual result was 32.6%. Although the CPSC met the target this year, the recall effectiveness rate is highly volatile and is dependent on the type of product and number of units involved in the recalls as well as consumers’ responses to the recalls.
Plan(s) for Improving Performance
The CPSC will continue working with recalling firms to maximize notification to consumers, including through direct notice, social media, and other technological means.
Data Source
CPSC’s Dynamic Case Management (DCM) System and Integrated Field System (IFS)
Data Collection Method and Computation
Recall information is gathered from Monthly Progress Reports provided by the recalling firms. Data from this source are entered into DCM. The data evaluated for this effort were DCM-closed cases for FY 2020. See also Definition of Performance Measure field above for the computation of this measure.
Data Limitations and Implications of the Reported Results
The CPSC relies on the data provided by the recalling firms. Results may differ slightly, due to updates, edits, or corrections to case data that may occur, after the team lead completes the fiscal year-end run of data and reports the results.

2 0 2 0 AP R | F e b r u a r y 2 0 2 1 A p p e n d i c e s
C P S C | P a g e 5 3
Control ID Program 2020KM4.1.02* Communications
Strategic Goal Goal 4: Communication
Strategic Objective 4.1: Improve usefulness and availability of consumer product safety information
Performance Measure Statement
Number of engagements with CPSC safety messaging on social media channels by stakeholders (in thousands)
Definition of Performance Measure
Number of stakeholder engagements with CPSC safety messages on Twitter, Instagram, and Facebook, as measured by social media monitoring services
Rationale for Performance Measure
Engagement refers to consumers who are sharing, forwarding, and/or re-tweeting CPSC safety messages.
2016 Actual 2017 Actual 2018 Actual 2019 Actual 2020 Actual 2020 Target Target Met?
-- 285 831 1,468 12,095 840 Analysis
The CPSC exceeded the FY 2020 target with more than 12 million engagements, an increase of more than 700 percent from 1.47 million in FY 2019. This success was due in part to CPSC’s creative advertising on various social media platforms, as well as CPSC’s use of audience optimizing to maximize engagements from social media users who would be receptive to the agency’s social media messaging.
Plan(s) for Improving Performance
The CPSC will continue to design and develop new online and social media communication to disseminate through social media and drive more engagement with CPSC safety messages.
Data Source
CPSC’s contracted social media monitoring companies for data on engagement.
Data Collection Method and Computation
Data are provided by contracted media monitoring companies that subscribe to media measurement tools that are used by a broad spectrum of companies, such as advertisers, agencies, and research firms that need reliable audience data. All engagement data are added together in a spreadsheet.
Data Limitations and Implications of the Reported Results
Units of social media engagement vary among the different media platforms. The reported result is a mixture of these engagement units.
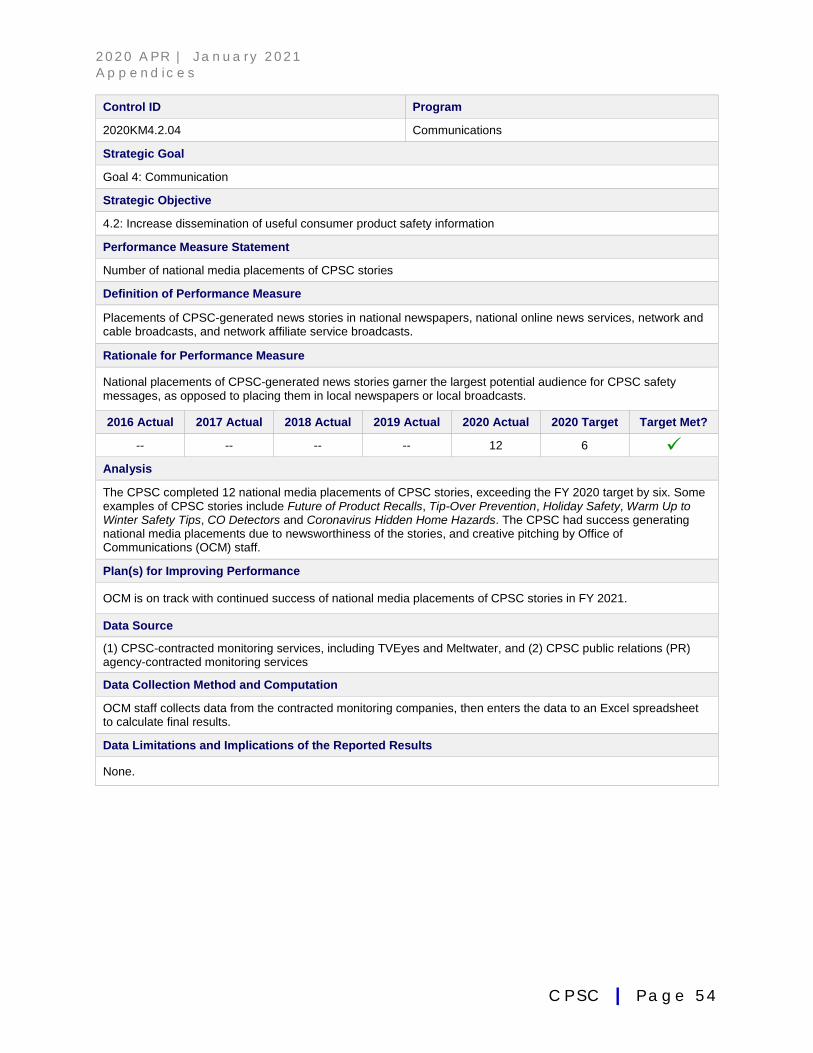
2 0 2 0 AP R | J a n u a r y 2 0 2 1 A p p e n d i c e s
C P S C | P a g e 5 4
Control ID Program
2020KM4.2.04 Communications
Strategic Goal
Goal 4: Communication
Strategic Objective
4.2: Increase dissemination of useful consumer product safety information
Performance Measure Statement
Number of national media placements of CPSC stories
Definition of Performance Measure
Placements of CPSC-generated news stories in national newspapers, national online news services, network and cable broadcasts, and network affiliate service broadcasts.
Rationale for Performance Measure
National placements of CPSC-generated news stories garner the largest potential audience for CPSC safety messages, as opposed to placing them in local newspapers or local broadcasts.
2016 Actual 2017 Actual 2018 Actual 2019 Actual 2020 Actual 2020 Target Target Met?
-- -- -- -- 12 6 Analysis
The CPSC completed 12 national media placements of CPSC stories, exceeding the FY 2020 target by six. Some examples of CPSC stories include Future of Product Recalls, Tip-Over Prevention, Holiday Safety, Warm Up to Winter Safety Tips, CO Detectors and Coronavirus Hidden Home Hazards. The CPSC had success generating national media placements due to newsworthiness of the stories, and creative pitching by Office of Communications (OCM) staff.
Plan(s) for Improving Performance
OCM is on track with continued success of national media placements of CPSC stories in FY 2021.
Data Source
(1) CPSC-contracted monitoring services, including TVEyes and Meltwater, and (2) CPSC public relations (PR) agency-contracted monitoring services
Data Collection Method and Computation
OCM staff collects data from the contracted monitoring companies, then enters the data to an Excel spreadsheet to calculate final results.
Data Limitations and Implications of the Reported Results
None.

2 0 2 0 AP R | J a n u a r y 2 0 2 1 A p p e n d i c e s
C P S C | P a g e 5 5
Control ID Program
2020KM4.2.05* Communications
Strategic Goal
Goal 4: Communication
Strategic Objective
4.2: Increase dissemination of useful consumer product safety information
Performance Measure Statement
Percentage of recall press release issued in 22 business days or less from first draft
Definition of Performance Measure
The total number of recall press releases issued in 22 business days or less from first draft, divided by the total number of recall press releases.
Rationale for Performance Measure
This performance measure is an indicator of the timeliness of recall press releases from first draft to issuance. The more quickly the CPSC and firms negotiate and issue press releases on consumer product recalls, the quicker the product hazard information is disseminated to consumers, enabling them to act more quickly on the recall.
2016 Actual 2017 Actual 2018 Actual 2019 Actual 2020 Actual 2020 Target Target Met?
-- -- -- -- 63% 60% Analysis
This is a new measure in FY 2020, an improved measure to track 100% of all recall press releases instead of only the timeliest 90% of the recall press releases. The FY 2020 actual result is 63%, slightly higher than the target of 60%.
Plan(s) for Improving Performance
Offices within the CPSC and the recalling firm work together to formulate and announce recall press releases as expeditiously as possible to protect consumers from hazardous recalled products. In FY 2021, this measure will be replaced by a new measure tracking the percentage of recall press releases turned around on a timely basis by the Office of Communications (OCM), once it has received the first draft from the Office of Compliance (EXC). This will measure the segment of the process that is within the CPSC’s control.
Data Source
CPSC News Release Performance (Tracking) Log
Data Collection Method and Computation
Data on recall announcements (regular recalls and recall alerts) are tracked and transferred to a performance log that compiles OCM’s dates for First Draft, Recall Issuance as well as the number of business days between these dates.
Data Limitations and Implications of the Reported Results
Even though the result of this measure is partially subject to CPSC’s actions, it is also subject to the recalling firm’s response time on the recall press release. Some firms have had logistical challenges executing recalls during the COVID-19 pandemic; this slows down the recalling firm’s response time.

2 0 2 0 AP R | J a n u a r y 2 0 2 1 A p p e n d i c e s
C P S C | P a g e 5 6
Appendix D: Acronyms
APR Annual Performance Report BPR Business Process Review CAP Corrective Action Plan CBP U.S. Customs and Border Protection CDC U.S. Centers for Disease Control and Prevention CFR Code of Federal Regulations CONOPS e-Commerce Concept of Operations and Implementation Plan CPSC U.S. Consumer Product Safety Commission CPSIA Consumer Product Safety Improvement Act
CPSRMS Consumer Product Safety Risk Assessment Management System DCM Dynamic Case Management System EDAS Enterprise Data Analytics Strategy FEVS Federal Employee Viewpoint Survey FTE Full-time Equivalent FY Fiscal Year GSA General Services Administration IAA Interagency Agreement IFS Integrated Field System ITDS International Trade Data System NEISS National Electronic Injury Surveillance System NIST National Institute of Standards and Technology OECD Organisation for Economic Cooperation and Development OFR Organohalogen OMB Office of Management and Budget PBR Performance Budget Request RAM Risk Assessment Methodology SDR Strategic Data Review

2 0 2 0 AP R | J a n u a r y 2 0 2 1 A p p e n d i c e s
U.S. Consumer Product Safety Commission Bethesda, MD 20814