fy sedimentation test for evaluation of flour quality of ... · the protein content of the flour...
TRANSCRIPT
GRAIN QUALITY
FY Sedimentation Test for Evaluation of Flour Quality of Canadian Wheats'
J. E. KRUGER and D. W. HATCHER
ABSTRACT Cereal Chem. 72(l):33-37
The FY sedimentation test is commonly used by manufacturers of Spring and Western Soft White wheat classes decreased. Examinationsteamed and fried noodles as one of their flour quality specifications. of flours increasing in protein content and dough strength suggested thatThe FY sedimentation values of Canadian wheat flours were determined, the latter was associated with the resultant changes in sedimentationand some of the factors influencing the test results were examined. FY volumes with time. Flour extraction rate was also found to have anreadings within the first hour for different wheat classes were as predicted influence on FY sedimentation values, as the 30% extraction flours' initialon the basis of their relative protein content and strength. In subsequent readings were all significantly different from those at or above 50 or2- and 3-hr sedimentation gel volumes, variations in trends existed between 60% flour extraction. Effects due to sprout damage were minimal. Athe different classes. Canadian Western Red Spring and Red Winter wheat minimum two-week aging period after milling was necessary to ensureclasses increased in sedimentation gel volumes, while the Canadian Prairie reproducible discrimination of the sediment interface.
The FY sedimentation test was developed by the Committeeof Japanese Bread Science (Akatsu 1954) as an indication of thecharacteristics of flour for various end-products. It is similar toa Zeleny sedimentation test (Zeleny 1947), but it is performedon flour rather than on wheat. Furthermore, the volume of sedi-ment is read not only at 5 min, but at 30 and 60 min, afterwhich the suspension is shaken again and the process repeated,followed by a third shaking and reading of sedimentation volumes.These readings produce an FY diagram that is indicative of thesuitability of the flour for bread, noodles, or confectionery products.It is also useful for blending of flours to achieve optimum specifi-cations for these products. As with the Zeleny sedimentation test,the main influence on the FY sedimentation test appears to bethe protein content of the flour and its inherent dough stability(Moss 1984, Martin and Stewart 1991). In recent years, somemills in Southeast Asia may have included FY sedimentationvalues in their flour quality specifications at the request of instantnoodle makers. In many cases, only 5 min readings are necessary,and a minimum FY value of 50-55 is required generally for noodles.
The present study was conducted to determine the FY sedi-mentation values of flours representative of the main classes ofwheat grown in Canada. In addition, the degree to which factorssuch as protein content, mill extraction rate, and sprout damageinfluenced test results was examined.
MATERIALS AND METHODS
Flour SamplesFlours (28) were from 1991 and 1992 crop year cargo or new
crop composite samples and represented the Canadian WesternRed Spring (CWRS), Canadian Western Red Winter (CWRW),Canadian Prairie Spring white (CPS white) and red (CPS red),Canada Western Soft White Spring (CWSWS), and CanadaWestern Extra Strong (CWES) wheat classes. All were milledon an Allis-Chalmers laboratory mill using the GRL sifter flowas described by Black et al (1980).
The milling procedure for the production of composite flourswith different degrees of refinement and their properties aredescribed in Kruger et al (1994). Wheats representative of theCWRS, CWRW, CPS white, CPS red, and CWSWS classes weremilled on the laboratory Allis-Chalmers mill and individual millstreams composited on the basis of increasing ash to produceflours with an extraction range of -30-75%.
'Contribution 726 of the Canadian Grain Commission, Grain Research Laboratory,Winnipeg.
© 1995 Department of Agriculture and Agri-Food, Government of Canada
FY Sedimentation TestThe procedure of Akatsu (1954) was followed, except that the
water bath temperature was maintained at 350 C rather than 500 C.A 5-g sample of flour was placed in a 100-ml graduated cylinder,and 50 ml of 0.2% lactic acid at 350C was added. The cylinderwas capped and shaken by hand for 10 sec. An additional 50 mlof lactic acid solution was added. The cylinder was inverted fivetimes and placed in a 350C water bath. Readings of the sedimentvolume were taken at 5, 30, and 60 min. After the 60-min reading,the cylinder was quickly inverted five times to resuspend thematerial, and the three new timed measurements recorded. Thisprocess was repeated a third time to yield nine data points. Atypical FY diagram and the nomenclature used to indicate variouspoints are indicated for CWRS wheat flour in Figure 1. Analyseswere performed in triplicate (average coefficient of variation =3.3%). Sedimentation volumes could be read more easily by adding0.01% bromophenol blue to the lactic acid solution and usingfluorescent backlighting. Preliminary investigations using the testprocedure determined that freshly milled samples were difficultto read and required at least two weeks aging before satisfactorydiscrimination of the gel interface could be obtained.
Ash ContentAsh content was determined using AACC method 08-01 (AACC
1983) on a 4-g sample in a silica dish incinerated overnight at6000 C.
Protein ContentProtein content was determined by the modified Kjeldahl
method (Williams 1973), and the results are expressed on a 14%moisture basis.
Falling NumberFalling number was determined on a 7-g sample of ground
wheat using AACC method 56-81B. Wheat (300 g) was groundin a Falling Number laboratory mill 3100, and the results arereported on a 14.0% moisture basis.
Physical Dough PropertiesRheological properties were determined according to AACC
method 54-21 (AACC 1983) using a farinograph equipped witha 50-g bowl. CWES wheat flours do not develop at a mixingspeed of 65 rpm; consequently, a speed of 90 rpm was used,as described by Preston and Kilborn (1984).
Statistical AnalysesAll statistical analyses were performed using SAS (version 6.08)
software (SAS Institute, Cary, NC).
Vol. 72, No. 1, 1995 33
RESULTS AND DISCUSSION
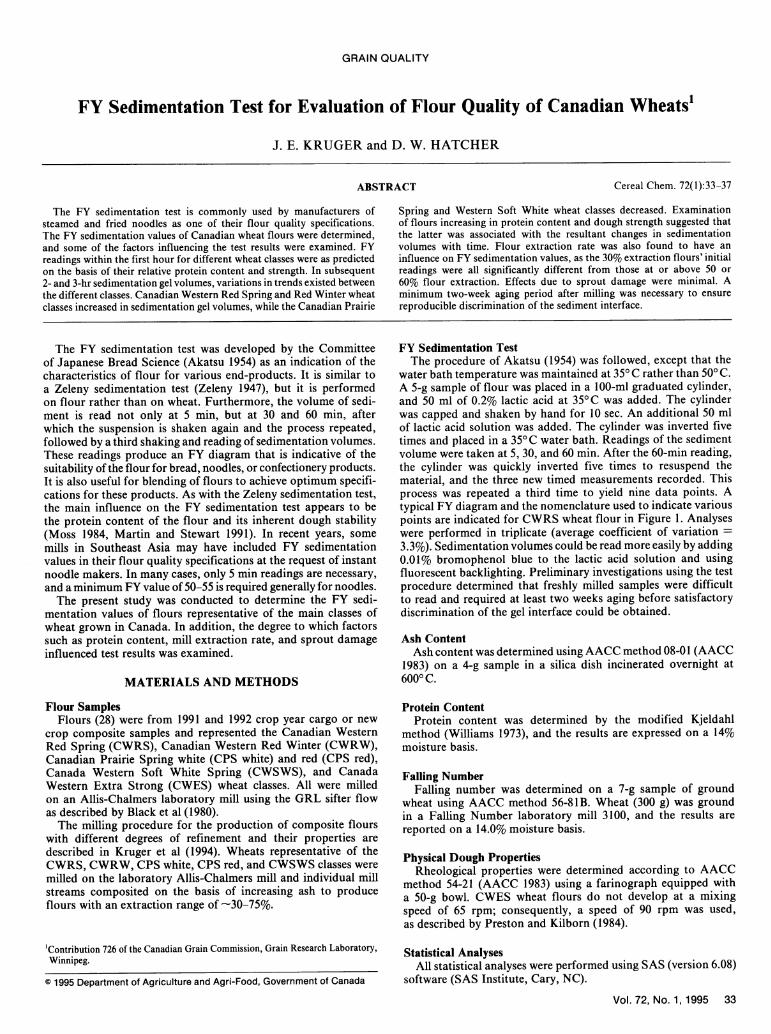
FY Sedimentation Values of Canadian Wheat ClassesTypical FY diagrams for flours of Canadian wheat classes grown
in Western Canada are shown in Figure 1. Canadian Red Springwheat is the predominant wheat class grown in Western Canada,and the FY diagram for its flour has been superimposed on thatof the other classes for better comparison. It is obvious that thereare substantial differences in the various diagrams and that muchmore information is potentially available with this test than withthe Zeleny sedimentation test, in which only one reading is taken.In general terms, the height of the initial reading relates to boththe protein and the overall strength of the flour, much as theZeleny sedimentation test does (see reports issued by the CanadianGrain Commission for specific information on quality differencesbetween Canadian wheat classes). For example, the greater proteincontent and stronger dough characteristic in the CWRS, CWRW,and CWES wheat classes result in initial FY sedimentation values(T5-1) over 70 ml. The medium protein and dough strength CPSclass give values around 60 ml, whereas the low protein and weakerCWSWS wheat flour results in FY sedimentation values lowerthan 40 ml. Measurements after the second and third shakingperiods (T5-2 and T5-3) vary from class to class and either increaseor decrease. These changes again appear to reflect the relativecharacteristics of the wheat flour in terms of protein strength.Thus, CWES wheat flour is extremely strong and is used forblending purposes. Its sedimentation volumes increased drama-tically with each shaking period. CWRS wheat flour, which hasgood dough strength, also increased in sedimentation volume withtime, but to a lesser extent than CWES. CWRW wheat is slightlyless strong than CWRS wheat flours and had sedimentationvolumes that increased minimally. Contrasted to this were thetwo CPS wheat flour types of medium dough strength thatdecreased in sedimentation volume with each shaking period.Finally, the very weak CWSWS wheat flour decreased in sedi-
mentation volume with each shaking period, but because of itslow initial sedimentation volume, the overall decrease in sedi-mentation volume was limited.
In most cases, although not all, the rate of decrease in sedimenta-tion volume with time after each progressive shaking (T30 andT60 readings) paralleled each other for a particular wheat class(Fig. 1). This suggests that representative information can beobtained from the 5-min values after each shaking period (T5-1,T5-2, and T5-3). As a consequence, although the entire nine pointswere recorded for all flours in the present study, our discussionwill focus primarily on the 5-min values.
Effect of Increasing Protein Content and Strengthon FY Sedimentation Values
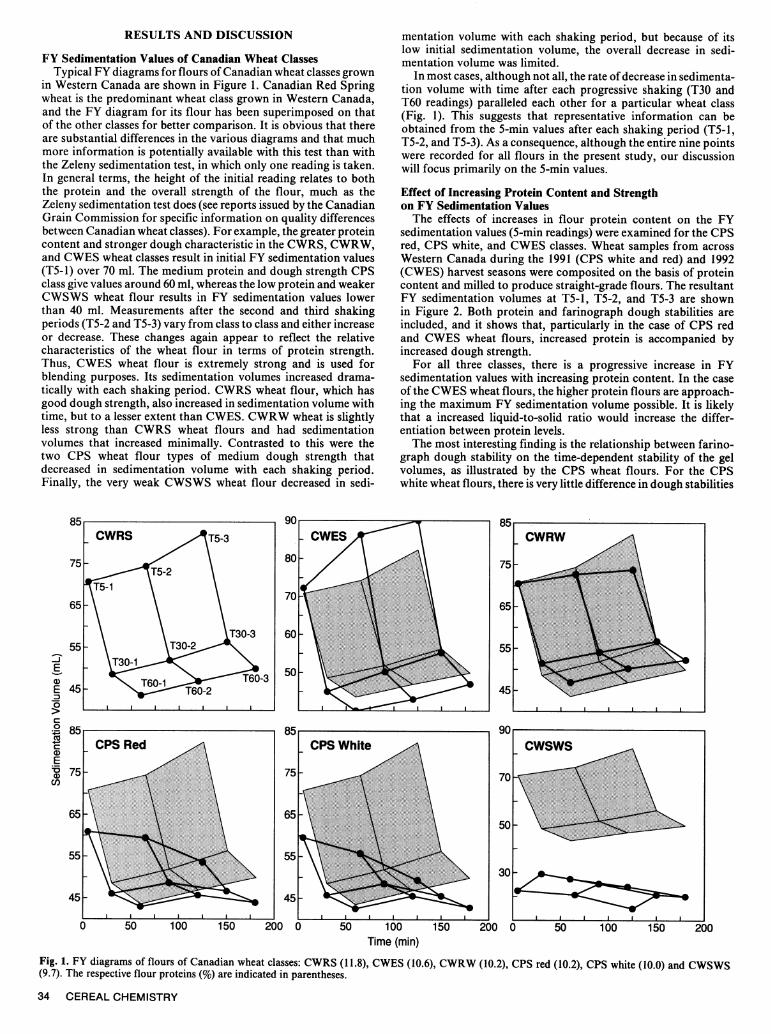
The effects of increases in flour protein content on the FYsedimentation values (5-min readings) were examined for the CPSred, CPS white, and CWES classes. Wheat samples from acrossWestern Canada during the 1991 (CPS white and red) and 1992(CWES) harvest seasons were composited on the basis of proteincontent and milled to produce straight-grade flours. The resultantFY sedimentation volumes at T5-1, T5-2, and T5-3 are shownin Figure 2. Both protein and farinograph dough stabilities areincluded, and it shows that, particularly in the case of CPS redand CWES wheat flours, increased protein is accompanied byincreased dough strength.
For all three classes, there is a progressive increase in FYsedimentation values with increasing protein content. In the caseof the CWES wheat flours, the higher protein flours are approach-ing the maximum FY sedimentation volume possible. It is likelythat a increased liquid-to-solid ratio would increase the differ-entiation between protein levels.
The most interesting finding is the relationship between farino-graph dough stability on the time-dependent stability of the gelvolumes, as illustrated by the CPS wheat flours. For the CPSwhite wheat flours, there is very little difference in dough stabilities
E
E 45 -
_ II01C tC
.t:_
c
E'aa)CD)
85CPS Red
..... ....... . .... .75
........ ..........\ .. ......... ...............................W J .,..,..............................,........,....X.,.....,...,.,...,... .. .... .............,,65
45
0 50 100 150 200 50 100Time (min)
150 200 0 50 100 150
Fig. 1. FY diagrams of flours of Canadian wheat classes: CWRS (11.8), CWES (10.6), CWRW (10.2), CPS red (10.2), CPS white (10.0) and CWSWS(9.7). The respective flour proteins (%) are indicated in parentheses.
34 CEREAL CHEMISTRY
CWRW
75 -
65
55-
45
9Ur
70
50
30
200
MO I
I I I I I . . .--w
I I I I I I I --- I
at the different protein levels, and the FY sedimentation valuesat successive 5-min shaking periods are consistent in that decreasesin gel volumes occur in most cases. For the CPS red wheatsflours, those with dough stabilities through 7.5 min decrease ingel volume with progressive shakings. The flour with a proteincontent of 11.7% and dough stability of 10.0 min, on the otherhand, has a fairly constant gel volume with time, and the flourwith a protein content of 12.5 and dough stability of 12.5 minhas an increased sedimentation volume with later 5-min valuescompared to the initial reading. These results would implicatedough strength as a factor associated with time-dependent gelstability.
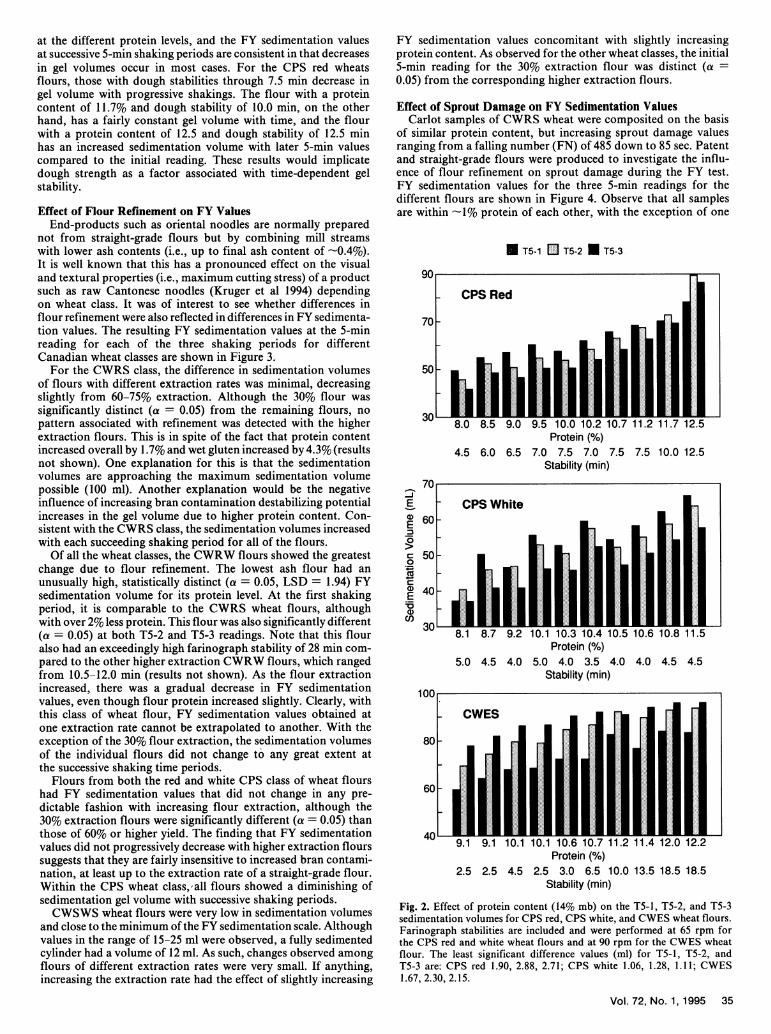
Effect of Flour Refinement on FY ValuesEnd-products such as oriental noodles are normally prepared
not from straight-grade flours but by combining mill streamswith lower ash contents (i.e., up to final ash content of -0.4%).It is well known that this has a pronounced effect on the visualand textural properties (i.e., maximum cutting stress) of a productsuch as raw Cantonese noodles (Kruger et al 1994) dependingon wheat class. It was of interest to see whether differences inflour refinement were also reflected in differences in FY sedimenta-tion values. The resulting FY sedimentation values at the 5-minreading for each of the three shaking periods for differentCanadian wheat classes are shown in Figure 3.
For the CWRS class, the difference in sedimentation volumesof flours with different extraction rates was minimal, decreasingslightly from 60-75% extraction. Although the 30% flour wassignificantly distinct (a = 0.05) from the remaining flours, nopattern associated with refinement was detected with the higherextraction flours. This is in spite of the fact that protein contentincreased overall by 1.7% and wet gluten increased by 4.3% (resultsnot shown). One explanation for this is that the sedimentationvolumes are approaching the maximum sedimentation volumepossible (100 ml). Another explanation would be the negativeinfluence of increasing bran contamination destabilizing potentialincreases in the gel volume due to higher protein content. Con-sistent with the CWRS class, the sedimentation volumes increasedwith each succeeding shaking period for all of the flours.
Of all the wheat classes, the CWRW flours showed the greatestchange due to flour refinement. The lowest ash flour had anunusually high, statistically distinct (a = 0.05, LSD = 1.94) FYsedimentation volume for its protein level. At the first shakingperiod, it is comparable to the CWRS wheat flours, althoughwith over 2% less protein. This flour was also significantly different(a = 0.05) at both T5-2 and T5-3 readings. Note that this flouralso had an exceedingly high farinograph stability of 28 min com-pared to the other higher extraction CWRW flours, which rangedfrom 10.5-12.0 min (results not shown). As the flour extractionincreased, there was a gradual decrease in FY sedimentationvalues, even though flour protein increased slightly. Clearly, withthis class of wheat flour, FY sedimentation values obtained atone extraction rate cannot be extrapolated to another. With theexception of the 30% flour extraction, the sedimentation volumesof the individual flours did not change to any great extent atthe successive shaking time periods.
Flours from both the red and white CPS class of wheat flourshad FY sedimentation values that did not change in any pre-dictable fashion with increasing flour extraction, although the30% extraction flours were significantly different (a = 0.05) thanthose of 60% or higher yield. The finding that FY sedimentationvalues did not progressively decrease with higher extraction flourssuggests that they are fairly insensitive to increased bran contami-nation, at least up to the extraction rate of a straight-grade flour.Within the CPS wheat class, all flours showed a diminishing ofsedimentation gel volume with successive shaking periods.
CWSWS wheat flours were very low in sedimentation volumesand close to the minimum of the FY sedimentation scale. Althoughvalues in the range of 15-25 ml were observed, a fully sedimentedcylinder had a volume of 12 ml. As such, changes observed amongflours of different extraction rates were very small. If anything,increasing the extraction rate had the effect of slightly increasing
FY sedimentation values concomitant with slightly increasingprotein content. As observed for the other wheat classes, the initial5-min reading for the 30% extraction flour was distinct (a =0.05) from the corresponding higher extraction flours.
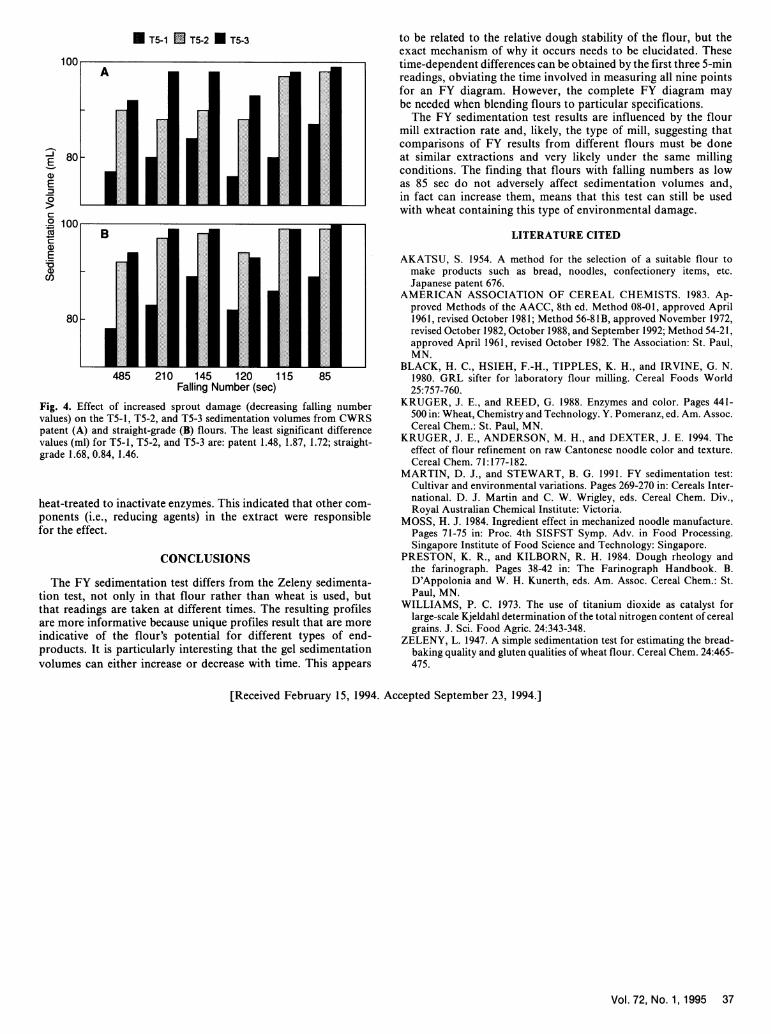
Effect of Sprout Damage on FY Sedimentation ValuesCarlot samples of CWRS wheat were composited on the basis
of similar protein content, but increasing sprout damage valuesranging from a falling number (FN) of 485 down to 85 sec. Patentand straight-grade flours were produced to investigate the influ-ence of flour refinement on sprout damage during the FY test.FY sedimentation values for the three 5-min readings for thedifferent flours are shown in Figure 4. Observe that all samplesare within -1% protein of each other, with the exception of one
U T5-1 [1 T5-2 U T5-3
90
CPS Red
70-
50-
8.0 8.5 9.0 9.5 10.0 10.2 10.7 11.2 11.7 12.5Protein (%)
4.5 6.0 6.5 7.0 7.5 7.0 7.5 7.5 10.0 12.5Stability (min)
Ea)
E
:30
CDE
a)f)
Protein (%)5.0 4.5 4.0 5.0 4.0 3.5 4.0 4.0 4.5 4.5
Stability (min)
Protein (%)2.5 2.5 4.5 2.5 3.0 6.5 10.0 13.5 18.5 18.5
Stability (min)
Fig. 2. Effect of protein content (14% mb) on the T5-1, T5-2, and T5-3sedimentation volumes for CPS red, CPS white, and CWES wheat flours.Farinograph stabilities are included and were performed at 65 rpm forthe CPS red and white wheat flours and at 90 rpm for the CWES wheatflour. The least significant difference values (ml) for T5-1, T5-2, andT5-3 are: CPS red 1.90, 2.88, 2.71; CPS white 1.06, 1.28, 1.11; CWES1.67, 2.30, 2.15.
Vol. 72, No. 1, 1995 35
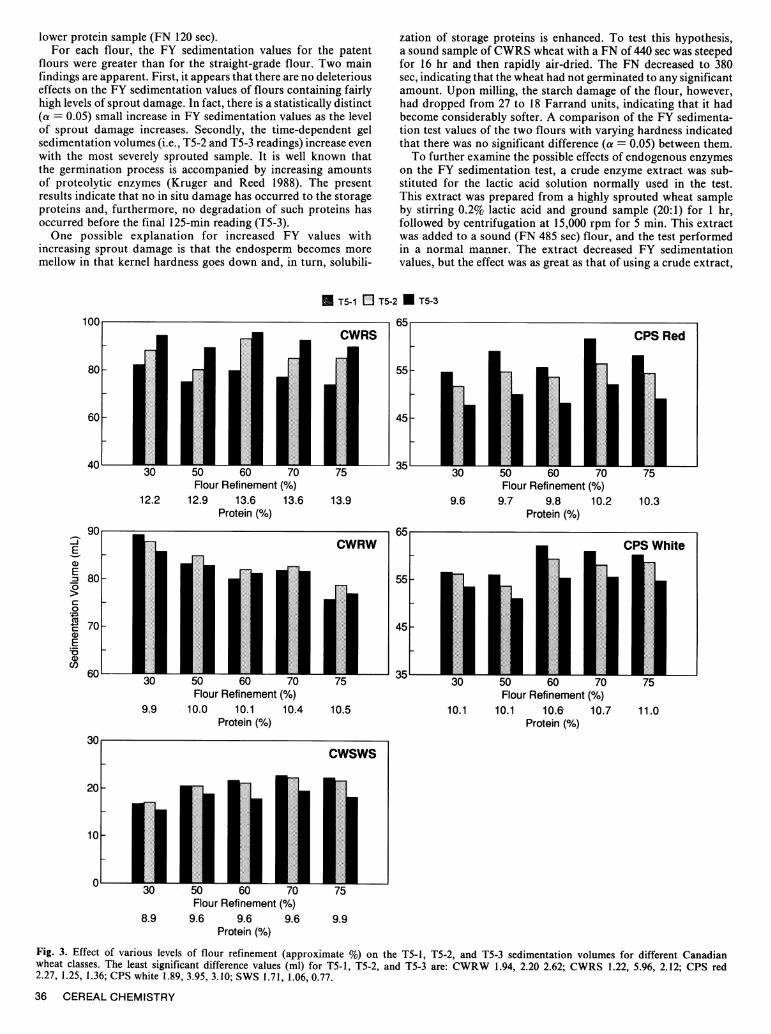
lower protein sample (FN 120 sec).For each flour, the FY sedimentation values for the patent
flours were greater than for the straight-grade flour. Two mainfindings are apparent. First, it appears that there are no deleteriouseffects on the FY sedimentation values of flours containing fairlyhigh levels of sprout damage. In fact, there is a statistically distinct(a = 0.05) small increase in FY sedimentation values as the levelof sprout damage increases. Secondly, the time-dependent gelsedimentation volumes (i.e., T5-2 and T5-3 readings) increase evenwith the most severely sprouted sample. It is well known thatthe germination process is accompanied by increasing amountsof proteolytic enzymes (Kruger and Reed 1988). The presentresults indicate that no in situ damage has occurred to the storageproteins and, furthermore, no degradation of such proteins hasoccurred before the final 125-min reading (T5-3).
One possible explanation for increased FY values withincreasing sprout damage is that the endosperm becomes moremellow in that kernel hardness goes down and, in turn, solubili-
zation of storage proteins is enhanced. To test this hypothesis,a sound sample of CWRS wheat with a FN of 440 sec was steepedfor 16 hr and then rapidly air-dried. The FN decreased to 380sec, indicating that the wheat had not germinated to any significantamount. Upon milling, the starch damage of the flour, however,had dropped from 27 to 18 Farrand units, indicating that it hadbecome considerably softer. A comparison of the FY sedimenta-tion test values of the two flours with varying hardness indicatedthat there was no significant difference (a = 0.05) between them.
To further examine the possible effects of endogenous enzymeson the FY sedimentation test, a crude enzyme extract was sub-stituted for the lactic acid solution normally used in the test.This extract was prepared from a highly sprouted wheat sampleby stirring 0.2% lactic acid and ground sample (20:1) for 1 hr,followed by centrifugation at 15,000 rpm for 5 min. This extractwas added to a sound (FN 485 sec) flour, and the test performedin a normal manner. The extract decreased FY sedimentationvalues, but the effect was as great as that of using a crude extract,
1 T5-1 [E T5-2 U T5-3
CWRS
55 -
45 -
- 35'
Flour Refinement (%)12.2 12.9 13.6 13.6
Protein (%)13.9
Flour Refinement (%)9.9 10.0 10.1 10.4 10.5
Protein (%)
cWsWs
Flour Refinement (%)9.6 9.7 9.8 10.2
Protein (%)
CPS White
55 -
451-
Flour Refinement (%)10.1 10.1 10.6 10.7
Protein (%)
Flour Refinement (%)8.9 9.6 9.6 9.6 9.9
Protein (%)
Fig. 3. Effect of various levels of flour refinement (approximate %) on the T5-1, T5-2, and T5-3 sedimentation volumes for different Canadianwheat classes. The least significant difference values (ml) for T5-1, T5-2, and T5-3 are: CWRW 1.94, 2.20 2.62; CWRS 1.22, 5.96, 2.12; CPS red2.27, 1.25, 1.36; CPS white 1.89, 3.95, 3.10; SWS 1.71, 1.06, 0.77.
36 CEREAL CHEMISTRY
1111
80 -
601-
40'
CPS Red
90
80
2Ea)E
c0
Ea)
co
10.3
70 F
60L
lb1
20 F
101
OL
11.0
us I
b I
35'
U T5-1 E3 T5-2 U T5-3
4nn-
E-i
E0
0
4)
E._
Co
80 -
100r
A
B
80 k
485 210 145 120 115Falling Number (sec)
85
Fig. 4. Effect of increased sprout damage (decreasing falling numbervalues) on the T5-1, T5-2, and T5-3 sedimentation volumes from CWRSpatent (A) and straight-grade (B) flours. The least significant differencevalues (ml) for T5-1, T5-2, and T5-3 are: patent 1.48, 1.87, 1.72; straight-grade 1.68, 0.84, 1.46.
heat-treated to inactivate enzymes. This indicated that other com-ponents (i.e., reducing agents) in the extract were responsiblefor the effect.
CONCLUSIONS
The FY sedimentation test differs from the Zeleny sedimenta-tion test, not only in that flour rather than wheat is used, butthat readings are taken at different times. The resulting profilesare more informative because unique profiles result that are moreindicative of the flour's potential for different types of end-products. It is particularly interesting that the gel sedimentationvolumes can either increase or decrease with time. This appears
to be related to the relative dough stability of the flour, but theexact mechanism of why it occurs needs to be elucidated. Thesetime-dependent differences can be obtained by the first three 5-minreadings, obviating the time involved in measuring all nine pointsfor an FY diagram. However, the complete FY diagram maybe needed when blending flours to particular specifications.
The FY sedimentation test results are influenced by the flourmill extraction rate and, likely, the type of mill, suggesting thatcomparisons of FY results from different flours must be doneat similar extractions and very likely under the same millingconditions. The finding that flours with falling numbers as lowas 85 sec do not adversely affect sedimentation volumes and,in fact can increase them, means that this test can still be usedwith wheat containing this type of environmental damage.
LITERATURE CITED
AKATSU, S. 1954. A method for the selection of a suitable flour tomake products such as bread, noodles, confectionery items, etc.Japanese patent 676.
AMERICAN ASSOCIATION OF CEREAL CHEMISTS. 1983. Ap-proved Methods of the AACC, 8th ed. Method 08-01, approved April1961, revised October 1981; Method 56-81B, approved November 1972,revised October 1982, October 1988, and September 1992; Method 54-21,approved April 1961, revised October 1982. The Association: St. Paul,MN.
BLACK, H. C., HSIEH, F.-H., TIPPLES, K. H., and IRVINE, G. N.1980. GRL sifter for laboratory flour milling. Cereal Foods World25:757-760.
KRUGER, J. E., and REED, G. 1988. Enzymes and color. Pages 441-500 in: Wheat, Chemistry and Technology. Y. Pomeranz, ed. Am. Assoc.Cereal Chem.: St. Paul, MN.
KRUGER, J. E., ANDERSON, M. H., and DEXTER, J. E. 1994. Theeffect of flour refinement on raw Cantonese noodle color and texture.Cereal Chem. 71:177-182.
MARTIN, D. J., and STEWART, B. G. 1991. FY sedimentation test:Cultivar and environmental variations. Pages 269-270 in: Cereals Inter-national. D. J. Martin and C. W. Wrigley, eds. Cereal Chem. Div.,Royal Australian Chemical Institute: Victoria.
MOSS, H. J. 1984. Ingredient effect in mechanized noodle manufacture.Pages 71-75 in: Proc. 4th SISFST Symp. Adv. in Food Processing.Singapore Institute of Food Science and Technology: Singapore.
PRESTON, K. R., and KILBORN, R. H. 1984. Dough rheology andthe farinograph. Pages 38-42 in: The Farinograph Handbook. B.D'Appolonia and W. H. Kunerth, eds. Am. Assoc. Cereal Chem.: St.Paul, MN.
WILLIAMS, P. C. 1973. The use of titanium dioxide as catalyst forlarge-scale Kjeldahl determination of the total nitrogen content of cerealgrains. J. Sci. Food Agric. 24:343-348.
ZELENY, L. 1947. A simple sedimentation test for estimating the bread-baking quality and gluten qualities of wheat flour. Cereal Chem. 24:465-475.
[Received February 15, 1994. Accepted September 23, 1994.]
Vol. 72, No. 1, 1995 37
l u l