fy08 quarter two - nm doit measures... · fy13 quarter two performance report october 1, 2012...
TRANSCRIPT

FY13 Quarter Two
Performance Report
October 1, 2012 through December 31, 2012
Darryl Ackley Cabinet Secretary
Jacqueline Miller Deputy Secretary

361 Department of Information Technology FY13 Q2 Performance Measure Report
Page 2
Department of Information Technology - 361
The purpose of this document is to provide an update to the Department of Information Technology
(Department) Performance Monitoring Plan (Plan) for each of the program areas. The Department’s Plan includes the definition, source of data and methodology to capture and analyze the data. The Plan also
describes the validation and reliability process to ensure the data is accurate and repeatable.
The Department was created by legislation enacted in the 2007 Legislative Session. The Department began operations July 1, 2007 and as a new Department established new performance measures.
As the State of New Mexico (State)’s provider for Information Technology (IT) services, the Department is
working across the State with all executive agencies (Agencies) to improve services and better facilitate efficient and responsive government for New Mexicans. At its foundation, this Plan is a continuation and
evolution of core IT measurement practices. Emphasis is placed on tracking, cost-benefit based, and consolidation of IT resources that leverages shared services, mitigates redundancy, and continues to drive
economies of scale. Also, leveraging systemic thinking as a means to better measure the many various IT systems upon which the State builds its core business.
The Plan embraces new technology measures with the inclusion of the implementation of the expanded use of the 700MHz commercial and public safety uses. Also, the Plan supplies metrics that track the use of
emerging technology to better support constituents and stakeholders of the state data center. These metrics help measure the reduction of duplicated efforts through pooled services.
Performance Measure Status For each of the performance measures, in this report, a color coded status is presented. The color coding, green, yellow or red is based on the percentage of the target being reported on either a quarterly or annual
basis:
Green 80% to 100% of the performance target or exceeding target.
Yellow 70% to 79% of the performance target.
Red 0% to 69% of the performance target.
361 Department of Information Technology FY13 Q2 Performance Measure Report
Page 3
Program Area: Program Support (P771)
The Program Support Division provides leadership and administrative services to the Department in
support of the Department’s mission. This division includes the Office of the Secretary. This division is responsible for the Department's direction, administrative policies and procedures, human resources,
budget and financial management, and purchasing and contractual support. Additionally, this division is responsible for establishing a cost recovery model and rates for the services provided by the Department.
Program Budget and FTE The Program Support Program area has 41 FTE and the following budget:
Budget Category Total (Thousands)
Salaries and Benefits $3,367.00
Contractual $38.20
Other $208.10
Other Financing Uses $0.00
Total $3,613.30
Performance Measures
PERFORMANCE MEASURE 1 - Percent of Audit Corrective Action Plan Commitments Completed on Schedule This measure will be reported in FY13 Q4.
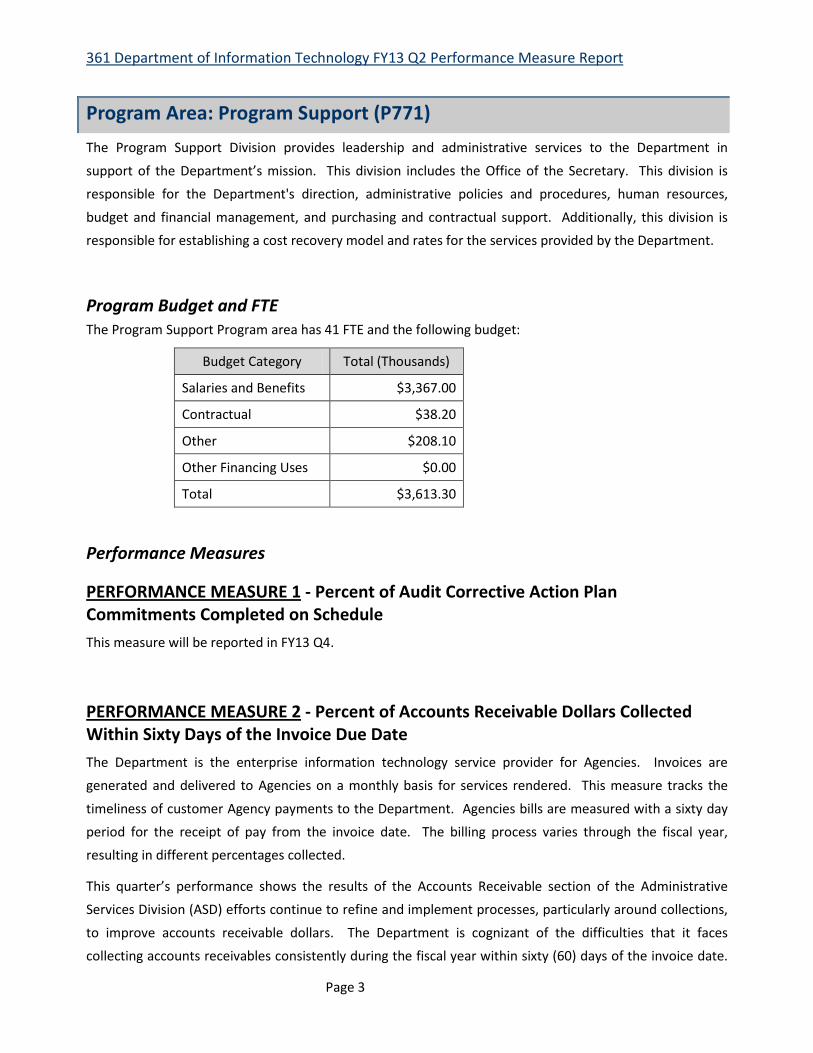
PERFORMANCE MEASURE 2 - Percent of Accounts Receivable Dollars Collected Within Sixty Days of the Invoice Due Date The Department is the enterprise information technology service provider for Agencies. Invoices are generated and delivered to Agencies on a monthly basis for services rendered. This measure tracks the
timeliness of customer Agency payments to the Department. Agencies bills are measured with a sixty day period for the receipt of pay from the invoice date. The billing process varies through the fiscal year, resulting in different percentages collected.
This quarter’s performance shows the results of the Accounts Receivable section of the Administrative Services Division (ASD) efforts continue to refine and implement processes, particularly around collections,
to improve accounts receivable dollars. The Department is cognizant of the difficulties that it faces collecting accounts receivables consistently during the fiscal year within sixty (60) days of the invoice date.

361 Department of Information Technology FY13 Q2 Performance Measure Report
Page 4
Billed agencies vary in their speed of payment, and the graph below shows that during the first and second quarter of the fiscal year agencies provide payments at a slower rate. However, agencies are forthcoming
with their financial obligations to the Department of Information Technology and demonstrated an improvement in payments in the last two quarters of the fiscal year.
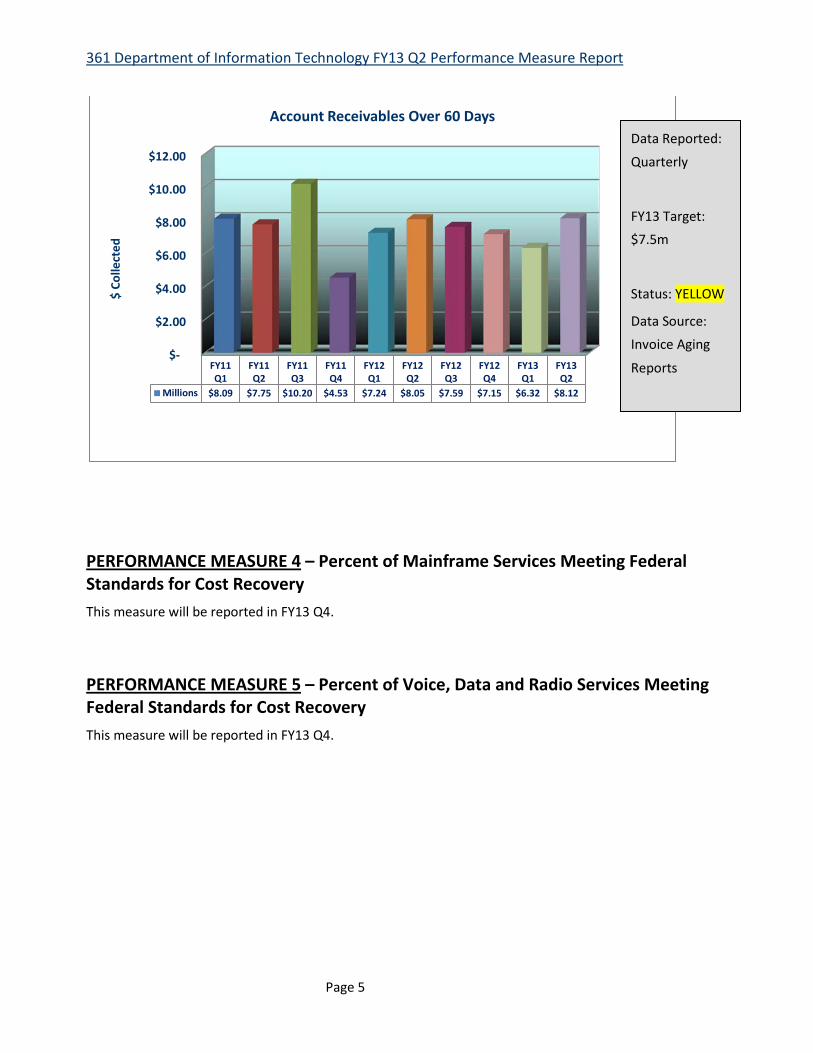
PERFORMANCE MEASURE 3 - Dollar Amount of Account Receivables Over Sixty Days This performance measure provides the cumulative total dollar amount of accounts receivables over sixty
days. The total dollar amount of account receivables over sixty days was $8,118,454 for quarter two of FY13. The results for the quarter reflect 8.25% over the target amount of $7,500,000 sustaining a status of
yellow for the performance measure.
0%
10%
20%
30%
40%
50%
60%
70%
80%
90%
FY11Q1
FY11Q2
FY11Q3
FY11Q4
FY12Q1
FY12Q2
FY12Q3
FY12Q4
FY13Q1
FY13Q2
% Collected 60 Days 47% 63% 75% 79% 49% 35% 71% 81% 36% 37%
Perc
enta
ge
Accounts Receivable Dollars Collected Within 60 Days of Invoice Due Date
Data Reported:
Quarterly
FY13 Target: 75%
Status: RED
Data Source:
Invoice Aging
Reports
361 Department of Information Technology FY13 Q2 Performance Measure Report
Page 5
PERFORMANCE MEASURE 4 – Percent of Mainframe Services Meeting Federal Standards for Cost Recovery This measure will be reported in FY13 Q4.
PERFORMANCE MEASURE 5 – Percent of Voice, Data and Radio Services Meeting Federal Standards for Cost Recovery This measure will be reported in FY13 Q4.
$-
$2.00
$4.00
$6.00
$8.00
$10.00
$12.00
FY11Q1
FY11Q2
FY11Q3
FY11Q4
FY12Q1
FY12Q2
FY12Q3
FY12Q4
FY13Q1
FY13Q2
Millions $8.09 $7.75 $10.20 $4.53 $7.24 $8.05 $7.59 $7.15 $6.32 $8.12
$ Co
llect
ed
Account Receivables Over 60 Days Data Reported:
Quarterly
FY13 Target: $7.5m
Status: YELLOW
Data Source: Invoice Aging
Reports

361 Department of Information Technology FY13 Q2 Performance Measure Report
Page 6
Program Area: Compliance & Project Management (P772)
The Compliance and Project Management Division is the state’s Enterprise Project Management Office and
performs the following functions: Provide IT Management Lifecycle policies, methodologies and templates for IT initiatives to promote quality and success and report regularly to Executive, Legislative, and IT
Commission on the status of the State’s IT Project Portfolio; Provide support, guidance and oversight on IT projects and procurements to promote improved outcomes; Review agency IT plans for prudent allocation
of IT resources and monitor compliance of projects with agency strategic plan and the state IT strategic plan; Review appropriation requests and legislation related to IT and make recommendations to the
Department of Finance, and Legislative Finance Committee for formal approval by the Legislature and the Governor; and Provide senior project management for enterprise projects.
Program Budget and FTE The Compliance and Project Management has seven (7) FTE and the following budget:
Budget Category Total (Thousands)
Salaries and Benefits $669.80
Contractual $0.00
Other $17.30
Other Financing Uses $157.40
Total $844.50
Performance Measures
PERFORMANCE MEASURE 6 – Number and Appropriated Budget of Executive Agency Certified Projects Reviewed Monthly for Oversight Requirements This performance measure reflects the volume of oversight for agency certified IT projects by tracking both the number and budget appropriations. All certified IT projects are required to submit monthly status
reports to the Department. At the end of this quarter there were fifty-five (55) open Agency certified projects worth $366 M.
Additional details include the number and appropriated budget for projects presented to the Project
Certification Committee (PCC) for phases, changes, and status updates of IT projects. During the quarter, there were fifteen (15) project certifications: one (1) project initiation, one (1) project initiation/planning,
one (1) initiation/planning/implementation, two (2) projects planning, one (1) change request and eight (8) closeouts. In addition one (1) project presented a status update. The Compliance and Project Management
is responsible for reviewing projects and status reports on a monthly basis to validate the project status and ensure compliance.

361 Department of Information Technology FY13 Q2 Performance Measure Report
Page 7
PERFORMANCE MEASURE 7 – Monthly Number and Budget of Approved IT Professional Services Contracts and Amendments This performance measure tracks the volume of oversight that the Department provides for statewide IT expenditures. The performance measure tracks the number of IT procurements reviewed and
compensation for the contracts. The division performs reviews for agency IT contracts, amendments, and RFP’s including all procurement types such as emergencies, sole source, agency price agreements, and state wide price agreements. The purpose of the review is to ensure the proposed contract(s) and procurement
is in accordance with State standards, guidelines, and consistent with the State IT Strategic Plan and Agency IT plans. For quarter two a total of fifty-two (52) procurements were reviewed in the amount of
$240,643,830.
PERFORMANCE MEASURE 8 – Number and Budget Requested for One Time IT Appropriations as Incorporated Within Annual Agency IT Plans This measure will be reported in FY13 Q4.
FY11Q1
FY11Q2
FY11Q3
FY11Q4
FY12Q1
FY12Q2
FY12Q3
FY12Q4
FY13Q1
FY13Q2
9 8
3 5 6 2 5
2 3 8
7 9
2 2 4 6
17 18
12
7
16 17
5 7 10 8
22 20
15 15
Number of Information Technology Projects Certified
# Closed
# Other
Data Reported:
Quarterly
FY13 Target: N/A
Status: N/A
Data Source:
Excel
Spreadsheet

361 Department of Information Technology FY13 Q2 Performance Measure Report
Page 8
Program Area: Enterprise Services (P773) & Equipment Refresh (P784) The purpose of the Enterprise Services program is to provide the state with the information technology fabric that enables agencies to innovate and excel in their specific domains with the goal of consolidating
services duplicated within agencies to promote cost savings and efficiencies. This is accomplished through the delivery and management of cost effective and efficient IT infrastructure services, enterprise
applications and other value added IT services. The program is enterprise funded thereby assessing fees for services which includes the depreciation cost for providing service. This enables an Equipment Replacement Fund to be utilized to maintain and enhance services over time.
Program Budget and FTE The Enterprise Services and the Equipment Replacement Fund has been merged together for performance measure reporting purposes. The Enterprise Services Program has 152 FTE. The combined budget is as
follows:
Budget Category Enterprise Services (P773)
Replacement Fund (P784)
Total (Thousands) Enterprise and Replacement
Salaries and Benefits $13,129.50 $13,129.50 Contractual $6,510.20 $6,510.20 Other $20,918.50 $3,862.10 $24,780.60 Other Financing Uses $7,869.40 $7,869.40 Total $48,427.60 $3,862.10 $52,289.70
Performance Measures
PERFORMANCE MEASURE 9 – Number of Enterprise Services Instrumented with Quantitative Metrics for Evaluating Savings/Cost Avoidance Resulting from Consolidation This measure will be reported in FY13 Q4.
PERFORMANCE MEASURE 10 – Amount of IT Savings/Cost Avoidance as Calculated for Enterprise Systems with Existing and Documented Metrics This measure will be reported in FY13 Q4.

361 Department of Information Technology FY13 Q2 Performance Measure Report
Page 9
PERFORMANCE MEASURE 11 – Percentage of Phone Systems Using Internet Protocol or Other Similar Technologies to Achieve Virtual Local Calling within the State This performance measure tracks the increased use of internet protocol (IP) technologies versus landlines.
This performance measure quantifies the continued advancements utilized by the State for telephone technology and represents the potential for significant measurable cost savings to the State. The number
of landline systems replaced by the use of the enterprise network reflects the continued success of increased cost saving, leveraging economies of scale within the IT consolidation effort.
This is a new performance measures with a target of 25%. In the first year the metric is structured with an incline target that began at 3% the first quarter and will increases each quarter with the requirement of
meeting the 25% target. Last quarter there were 626 IP Base Telephones. In quarter two an additional 200 IP Base Telephones were installed. With an increase of 200 phones per quarter it will take two years to
meet a target of 10%. This is a performance measure that may not be realistic and will require a revision next year.
PERFORMANCE MEASURE 12 – Percentage Reduction of Past End of Life Systems Refreshed/Replaced with Equipment Replacement Funds This measure will be reported in FY13 Q4.
0.0%5.0%
10.0%
15.0%
20.0%
25.0%
FY13 Q1FY13 Q2
FY13 Q3FY13 Q4
FY14 Q1FY14 Q2
FY14 Q3FY14 Q4
% IP Base Telephones
Percentage of Phone Systems Using Internet Protocal to Achieve Local Calling
Within the State Enterprise
Actuals IP PhonesProjected IP Phones
Data Reported:
Quarterly
FY13 Target:
incline 25%
Status: GREEN
Data Source: Contracts
Database

361 Department of Information Technology FY13 Q2 Performance Measure Report
Page 10
PERFORMANCE MEASURE 13 – Number of Anchor Institutions Utilizing the Forthcoming 700MHz Long Term Evolution Public Safety Network On behalf of the State, the Department is one of seven institutions nation-wide to have both a waiver for the operation of a 700 MHz public safety network, and
federal funds for the initial deployment of such a capability. This performance measure will track the number of anchor institutions, or ‘customers’ that this new
technology will support. This metric is also a requirement of the federal grant awarded to the Department, but is equally as important to be established internally
to the Department. As this technology is anticipated to become a substantial portion of the Department’s radio capability over the next five to ten years, it will
be important to meter how widespread its adoption is for the purposes of advanced planning and development of related cost models.
The 700MHz performance measure is on hold due to the Federal Communications Commission (FCC)
placing the 700MHz project on hold. The Department will report on this performance measure as soon as the hold restriction is removed from by the FCC.
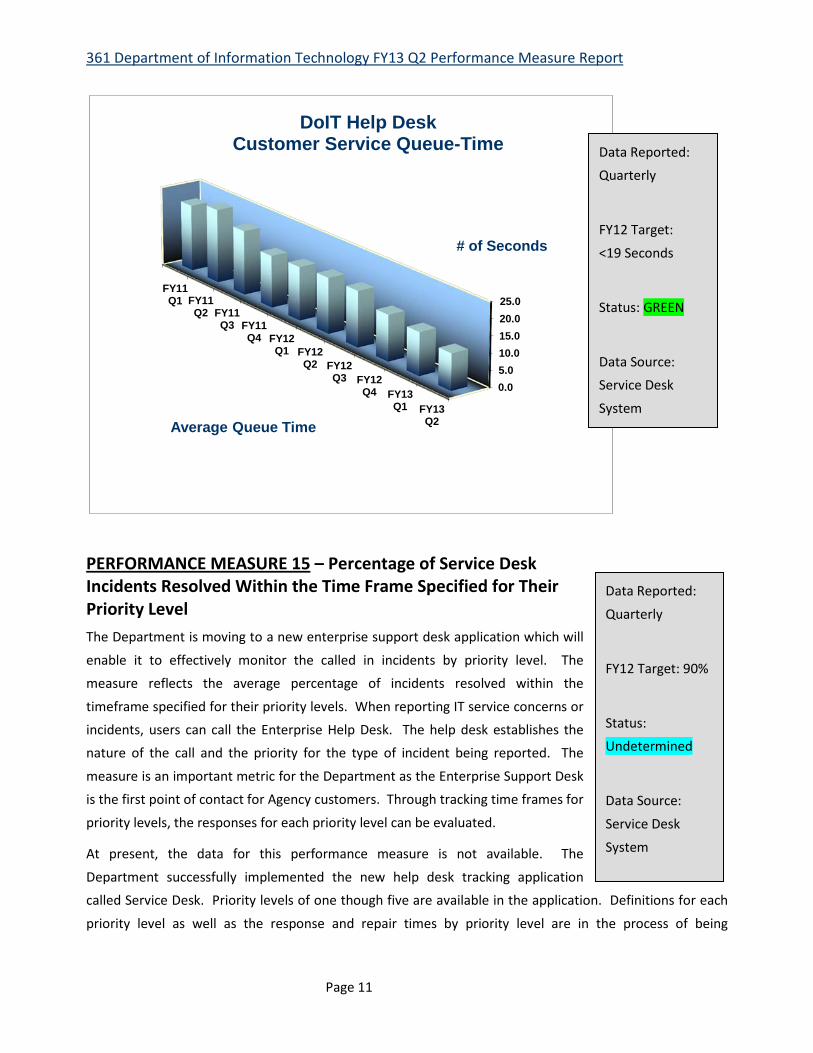
PERFORMANCE MEASURE 14 - Queue-Time to Reach a Customer Service Representative at the Department Help Desk, in Seconds In the 2nd quarter of FY13, the Department’s Enterprise Help Desk received over 2,230 calls requesting
assistance on items such as password resets, application support questions and other IT incidents. The average wait time to speak with a customer representative, once the customer navigated the interactive
voice response system (IVR), was 13.0 seconds. This is an improvement of 2.0 seconds from the previous quarter and below the target level of 19.0 seconds.
Additionally, the Department’s Enterprise Help Desk total service desk tickets for the quarter were 6,349; 522 were incidents and 5,827 were requests. A total of 115 surveys were received with an overall satisfaction rate of 97%; which is an increase in satisfaction of 1% from last quarter.
Data Reported:
Quarterly
FY13 Target: 5
Status: Undetermined
Data Source:
ARRA Reporting
361 Department of Information Technology FY13 Q2 Performance Measure Report
Page 11
PERFORMANCE MEASURE 15 – Percentage of Service Desk Incidents Resolved Within the Time Frame Specified for Their Priority Level The Department is moving to a new enterprise support desk application which will
enable it to effectively monitor the called in incidents by priority level. The measure reflects the average percentage of incidents resolved within the
timeframe specified for their priority levels. When reporting IT service concerns or incidents, users can call the Enterprise Help Desk. The help desk establishes the nature of the call and the priority for the type of incident being reported. The
measure is an important metric for the Department as the Enterprise Support Desk is the first point of contact for Agency customers. Through tracking time frames for
priority levels, the responses for each priority level can be evaluated.
At present, the data for this performance measure is not available. The
Department successfully implemented the new help desk tracking application called Service Desk. Priority levels of one though five are available in the application. Definitions for each
priority level as well as the response and repair times by priority level are in the process of being
0.05.010.015.020.025.0
FY11Q1 FY11
Q2 FY11Q3 FY11
Q4 FY12Q1 FY12
Q2 FY12Q3 FY12
Q4 FY13Q1 FY13
Q2
# of Seconds
Average Queue Time
DoIT Help Desk Customer Service Queue-Time Data Reported:
Quarterly
FY12 Target:
<19 Seconds
Status: GREEN
Data Source: Service Desk
System
Data Reported:
Quarterly
FY12 Target: 90%
Status: Undetermined
Data Source:
Service Desk
System
361 Department of Information Technology FY13 Q2 Performance Measure Report
Page 12
established. Additional reporting capability is being tested for possible implementation. Until this is complete the data will not be available to report on this measure.
Action Plan
The Department will continue with the implementation of the Service Desk application by defining the definitions for each priority level as well as the response and repair times by priority level. Once definitions
and service level agreements for each have been established, Service Desk will be configured with the appropriate values. Performance reports will be generated by Priority level and will be reported in the FY13 Performance Measures.
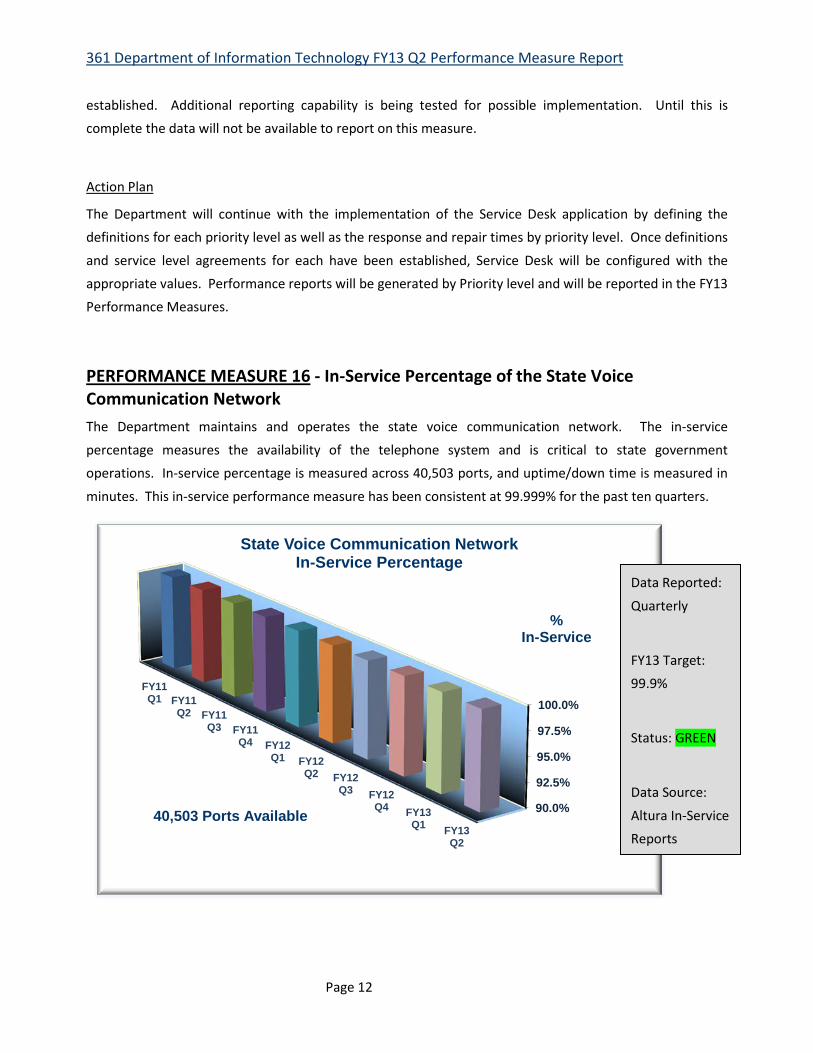
PERFORMANCE MEASURE 16 - In-Service Percentage of the State Voice Communication Network The Department maintains and operates the state voice communication network. The in-service
percentage measures the availability of the telephone system and is critical to state government operations. In-service percentage is measured across 40,503 ports, and uptime/down time is measured in
minutes. This in-service performance measure has been consistent at 99.999% for the past ten quarters.
90.0%
92.5%
95.0%
97.5%
100.0%FY11Q1 FY11
Q2 FY11Q3 FY11
Q4 FY12Q1 FY12
Q2 FY12Q3 FY12
Q4 FY13Q1 FY13
Q2
% In-Service
40,503 Ports Available
State Voice Communication Network In-Service Percentage
Data Reported:
Quarterly
FY13 Target: 99.9%
Status: GREEN
Data Source:
Altura In-Service Reports
361 Department of Information Technology FY13 Q2 Performance Measure Report
Page 13
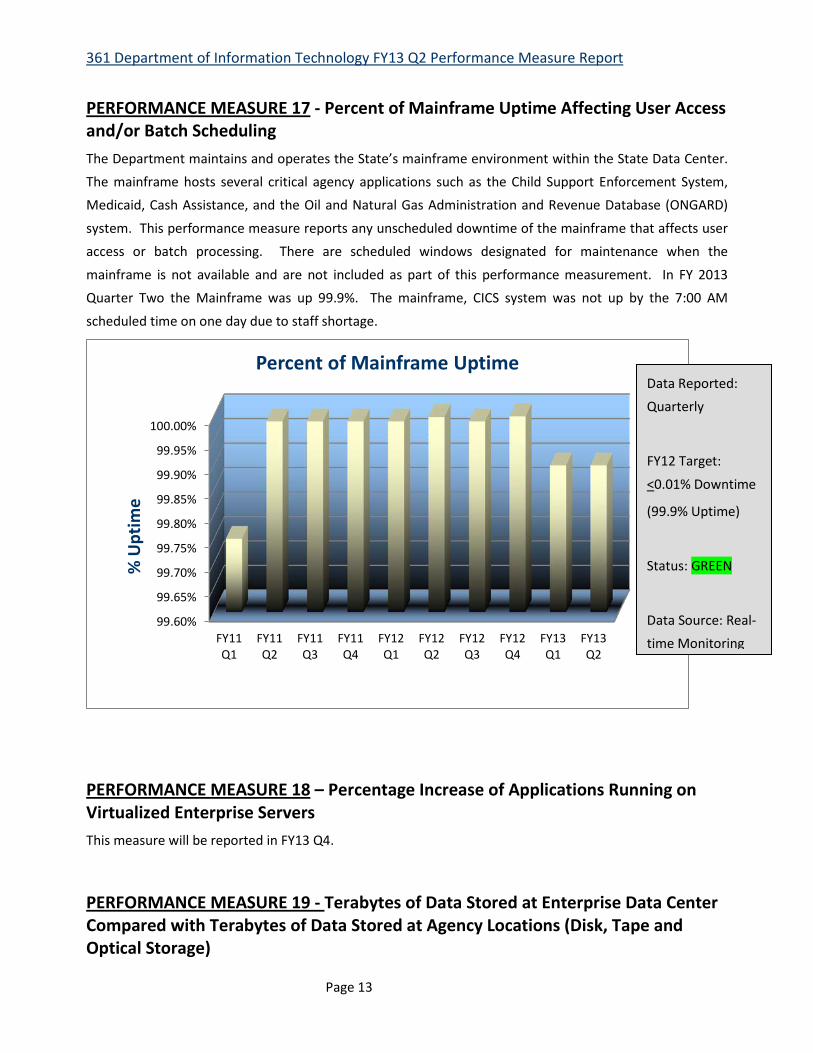
PERFORMANCE MEASURE 17 - Percent of Mainframe Uptime Affecting User Access and/or Batch Scheduling The Department maintains and operates the State’s mainframe environment within the State Data Center. The mainframe hosts several critical agency applications such as the Child Support Enforcement System, Medicaid, Cash Assistance, and the Oil and Natural Gas Administration and Revenue Database (ONGARD)
system. This performance measure reports any unscheduled downtime of the mainframe that affects user access or batch processing. There are scheduled windows designated for maintenance when the
mainframe is not available and are not included as part of this performance measurement. In FY 2013 Quarter Two the Mainframe was up 99.9%. The mainframe, CICS system was not up by the 7:00 AM
scheduled time on one day due to staff shortage.
PERFORMANCE MEASURE 18 – Percentage Increase of Applications Running on Virtualized Enterprise Servers This measure will be reported in FY13 Q4.
PERFORMANCE MEASURE 19 - Terabytes of Data Stored at Enterprise Data Center Compared with Terabytes of Data Stored at Agency Locations (Disk, Tape and Optical Storage)
99.60%
99.65%
99.70%
99.75%
99.80%
99.85%
99.90%
99.95%
100.00%
FY11Q1
FY11Q2
FY11Q3
FY11Q4
FY12Q1
FY12Q2
FY12Q3
FY12Q4
FY13Q1
FY13Q2
% U
ptim
e
Percent of Mainframe Uptime Data Reported: Quarterly
FY12 Target:
<0.01% Downtime
(99.9% Uptime)
Status: GREEN
Data Source: Real-time Monitoring

361 Department of Information Technology FY13 Q2 Performance Measure Report
Page 14
This measure will be reported in FY13 Q4.
PERFORMANCE MEASURE 20 – Number of Enterprise Data Systems with Established Disaster Recovery of Business Continuity Presence at the Secondary Data Center This measure will be reported in FY13 Q4.
PERFORMANCE MEASURE 21 – Percent of Co-located and Enterprise-hosted Services with Documented System Security Plans This measure will be reported in FY13 Q4.
PERFORMANCE MEASURE 22 – Number of Perimeter and Security-Logged Systems Reporting Security Metrics to the Network Operations Center This measure will be reported in FY13 Q4.
PERFORMANCE MEASURE 23 - Percent of Scheduled Uptime the Statewide Human Capital Management Reporting System is Available during Business Hours This performance measure reports any unscheduled downtime of the SHARE-Human Capital Management (HCM) suite that affects user access or batch processing. There are scheduled windows designated for
maintenance when the SHARE-HCM suite is not available and is not included as part of this performance measure. The Department monitors the SHARE environment 24 hours a day, 7 days a week, to ensure it is
available to users from 8:00 A.M. to 5:00 P.M. Monday through Friday. The Department reporting target is 99% uptime. There was an outage of eight hours on December 7, 2012 due to the SSL Certificates expired.
A second outage occurred when the database ran out of space on a payroll weekend, affecting payroll. However, that outage is not included because it did not occur during business hours. The HCM system was available 464 hours of the 472 business hours during FY2013 Quarter Two. The reporting metrics is 98.3%
uptime. This is within the margin of acceptable performance level with 1.7% of Business Days for SHARE - HCM not available.

361 Department of Information Technology FY13 Q2 Performance Measure Report
Page 15
PERFORMANCE MEASURE 24 - Percent of Scheduled Uptime the Financial Statewide Human Resources, Accounting and Management Reporting System is Available during Business Hours This performance measure reports any unscheduled downtime of the SHARE-Financial (FIN) suite that affects user access or batch processing. There are scheduled windows designated for maintenance when
the SHARE-FIN suite is not available and is not included as part of this performance measure. The Department monitors the SHARE environment 24 hours a day, 7 days a week, to ensure it is available to
users from 8:00 A.M. to 5:00 P.M. Monday through Friday. The Department reporting target is 99% uptime. There was an outage of forty-eight hours from December 4, 2012 5:00 PM till December, 13, 2012
8:30 AM due to the FIN Database Corruption. A second outage of 1.5 hours occurred when the database ran out of space. The FIN system was available 422 hours of the 472 business hours during FY2013 Quarter
Two. The reporting metrics is 89.4% uptime. This is within the margin of acceptable performance level with 10.6% of Business Days for SHARE - FIN not available. The SHARE Financials system has not experience an
outage of this magnitude for some time due to the diligent efforts of the SHARE staff. However, the SHARE program
has been understaffed and is working to expand its support resources and capabilities. The outage is a direct
reflection of the impact that SHARE has to the State and the necessity to staff and fund SHARE sufficiently.
0%1%2%3%4%5%6%7%8%9%
10%
FY11Q1
FY11Q2
FY11Q3
FY11Q4
FY12Q1
FY12Q2
FY12Q3
FY12Q4
FY13Q1
FY13Q2
Perc
enta
ge
Percent of Business Days that SHARE – HCM Was Not Available
Due to Unscheduled Downtime During Business Hours Data Reported: Quarterly
FY12 Target: 99%
Status: GREEN
Data Source: Real-
time Monitoring
Reports

361 Department of Information Technology FY13 Q2 Performance Measure Report
Page 16
0%1%2%3%4%5%6%7%8%9%
10%
FY11Q1
FY11Q2
FY11Q3
FY11Q4
FY12Q1
FY12Q2
FY12Q3
FY12Q4
FY13Q1
FY13Q2
Perc
enta
ge
Percent of Business Days that SHARE – FINANCIALS Was Not Available
Due to Unscheduled Downtime During Business Hours Data Reported: Quarterly
FY12 Target: 99%
Status: GREEN
Data Source: Real-
time Monitoring Reports