fy14 interim results briefing · 2014-02-18 · fy14 interim results briefing for personal use only...
TRANSCRIPT

DATA#3 LIMITED (DTL)
FY14 INTERIM RESULTS
BRIEFING19th February 2014
For
per
sona
l use
onl
y

INTERIM RESULT
For
per
sona
l use
onl
y

PERFORMANCE REFLECTED MARKET CHALLENGES
• Revenue declined 1.8% to $399.1M
• Gross profit margin declined from 15.2% to 14.4%
• Product gross profit declined 11.7% to $28.7M
• Services gross profit decreased 1.3% to $28.8M
• Staff costs increased 4.4% to $46.7M and operating expenses increased 3.5% to $8.3M
• NPBT and EPS declined 62% to $3.7M and 1.67 cents respectively, in line with guidance provided in December
• A fully franked dividend of 1.5 cents was declared
3
FY14 first half (1H14) under plan & pcp
For
per
sona
l use
onl
y

4
190.5
266.8
324.8375.2
338.6 332.7
0
100
200
300
400
1H09 1H10 1H11 1H12 1H13 1H14
Product revenue ($M)
REVENUE TRENDS
38.9 39.4
51.659.1
66.6 65.1
0
25
50
75
1H09 1H10 1H11 1H12 1H13 1H14
Services revenue ($M)
Services & product revenues down overall, but both up if the Fiona Stanley Hospital contract in 1H13 is excluded
230
307
378
436406 399
0
100
200
300
400
500
1H09 1H10 1H11 1H12 1H13 1H14
Total revenue ($M)
For
per
sona
l use
onl
y
5
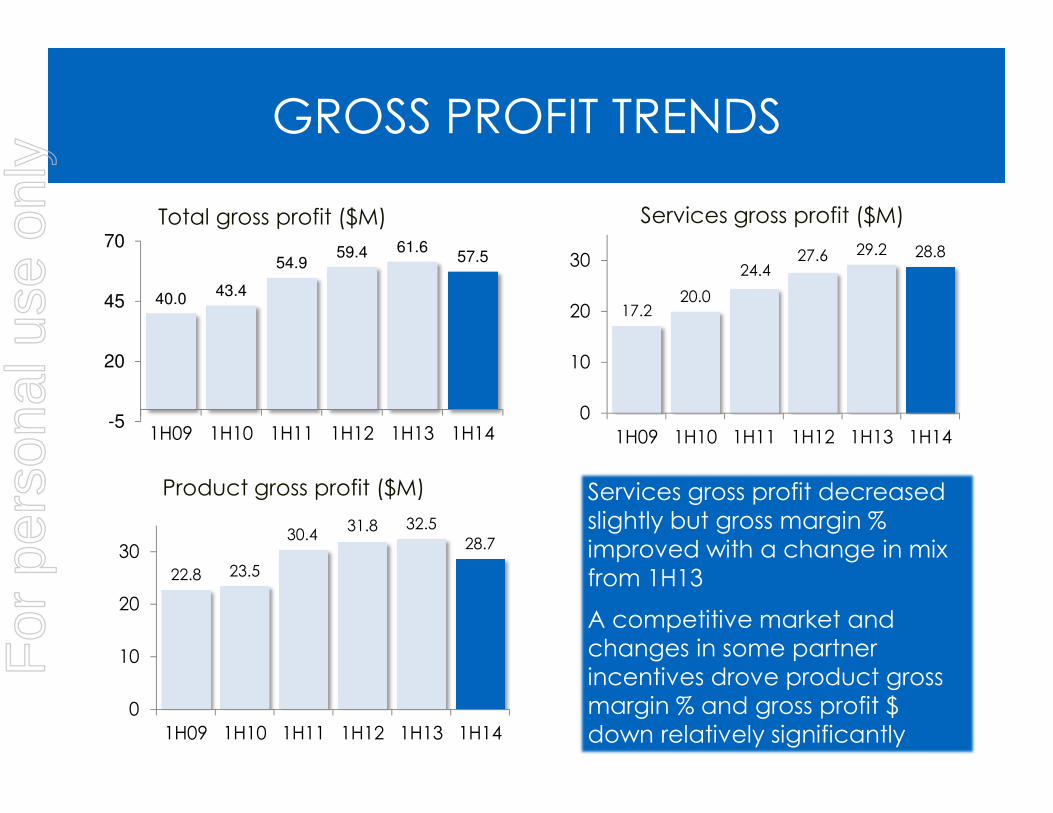
17.220.0
24.427.6 29.2 28.8
0
10
20
30
1H09 1H10 1H11 1H12 1H13 1H14
Services gross profit ($M)
GROSS PROFIT TRENDS
22.8 23.5
30.431.8 32.5
28.7
0
10
20
30
1H09 1H10 1H11 1H12 1H13 1H14
Product gross profit ($M) Services gross profit decreased slightly but gross margin % improved with a change in mix from 1H13
A competitive market and changes in some partner incentives drove product gross margin % and gross profit $down relatively significantly
40.043.4
54.959.4 61.6
57.5
-5
20
45
70
1H09 1H10 1H11 1H12 1H13 1H14
Total gross profit ($M)
For
per
sona
l use
onl
y
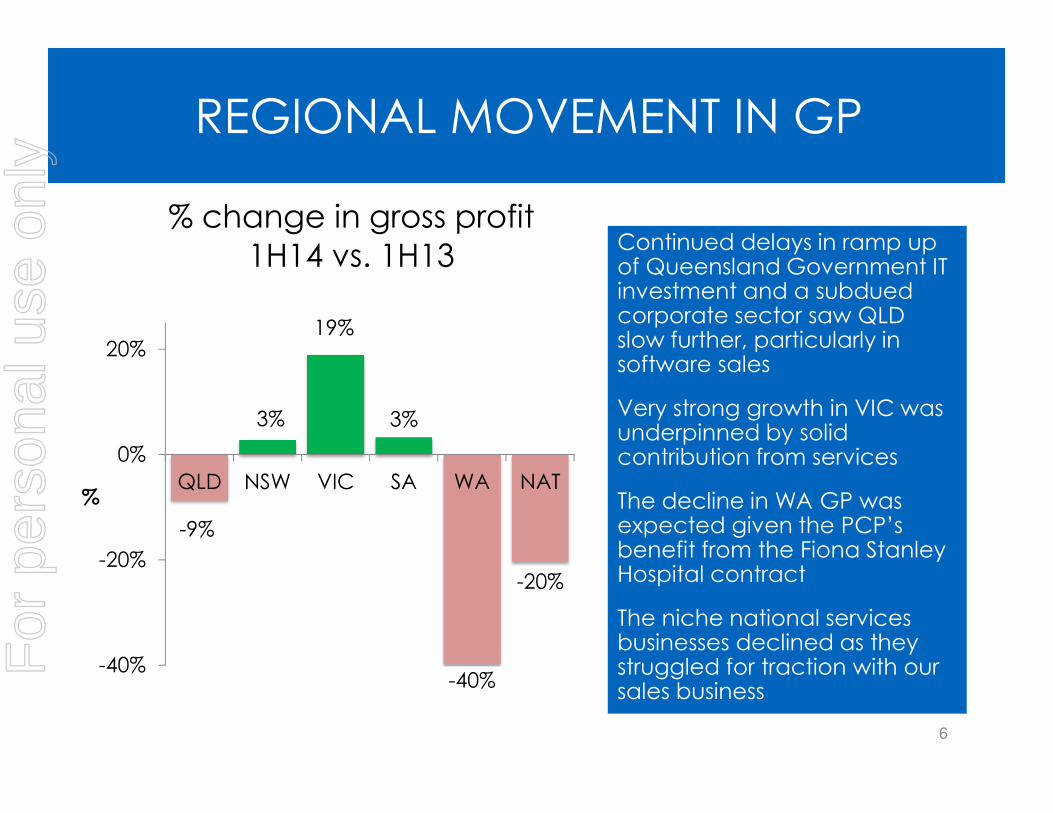
REGIONAL MOVEMENT IN GP
6
Continued delays in ramp up of Queensland Government IT investment and a subdued corporate sector saw QLD slow further, particularly in software sales
Very strong growth in VIC was underpinned by solid contribution from services
The decline in WA GP was expected given the PCP’s benefit from the Fiona Stanley Hospital contract
The niche national services businesses declined as they struggled for traction with our sales business
-9%
3%
19%
3%
-40%
-20%
-40%
-20%
0%
20%
QLD NSW VIC SA WA NAT%
% change in gross profit
1H14 vs. 1H13
For
per
sona
l use
onl
y
7
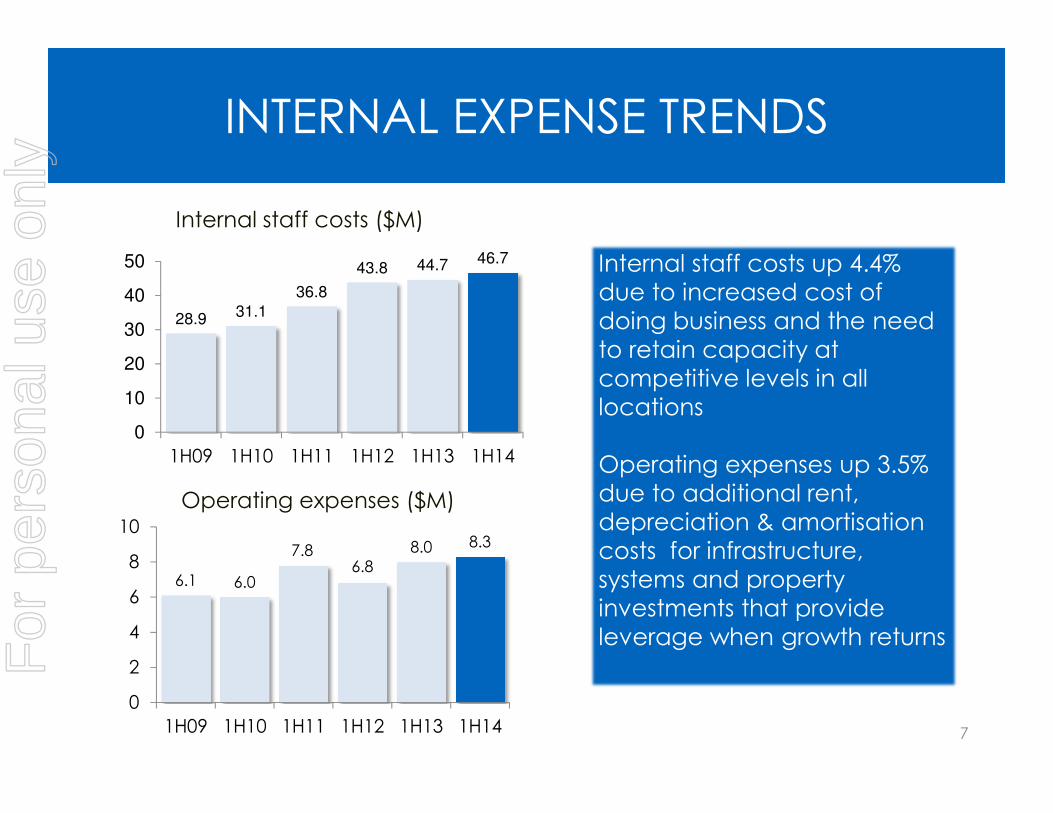
INTERNAL EXPENSE TRENDS
28.9 31.1
36.8
43.8 44.7 46.7
0
10
20
30
40
50
1H09 1H10 1H11 1H12 1H13 1H14
Internal staff costs ($M)
6.1 6.0
7.86.8
8.0 8.3
0
2
4
6
8
10
1H09 1H10 1H11 1H12 1H13 1H14
Operating expenses ($M)
Internal staff costs up 4.4% due to increased cost of doing business and the need to retain capacity at competitive levels in all locations
Operating expenses up 3.5% due to additional rent, depreciation & amortisation costs for infrastructure, systems and property investments that provide leverage when growth returnsF
or p
erso
nal u
se o
nly
8
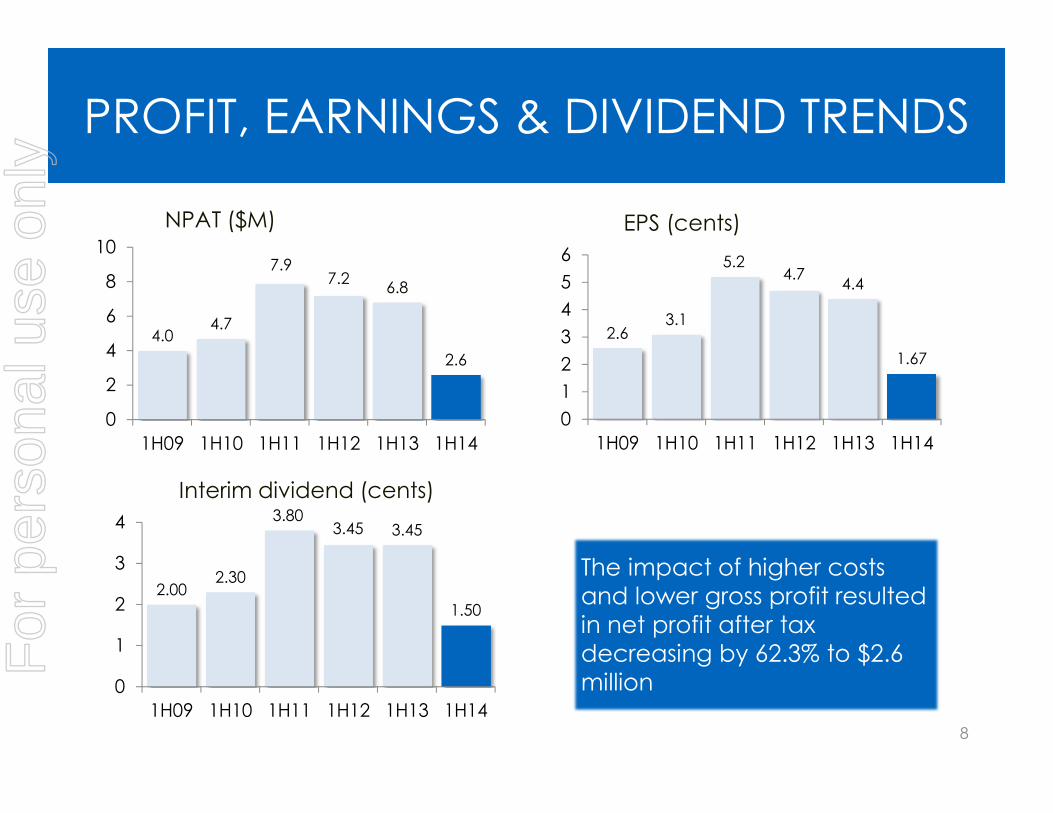
PROFIT, EARNINGS & DIVIDEND TRENDS
2.63.1
5.24.7
4.4
1.67
0
1
2
3
4
5
6
1H09 1H10 1H11 1H12 1H13 1H14
EPS (cents)
The impact of higher costs and lower gross profit resulted in net profit after tax decreasing by 62.3% to $2.6 million
4.04.7
7.97.2
6.8
2.6
0
2
4
6
8
10
1H09 1H10 1H11 1H12 1H13 1H14
NPAT ($M)
2.002.30
3.803.45 3.45
1.50
0
1
2
3
4
1H09 1H10 1H11 1H12 1H13 1H14
Interim dividend (cents)
For
per
sona
l use
onl
y

9.8
-7.1 -0.6 0.31.3
3.7
-8.0
-6.0
-4.0
-2.0
0.0
2.0
4.0
6.0
8.0
10.0
1H13 NPBT Productsegment
profit
Servicessegment
profit
Unallocatedcorporaterevenue
Unallocatedcorporate
costs
1H14 NPBT
$M
Movement in NPBT elements
compared to 1H13
9
MOVEMENT IN NPBT OVER PCP
For
per
sona
l use
onl
y

1H BALANCE SHEET AND CASHFLOW
• Strong balance sheet
• No material debt
• Cash flow ‘seasonality’ in line with trend
• Average daily 1H cash balance up from $50.4M to $60.2M
1
10
For
per
sona
l use
onl
y

PEOPLE NUMBERS & COSTS
Ended slightly below pcp
11
Internal people numbers
695707
681
676 677 680679687
681
681689 686
600
650
700
750
Jul Aug Sep Oct Nov Dec
1H14 1H13
• 1H13 average headcount 684
• 1H14 average headcount 686
• Net reduction from restructure in September
• 1H cost/person increase of approximately 4%F
or p
erso
nal u
se o
nly

CONTRACTOR TRENDS
Contractor numbers up 7%
12
People Solutions
308
334
309314
308300
306
291 294288 290
284
250
300
350
Jul Aug Sep Oct Nov Dec
1H14 1H13For
per
sona
l use
onl
y

SIGNIFICANT CONTRACTS IN 1H FY14
For
per
sona
l use
onl
y

FULL OUTSOURCE & PROJECT DELIVERY
14
Brisbane Airport Corporation
• Competitive tender
• 3 + 1 + 1 years
• Full outsource incl services desk, field support and remote management
• Extends to PMO and subcontract project delivery
“excited by potential to
improve service delivery
and project support”
For
per
sona
l use
onl
y

PURE IaaS
15
McInnes Wilson Lawyers
• Competitive tender
• 3 year Platinum agreement for Data#3 IaaS
• Includes migration
• Moving from small in-house team to Data#3 services
“transition going well”For
per
sona
l use
onl
y
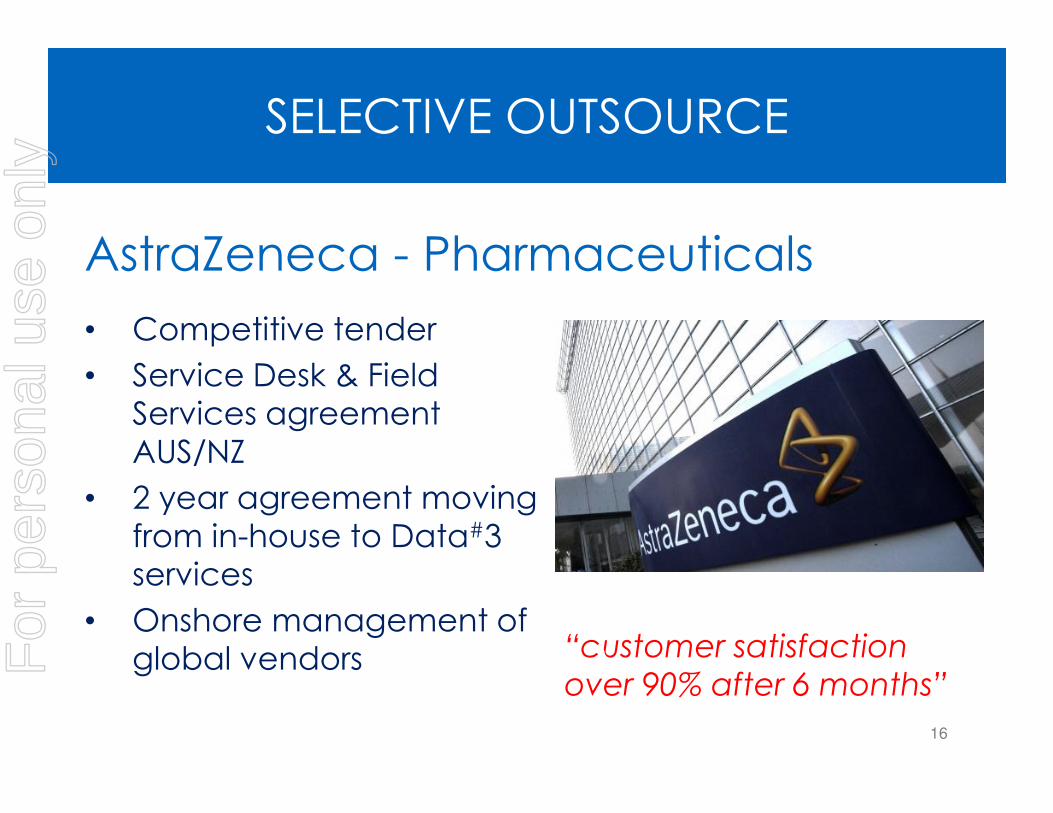
SELECTIVE OUTSOURCE
16
AstraZeneca - Pharmaceuticals
• Competitive tender
• Service Desk & Field Services agreement AUS/NZ
• 2 year agreement moving from in-house to Data#3 services
• Onshore management of global vendors “customer satisfaction
over 90% after 6 months”
For
per
sona
l use
onl
y

STAFF AUGMENTATION OUTSOURCE
17
British American Tobacco
• Competitive tender
• Data#3 Hybrid IT staff augmentation
• 3 years – full management of 40+ IT team
• One supplier, fixed price, one invoice and cost savings
“12% cost reduction with
impressive soft benefits”
For
per
sona
l use
onl
y

1H FY14 SUMMARY
For
per
sona
l use
onl
y
1H FY14 SUMMARY
“In a challenging market in which decisions
remained difficult and competitive
particularly for our core product and
associated services businesses, we were
not able to achieve our financial
objectives. However with strong cash
management and a strong balance sheet,
the board was able to declare a fully
franked dividend of 1.5 cents per share” 19
Summary
For
per
sona
l use
onl
y

WHAT WE DO
For
per
sona
l use
onl
y

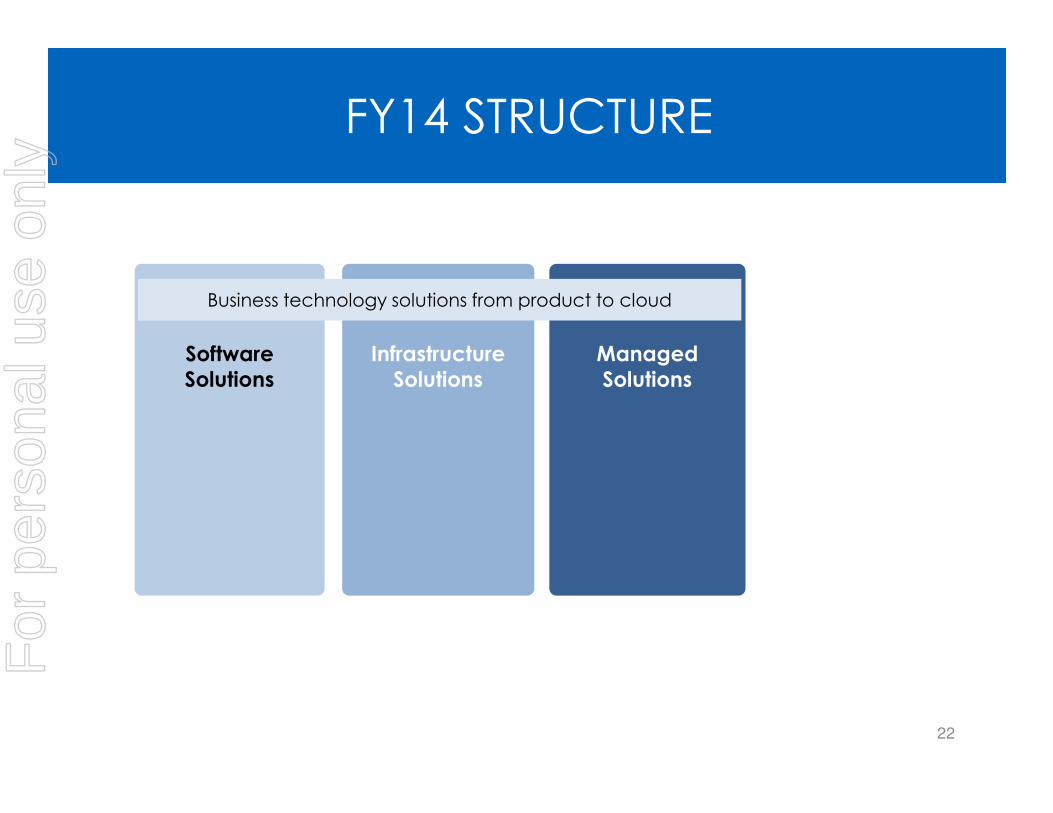
REALIGNMENT AND CONSOLIDATION
• Aligned around our customers’ needs for HYBRID IT, a combination of on premise, outsourced and cloud
• Realigned the 5 areas of specialisation into 3
o Software Solutions
o Infrastructure Solutions
o Managed Solutions
• Consolidated all ‘back office’ functions into 2 business
o Shared Services
o Corporate Services21
July restructure
For
per
sona
l use
onl
y
Software
Solutions
22
Infrastructure
Solutions
Managed
Solutions
FY14 STRUCTURE
Business technology solutions from product to cloud
For
per
sona
l use
onl
y
Software
Solutions
23
Infrastructure
Solutions
Cloud Consulting
Cloud Delivery
Project Services
Service Desk
Managed
Solutions
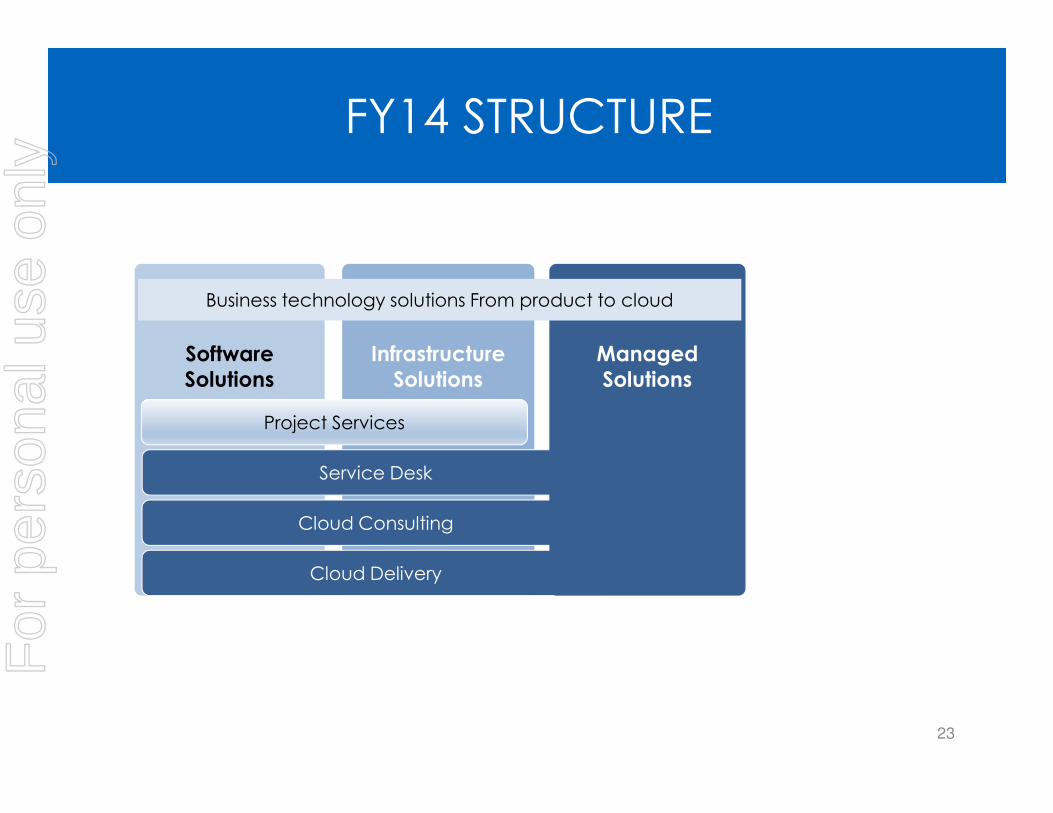
FY14 STRUCTURE
Business technology solutions From product to cloud
For
per
sona
l use
onl
y

Software
Solutions
24
StatesNational Initiatives
Telstra, Supply Chain
Education
Infrastructure
Solutions
Cloud Consulting
Cloud Delivery
Project Services
Supply Chain Group Administration
Marketing & PartnersShared Services
Information Systems
HR
Legal/ComplianceFinance Corporate ServicesBoard
Service Desk
Managed
Solutions
FY14 STRUCTURE
Business technology solutions From product to cloud
For
per
sona
l use
onl
y

SHAREHOLDER PERSPECTIVE GOING FORWARD
For
per
sona
l use
onl
y

SHAREHOLDER PERSPECTIVE
1. Is DTL’s FY14 plan still appropriate?
2. Has it been well executed?
3. In a market in transition, is DTL positioned
to grow revenues, profit and dividends?
4. When can we expect this to happen?
26
4 questions ……
For
per
sona
l use
onl
y

SHAREHOLDER PERSPECTIVE
27
Is DTL’s FY14 plan still appropriate?
Assumptions
• Difficult macro-economic times
• Significant technology disruptors will drive Hybrid IT
with emphasis on cloud
• Aggressive competition for the best people
Simplified structure
Enhance strategic positioning by extending our solutions into HYBRID IT & transformational services
Leverage our investments
Focus on sales performance and productivityFor
per
sona
l use
onl
y

SHAREHOLDER PERSPECTIVE
28
Is DTL’s FY14 plan still appropriate?
We are certain that it is.
For
per
sona
l use
onl
y

SHAREHOLDER PERSPECTIVE
29
Has the plan been well executed?
Simplified structureIn place but impact underestimated and took time for sales momentum to build
Enhance strategic positioning by extending our solutions into HYBRID IT & transformational services
Additional operating expenditure required in aaS and sales capacity in 2H
Leverage our investments
Poor product market dulled supply chain leverage; aaS investment leveraged; premises & people investments have upside
Focus on sales performance and productivity
Not on track as December fell short of forecasts. Win ratios declined in competitive market
For
per
sona
l use
onl
y

SHAREHOLDER PERSPECTIVE
30
Has the plan been well executed?
While we underestimated the impact of
the July restructure, particularly on sales
performance, this is now past and our
teams are fully engaged in the new
areas of specialisation.
For
per
sona
l use
onl
y

SHAREHOLDER PERSPECTIVE
31
In a market in transition, is DTL
positioned to grow revenues, profit and
dividends?
1. A unique point in time
2. Three elements to the transition
3. Our response
4. The customer references that support thisFor
per
sona
l use
onl
y

1970 1980 1990 2000 2010
32
A MARKET UNIQUELY IN TRANSITION
IBM S360
1960
IBM S/3
IBM PC
INTERNET
CLOUD
iPhone
For
per
sona
l use
onl
y

THREE ELEMENTS TO THE TRANSITION
IT commoditising
IT consumption changing
Risk shifting
33
For
per
sona
l use
onl
y

IMPLICATIONS OF THE TRANSITION
IT commoditising
IT consumption changing
Risk shifting
Data centre desktop product
and related services
Competitive and price sensitive
Demands solution packaging & operational efficiency
HYBRID IT From product to
outsource to cloud
From Capex to Opex
Demands solution breadth,
integration and financing
From implementation to
adoption
New service types
Demands investment and
trusting relationships
34
For
per
sona
l use
onl
y

OUR RESPONSE TO THE TRENDS
35
IT commoditising
IT consumption changing
Risk shifting
Sales efficiency
Investment in supply chain automation
‘Rapid’ service packaging
Investing in aaS
People augmentation
Maturing selective sourcing solutions
Investing in aaS
Finance partner
Niche adoption services in
Consulting and Business
Productivity
Investing in aaS
35
For
per
sona
l use
onl
y

SUPPORTING REFERENCES
IT commoditising
IT consumption changing
Risk shifting
36
For
per
sona
l use
onl
y

SHAREHOLDER PERSPECTIVE
37
In a market in transition, is DTL
positioned to grow revenues, profit and
dividends?
We think we are and as our customers
re-architect their IT strategies, we
believe we’re positioned strongly with
offerings and references.For
per
sona
l use
onl
y
SHAREHOLDER PERSPECTIVE
38
When can we expect this to
happen?
We’re seeing conditions improving which
should translate in time to more positive
sentiment toward investment.
This in turn will lead to more significant
take-up in aaS and transformational
services.For
per
sona
l use
onl
y

2H FY14OUTLOOK
For
per
sona
l use
onl
y

2H GUIDANCE
“With the shortfall in first half
performance it will be very difficult for the
company to achieve its original target to
at least match FY13”
40
For
per
sona
l use
onl
y

2H GUIDANCE
“However activity levels are very
high and with pipeline building our
original 2H FY14 target, while
aggressive, is not beyond reach. We
will keep shareholders advised as
the second half progresses”
41
For
per
sona
l use
onl
y

Q & A
For
per
sona
l use
onl
y

APPENDIX 1 – FINANCIAL SUMMARY
43
For
per
sona
l use
onl
y

DISCLAIMER
This presentation has been prepared by Data#3 Limited (“the Company”). It contains general background information about the Company’s activities current as at the date of the presentation. It is information given in summary form and does not purport to be complete. The distribution of this presentation in jurisdictions outside Australia may be restricted by law and you should observe any such restrictions.
This presentation is not (and nothing in it should be construed as) an offer, invitation, solicitation or recommendation with respect to the subscription for, purchase or sale of any security in any jurisdiction, and neither this document nor anything in it shall form the basis of any contract or commitment. The presentation is not intended to be relied upon as advice to investors or potential investors and does not take into account the investment objectives, financial situation or needs of any particular investor. These should be considered, with or without professional advice, when deciding if an investment is appropriate.
The Company has prepared this presentation based on information available to it, including information derived from publicly available sources that have not been independently verified. No representation or warranty, express or implied, is made as to the fairness, accuracy, completeness, correctness or reliability of the information, opinions and conclusions expressed.
Any statements or assumptions in this presentation as to future matters may prove to be incorrect and differences may be material. To the maximum extent permitted by law, none of the Company, its directors, employees or agents, nor any other person accepts any liability, including, without limitation, any liability arising from fault or negligence on the part of any of them or any other person, for any loss arising from the use of this presentation or its contents or otherwise arising in connection with it.
44
For
per
sona
l use
onl
y

For
per
sona
l use
onl
y

For
per
sona
l use
onl
y