fy15 compact and budget planning guidelines...
TRANSCRIPT

FY15 Compact and Budget Planning
Guidelines
Academic Units
January 17, 2014
Materials Due: (see sections E, F and G
beginning on page 20)
1. Compact Information
2. Investment Opportunities
3. Reallocations
4. Significant Financial Issues
5. ICR Estimates
6. Collegiate/Campus & Durable Goods Fees (& Fee entry into the
system)
7. Student Services Fee Waivers
8. Transfers Between Units
9. Budget Development Worksheet
10. O&M/State Special Compensation
11. ISO Rates
Materials Due: five working days prior to scheduled budget oversight/compact meeting

Budget Planning Guidelines for FY15 – Academic Units
2
Contents Page
A. Compact /Budget Development Process for FY15 3
B. Academic Units Included in these Instructions 3
C. Context of the Biennial State Appropriation 5
D. FY15 Budget Parameters – Planning Assumptions: 5
1. Budget Framework for FY15 5
2. Planning for Reallocations 6
3. Salary and Fringe Benefit Assumptions 7
4. Enterprise System Assessment 11
5. Property & Liability and Non-Profit Organization Liability Insurance 11
6. Utility Rates 13
7. Tuition Estimates 15
8. ICR Estimates 16
9. Cost Pool Allocations 19
E. Submissions – Compact Information 20
F. Submissions - Budget Planning 21
1. Investment opportunities 21
2. Reallocations for FY15 21
3. Reallocations Implemented FY14 25
4. Significant Financial Issues 25
G. Submissions – Detailed Budget Materials 26
1. Revenue Estimates – ICR 26
2. Collegiate/Campus and Durable Goods Fees 26
3. Course, Misc. & Academic Fee Entry and Approval 27
4. Student Services Fee Waivers 28
5. Transfers Between Units 30
6. Budget Development Worksheets 30
7. O&M/State Special Compensation 32
8. Internal Sales Rate Setting 32
H. Process 33
1. Meetings and Due Dates 33
2. Budget Recommendations 34
3. Balancing the Overall University Budget 34 Figures
1. Graduate and Professional Student Fringe Table 10
2. FY15 ICR Revenue Estimate Response 18
Appendix A – Cost Pool Descriptions 35
Appendix B – Treatment of Space in the Budget Model 41
Attachment 1 – Indirect Cost Recovery – Unit Estimates for FY15 43

Budget Planning Guidelines for FY15 – Academic Units
3
A. Compact/Budget Development Process for FY15
The process for compact development for FY15 has changed for many of the academic units reporting to
the Provost. For the Twin Cities colleges, an initial set of compact questions was sent out from the
Provost’s office in November, with follow up expected at their regularly scheduled individual
collegiate/Provost meetings in December and January. For those units, there are no additional compact
instructions to respond to at this time. Instead, you will be developing the issue agenda for the budget
oversight/compact meetings in consultation with the Provost.
For those academic units that did not already receive the separate compact questions from the Provost,
they are included as a separate document attached to the email with these Budget Instructions. Please
submit a response to these questions as appropriate (not all questions are relevant for each unit) at the
same time you submit your budget response. The units that should respond to the Compact Instructions at
this time are:
AHC Shared
Athletics
Auxiliary Services
Provost Office – Academic Centers
Research, VP – Academic Centers
Undergraduate Education – Academic Centers
University of MN Crookston
University of MN Duluth
University of MN Morris
University of MN Rochester
Level of Implementation
For purposes of budget development, the “unit” designation used in these instructions remains the
Resource Responsibility Center (RRC). Although some aspects of the budget model require calculations
at a DeptID level (department or lower), by and large decisions will continue to be made at the RRC
level. If a Dean/Chancellor/RRC Unit Head wishes to systematically or formulaically allocate costs
down to a department level, he or she will first need approval from the Provost. Each RRC remains the
organizational level of the University to be held accountable for the financial management of the units
within it, so there is no expectation that a unique knowledge and skill base in financial management be
developed in all departments in response to the budget model. It is, however, the responsibility of the
RRC level management to communicate the financial framework context and information to
departments and units as appropriate to foster a better understanding of the budget throughout the
University.
B. Academic Units Included in these Instructions
Units receiving these instructions are considered academic units for purposes of the internal budget
model. These are the units that will:
1) receive earned revenues directly
2) receive as allocations 100% of the state appropriation
3) receive charges annually for the costs represented by support unit budgets
Unit Budget Officer for FY15
Ag. Experiment Station Julie Tonneson
Athletics Julie Tonneson
Auxiliary Services Julie Tonneson

Budget Planning Guidelines for FY15 – Academic Units
4
Unit Budget Officer for FY15
Biological Sciences Julie Tonneson
Unit Budget Officer for FY14
Continuing Education Carole Fleck
Crookston Campus Carole Fleck
Design Lincoln Kallsen
Duluth Campus Carole Fleck
Education & Human Dev Lincoln Kallsen
Liberal Arts Julie Tonneson
Ag., Food & Environmental Sc. Lincoln Kallsen
Carlson School of Mgmt Robin Dittmann
Dentistry Robin Dittmann
Humphrey Institute Robin Dittmann
Science & Engineering Julie Tonneson
Law School Robin Dittmann
Medical School Robin Dittmann
MN Extension Julie Tonneson
Morris Campus Carole Fleck
Nursing Robin Dittmann
Pharmacy Robin Dittmann
Public Health Robin Dittmann
Rochester Campus Carole Fleck
Veterinary Medicine Robin Dittmann
AAPRV
Weisman Robin Dittmann
Concerts & Lectures/Northrop Robin Dittmann
CURA Robin Dittmann
Institute for Advanced Study Robin Dittmann
Research & Community Engagement Robin Dittmann
U Metropolitan Consortium Robin Dittmann
GPSTR
Interdiscp. Center for Global Change Lincoln Kallsen
RSRCH
Center for Cognitive Sciences Robin Dittmann
Center for Transportation Studies Robin Dittmann
Hormel Inst. Robin Dittmann
Institute on the Environment Robin Dittmann
MN Population Center Robin Dittmann
MN Supercomputer Institute Robin Dittmann
University Press Robin Dittmann
STDAF
Boynton Lincoln Kallsen
Rec Sports Lincoln Kallsen
TC Student Unions Lincoln Kallsen
Student Legal Serv. Lincoln Kallsen
Student Conflict Res. Lincoln Kallsen
AHCSH
All Units Robin Dittmann
UEDUC
Academic Counseling Lincoln Kallsen

Budget Planning Guidelines for FY15 – Academic Units
5
Air Force ROTC Lincoln Kallsen
Army ROTC Lincoln Kallsen
Navy ROTC Lincoln Kallsen
*Note – Student Affairs units are included here as part of the academic unit budget process. However,
their materials were submitted in the fall to accommodate the student fee approval process. Final budgets
will be approved as part of this process, so they are listed here, but they need not resubmit budget
materials submitted last fall.
C. Context of the Biennial State Appropriation:
The table below outlines the state general fund appropriations to the University of MN for the current
(2014-2015) biennium. The appropriations from the Health Care Access Fund, and the appropriation to
the academic Health Center pursuant to Minnesota Statutes 297.10 remain stable at $2.2 million and
$22.2 million respectively, and have been excluded from the table.
University of Minnesota
2014 – 2015 Biennial Appropriations ($ in Thousands)
FY2014 FY2015 Biennium
Beginning Biennial Base Level Appropriation $545,344 $545,344 $1,090,688
S.F. 1236 State Funding Level $576,799 $591,099 $1,167,898
Change from Beginning Biennial Base Level $31,455 $45,755 $77,210
Change from Prior Year $31,455 $14,300
% Increase from Prior Year 5.8% 2.5%
% Increase from Base Level Funding 7.1%
The $14.3 million increase in appropriation for FY15 (compared to FY14) is the result of two separate
funding decisions:
An increase of $14.2 million to hold the resident undergraduate tuition rate flat at the 2013-14
level – second year of flat rates for resident undergraduate tuition
An increase of $100,000 for the MnDRIVE research initiative (funding committed to the four
proposed research projects: Robotics, Sensors and Advanced Manufacturing; Securing the Global
Food Supply; Advancing Industry, Conserving Our Environment; and Advancing Discoveries
and Treatments for Brain Conditions)
The growth in the appropriation has been factored into the overall FY15 budget framework.
D.FY15 Budget Parameters – Planning Assumptions:
1. Budget Framework for FY15: At this point in the process, the planning assumptions for balancing
the FY15 annual budget have been updated from what was included in the FY14 Operating Budget
approved by the Board of Regents in June. For the O&M (appropriation and tuition) and State Special
budget, the budget balancing planning framework that is the basis for these budget instructions is as
follows:

Budget Planning Guidelines for FY15 – Academic Units
6
Incremental Resources
Tuition (graduate/professional/nonresident) $4,500,000
Appropriation – Tuition Relief 14,200,000
Appropriation – MnDRIVE 100,000
Internal University Resources – Recurring 24,900,000
Total $43,700,000
Incremental Expenditures
Compensation $15,400,000
Incremental MnDRIVE 100,000
Facilities/Contractual Obligations/Investments 26,700,000
Total $42,200,000
Balance $1,500,000
The tuition estimate included in the framework factors out revenue increases from changes in enrollment
or surcharges, and instead reflects a similar revenue growth to what is estimated for FY14 (over FY13)
from rate changes on graduate, professional and nonresident rates only. As in past years, this overall
estimate will be refined during the budget process based on your responses to separate instructions you
will receive in February related to tuition estimates for FY15.
The cost of compensation assumes a 2.5% increase in salaries and a reduction in fringe rates (detailed
below). Cost estimates for facility related expenses (utilities, debt service, new building operations) were
originally based on an assumption of trend growth, but have been refined based on more up-to-date
information. Finally, with the updated/reduced facility cost estimates, there is a planned investment pool
for all units of over $20 million.
In order to balance the budget given the relatively small increase in appropriation and tuition revenues
and the estimated expenditures related to compensation, facilities, other bills, and potential investments in
units, the required internal reallocation or level of internal University resources necessary is $24.9
million.
2. Planning for Reallocations: As just mentioned, the planning framework for FY15 includes a targeted
O&M and State Special funds $24.9m reallocation for all academic and support units. This calculation
results in an amount approximately equal to 1.5% of the FY14 adjusted O&M/State Specials/Tuition
allocation base included in the approved budget (adjusted for the elimination of institutional financial aid
programs, utilities, leases, etc.).
A portion of this target was implemented in support units during the fall process through productivity
improvements or cost reductions, and a portion will be implemented within the academic units (see
section F-2 below for the reallocation targets by unit and further guidelines on how to approach this
reallocation).
Future Reallocations: At the September Board of Regents meeting, the President outlined his
“Operational Excellence Implementation Plan”. As part of that plan, the President has committed to
achieving at least $90 million in administrative cost savings over a six year timeframe (FY14 – FY19), or
$15 million per year. In the first year of the plan, FY14, we will have achieved $15 million in accordance

Budget Planning Guidelines for FY15 – Academic Units
7
with the performance measure outlined by the state legislature in the higher education funding bill (see
section F-3 below for further information on FY14).
In FY15, we need to identify at least $15 million in additional cost savings, which will then be redirected
to enhance our mission activities, stem the overall growth in the net cost to attend the University, and to
meet inflationary cost pressures as identified in the overall budget framework. A portion of this $15
million list will be derived from responses to the $24.9 million reallocation target, but when final, the list
will incorporate administrative cost reduction in all nonsponsored funds (see section F-2 below for
details).
3. Salary and Fringe Benefit Assumptions: Information in this document related to compensation
matters has been prepared for budgeting purposes only and should not be interpreted as an attempt by the
University to disregard good faith bargaining with affected employee groups or to ignore all other
mandates of PELRA. In addition, all described plans are subject to Board of Regents approval.
Consistent with plans outlined for the FY15 budget framework, a general 2.5% salary increase, along with
the associated fringe rates outlined below, should be assumed in developing overall cost estimates for
compensation in FY15. This estimate represents a general planning parameter to be used at the unit level.
A set of documents outlining the details of implementing the final salary plans for FY15 will be
distributed from Human Resources at a later date.
Projected fringe benefit rates for FY15 for use in budget planning are outlined below. The rates differ
from FY14 because, as in any year, the federally required methodology for calculating fringe rates, which
must reconcile to the annual audited financial statement, necessitated a change in the rates based on the
final FY13 actual expenditures. These are the rates you should use to calculate the estimated impact on
your non-sponsored budget as requested in section G-7 below:
Projected 2014-15
Civil Service 34.2%
Academic 32.5%
Graduate Assistant 23.3%
Fringe Simplification: A proposal has been approved as a part of the Enterprise System Upgrade Project
which changes the employee groups and the methodology used for the calculation of departmental fringe
benefit charges. Although this will be implemented in FY15, using the above rates remains an accurate
budget planning tool at this point. The Budget Office will be calculating the budgetary impact by unit
from implementation of the fringe simplification changes – the difference in cost from what the above
rates generate as an estimated cost increase compared to the rates under the new methodology. You
should use the rates above to determine the changes in salary and fringe for FY15, and then there will be a
separate process to calculate the impact (more or less cost) as a result of the new methodology, and
budget decisions will be made to address those secondary impacts – make them budget neutral or address
them through subsequent allocation decisions.
Budgeting for Graduate Student Remission Charges:
Graduate assistants qualify for tuition benefits according to the number of hours worked per semester,
with 100% tuition benefits earned for 390 hours (20 hours per week for 19.5 weeks, which is a 50%
appointment.) Students appointed between 97.5 and 390 hours per semester will receive prorated tuition
benefits; for example a 12.5% appointment (97.5 hours) would receive one quarter of the tuition amount

Budget Planning Guidelines for FY15 – Academic Units
8
and a 25% appointment (195 hours) would receive half tuition. As in the past, students appointed below
the 12.5% level will not receive tuition benefits. Those students appointed between 12.5% and 25% only
get the hourly benefit toward resident tuition. A student must have a 25% appointment (195 hours) in
order to qualify for the waiver of non-resident tuition. All graduate assistants will be required to be on
biweekly payroll. It is possible to move individuals currently at the University to “exceptional hourly” to
avoid requiring them to begin keeping a timecard.
Graduate assistants will be required to register for at least 6 credits (except for those in the special
advanced Ph.D. categories described below.) Students (such as Masters students who have completed
their coursework and thesis credits and part-time students) may petition to the Graduate School to register
for fewer credits.
Charges to Employers
1. The fringe benefit charge for tuition is a flat hourly rate that is set to recover the tuition benefit which
the graduate assistant earns. Next year’s projected $7,729 semester benefit (graduate school tuition) will
be covered by an hourly charge of $17.84 per hour for 390 hours of work plus a subsidy rendered from an
over-recovery in the graduate assistant tuition remission pool in FY2012-13. Because tuition rates have
not yet been approved by the Board of Regents, the rate of $17.84 is preliminary and reflects our best
estimate at the time these instructions were written. This hourly rate will be charged to employers for
every hour of work, even if the student works less than 12.5% or more than 50% time. Anticipated
charges for graduate student tuition remission should be budgeted in account code 710300.
2. The graduate assistant health insurance benefits program will continue with similar benefits for
graduate assistants and their enrolled dependents; the student will again pay 5% of the plan premium. The
plan administrator will remain Health Partners. You can plan on a health fringe rate for FY15 of 16.34%
of salary (additional information will be provided with the Fringe Simplification materials at a later date).
Ph.D. Candidates
1. Once a Ph.D. student has passed the preliminary oral exam and completed 24 doctoral thesis credits
he/she is eligible for employment in one of four job classes at a significantly lower tuition fringe cost.
The student would receive the value of one credit of tuition. This benefit would be prorated for those
appointed less than 50% time, as noted above. The employer would pay a corresponding hourly fringe
rate estimated at $2.83.
Summer
1. The full benefit for 260 hours of graduate assistant employment during the 13 week summer period
will equal the previous year’s semester value. Students who work fewer than 260 hours will receive
prorated benefits (except for summer session teaching assistants; see below.) Students may use this
benefit for any mix of registrations during summer session terms. Employers will pay the same $17.84
hourly fringe rate on these job classes for summer 2015.
2. In order to avoid unnecessary tuition fringe charges for graduate assistants who don’t need to register
during the summer, four job classifications are available for that period only. They carry no tuition
benefit or tuition fringe charge, but of course they must then incur FICA taxes because the employee is
not a registered student. For graduate assistants who do need to register during the summer, the regular
year-round job classifications should be retained. Health insurance coverage and fringe charge continue
on both sets of job classes (additional information will be provided with the Fringe Simplification
materials at a later date).

Budget Planning Guidelines for FY15 – Academic Units
9
3. Summer session teaching assistants pose a unique problem because their entire salary (as with summer
session faculty) is paid (at a higher hourly rate) in the 200 hours of a five-week term. To provide the
same tuition benefit that a comparable graduate assistant would earn for teaching a course during fall or
spring semesters, requires charging a higher hourly fringe rate ($42.17 for summer 2015) on those
recorded 200 hours of teaching during the summer session. They end up with the same total pay and
benefits as in other semesters and summer session departments will pay the same total fringe charge.
Professional Program Assistantships
1. The job classes of Medical Fellow and Medical Resident are clinical residency positions that
typically involve 100% time appointments. Therefore, the fringe rate has been set to recover the
tuition costs over 780 hours of work per semester.
2. The job classes of Veterinary Resident-Grad Program are clinical residency positions that
typically involve 75% time appointments. Therefore, the fringe rate has been set to recover the
tuition costs over 682.50 hours of work per semester.
3. Students pursuing professional post-baccalaureate degrees outside the Graduate School (such as
JD or MBA) do not generally need the teaching or research experiences as preparation for their
future careers. A specific job class, Professional Program Assistant (9535), is for such students in
those professional degree programs who are employed within their college of registration. These
positions will carry no tuition benefit or fringe charge, but will be included in the graduate
assistant health benefit program for students whose appointments are 25% time or greater.
The above information is summarized in table format in Figure 1 of these instructions. For questions
about this policy, please contact, Susan E. Cable-Morrison, Manager, Graduate Assistant Services/Office
of Human Resources (624-3393) or [email protected].

Budget Planning Guidelines for FY15 – Academic Units
10
Figure 1
Graduate and Professional Student Fringe Table
Tuition Fringe as Dollar per Hour Charge
Fiscal Year 2014-15
Tuition Health Social Security
Medicare
Total
% Fringe
Summer Term Only
9571 Summer Term TA $0.00 16.34% 6.96% 23.30%
9572 Summer Term RA $0.00 16.34% 6.96% 23.30%
9573 Summer Term AF $0.00 16.34% 6.96% 23.30%
9574 Summer Term TA w/ T. Ben $42.17 16.34% 6.96% 23.30%
9575 Summer Session TA w/o T. Ben $0.00 16.34% 6.96% 23.30%
Academic Year and Summer Term
9510 Graduate Assistant Coach $17.84 16.34% 6.96% 23.30%
9511 Teaching Assistant (TA) $17.84 16.34% 6.96% 23.30%
9515 Graduate Instructor $17.84 16.34% 6.96% 23.30%
9517 Ph.D. Cand. Graduate Instructor $2.83 16.34% 6.96% 23.30%
9518 Advanced Masters TA $2.83 16.34% 6.96% 23.30%
9519 Ph.D. Cand. w/24 thesis cred. TA $2.83 16.34% 6.96% 23.30%
9521 Research Assistant (RA) $17.84 16.34% 6.96% 23.30%
9526 Graduate Research Project Asst. $17.84 16.34% 6.96% 23.30%
9527 Ph.D. Cand. Grad Research Asst. $2.83 16.34% 6.96% 23.30%
9528 Advanced Masters RA $2.83 16.34% 6.96% 23.30%
9529 Ph.D. Cand. w/24 thesis cred. RA $2.83 16.34% 6.96% 23.30%
9531 Administrative Fellow (AF) $17.84 16.34% 6.96% 23.30%
9532 Advanced Masters AF $2.83 16.34% 6.96% 23.30%
9533 Ph.D. Cand. w/24 thesis cred. AF $2.83 16.34% 6.96% 23.30%
9535 Professional Program Asst. $0.00 16.34% 6.96% 23.30%
9538 Legal Project Assistant w/T. Ben $40.27 0.00% 6.96% 6.96% 9539 Legal Project Asst. w/o T. Ben $0.00 0.00% 6.96% 6.96%
9553 Dental Fellow $17.84 0.00% 6.96% 6.96% 9554 Med Fellow, Graduate Program $8.92 0.00% 6.96% 6.96% 9559 Med Resident, Grad Program $8.92 0.00% 6.96% 6.96% 9549 Vet Resident, Grad Program $11.89 0.00% 6.96% 6.96%
FICA assessed only if student fails test for exclusion. Graduate students employed at the University will be exempt
from FICA withholding on their University wages, and therefore, their salaries will not be assessed for the
employer’s share of FICA, if they meet the following test:
Enrolled for at least 3 credits per term if a graduate student (one credit for Ph.D. candidates working on a
dissertation)
Social Security and Medicare components are 5.66% for FICA and 1.3% for Medicare (6.96% total)

Budget Planning Guidelines for FY15 – Academic Units
11
4. Enterprise System Assessment - The Enterprise Assessment is a systematic method of assessing units
a fee to pay for the development, implementation, maintenance and replacement of institutional business
systems.
The assessment is charged to individual fund-deptID-programs through the general ledger allocation
process. This monthly process applies a set percentage against certain salary expenditures in specific
funds. A general ledger journal entry is then posted to the actual general ledger. Beginning in FY14, the
Enterprise System Assessment rate was increased from 1.25% to 1.75%, and it will continue at
1.75% for FY15 and beyond. This is necessary to cover the costs of the Enterprise System Upgrade
Project over a reasonable timeframe, as well as longer-range strategies to address enterprise systems
requirements.
The following assumptions should be built into the FY15 budget plans at this time:
Assessment rate of 1.75% of projected FY15 salaries
Expected assessment should be budgeted in account code 820200 – Enterprise Assessment-Final
Budget Only. (Actual charges will hit account code 820201).
Assessment is on actual salary expenditures in the following funds, with a few individual chart
string exceptions:
State Appropriation, Tuition, U Fee – fund 1000
Auxiliaries – funds 1100 – 1106, 1152, 1153
Other Unrestricted – funds 1020, 1023, 1024, 1025, 1026
Private Practice – fund 1030
Restricted State Specials – funds 1801 – 1807
Assessment occurs near the end of an accounting period based on actual salary expenses in that
period. Both debits and credits to salaries are included in the assessment calculation.
Salary expense used in the calculation will include the following account codes:
700101 – Salaries – Faculty
700201 - Salaries – Professional & Administrative
700301 - Salaries – Graduate/Professional Student – Tuit Ben
700302 – Salaries – Graduate/Professional Student – No Tuit Ben
700401 – Salaries – Undergrad Academic
700402 – Salaries – Undergrad Non-Academic
700501 – Salaries – Civil Service
700502 – Salaries – AFSCME
700503 – Salaries – Teamster/Law Enforcement
700504 – Salaries – Trades
700801 – Salaries – 27th PD Accrual
Questions regarding the Enterprise Assessment allocation process can be directed to the University
Financial Helpline at (612) 624-1617 or [email protected].
5. Property & Liability and Non-Profit Organization Liability Insurance
Property and Liability Insurance: The University purchases property and liability insurance centrally
for all of its campuses and programs. The University’s property insurance provides coverage to
University-owned buildings and contents for perils such as fire, windstorm, hail, explosions, smoke,
vandalism, water damage, etc. General Liability insurance provides coverage for third party
injury/damages. This policy provides coverage for injuries/damages to students, volunteers, and visitors
on campus when the University is determined to be negligent.

Budget Planning Guidelines for FY15 – Academic Units
12
The Office of Risk Management charges RRCs for University property and liability insurance premiums
based on each RRC’s share of total University space. The premium expenditure should be budgeted by
each RRC as account code 720313. The Office of Risk Management will initiate a journal entry to
complete the transaction for FY15 sometime in the first three months of the fiscal year.
Non-Profit Organization Liability (NPOL): The University purchases Non-Profit Liability Insurance
centrally for all its employees, officials and authorized volunteers. Non-profit liability insurance has
primarily focused on the cost of employment disputes, including claims of sexual harassment, unlawful
discrimination and various constitutional violations. Employment related litigation has increased over the
years, as has the volatility of damage awards.
The Office of Risk Management charges RRCs for a portion of the University Non-Profit Organization
Liability insurance premiums based on each RRC’s share of the total current, non-sponsored salaries in
fiscal year accounts during FY14. The premium expenditure should be budgeted by each RRC as account
code 720313. The Office of Risk Management will initiate a journal entry to complete the transaction for
FY15 sometime in the first three months of the fiscal year.
For FY15 planning purposes, each unit should assume a 6% increase in the amounts billed for FY14,
most heavily influenced by projected increases in property and general liability insurance costs. Once
again, the change anticipates pricing changes in the global property insurance marketplace. Please
understand this is an estimate and the actual costs may differ slightly. The FY14 actual charge and the
projected FY15 estimates are listed below by unit. For those units with support and academic functions,
the amounts were communicated in the fall as part of the support units’ budget process.
FY14 Actual Charge FY15 Estimate
Ag. Experiment Station $44,935 $47,631
AHC Shared 176,954 187,571
Athletics 366,014 387,975
Auxiliary Services 821,680 870,981
Biological Sciences 134,021 142,063
Carlson School of Mgmt 109,171 115,721
Continuing Education 40,259 42,675
Crookston 175,180 185,690
Dentistry 103,039 109,222
Design 66,111 70,077
Duluth 799,152 847,101
Education & Human Dev. 178,226 188,920
Food, Ag. & Nat. Res. Sciences 433,823 459,853
Humphrey School 32,761 34,727
Law School 95,416 101,141
Liberal Arts 411,424 436,110
Medical School 577,373 612,015
MN Extension 42,214 44,746
Morris 239,490 253,859
Nursing 24,541 26,013
Pharmacy 62,913 66,688
Public Health 77,869 82,541
Rochester 5,691 6,033
Science & Engineering 533,921 565,956
Veterinary Medicine 170,923 181,178

Budget Planning Guidelines for FY15 – Academic Units
13
6. Utility Rates
Utility costs will continue to be managed by each campus (or research and outreach station).
On the Twin Cities campus, costs for steam, electrical, gas and chilled water use will continue to be
allocated to each RRC based on the actual consumption of these utilities by the buildings in which the
RRC has programs in operation. The cost for the remaining utility (water), will be included in the
Facilities Management O&M (Operations and Maintenance) cost pool based on proportionate share of
ASF. If your RRC is not included in the Facilities O&M cost pool, you will continue to be directly billed
for all FM services and this additional utility.
Below is a short summary of these utilities, their cost components, how FM develops and tracks both cost
and utilization of these utilities, and a summary of the rates.
1. Rates Allocated based on consumption to all RRCs
There are 2 factors in determining the allocated utility cost for electricity, steam (heat), gas and chilled
water:
a. Utility rate
b. Utility consumption
The Steam, Electrical, Gas and Chilled Water utility rates are applicable to units on the Twin Cities
campus. The newly published rates will be effective on July 1, 2014 and are held stable for the complete
fiscal year. The rates include costs to purchase, produce, manage, and deliver the utilities and are
described in more detail below. Utilities are operated as an internal sales activity and are managed to be a
‘break-even’ operation. Therefore, at the end of each fiscal year, the difference in actual cost to provide
the utility vs. the published ‘rate’ cost to provide the utility is rolled into future published rates (i.e.
surpluses help lower future rates, and deficits increase future rates).
Consumption of steam, electricity, gas and chilled water are metered for every building on campus on a
monthly basis. This information is then used to allocate cost for the month based on the ASF (assignable
square feet) of each program within each building (DeptID level information from the space database
‘snapshot’ taken in the fall). The space information used for this allocation is updated annually in the fall
(see Space Information section in Appendix B for more on this process).
To assist in budgeting for these utility costs, the projection of costs for FY15 for each unit is included on
the budget development worksheet. In addition, a schedule with this information and with projections of
utility consumption for each building and RRC (with DeptID detail) will be made available on the Budget
Office web site in the near future (you will get e-mail notification of the posting of data). A projection of
consumption is also available to customers outside the cost pool such as academic enterprises,
independent organizations, and institutional supported departments upon request. Requests can be made
to Arwen Bloomdahl at extension 5-0725.
FY2013-14 FY2014-15
Current Rate Estimated Rate
Steam – 1,000 lbs of steam (Mlb) $21.98 $23.21

Budget Planning Guidelines for FY15 – Academic Units
14
Steam costs are allocated based on Mlb (M-pound, or 1,000 pounds of steam). The steam rate includes
the costs of fuel, operations of the boilers and plant, capital and maintenance of the distribution systems,
energy conservation projects, and administration.
Electric – Kilowatt Hours (Kwhr) $.0991 $.1008
Electric costs are allocated based on Kilowatt Hours (Kwhr). The electric rate charged to the U by Xcel is
a complicated set of formulas based on timing of peak use, fuel cost pass-through, etc. The above
University rate is set for the fiscal year and is a budgeted average cost. The electric utility rate includes
the purchased costs of electricity, distribution costs, capital renewal, energy conservation projects and
administration.
Gas – Dekatherm (Dkthrm) $7.92 $8.00
Gas costs are allocated based on dekatherms. The University rate is set for the year and is budgeted based
upon average cost. It includes the costs of purchased gas, administration, and energy conservation. The
purchased gas is a commercial/industrial firm gas provided by CenterPoint Energy or Xcel. This gas
charge generally applies to buildings not on the campus steam systems but can also apply to buildings
with such gas uses as laboratories or kitchens.
Chilled Water (ton/hour) $0.205 $0.213
Chilled water costs are allocated based on tons of cooling hours (a metered measure). The chilled water
rate includes the electric, steam and water costs used to generate the chilled water. Costs also include
maintenance, capital renewal, energy administration and energy conservation. Central air conditioning
via Chilled Water is not available in all buildings. Only those RRC’s with space in the buildings that are
part of the Chilled Water distribution system will be charged for this Utility.
2. Rates Allocated in O&M cost pool & billed based on consumption for units outside the cost pool
The cost for the remaining utility (water), will be included in the Facilities Management O&M
(Operations and Maintenance) cost pool and spread on the cost/asf charge (see Appendix A for a
description of the Facilities O&M cost pool) for FY14. If your RRC is not included in the O&M cost
pool, you will continue to be directly billed for all FM services and this additional utility.
FY2013-14 FY2014-15
Current Rate Estimated Rate
Water/Sewer – Hundred Cubic Feet (CCF)
Minneapolis $8.78 $ 10.83
St. Paul $5.78 $ 5.98
The Minneapolis water and sewer rate includes purchased costs for water, sewer and storm water. The
St. Paul rate includes water and sewer. Also included in the Minneapolis and St. Paul rates are costs for
maintaining the water distribution system and capital renewal projects.
Water is billed at the actual municipal rate plus a mark-up to cover University maintenance and capital
renewal projects. The monthly per unit rate will fluctuate based on the actual bill from the municipal
utility.

Budget Planning Guidelines for FY15 – Academic Units
15
Questions regarding utility rates should be directed to Wendy Berkowitz at 624-8886, Shari Zeise at 625-
9429, or Arwen Bloomdahl at 625-0725.
7. Tuition Estimates
There are no tuition estimates for FY15 included with these instructions. Instead, updated estimates for
FY14 are detailed in the table below, and preliminary estimates for FY15 will be distributed in February,
along with the corresponding instructions related to submitting unit proposed estimates. This portion of
the budget instructions is delayed because basing the estimates on more up-to-date information will
provide a more accurate estimate for FY15. Please work with the Budget Office if timing doesn’t allow
complete analysis and submission prior to the scheduled budget oversight/compact meeting. The
estimates can be submitted after the scheduled meetings if necessary.
Methodology
This year’s projection model uses actual tuition data from the previous fiscal year (FY13). For the past
few years we have used a projection model which looked at the average proportion of Fall tuition from
UM-Reports tuition attribution against the fiscal end total EFS ledger tuition recorded for each
college/campus over the last four years. In examining the data, we have found that for most units there
has been a slow but steady trend of having slightly more of the total tuition revenue concentrated in the
fall semester. Despite a relatively small year-to-year change, the overall effect on the tuition model is that
there has been modest over-estimation of fiscal year end tuition, usually in the 0.3%-0.5% range. We
hope by concentrating the model only on the most recent past fiscal year we can improve the accuracy
somewhat given the data trends we are seeing.
The proportion of Fall 2012 tuition to final FY13 tuition in the EFS ledger is identified in column B. The
FY14 projections assume that for each campus and college, the Fall 2013 revenue will be the same
percentage of the FY14 total as in the previous fiscal year. Questions regarding the updated tuition
revenue projections for FY14 may be directed to Lincoln Kallsen ([email protected]).

Budget Planning Guidelines for FY15 – Academic Units
16
As you anticipate development of the FY15 tuition estimates, please be prepared to explain the variances
in the table above (column E). It may be that your analysis leads to a different estimate for the current
year, so if that’s the case, please explain the difference and rationale for that difference. However, if you
agree with the estimate above and the FY14 revenue exceeds what was budgeted and planned for, you
should be able to explain how that additional income was used, in part, to generate the increase, or how it
is being used in your current year expenditure plans on a recurring or nonrecurring basis. Conversely, if
the FY14 revenue estimate is less than what was included in the budget, please be prepared to explain
how that difference is being accommodated – through expenditures reductions, other revenue increases or
balances to bridge to next year. These explanations will be requested as part of the supplemental
instructions related to tuition estimates coming in February.
8. ICR Estimates
A new four-year F&A (facilities and administrative cost) rate agreement was signed on December 8,
2011. These new rates are effective from FY12 through FY15, and will continue to be used after the end
of FY15 until a new rate agreement is established.
2013-14 Tuition Projection from Fall data (Fall 2013 FINAL)
A B C=A/B D E=C-D
Fall 2013 Final FactorProjected FY14
Tuition
FY14 Budgeted
Tuition Variance
UMC Crookston Campus 7,740,081$ 0.465 16,659,613$ 16,556,978$ $102,635
UMD Duluth Campus 55,793,326$ 0.496 112,473,169$ 114,203,425$ ($1,730,256)
UMM Morris Campus 8,935,742$ 0.502 17,804,915$ 17,547,729$ $257,186
UMR Rochester Campus 3,203,816$ 0.500 6,405,974$ 6,185,742$ $220,232
AHCSH AHC Shared 2,572,191$ 0.428 6,006,599$ 5,649,218$ $357,381
CBS Biological Sciences 11,080,066$ 0.513 21,597,698$ 21,458,768$ $138,930
CCE Continuing Education 6,190,395$ 0.410 15,096,748$ 13,566,370$ $1,530,378
CEHD Education & Human Development 28,237,336$ 0.457 61,726,725$ 63,876,739$ ($2,150,014)
CFANS Food, Ag & Nat Res Sci. 13,395,770$ 0.518 25,869,776$ 27,344,350$ ($1,474,574)
CLA Liberal Arts 87,709,727$ 0.494 177,387,384$ 173,802,108$ $3,585,276
CSENG Science and Engineering 60,031,197$ 0.513 116,921,084$ 116,239,730$ $681,354
CSOM Carlson School of Management* 34,100,789$ 0.474 71,894,081$ 72,506,876$ ($612,795)
DENT Dentistry 8,551,820$ 0.398 21,499,527$ 19,680,000$ $1,819,527
DESGN Design 8,837,787$ 0.522 16,944,688$ 18,116,507$ ($1,171,819)
GPSTR Global Studies 54,063$ 0.437 123,654$ 132,632$ ($8,978)
GRAD Graduate School 286,058$ 0.537 532,869$ 537,607$ ($4,738)
HHH Humphrey School of Public Affairs 3,618,707$ 0.497 7,274,858$ 7,164,237$ $110,621
HLSCI Health Sciences 178,720$ 0.628 284,389$ $284,389
LAW Law School 16,633,383$ 0.507 32,820,066$ 32,626,446$ $193,620
MED Medical School 17,248,253$ 0.386 44,724,451$ 44,584,674$ $139,777
NURSG Nursing 5,233,615$ 0.452 11,573,267$ 11,441,194$ $132,073
PHARM Pharmacy 9,539,751$ 0.446 21,370,447$ 21,601,390$ ($230,943)
PUBHL Public Health 7,820,627$ 0.429 18,245,730$ 19,204,111$ ($958,381)
UEDUC VP Undergraduate Education 534,126$ 0.553 966,528$ 841,855$ $124,673
VETMD Veterinary Medicine 8,038,182$ 0.446 18,022,791$ 17,230,500$ $792,291
Multi-institutional 64,096$ 0.481
ALL UNIVERSITY 405,629,624$ 0.480 844,227,033$ 842,099,186$ $2,127,847
* Includes tuition surcharge

Budget Planning Guidelines for FY15 – Academic Units
17
Award Type Current Old Rate
Rate
(use for FY15)
On-Campus Research 52.0 51.0
On-Campus Public Service 33.0 32.0
(a.k.a. Other Sponsored Activities)
On-Campus Instruction 50.0 50.0
Hormel Institute 52.5 52.5
Dept. of Defense Contracts 57.0 57.0
Off-Campus Projects 26.0 26.0
For FY15, as in FY14, a college or other unit where research is conducted will receive 100% of the
indirect cost revenue associated with that research. This revenue will be posted automatically by the
PeopleSoft financial system into a designated RRC-level ICR chartstring.
As part of the FY15 budget development process, each unit that generates ICR revenue is asked to submit
an estimate of how much ICR they expect to generate in FY14 (the current year) and also in FY13.
Attachment 1 provides an updated estimate of FY14 ICR revenue and a preliminary estimate of total ICR
revenue for FY15 developed by the Budget Office. Column g contains an updated estimate of total
annual ICR revenue for the current fiscal year, FY14. This updated estimate was developed using actual
ICR revenue generated over the first six months of FY14. Column j, FY15 Estimated Total Revenue, is
the result of multiplying the updated FY14 estimate in column g by 1.0, indicating a 0% inflation factor
for FY15 over the updated estimate for FY14 ICR revenue. We know overall awards for the University
were down in FY13, and preliminary estimates suggest total ICR revenue for FY14 will be below the
FY13 level. While there is no way to know for sure what spending patterns will be on projects, the
Budget Office estimates are assuming no growth over the FY14 estimate. If activity in your college
suggests there will be a decrease in research spending and associated ICR revenue, feel free to decrease
the estimate as deemed appropriate. Colleges that expect increased ICR revenue due to additional awards
or increased activity should increase the estimate accordingly.
As always, the amounts on Attachment 1 represent a starting point in estimating FY15 ICR revenue by
RRC. It is very important for each unit that generates ICR revenue to evaluate these estimates in light of
any circumstances or facts that may be known by the unit but not reflected in the Budget Office estimate.
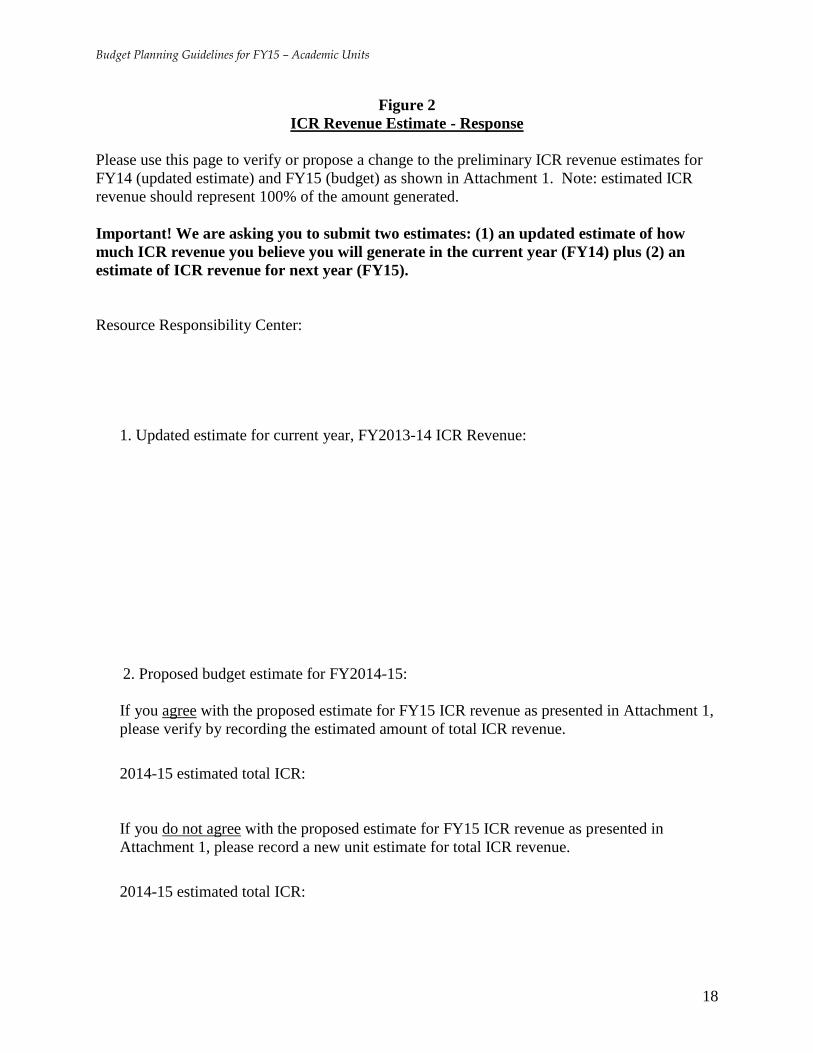
For the budget submittal, please complete Figure 2 entitled FY15 ICR Revenue Estimate - Response to
submit estimates for FY14 (updated estimate) and FY15 (budget) ICR revenue.
If you have any questions regarding these instructions or calculating the ICR revenue estimate for FY14
or FY15, please call Robin Dittmann at (612) 626-9277.
Budget Planning Guidelines for FY15 – Academic Units
18
Figure 2
ICR Revenue Estimate - Response
Please use this page to verify or propose a change to the preliminary ICR revenue estimates for
FY14 (updated estimate) and FY15 (budget) as shown in Attachment 1. Note: estimated ICR
revenue should represent 100% of the amount generated.
Important! We are asking you to submit two estimates: (1) an updated estimate of how
much ICR revenue you believe you will generate in the current year (FY14) plus (2) an
estimate of ICR revenue for next year (FY15).
Resource Responsibility Center:
1. Updated estimate for current year, FY2013-14 ICR Revenue:
2. Proposed budget estimate for FY2014-15:
If you agree with the proposed estimate for FY15 ICR revenue as presented in Attachment 1,
please verify by recording the estimated amount of total ICR revenue.
2014-15 estimated total ICR:
If you do not agree with the proposed estimate for FY15 ICR revenue as presented in
Attachment 1, please record a new unit estimate for total ICR revenue.
2014-15 estimated total ICR:

Budget Planning Guidelines for FY15 – Academic Units
19
9. Cost Pool Allocations
Decisions to date made on the support unit budget items have increased the overall cost pool allocations,
and thus the total charges, for FY15. The specific impacts on each academic unit will be entered into the
budget development worksheets, so units can see the difference in what each of the costs were for FY13
and FY14 and what they will be for FY15. Additionally, the spreadsheets used to calculate the cost
allocations and the related summary of charges by college, along with the detailed FY15 line-item
increases added to each cost pool, will be discussed at the Framework Overview meetings in January and
February and will be available on the Budget Office web site in the very near future. An e-mail
announcement of that posting will be sent out as soon as those documents are available for viewing. The
general description of the budgets funded within each cost pool is included with these instructions as
Appendix A.
When reviewing changes in the cost pools, it is important to remember what items are included within the
pools. Targeted reductions to support unit budgets, facility cost changes and some transfers of line items
out of the pools to academic units, combined with compensation increases, student aid increases and
targeted investments that flow through the pools, results in a net overall increase of $9.6 million (1.9%)
identified below. In aggregate, the changes in cost pool totals from FY14 are as follows (prior to the
double-step-down redistribution):
Cost Pool FY14 Total* FY15 Total $ Change % Change Support Service Units Systemwide $90,050,997 $89,389,489 ($661,508) -0.7%
Technology Systemwide 33,472,149 33,790,386 318,237 1.0%
Facilities O&M 79,523,728 82,761,051 3,237,323 4.1%
Support Service Units Twin Cities 12,545,778 14,157,261 1,611,483 12.8%
Technology Twin Cities 32,819,619 33,172,281 352,662 1.1%
Student Services (All) Systemwide 12,653,471 12,582,271 (71,200) -0.6%
Student Services (All) Twin Cities 1,776,541 1,767,995 (8,546) -0.5%
Research Support Services 28,701,262 31,189,201 2,487,939 8.7%
Library 42,597,456 42,644,500 47,044 0.1%
Student Serv. Undergrad 18,814,413 19,337,121 522,708 2.8%
Student Serv. Undergrad Aid 37,049,262 39,205,062 2,155,800 5.8%
Student Serv. Grad 15,189,126 15,282,800 93,674 0.6%
General Purpose Classrooms 9,799,461 10,091,985 292,524 3.0%
Utilities (direct-not in above pools) 54,896,378 53,689,410 (1,206,968) -2.2%
Debt (direct-not in above pools) 33,084,903 33,518,810 433,907 1.3%
Leases (direct-not in above pools) 3,642,949 3,611,665 (31,284) -0.9%
Warehouses (direct-not in above pools) 404,672 450,514 45,842 11.3%
Totals $507,022,165 $516,641,802 $9,619,637 1.9%
*The FY14 totals have been adjusted to reflect a “rebasing” of certain support unit allocations
between pools – for units that have base operations funded from different cost pools (Undergraduate
Education, Sr. VP Health Sciences, University Relations, etc.). The FY14 cost pools were set with an
estimated distribution of these split allocations between the different pools, but now that the actual
distributions are known, the pools are “rebased” to correctly reflect the final allocations for each unit
by pool. The total of $507,022,165 did not change for this adjustment – only some of the amounts by
pool within that total changed slightly.
In addition to looking at the change by pool, it is helpful to understand the increase for FY15 by looking
at the various decision categories that resulted in the increase. There are seven categories of spending that

Budget Planning Guidelines for FY15 – Academic Units
20
increased the pools, and as the table below shows, the three largest contributors to the increase for FY15
are investments in academic programming, compensation increases in the support units, and student aid:
Responsible for
X% of the $9.6m Increase
Strategic Academic Investments $4,043,500 42.0%
Compensation Cost Increase 2,717,000 28.2%
Student Aid 2,137,500 22.2%
Strategic Support Investments 1,924,807 20.0%
New Bldgs Operations/Utilities-TC 1,559,168 16.2%
Contractual/Safety/Structural Issues 1,142,000 11.9%
Debt Service/Leases 1,042,835 10.9%
In addition, there are two categories of decisions that decreased the pools:
Unit Base Budget Reductions (4,722,032) -49.1%
Net Transfers-Cost Pool Units to Academic Units (225,141) -2.3%
Total Net Change in Pool Charges $9,619,637 100.0%
The complete list of funded items by cost pool will be posted to the Budget Office web site, but examples
of the investments include: merit-based student aid, Library collections, revenue replacement for the
Office of Technology Commercialization (phase-in), a research infrastructure funding pool, UMarket and
Logistics operations, and so forth.
When the budget for next fiscal year is finalized for Board review, all investments (whether included in
the cost pools or direct funded in the colleges and campuses) will be summarized and explained together.
Please note, the final cost pool charges will be adjusted again before the budget for FY15 is finalized due
to implementation plans for the fringe simplification proposal. Implementation of the new methodology
will result in a redistribution of fringe benefit costs across units – some units will experience higher costs
due to the new methodology and some will experience lower costs. The Budget Office is developing a
plan to address the “winners” and “losers”, a piece of which will involve the transfer of allocation
between units on a “budget neutral” basis. As a result, the cost pool charges will go down as allocations
are taken from support units that will experience fringe cost savings – and that reduction in cost pool
charges will help to partially address the issue for academic units experiencing a fringe cost increase.
Because these changes in the cost pools will be “budget neutral”, you can go ahead and do your budget
planning with the changes described above and reflected in your individual budget development
worksheets. Final cost pool charges for budget entry purposes will be communicated at a later date.
E. Submissions – Compact Information
For the Twin Cities colleges that received a set of compact questions from the Provost in November, at
this time please just submit any supplemental information that you plan to discuss at the budget
oversight/compact meeting.
For the units that did not receive the compact communication from the Provost (listed in Section A on
page 3 of these instructions) please submit responses to the relevant questions in the Compact Instructions
included as an attachment to the email with these budget instructions.

Budget Planning Guidelines for FY15 – Academic Units
21
F. Submissions – Budget Planning
1) Investment Opportunities (no more than 2 pages total):
As mentioned previously, the budget framework for FY15 includes the potential for some investment in
academic unit proposals. Therefore, it is optional for you to submit a request for funding of your highest
priority initiatives. If you choose to submit, please request funding for your highest priority items in
direct support of the activities/programs described in your compact submission. These should be items
representing absolutely critical needs or unique opportunities. Your submission should identify the
items in priority order and should include a full description of what the proposed funding will support,
including projected outcomes, along with a justification for why it is necessary at this time.
Only the highest priority and most compelling proposals will be considered. Please note, requests should
not be related to the general salary increase of 2.5% plus fringe benefit costs or the increase in cost pool
charges described above. Those general parameters are funded within the overall budget framework over
and above any amounts identified for potential investment.
Any requests for information technology investments should align with the University’s ongoing
commitment to Operational Excellence and reducing administrative costs. In that spirit, units are strongly
encouraged to leverage shared, or commodity, services rather than duplicate existing services. Over the
past year, an IT governance process was developed to gather broad input about IT needs at the University
in order to identify the true institutional priorities for IT and strategically focus our technology
investments. While the summarized themes will not be used to exclusively inform technology
investments for the University, any budget requests for critical needs in this area should align with the
following emerging themes:
E-learning*
Constituent Relationship Management (CRM)*
Training and Proactive Support
Data and Reporting Services
Research Computing Services and Support
Wireless Penetration
Aligning Classroom Technology and Associated Support
Video Infrastructure Enhancement
*E-learning and CRM were identified by the Deans as key areas for investment.
The Vice President for Information Technology will review, prioritize and recommend actions on any IT
related requests.
2) Reallocations for FY15:
As mentioned in section D-2 above, for FY15, reallocation targets have been calculated for both the
O&M/State Specials fund groups and the Other Nonsponsored fund groups (excluding ISO funds) as part
of balancing the budget and meeting the President’s goal of reducing “administrative” expenses by $15
million each year (FY14 – FY19). To balance the O&M/State Special funds budget, the total reallocation
target across all support and academic units is $24.9 million. For purposes of budget planning and the
responses requested in these instructions, the proportional allocation of the 1.5% reduction amounts in the
O&M and State Special funds by academic unit is as follows:

Budget Planning Guidelines for FY15 – Academic Units
22
O&M/SS
Reallocation
Unit Target
Academic Hlth Center Shared $488,000
Agricultural Experiment Station 82,000
Athletics 101,000
Auxiliary Services 3,000
Biological Sciences 635,000
Carlson School of Mgmt 1,135,000
Continuing Education 282,000
Dentistry 490,000
Design 380,000
Education & Human Dev. 1,181,000
Equity & Diversity 16,000
Food, Ag., Nat. Resource Sciences 1,197,000
Global Programs/Strategy Alliance 3,000 $4k taken in fall
Graduate School-Academic Allocation 8,000
Humphrey Institute 194,000
Law School 538,000
Liberal Arts 3,259,000
Medical School 1,968,000
MN Extension 396,000
Nursing 250,000
Pharmacy 397,000
Public Health 388,000
Science and Engineering 2,517,000
Sr. VP for Acad Affairs 48,000 $96k taken in fall
Student Affairs-Academic Units 79,100 $46,100 over target per fall submission
UM Crookston 357,000
UM Duluth 2,024,000
UM Morris 514,000
UM Rochester 199,000
Undergraduate Ed-Academic Units 20,000 $25k taken in the fall
University Relations – from Off-the-Top 50,000
Veterinary Medicine 546,000
VP for Research (academic units) 234,000
For the other nonsponsored fund groups, the targets have been calculated using information from the Cost
Definition and Benchmarking analysis which categorized FY13 expenditures into “Mission, Student Aid,
Mission Support and Leadership & Oversight”. It is estimated that of the total expenditures for FY14 in
just the categories of “Mission Support & Facilities and Leadership & Oversight”, the other nonsponsored
funds represent approximately 43%. So for the total target of $15 million in administrative cost
reductions, the proportionate share assigned to the other nonsponsored funds is $6.4 million (43% of $15
million). By unit, that $6.4 million has then been proportioned out for reallocation targets as 1.2% of
total anticipated FY14 spending in those two spending categories as follows:

Budget Planning Guidelines for FY15 – Academic Units
23
A B C
FY13 Spend Estimated FY14
in Mission Spend in
Support & Mission Support Reallocation
Facilities and & Facilities Target for
Leadership & and Leadership FY15
Unit Oversight & Oversight (B * 1.2%)
Academic Hlth Center Shared $9,770,925 $9,966,344 $119,600
Agricultural Experiment Station 506,226 516,351 6,200
Athletics 74,120,620 75,603,032 907,200
Auxiliary Services 73,785,257 75,260,962 903,100
Biological Sciences 2,008,830 2,049,007 24,600
Carlson School of Mgmt 8,641,739 8,814,574 105,800
Continuing Education 2,998,771 3,058,746 36,700
Dentistry 9,598,022 9,789,982 117,500
Design 2,235,683 2,280,396 27,400
Education & Human Dev. 6,161,194 6,284,418 75,400
Food, Ag., Nat. Resource Sciences 19,218,970 19,603,349 235,200
Humphrey Institute 1,707,309 1,741,455 20,900
Law School 3,457,423 3,526,571 42,300
Liberal Arts 8,594,986 8,766,886 105,200
Medical School 58,046,346 59,207,273 710,500
MN Extension 4,739,794 4,834,590 58,000
Nursing 1,776,339 1,811,866 21,700
Pharmacy 4,175,399 4,258,907 51,100
Public Health 6,255,292 6,380,398 76,600
Science and Engineering 19,701,799 20,095,835 241,200
Sr. VP for Acad Affairs (academic) 1,301,346 1,327,373 15,900
Student Affairs (fee funded units)* 46,967,247 47,906,592 574,900
UM Crookston 5,037,011 5,137,752 61,700
UM Duluth 36,066,319 36,787,645 441,500
UM Morris 8,723,321 8,897,788 106,800
UM Rochester 1,937,861 1,976,618 23,700
Undergraduate Ed (academic) 9,493 9,682 100
Veterinary Medicine 7,772,153 7,927,596 95,100
VP for Research (academic) 7,383,804 7,531,480 90,400
(*Special note for Student Affairs – this target is calculated on all the other nonsponsored funds,
including the use of Student Services fee revenue. Since reallocation guidelines have previously been
given to the fee committees, you should subtract the reallocations resulting from that process from the
above target and plan for the balance from your remaining activities.)
Each RRC receiving these instructions should develop and submit proposals to address budget
adjustments in the amounts identified above – separately for the O&M/State Special funds and the Other
Nonsponsored funds. The proposals should briefly outline the actions to be taken to reduce your
recurring budget and the projected impact on the unit activities and service levels.

Budget Planning Guidelines for FY15 – Academic Units
24
In support of the President’s Operational Excellence Initiative, and in accordance with his commitment to
find $15 million in administrative cost savings each year for six years, the reallocations for FY15 should
be focused as much as possible on reductions to administrative operations and costs.
In a recent communication, you received the specific spreadsheets related to your unit for the Cost
Definition and Benchmarking analysis. This should serve as a tool in helping to understand the
expenditures that are categorized as “administrative”. There are six tabs of information breaking down
the data in a variety of views, and if you have ISO activity, which was excluded from the general analysis,
there are two additional tabs with just the ISO breakdowns for your information. You also received
information on the definitions and calculations used to arrive at the final results to help you better
understand the data. As a reminder, the categories of expenditure in the analysis are as follows:
Direct Mission Delivery – the expenses of the ‘doers’ of the mission
Mission Support & Facilities – the expenses to ‘support’ the delivery of mission activities
Leadership & Oversight – the expenses for the ‘leadership, direction, control and
management’ of the mission
The expectation for your reallocation plans is that you will implement reductions, to the extent possible,
that would result in a decrease in the spending categories considered Mission Support & Facilities
and Leadership & Oversight. Please note – maintaining the University’s commitment to student
financial aid remains a top priority. Therefore, all types of financial aid for students (scholarships,
fellowships, block grants) whether for undergraduate, graduate or professional students, must remain
protected. For the cost definitions and benchmarking exercise, student aid expenditures were set aside
and not included in any of the three spending categories.
For O&M and State Special Funds: You should look first to those two areas of spending
when considering what to propose for reallocation. For most academic units there is a mix
of expenditures within all three categories, so if your reallocation proposals impact the
Direct Mission Delivery portion of the budget, you should provide rationale for this decision
and indicate why the decision was made to move beyond Mission Support & Facilities or
Leadership & Oversight. There are many units where it will be impractical to fully avoid
reductions in the Mission Delivery category, or for which a broader strategic reallocation
plan would include reallocations in all three cost categories. Providing the rationales or
broader reallocation plan in your response will be critical in understanding your proposal.
Student aid is not in the reallocation base, not in the spending categories, and should not be cut.
Please keep in mind that the O&M/State Special reductions will contribute to balancing the
overall institutional budget framework, and therefore will support the costs in the framework
related to compensation increases, facilities and any investments, whether they are within your
unit or in another unit. These cost increases that are within your unit, therefore, will not have to
be covered over and above the reduction amounts identified above and addressed in your
proposed strategy.
For Other Nonsponsored Funds: For these funds, the target on the previous page was
developed by applying 1.2% to estimated expenditures in only the Mission Support & Facilities
and Leadership & Oversight categories. Therefore, the reallocation plans for this target should be
focused solely on activities in these categories (no mission or student aid related expenditures
should be impacted). When you propose an expenditure reduction to address this target, the
funds freed up from that action will remain in your unit, but then can be applied to known cost
increases, such as those for compensation or inflation, or new investment. It is understood that

Budget Planning Guidelines for FY15 – Academic Units
25
“new” spending may continue to be in the defined categories of Mission Support & Facilities or
Leadership & Oversight, but it is hoped that this exercise will result in a reprioritization of
functions, moving investment from low priority to higher priority or new activities, and that in
some cases it will reduce the need for increased revenues to pay for cost increases. Reallocation
will keep pressure off the need to increase fees on students in areas where such fees are the source
for operating revenues, or it will help offset declines or sluggish increases in resources such as
ICR or endowment earnings.
Proposals for both sets of targets will be reviewed during the budget oversight meetings. Not all
proposals will be accepted and implemented. Instead, the responses will provide a menu of actions to
discuss during the budget meetings and in the weeks following. Ultimately, any reductions recommended
to the President will be strategic and differential – not straight across-the-board.
3) Reallocations Implemented FY14:
For purposes of responding to the state of Minnesota regarding the performance measure they enacted to
reduce administrative costs at the University in FY14 (“for fiscal year 2014, decrease administrative costs
by $15,000,000”) we need to produce a complete and accurate list of actions taken. Based on the initial
responses received from each unit on plans to implement the FY14 reallocations (roughly .8% of the
O&M/State Special base) we created a preliminary list of administrative reductions that totaled $10
million. Now we need your help in two ways:
a) Please provide a description of what you actually implemented in the way of cost reductions for
FY14 as part of that reallocation exercise related to the FY14 O&M/State Special budget. We
need to make sure the list we have been working with is accurate and that you actually did what
you said you would do. Or we need to know if your original plans and the actual implementation
differ. Please provide a list of the actions taken, with the corresponding dollar cost reductions,
and be as specific in the description as possible so we will be able to determine if the reduction
was from the Mission Support and Facilities or the Leadership & Oversight categories of
spending.
b) Please provide a list of cost reduction actions you are implementing in FY14 in addition to what
was required as part of your reallocation target discussed during budget development (in addition
to (a) above). As mentioned above, we identified $10 million in administrative cuts from your
original responses related to the O&M/State Special budget, but we need to have a list that totals
$15 million. Therefore, regardless of funding source, if you implemented additional cost
reductions in FY14, we would like that full list and description of actions so we can take credit
for all the difficult decisions and strategic choices made to continue or enhance current levels of
service. Again, be as specific as possible so we are able to determine what actions were
reductions to those two administrative categories of spending.
4) Significant Financial Issues:
Sometimes units face financial issues that may not require additional funding from outside of the unit, but
represent a challenge or policy question in working to solve them. If there is some issue in this category
that you wish to bring to the attention of the Budget Office or academic leadership (something you’re
currently facing or anticipating within the next year or so), please describe it in a short paragraph. It may
be discussed during the budget oversight meeting or it may result in a more targeted conversation at a
later date.

Budget Planning Guidelines for FY15 – Academic Units
26
G. Submissions – Detailed Budget Materials
Items 1 – 8 in this section should be submitted to the relevant Budget Officer 5 working days prior
to the scheduled compact/budget meeting.
1. Revenue Estimates – ICR
Submit Figure 2 on page 18 with any relevant supporting documentation.
2. Collegiate/Campus and Durable Goods Fees
A. Collegiate/Campus and Durable Goods Fees Definition: The collegiate/campus and durable goods
fee definitions were updated and approved by the Board of Regents in 2011 to be as follows:
Subd. 3. Academic Fees.
(a) Campus/Collegiate Fees. Campus/collegiate fees are campus- and college wide
fees that may be assessed to all students enrolled on a campus or in a college for
goods and services that directly benefit students but that are not part of actual classroom
instruction. Allowable goods and services include advising, career services, computer
labs, special equipment, orientation activities, and other goods or activities intended to
enhance the student experience outside of actual classroom instruction. Each campus
shall assess no more than one campus-wide fee and each college shall assess no more
than one college-wide fee.
(b) Durable Goods Fees. Durable goods fees may be charged by a campus or a
college to their enrolled students (or any cohort or subset of their enrolled students) for
educational materials and equipment that will be owned by, potentially owned by, or
assigned to a specific student for their use during the entire term. Durable goods fees
may not be charged for services, or for use of any equipment owned and retained by the
University, with the exception of computer or other specialized equipment assigned for
a full term to a specific student.
B. Collegiate/Campus Fees Structure: In order to rationalize the set of collegiate/campus fees charged
to students throughout the University and ensure appropriate application of the above definitions, the
following standards are recommended for implementation. Limited exceptions to these standards may be
approved with a compelling justification (e.g. capital enhancement fee and TCF Stadium fee on the Twin
Cities campus):
1. As mentioned above, each campus may assess only one campus-wide fee and each college (for the
Twin Cities and Duluth) may assess only one college-wide fee.
2. Campuses and colleges may charge these fees only to their own students – defined by unit of
enrollment. Colleges may not charge a collegiate fee to students enrolled in other colleges.
3. Collegiate/Campus fee rates will be the same for each student within a college or campus, regardless of
student level or program of enrollment. So, for example, the fee rate may not differ for undergraduate vs.
graduate students or for students enrolled in one program within a college vs. another program.
4. Collegiate/Campus fees may vary by credit load. Colleges and campuses may choose to apply the
same rate to all students regardless of credit load. However, if they choose to differentiate, the standard
fee structure will be a flat rate with a single threshold of six credits: one flat rate applied to students

Budget Planning Guidelines for FY15 – Academic Units
27
registered for 6 or more credits and half that rate charged for students registered for less than 6 credits.
This single credit threshold applies to undergraduate, graduate and professional level students.
5. Collegiate Campus fees may vary by term. Colleges and campuses may choose to apply the same rate
to all students regardless of term. However, if they choose to differentiate, the standard fee structure will
be a flat rate for summer term vs. fall and spring terms: one flat rate applied to students registered for fall
and spring terms (with potential credit variations as mentioned in “4”) and half that rate charged for
students registered for summer term. If this structure is implemented along with the variation in credit
loads as mentioned in “4”, then the credit threshold for summer would be 3 credits, rather than 6.
6. Separate seating fees and orientation fees at the college or campus level should be eliminated. Costs
related to these items may be justifiably included in the collegiate fees.
C. Durable Goods Fees Definition and Structure: It is recognized that there are situations in which
charging all students for a particular item required for enrollment is beneficial to the student in that it can
be purchased at a lower bulk rate than the student would pay on their own. Therefore, a term fee, separate
from the collegiate/campus fee, may be charged by the college or campus to their enrolled students (or
any cohort or subset of their enrolled students) for educational materials that will be owned, or potentially
owned in the future, by the student (e.g. laptop computers, scientific instruments, reference materials,
etc.). Durable goods fees may be structured to change by program and academic year, depending on the
relevant group of students and the corresponding “goods”. Durable goods fees may NOT be charged for
usage of equipment owned and retained by the University or for services.
D. Approval Process – Collegiate/Campus and Durable Goods Fees: These fees must be entered into
the Fee Request and Approval System (see next section below). In addition, each RRC proposing to
either continue or change an existing fee in this category or to create a new fee in this category must
submit the following information along with their other budget materials (provide separate sets of
information for a collegiate/campus fee and a durable goods fee).
The proposed fee rate and set up structure for FY15
A detailed and specific explanation of what services or activities the fee will support (see
definition)
An estimate of the revenue that will be generated from the fee in FY15
An allocation of that estimated revenue across the itemized list of services or activities supported
through the fee
A description of the internal fee process within the college or campus, indicating who was
involved in setting the proposed fee level and determining the different uses for the fee
These fee proposals will be discussed as part of the compact/budget oversight meetings. Please note – as
the University has committed to hold undergraduate resident tuition at current levels for the next
two years and is trying to limit additional financial burden on students, any proposal to increase
these fees will receive significant scrutiny and will be approved only in exceptional cases. In
addition, proposals to increase existing or add categories of course and miscellaneous fees will
receive the same scrutiny.
3. Course, Miscellaneous and Academic Fee Entry and Approval
Each unit owning college, course and incidental fees charged to a student (most of which – but not all –
are charged to a PeopleSoft student account and appear on billing statements) must review these fees,
propose changes and new fees, and submit them for approval on an annual basis. Budget preparation for

Budget Planning Guidelines for FY15 – Academic Units
28
FY15 is our second year of using the Tuition and Fee Management System (TFMS) to review, submit,
and approve fees. The information submitted will be incorporated into the overall tuition and fee plan
presented to the Board of Regents along with the budget in May.
TFMS will be available for entry of FY15 fee information on February 3, 2014. Fee entry should be
completed by RRCs by March 29, 2014. The system captures student fee information for review and
analysis, helps ensure that units receive the fee revenues approved in the annual budget process, and feeds
information to PeopleSoft to ensure accurate and efficient student account billings. Fees that have been
entered in TFMS previously will be rolled over as FY15 fee requests for update by the unit that owns
them. Information on training and resources for using TFMS will be distributed in the next few weeks,
along with detailed instructions for fee entry.
The information required to create or update a fee request in the TFMS is similar to past years and will
include:
The EFS chart string where the fee revenue is to be recorded
The amount of the fee
The amount of expected revenue
The semesters that the fee should be charged.
Rate structure (example, is this fee a flat fee or a per credit rate? are different amounts charged at
different credit levels?).
For course fees, the course subject and designator (for example ACCT 2050) and the component
to attach the fee to must be identified, and if fees must be broken down to a section level, the
section numbers are necessary
The method of assessment: will it be posted as part of the tuition calculation process, will a
department be posting it directly to the student accounts, or is it collected by some other method
An appropriate justification (this is required)
A brief, but informative, public fee description
Additional information and instructions, including guidelines for appropriate fee justification and rate
development, are discussed in the TFMS materials. All fees charged by academic units, and all fees
charged based on student registration must be submitted for approval (exception: some fees charged
through the Learning Abroad Center and billed through the Education Abroad Module). A word of
caution: changes to FY14 fees entered after the FY14 fees are rolled over to FY15 in TFMS on January
31 will not affect the FY15 version of the fee request.
After fees are submitted, the relevant budget officer in the Office of Budget and Finance will review
them. Fee system users can go online and see the status of a fee at any time. A report listing the fees
approved by the budget officers will be generated for review by the Board of Regents. It is this final list
of fees that will be implemented in PeopleSoft for FY15.
There is no other process for implementation of fees – please make sure the list you submit is complete
and accurate. Fees that are not requested via TFMS and approved by the Regents may not be
implemented until the next budget year.
4. Student Services Fee Waivers
The Office of Student Affairs is again requesting colleges on the Twin Cities campus to apply for waiver
status for all academic programs that wish to allow such waivers in FY15. If a waiver is granted, none of
the students enrolled in the program in question will be charged student service fees. Though this is a

Budget Planning Guidelines for FY15 – Academic Units
29
financial benefit for students, it will make these students ineligible for access to student fee supported
benefits or services such as the recreation centers, Boynton Health Service, and other student fee
supported campus services. Students in these programs have the option of paying the student service fee,
or they may purchase the Boynton Health Service extended coverage but are not eligible to enroll in the
Student Health Benefit Plan provided by the University (i.e., they are not eligible to purchase student
hospitalization insurance). Please take this into consideration as you apply for program waiver status.
Academic programs on the Crookston, Duluth and Morris campuses should consult their student affairs
offices for policies specific to their campuses.
Programs must have a unique degree and major code, or have some other way in the registration system
in which students as a group can be uniquely identified as belonging to the program for which the waiver
would be applied. The entire program must qualify for the exemption – specific sections, terms, and
locations cannot be made exempt. Remember that all students registering for less than 6 credits during an
academic term are automatically exempt from paying the student service fee, and off-campus courses do -
not count towards this 6 credit limit for purposes of receiving an exemption. Also under current policy,
non-degree seeking students and post-secondary enrollment option students are exempt from student
service fees, and therefore need not be included in your proposals.
Per the work group recommendations, approved waiver exemptions will be reviewed every three years.
Programs currently receiving program waivers that do not have to reapply this year are listed at the end of
this section. Please contact Jill Merriam at 625-2515 or [email protected] with any questions you may
have.
Criteria for granting student service fee waivers to programs:
The program must be designed specifically for full-time working professionals AND one of the following
must also be true:
The program is designed and delivered as a weekend-only and/or evening-only program;
The program is delivered in its entirety via distance education; or
The program is delivered in its entirety at an off-campus location.
Each college that has a program or programs that wish to apply for a program waiver should provide the
following information as part of this budget submission:
College
Name of program
Degree(s) offered
Approximate number of students per term
Approximate number of percentage of students taking six or more credits per term
Brief description of program and rationale for program waiver
Programs currently approved for fee waivers
Education and Human Development
Office of Professional Development and Outreach
Educational Admin Ed.D cohorts
Leadership Academy
Carlson School of Management
Evening MBA

Budget Planning Guidelines for FY15 – Academic Units
30
Evening Masters of Arts in Human Resources and Industrial Relations
Evening MHA
Executive MBA
Continuing Education - Masters of Liberal Studies
Science & Engineering
MS Management of Technology
MS Manufacturing Systems Engineering
MS Software Engineering
MS Infrastructure Systems Engineering
UNITE
Human Ecology - Masters of Social Work – Rochester and Moorhead programs
COAFES - Cooperative program with SWSU
Medical School - Rural Physicians Associates Program
5. Transfers Between Units
If there should be a permanent transfer of base allocation between RRCs for FY15, please submit that
information. Please include the dollar amount to be transferred and the reason for the transfer. It would
be most helpful if both RRCs involved in the transfer send in the same information as part of their
individual submissions. If this coordination is not done in advance, subsequent contacts will be made to
ensure agreement on the adjustments.
6. Budget Development Worksheet
Budget development worksheets are available in PeopleSoft (PS) for entry of financial information. The
budget review process will include an analysis of each unit’s overall financial structure and health, and
these worksheets are one tool used in that analysis. RRC managers have the option of completing the
worksheet just at the RRC level, or asking their budget departments to complete the worksheet at the
lower structural level, which then rolls up to the RRC level. The budget departments for worksheet
purposes can be located in two places: on the RRC Status and Approval tab of the Budget Development
Worksheet in PS (at the RRC level) or in PS on the Budget Tree. Follow this path in the Reporting
Instance (not production) to find the relevant breakdown by RRC on the Budget Tree:
Tree Manager > Tree View > choose tree UM_DEPTID_BUDGET effective dated 7/1/2013.
It is easiest to view this tree in the “Print Format” Option.
Only one worksheet per RRC will be accepted by the Budget Office, so this optional functionality to enter
at the lower level is provided just for those RRCs that would like their budgeting departments to submit a
more specific level of financial planning information to them. The Budget Office will not review the
worksheets from that lower structural level unless it is necessary for more in-depth analysis.
The worksheets operate the same way they have in the past, but for RRC managers new to the process,
there is an on-line course available for Budget Development Worksheets at the training website:
(http://www1.umn.edu/ohr/training/index.html ). Continue to Financial Management Training, which is
listed in the connections at the left of the page, and proceed to course registration under the link to Enroll

Budget Planning Guidelines for FY15 – Academic Units
31
in Courses. Additional resources include two job aids available under Review Course Materials: Budget
Development Worksheet – Dept. User Job Aid, and Budget Development Worksheet – RRC Manager Job
Aid.
The correct path to access the worksheets within PeopleSoft is: UM Budgeting > UM Budget
Development Worksheet > UM RRC Manager OR UM Department Users > UM Budget Dev Worksheet.
The worksheets hold the following information for FY12 Actuals, FY13 Actuals, the FY14 Approved
Budget and FY14 Year to Date Actuals (the format of the worksheets is the same for all units):
- Actual revenues and expenditures by summary categories – all non-sponsored funds (information
on the specific account codes under each category can be found in the reporting instance > Tree
Manager > Tree View. Choose the tree UM_ACCOUNT_REPTG and pick the effective date
7/1/2013. Use the “Print Format” option to view all.)
- Net transfers in/out from other units – all funds combined
- Actual central allocation
- (Decrease)/Increase in net assets overall – defined as Revenues less Expenditures plus Net
Transfers plus Central Allocation
- Net assets at the beginning of the year (Prior Year Carryforward) and net assets at the end of the
year (Ending Balance) – all non-sponsored funds combined – and that figure represented as a
percent of total expenditures
- Total sponsored expenditures
As in past years, there is also a column for projections through the end of FY14 (“Forecast”) to arrive at
an updated estimate of carryforward into FY15 if that is warranted.
The final column (Budget 2015) is for projecting FY15 activity. The budget submittal should focus on
completing the Forecast 2014 column and then completing the Budget 2015 column based on the
planning parameters described in this document. For both columns, please fill in each row using the best
information available at this time. FY15 projections should only focus on current operations and
plans carried forward and should not reflect new initiatives – this should reflect the ongoing costs of
current operations only. Also, please note that projected increases entered in the various expenditure
categories of the Budget 2015 column do not guarantee approval of that expenditure level or increased
allocations. The purpose of this part of the exercise is to best represent the costs of ongoing operations.
Decisions made on whether that level of activity is appropriate or desired will be made through the budget
development process.
If a transfer of base allocation is submitted under section F-1 above, the budget development worksheet
should be completed assuming the transfer of activity is incorporated. In other words, if the allocation
and corresponding expenditures associated with some activity is being transferred between RRCs for
FY15, then the expense projections in the Budget 2015 column of the budget development worksheet
should also reflect that transfer. In addition, planned reorganizations that result in DeptIDs moving from
one RRC to another, (or from one budget department to another should be reflected in the planning for
FY15: revenues and expenditures for DeptIDs that are being reassigned should be included in the RRC to
which they will be assigned in FY15.
Please note To ensure that the ending balance and the carryforward information at the bottom of each
“actuals” column reconciles correctly to the balances in PeopleSoft and on UM Reports, a number of
rows at the bottom of the worksheet reflect balance sheet transactions. For entry purposes, however, you
are not asked to budget for or forecast those balance sheet transactions. You can complete the Forecast
2014 and Budget 2015 columns for all the other rows, and the sheet will work as it is intended to work.

Budget Planning Guidelines for FY15 – Academic Units
32
Since you do not plan for the activity in the added rows, the ending balance will calculate correctly in the
Forecast 2014 and Budget 2015 columns without entering in those rows.
If there is information missing in these instructions necessary to complete the Budget 2015 column,
please contact your budget officer for assistance. Please note – the central allocation line for FY15
should contain the exact same amount as appears in the Budget 2014 column with one exception – it
can be adjusted for planned permanent transfers between units (see section F-1 above).
The completed Budget Development Worksheet does not have to be sent in with the rest of the budget
materials. When it is submitted in the system, it will be considered complete. The Budget Office will
review, download and format these sheets for distribution to the oversight meeting participants.
7. O&M/State Special Compensation
As part of the University’s overall budget development framework, comparing available resources with
projected cost increases, an annual calculation of the projected increase in compensation costs is included
for the O&M and State Special fund groups. That calculation is done centrally and provides useful
information in trying to estimate the cost of compensation for each unit. To verify that the central
methodology yields reliable results, please provide an answer to the following question:
“What is your calculated increased cost for salary and fringe for FY15 in O&M and State Special funds
only?” (often a net increase – salary increase combined with fringe decrease)
The answer to this question will be a portion of the increase reflected on your budget development
worksheet in the lines for salary and fringe expenditures (representing the estimate for O&M and State
Special funds only, rather than all nonsponsored funds combined). If you have questions on this, please
contact your budget officer.
8. Internal Sales Rate Setting
Units conducting internal sales activity must submit their rate proposals through the budget process. This
section is intended to provide instruction for internal sales submittals from the RRCs listed on pages 3 and
4, so any unit without internal sales activity can disregard this section.
University policy ensures that goods and services sold to other University departments are being sold at
rates that comply with Federal A-21 regulations and federal Cost Accounting Standards (CAS); and that
they are sold at rates that fully cover, but do not exceed costs. If goods and services sold to other
University departments do not fully cover costs, all subsidies must be documented in the rate
development. The intent of the policy is to accumulate all allowable and allocable costs within an
identified, segregated set of accounts; to recognize subsidies of the operation, to provide a feasible means
of operating a business within federal guidelines, and to establish rates based on total costs.
Submittal of Internal Sales Information – Two Separate Procedures:
A) Internal Sales Office – All units conducting Internal Sales in FY15 must submit rate development
information for the forthcoming year and an annual review of internal sales activity for the prior fiscal
year to the Internal Sales Office. Information submitted is used to review internal sales rates for
compliance with federal accounting standards. Rate information for the forthcoming fiscal year must be
submitted to the Internal Sales Office regardless of expected annual revenue amounts. If the department
will discontinue the activity, submit the “Certification of Annual Review” stating the terms and conditions
of closing out the activity. Refer to procedure “Reviewing Internal Sales Activity Annually” in the

Budget Planning Guidelines for FY15 – Academic Units
33
“Selling Goods and Services to University Departments” policy for the documentation due to the Internal
Sales Office by September 30 of each year.
B) Budget Office - Rate information for the forthcoming fiscal year must be submitted to the Budget
Office according to the instructions below. Submittal of rate information through the budget process does
not eliminate the need for units to work with the Internal Sales Office in reviewing internal sales rates for
compliance with federal accounting standards. The submittal of information to the Budget Office is
intended to arrive at a decision on the appropriate level of individual rates, incorporating the correct
planning parameters, and does not involve reviewing the rates relative to federal accounting standards.
Instructions for units conducting internal sales that meet or exceed $300,000 in annual revenues: All rates
for internal sales activity in this category should be developed using the procedures defined in University
of Minnesota financial policy 3.2.1, Selling Goods & Services to University Departments. For FY15
budget development, units conducting internal sales at this level should submit a summary of their major
rates for FY13, FY14 and proposed for FY15, including a comparison of the rates, and the percentage
increases or decreases each year. “Major rates” are those associated with the product lines that generate
the majority (75-80%) of annual internal sales revenues. If the data does not provide for accurate or
meaningful comparisons between the years, then include only the years for which the data are
comparable.
Instructions for units with less than $300,000 in annual internal sales revenues: All rates for internal sales
activity in this category should be developed using the procedures defined in University of Minnesota
financial policy 3.2.1, Selling Goods & Services to University Departments. For purposes of FY15
budget development, units conducting internal sales at this level should submit rate information only for
rates which are new for FY15 or for anticipated increases in a current rate that exceeds a 2.5%
inflationary rate. In the submission, include:
Rate for FY14
Proposed rate for FY15
Product line involved
Description of any new product line or businesses involved
Process for setting the rate
Cost components included in the rate
Review and approval process for the rate
Total annual revenue projected for FY15 and growth over FY14 if applicable
H. Process
1. Meetings and Due Dates
The compact/budget meetings are scheduled throughout February and March. The meetings will focus on
reviewing any significant issues surfacing from the materials submitted in response to these instructions
(budget and compact where applicable). No supplemental presentation materials are necessary.
Submittal Due Date – 5 working days prior to the scheduled meeting, please send all required
materials in Sections E,F and G to Jessie Strader in the Budget Office ([email protected]) and to
the relevant budget officer listed in Section B.

Budget Planning Guidelines for FY15 – Academic Units
34
2. Budget Recommendations
At the conclusion of the meetings, Sr. Vice President for Academic Affairs and Provost Karen Hanson,
Vice President Brooks Jackson, Vice President Brian Herman, Vice President Richard Pfutzenreuter and
Budget Director Julie Tonneson will make recommendations to the President on the approval of specific
initiative requests and the level of O&M/State Special allocation for each unit. These recommendations
will take into consideration the proposals and funding levels necessary to make the unit successful and the
necessity of presenting a balanced budget to the Board of Regents. The budget for the University must be
balanced by late April to meet presentation deadlines for the May Board of Regents meetings.
As mentioned previously in these instructions, communication on investment decisions going forward
will be done in an all-funds context. Each unit will receive a response to the items submitted for
consideration in the budget.
3. Balancing the Overall University Budget
Approximately half of the budget process has been completed with the distribution of these instructions.
Support unit budget instructions were distributed in September;
Budget/compact meetings were held with each of the support units in October and November;
Forecasting items (salary and fringe, revenue estimates etc.) have been updated to support the
overall context for making decisions within the University’s budget framework;
Preliminary support unit budgets for FY15 have been recommended to the President and he has
given approval to proceed based on those recommendations;
Cost allocations have been calculated for FY15 based on the approval of support unit budgets.
The remaining components of budget development for FY15 will include:
Budget/compact meetings with each of the academic units in February and March;
Development of academic budget recommendations to the President based on the available
information regarding resources, all-funds analyses and investment plans of each unit – to be
completed in April;
Adjustment of support unit budgets, cost allocations and planned academic unit budgets near the
end of the process only when a significant unforeseen impact to the budget occurs – otherwise,
hold to approved budgets and cost allocations and deal with moderate to low impact variances
through the use of central reserves or through adjustments to budgets and rates the following
year;
Delivery of the President’s recommended operating budget for FY15 to the Board of Regents for
review and approval in May and June.

Budget Planning Guidelines for FY15 – Academic Units
35
APPENDIX A
Cost Pool Descriptions
There are nine primary cost pools in the budget model. A brief description of each cost pool and the basis
for allocating the corresponding costs is described below. In addition, the detailed FY15 model that
calculates the distribution of costs for each pool (the “double step-down” model) contains the specific
unit-level statistics on which each cost pool is allocated and will soon be posted to the Budget Office web
site for reference.
1. Support Service Units
This cost pool includes the budgets for those units with general support responsibilities. Most of them
have institution-wide oversight, policy or programmatic responsibilities, but several areas clearly provide
services only to the Twin Cities campus, so this cost pool incorporates a two-tiered methodology –
spreading the “systemwide” budgets across all campuses and the “twin cities” budgets only to units on the
Twin Cities campus. On the “double step-down” model, the statistics and cost allocations for this pool
are split into two separate columns – one for System-wide and one for Twin Cities only. The units
included within this pool are:
System-wide Twin Cities Only
Audits Campus Mail
Bldg Systems Automation Ctr University of MN Alumni Assoc.
Board of Regents University of MN Police
Budget and Finance University Services (Finance, HR, IT)
Capital Planning & Project Mgmt.
Controller
Equity and Diversity
General Counsel
Global Programs & Strategy Alliance
Human Resources
President’s Office
Public Safety (excluding Police)
Sr. VP – Academic Affairs & Provost (excluding academic areas)
Sr. VP – Health Sciences (excluding academic areas)
University Relations
VP for University Services
This cost pool is allocated to the academic units based on their proportionate share of total expenditures
(all funds) of the most recently closed fiscal year. The combined total of the FY15 approved budgets for
the units listed above will be allocated based on the academic units’ proportionate share of FY13 total
expenditures (all funds). Total expenditures was chosen as the base simply to represent the most
reasonable way to spread a shared cost across all units. There is no recognized link between the amount
of spending in a unit and that unit’s “use” of the services of a particular office within this pool.
2) Technology
This cost pool includes the portion of the Office of Information Technology’s (OIT) budget that are not
operated as an Internal Sales Organization (ISO) and a small portion of the technology functions of the
Office of the Senior Vice President for Health Sciences. The portions of OIT’s budget that have been
managed as an ISO will continue to operate that way. The cost allocation charge implemented through

Budget Planning Guidelines for FY15 – Academic Units
36
the budget model will fund such things as the Data Network, Email, Voice Services, File Storage,
PeopleSoft, E-Research, Helpdesk, Digital Media Center, Security and so forth.
As with the Support Service Unit Pool, much of the budget within this cost pool supports institution-wide
oversight, policy or programmatic activities, but some areas within OIT primarily provide services only to
the Twin Cities campus, so this cost pool also incorporates a two-tiered methodology – spreading some of
the budget across all campuses and some only to units on the Twin Cities campus. For example, the data
network is primarily a twin cities campus activity, while the Peoplesoft systems and security policy and
procedures are system-wide activities. For FY15, 51% of OIT’s approved O&M budget has been
allocated on a system-wide basis and the remaining 49% has been allocated only to the Twin Cities
campus. A small portion of the Sr. VP for Health Sciences budget related to technology is included in the
TC tier of this pool. Again, on the “double step-down” model, the statistics and cost allocations for this
pool are split into two separate columns – one for System-wide and one for Twin Cities only.
This cost pool is allocated to the academic units based on a proportionate share of total employee and
student headcount from the fall of the prior year. The FY15 approved centrally allocated budget for these
technology functions is spread based on the academic units’ proportionate share of total headcount from
the fall of 2013. Total headcount was chosen as the basis for this cost allocation because it was believed
to be the best proxy for “use” of technology service across the institution. Whether any particular
employee or student actually uses their x.500 account is not measured. Instead, the provision of the
opportunity for use and the recognition that all students’ and employees’ records are maintained within
the computer systems and networks of the University were the basis for the decision. It is a relatively
stable, predictable and simple basis on which to allocate costs. The detailed query results that led to the
headcount statistics for this pool on the “double step-down” model will be available for reference on the
Budget Office web site. The student headcount has been adjusted so that part time students are weighted
at .5.
3) Facilities Operations & Maintenance
This cost pool includes services within Facilities Management (FM) on the Twin Cities campus only.
Facility operations and maintenance costs will continue to be managed outside of this cost allocation pool
by each campus (or research and outreach station). Services provided within the FM O&M cost pool include:
Custodial Services
Maintenance (preventive and repair maintenance to facilities and major equipment)
Landcare
Waste management
R&R (Repair and Replacement, extraordinary maintenance and replacement of building
components like roofs, windows, elevators, etc.)
Water, Sewer and Storm-water utility costs
Facilities Management administration
Beginning in FY12, this pool was adjusted to remove the costs of chilled water. It is now possible to
reliably measure actual consumption of the chilled water utility by building, so that utility has been
added to the direct charged “utilities” cost pool and removed from this pool.
The costs within this cost pool are based upon an agreed upon set of service levels for the Twin Cities
campus. These service levels and the associated costs have been (and will continue to be on an annual
basis) reviewed and approved through the budget process. Details of these service levels are available to

Budget Planning Guidelines for FY15 – Academic Units
37
download from the FM website (http://www.uservices.umn.edu/fm.html). In addition, a customer
advisory group has been formed to meet monthly to work on facility related service delivery and service
needs. Additional services beyond those funded within this cost pool are available by FM at their
identified rates.
This cost pool is allocated to the academic units based on a proportionate share of total assignable square
feet (ASF) from the fall of the prior year. The FY15 approved budget for these activities within Facilities
Management will be allocated based on the academic units’ proportionate share of ASF from November
2013. Each unit was given an opportunity to review the space data assigned to it and make necessary
changes prior to “locking” the data base for use in the budget model. That same process will take place
each year. A more complete explanation of the rules used in the assignment of space is included in these
instructions as Appendix B.
This pool excludes buildings operated to support auxiliary functions that are required to pay their actual
costs, such as athletic venues, residential life student housing, parking ramps, student unions and
Boynton. In addition, O&M costs (and the associated ASF) for “warehouse” type space is assigned costs
from a separate direct consumption-based cost pool (since these facilities are much cheaper to operate and
receive a lower level of services, ex. no custodial services). Warehouse space includes facilities such as
gyms, field houses, and barns.
Lastly, the space (and costs) leased to non-university tenants are excluded as well. Non-university tenant
space is funded through lease revenue which off-sets these costs.
The space statistics for each academic unit are included on the “double step-down model” that will be
available for reference on the Budget Office web site.
4) Student Services
Beginning in FY13, this cost pool is divided into four categories (previously it was three), containing the
budgets of various central administrative units dealing with student services.
a. Category 1 – Services to All Students (regardless of type or level). This category includes
the budgets for Student Finance Administration (primarily PeopleSoft system administration)
and the Registrar. Due to the nature of some of these activities, this cost pool also
incorporates a two-tiered methodology – spreading some of the budgets across all campuses
and some only to units on the Twin Cities campus. Approximately 85-90% of the budgets
for these two units (excluding classroom activities) is distributed system-wide, and the
remaining 10-15% is distributed just to the Twin cities units. On the “double step-down”
model, the statistics and cost allocations for this pool are split into two separate columns –
one for System-wide and one for Twin Cities only.
The basis for distribution of this cost pool is total student headcount from a point in time
during fall semester of the previous year. The FY15 approved budgets for these two units is
allocated based on the academic units’ proportionate share of the total student headcount
from the fall of 2013. The detailed query results that led to the headcount statistics for this
pool on the “double step-down” model will be available for reference on the Budget Office
web site. The student headcount has been adjusted to weight part-time students at .5.
b. Category 2 – Services to Twin Cities Undergraduate Students. This category includes the
budgets for:
Admissions Office and Scholarships

Budget Planning Guidelines for FY15 – Academic Units
38
Orientation & First Year Programs
Health Career Center
Student Affairs (excluding activities funded through student fees)
Office of the Vice Provost for Undergraduate Education
(Undergraduate Financial Aid has been moved to a new Category 3 – below)
The combined budgets for these activities are distributed only to units on the Twin Cities
campus. The basis for distribution of this cost pool is total undergraduate student headcount
from a point in time during fall semester of the previous year. The FY15 approved budgets
for these units and activities is allocated based on the academic units’ proportionate share of
the total undergraduate student headcount from the fall of 2013. The detailed query results
that led to the headcount statistics for this pool on the “double step-down” model will be
available for reference on the Budget Office web site. The student headcount has been
adjusted to weight part-time students at .5.
c. Category 3 – Undergraduate Financial Aid. This category was new beginning FY12. It
contains the undergraduate financial aid programs managed by the Vice Provost for
Undergraduate Education: The Promise for Tomorrow Scholarship Program, the Presidential
Scholarship Match Program and the Admissions Scholarships.
The majority of combined budgets for these programs are distributed only to students
enrolled in units on the Twin Cities campus. The basis for distribution of this cost pool is
total full-time undergraduate student headcount from a point in time during fall semester of
the previous year. The FY15 approved budget for these activities is allocated based on the
academic units’ proportionate share of total full-time undergraduate student headcount from
the fall of 2013. Part-time students are not eligible for the aid programs included in this cost
pool. The detailed query results that led to the headcount statistics for this pool on the
“double step-down” model will be available for reference on the Budget Office web site.
d. Category 4 – Services to Students Enrolled in the Graduate School. This category includes
the budget for the Graduate School and a graduate student funding pool within the budget of
the Vice President for Reseach.
For the initial FY15 calculations, the basis for distribution of this cost pool is total headcount
of students with the academic career of “graduate” but excluding those within that career with
the academic program of xxDMS (departmental masters) – again from a point in time during
fall semester of the previous year. Graduate School Faculty headcount was eliminated
beginning FY12. The FY15 approved budgets for the Graduate School and the graduate
student funding pool within RSRCH are allocated based on the academic units’ proportionate
share of the total headcount from the fall of 2013. Again, the detailed query results that led to
the headcount statistics for this pool on the “double step-down” model will be available for
reference on the Budget Office web site. The student headcount has been adjusted to weight
part-time students at .5. Further analysis is being done related to the restructuring of the
Graduate School and further changes in the statistics for this pool may be implemented for
FY15. If that occurs, the adjustments will be implemented budget neutral.
5) Research Support Services
This cost pool includes the budgets for central units that administer, support and monitor sponsored
research activity. Structurally, these budgets exist within the office of the Vice President for Research

Budget Planning Guidelines for FY15 – Academic Units
39
(excluding the academic centers), Sponsored Financial Reporting in the Controller’s Organization,
University Health and Safety, and the AHC Office of Research.
This cost pool is allocated to academic units based on their proportionate share of the average of the last
three years of total sponsored expenditures. The three-year rolling average is used in this formula to
recognize the relative variability in this revenue source for some units, which will serve to lessen large
swings in the costs distributed by unit. The total of the FY15 approved budgets for the units identified
above will be allocated based on the academic units’ proportionate share of the average of FY11, FY12
and FY13 total sponsored expenditures.
6) Library
This cost pool includes only the approved centrally allocated budget for the University Libraries.
Because this budget supports Twin Cities’ activities almost exclusively, this cost pool is allocated only to
units on the Twin Cities and Rochester campuses. The basis for distribution is a weighted faculty and
student headcount from the previous fall. The weighting factors are as follows:
Lower division undergraduate students .5
Upper division undergraduate students .75
Professional and graduate students 1.0
Faculty (broadly defined) 1.0
The FY15 approved budget for the University Libraries is allocated to the academic units based on the
weighted headcount from the fall of 2013. The detailed query results that led to the headcount statistics
for this pool on the “double step-down” model will be available for reference on the Budget Office web
site. The student headcount has been adjusted to weight part-time students at .5.
7) Utilities
This cost pool represents the actual costs for the following utilities: steam, electricity, gas, and chilled
water. A more complete description of this cost pool is included within the instructions, Section D-6 on
page 13. Some units will continue to need the utility rates to plan for their budgets, so that information
was included in the instructions as planning parameters.
The actual costs will be allocated to the academic units on the Twin Cities campus based on their actual
consumption of the utilities involved. The cost is calculated at a building level and then distributed
within the building based on each unit’s share of total assignable square feet for that building.
8) Debt & Leases
This pool includes the costs of centrally supported debt service and leases on behalf of units on all
campuses. Costs are allocated based on the actual occupancy of space for which the University pays debt
service or lease costs (again distributed within a shared building based on each unit’s share of total
assignable square feet for that building).
9) General Purpose Classrooms
This cost pool includes the budgets for central units that support, monitor and manage general purpose
classroom space on the Twin Cities campus. The units involved are the Classroom Management Offices

Budget Planning Guidelines for FY15 – Academic Units
40
within the Sr. Vice President for Academic Affairs & Provost Office and the Sr. Vice President for Health
Sciences Office.
This cost pool is allocated to the academic units based on their proportionate share of total course
registrations in the fall of the prior year. The approved budget for these activities for FY15 is allocated
based on total course registrations from the fall of 201. The detailed query results that led to the course
registration statistics for this pool on the “double step-down” model will be available for reference on the
Budget Office web site.
Budget Planning Guidelines for FY15 – Academic Units
41
APPENDIX B
Treatment of Space in the Budget Model
Space Information as it relates to Cost Pools;
There are four cost pools in the new budget model which rely upon how much space is assigned to RRCs:
Property & Liability Insurance (not a new cost pool)
Twin Cities Campus Utilities
Twin Cities Campus Facilities O&M costs
Twin Cities Debt allocation
[Note: For coordinate campuses and research/outreach stations, the cost allocation processes for the Twin
Cities (utilities, O&M, and debt) will be allocated based on the campus/site and will not utilize individual
space allocations within a building.]
Separately in these instructions, (in the Property & Liability and Non-Profit Organization Liability
Insurance section on page 12) the cost allocation for each of these cost pools is described. This section is
intended to explain how the baseline space information is generated, managed and will be used to support
cost allocation.
In a memo sent on October 5, 2006 to RRC managers from the Budget Office and the Office of Space
Management, each RRC was asked to verify the CUFS area to which each room on the Twin Cities
campus is assigned. This memo summarized how and where the University maintains the allocation of
space:
“The SPACE database, which tracks assignment, function and use of every room in every
building at the University of Minnesota, is now being used as the basis for determining the
quantity of assignable square footage (ASF) assigned to each Area Group (RRC) for calculation
of the costs which will be allocated by ASF in the new budget model. Assignment information is
normally updated by the Office of Space Management on a one to three year basis for strategic
planning purposes, indirect cost recovery, and allocation of insurance and utilities costs.”
With this notice RRCs were given the opportunity to update the information within the SPACE database.
Each fall, the Budget Office in collaboration with the Office of Space Management sends a listing of
rooms assigned to each RRC by building. RRC Managers should review this information and send back
corrections if needed. After the SPACE system is updated, a snap-shot is taken and that information is
used to calculate the building cost allocation for the following fiscal year. Changes to space allocation
after that point and throughout the fiscal year will not be utilized to change any cost allocation throughout
the year, but will be part of calculating the allocation of costs for the next fiscal year.
Any change in the allocation of space needs to be reviewed and approved by the Office of Space
Management. Though changes in the assignment of space may be approved or dis-approved for a number
of reasons, some general criteria and practices include:
Space assignments within a DeptID require approval by the Director
Space assignments within a DeptID require approval by the RRC (Dean/AVP/etc.)
Space assignments within a VP unit require approval by a VP
Budget Planning Guidelines for FY15 – Academic Units
42
Space changes between units require the approval of both sides of the change or the
administrative leader for both of them (ex. a Dean can approve changes between departments)
and the Office of Space Management.
Space may be considered for a ‘return’ to the University as unassigned or changed to inactive
(and not charged to an RRC) if:
o The change helps achieve a strategic goal
o The space is contiguous, accessible from a public corridor, and of sufficient size to be
assigned to another program
All cost will be allocated according to Assignable Square feet, defined as:
Assignable square feet (or “ASF”) is the sum of all areas on all floors of a building assigned to, or
available for assignment to, an occupant. It is measured and tracked at the room level. Note that
it does not include space used for the general operations of the building as described under non-
assignable space below.
This means that all the costs relating to non-assigned space is excluded from the cost allocation process
and are shared equally by each ASF within a building. Non-Assignable space is defined as:
The sum of all areas on all floors of a building not available for assignment to an occupant or for
specific use, but necessary for the general operation of a building. This includes areas like public
restrooms, corridors, stairwells, elevator lobbies and shafts, custodial closets, loading platforms,
and mechanical rooms.
Finally, there is Unassigned Space, i.e. space which could be assigned to someone but is not due to it
being decommissioned, unfinished, inactive or under renovation. Space that is unassigned is handled
based on the following rules.
- Decommissioned or unfinished space is excluded from the total assignable square footage.
- Inactive space is assigned to the Facilities Cost Pool and allocated accordingly.
- Space that is being remodeled is assigned to the future tenant.
Any questions regarding the space data base should be directed to the Office of Space Management at 6-
7996.
Office of Space Management
400 Donhowe Building (3121)
319 – 15th Avenue South East
Minneapolis, MN 55455

Budget Planning Guidelines for FY15 – Academic Units
43
Attachment 1
Indirect Cost Recovery a B c d e f g h i j
Unit estimates for FY15 FY14 FY13 FY13 FY13 FY14 FY14 FY14 FY14 FY14 FY15
Total ICR Total ICR Total ICR PER 06 Estimated Estimated Most Budget Projected Estimated
Through Through Through Percent Total Revenue Total Revenue Conservative ICR Variance Total Revenue
Period 06 Period 06 Period 12 of Total a*(1/d) a*2 Estimate Revenue to Budget g * 1.0
Coordinate Campuses
1 Crookston 15,976 70,361 121,276 58.02% 27,537 31,952 27,537 140,716 (113,179) 27,537 1
2 Duluth 1,665,673 1,451,772 2,635,052 55.09% 3,023,295 3,331,346 3,023,295 2,602,832 420,463 3,023,295 2
3 Morris 78,686 87,971 149,633 58.79% 133,840 157,372 133,840 138,638 (4,798) 133,840 3
4 Rochester 4,198 17,497 18,114 96.59% 4,346 8,396 4,346 163 4,183 4,346 4
Academic Health Center
5 Academic Health Center-Shared 5,793,630 7,006,286 13,914,894 50.35% 11,506,488 11,587,260 11,506,488 12,881,334 (1,374,846) 11,506,488 5
6 School of Dentistry 936,430 877,469 1,786,709 49.11% 1,906,766 1,872,860 1,872,860 1,900,000 (27,140) 1,872,860 6
7 Medical School 22,788,941 23,679,035 47,283,445 50.08% 45,506,062 45,577,882 45,506,062 43,693,694 1,812,368 45,506,062 7
8 School of Nursing 377,164 409,739 829,053 49.42% 763,142 754,328 754,328 797,607 (43,279) 754,328 8
9 College of Pharmacy 2,090,995 1,666,340 3,534,721 47.14% 4,435,520 4,181,990 4,181,990 3,332,632 849,358 4,181,990 9
10 School of Public Health 6,777,095 7,218,200 14,988,864 48.16% 14,072,893 13,554,190 13,554,190 11,966,874 1,587,316 13,554,190 10
11 College of Veterinary Medicine 1,445,707 1,631,280 3,121,665 52.26% 2,766,547 2,891,414 2,766,547 2,803,804 (37,257) 2,766,547 11
12 Total Academic Health Center 40,209,962 42,488,349 85,459,351 80,957,418 80,419,924 80,142,465 77,375,945 2,766,520 80,142,465 12
Executive VP and Provost
13 Executive VP and Provost 4,648 38,407 89,510 42.91% 10,832 9,296 9,296 5,450 3,846 9,296 13
14 College of Biological Sciences 2,850,585 2,927,320 5,911,091 49.52% 5,756,141 5,701,170 5,701,170 5,485,751 215,419 5,701,170 14
15 College of Liberal Arts 1,447,966 1,693,259 3,117,294 54.32% 2,665,709 2,895,932 2,665,709 2,900,000 (234,291) 2,665,709 15
16 Science & Engineering 16,838,220 15,963,377 29,599,021 53.93% 31,221,140 33,676,440 31,221,140 29,672,047 1,549,093 31,221,140 16
17 Agricultural Experiment Stations 0 0 0 0 0 0 0 0 0 17
18 Design, College of 121,495 49,068 206,588 23.75% 511,523 242,990 242,990 150,196 92,794 242,990 18
19 Education and Human Development 2,875,186 2,787,738 6,048,106 46.09% 6,237,828 5,750,372 5,750,372 5,359,253 391,119 5,750,372 19
20 Agriculture, Food and Environ. Sciences 3,932,505 3,999,562 7,865,964 50.85% 7,734,083 7,865,010 7,734,083 7,323,987 410,096 7,734,083 20
21 Carlson School of Management 73,160 87,859 144,510 60.80% 120,333 146,320 120,333 148,499 (28,166) 120,333 21
22 Humphrey School of Public Affairs 305,085 271,200 511,100 53.06% 574,959 610,170 574,959 350,000 224,959 574,959 22
23 Law School 113,126 35,476 153,551 23.10% 489,644 226,252 226,252 65,358 160,894 226,252 23

Budget Planning Guidelines for FY15 – Academic Units
44
Attachment 1 - continued A B C D E F G H I J
FY1\2 FY13 FY13 FY13 FY14 FY14 FY14 FY1\4 FY14 FY15
Total ICR Total ICR Total ICR PER 06 Estimated Estimated Most Budget Projected Estimated
Through Through Through Percent Total Revenue Total Revenue Conservative ICR Variance Total Revenue
Period 06 Period 06 Period 12 Of Total a*(1/b) a*2 Estimate Revenue To Budget g * 1.0
24 Minnesota Extension Service 820,248 1,153,038 1,987,551 58.01% 1,413,904 1,640,496 1,413,904 2,303,912 (890,008) 1,413,904 24
25 College of Continuing Education 575 261 1,221 21.38% 0 1,150 0 500 (500) 0 25
26 Global Programs/Strategy Alliance 51,176 51,721 93,029 55.60% 92,049 102,352 92,049 40,525 51,524 92,049 26
27 Equity & Diversity 0 132,161 146,159 90.42% 0 0 0 0 0 0 27
28 Total Executive VP & Provost 29,433,975 29,190,447 55,874,695 56,828,145 58,867,950 55,752,257 53,805,478 1,946,779 55,752,257 28
29 Human Resources, Off of 0 2,725 3,471 78.51% 0 0 0 0 0 0 29
30 VP for Research 2,337,349 2,686,861 5,207,895 51.59% 4,530,442 4,674,698 4,530,442 5,175,000 (644,558) 4,530,442 30
31 SAAAU System Acad Admin Academic 0 183,667 289,078 63.54% 0 0 0 0 0 0 31
32 VP for System Academic Administration 37,662 10,705 19,803 54.06% 69,670 75,324 75,324 70,000 5,324 75,324 32
33 University Libraries 14,108 13,641 23,810 57.29% 24,625 28,216 24,625 15,000 9,625 24,625 33
34 Student Affairs 23,407 20,433 174,967 11.68% 200,433 46,814 46,814 8,000 38,814 46,814 34
35 Auxiliary Services 0 (1,470) (1,470) 100.00% 0 0 0 0 0 0 35
36 University Health & Safety 0 0 0 0 0 0 0 0 0 36
37 Grand Total 73,820,996 76,222,959 149,975,675 145,799,751 147,641,992 143,760,945 139,331,772 4,429,173 143,760,945 37