fy18 q3 performance reportnzx-prod-s7fsd7f98s.s3-website-ap-southeast-2.amazonaws.com/... · fy18 6...
TRANSCRIPT
17 April 2018
FY18 Q3
Performance Report
G E N E S I S E N E R G Y L I M I T E D

FY18 2Q3 PERFORMANCE REPORT
Q3 FY18 Performance Summary
It was an improved performance from the Customer segment as increases in B2B and LPG sales wereoffset by residential electricity and gas volume declines, in part due to one of the warmest summerson record. The highlight of the quarter was the positive sentiment coming from Genesis customers,our net promoter score up 3 percentage points, and churn dropped 1.2 percentage points below thecomparable quarter. Residential customer losses continued to decline over the period, these turnedto gains in the month of March and B2B sales lifted by 21% over the quarter. B2B gas sales were up31%. Netback fell to $80/MWh due to increased investment in marketing and business sales teams,increased C&I volumes, and lines cost timing impacts. LPG sales volumes rose 55%.
Total generation volumes were up 16% with thermal generation up 40% and renewable down 9%.Renewable volumes and forced outage factors were affected by the outage at Tekapo B, and agenerator failure at Tokaanu. Tekapo lake ended the period on 122% of average. National storagerecovered through the quarter to end on 111% of average with average price received for generationup 70% to $89/MWh. Our thermal generation continued to support the volatile market conditionswith 34GWh of swaptions called. The coal stockpile reduced 27% to end on 257kt.
Gas production of 3.0PJ was up 22%, as the field operated at 93.5% of maximum plant capacity tosupport generation requirements and swaption calls. LPG yield was 2.7% up, now stable above 4tonnes per TJ of gas produced. Oil sales volumes fell 15% due to export shipment timing howeverBrent Crude spot prices rose 24% to USD67/bbl.
Genesis is seeing a positive response from customers as a result of brand recognition and through innovation delivered, with churn below the comparable quarter and residential gains in March. James Magill, Executive General Manager Product Marketing
Customer
Wholesale
Kupe
Wholesale
WholesaleKupe

FY18 3
Customer Segment Performance
Highs Lows
20.6%
1.4 PJTotal gas sales
volumes16.3%
1. Power Shout is an offering to customers to use 5 free hours of power at a time of their choosing
$80/MWhNetback down 5.4%
‘Power Shout’ 1
Launched to around 200,000 customers
737 GWhB2B electricity
sales
$266/MWhVolume weighted average Residential electricity price 2.2%
Q3 PERFORMANCE REPORT
Customer Churn1.2ppts down on Q3 FY17
1,330 GWhTotal Electricity
retail sales volumes7.6%
5.0%
593 GWhResidential electricity
sales volume
16.9%
0.3 PJResidential gas sales volume
6%Genesis Brand Net
Promoter score climbs 3 ppt
(3,500)
(3,000)
(2,500)
(2,000)
(1,500)
(1,000)
(500)
0
500
1,000
Oct-17 Nov-17 Dec-17 Jan-18 Feb-18 Mar-18
Customers > 1 Product
LPG Only Customers
Gas Only Customers
Electricity Only Customers
Total Customer Change
CHANGE IN CUSTOMER NUMBERS (SIX MONTHS)

FY18 4
Wholesale Segment Performance
$89/MWhAverage price received
for generation 70.0%
632 GWhTotal renewable
generation 9.0%
33.5 GWhSwaptions called by
other market participants
6.4%Forced Outage Factor
(FOF) up due to Tekapo outage
5.8 ppts
1,632 GWhTotal generation up in
response to market 15.6%
246 GWhRankine output to
support volatile market conditions
0
1,000
2,000
3,000
4,000
5,000
6,000
$- $20 $40 $60 $80
$100 $120 $140 $160 $180 $200
1-J
an
6-J
an
11
-Jan
16
-Jan
21
-Jan
26
-Jan
31
-Jan
5-F
eb
10
-Fe
b
15
-Fe
b
20
-Fe
b
25
-Fe
b
2-M
ar
7-M
ar
12
-Mar
17
-Mar
22
-Mar
27
-Mar
Lake Storage(GWh)
Wholesale Price($/MWh)
Benmore (BEN2201) Otahuhu (OTA2201)
Storage Long Run Average (RHS) FY2018 Storage
Source: COMIT/Genesis Energy
DAILY AVERAGE WHOLESALE PRICES & NATIONAL HYDRO
Q3 PERFORMANCE REPORT
Highs Lows
257 kilotonneHuntly coal stockpile
inventory levels optimised26.8.%
FY18 5
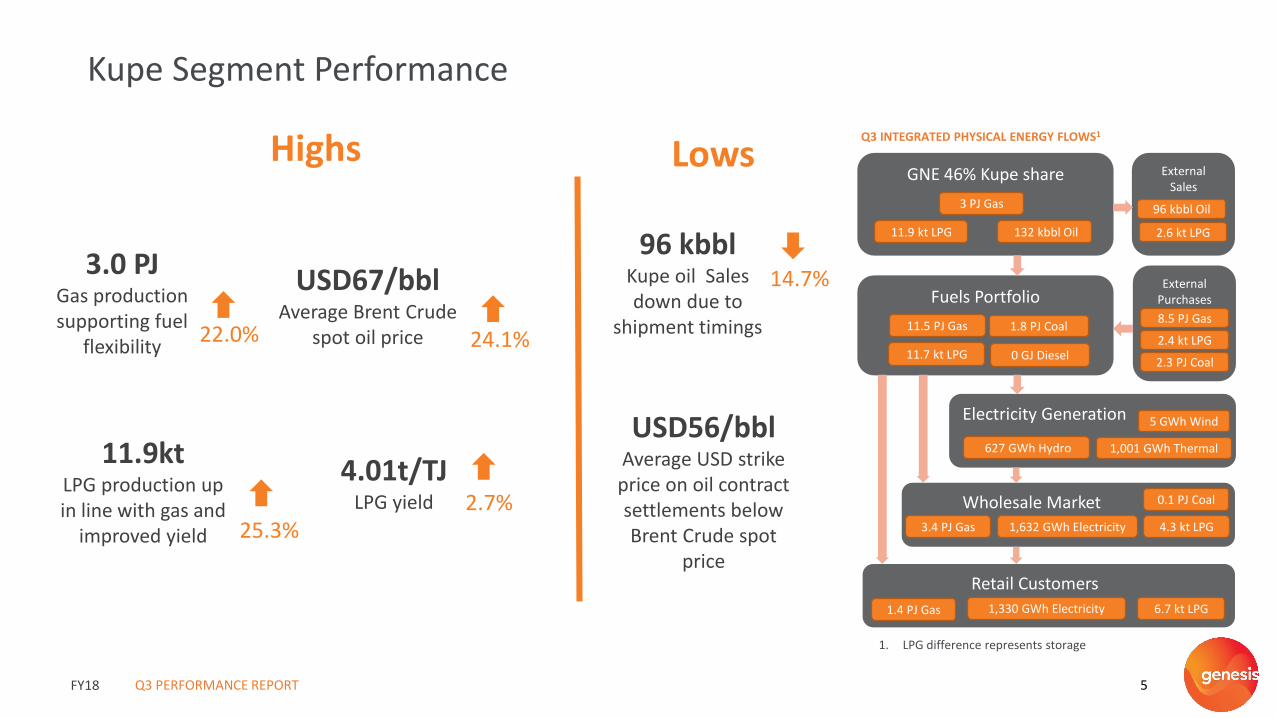
Kupe Segment Performance
11.9ktLPG production up in line with gas and
improved yield 25.3%
14.7%USD67/bblAverage Brent Crude
spot oil price
96 kbblKupe oil Sales down due to
shipment timings
3.0 PJGas production supporting fuel
flexibility22.0%
External Sales
GNE 46% Kupe share
132 kbbl Oil11.9 kt LPG
3 PJ Gas
Fuels Portfolio
Electricity Generation
Wholesale Market
Retail Customers
1,330 GWh Electricity
3.4 PJ Gas
1.4 PJ Gas
4.3 kt LPG
6.7 kt LPG
1,632 GWh Electricity
11.5 PJ Gas 1.8 PJ Coal
0 GJ Diesel
627 GWh Hydro
5 GWh Wind
1,001 GWh Thermal
96 kbbl Oil
11.7 kt LPG
2.6 kt LPG
External Purchases
8.5 PJ Gas
2.3 PJ Coal
2.4 kt LPG
0.1 PJ Coal
24.1%
Q3 INTEGRATED PHYSICAL ENERGY FLOWS1
Q3 PERFORMANCE REPORT
Highs Lows
4.01t/TJLPG yield 2.7%
1. LPG difference represents storage
USD56/bblAverage USD strike price on oil contract settlements below Brent Crude spot
price

FY18 6
GlossaryCUSTOMER
Brand Net Promoter Score Based on survey question "How likely would you be to recommend Genesis Energy/Energy Online to your friends or family?"
Electricity Market Share Market share based on Electricity Authority data for the end of quarter
Gas Market Share Market share based on Gas Industry Company data for the end of quarter
Customers Electricity and gas customers are defined by single customer view, regardless of number of connections (ICP's)
Single Customer View Represents unique customers which may have multiple ICP's
ICP Installation Connection Point
MVP Minimal Viable Product
Resi, SME, C&I Residential, small and medium enterprises and commercial & industrial customers
Volume Weighted Average Electricity Selling Price - $/MWh Average selling price for customers including lines/transmission and distribution and after prompt payment discount
Volume Weighted Average Gas Selling Price - $/MWh Average selling price for customers including lines/transmission and distribution and after prompt payment discount
Average Retail Electricity Purchase Price - LWAP ($/MWh) Excludes settlements from electricity derivatives.
LPG Customer Connections Defined as number of customers
Bottled LPG Sales (tonnes) Represents 45kg LPG bottle sales
Other Bulk and SME LPG Sales (tonnes) Represents bulk, 3rd party distributors and SME sales
Wholesale LPG Sales (tonnes) Represents wholelsale, export sales and transfers to Huntly power station
Electricity Sales - Wholesale (GWh) Includes contracts for difference and options (excluding futures)
Electricity Purchases - Wholesale (GWh) Includes contracts for difference and options (excluding futures)
Retail Netback ($/MWh) Customer Segment EBITDAF plus electricity and gas purchase cost divided by total electricity and gas sales volumes
GENERATION
Coal (GWh) Coal generation is calculated by applying coal burn to monthly average heat rates
Average Price Received for Generation - GWAP ($/MWh) Excludes settlements from electricity derivatives.
Coal Used In Internal Generation (PJ) Results have been revised to reflect changes in coal kilo tonnes to PJ conversion rate and volume methodology
Rankines Fuelled by Coal (%) The proportion of coal used in the Rankine units
Equipment Availability Factor (EAF) The percentage of time a power station is available to generate electricity
Forced Outage Factor (FOF) The percentage of time a power station is unavailable to generate electricity due to unplanned failure or defect.
WHOLESALE
Weighted Average Fuel Cost ($/MWh) Total cost of fuel burnt plus emissions on fuel burnt divided by total generation (thermal, hydro and wind)
CORPORATE
Total Recordable Injury Frequency Rate Rolling 12 month TRIFR per 200,000 hours worked for employees and contractors
Headcount Based on full time equivalents, excluding contractors
KUPE
Oil Hedge Levels (%) % hedged for remainder of FY as % of forecast sales
Q3 PERFORMANCE REPORT
FY18 7
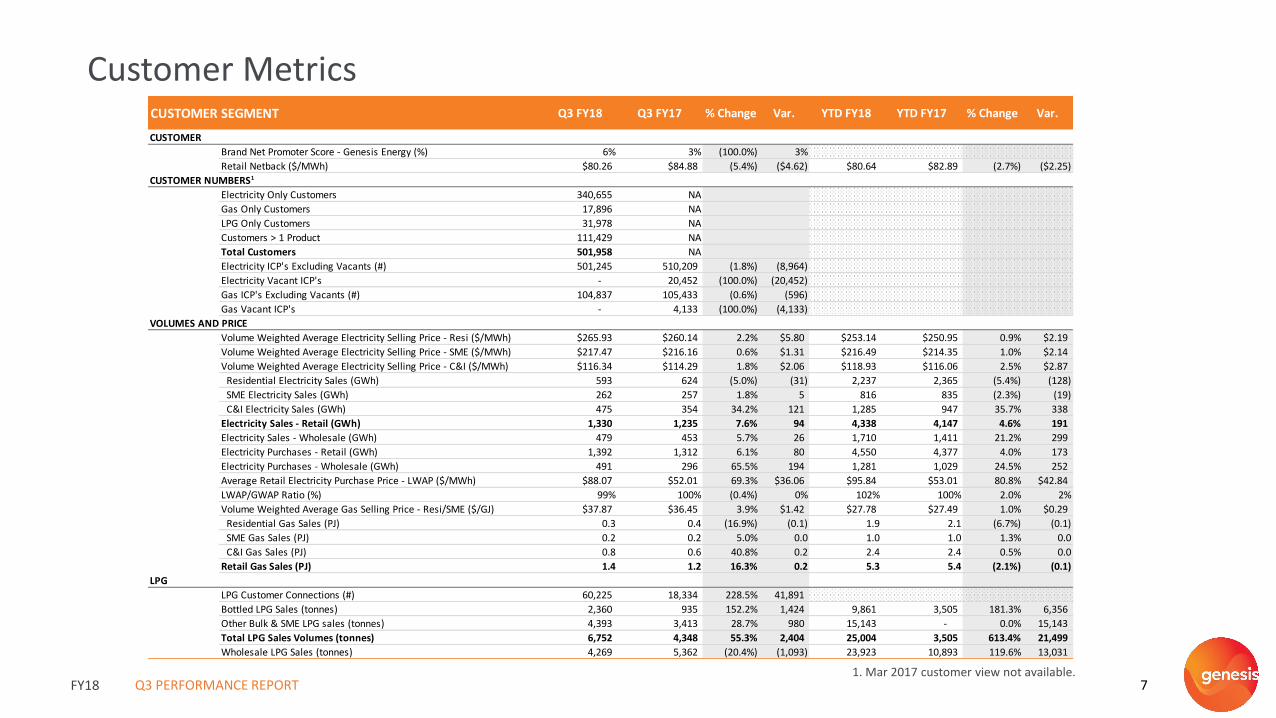
Customer Metrics
1. Mar 2017 customer view not available.Q3 PERFORMANCE REPORT
CUSTOMER SEGMENT Q3 FY18 Q3 FY17 % Change Var. YTD FY18 YTD FY17 % Change Var.
CUSTOMER
Brand Net Promoter Score - Genesis Energy (%) 6% 3% (100.0%) 3%
Retail Netback ($/MWh) $80.26 $84.88 (5.4%) ($4.62) $80.64 $82.89 (2.7%) ($2.25)
CUSTOMER NUMBERS1
Electricity Only Customers 340,655 NA
Gas Only Customers 17,896 NA
LPG Only Customers 31,978 NA
Customers > 1 Product 111,429 NA
Total Customers 501,958 NA
Electricity ICP's Excluding Vacants (#) 501,245 510,209 (1.8%) (8,964)
Electricity Vacant ICP's - 20,452 (100.0%) (20,452)
Gas ICP's Excluding Vacants (#) 104,837 105,433 (0.6%) (596)
Gas Vacant ICP's - 4,133 (100.0%) (4,133)
VOLUMES AND PRICE
Volume Weighted Average Electricity Selling Price - Resi ($/MWh) $265.93 $260.14 2.2% $5.80 $253.14 $250.95 0.9% $2.19
Volume Weighted Average Electricity Selling Price - SME ($/MWh) $217.47 $216.16 0.6% $1.31 $216.49 $214.35 1.0% $2.14
Volume Weighted Average Electricity Selling Price - C&I ($/MWh) $116.34 $114.29 1.8% $2.06 $118.93 $116.06 2.5% $2.87
Residential Electricity Sales (GWh) 593 624 (5.0%) (31) 2,237 2,365 (5.4%) (128)
SME Electricity Sales (GWh) 262 257 1.8% 5 816 835 (2.3%) (19)
C&I Electricity Sales (GWh) 475 354 34.2% 121 1,285 947 35.7% 338
Electricity Sales - Retail (GWh) 1,330 1,235 7.6% 94 4,338 4,147 4.6% 191
Electricity Sales - Wholesale (GWh) 479 453 5.7% 26 1,710 1,411 21.2% 299
Electricity Purchases - Retail (GWh) 1,392 1,312 6.1% 80 4,550 4,377 4.0% 173
Electricity Purchases - Wholesale (GWh) 491 296 65.5% 194 1,281 1,029 24.5% 252
Average Retail Electricity Purchase Price - LWAP ($/MWh) $88.07 $52.01 69.3% $36.06 $95.84 $53.01 80.8% $42.84
LWAP/GWAP Ratio (%) 99% 100% (0.4%) 0% 102% 100% 2.0% 2%
Volume Weighted Average Gas Selling Price - Resi/SME ($/GJ) $37.87 $36.45 3.9% $1.42 $27.78 $27.49 1.0% $0.29
Residential Gas Sales (PJ) 0.3 0.4 (16.9%) (0.1) 1.9 2.1 (6.7%) (0.1)
SME Gas Sales (PJ) 0.2 0.2 5.0% 0.0 1.0 1.0 1.3% 0.0
C&I Gas Sales (PJ) 0.8 0.6 40.8% 0.2 2.4 2.4 0.5% 0.0
Retail Gas Sales (PJ) 1.4 1.2 16.3% 0.2 5.3 5.4 (2.1%) (0.1)
LPG
LPG Customer Connections (#) 60,225 18,334 228.5% 41,891
Bottled LPG Sales (tonnes) 2,360 935 152.2% 1,424 9,861 3,505 181.3% 6,356
Other Bulk & SME LPG sales (tonnes) 4,393 3,413 28.7% 980 15,143 - 0.0% 15,143
Total LPG Sales Volumes (tonnes) 6,752 4,348 55.3% 2,404 25,004 3,505 613.4% 21,499
Wholesale LPG Sales (tonnes) 4,269 5,362 (20.4%) (1,093) 23,923 10,893 119.6% 13,031

FY18 8
Wholesale Metrics
Q3 PERFORMANCE REPORT
WHOLESALE SEGMENT Q3 FY18 Q3 FY17 % Change Var. YTD FY18 YTD FY17 % Change Var.
GENERATION
Gas (GWh) 857 718 19.4% 139 2,652 2,150 23.3% 502
Coal (GWh) 144 - N/A 144 522 53 887.9% 469
Total Thermal (GWh) 1,001 718 39.4% 283 3,173 2,203 44.1% 971
Hydro (GWh) 627 689 (9.0%) (62) 2,314 2,302 0.5% 11
Wind (GWh) 5 5 (6.7%) (0) 15 17 (9.0%) (2)
Total Renewable (GWh) 632 694 (9.0%) (63) 2,329 2,319 0.4% 10
Total Generation (GWh) 1,632 1,412 15.6% 220 5,502 4,522 21.7% 981
Average Price Received for Generation - GWAP ($/MWh) $88.54 $52.07 70.0% $36.46 $93.90 $52.96 77.3% $40.94Generation Emissions (ktCO2) 523 287 81.9% 235 1,683 948 77.6% 735
Generation Carbon Intensity (tCO2/GWh) 320 203 57.3% 117 306 210 45.9% 96
Forced Outage Factor (FOF) 6.4% 0.6% 966.7% 5.8% 3.3% 0.9% 266.7% 2.4%
Equipment Availability Factor (EAF) 84.1% 90.4% (7.0%) (6.3%) 90.3% 92.3% (2.2%) (0)
Rankine Output (GWh) 246 (4) N/A 250 859 181 373.8% 678
Rankines Fueled by Coal (%) 59% 0% N/A 58.5% 61% 30% 105.7% 31%
WHOLESALE
Gas Purchases (PJ) 11.5 9.9 16.2% 1.6 35.9 33.2 8.0% 2.7
Coal Purchases (PJ) 2.3 0.0 N/A 2.3 4.3 0.1 8000.6% 4.2
Wholesale Gas Sales (PJ) 3.4 3.3 2.3% 0.1 9.8 11.3 (13.1%) (1.5)
Wholesale Coal Sales (PJ) 0.1 0.2 (69.4%) (0.1) 0.3 0.6 (54.2%) (0.3)
Gas Used In Internal Generation (PJ) 6.7 5.4 25.2% 1.4 20.9 16.6 26.3% 4.4
Coal Used In Internal Generation (PJ) 1.7 0.0 N/A 1.7 6.0 0.7 723.4% 5.3
Weighted Average Fuel Cost ($/MWh) $42.89 $31.61 35.7% $11.28 $37.85 $30.91 22.4% $6.93
Coal Stockpile - closing balance (kilotonnes) 257.1 351.2 (26.8%) (94.1)

FY18 9
Kupe and Other Metrics
1. TRIFR now being reported to include contractors. Prior period has been restated on same basis
Q3 PERFORMANCE REPORT
KUPE SEGMENT Q3 FY18 Q3 FY17 % Change Var. YTD FY18 YTD FY17 % Change Var.
KUPE
Gas Production (PJ) 3.0 2.4 22.0% 0.5 9.1 6.2 45.4% 2.8
Oil Production (kbbl) 132.5 127.7 3.7% 4.8 413.2 323.5 27.7% 89.7
Oil Sales (kbbl) 96.0 112.5 (14.7%) (16.5) 337.0 259.2 30.0% 77.7
Average Brent Crude Spot Oil Price (USD/bbl) $66.76 $53.78 24.1% $12.98 $60.08 $49.70 20.9% $10.38
LPG Sales (kt) 11.7 9.7 21.0% 2.0 34.4 21.2 62.0% 13.1
LPG Production (kt) 11.9 9.5 25.3% 2.4 34.4 21.1 62.8% 13.3
OTHERCORPORATE
Headcount (FTE) 1,012 775 30.6% 237
Total Recordable Injury Frequency Rate1 1.18 0.65 81.5% 0.53

FY18 10
Appendix: Customer Segment
Q3 PERFORMANCE REPORT
0
5,000
10,000
15,000
20,000
25,000
30,000
35,000
0
1,000
2,000
3,000
4,000
5,000
6,000
7,000Q
1 F
Y14
Q2
Q3
Q4
Q1
FY1
5
Q2
Q3
Q4
Q1
FY1
6
Q2
Q3
Q4
Q1
FY1
7
Q2
Q3
Q4
Q1
FY1
8
Q2
Q3
Ton
nes
Ton
nes
LPG SALES VOLUMES (tonnes)
Quarterly Retail LPG Sales Volumes
Quarterly Bulk/SME LPG Sales Volume
Rolling 12month sales volume (RHS)
0.0
1.0
2.0
3.0
4.0
5.0
6.0
7.0
8.0
0.0
0.2
0.4
0.6
0.8
1.0
1.2
1.4
Q1
FY1
4
Q2
Q3
Q4
Q1
FY1
5
Q2
Q3
Q4
Q1
FY1
6
Q2
Q3
Q4
Q1
FY1
7
Q2
Q3
Q4
Q1
FY1
8
Q2
Q3
PJ
PJ
RETAIL GAS SALES VOLUMES (PJ)
Quarterly C&I Sales Volumes Quarterly Resi Sales Volumes
Quarterly SME Sales Volumes Rolling 12month sales volume (RHS)
0
1000
2000
3000
4000
5000
6000
7000
0
200
400
600
800
1000
1200
Q1
FY1
4
Q2
Q3
Q4
Q1
FY1
5
Q2
Q3
Q4
Q1
FY1
6
Q2
Q3
Q4
Q1
FY1
7
Q2
Q3
Q4
Q1
FY1
8
Q2
Q3
GW
h
GW
h
ELECTRICITY SALES VOLUMES (GWh)
Quarterly C&I Sales Volumes Quarterly Resi Sales Volumes
Quarterly SME Sales Volumes Rolling 12month sales volume (RHS)

FY18 11
Appendix: Wholesale Segment
0
500
1,000
1,500
2,000
2,500
3,000
3,500
4,000
4,500
Apr May Jun Jul Aug Sep Oct Nov Dec Jan Feb Mar
GWh
NEW ZEALAND DAILY STORAGE
91 year Average 12month Rolling
Source: COMIT
0
20
40
60
80
100
120
140
160
Apr May Jun Jul Aug Sep Oct Nov Dec Jan Feb Mar
GWh
WAIKAREMOANA STORAGE vs LONG RUN AVERAGE - Q3 FY2018Waikaremoana Storage
Source: COMITSource: COMITSource: COMIT
0
200
400
600
800
1000
Apr May Jun Jul Aug Sep Oct Nov Dec Jan Feb Mar
GWh
TEKAPO STORAGE vs LONG RUN AVERAGE - Q3 FY2018
Tekapo Storage
Source: COMIT
Q3 PERFORMANCE REPORT

FY18 12
Appendix: Wholesale Segment
PLANT PERFORMANCE
Q3 PERFORMANCE REPORT
0
1,000
2,000
3,000
4,000
5,000
6,000
Q3 2018 Q3 2017 Q3 YTD 2018 Q3 YTD 2017
GW
h
Hau Nui Wind Farm
Tekapo A and B power stations
Waikaremoana Power Scheme
Tongariro Power Scheme
Huntly Unit 6
Huntly Unit 5
Huntly Units 1 to 4 Gas
Huntly Units 1 to 4 Coal
GENERATION BY POWER STATION
0%
2%
4%
6%
8%
10%
12%
14%
16%
18%
20%
0%
10%
20%
30%
40%
50%
60%
70%
80%
90%
100%
Jul-
14
Sep
-14
No
v-1
4
Jan
-15
Mar
-15
May
-15
Jul-
15
Sep
-15
No
v-1
5
Jan
-16
Mar
-16
May
-16
Jul-
16
Sep
-16
No
v-1
6
Jan
-17
Mar
-17
May
-17
Jul-
17
Sep
-17
No
v-1
7
Jan
-18
Mar
-18
Forc
ed
Ou
tage
Fac
tor
(FO
F) %
Equ
ipm
en
t A
vaila
bili
ty F
acto
r (E
AF)
%
Monthly EAF Monthly FOF
FY18 13
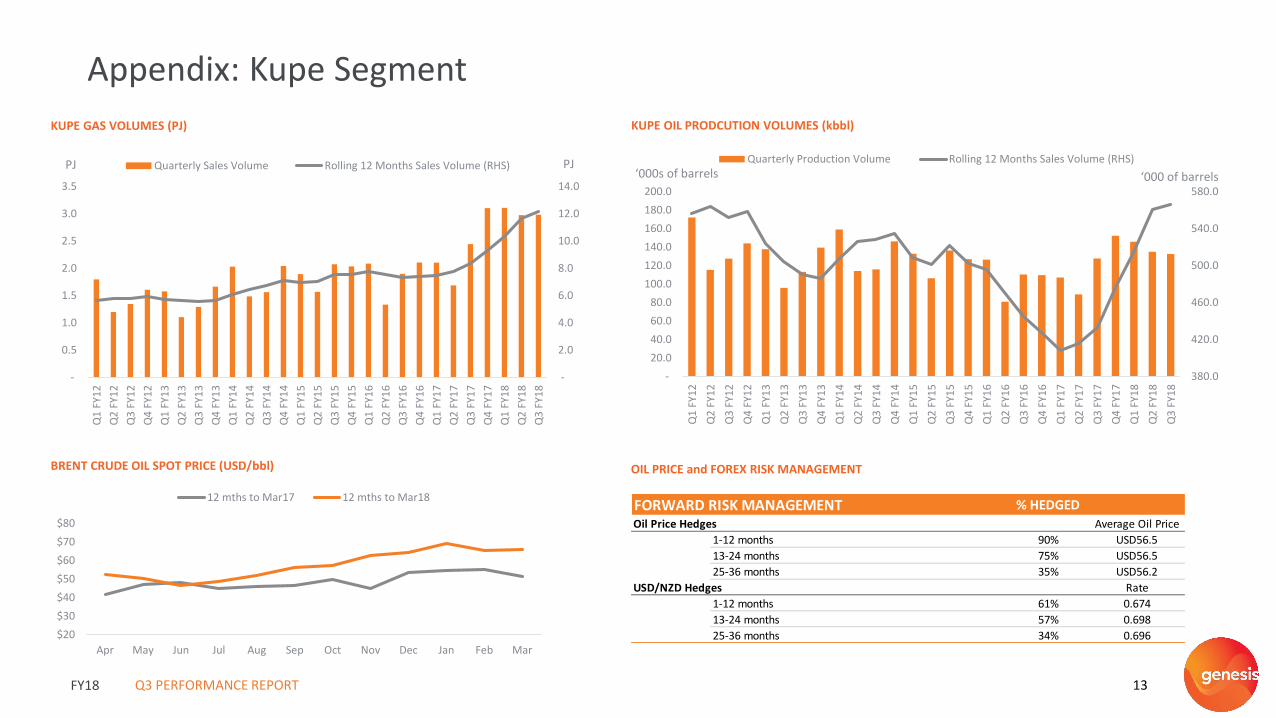
Appendix: Kupe Segment
OIL PRICE and FOREX RISK MANAGEMENTBRENT CRUDE OIL SPOT PRICE (USD/bbl)
Q3 PERFORMANCE REPORT
FORWARD RISK MANAGEMENT % HEDGED
Oil Price Hedges Average Oil Price
1-12 months 90% USD56.5
13-24 months 75% USD56.5
25-36 months 35% USD56.2
USD/NZD Hedges Rate
1-12 months 61% 0.674
13-24 months 57% 0.698
25-36 months 34% 0.696
380.0
420.0
460.0
500.0
540.0
580.0
-
20.0
40.0
60.0
80.0
100.0
120.0
140.0
160.0
180.0
200.0
Q1
FY1
2
Q2
FY1
2
Q3
FY1
2
Q4
FY1
2
Q1
FY1
3
Q2
FY1
3
Q3
FY1
3
Q4
FY1
3
Q1
FY1
4
Q2
FY1
4
Q3
FY1
4
Q4
FY1
4
Q1
FY1
5
Q2
FY1
5
Q3
FY1
5
Q4
FY1
5
Q1
FY1
6
Q2
FY1
6
Q3
FY1
6
Q4
FY1
6
Q1
FY1
7
Q2
FY1
7
Q3
FY1
7
Q4
FY1
7
Q1
FY1
8
Q2
FY1
8
Q3
FY1
8
‘000 of barrels‘000s of barrelsQuarterly Production Volume Rolling 12 Months Sales Volume (RHS)
-
2.0
4.0
6.0
8.0
10.0
12.0
14.0
-
0.5
1.0
1.5
2.0
2.5
3.0
3.5
Q1
FY1
2
Q2
FY1
2
Q3
FY1
2
Q4
FY1
2
Q1
FY1
3
Q2
FY1
3
Q3
FY1
3
Q4
FY1
3
Q1
FY1
4
Q2
FY1
4
Q3
FY1
4
Q4
FY1
4
Q1
FY1
5
Q2
FY1
5
Q3
FY1
5
Q4
FY1
5
Q1
FY1
6
Q2
FY1
6
Q3
FY1
6
Q4
FY1
6
Q1
FY1
7
Q2
FY1
7
Q3
FY1
7
Q4
FY1
7
Q1
FY1
8
Q2
FY1
8
Q3
FY1
8
PJPJ Quarterly Sales Volume Rolling 12 Months Sales Volume (RHS)
KUPE GAS VOLUMES (PJ) KUPE OIL PRODCUTION VOLUMES (kbbl)
$20
$30
$40
$50
$60
$70
$80
Apr May Jun Jul Aug Sep Oct Nov Dec Jan Feb Mar
12 mths to Mar17 12 mths to Mar18