fy18 result presentation...fy18 result presentation 10 value through integration —integrated kupe...
TRANSCRIPT

G E N E S I S E N E R G Y L I M I T E D
FY18 Result Presentation
29 August 2018Marc England – CHIEF EXECUTIVE
Chris Jewell – CHIEF FINANCIAL OFFICER
AGENDA
Year in Review
Financial Performance
Strategic Update and Outlook
FY18 RESULT PRESENTATION 2
Supplementary Information
1. Year in Review
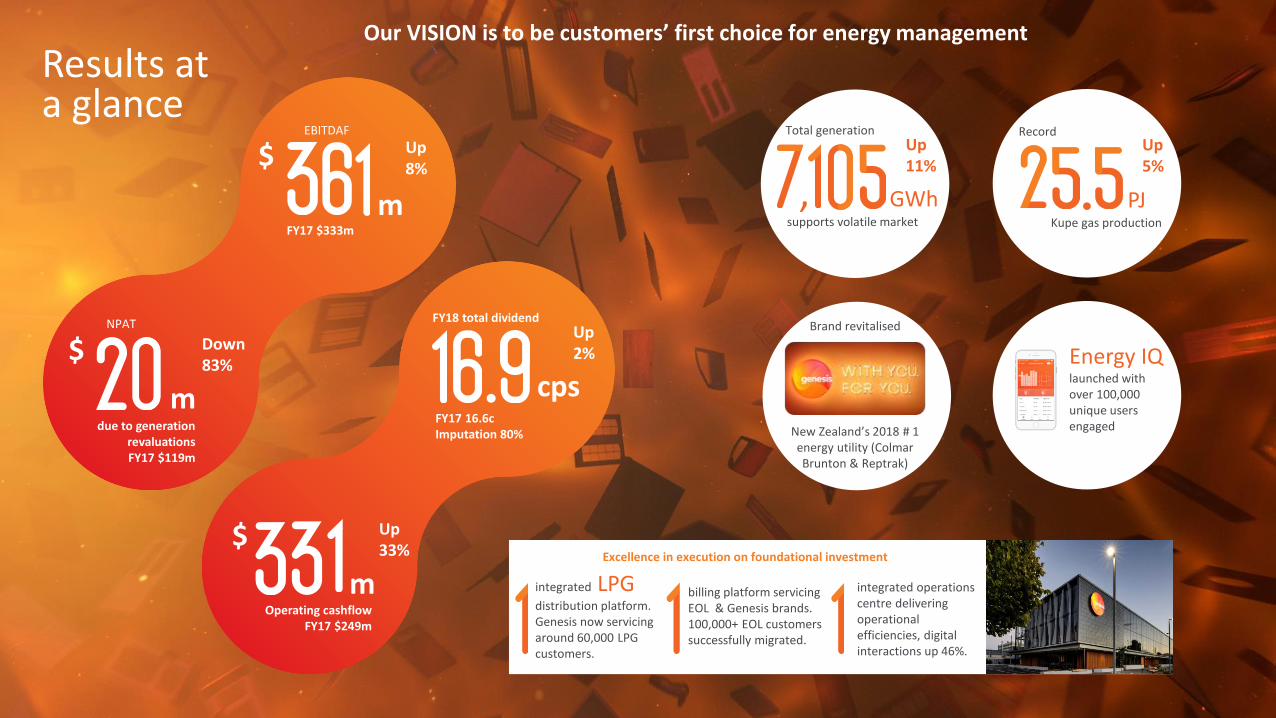
Results at a glance
EBITDAF
FY17 $333m
m
$
m
$
due to generation revaluations FY17 $119m
$
Operating cashflowFY17 $249m
FY18 total dividend
FY17 16.6c Imputation 80%
cps
billing platform servicing EOL & Genesis brands. 100,000+ EOL customers successfully migrated.
Kupe gas production
PJ
Record
m integrated operations centre delivering operational efficiencies, digital interactions up 46%.
integrated LPG distribution platform. Genesis now servicing around 60,000 LPG customers.
Energy IQ launched with over 100,000 unique users engaged
Brand revitalised
“With You, For you”
New Zealand’s 2018 # 1 energy utility (Colmar Brunton & Reptrak)
GWhsupports volatile market
,
Up5%
Up11%
Total generation
NPAT
Our VISION is to be customers’ first choice for energy management
Excellence in execution on foundational investment
Up8%
Down83%
Up2%
Up33%
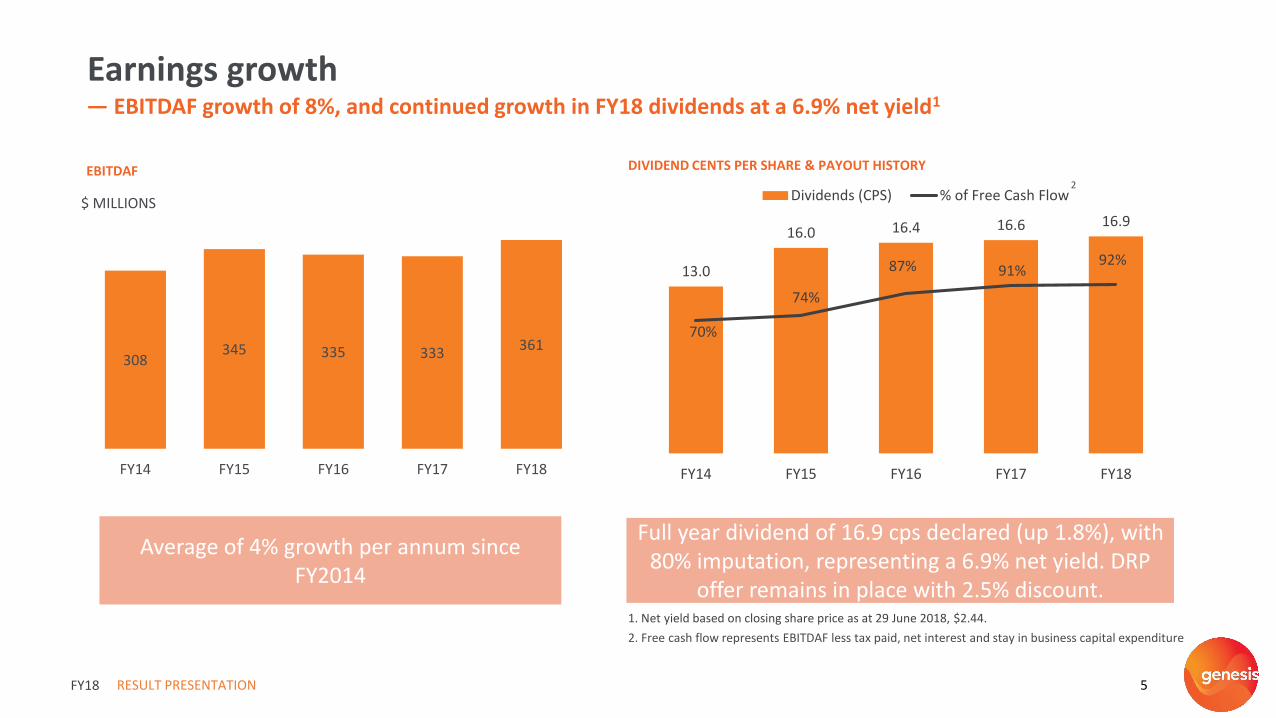
308345 335 333
361
FY14 FY15 FY16 FY17 FY18
$ MILLIONS
EBITDAF
RESULT PRESENTATION 5
Earnings growth— EBITDAF growth of 8%, and continued growth in FY18 dividends at a 6.9% net yield1
Average of 4% growth per annum since FY2014
FY18
DIVIDEND CENTS PER SHARE & PAYOUT HISTORY
13.0
16.0 16.4 16.6 16.9
70%
74%
87% 91%92%
-10%
10%
30%
50%
70%
90%
110%
130%
0
FY14 FY15 FY16 FY17 FY18
Dividends (CPS) % of Free Cash Flow
Full year dividend of 16.9 cps declared (up 1.8%), with 80% imputation, representing a 6.9% net yield. DRP
offer remains in place with 2.5% discount.1. Net yield based on closing share price as at 29 June 2018, $2.44.
2. Free cash flow represents EBITDAF less tax paid, net interest and stay in business capital expenditure
2

15%
17%
19%
21%
23%
25%
27%
Jan
-17
Feb
-17
Mar
-17
Ap
r-1
7
May
-17
Jun
-17
Jul-
17
Au
g-1
7
Sep
-17
Oct
-17
No
v-1
7
Dec
-17
Jan
-18
Feb
-18
Mar
-18
Ap
r-1
8
May
-18
Jun
-18
Genesis Market (excl Genesis)
-5%0%5%
10%15%20%25%30%35%40%
Jun
-17
Jul-
17
Au
g-1
7
Sep
-17
Oct
-17
No
v-1
7
De
c-1
7
Jan
-18
Feb
-18
Mar
-18
Ap
r-1
8
May
-18
Jun
-18
NPS - Genesis 3 Month Rolling Promoter - Genesis 3 Month Rolling
RESULT PRESENTATION 6
Brand performance— a focus on brand and loyalty initiatives is shifting perceptions and reducing churn versus market
FY18
RESIDENTIAL ELECTRICITY CHURN (EXCL EOL, ROLLING 3 MONTH)
GENESIS NPS AND PROMOTER SCORE
+10 ppt
+5 ppt
CORPORATE REPUTATION RANKINGS
2017 2018Genesis vs
Competitors
20th 13th 1st
13th 5th 1st
New Zealand’s 2018 # 1 ranked energy utility
2.6 ppt2.1 ppt
BRAND METRIC
SOURCE: Campaign Tracking, The Purpose Business
Genesis May 17
Genesis May 18
Genesis vs Competitors
First to market with new technology 14% 29% +14 ppt
Puts people in control of their energy use 15% 23% +11 ppt
Market leader 21% 33% +15 ppt
Knows you and understands what you need
60% 67% +8 ppt
RESULT PRESENTATION 7
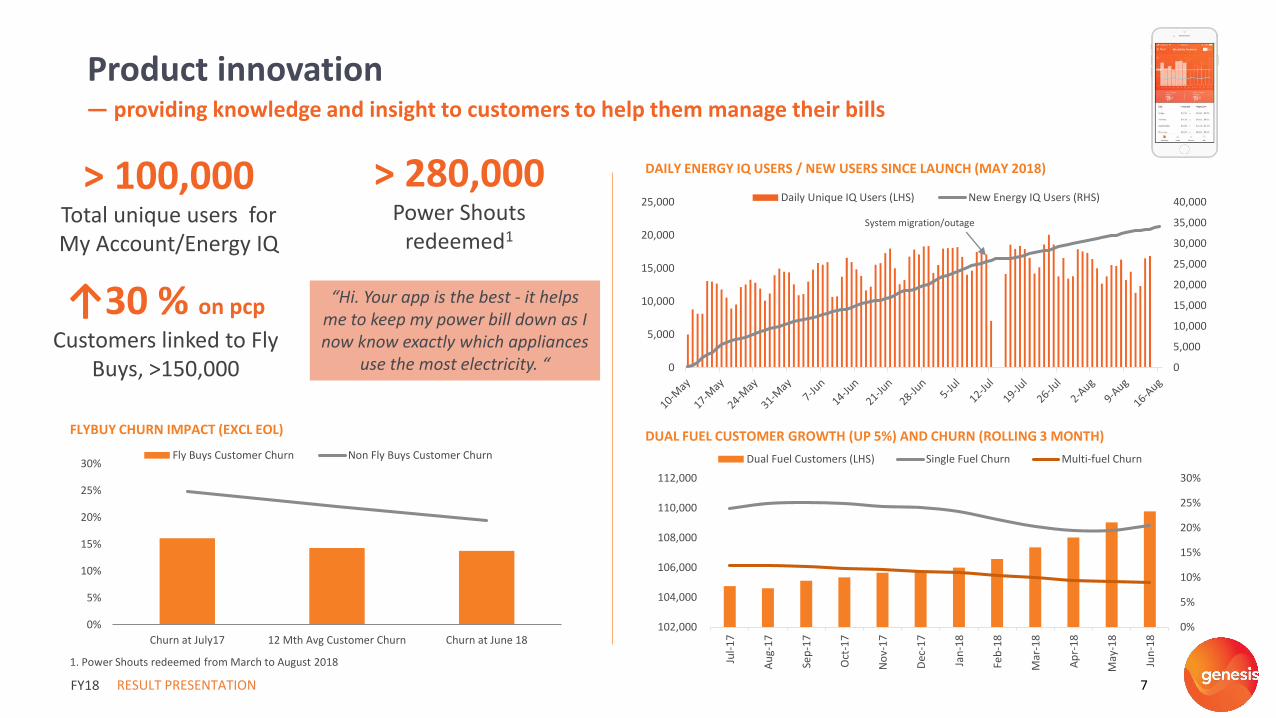
Product innovation— providing knowledge and insight to customers to help them manage their bills
FY18
DAILY ENERGY IQ USERS / NEW USERS SINCE LAUNCH (MAY 2018)
DUAL FUEL CUSTOMER GROWTH (UP 5%) AND CHURN (ROLLING 3 MONTH)
↑30 % on pcp
Customers linked to Fly Buys, >150,000
> 100,000 Total unique users for My Account/Energy IQ
> 280,000 Power Shouts
redeemed1
0%
5%
10%
15%
20%
25%
30%
Churn at July17 12 Mth Avg Customer Churn Churn at June 18
Fly Buys Customer Churn Non Fly Buys Customer Churn
FLYBUY CHURN IMPACT (EXCL EOL)
“Hi. Your app is the best - it helps me to keep my power bill down as I now know exactly which appliances
use the most electricity. “
0%
5%
10%
15%
20%
25%
30%
102,000
104,000
106,000
108,000
110,000
112,000
Jul-
17
Au
g-1
7
Sep
-17
Oct
-17
No
v-1
7
Dec
-17
Jan
-18
Feb
-18
Mar
-18
Ap
r-1
8
May
-18
Jun
-18
Dual Fuel Customers (LHS) Single Fuel Churn Multi-fuel Churn
1. Power Shouts redeemed from March to August 2018
0
5,000
10,000
15,000
20,000
25,000
30,000
35,000
40,000
0
5,000
10,000
15,000
20,000
25,000 Daily Unique IQ Users (LHS) New Energy IQ Users (RHS)
System migration/outage
RESULT PRESENTATION 8
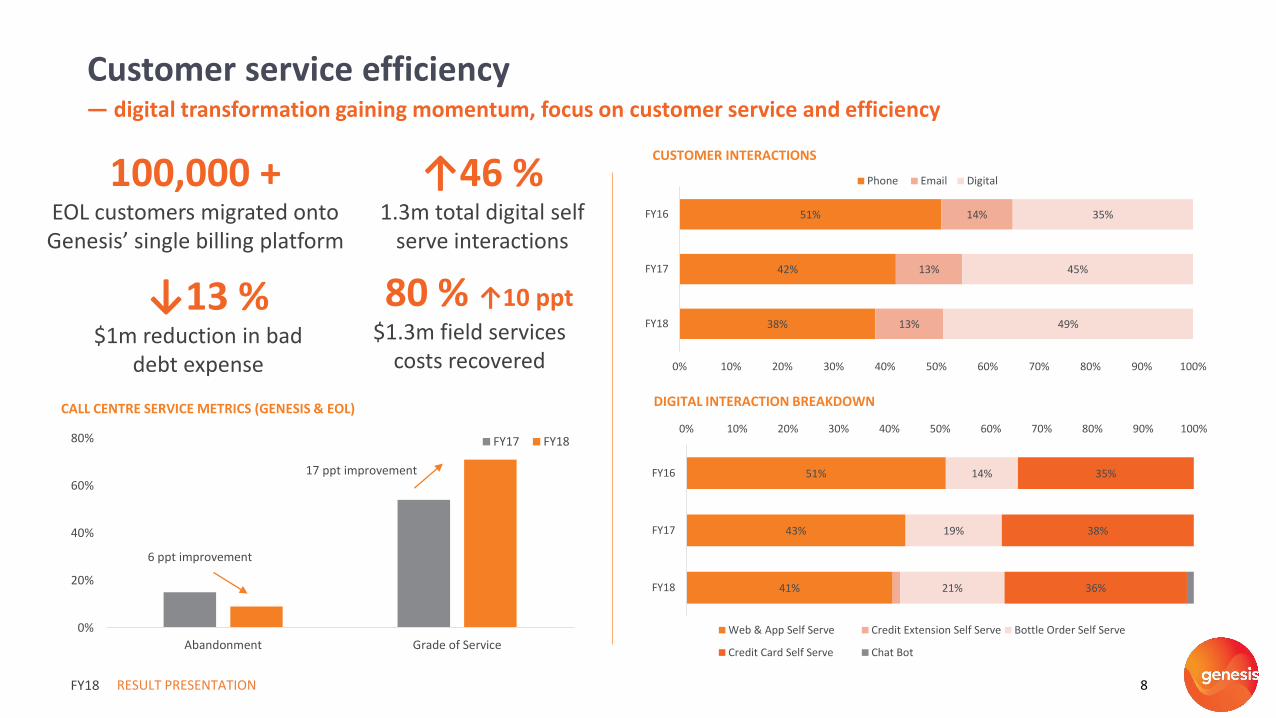
Customer service efficiency — digital transformation gaining momentum, focus on customer service and efficiency
FY18
CUSTOMER INTERACTIONS
CALL CENTRE SERVICE METRICS (GENESIS & EOL) DIGITAL INTERACTION BREAKDOWN
↑46 % 1.3m total digital self
serve interactions
100,000 + EOL customers migrated onto Genesis’ single billing platform
↓13 %$1m reduction in bad
debt expense
0%
20%
40%
60%
80%
Abandonment Grade of Service
FY17 FY18
6 ppt improvement
17 ppt improvement
80 % ↑10 ppt
$1.3m field services costs recovered
38%
42%
51%
13%
13%
14%
49%
45%
35%
0% 10% 20% 30% 40% 50% 60% 70% 80% 90% 100%
FY18
FY17
FY16
Phone Email Digital
41%
43%
51%
21%
19%
14%
36%
38%
35%
0% 10% 20% 30% 40% 50% 60% 70% 80% 90% 100%
FY18
FY17
FY16
Web & App Self Serve Credit Extension Self Serve Bottle Order Self Serve
Credit Card Self Serve Chat Bot
RESULT PRESENTATION 9
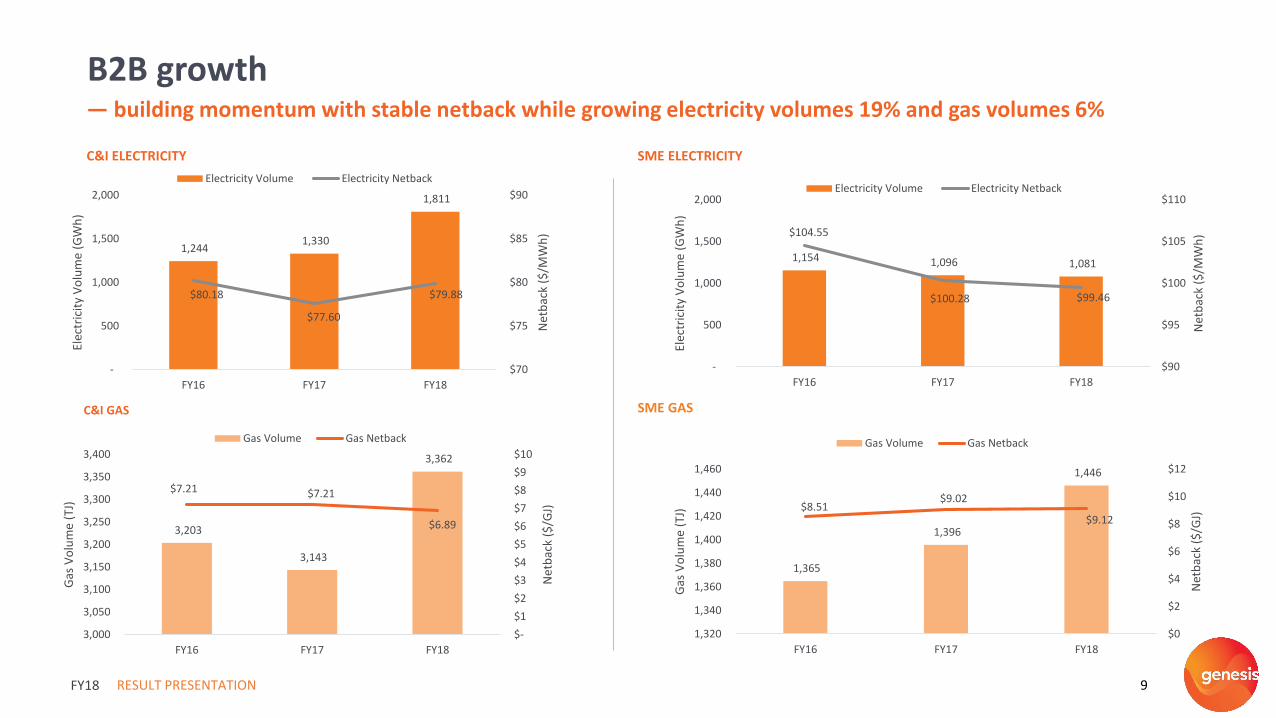
B2B growth— building momentum with stable netback while growing electricity volumes 19% and gas volumes 6%
FY18
SME GASC&I GAS
SME ELECTRICITYC&I ELECTRICITY
1,244 1,330
1,811
$80.18
$77.60
$79.88
$70
$75
$80
$85
$90
-
500
1,000
1,500
2,000
FY16 FY17 FY18
Net
bac
k ($
/MW
h)
Elec
tric
ity
Vo
lum
e (G
Wh
)
Electricity Volume Electricity Netback
1,154 1,096 1,081
$104.55
$100.28 $99.46
$90
$95
$100
$105
$110
-
500
1,000
1,500
2,000
FY16 FY17 FY18
Net
bac
k ($
/MW
h)
Elec
tric
ity
Vo
lum
e (G
Wh
)
Electricity Volume Electricity Netback
3,203
3,143
3,362
$7.21 $7.21
$6.89
$-
$1
$2
$3
$4
$5
$6
$7
$8
$9
$10
3,000
3,050
3,100
3,150
3,200
3,250
3,300
3,350
3,400
FY16 FY17 FY18
Net
bac
k ($
/GJ)
Gas
Vo
lum
e (T
J)
Gas Volume Gas Netback
1,365
1,396
1,446
$8.51 $9.02
$9.12
$0
$2
$4
$6
$8
$10
$12
1,320
1,340
1,360
1,380
1,400
1,420
1,440
1,460
FY16 FY17 FY18
Net
bac
k ($
/GJ)
Gas
Vo
lum
e (T
J)
Gas Volume Gas Netback
-250
-150
-50
50
150
250
2013 2014 2015 2016 2017
Sup
ply
/ D
eman
d (
kt)
Demand ExportSupply ImportLinear (Supply Decline) Linear (Demand Increase)
FY18 RESULT PRESENTATION 10
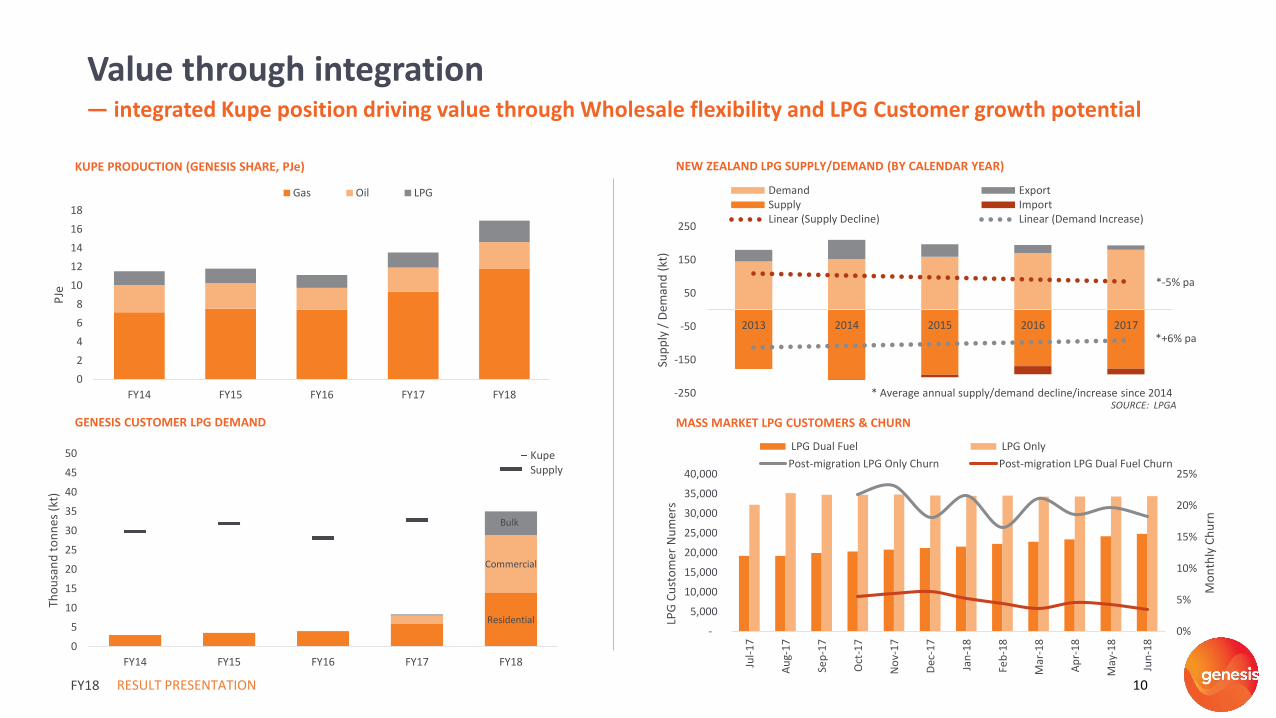
Value through integration— integrated Kupe position driving value through Wholesale flexibility and LPG Customer growth potential
MASS MARKET LPG CUSTOMERS & CHURNGENESIS CUSTOMER LPG DEMAND
KUPE PRODUCTION (GENESIS SHARE, PJe) NEW ZEALAND LPG SUPPLY/DEMAND (BY CALENDAR YEAR)
0
2
4
6
8
10
12
14
16
18
FY14 FY15 FY16 FY17 FY18
PJe
Gas Oil LPG
0%
5%
10%
15%
20%
25%
-
5,000
10,000
15,000
20,000
25,000
30,000
35,000
40,000
Jul-
17
Au
g-1
7
Sep
-17
Oct
-17
No
v-1
7
Dec
-17
Jan
-18
Feb
-18
Mar
-18
Ap
r-1
8
May
-18
Jun
-18
Mo
nth
ly C
hu
rn
LPG
Cu
sto
mer
Nu
mer
s
LPG Dual Fuel LPG Only
Post-migration LPG Only Churn Post-migration LPG Dual Fuel Churn
SOURCE: LPGA
Residential
Commercial
Bulk
0
5
10
15
20
25
30
35
40
45
50
FY14 FY15 FY16 FY17 FY18
Tho
usa
nd
to
nn
es (
kt)
KupeSupply
*-5% pa
*+6% pa
* Average annual supply/demand decline/increase since 2014
RESULT PRESENTATION 11
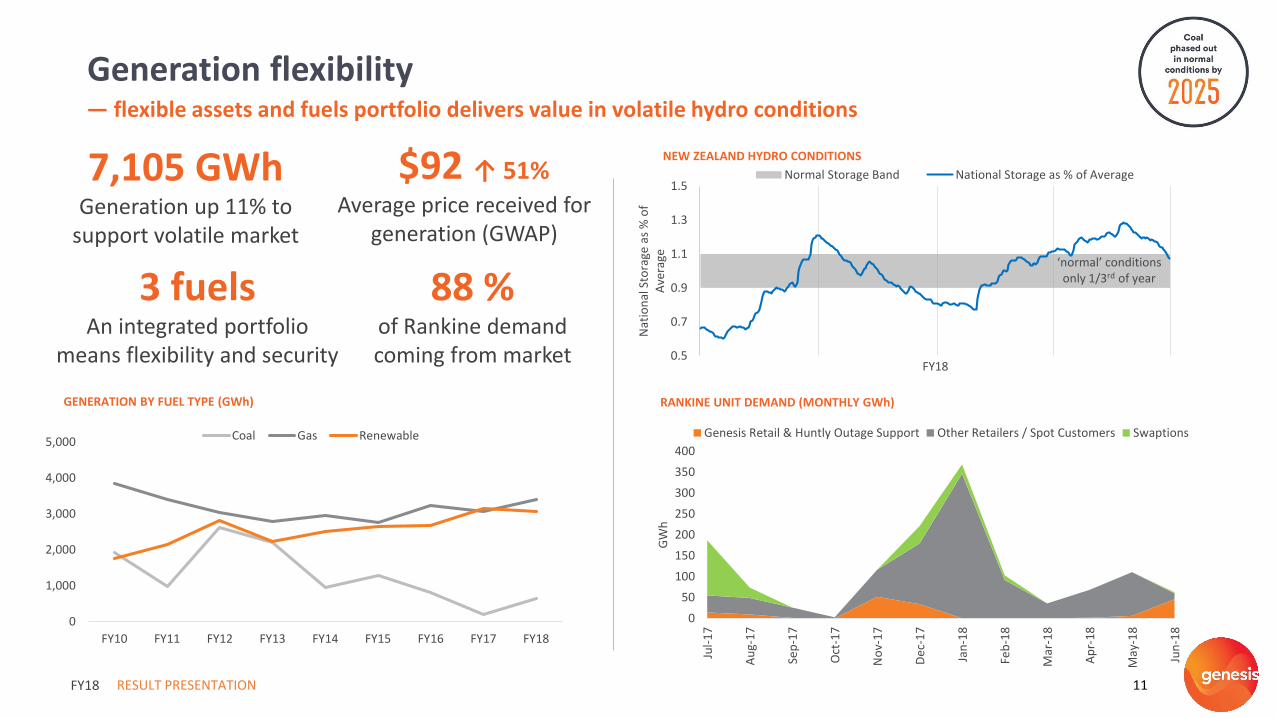
Generation flexibility— flexible assets and fuels portfolio delivers value in volatile hydro conditions
FY18
NEW ZEALAND HYDRO CONDITIONS
RANKINE UNIT DEMAND (MONTHLY GWh)
0
50
100
150
200
250
300
350
400
Jul-
17
Au
g-1
7
Sep
-17
Oct
-17
No
v-1
7
De
c-1
7
Jan
-18
Feb
-18
Mar
-18
Ap
r-1
8
May
-18
Jun
-18
GW
h
Genesis Retail & Huntly Outage Support Other Retailers / Spot Customers Swaptions
0.5
0.7
0.9
1.1
1.3
1.5
Nat
ion
al S
tora
ge a
s %
of
Ave
rage
FY18
Normal Storage Band National Storage as % of Average
3 fuels An integrated portfolio
means flexibility and security
7,105 GWh Generation up 11% to
support volatile market
88 % of Rankine demand coming from market
GENERATION BY FUEL TYPE (GWh)
0
1,000
2,000
3,000
4,000
5,000
FY10 FY11 FY12 FY13 FY14 FY15 FY16 FY17 FY18
Coal Gas Renewable
‘normal’ conditions only 1/3rd of year
$92 ↑ 51%
Average price received for generation (GWAP)
2. Financial Performance

333
119
74
284249
182
47
166
1,212
361
20
58
305331
184
80
170
1,183
EBITDAF NPAT Underlying Earnings Operating Costs Operating Cashflow Free Cash Flow Capital Expenditure Dividend Net Debt
$ MILLIONS FY17 FY18
12
— EBITDAF up 8%, investment in operating and capital expenditure up, free cash flow up 1%, net debt down $29m
FINANCIAL HIGHLIGHTS
RESULT PRESENTATION 13
FY18 financial highlights
FY18
+ 8% - 83% - 22% + 7% + 71%+ 1% + 2% - 2%
1. Net Debt is shown on a separate scale to other financial comparisons2. Impacted by $100.3m non-cash fair value asset adjustments on Huntly Rankine units, FY18 $48.8m decrease against a FY17 $51.5m gain.
+ 33%
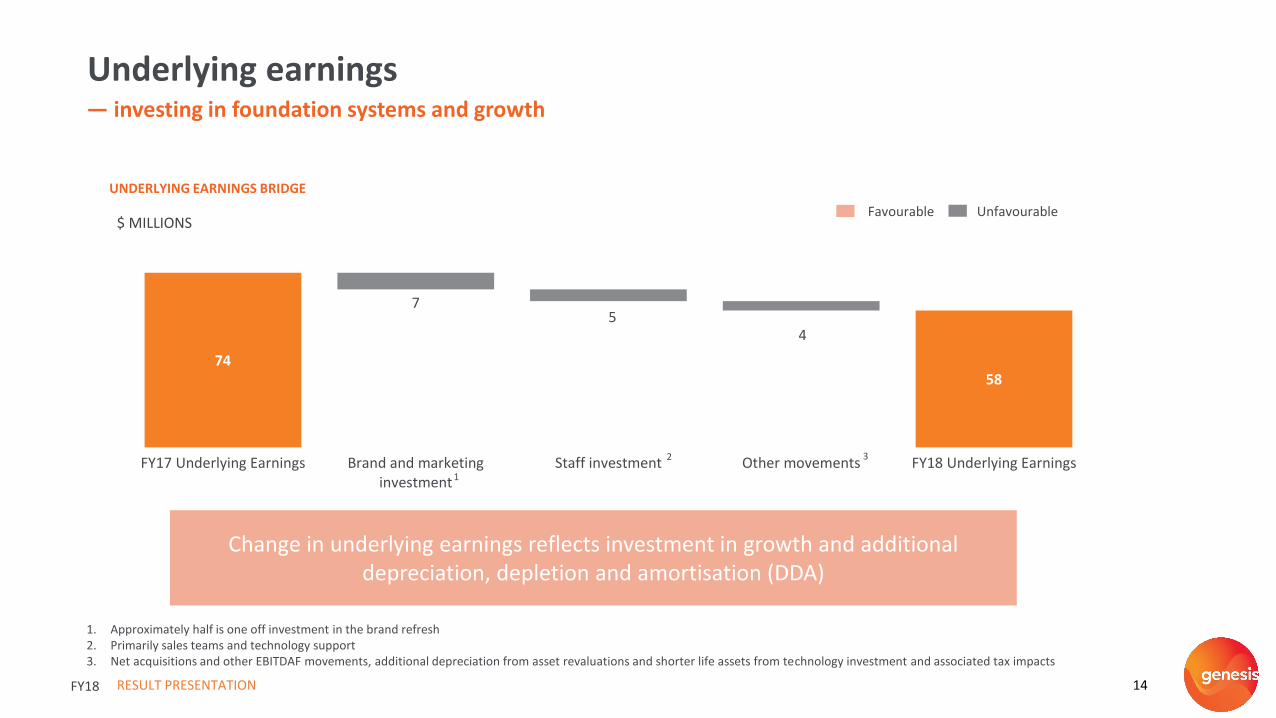
UNDERLYING EARNINGS BRIDGE
RESULT PRESENTATION 14
Underlying earnings— investing in foundation systems and growth
Favourable Unfavourable
Change in underlying earnings reflects investment in growth and additional depreciation, depletion and amortisation (DDA)
$ MILLIONS
FY18
7458
75
4
FY17 Underlying Earnings Brand and marketinginvestment
Staff investment Other movements FY18 Underlying Earnings1
3
1. Approximately half is one off investment in the brand refresh2. Primarily sales teams and technology support3. Net acquisitions and other EBITDAF movements, additional depreciation from asset revaluations and shorter life assets from technology investment and associated tax impacts
2
FY18 vs FY17 EBITDAF
$ MILLIONS
RESULT PRESENTATION 15
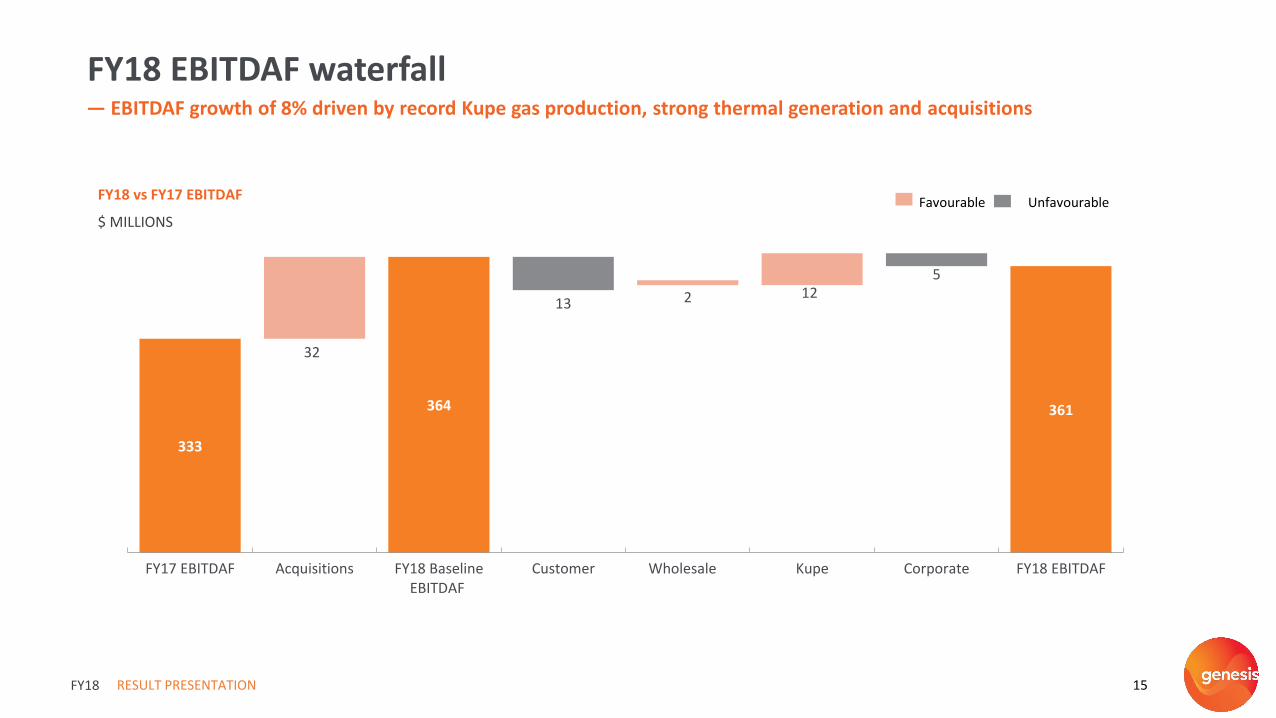
— EBITDAF growth of 8% driven by record Kupe gas production, strong thermal generation and acquisitions
FY18 EBITDAF waterfall
FY18
333
364 361
13
5
32
2 12
FY17 EBITDAF Acquisitions FY18 BaselineEBITDAF
Customer Wholesale Kupe Corporate FY18 EBITDAF
Favourable Unfavourable
84
115
1
19
7
3 3
FY17 EBITDAF Acquisition Higher volumeand prices
Crown royaltyrefund
FY17 M&A costs Other FY18 EBITDAF
RESULT PRESENTATION 16
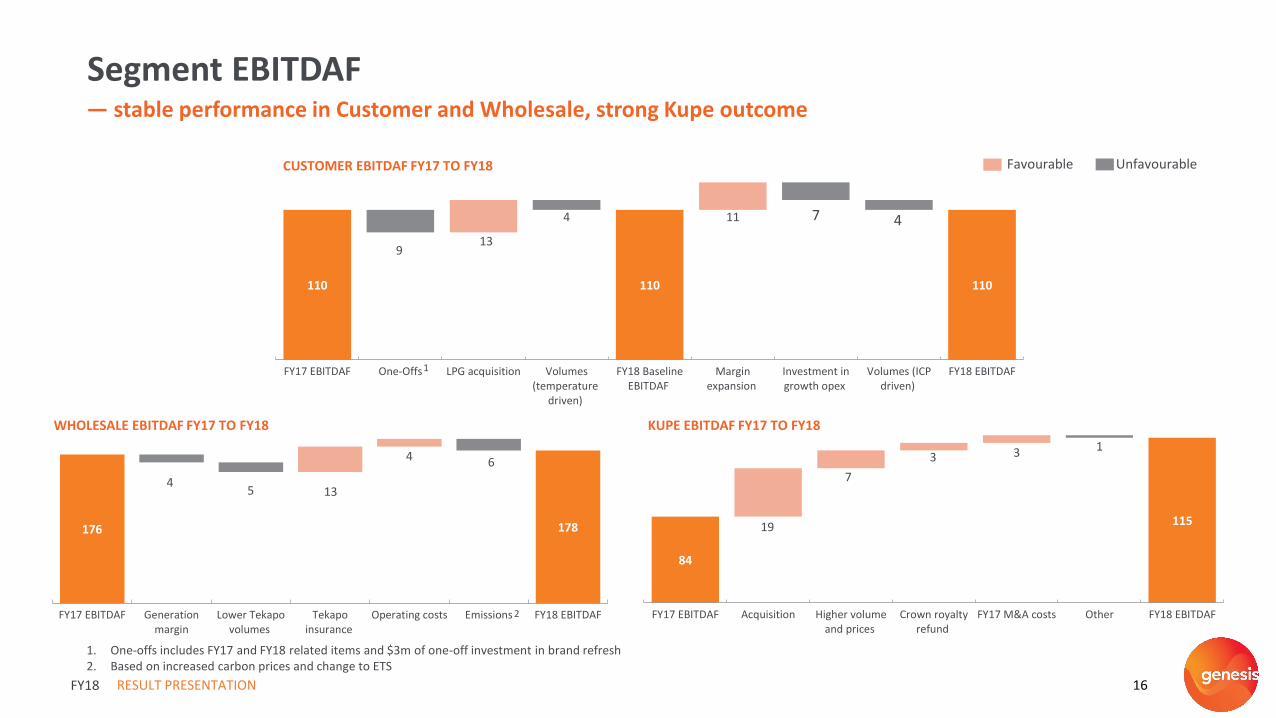
— stable performance in Customer and Wholesale, strong Kupe outcome
Segment EBITDAF
FY18
KUPE EBITDAF FY17 TO FY18
CUSTOMER EBITDAF FY17 TO FY18
WHOLESALE EBITDAF FY17 TO FY18
110 110 110
9
4 7 4
13
11
FY17 EBITDAF One-Offs LPG acquisition Volumes(temperature
driven)
FY18 BaselineEBITDAF
Marginexpansion
Investment ingrowth opex
Volumes (ICPdriven)
FY18 EBITDAF
176 178
45
6
13
4
FY17 EBITDAF Generationmargin
Lower Tekapovolumes
Tekapoinsurance
Operating costs Emissions FY18 EBITDAF
1
1. One-offs includes FY17 and FY18 related items and $3m of one-off investment in brand refresh2. Based on increased carbon prices and change to ETS
Favourable Unfavourable
2
328289 294 284 305
FY14 FY15 FY16 FY17 FY18
$ MILLIONS
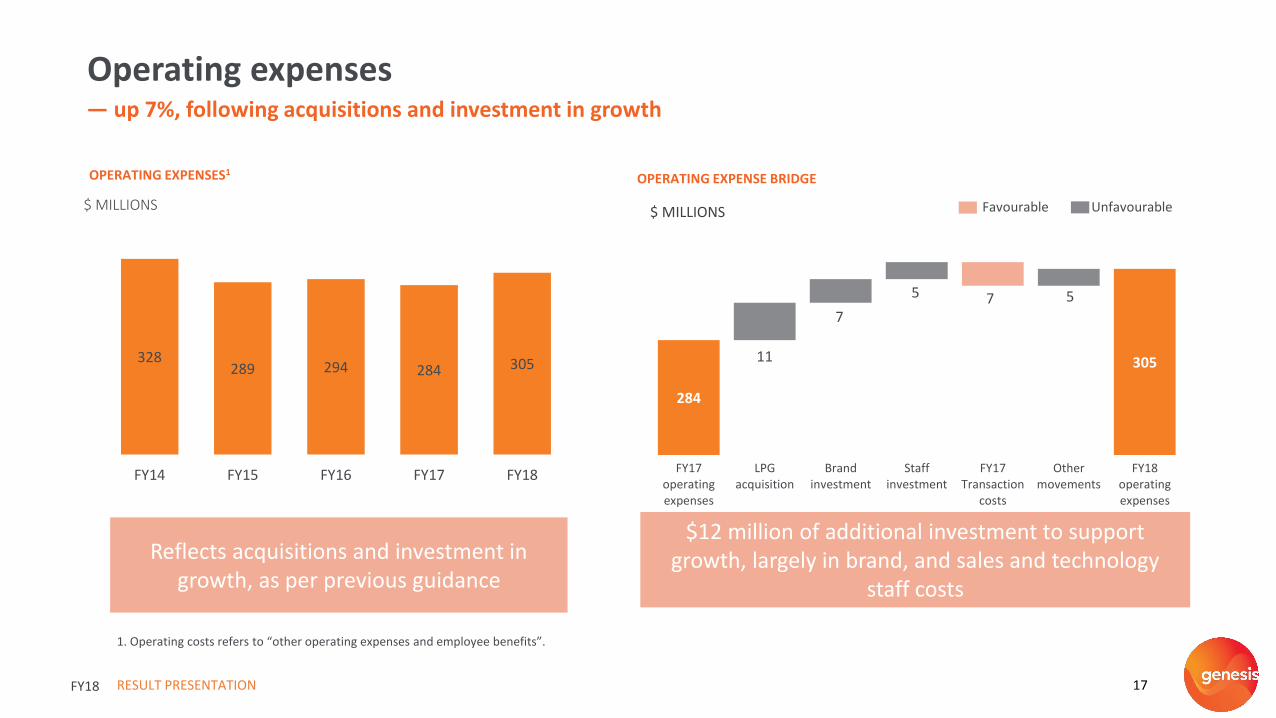
OPERATING EXPENSES1OPERATING EXPENSE BRIDGE
RESULT PRESENTATION 17
Operating expenses— up 7%, following acquisitions and investment in growth
$12 million of additional investment to support growth, largely in brand, and sales and technology
staff costs
Favourable Unfavourable
Reflects acquisitions and investment in growth, as per previous guidance
$ MILLIONS
1. Operating costs refers to “other operating expenses and employee benefits”.
FY18
284
30511
7
5 57
FY17operatingexpenses
LPGacquisition
Brandinvestment
Staffinvestment
FY17Transaction
costs
Othermovements
FY18operatingexpenses
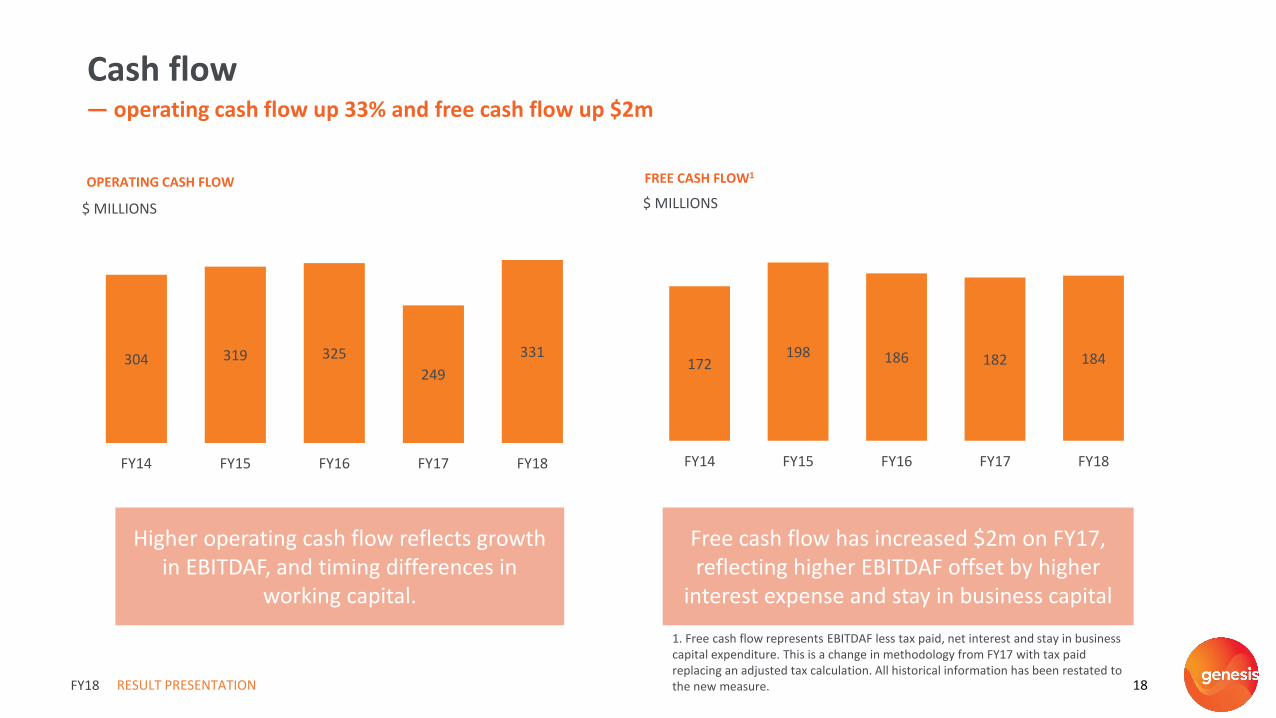
172198 186 182 184
FY14 FY15 FY16 FY17 FY18
$ MILLIONS
OPERATING CASH FLOW
304 319 325
249
331
FY14 FY15 FY16 FY17 FY18
$ MILLIONS
FREE CASH FLOW1
RESULT PRESENTATION 18
Cash flow— operating cash flow up 33% and free cash flow up $2m
Higher operating cash flow reflects growth in EBITDAF, and timing differences in
working capital.
Free cash flow has increased $2m on FY17, reflecting higher EBITDAF offset by higher
interest expense and stay in business capital
1. Free cash flow represents EBITDAF less tax paid, net interest and stay in business capital expenditure. This is a change in methodology from FY17 with tax paid replacing an adjusted tax calculation. All historical information has been restated to the new measure.FY18
RESULT PRESENTATION 19
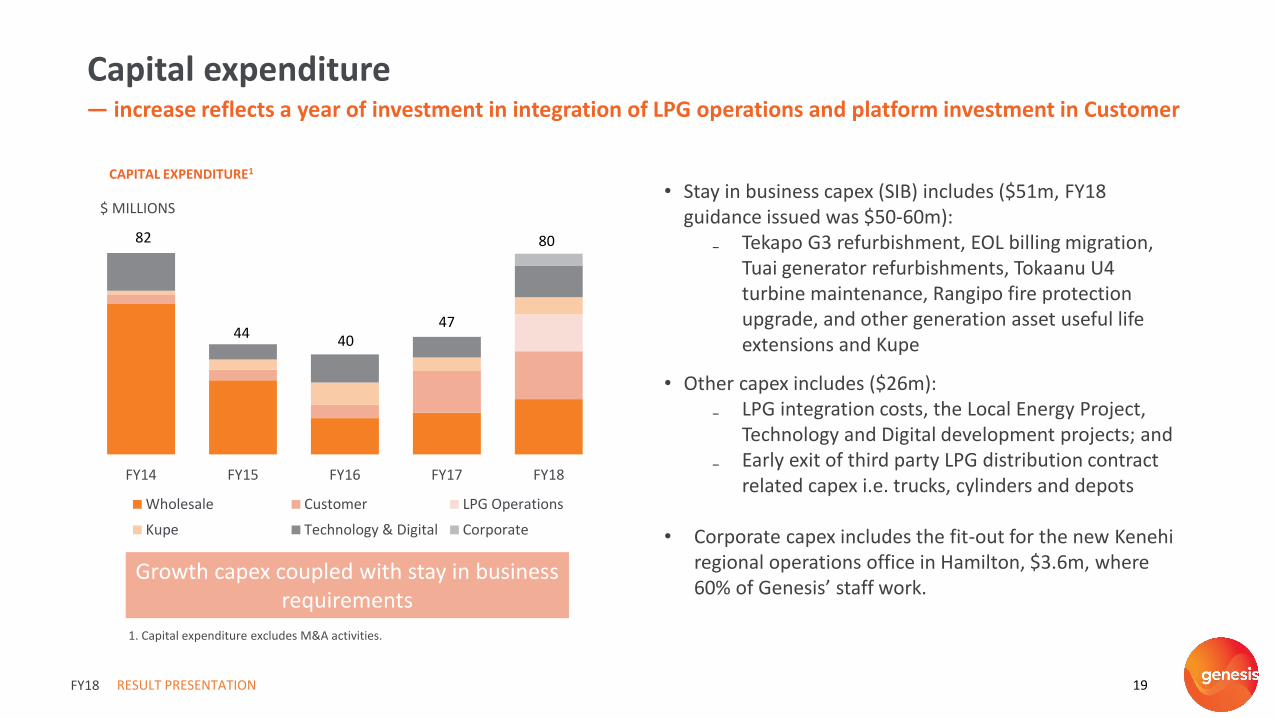
Capital expenditure— increase reflects a year of investment in integration of LPG operations and platform investment in Customer
Growth capex coupled with stay in business requirements
CAPITAL EXPENDITURE1
• Stay in business capex (SIB) includes ($51m, FY18 guidance issued was $50-60m):
₋ Tekapo G3 refurbishment, EOL billing migration, Tuai generator refurbishments, Tokaanu U4 turbine maintenance, Rangipo fire protection upgrade, and other generation asset useful life extensions and Kupe
• Other capex includes ($26m):₋ LPG integration costs, the Local Energy Project,
Technology and Digital development projects; and₋ Early exit of third party LPG distribution contract
related capex i.e. trucks, cylinders and depots
• Corporate capex includes the fit-out for the new Kenehiregional operations office in Hamilton, $3.6m, where 60% of Genesis’ staff work.
1. Capital expenditure excludes M&A activities.
FY14 FY15 FY16 FY17 FY18
Wholesale Customer LPG Operations
Kupe Technology & Digital Corporate
$ MILLIONS
82
44 4047
80
FY18
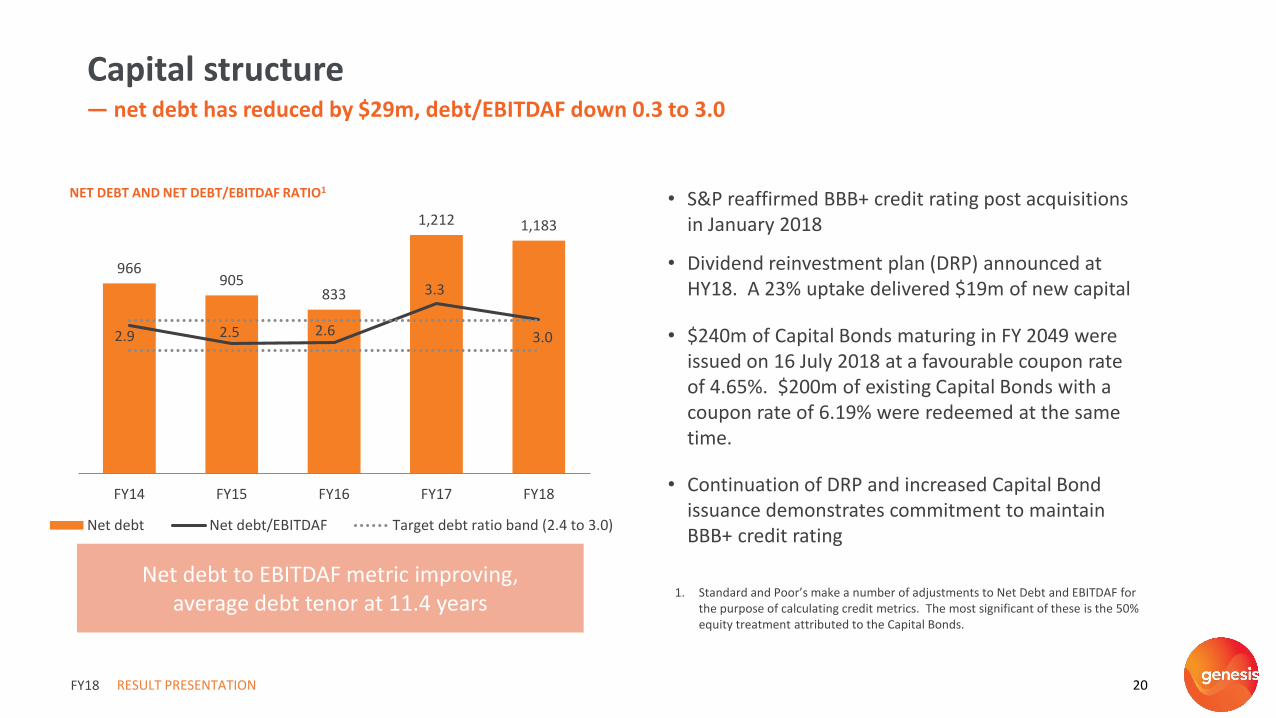
NET DEBT AND NET DEBT/EBITDAF RATIO1
966905
833
1,212 1,183
2.9 2.5 2.6
3.3
3.0
0.0
0.5
1.0
1.5
2.0
2.5
3.0
3.5
4.0
4.5
5.0
0
200
400
600
800
1000
1200
FY14 FY15 FY16 FY17 FY18
Net debt Net debt/EBITDAF Target debt ratio band (2.4 to 3.0)
RESULT PRESENTATION 20
Capital structure— net debt has reduced by $29m, debt/EBITDAF down 0.3 to 3.0
Net debt to EBITDAF metric improving, average debt tenor at 11.4 years
FY18
• S&P reaffirmed BBB+ credit rating post acquisitions in January 2018
• Dividend reinvestment plan (DRP) announced at HY18. A 23% uptake delivered $19m of new capital
• $240m of Capital Bonds maturing in FY 2049 were issued on 16 July 2018 at a favourable coupon rate of 4.65%. $200m of existing Capital Bonds with a coupon rate of 6.19% were redeemed at the same time.
• Continuation of DRP and increased Capital Bond issuance demonstrates commitment to maintain BBB+ credit rating
1. Standard and Poor’s make a number of adjustments to Net Debt and EBITDAF for the purpose of calculating credit metrics. The most significant of these is the 50% equity treatment attributed to the Capital Bonds.

3. Strategy Update and Outlook
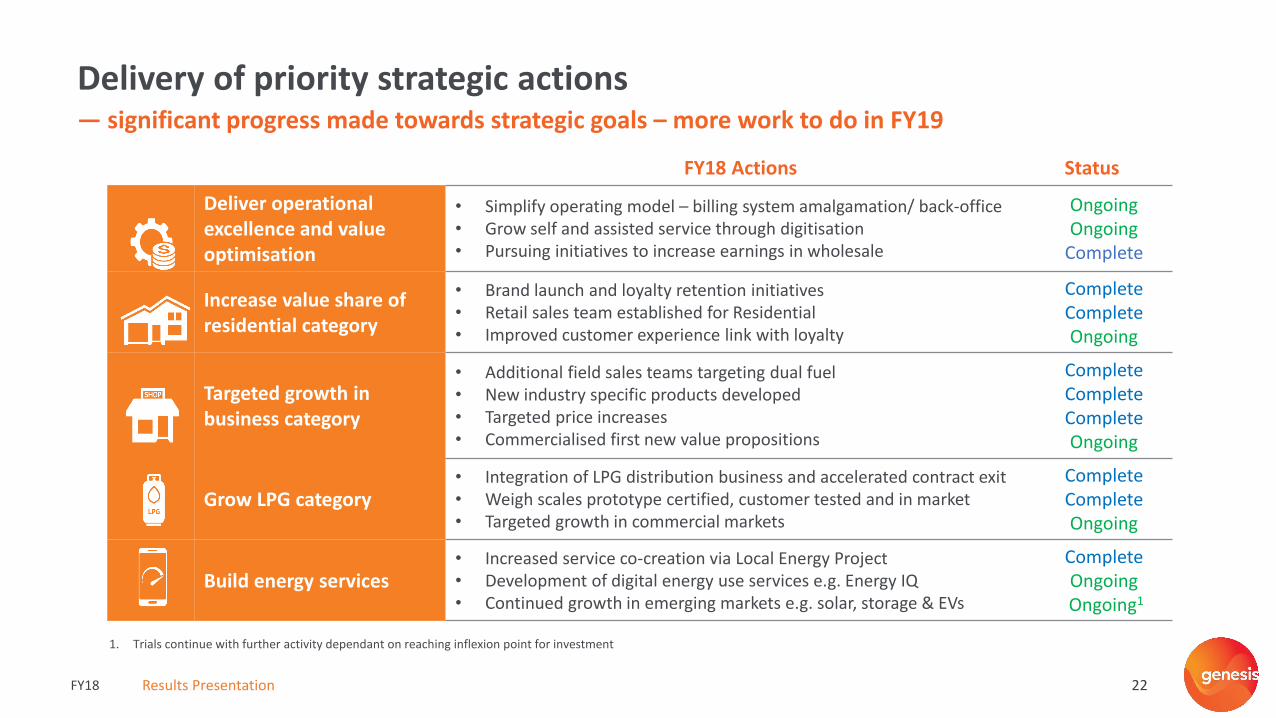
Delivery of priority strategic actions— significant progress made towards strategic goals – more work to do in FY19
22FY18 Results Presentation
FY18 Actions Status
Deliver operational excellence and value optimisation
• Simplify operating model – billing system amalgamation/ back-office• Grow self and assisted service through digitisation• Pursuing initiatives to increase earnings in wholesale
Ongoing Ongoing
Complete
Increase value share of residential category
• Brand launch and loyalty retention initiatives• Retail sales team established for Residential • Improved customer experience link with loyalty
Complete CompleteOngoing
Targeted growth in business category
• Additional field sales teams targeting dual fuel• New industry specific products developed • Targeted price increases • Commercialised first new value propositions
Complete CompleteComplete Ongoing
Grow LPG category• Integration of LPG distribution business and accelerated contract exit• Weigh scales prototype certified, customer tested and in market• Targeted growth in commercial markets
Complete CompleteOngoing
Build energy services• Increased service co-creation via Local Energy Project• Development of digital energy use services e.g. Energy IQ• Continued growth in emerging markets e.g. solar, storage & EVs
CompleteOngoingOngoing1
1. Trials continue with further activity dependant on reaching inflexion point for investment
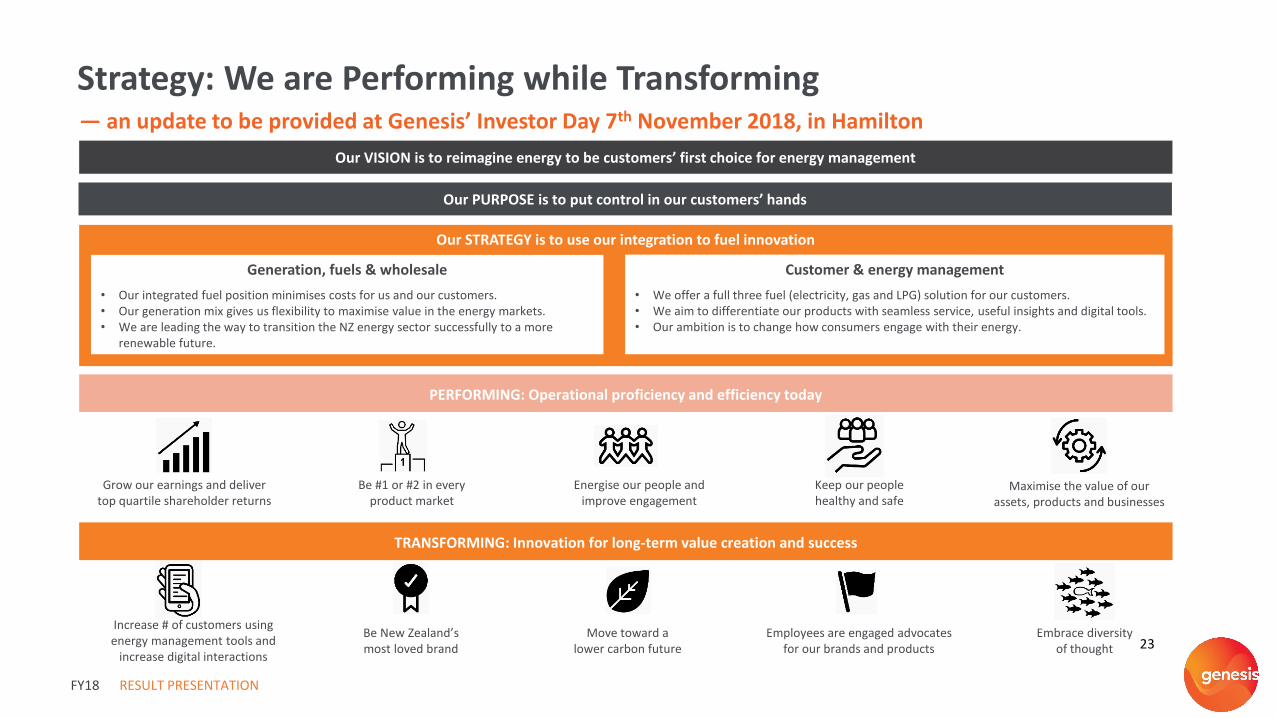
Strategy: We are Performing while Transforming
23
FY18 RESULT PRESENTATION
— an update to be provided at Genesis’ Investor Day 7th November 2018, in Hamilton
Our VISION is to reimagine energy to be customers’ first choice for energy management
Our PURPOSE is to put control in our customers’ hands
PERFORMING: Operational proficiency and efficiency today
TRANSFORMING: Innovation for long-term value creation and success
Increase # of customers using energy management tools and
increase digital interactions
Grow our earnings and deliver top quartile shareholder returns
Be #1 or #2 in every product market
Energise our people and improve engagement
Keep our people healthy and safe
Maximise the value of our assets, products and businesses
Embrace diversity of thought
Employees are engaged advocates for our brands and products
Move toward a lower carbon future
Be New Zealand’s most loved brand
Our STRATEGY is to use our integration to fuel innovation
Generation, fuels & wholesale
• Our integrated fuel position minimises costs for us and our customers. • Our generation mix gives us flexibility to maximise value in the energy markets.• We are leading the way to transition the NZ energy sector successfully to a more
renewable future.
Customer & energy management
• We offer a full three fuel (electricity, gas and LPG) solution for our customers.• We aim to differentiate our products with seamless service, useful insights and digital tools.• Our ambition is to change how consumers engage with their energy.
RESULT PRESENTATION 24
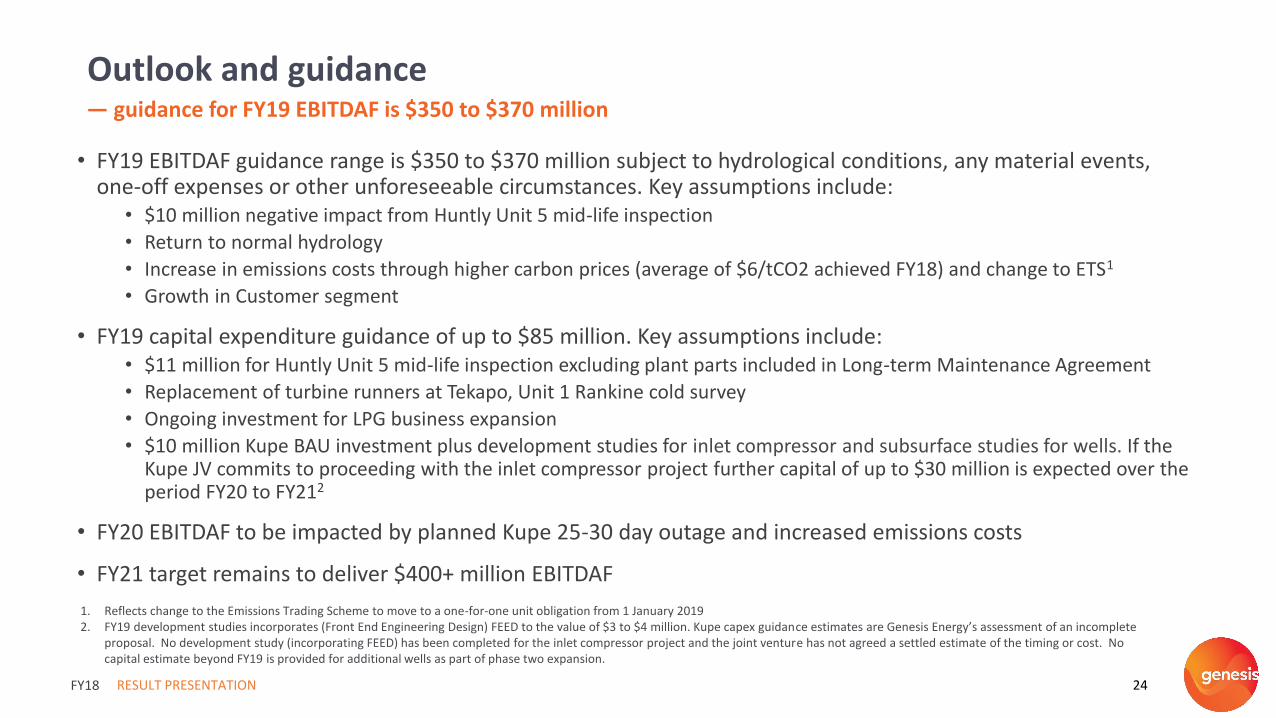
Outlook and guidance— guidance for FY19 EBITDAF is $350 to $370 million
• FY19 EBITDAF guidance range is $350 to $370 million subject to hydrological conditions, any material events, one-off expenses or other unforeseeable circumstances. Key assumptions include:
• $10 million negative impact from Huntly Unit 5 mid-life inspection
• Return to normal hydrology
• Increase in emissions costs through higher carbon prices (average of $6/tCO2 achieved FY18) and change to ETS1
• Growth in Customer segment
• FY19 capital expenditure guidance of up to $85 million. Key assumptions include:• $11 million for Huntly Unit 5 mid-life inspection excluding plant parts included in Long-term Maintenance Agreement
• Replacement of turbine runners at Tekapo, Unit 1 Rankine cold survey
• Ongoing investment for LPG business expansion
• $10 million Kupe BAU investment plus development studies for inlet compressor and subsurface studies for wells. If the Kupe JV commits to proceeding with the inlet compressor project further capital of up to $30 million is expected over the period FY20 to FY212
• FY20 EBITDAF to be impacted by planned Kupe 25-30 day outage and increased emissions costs
• FY21 target remains to deliver $400+ million EBITDAF
FY18
1. Reflects change to the Emissions Trading Scheme to move to a one-for-one unit obligation from 1 January 20192. FY19 development studies incorporates (Front End Engineering Design) FEED to the value of $3 to $4 million. Kupe capex guidance estimates are Genesis Energy’s assessment of an incomplete
proposal. No development study (incorporating FEED) has been completed for the inlet compressor project and the joint venture has not agreed a settled estimate of the timing or cost. No capital estimate beyond FY19 is provided for additional wells as part of phase two expansion.

4. Supplementary Information

Balance Sheet FY18($m)
FY17($m)
Variance
Cash and Cash Equivalents 49.3 27.8
Other Current Assets 343.8 344.5
Non-Current Assets 3,841.9 3,847.0
Total Assets 4,235.0 4,219.3 0.4%
Total Borrowings 1,255.4 1,259.8
Other Liabilities 1,018.1 977.6
Total Equity 1,961.5 1,981.9 (1.0%)
Adjusted Net Debt 1,182.9 1,211.5
Gearing per bank Covenants 32.4% 32.3%
EBITDAF Interest Cover 6.4x 6.6x
Net Debt/EBITDAF 3.0x 3.3x
Income Statement FY18($m)
FY17($m)
Variance
Revenue 2,304.5 1,951.1 18.1%
Total Operating Expenses (1,944.0) (1,618.6) 20.1%
EBITDAF 360.5 332.5 8.4%
Depreciation, Depletion & Amortisation (205.7) (174.6)
Impairment of Non-Current Assets (0.4) (2.4)
Revaluation of Generation Assets (48.8) 51.5
Fair Value Change (3.1) 22.6
Other Gains (Losses) (0.7) (1.6)
Earnings Before Interest & Tax 101.8 228.0 (55.4%)
Interest (74.3) (60.5)
Tax (7.7) (48.8)
Net Profit After Tax 19.8 118.7 (83.3%)
Earnings Per Share (cps) 1.98 11.88
Stay in Business Capital Expenditure 50.8 39.4 28.9%
Free Cash Flow1 183.7 181.6 1.2%
Dividends Per Share (cps) 16.9 16.6 1.8%
Dividends Declared as a % of FCF 92.4% 91.4% 1 ppt
Cash Flow Summary FY18($m)
HY17($m)
Variance($m)
Net Operating Cash Flow 330.6 248.5
Net Investing Cash Flow (82.2) (409.6)
Net Financing Cash Flow (226.9) 154.0
Net Increase (Decrease) in Cash 21.5 (7.1) 403%
RESULT PRESENTATION 26
Financial statements
FY18
1. Free cash flow represents EBITDAF less cash tax paid, net interest and stay in business capital expenditure. This is a change in methodology from FY17 with tax paid replacing an adjusted tax calculation. All historical information has been restated to the new measure.
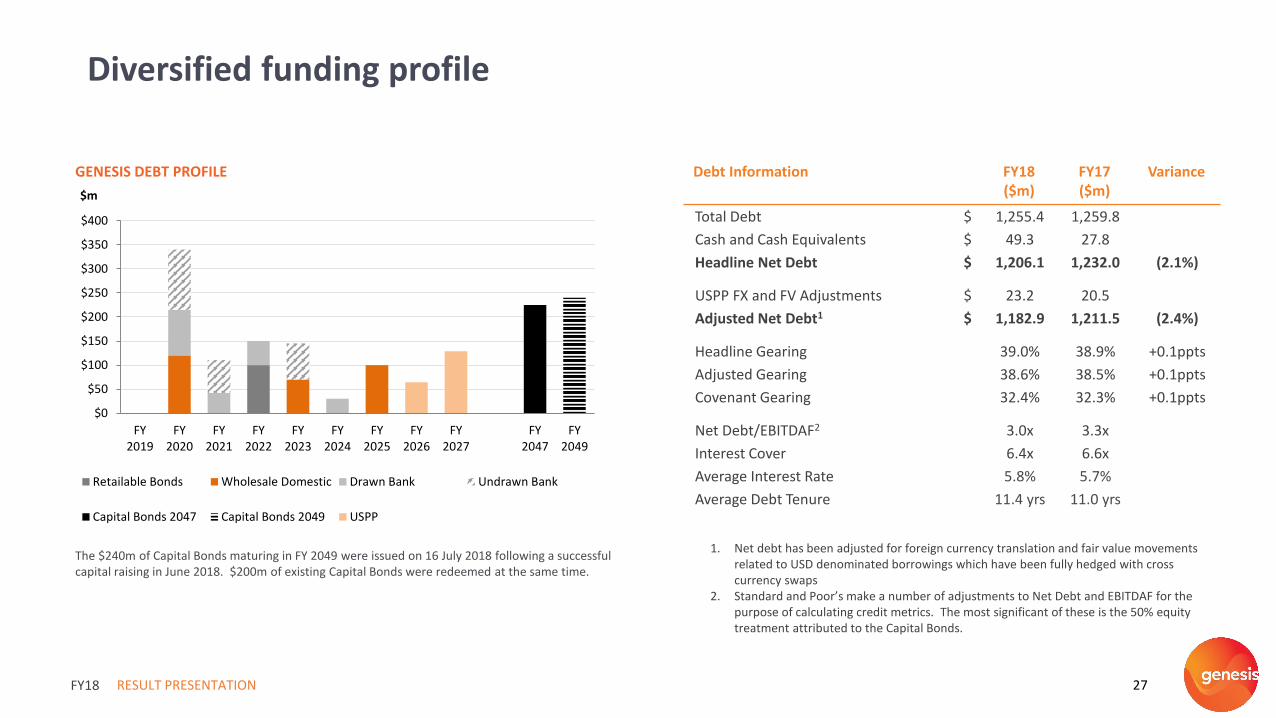
Debt Information FY18($m)
FY17($m)
Variance
Total Debt $ 1,255.4 1,259.8
Cash and Cash Equivalents $ 49.3 27.8
Headline Net Debt $ 1,206.1 1,232.0 (2.1%)
USPP FX and FV Adjustments $ 23.2 20.5
Adjusted Net Debt1 $ 1,182.9 1,211.5 (2.4%)
Headline Gearing 39.0% 38.9% +0.1ppts
Adjusted Gearing 38.6% 38.5% +0.1ppts
Covenant Gearing 32.4% 32.3% +0.1ppts
Net Debt/EBITDAF2 3.0x 3.3x
Interest Cover 6.4x 6.6x
Average Interest Rate 5.8% 5.7%
Average Debt Tenure 11.4 yrs 11.0 yrs
1. Net debt has been adjusted for foreign currency translation and fair value movements related to USD denominated borrowings which have been fully hedged with cross currency swaps
2. Standard and Poor’s make a number of adjustments to Net Debt and EBITDAF for the purpose of calculating credit metrics. The most significant of these is the 50% equity treatment attributed to the Capital Bonds.
GENESIS DEBT PROFILE
RESULT PRESENTATION 27
Diversified funding profile
FY18
The $240m of Capital Bonds maturing in FY 2049 were issued on 16 July 2018 following a successful capital raising in June 2018. $200m of existing Capital Bonds were redeemed at the same time.
$0
$50
$100
$150
$200
$250
$300
$350
$400
FY2019
FY2020
FY2021
FY2022
FY2023
FY2024
FY2025
FY2026
FY2027
FY2047
FY2049
$m
Retailable Bonds Wholesale Domestic Drawn Bank Undrawn Bank
Capital Bonds 2047 Capital Bonds 2049 USPP

Customer Key Information FY18 FY17 Variance
EBITDAF ($ millions) 109.8 109.6 +0.2%
Electricity Netback ($/MWh) $97.84 $102.84 (4.9%)
Gas Netback ($/GJ) $8.31 $8.65 (3.9%)
LPG Netback ($/t) $727.17 N/A
Electricity Only Customers 341,545 357,900
Gas Only Customers 18,444 19,134
LPG Only Customers 34,370 32,166
Customers with > 1 Fuel 109,767 104,586
Total Customers 504,126 513,786 (1.9%)
Total Electricity and Gas ICP’s 609,316 620,634 (1.8%)
Volume Weighted Average Electricity Selling Price – Resi ($/MWh)
$252.26 $251.44 +0.3%
Volume Weighted Average Electricity Selling Price – SME ($/MWh)
$216.66 $215.38 +0.6%
Volume Weighted Average Electricity Selling Price – C&I ($/MWh)
$121.46 $120.04 +1.2%
Volume Weighted Average Gas Selling Price ($/GJ)
$27.12 $27.14 (0.1%)
Customer Electricity Sales (GWh) 5,980 5,653 +5.8%
Customer Gas Sales (PJ) 7.5 7.4 +1.4%
Customer LPG Sales (tonnes) 35,005 8,287 +322.4%
Wholesale Key Information FY18 FY17 Variance
EBITDAF ($ millions) 178.0 176.1 +1.1%
Renewable Generation (GWh) 3,056 3,154 (3.1%)
Thermal Generation (GWh) 4,049 3,268 +23.9%
Total Generation (GWh) 7,105 6,422 +10.6%
GWAP ($/MWh) 91.59 60.63 +51.1%
LWAP/GWAP Ratio 101% 100% +1 ppts
Weighted Average Fuel Cost ($/MWh) 37.91 32.54 +16.5%
Coal/Gas Mix (Rankines only) 63/37 41/59
Kupe Key Information FY18 FY17 Variance
EBITDAF ($m) 115.3 84.4 +36.6%
Gas Sales (PJ) 12.1 9.3 +30.1%
Oil Production (kbbl) 533 476 +12.0%
Oil Sales (kbbl) 533 507 +5.1%
LPG Sales (kt) 46.1 32.1 +43.6
Remaining Kupe Reserves (2P, Pje)1 351.1 373.1 +14.2
Average Brent Crude Oil (USD/bbl) 64 50 +28.0%
Average Hedged Price (USD/bbl) 58 57 +1.8%
RESULT PRESENTATION 28
Operational highlights
FY18
1. FY18 remaining reserves include FY18 production of 36.2 Pje, and represent a 4% increase in total reserves in FY18 (14 PJe).
RESULT PRESENTATION 29
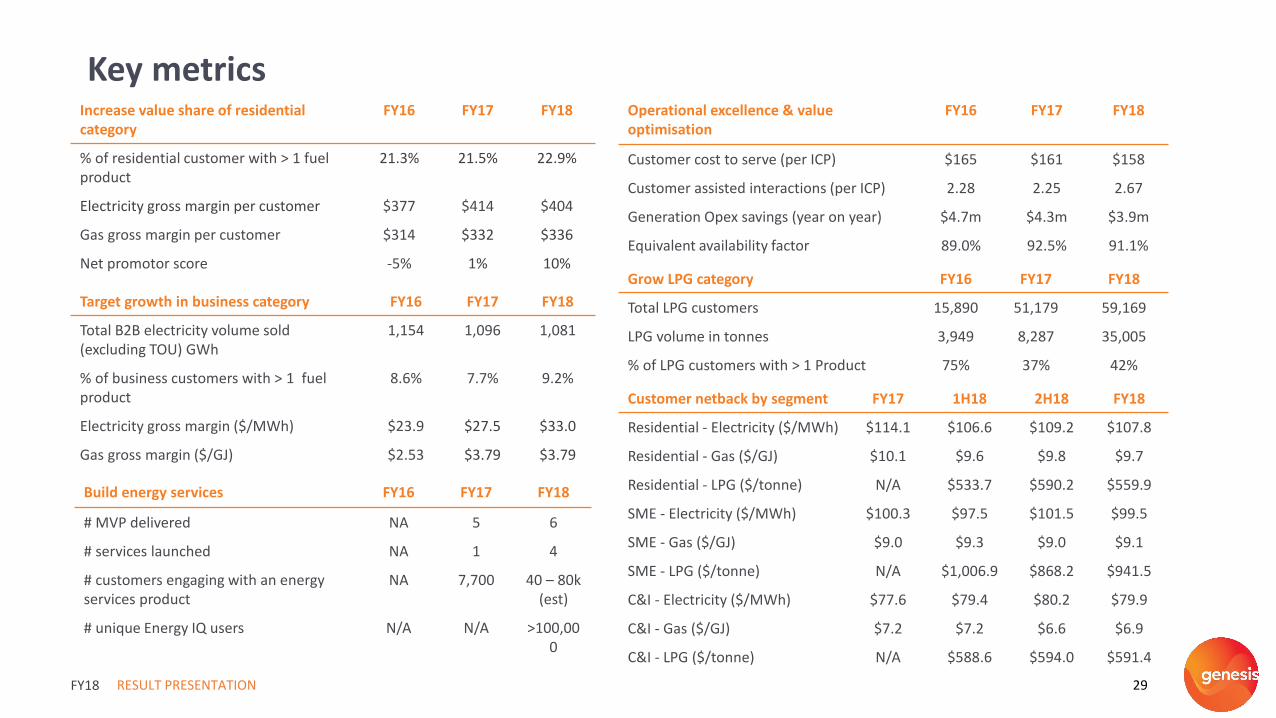
Key metrics
FY18
Operational excellence & value optimisation
FY16 FY17 FY18
Customer cost to serve (per ICP) $165 $161 $158
Customer assisted interactions (per ICP) 2.28 2.25 2.67
Generation Opex savings (year on year) $4.7m $4.3m $3.9m
Equivalent availability factor 89.0% 92.5% 91.1%
Increase value share of residential category
FY16 FY17 FY18
% of residential customer with > 1 fuel product
21.3% 21.5% 22.9%
Electricity gross margin per customer $377 $414 $404
Gas gross margin per customer $314 $332 $336
Net promotor score -5% 1% 10%
Target growth in business category FY16 FY17 FY18
Total B2B electricity volume sold (excluding TOU) GWh
1,154 1,096 1,081
% of business customers with > 1 fuel product
8.6% 7.7% 9.2%
Electricity gross margin ($/MWh) $23.9 $27.5 $33.0
Gas gross margin ($/GJ) $2.53 $3.79 $3.79
Grow LPG category FY16 FY17 FY18
Total LPG customers 15,890 51,179 59,169
LPG volume in tonnes 3,949 8,287 35,005
% of LPG customers with > 1 Product 75% 37% 42%
Build energy services FY16 FY17 FY18
# MVP delivered NA 5 6
# services launched NA 1 4
# customers engaging with an energy services product
NA 7,700 40 – 80k (est)
# unique Energy IQ users N/A N/A >100,000
Customer netback by segment FY17 1H18 2H18 FY18
Residential - Electricity ($/MWh) $114.1 $106.6 $109.2 $107.8
Residential - Gas ($/GJ) $10.1 $9.6 $9.8 $9.7
Residential - LPG ($/tonne) N/A $533.7 $590.2 $559.9
SME - Electricity ($/MWh) $100.3 $97.5 $101.5 $99.5
SME - Gas ($/GJ) $9.0 $9.3 $9.0 $9.1
SME - LPG ($/tonne) N/A $1,006.9 $868.2 $941.5
C&I - Electricity ($/MWh) $77.6 $79.4 $80.2 $79.9
C&I - Gas ($/GJ) $7.2 $7.2 $6.6 $6.9
C&I - LPG ($/tonne) N/A $588.6 $594.0 $591.4

RESULT PRESENTATION 30
Additional disclosures
FY18
0
5
10
15
20
25
30
35
40
FY19 FY20 FY21 FY22 FY23 FY24 FY25 FY26
PJ
TAKE-OR-PAY FORWARD GAS PURCHASES1
1. Represents gas contracts under which Genesis is required to take the product or pay a penalty. Includes Kupe and Producer Price Index adjustments
CARBON HEDGE POSITION
$8.00 -$9.00
$8.00 -$9.00
$8.00 -$9.00 $8.50 -
$9.50
$8.50 -$9.50
$8.50 -$9.50
$7.50 -$8.50
FY18 FY19 FY20 FY21 FY22 FY23 FY24 FY25
NZU
nit
sas
% o
f p
ote
nti
al e
xpo
sure
Hedged Emission Unhedged Volume
$6 $9-14 $15-20 $17-22 $17-22 $19-24 $20-25 $20-25
Estimated price per unit (NZD/NZU)
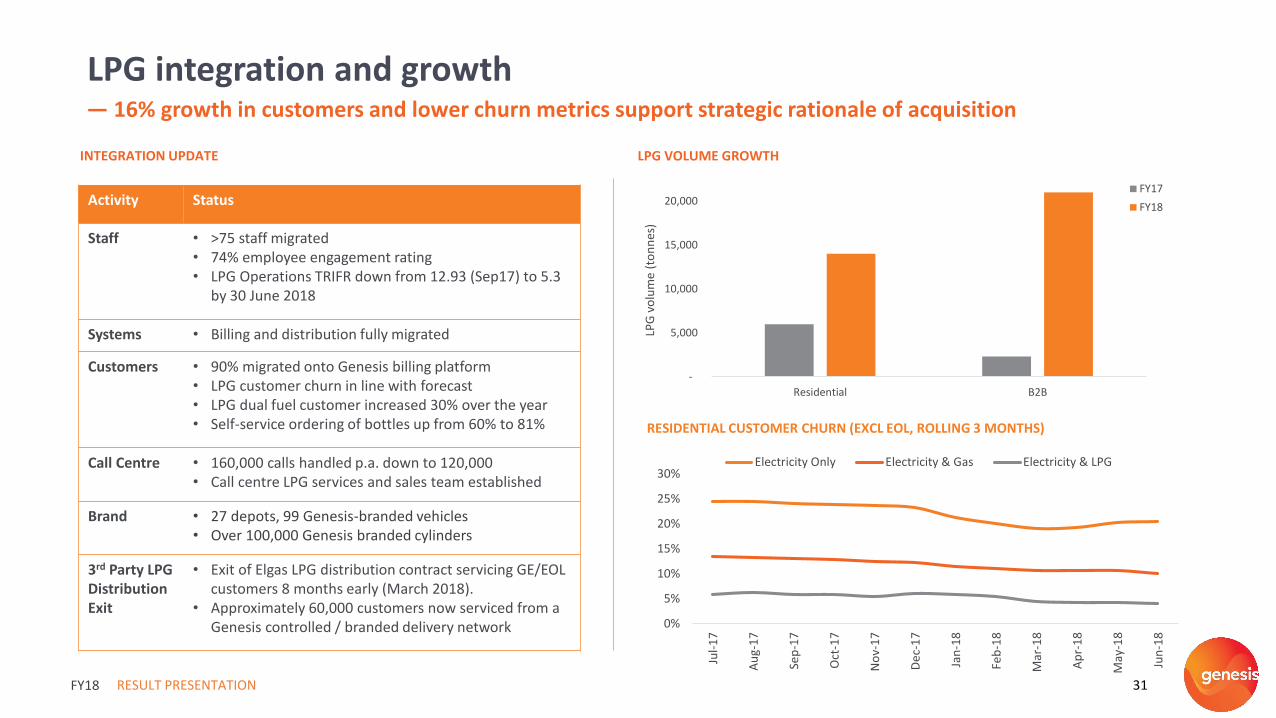
LPG VOLUME GROWTH
RESULT PRESENTATION 31
LPG integration and growth— 16% growth in customers and lower churn metrics support strategic rationale of acquisition
FY18
RESIDENTIAL CUSTOMER CHURN (EXCL EOL, ROLLING 3 MONTHS)
Activity Status
Staff • >75 staff migrated• 74% employee engagement rating• LPG Operations TRIFR down from 12.93 (Sep17) to 5.3
by 30 June 2018
Systems • Billing and distribution fully migrated
Customers • 90% migrated onto Genesis billing platform• LPG customer churn in line with forecast• LPG dual fuel customer increased 30% over the year• Self-service ordering of bottles up from 60% to 81%
Call Centre • 160,000 calls handled p.a. down to 120,000• Call centre LPG services and sales team established
Brand • 27 depots, 99 Genesis-branded vehicles• Over 100,000 Genesis branded cylinders
3rd Party LPG Distribution Exit
• Exit of Elgas LPG distribution contract servicing GE/EOL customers 8 months early (March 2018).
• Approximately 60,000 customers now serviced from a Genesis controlled / branded delivery network
INTEGRATION UPDATE
0%
5%
10%
15%
20%
25%
30%
Jul-
17
Au
g-1
7
Sep
-17
Oct
-17
No
v-1
7
De
c-1
7
Jan
-18
Feb
-18
Mar
-18
Ap
r-1
8
May
-18
Jun
-18
Electricity Only Electricity & Gas Electricity & LPG
-
5,000
10,000
15,000
20,000
Residential B2B
LPG
vo
lum
e (t
on
nes
)
FY17
FY18