fy19 business review - consolidated v5 (paces west
TRANSCRIPT

“Our strong full-year results and ability to deliver on several strategic initiatives demonstrate Investcorp’s
resilience and focus on strategic growth and profitability goals, despite various economic and geopolitical
challenges. This is attributable to our relentless efforts in globalizing our products and distribution platform,
while remaining responsive to our clients’ demands and needs. Our expansion into new geographies,
such as China and India, and new products, such as direct lending and infrastructure, is mirrored by similar
ambitions in diversifying our client base, both by geography and segment.
Our ambitious growth strategy of reaching $50 billion in AUM over the medium term is unchanged as we
remain focused on delivering profitable growth, while retaining a prudent approach to balance sheet and
liquidity management. We are well-positioned to continue delivering superior shareholder value and
interesting investment opportunities for our clients.”
Mohammed Alardhi
Business Review Fiscal Year 2019 For the period July 1, 2018 to June 30, 2019

Business Highlights 1
Business Environment 10
Discussion of Results 31
Investment Activity 40
Realizations & Distributions 46
AUM & Fundraising 55
Portfolio Performance 59
PE Portfolio Listing 69
Figures throughout may not add up due to rounding
BUSINESS HIGHLIGHTS | 1
Business Highlights
Growth initiatives
A number of strategic initiatives have been completed and several are well underway to realize
Investcorp’s medium-term objective of more than doubling assets under management, including:
Inorganic growth:
Completed the acquisition of a strategic minority stake in Banque Pâris
Bertrand, an independent private bank based in Geneva and
Luxembourg
Opened an office in India with the launch of Investcorp India Asset
Managers Limited, following the acquisition of the private equity and real
estate funds businesses of IDFC Alternatives Limited in India
Announced the acquisition of a majority interest in CM Investment
Partners, an investment advisor focused on middle market lending in the
United States (expected to close in FY20, subject to receipt of relevant
regulatory approval)
Announced a definitive agreement to acquire Mercury Capital Advisors,
one of the world’s leading institutional capital raising and investment
advisory enterprises (expected to close in FY20, subject to receipt of
relevant regulatory approval)
Fundraising platform:
Placed first private equity deal, United Talent Agency, wholly in the United
States
Successfully closed a $185 million continuation vehicle with HarbourVest
Closed a secondary transaction with Coller Capital to create a European
private equity buyout fund of approximately $1 billion
Completed the $403 million final close of the Firm’s fourth technology
fund
Investment platform:
Announced the Firm’s first private equity investment in China, in
partnership with China Everbright Limited
Successfully launched a joint venture with Aberdeen Standard
Investments, that will invest in social and core infrastructure projects in
the Gulf and MENA region

BUSINESS HIGHLIGHTS | 2
Robust levels of activity with
$2.9 billion of aggregate
investment across Investcorp’s
businesses, a 2% year-on-year
increase
A record level of deal-by-deal
placement of $1.4 billion was
achieved, reflecting strong client
demand in both private equity
and real estate
Distributions to Investcorp and its
clients from investment realizations
and other distributions increased to
$4.0 billion

BUSINESS HIGHLIGHTS | 3
The rise in profit for the year is
predominantly attributable to higher fee
income and lower interest expense
partially offset by lower asset-based
income and an increase in operating
expenses.
Interest expense decreased by 9% due
to a combination of lower average
drawn balances and a lower spread.
The cost-to-income ratio remained
stable at 65% with operating expenses
increasing in line with income
Asset-based income decreased to
$106 million primarily driven by lower
private equity returns
Fee income is up 17% versus fee
income for the prior year, with growth in
both AUM fees as well as in deal fees

BUSINESS HIGHLIGHTS | 4
Shareholder KPIs
Balance sheet KPIs
Jun-18 Jun-19
$2.5b $2.4b Total assets decreased primarily due to lower co-investments driven by exits
$1.1b $1.1b Total equity stable
$1.0b $1.1b Accessible liquidity substantially covers all outstanding medium-term debt
0.5x 0.4x Net leverage remains well below 1.0x
31.5% 33.8% Basel III regulatory capital well above CBB minimum requirements
0.7x 0.5x Co-investments / permanent & long-term capital well below 1.0x
Fully diluted EPS
Return on equity
Book value per share
$1.47
12%
$13.26

BUSINESS HIGHLIGHTS | 5
Fundraising ($ millions)
Private equity
Real estate
Absolute returns investments
Credit management
$1,869
$639
$1,212
$2,007
Total fundraising was $5.7 billion (FY18:
$3.5 billion)
$742 million placed with clients in private
equity investments, including the Firm’s first
China- and India-focused offerings
$77 million raised for the fourth technology
fund, $1.1 billion raised through two
secondary transactions with Coller Capital
and HarbourVest Partners
$639 million placed with clients across six
new real estate portfolios
$1.2 billion of new subscriptions for ARI
$1.8 billion raised for four new CLOs
$125 million of inflows for senior secured
loan funds
$86 million for a CLO Risk retention
vehicle
$35 million for a new Credit Opportunities
Portfolio product

BUSINESS HIGHLIGHTS | 6
Total AUM ($ billions)
PE PE
RERE
ARIARI
CMCM
OtherOther
FY18 FY19
$26.3b$28.2b
Private equity AUM has increased 21% to $5.8 billion, reflecting the well supported
deal-by-deal fundraising during the year, including for the Firm’s first China- and
India-focused investment offerings
Real estate AUM increased by 4% during the year to $6.1 billion primarily due to the
strong fundraising for new portfolios partially offset by a good pace of realizations of
older properties. During the course of the year the Firm adopted prevailing market
practices for calculating AUM for the real estate business by considering the market
value of the managed assets
ARI AUM has increased by 2% to $3.8 billion, primarily due to strong fundraising for
the Firm’s hedge fund partnerships partially offset by the anticipated roll off of older,
less profitable AUM
Credit management AUM increased by 4% to $11.8 billion primarily due to the
issuance of four new CLO's and subscriptions into open-ended funds

BUSINESS HIGHLIGHTS | 7
Investment Activity
$750 million…
…the aggregate capital deployed in six new
private equity investments, one special
opportunity portfolio investment, IDFC
Private Equity Fund IV and five existing
portfolio companies
$670 million…
…the aggregate capital deployed
in five new real estate
portfolios
Jamestown CLO XI
(Warehoused from FY18)
$71 million
Jamestown CLO XII
(Warehoused from FY18)
$366 million
Harvest CLO XX
(Warehoused from FY18)
€252 million
Harvest CLO XXI
€398 million
Jamestown XIV
(Warehoused)
$40 million
Harvest CLO XXII
(Warehoused)
€200 million
Harvest CLO XXIII
(Warehoused)
€34 million
$1.5 billion…
… the aggregate investment in three
carried forward CLO’s & four new CLO’s
for the credit management business

BUSINESS HIGHLIGHTS | 8
Exits & Distributions
Private equity exits included the sale of Nobel Learning Communities, a leading provider of
private education in the US; the sale of Gulf Cryo, a leading manufacturer, distributor and
services provider of industrial gases; the sale of The Wrench Group, a national leader in home
maintenance and repair services in the US; the IPO of Leejam, a leading fitness chain operator
in Saudi Arabia; the signing of an agreement to sell SecureLink Group, a leading
cybersecurity infrastructure and managed services provider in Europe; the sale of three
companies – ATC Telecom Infrastructure Limited, Deepak Cables (India) Limited and
Manipal Integrated Services – from the portfolio of the newly acquired Indian business; and
the secondary sale of the remaining portfolio companies in Investcorp Technology III L.P to
HarbourVest (Investcorp Technology Partners will continue to manage the assets)
Significant real estate exits included the realizations of six portfolios: 2015 Residential I
Portfolio (with the sale of Fairways at Towson); National Hotel Portfolio (with the sale of
Newark Hilton); 2014 Office and Industrial Portfolio (with the sale of Highlands Campus
Tech); 2013 Commercial Properties Portfolio and 2014 Office (with the sale of Oracle &
International Centre); and Villas at Green Valley
Total realization proceeds and other distributions to Investcorp and its clients were $4.0 billion,
including $1.0 billion related to the credit management business.

BUSINESS HIGHLIGHTS | 9
Investcorp’s key performance indicators:
FY15 FY16 FY17 FY18 FY19 5-year view
(FY15-FY19)
Fee income ($m) 308 307 320 321 376 1632 (cumulative)
Asset-based income ($m) 73 76 102 133 106 494 (cumulative)
Gross operating income ($m) 381 383 422 454 465 2105 (cumulative)
Cost-to-income ratio 64% 71% 65% 65% 65% 66% (average)
Return on average assets 5% 4% 5% 5% 5% 5% (average)
Return on ordinary shareholders’ equity
16% 10% 12% 11% 12% 12% (average)
Diluted earnings per share ($)* 1.29 0.94 1.25 1.30 1.47 6.25 (cumulative)
Book value per share ($)* 9.00 10.15 11.10 12.13 13.26 47% (cumulative
growth)
Dividend per ordinary share ($)* 0.15 0.24 0.24 0.24 0.30 1.17 (cumulative)
* The weighted average ordinary shares and the resulting metrics for FY15 have been realigned to reflect the share split executed in FY16

BUSINESS ENVIRONMENT | 10
Business Environment
Measures of global economic activity have continued to decelerate since March 2019, as can be seen below.
Global growth for 2019 is now expected to be slightly above 2.5%, significantly below IMF forecasts for the year.
The slowdown has been particularly acute in the manufacturing and traded sectors, where the lagged effect of
heightened policy uncertainty, last year’s Chinese deleveraging, and higher US interest rates is taking its toll on
sentiment and business investment decision-making.
Global GDP Aggregate Nowcast
Source: Investcorp, Goldman Sachs, Morgan Stanley & Macrobond
The services sector, in contrast, has been somewhat buoyant, bolstered by the resilient US consumer, as indicated
by the two charts below. Low unemployment, decent real wage growth, and a high savings ratio remain tailwinds
for the segment. Still, a sustained downtrend in manufacturing could have a more far-reaching effect, which may
already be evident in the recent services gauge decline. That said, this year’s policy shifts by the Federal Reserve
and the Chinese leadership may well brighten the outlook for manufacturing, assuming the rising US trade frictions
don’t tip the sector into outright recession first. Should this happen, it could be expected that the rest of the economy
would likely fall into line and hopes for a further extension of the current cycle could quickly evaporate.
World, GDP, IMF WEO, Estimate, Constant Prices, Change Y/Y
World GDP Grow th Now cast
YoY Change (%)

BUSINESS ENVIRONMENT | 11
US Leading Economic Indicators – Manufacturing vs. Services
Source: Investcorp
US Economic Leading Indicators – Consumer vs. Corporate
Source: Investcorp
In Europe, the ongoing slide in macroeconomic momentum is showing tentative signs of reaching its nadir; as can
be seen in the following chart, capital spending expectations have recently staged a slight rebound. Nevertheless,
the situation remains fragile and the calendar going forward is laden with potential negative catalysts. Among other
things, the ratification of Boris Johnson as the UK’s next Prime Minister has raised the risk of a disorderly “no deal”
Brexit, while in Italy, the summer lull could prove short-lived when the government begins negotiations in the fall
regarding its 2020 budget.
Serv ices [pc1, Model 2]
Manuf acturing [pc 1, Model 1]
IVC Consumer Sentiment Factor [pc 1, Model 2, m.a. 1 quarter]
IVC US Corporate Sentiment Factor [pc 1, Model 1, m.a. 1 quarter]
Leading indicator index
Sentiment index

BUSINESS ENVIRONMENT | 12
Percentage Points
Percentage Points
Europe Capex Expectations
Euro area, Economic Situation Surveys, Ifo, World Economic Climate, Economic situation in the next 6 months
Source: Investcorp
Finally, the risks of further trade-related woes have not disappeared. President Donald Trump has kept his options
open regarding the previously announced Section 232 investigation into Europe’s automobile sector, while
measures aimed at retaliating against increased European taxation and regulation of large US tech firms are also
on the table.
With respect to global inflation dynamics – the US gauge is featured below – Investcorp anticipates that
expectations will stabilize and gradually firm from where they are now. As evidenced by communications from the
Fed and other central banks, policymakers are committed to engineering, through whatever means are necessary,
a reflationary process that will alleviate some of the risks associated with rates being pegged near the zero-lower
bound.
US Inflation Measures
Source: Investcorp
Consumer Price Index, All Urban Consumers, U.S City Average, All Items [c.o.p. 1 year]Consumer Price Index, All Urban Consumers, U.S City Average, All Items Less Food & Energy [c.o.p. 1 year]Personal Consumption Expenditures, Excluding Food & Energy Price Index [ c.o.p. 1 year]

BUSINESS ENVIRONMENT | 13
Consumer Price Index, All Urban Consumers, U.S City Av erage, All Items Less Food & Energy , SA, Ihs [c.o.p. 1 y ear]
One-Sided, Output Gap, Federal Reserv e Bank of New York, Laubach-Williams Natural Rate of interest Estimates
Percentage Points %
\Lending further weight, output gaps in the US, highlighted in the first chart below, as well as globally, remain in or
near positive territory, and industry surveys continue to point to limited slack in the economy. The American job
market, in particular, is nearing historically high levels of tightness, as can be seen in the second chart. Even
assuming that the Philip’s curve becomes flatter, these factors will likely spur, in the medium term, a normalization
of inflation toward the US central bank’s target. Moreover, the suggestion in recent policymaker communications
of a willingness to run the economy “hot” and allow for an overshoot of targets to compensate for persistent
undershooting in the past suggests that central bankers are more sanguine than normal about the risks to the
upside, at least in the near term. Against this backdrop, it appears that central banks will seek to target an average
inflation rate throughout the cycle, allowing for periodic overshoots following downturns.
US CPI and Output Gap
Source: Investcorp
US Labour Market Tightness Indicator
Source: Investcorp
United States [pc 1]

BUSINESS ENVIRONMENT | 14
Despite the more dovish stance, it is yet to be seen whether the new framework will spur a reorientation of long-
term inflation expectations. Inflation still faces structural headwinds that are difficult to quantify, including the effects
of technological innovation and globalization. Taken together, however, Investcorp believes the various dynamics
will engender a slightly higher path for inflation in coming quarters. Such an outcome will likely be welcomed by
developed market central banks and governments alike, especially in Europe, where social disturbances in France
and Italy continue to suggest a need to ease the pressures through higher nominal wages. These are expected to
feed into higher prices down the line.
Private Equity – North America and Europe
In the US, 2018 was another record-setting year for both deal value and transaction count. In Q1 2019, 649 middle
market transactions were completed, totaling $75.1 billion in deal value – a 17.9% decrease in number of
transactions and a 32.6% decrease in total value compared to the prior year. The large decrease in total value
signals a shift toward smaller transactions being completed. The median middle market deal size was $155.0
million in Q1 2019, down from the $192.0 million median middle market deal size for the full year 2018. Investment
in technology continues to grow and accounted for 27.1% of total deal value in Q1 2019. Multiples in the US remain
high due to increased competition among PE firms in the middle-market space.
US PE deal flow by year
*As of March 31, 2019. Unknown values are estimated based on known figures. Source: Pitchbook 1Q 2019 US Breakdown Report
According to Pitchbook, in Europe, deal flow in Q1 2019 continued to slow down after 2018’s record showing. With
674 deals estimated to be completed and totaling to €65.7 billion during the first three months of the year, overall
count is down approximately 26.8% compared to the same period in 2018. Deal value also decreased by 34.2%
caused by lower count as well as the downtrend in mega-deals (€1 billion or higher). While many of the deals
closed in Q1 2019 were priced in Q4 2018, when public equities were expected to put a downward pressure on
pricing, multiples remained raised and the median European buyout multiple was with 11.5x the highest figure on
record. In addition to M&A activities, buyouts in the software space have been driving European deal activities.
15.4% of deals in the first quarter of 2019 were targeted and closed transactions in the software segment. This

BUSINESS ENVIRONMENT | 15
trend is being enforced by European regulations such as the May 2019 enacted GDPR law which fosters the next
generation of software targets.
Europe PE deal activity
*As of March 31, 2019. Unknown values are estimated based on known figures. Source: Pitchbook 1Q 2019 European Breakdown Report
The US exit market was at its lowest level in six years in the first three months of 2019, with 137 transactions and
an exit volume of $27.1 billion – representing year-over-year declines of 41.8% and 46.3%, respectively. This trend
is expected to continue as the majority of companies acquired from 2014-2016 still are not ready for sale.
Investment holding periods have lengthened to 6.8 years on average – with fewer than 50% of middle market exits
now occurring in under 5 years. IPO activity continues to decline as secondary buyouts and corporate acquisitions
offer more competitive pricing. IT deal exits follow a pattern similar to deal flow, with IT deals now accounting for a
larger proportion of PE-backed exits (32.1%).
US PE-backed exits
*As of March 31, 2019. Unknown values are estimated based on known figures. Source: Pitchbook 1Q 2019 US Breakdown Report
€ 8
1.0
€ 1
76
.1
€ 2
05
.6
€ 1
91
.6
€ 2
26
.4
€ 3
10
.9
€ 4
14
.1
€ 3
34
.3
€ 4
16
.6
€ 4
39
.1
€6
5.7
1,767
2,450
2,8612,726 2,841
3,297
3,767 3,7403,893
3,580
674
0
500
1,000
1,500
2,000
2,500
3,000
3,500
4,000
4,500
€0
€150
€300
€450
€600
2009 2010 2011 2012 2013 2014 2015 2016 2017 2018 2019*Deal Value (€B) Estimated Deal Value (€B) # of Deals Closed Estimated # of Deals Closed
Estimated # of Exits
BUSINESS ENVIRONMENT | 16
Estimated # of Exits
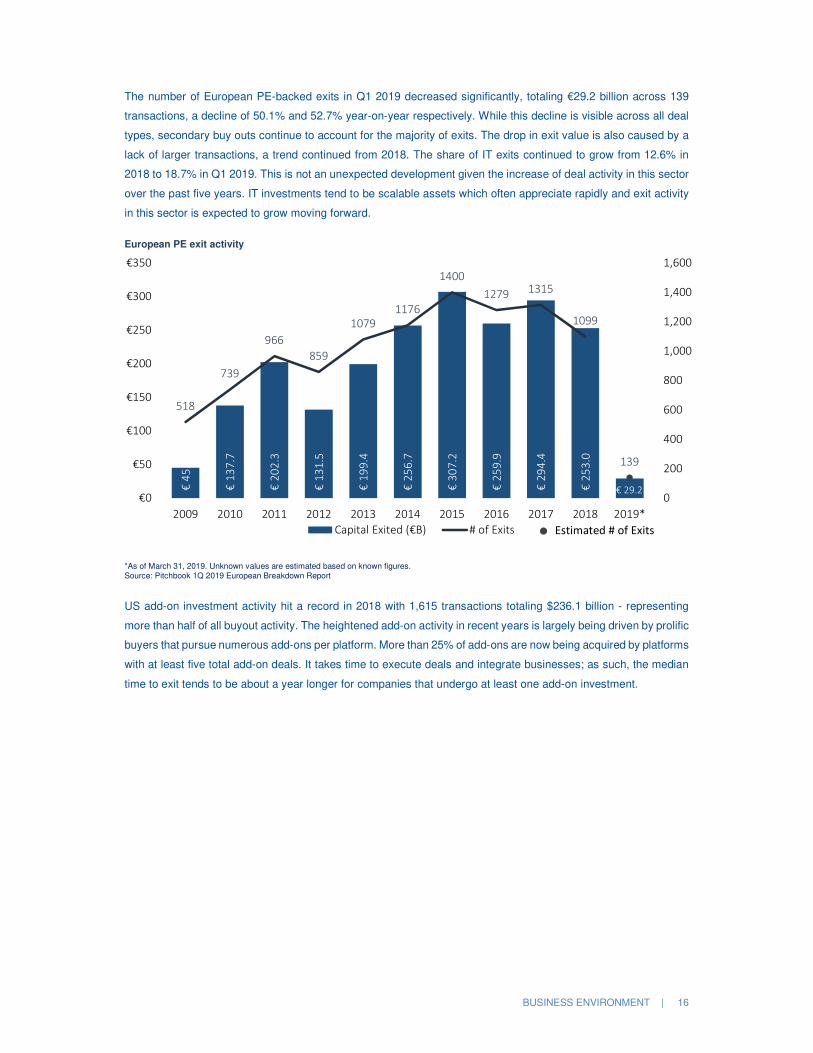
The number of European PE-backed exits in Q1 2019 decreased significantly, totaling €29.2 billion across 139
transactions, a decline of 50.1% and 52.7% year-on-year respectively. While this decline is visible across all deal
types, secondary buy outs continue to account for the majority of exits. The drop in exit value is also caused by a
lack of larger transactions, a trend continued from 2018. The share of IT exits continued to grow from 12.6% in
2018 to 18.7% in Q1 2019. This is not an unexpected development given the increase of deal activity in this sector
over the past five years. IT investments tend to be scalable assets which often appreciate rapidly and exit activity
in this sector is expected to grow moving forward.
European PE exit activity
*As of March 31, 2019. Unknown values are estimated based on known figures. Source: Pitchbook 1Q 2019 European Breakdown Report
US add-on investment activity hit a record in 2018 with 1,615 transactions totaling $236.1 billion - representing
more than half of all buyout activity. The heightened add-on activity in recent years is largely being driven by prolific
buyers that pursue numerous add-ons per platform. More than 25% of add-ons are now being acquired by platforms
with at least five total add-on deals. It takes time to execute deals and integrate businesses; as such, the median
time to exit tends to be about a year longer for companies that undergo at least one add-on investment.
€ 4
5.2
€ 1
37
.7
€ 2
02
.3
€ 1
31
.5
€ 1
99
.4
€ 2
56
.7
€ 3
07
.2
€ 2
59
.9
€ 2
94
.4
€ 2
53
.0
518
739
966
859
1079
1176
1400
1279 1315
1099
139
0
200
400
600
800
1,000
1,200
1,400
1,600
€0
€50
€100
€150
€200
€250
€300
€350
2009 2010 2011 2012 2013 2014 2015 2016 2017 2018 2019*
Capital Exited (€B) # of Exits
€ 29.2

BUSINESS ENVIRONMENT | 17
US PE Add-on activity
*As of March 31, 2019. Unknown values are estimated based on known figures. Source: Pitchbook 1Q 2019 US Breakdown Report
Private Equity – MENA
Crude oil prices increased from January through April 2019 driven by the efforts of OPEC and its non-OPEC
partners to remove excess oil supplies from the market, further augmented by falling oil output from Iran and
Venezuela due to a combination of political turmoil as well as by lower supplies from Canada due to pipeline
bottlenecks. The months of May to June 2019 registered a decline in oil prices on the back of global geopolitical
tensions and concerns over a global slowdown. Overall, crude oil prices averaged $66 per barrel during the first
half of 2019 (“H1 2019”) compared to $72 per barrel in FY 2018. The U.S. Energy Information Administration
projects oil prices to average $67 per barrel in 2019.
Brent Crude Oil Price: January 1, 2018 – June 30, 2019 ($bbl)
Source: Bloomberg
Estimated # of Deals closed

BUSINESS ENVIRONMENT | 18
The overall GCC real GDP growth in calendar year (“CY”) 2019 is expected to pick up slightly to 2.1%, up from
2.0% in CY 2018. Non-oil GDP growth is expected to grow to 2.9% in 2019 compared to 2.3% in 2018. Government
spending and multiyear infrastructure plans are likely to support economic activity in Kuwait and Saudi Arabia,
whereas the Expo 2020 related spending in Dubai and Abu Dhabi’s three-year economic stimulus program of $13.6
billion are expected to support near-term growth in the UAE.
After recording a growth of 2.2% during 2018, the IMF expects the Saudi economy to grow at 1.9% in 2019 with
the non-oil segment growth expected to be 2.9% in 2019 compared to 2.1% in 2018. Saudi Arabia recorded a
budget surplus of $7.4 billion during the first quarter of 2019 (“Q1 2019”), the first surplus registered by the Kingdom
since the decline of oil prices in 2014. The IMF projects the fiscal deficit to rise to 7% of GDP in 2019 compared to
5.9% in 2018 due to higher government spending expected in the remainder of the year.
Challenges remain especially in the Saudi labor market on the back of the Saudization program and levies on
expatriate workers and dependents. During H1 2019, Saudi Arabia approved a $3 billion refund plan to ease the
expat levies companies must pay, to help revive economic growth. In a bid to encourage more Saudi nationals to
work in the private sector, the Human Resources Development Fund announced plans to provide certain eligible
Saudi nationals an allowance in the initial three years of employment.
In H1 2019, Saudi Arabia also approved a ‘Privileged Residency System’ which would offer special permits to
certain skilled expatriates and investors to own property and apply for unlimited or one-year renewable visas without
the need for a local sponsor.
The region is also witnessing several Public Private Partnerships (“PPP”) being announced and awarded across
various sectors. In June 2019, Saudi Arabia's Ministry of Health opened tenders for its first PPP project involving
the upgrade of radiology and medical imaging services at seven hospitals in Riyadh.
The Saudi Tadawul All Share Index was up approximately 13% during H1 2019 benefiting from foreign inflows
following its inclusion in the FTSE Russell Emerging Markets index in March 2019 and in the MSCI Index in May
2019. The phased addition of the Tadawul index to the MSCI index will give its stocks a weighting of approximately
2.6% on a proforma basis. According to the Saudi Tadawul CEO, the inclusions are expected to result in strong
inflows of around $15-20 billion in 2019. Owing to the generally positive sentiment in financial markets in Q1 2019,
Saudi Arabia raised $7.5 billion in long-term bonds due in 2029 and 2050. The first half of 2019 also saw Saudi
Aramco sell $12 billion of international bonds across five tranches in the most heavily oversubscribed emerging
market bond issuance ($100 billion).
UAE’s GDP is forecasted at 2.8% in 2019 compared to 1.7% in 2018, driven by private consumption and an
increase in investment flows. According to a recent report by Ernst & Young assessing the economic impact of
Dubai’s Expo 2020, the event is expected to contribute approximately 1.5% of UAE’s annual GDP from October
2020 to April 2021.
In H1 2019, UAE approved the regulatory framework for the issuance of residence permits to investors,
entrepreneurs and innovators following the decision in November 2018 to adopt a new system of entry visas for
investors and professional talents by providing them with long-term visas.
In H1 2019, Abu Dhabi enacted a new law designed to encourage private sector involvement in housing,
infrastructure and education projects in the region, as part of the $13.6 billion three-year stimulus program to boost
the economy. The law formalizes the creation of a government body, the Abu Dhabi Investment Office, to drive
foreign direct investment and to lead the public-private partnership program.

BUSINESS ENVIRONMENT | 19
In summary, while uncertainties around oil prices remain, GCC governments overall remain committed to wide-
ranging economic and social reforms to transform their economies away from the traditional reliance on oil and to
create a more dynamic private sector.
During H1 2019, the GCC stock exchanges registered three IPOs and no REIT issuances with a total capital raised
of approximately $920 million. This compares to one IPO and six REIT issuances in Saudi Arabia and two IPOs in
Oman in H1 2018, with a total capital raised of approximately $850 million.
H1 2019 recorded 43 M&A transactions in the GCC region, compared to 56 transaction in H1 2018 (-23%). Seven
of these transactions were led by a financial buyer in H1 2019 compared to nine transactions in H1 2018.
Healthcare, Power, Energy and Chemicals and Industrials were the most active sectors, with the UAE being the
most active market. During the same period, there were six exits by a financial investor.
Breakdown of GCC Private Equity Transactions in H1 2019 (January 1 – June 30)
Source: Merger Market, Investcorp Analysis as of June 30, 2019
The Turkish economy witnessed a contraction of -2.6% year-on-year in Q1 2019 on the back of high inflation,
pervasive consumer pessimism and currency weakness, further highlighted by slow consumer credit growth and
ongoing weakness in the construction sector.
The Turkish Lira depreciated by approximately 9% during H1 2019 to reach TL5.79:US$1.0 as of June 30, 2019,
due to concerns over heightened economic uncertainties and geopolitical tensions.
The Central Bank of the Republic of Turkey kept the benchmark interest rate unchanged at 24.00% for the sixth
consecutive meeting, in line with market expectations. The Bank’s decision was driven by the fact that weak
domestic demand and tight monetary policy are feeding through to softer inflationary pressures. Inflation, which
came in at a nine-month low of 18.7% in May 2019 has been on a general downward path since October 2018.
In April 2019, Turkey’s 12-month cumulative current account deficit fell to its lowest level since 2009, narrowing to
$8.6 billion (1.2% of GDP), down from $27.1 billion in December 2018 (3.4% of GDP). The decline was supported
by price competitiveness and tourism owing to a weak lira and coupled with muted domestic demand.
The IMF predicts Turkey’s real GDP to contract by 2.5% in 2019 compared to a growth of 2.6% in 2018 as the
elevated inflation, a steep increase in borrowing costs and curtailed bank lending continue to weigh in on household
purchasing power, private consumption and investment. Economists however predict that the economy should
recover in 2020 as inflation softens and current account narrows, providing room for monetary policy easing.
Healthcare2
Power, Energy,
Chemicals
2
Industrials2
Other Services
1
UAE4
KSA2
Kuwait1
BUSINESS ENVIRONMENT | 20
While near term risks remain, the medium to long-term outlook for the Turkish economy remains positive on account
of the country’s strong fundamentals such as its sizeable young population, its aspiring middle class, its
entrepreneurial culture and its strategic geographical position as a trading hub.
There were no IPOs recorded in Turkey in H1 2019 owing to volatile market conditions coupled with weak investor
appetite.
On the M&A front, Turkey recorded 37 M&A transactions in H1 2019 compared to 54 transactions in H1 2018 (-
31%). Three out of these transactions were led by a financial buyer compared to eight transactions in H1 2018.
During the same period, there were five exits by a financial investor.
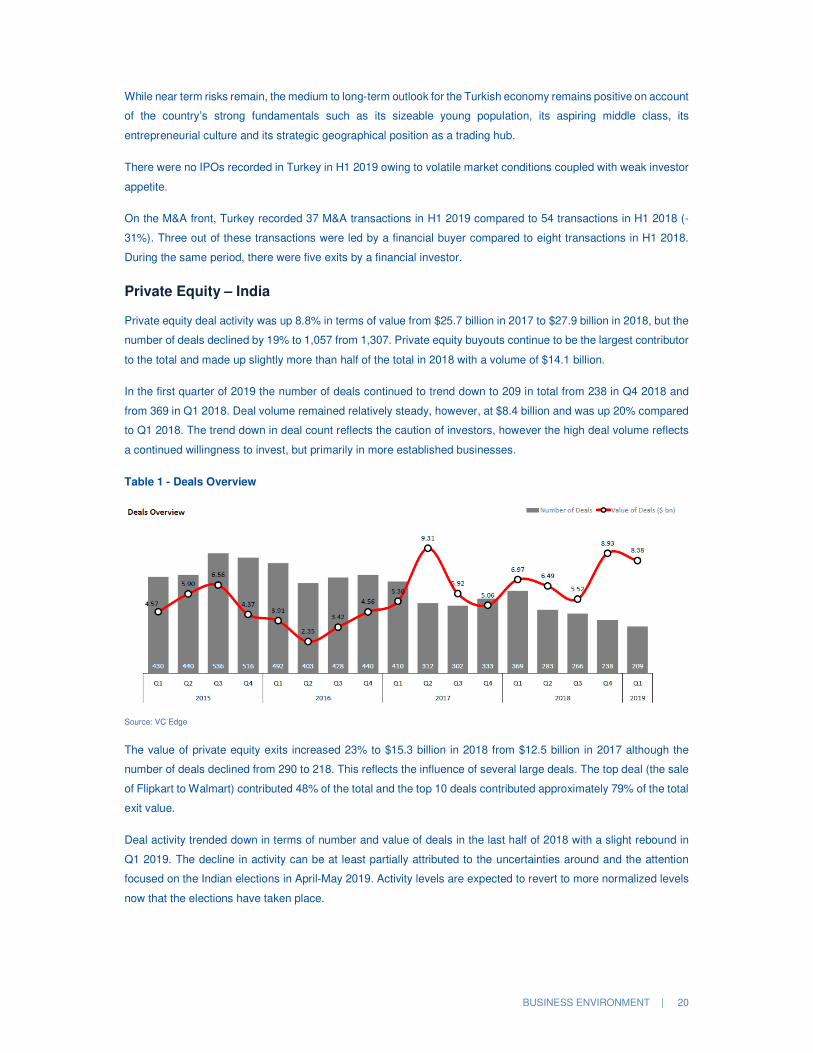
Private Equity – India
Private equity deal activity was up 8.8% in terms of value from $25.7 billion in 2017 to $27.9 billion in 2018, but the
number of deals declined by 19% to 1,057 from 1,307. Private equity buyouts continue to be the largest contributor
to the total and made up slightly more than half of the total in 2018 with a volume of $14.1 billion.
In the first quarter of 2019 the number of deals continued to trend down to 209 in total from 238 in Q4 2018 and
from 369 in Q1 2018. Deal volume remained relatively steady, however, at $8.4 billion and was up 20% compared
to Q1 2018. The trend down in deal count reflects the caution of investors, however the high deal volume reflects
a continued willingness to invest, but primarily in more established businesses.
Table 1 - Deals Overview
Source: VC Edge
The value of private equity exits increased 23% to $15.3 billion in 2018 from $12.5 billion in 2017 although the
number of deals declined from 290 to 218. This reflects the influence of several large deals. The top deal (the sale
of Flipkart to Walmart) contributed 48% of the total and the top 10 deals contributed approximately 79% of the total
exit value.
Deal activity trended down in terms of number and value of deals in the last half of 2018 with a slight rebound in
Q1 2019. The decline in activity can be at least partially attributed to the uncertainties around and the attention
focused on the Indian elections in April-May 2019. Activity levels are expected to revert to more normalized levels
now that the elections have taken place.

BUSINESS ENVIRONMENT | 21
Table 3 - PE Exits Overview
Source: VC Edge
Real Estate Investment – North America
Commercial real estate market fundamentals in the US remain healthy across most asset classes in a majority of
metropolitan areas. Uncertainty due to trade issues, policy uncertainty and the impact of tax changes made for a
somewhat slow start to 2019. However, the US economy now seems more stable and is once again driving demand
for US property with an increase in leasing activity, market rents and values. US employment levels continue to
grow steadily, and the unemployment rate stands at 3.7% as of June 2019 (versus 4.0% in June 2018). These
trends continue to have a favorable impact on the office, multifamily, student housing, retail, industrial and
hospitality sectors.
US real estate transaction volume is up 2% year-over-year through June 2019 versus the same period last year.
However, the growth was not uniform across property types. Office sector sales volume was up 30% year-over
year and multifamily volume was up 20% for the same period. Sales volume fell in the industrial sector in Q2 2019,
down 13% year-over-year. Despite this decline, investors are still eagerly pursuing industrial investments. Overall
prices continued to grow, although at a slower pace from a year earlier. Capitalization rates remain largely
unchanged from a year ago. Further, operating fundamentals remain solid. Capital flows into the US are expected
to continue to remain strong because the US is seen as a safe haven relative to other countries.
Transaction Volume ($ billions)
Source: Real Capital Analytics, Inc. 2019
$0
$100
$200
$300
$400
$500
$600
$700
'01 '02 '03 '04 '05 '06 '07 '08 '09 '10 '11 '12 '13 '14 '15 '16 '17 '18 H1 19

BUSINESS ENVIRONMENT | 22
US office market fundamentals remained sound through Q1 2019. Office-using employment remained resilient
and expanded in Q1 2019, with tech markets in the West and low-cost markets in the South continuing to see the
highest office-using job growth. According to CBRE, office vacancy rates across the US remained at 12.5% in Q1
2019, the lowest level since 2007. Downtown vacancy rates increased to 10.5%, while suburban vacancy rates
decreased. San Francisco maintained the lowest vacancy rate in the US in Q1 2019 at 4.7%, due to continued
strong tech-tenant demand. According to CBRE, rent growth has accelerated over the past year, with the average
asking rent increasing by 2.7% in Q1 2019, the largest quarterly increase since 2007. New supply completions
decreased in Q1 2019 to 9.6 million square feet, the lowest quarterly level since 2006.
US retail market fundamentals remained healthy through Q1 2019 due to strong retail sales and net asking rents
increasing across all major retail property segments. According to CBRE, all retail segments - except for power
centers - posted positive net absorption in Q1 2019. The overall availability rate fell slightly to 6.2% in Q1 2019.
Availability rates declined for both the neighborhood, community and smaller shopping center segment and the
lifestyle and mall segment, but rose slightly for the power center segment. Retail sales, excluding sales at gasoline
stations, remained healthy and increased by 3.8% year-over-year, driven by growth in e-commerce (non-store
retailers) and restaurants. Net asking rent growth increased by 1.5% in Q1 2019 and 4.8% year-over-year. The
average net asking rent reached the highest level since Q4 2008 according to CBRE.
US market fundamentals for the industrial market remained stable through Q1 2019. This sector, along with
multifamily and student housing, remain the three most desirable sectors within the real estate space. According
to CBRE, new supply slightly outpaced demand for the first time in over eight years. However, the US industrial
availability rate remained at 7.0% - the lowest level since Q4 2000. Detroit, Salt Lake City, Milwaukee, Portland,
Las Vegas and the San Francisco Peninsula led the way with the lowest availability rates, all below 4.5%. Low
availability rates and strong leasing demand have resulted in sustained rental growth. The average net asking rent
grew 2.2% in Q1 2019 to $7.51 per square foot - the highest level since CBRE began tracking the metric in 1989.
Rents increased 8.1% year-over-year, the highest growth rate in this cycle. New supply was down almost 50%
from the previous quarter and over 20% year-over-year. A strong labor market and rising wages are expected to
continue to be a primary driver of demand for industrial space. In addition, the continued strength of the US dollar,
low inflation and rising nominal income are expected to lead to more imported goods. According to CBRE, each
dollar increase in imports consumes three times more warehouse space than each dollar increase in exports.
US market fundamentals in the ‘for rent’ multifamily market remained healthy in Q1 2019. According to CBRE,
the vacancy rate fell to 4.6% year-over-year. Markets with the lowest vacancy rates were Minneapolis, New York
metro and Providence – all below 3.5%. Average monthly rent rose 3.0% year-over-year, above the 20-year
historical average of 2.5%. Demand remains strong due to favorable demographics and shifting lifestyle
preferences favoring renting rather than owning. While multifamily rents have risen 35.3% this decade, single-
family home prices have risen much more (59.4% over the decade). New supply is concentrated in large markets
(typically in urban locations) with more than half of all new supply located in only 10 markets. Markets that saw the
biggest increase in supply for the four quarters ended in Q1 2019 were New York, Dallas/Fort Worth and Los
Angeles/Southern California. Demand in each of these markets remains solid.
The US student housing market continues to be an attractive asset class. 2018 was a record-setting year for the
sector, with transaction volume of almost $11 billion (a 39% increase from 2017, and a 77% increase over the five-
year average). Capitalization rates in 2018 stayed constant with 2017 levels, despite a volatile interest rate
environment towards the end of the year. Both foreign and domestic capital sources continue to seek ways to enter
the sought-after asset class. The student housing sector has historically performed well during recessionary periods

BUSINESS ENVIRONMENT | 23
and forecasts on new supply, enrollment growth and occupancy are favorable, which are expected to create a
positive operating dynamic in the near term.
The US hospitality market grew slightly in Q1 2019. According to CBRE, demand growth grew by 2.4% year-
over-year and supply growth remained at 2.0%. The markets which saw the largest year-over-year demand
increases were Louisville, Nashville and Milwaukee. US occupancy increased by 0.4% year-over-year, setting a
new Q1 occupancy record of 61.8%. Average daily rate (ADR) increases remained modest at 1.1%, which resulted
in revenue per available room growth of 1.5%. Two of the top three ADR growth markets were in the Bay Area
(San Francisco and Oakland), reflecting the positive impact of the tech industry on lodging demand. Atlanta, host
of the 2019 Super Bowl, had the 2nd largest ADR growth. Markets that saw the biggest increase in supply year-
over-year were Nashville, Seattle and Louisville.
Real Estate Investment – Europe
United Kingdom
UK economic growth has been more resilient than had been forecast immediately after the EU referendum result.
However, Brexit-related uncertainty continues to hinder growth and the fall in the pound has hit real spending
power. GDP growth was 1.4% over 2018. This is due to continued subdued real consumer spending growth and
the drag on business investment from ongoing economic and political uncertainty relating to the outcome of the
Brexit negotiations.
Despite the uncertainty, the UK unemployment rate remains steady at 3.9%, the lowest number since January
1975. 12-month inflation rate fell to 1.8% in March 2019, considerably down from 2.3% in March 2018.
The e-commerce revolution is predicted to continue to drive sustained demand for industrial and logistics space in
2019, with demand for bigger ‘big boxes’ increasing fastest. This was evidenced by the fact that e-commerce
companies and third-party logistics firms accounted for over half of the floor space taken in 2018. Upward pressure
on rental levels was sustained throughout much of the UK during 2018, with average rental growth for prime stock
of 5.0%. Whilst 2018 was a record year for both investment and take-up, activity slowed in the first three months
of 2019, with many occupiers and investors taking a “wait-and see” approach in the run up to (the now delayed)
Brexit day. The market remains fundamentally strong, with rents continuing to rise, and investors’ interest in the
sector showing no signs of abating.
Central London office investment is forecast to be approximately £5 billion for the first half of 2019, a 39% drop on
a year-ago; this drop is attributed to Brexit which has deterred investors. Whilst investment is down, pricing levels
have not suffered and yields have remained firm as decreasing supply pipeline coupled with strong levels of pre-
leasing has led to intense competition for development and refurbishment opportunities across the capital. The
occupational market saw a strong first half, with the volume of space let forecast to reach 4.3 million sq. ft, only 6%
below the 10-year average.
The regional office story is similar to London’s; after record take-up levels in 2018, Q1 2019 slowed but remained
healthy. In aggregate across the “Big Nine” markets take-up in Q1 2019 was 4% below the 10-year average, with
the out-of-town market performing better than the city centers. The average office vacancy rate in the “Big 6”
markets fell below the 5% mark for the first time ever during 2018, whilst Grade A vacancy stands at just 1.5%
(source: JLL). On the supply side, city center office construction is currently at its highest level since 2007, standing
at more than 5 million sq. ft, although over half of this is already pre-let. As with London offices, investment volumes
in the regions outside London were significantly down in Q1 2019, at around 45% of the 10-year average. Vendor

BUSINESS ENVIRONMENT | 24
pricing expectations are holding firm and the delta of price expectation between buyers and sellers have contributed
to the low level of transactions.
Retail continues to suffer with a number of high-profile retailer Compulsory Voluntary Agreements (CVAs) during
the past 12 months. The investment market remains challenged with investor caution having an impact on pricing,
and the spread between prime and secondary yields continuing to widen.
Across all sectors, total investment volumes for the UK declined year-on-year by 6.5% during 2018 to around £62
billion; however, activity in central London rose 10% compared with 2017. The first quarter of 2019 slowed further
with many investors standing on the sidelines until more clarity on the Brexit outcome is known.
Germany
Capital Economics forecasts German GDP growth of 0.5% in 2019 and 0.8% in 2020, lower than the 2018 GDP
growth rate of 1.5%. German unemployment has continued to decline over the last five years and is forecast to be
at 3.2% in 2019 according to Capital Economics. A continued low unemployment rate is expected to benefit
domestic demand, which is in turn expected to support economic growth in Germany.
In 2018, the office take-up volume in the ‘Big 7’ German office markets (Berlin, Frankfurt, Hamburg, Munich,
Dusseldorf, Stuttgart and Cologne) reached around 3.8 million sq. m., which is the third-best year in terms of take-
up since the millennium and 17% above the 10-year average. Due to a lack of available good-quality product in the
‘Big 7’ office markets, take-up dropped by 8.7% when comparing 2018 to 2017, while the aggregate vacancy rate
decreased to 3.1% as at Q4 2018, down from 4.1% in Q4 2017 (source: Colliers).
There is a significant shortage of office space, particularly in central city locations; this shortage of available stock
has left many companies unable to relocate. Unlike in previous cycles, completions and supply have not kept pace
with the positive demand and are slowly starting to react. In 2018, in the ‘Big 7’ German office markets, completions
amounted to 843,000 sq. m. which is approximately 7% below the five-year average. The strong demand is also
reflected in continued positive net absorption in the ‘Big 7’ German office markets. This figure is quoted at more
than 1.6 million sq. m. for 2018, which refers to the amount by which occupied office space has increased (source:
Colliers).
Investor appetite for office assets remained strong in 2018; total German office transaction volume amounted to
€30.9 billion, representing an increase of 16% year-on-year, the highest for 10 years (source: Colliers).
Real Estate Investment – India
The real estate sector in India is expected to reach a market size of $1 trillion by 2030 from $120 billion in 2017
and contribute 13% of the country’s GDP by 2025. Retail, hospitality and commercial real estate are also growing
significantly, providing the much-needed infrastructure for India's growing needs.
Sectors such as IT and IT enabled services, retail, consulting and e-commerce have registered high demand for
office space in recent times. Commercial office stock in India is expected to exceed 600 million square feet by 2018
end while office space leasing in the top eight cities (Mumbai Metropolitan Region, National Capital Region, Pune,
Bengaluru, Ahmedabad, Hyderabad, Kolkata and Chennai) is expected to exceed 100 million square feet during
2018-20. Co-working space across the top seven cities (top eight cities excluding Ahmedabad) has increased
sharply in 2018 (up to September), reaching 3.44 million square feet, compared to 1.11 million square feet for the
same period in 2017.

BUSINESS ENVIRONMENT | 25
The residential real estate market in the top seven cities is now going through a phase of consolidation, with
absorption, supply and prices displaying a downward trend in many micro markets. The implementation of the
following three key policy decisions/reforms have had a negative immediate impact on an already slow residential
market:
1. Demonetization - All INR 500 and INR 1,000 notes were demonetized in November 2016, causing people
to be wary of spending, leading to a decline in demand for housing. Property registrations saw a decrease
of up to 40% (source: Kotak Mahindra Bank Report), giving rise to an air of fear among developers. This
led to them putting many projects on hold to avert losses and risk.
2. The Real Estate Regulation (and Development) Act (“RERA”) came into effect in May 2017. It aims to
boost investments in the real estate sector and create a more transparent environment for property buyers
by increasing the accountability of builders
3. Goods and Services Tax (“GST”) - this tax reform has been implemented with the intent of simplifying the
indirect tax
As seen in the chart below, sales declined in 2016/17 following demonetization and the implementation of RERA
and GST. Pre-sales at listed developers over H1 FY19, however, are starting to revert to normalized levels.
Residential sales (Rs billion)
Source: PropEquity, J.P. Morgan
Some of the major investments and developments in this sector recently are as follows:
• Commercial real estate saw the highest ever leasing absorption of over 47 million sq. ft with institutional
inflows of over $3.3 billion in 2018
• Residential property sales rose 58% from a year ago to ~78,000 apartments during the quarter ended
March across the top seven cities
• In April 2019, India implemented goods and services tax reform in the real estate sector, seeing rates
drop to 1%-5%. This is against earlier rates of 8-12%
The Government of India along with the governments of the respective states has taken several initiatives to
encourage development in the sector. The Smart City Project, where there is a plan to build 100 smart cities, is a
prime opportunity for real estate companies. Below are some of the other major Government initiatives:
• Under the Pradhan Mantri Awas Yojana (PMAY) Urban, more than 6.85 million houses have been
sanctioned up to December 2018.

BUSINESS ENVIRONMENT | 26
• In February 2018, creation of the National Urban Housing Fund was approved with an outlay of INR 600
billion ($9.3 billion).
• Under the Pradhan Mantri Awas Yojana (PMAY) Urban 1.4 million houses have been sanctioned in 2017-
18. In March 2018, construction of an additional 320,000 affordable houses was sanctioned under the
scheme.
A further impetus to the sector has come from the recent proposal by the Reserve Bank of India to allow banks to
invest in real estate investment trusts and infrastructure investment trusts.
Source: Media Reports, Press releases, Knight Frank India, VCCEdge, JLL Research, CREDAI-J, Kotak Mahindra Bank Report, Prop Equity, JP Morgan, IBEF
Report
Absolute Return Investments
Hedge funds delivered positive performance of +1.3% for FY19, as measured by the HFRI Fund of Funds
Composite Index, compared to FY18 performance of +5.2%.
Performance was markedly different between the first and second halves of FY19. The HFRI Fund of Funds
Composite Index was down 4.7% for H1 FY19 as global equity markets suffered significant volatility, particularly in
October and December 2018. December 2018 was the worst performing December for the Dow Jones Industrial
Average and the S&P 500 since 1931. The S&P 500 was down 6.9% and the MSCI World was down 8.9% in H1
FY19. Conversely, the HFRI Fund of Funds Composite Index was up 6.3% for H2 FY19. A strong rebound in risk
assets led H2 FY19 to be the strongest period for risk assets in over ten years and the S&P 500 had the best H2
FY19 performance since 1997.
Global macro discretionary funds were marginally positive over FY19; the HFRI Macro index was up 2.8%.
Performance was more challenged in H1 FY19 amid a challenging backdrop for both traditional asset classes and
across most hedge fund styles with H2 FY19 proving to be more conducive for the strategy. The most successful
macro players were those that successfully captured the movement in risk assets over this period - primarily it paid
to be long risk assets (equities, credit) and long duration. Despite the overall muted returns for macro there was
some excellent performance from several macro hedge funds. Emerging markets focused managers performed
well, particularly if they risk managed well in Q4 2018 and then re-engaged in H1 2019, as well as directional and
relative value rates specialists. The key trade for macro managers during H2 FY19 was to be long duration, as
global bond yields tumbled across the world. Many leading bond markets, including Germany, France, Switzerland
and Japan now have negative yields. German Bunds have negative sovereign yields out to as far as 20 years in
maturity. Looking across the world there is now approximately $13.4 trillion of negative yielding debt. The US 10-
year rallied 70bps (2.83% to 2.07%) between January and June to return +6.9%. Macro discretionary managers
tend less to play equities, often using equities as a hedge or relative value. However, managers that were able to
engage in late December/early January after the steep drawdown between October and December were well
rewarded. Managers also saw plenty of opportunities in the commodity space with strong performance across
energy, particularly gasoline and WTI/Brent. WTI rose steadily from the December lows of $42 to break above $65
in late April. Also, in precious metals – gold broke out of recent trading ranges to break $1,400 in June as the
opportunity cost of yield bearing assets fell. There were also idiosyncratic moves in soft commodities due to both
tariffs (soya beans) and weather conditions (e.g. corn had the slowest planting progress since records began).
Commodity trading advisors (‘CTA’) outperformed the broader hedge fund indices in FY19. Performance was
particularly strong for pure trend followers in H2 FY19. CTA performance was primarily driven by managers that
had exposure to fixed income duration and equity markets as CTA’s benefited from the strong rallies across equity

BUSINESS ENVIRONMENT | 27
and fixed income. Performance in commodity markets was mixed with several managers catching the strong moves
up in energy but others were caught out in the sharp reversals in soft commodities such as corn.
Equity market neutral strategies underperformed in FY19. The Equity Market Neutral (EMN) strategy has
struggled for much of the fiscal year primarily due to aggressive factor rotation and a persistent “growth” versus
“value” factor bias that has hampered returns. There have been significant liquidations across the quantitative
equity space in FY19 most likely emanating from large liquidations from multi-strategy and specialist quantitative
managers and this has had a negative impact on the broader space.
Fixed income relative value strategies performed broadly in-line with broader hedge fund strategies during FY19.
Managers that employ a long volatility bias have generally struggled in FY19 as all asset class volatilities trended
lower in recent years with fixed income particularly subdued. Despite a pick-up in fixed income volatility in Q2 2019,
levels preceding this in Q1 2019 hit all-time lows. Some managers were able to benefit from classic cash/futures
basis trading in both the US and Europe. This strategy currently benefits from the regulatory induced reduction of
bank proprietary trading desks, thereby increasing barriers to entry and limiting competition.
Convertible arbitrage strategies produced consistent returns over FY19 outperforming broader hedge fund
indices. Performance was particularly strong in H2 FY19 as convertible arbitrage strategies benefitted from strong
credit markets. Managers employing “synthetic put” structures were successfully able to trade gamma (volatility)
opportunities. The new issuance calendar has also provided a positive backdrop to the strategy, particularly for
those managers that have the ability to participate in new issuance and to take advantage of ensuing weakness in
secondary pricing.
Credit funds were up 3.2% in FY19 as measured by the HFRI: Credit index. Within this category, funds focused
on corporate credit led the way (HFRI: RV-FI Corporate Credit +5.7%), followed by structured credit funds (HFRI:
RV-FI ABS +3.7%) and then distressed funds (HFRI: Event-Driven Distressed/Restructuring +0.3%). All benefited
from a strong high yield (“HY”) market as the Bank of America Merrill Lynch HY Master Index returned +7.3% in
FY19. Despite marginally wider spreads, high yield performance was driven largely by the receipt of coupon and
lower risk-free rates as defaults remained well below the long run average. Managers parlayed higher yielding CCC
bonds and an active refinancing market into attractive returns across corporate credit strategies. Distressed
strategies lagged as CCC bonds finished the fiscal year with spreads as much as 100bps wider than at the start.
ABS strategies finished somewhere in between on the backs of overall limited available carry for many RMBS
trades and declining excess spread in the case of CLOs.
Equity long/short (L/S) hedge funds finished the fiscal year with positive performance as the HFRI: Equity L/S
(Total) index was up 0.4%. A strong second half to the fiscal year turned performance around as equity focused
hedge funds were down 8.2% in the first six months but up 9.4% in the latter six months. Hedge funds averaged a
beta to the MSCI World Equity index of 0.55 during the fiscal year, corresponding to a negative alpha of 3.1% on
the year vs. the index. Periods like FY19 where markets abruptly switch direction can be difficult for fund managers
as they often get whipsawed and become defensive just as markets turn. Managers added some tactical gains by
increasing their beta in the second half of the year as the MSCI World Equities Index went from losing 9.1% after
the first six months to gaining 17.0% over the next six months. Against this backdrop, those funds focused on US
markets tended to outperform those focused mostly elsewhere, just as those funds with a more long-biased
approach easily outperformed those funds with a more muted market stance.
Event driven funds finished the fiscal year +1.75% as measured by the HFRI Event Driven (Total) index. Key sub-
strategies such as merger-arbitrage (HFRI ED: Merger Arbitrage index, +3.7%), activism (HFRI ED: Activist index,

BUSINESS ENVIRONMENT | 28
-1.8%) and special situations (HFRI ED: Special Situations index, +1.7%) were mixed. Unsurprisingly, merger-
arbitrage led the way as, despite relatively low average annualized merger spreads, the space saw only limited
deal breaks following Qualcomm’s failed acquisition of NXP in July 2018. Meanwhile, merger investors revisited
their risk tolerance for overseas deals with security or regulatory hurdles and increasingly either avoided, limited or
hedged such positions.
Credit Management
Loan market overview
The Credit Suisse Leveraged Loan Index rose 0.47, or 1.58%, to 96.78 as at June 2019, with most of the gains
coming in April.1 The mixed performance over the May-June span can largely be attributed to ongoing concerns
about a potential trade war and the Federal Reserve’s pivot toward a dovish stance. Additionally, technical
conditions deteriorated as retail investors continued to head for the exits. Loan mutual funds have seen
redemptions for 32 straight weeks through June 2019; a total of $7.5 billion was withdrawn from April to June 2019.
That said, other factors served to make up the difference, leaving supply and demand roughly in balance.2 One
key driver was CLO issuance; $36.9 billion in new issues were priced in Q2 2019, which is on a par with last year’s
record pace. Additional support came from $17.1 billion in loan repayments, much of which emanated from high
yield bond refinancings and IPOs. The supply of new loans, meanwhile, remained tepid; net priced volume was
$48.6 billion, significantly below the $86.1 billion seen in Q2 2018. Generally speaking, issuance owed much to
LBO and M&A financing, refinancing, and opportunistic dividend deals, which accounted for 45%, 20% and 10%
of the total, respectively.
In terms of the market’s fundamentals, conditions remained sound. While the trailing 12-month default rate rose to
1.34% at the end of June from 0.93% in the first quarter, it remained below the 1.63% level that prevailed at the
end of December 2018.3 The discount margin tightened by seven basis points to 460 basis points.
1 Credit Suisse US Leveraged Loan Index Monthly data, June 28, 2019 2 LevFin Insights, LFI Quarterly Insights Q2 2019, July 2, 2019 3 LCD, an offering of S&P Global Market Intelligence, July 1, 2019
-5.4%
-4.1%
-1.0%
0.4%
1.8%
2.1%
2.6%
2.7%
2.7%
2.8%
1.3%
-6% -4% -2% 0% 2%
Asia Pacific Equities
European Equities
Equity Market Neutral
Distressed / Credit
Event Driven
Fixed Income Relative Value
Convertible Arbitrage
CTA Systematic
Global Macro
US Equities
HFRI FOF Composite
Performance of hedge fund strategies (July 2018 – June 2019)
Source: PerTrac, Investcorp

BUSINESS ENVIRONMENT | 29
Sector-wise, only one group posted negative returns in Q2 2019 – metals and minerals, down 1.62% – though
other economically-sensitive segments also disappointed, including energy, which was flat, and consumer
durables, which drifted 0.21% higher. In contrast, defensive issues, including utilities and food and drug names –
up 2.13% and 2.05%, respectively – more than held their own. Interestingly, the housing segment also fared well,
gaining 2.08% on positive sector-specific data. As was the case in the first quarter, higher-rated credits led the
pack: BB-rated and B-rate loans were up 1.66% and 1.57%, respectively, while CCC-rated counterparts rose just
0.58%.4
Across the Atlantic, the Credit Suisse Western European Leveraged Loan Index rallied 1.87% in Q2 2019.5 While
all three months witnessed positive returns, the bulk of the gain came in April, when the market rose 1.23%. Overall,
the average loan price increased from 97.69 to 98.01, which was off its early-quarter peak of 98.38 and well below
the September 2018 high of 99.07. Despite more favorable conditions in the region than elsewhere, the European
loan market could not fully shake off the US-led decline in global risk sentiment that occurred during May and June.
In terms of supply and demand, the latter continued to outweigh the former. Despite sustained interest from
investors, European loan issuance faltered; at EUR 34.9 billion for the year through June, the total was down 30%
from the year-ago period.6
At the same time, CLO formation has been robust, with EUR 14.7 billion of new issues coming to market during
the first six months of 2019, 6% more than in last year’s first half. Since 2019 began, five new managers have
entered the CLO space, with a further handful expected to debut new issues in coming months, and even with a
more nervous tone in credit markets overall on the heels of continuing macro uncertainty, CLO demand has helped
to keep things buoyant. Separately, the European discount margin tightened by 10 basis points to 420 basis points
last quarter.
Amid strong demand for European loan assets, especially from CLO rampers, the best values continue to be found
in the primary market, where issues have traded up strongly on the break because investors have been unable to
get the allocations they want. In contrast, the secondary market remains a fairly expensive source of supply. Given
that, primary market access and the ability to secure sufficient allocations remain the key to good performance.
Similar to what occurred in the US, cyclical and other industries that are susceptible to macro headwinds came up
short in Q2 2019; shipping and aerospace fell 3.55% and 2.95%, respectively. Interestingly, consumer durables
turned out to be the best performing group, with a gain of 3.92%, followed by utilities and housing, which rose
3.00% and 2.49%, respectively. Traditionally defensive sectors such as food and healthcare also fared well; both
groups posted returns in excess of 2% for the period.
Credit-wise, riskier CCC-rated obligations generated subpar performance, with a gain of 1.18% over the April-June
span, in contrast to BB-rated and B-rated loans, which rose 1.88% and 1.93%, respectively.
More broadly, underlying credit fundamentals in Europe have remained robust; the S&P European Leveraged Loan
Index (ELLI) posted a 0% trailing 12-month default rate in the first half of 2019.7 That said, the number of issues
moving into stressed pricing territory has been rising, though, this has generally been for company-specific reasons,
4 Credit Suisse US Leveraged Loan Index Monthly data, June 28, 2019 5 Credit Suisse Western Europe Leveraged Loan Index Monthly data, June 28, 2019. 6 LCD, an offering of S&P Global Market Intelligence, July 1, 2019 7 LCD, an offering of S&P Global Market Intelligence, July 1, 2019

BUSINESS ENVIRONMENT | 30
rather than because of market or industry concerns. Investcorp continues to expect idiosyncratic mishaps to occur
and will be quick to exit positions that it feels may encounter stress.
Loan market outlook
In the loan market – and in other asset classes, for that matter – the stance of central banks, most notably the
Federal Reserve, is the primary focus. Since last year’s fourth quarter, investors have shifted from expecting further
Fed interest-rate hikes to anticipating multiple cuts, with the first such move in July. More recently, mixed economic
data and the strength of the latest US jobs report have served to muddy the waters regarding the trajectory and
timing of prospective rate cuts. That said, Fed dovishness could nonetheless help to prolong the current expansion
and provide an earnings tailwind for the companies Investcorp invests in.
On the other side of the Atlantic, the ECB also looks increasingly likely to become more accommodative following
its acknowledgement of the downside risks to the growth outlook. Typically, retail investors tend to flee the floating-
rate loan segment when rates are expected to decline, creating a technical headwind. However, Investcorp agrees
with a Credit Suisse strategist who notes that “while the prospect of Fed rate cuts certainly remains a challenge for
the loan market, low all-in loan yields already factor in this negative outcome”.8 Investcorp also expects persistent
demand from CLOs – which have already issued $65 billion and €14.7 billion of securities this year in US and
European markets, respectively9 – to remain a supporting factor.
In terms of Investcorp’s outlook for the loan market going forward, Investcorp anticipates coupon-like returns that
will, following the strong first quarter rally, lead to full-year performance in excess of 8%. In Investcorp’s view,
however, the path higher is unlikely to be smooth. Investcorp expects to see bouts of volatility as investors react to
changes in perceived risks surrounding the economy, trade policies, and central bank policymaking.
8 Credit Suisse Credit Strategy Daily Comment, July 3, 2019 9 LCD, an offering of S&P Global Market Intelligence, July 1, 2019

DISCUSSION OF RESULTS | 31
Discussion of Results
Profit for the Year
Profit for the year includes fee income from client-centric activities and asset-based income from returns generated
on balance sheet assets, including unrealized changes in fair value of co-investments in Investcorp’s private equity
(‘PE’) and real estate (‘RE’) products, accrued returns on credit management (‘CM’) exposures and realized
changes in the fair value of absolute return investments (‘ARI’) products.
Despite a slowing macroeconomic backdrop and increasing trade and geopolitical tensions, profit for the year of
$131 million for FY19 was 5% higher than profit for the prior fiscal year (‘FY18’). Excluding the write down in value
of a legacy investment the net income grew by 15%. Continued geographical diversification of the Firm’s client
base and product set has helped support record levels of investment activities and fundraising across all markets.
This has resulted in higher gross operating income during the year, which grew to $465 million, reflecting a 2%
increase over FY18. Investcorp’s FY19 results represent a return on equity (‘ROE’) of 12% and fully diluted earnings
per share (‘EPS’) of $1.47 per ordinary share.
Income ($ millions) FY19 FY18 % Change B/(W)
Fee income 376 321 17%
Asset-based income 106 137 (23%)
Write-down of legacy investments (17) (4) (>100%)
Gross operating income 465 454 2%
Provisions for impairment (4) (4) 0%
Interest expense (51) (56) (9%)
Operating expenses (268) (256) 5%
Profit before tax 142 138 3%
Income tax expense (11) (13) (15%)
Profit for the year 131 125 5%
Profit for the year excluding fair value changes of legacy investments
148 129 15%
Basic earnings per ordinary share ($) 1.52 1.34 13%
Fully diluted earnings per ordinary share ($) 1.47 1.30 13%
Fee income increased to $376 million (FY18: $321 million) with growth recorded in AUM fees as well as in deal
fees. Asset-based income decreased to $106 million (FY18: $137 million) primarily driven by lower private equity
returns.
Interest expense decreased by 9% due to a combination of lower average drawn balances and lower margins.
Operating expenses increased by 5% to $268 million (FY18: $256 million) reflecting the expansion of Investcorp’s
distribution platform. The tax expense decreased by $2 million.

DISCUSSION OF RESULTS | 32
Fee Income
Fee income has two components: (i) AUM fees which include management and administrative fees on aggregate
client investments under management in private equity and real estate deals, as well as fees from client
investments in ARI and CM; and (ii) deal fees which are generated and earned from transactional activities related
to direct investments (PE, RE and special opportunities portfolios (‘SOPs’)), including their initial acquisition,
subsequent placement and eventual exit, plus performance fees for value added during the ownership period.
Summary of fees ($ millions) FY19 FY18 % Change B/(W)
ARI fees 13 13 0%
CM fees 50 46 9%
Other management fees 118 114 4%
AUM Fees 181 173 5%
Activity fees 167 128 30%
Performance fees 28 20 40%
Deal fees 195 148 32%
Fee income 376 321 17%
Total fee income in FY19 increased to $376 million (FY18: $321 million).
AUM fees were $181 million in FY19, 5% higher than FY18. The increase reflects a higher level of client assets
under management.
The increase in AUM fees was complemented by an increase in deal fees in FY19 to $195 million (FY18: $148
million), mainly driven by higher activity fees relative to FY18. Performance fees of $28 million increased by 40%
(FY18: $20 million) reflecting the positive performance of the underlying PE and RE portfolios. Activity fees
increased by 30% to $167 million (FY18: $128 million). The increase primarily reflects higher PE activity fees,
driven by several deals exited during the year and the fee generated from the Firm’s first investments in China and
India.
Asset-based Income
Asset-based income is earned on Investcorp’s PE, RE, CM and ARI co-investments held on the balance sheet,
including invested liquidity. Asset-based income includes unrealized changes in the fair value of PE and RE co-
investments, accrued returns on CM exposures and realized changes in the fair value of ARI co-investments.
Gross asset-based income during FY19 decreased by $31 million relative to FY18 to a net gain of $106 million,
primarily driven by a significant decrease in the PE returns during the year.

DISCUSSION OF RESULTS | 33
Asset-based income ($ millions) FY19 FY18 % Change B/(W)
Private equity investment 29 65 (55%)
Credit management investment 22 28 (21%)
Absolute return investment 8 10 (20%)
Real estate investment 29 24 21%
Investment in an associate 5 - n.m.
Treasury and other asset-based income 13 10 30%
Gross asset-based income 106 137 (23%)
The tables below summarize the primary drivers of asset-based income for PE, ARI and RE.
PE asset-based income KPIs ($ millions)* FY19 FY18 % Change
B/(W)
Asset-based income 29 65 (55%)
Average co-investments 426 409 4%
Absolute yield 6.8% 15.9% (9.1%)
* Excludes fair value change of legacy investments
PE asset-based income in FY19 was driven by steady growth across most of the US and European portfolio and
successful realizations during the year. Positive returns were however offset by lower returns for investments in
the Turkey region which were impacted by the depreciation in the Turkish Lira and by valuation declines in certain
US retail sector exposures and in a legacy investment.
CM asset-based income KPIs ($ millions) FY19 FY18 % Change B/(W)
Asset-based income 22 28 (21%)
Average co-investments 296 347 (15%)
Absolute yield 7.4% 8.1% (0.7%)
The asset-based income for the CM business primarily represents returns on CLO co-investment exposures, which
delivered steady returns and were supported by active management of the CLO funds by the credit management
team. The CM asset-based return decreased by $6 million to $22 million as compared to FY18, primarily due to
lower average co-investment exposures and the diversification of the Firm’s co-investments to vertical tranches of
CLO’s which lowers risk as opposed to investing only in equity tranches of new CLO issuances.
ARI asset-based income KPIs ($ millions) FY19 FY18 % Change B/(W)
Asset-based income 8 10 (20%)
Average co-investments 137 207 (34%)
Absolute yield 5.8% 4.8% 1.0%
ARI returns declined by 20% in FY19 to $8 million. The return was primarily affected by a lower average co-
investment balance during the year.

DISCUSSION OF RESULTS | 34
RE asset-based income KPIs ($ millions) FY19 FY18 % Change B/(W)
Asset-based income 29 24 21%
Average co-investments 306 325 (6%)
Absolute yield 9.5% 7.4% 2.1%
RE asset-based income is primarily driven by rental yields. The higher income in FY19 as compared to FY18
reflects higher yield on the co-investment balance which is mainly driven by strong performance of the entire
portfolio across US and Europe. A large portion of the average co-investments relates to underwriting on which
Investcorp earns the rental yield during the period of underwriting.
The table below shows the average yields on balance sheet co-investments for each of the last five fiscal years by
asset class.
Asset yields FY15 FY16 FY17 FY18 FY19 Average
(FY15 – FY19)
Private equity * 6.8% 16.5% 3.5% 15.9% 6.8% 9.9%
Credit management - - 12.1% 8.1% 7.4% 9.2%
Absolute return investments 2.0% (6.2%) 6.2% 4.8% 5.8% 2.5%
Real estate investment 5.5% (0.6%) 7.8% 7.4% 9.5% 5.9%
Average co-investment yield 5.0% 5.4% 6.7% 9.9% 7.5% 6.9%
* Excludes fair value change of legacy investments for FY18 and FY19
Interest Expense
Total interest expense, including commitment fees on undrawn revolving credit facilities, decreased by 2% to $51
million in FY19 from $56 million in FY18. The decrease was due to lower average interest-bearing liabilities primarily
due to repayment of the CHF 125 million bond that matured during the fiscal year, which was also complemented
by a tightening of the spread on Investcorp’s average borrowings
Interest expense ($ millions) FY19 FY18 Change H/(L)
Total interest expense 51 56 (5)
Average short-term interest-bearing liabilities 605 504 101
Average medium- and long-term interest-bearing liabilities 602 775 (<100%)
Average interest-bearing liabilities 1,207 1,279 (72)
Interest expense on funded liabilities(a) 43 50 (7)
Average cost of funding on funded liabilities 3.6% 3.9% (0.3%)
Average 1-month US LIBOR 2.3% 1.5% 0.8%
Spread over LIBOR 1.2% 2.4% (1.2%)
(a) Does not include commitment fee cost on undrawn revolvers.

DISCUSSION OF RESULTS | 35
Operating Expenses
Operating expenses increased by 5% to $268 million in FY19 from $256 million in FY18. The staff compensation,
which includes fixed and variable components, increased by 6%. Other personnel costs and charges such as
training and recruitment increased by 27%. The increase in staff compensation and other personnel costs and
charges is primarily due to the 4% increase in global headcount across all locations and higher staff compensation
per FTE. Other operating expenses, comprising of professional fees, technology, travel and business development,
administration and infrastructure costs decreased by 1%. Total expenses, as a percentage of net revenues,
remained constant at 65%.
Operating expenses ($ millions) FY19 FY18 Change
H/(L)
Staff compensation 174 164 10
Other personnel costs and charges 14 11 3
Other operating expenses 80 81 (1)
Total operating expenses 268 256 12
Full time employees (‘FTE’) at end of period 419 402 17
Staff compensation per FTE (‘000) 415 408 2%
Other operating expenses per FTE (‘000) 191 199 (4%)
Total staff compensation / total operating expenses 65% 64% 1%
Operating expenses / Net revenue(a) 65% 65% 0%
(a) Net revenue represents gross operating income less provisions for impairment and interest expense
Balance Sheet
Key balance sheet metrics are shown in the table below.
Balance sheet metrics Jun-19 Jun-18
Total assets $2.4 billion $2.5 billion
Leverage(a) 1.1x 1.3x
Net leverage ratio(b) 0.4x 0.5x
Shareholders’ equity $1.1 billion $1.1 billion
Co-investments(c) / long-term capital(d) 0.5x 0.7x
Capital adequacy ratio 33.8% 31.5%
Residual maturity – medium- and long-term facilities 73 months 69 months
(a) Calculated in accordance with bond covenants.
(b) Calculated in accordance with bank loan covenants and is net of liquidity, underwriting and deferred fees.
(c) Excludes underwriting and is net of facilities secured against absolute return investments and credit management co-investments.
(d) JPY37 billion debt maturing in FY30, $41 million secured financings maturing in FY31, $42 million debt maturing in FY32, $50m debt maturing in FY33,
deferred fees and total equity.

DISCUSSION OF RESULTS | 36
Assets
Assets ($ millions) Jun-19 Jun-18 Change H/(L)
Cash and other liquid assets 390 371 19
PE, RE and ARI underwriting & CM warehousing 334 446 (112)
CM co-investments 332 272 60
ARI co-investments 112 189 (77)
PE and RE co-investments
(excluding underwriting) 573 701 (128)
Investment in an associate 38 - 38
Other (working capital and fixed assets) 582 514 68
Total assets 2,361 2,493 (132)
Co-investment assets
(excluding underwriting) 1,017 1,162 (145)
At June 30, 2019, total assets were $2.4 billion, 5% lower than at June 30, 2018. Total co-investments decreased
by $145 million to $1,017 million, primarily driven by a $120 million decrease in PE co-investments resulting from
two secondary sales and several other realizations. ARI co-investments also decreased by $77 million, but this
was mostly offset by an increase in CM co-investments of $60 million. As at June 30, 2019, gross co-investments
in CM were $332 million of which $84 million was utilized to secure amounts drawn under long term repo financing
agreements.
Co-investments are funded entirely by a combination of long-term and permanent sources of capital
* Excludes underwriting and is net of the amount of a secured facilities (which are secured against CM co-investments)
** Long term capital consists of JPY37 billion debt maturing in FY30, $41 million secured financings maturing in FY31, $42 million debt maturing in FY32, $50m
debt maturing in FY33, deferred fees and total equity.
Investcorp focuses on maintaining a co-investment to long-term capital ratio of 1.0x or lower, such that the entire
balance sheet co-investment portfolio is fully funded through permanent or quasi-permanent capital and does not
rely on medium-term debt financing. As at June 30, 2019 the aggregate level of co-investments net of a $84 million
repo credit facility secured against CM co-investments remained fully covered by permanent and long-term sources
of capital.

DISCUSSION OF RESULTS | 37
Liquidity
Despite the repayment of the CHF 125 million bond that matured during the fiscal year and the buyback of ordinary
shares, accessible liquidity, comprising undrawn committed revolving facilities plus balance sheet cash and other
liquid assets of $1.1 billion was maintained at a higher level as compared to FY18 (June 30, 2018: $996 million)
and covers all outstanding debt maturing over the next ten years.
Liquidity cover ($ millions)
1 Syndicated revolving facilities
2 Syndicated revolving facilities- includes €76 million ($87m as at June 30th 2019 exchange rates)
3 JPY 37 billion ($343 million as at 30th June 2019 exchange rates) debt maturing in FY30, €36 million ($41 million as at 30th June 2019 exchange rates)
debt maturing in FY31, €37 million ($42 million as at 30th June 2019 exchange rates) debt maturing in FY32 & $50 million debt maturing in FY33
Liabilities
Total liabilities decreased by $154 million to $1,216 million at June 30, 2019.
Liabilities ($ millions) Jun-19 Jun-18 Change H/(L)
Term and institutional accounts 151 300 (149)
Call accounts 263 116 147
Medium and long-term debt 514 617 (103)
Total debt 928 1,033 (105)
Deferred fees 63 72 (9)
Other liabilities(a) 225 265 (40)
Total liabilities 1,216 1,370 (154)
(a) Payables and accrued expenses, negative fair value of derivatives
The decrease in medium and long-term debt was primarily due to the repayment of a CHF 125 million bond that
matured during the fiscal year, which was partially offset by a new repo credit facility secured against CM co-
investments. Currency translation risks are fully hedged, and hence there is no material impact on profit for the
year from this or other exchange rate movements.
390
686
2501
4362
4763
250
686
1,075
Totalliquidity
as ofJune 30,
2019
H1FY20
H2FY20
H1FY21
H2FY21
H1FY22
H2FY23
FY30+
Maturing debt facilities Cum ulative m aturing debt
Undraw n
1076

DISCUSSION OF RESULTS | 38
Financial leverage
* Total debt is defined as call accounts, term and institutional accounts, medium and long-term debt
** Calculated in accordance with bond covenants. Liabilities are net of transitory balances
*** Calculated in accordance with bank loan covenants, net of liquidity, underwriting and deferred fees
Leverage, as defined for financial covenants principally in Investcorp’s outstanding bond and note issues, is
calculated after deducting any transitory liabilities from the aggregate level of liabilities on the balance sheet, and
has remained low in line with Investcorp’s medium-term objectives to maintain comfortable covenant headroom.
Net leverage, as defined in the 4-year syndicated revolving credit facility, is calculated by deducting cash,
underwriting balances and deferred fees (arising from the introduction of IFRS 15) from liabilities.
Credit Ratings
Investcorp held its annual rating review with both Moody’s and Fitch in October 2018. Moody’s reaffirmed the Ba2
rating and ‘Stable’ outlook. This reflects the Firm’s solid market position in the GCC region as a leading investment
provider, its healthy operating margins and good asset retention. The rating incorporates the Firm’s adequate
liquidity profile and the ongoing improvement in earnings quality due to the growth in more stable and predictable
asset management fees. Following the yearly review, Fitch Ratings re-affirmed Investcorp’s credit ratings at BB
and brought the outlook back to “Stable’.
Agency Rating grade Comment
Moody’s Investor Service Ba2 / Stable outlook Rating and outlook confirmed in October 2018
Fitch Ratings BB / Stable outlook Rating confirmed and outlook brought back to “Stable” in October 2018
0.0x
1.0x
2.0x
3.0x
$-
$1.0
$2.0
$3.0
$4.0
Jun-09 Jun-10 Jun-11 Jun-12 Jun-13 Jun-14 Jun-15 Jun-16 Jun-17 Jun-18 Jun-19
Total debt (LHS)* Leverage (RHS)** Net leverage ratio (RHS)***

DISCUSSION OF RESULTS | 39
Equity
Equity ($ millions) Jun-19 Jun-18 Change H/(L)
Ordinary shareholders’ equity 987 964 23
Preference share capital 123 123 -
Proposed appropriations 38 41 (3)
Other reserves (3) (5) 2
Net book equity 1,145 1,123 22
Net equity at June 30, 2019 was $1.1 billion, reflecting an increase in equity from the profit for the year partially
offset by the treasury shares purchased during the year. Book value per ordinary share as of June 30, 2019
increased by 9% to $13.26 (FY18: $12.13).
Capital Adequacy
Investcorp’s capital adequacy ratio (‘CAR’) at June 30, 2019 was 33.8% (June 30, 2018: 31.5%), reflecting lower
risk-weighted assets and a marginal increase in regulatory capital during the year. The CAR is comfortably in
excess of the Central Bank of Bahrain’s (‘CBB’) regulatory minimum requirement of 12.5%.
Regulatory capital adequacy ratio (CAR)
The CBB has designated Investcorp as a Domestic Systemically Important Bank (‘DSiB’). As a result of this
designation, Investcorp is subject to an increased frequency of prudential meetings and inspections by the CBB.
31.5%
0.5%
33.8%
1.8%
0%
10%
20%
30%
40%
Basel III CARJun 30, 2018
Decrease in risk-weighted assets
Increase in otherregulatory capital
Basel III CARJun 30, 2019

INVESTMENT ACTIVITY | 40
Investment Activity
New Acquisitions: Private Equity
Investcorp targets the acquisition of attractive private equity opportunities in North America, Europe, Asia,
the Gulf and MENA regions, including Turkey. In addition, it continues to support its existing portfolio
companies to increase their market share and expand their operational footprint through selected add-on
acquisitions. The Firm seeks private equity investments that it believes offer its investors the potential for
an attractive return profile, driven by proactive value creation initiatives, including revenue growth through
expansion in new territories, business efficiency improvements and the strengthening of management
teams.
The aggregate capital deployed in private equity investments during FY19 was $750 million. $609 million
was deployed across four new private equity investments and one new special opportunity portfolio
investment, $78 million was invested through or alongside Investcorp’s technology funds in two new
investments, $6 million was invested in IDFC Private Equity Fund IV (“IDFC PE Fund IV”) and $57 million
of additional capital was invested in five existing portfolio companies.
New acquisitions
United Talent Agency
The third largest talent agency in the world
Date of Investment August 2018
Investors Deal-by-deal
Industry Sector Business services - Media
Headquarters California, US
softgarden
A fast-growing Human Resource software provider
Date of Investment September 2018
Investors Investcorp Technology Partners IV
Industry Sector Technology – Big data
Headquarters Berlin, Germany
China Pre-IPO Technology Portfolio
A highly diversified portfolio that invests in leading pre-IPO
technology companies
Date of Investment September 2018
Investors Deal-by-deal
Industry Sector Technology
Headquarters Predominantly in China

INVESTMENT ACTIVITY | 41
Ubisense
A market leader in enterprise location intelligence solutions
Date of Investment December 2018
Investors Investcorp Technology Partners IV
Industry Sector Technology – Big data
Headquarters Cambridge, UK
Health Plus Management
A provider of business management and operations services for
independent physician practices in the physical medicine and
rehabilitation market
Date of Investment January 2019
Investors Deal-by-deal
Industry Sector Business services - Healthcare
Headquarters New York, US
Revature
A leading technology talent development company
Date of Investment February 2019
Investors Deal-by-deal
Industry Sector Business services – Technology enabled services
Headquarters Washington, US
Cambio
Operates in the Electronic Health Records (“EHR”) market, offering
software solutions for acute, primary, social and person-centred care
Date of Investment February 2019
Investors Deal-by-deal
Investcorp European Buyout Fund A, L.P.
Industry Sector Business services - Healthcare
Headquarters Stockholm, Sweden
Citykart Retail Private Limited
A value apparel retail chain
Date of Investment February 2019
Investors IDFC Private Equity Fund IV
Industry Sector Consumer & retail
Headquarters New Delhi, India

INVESTMENT ACTIVITY | 42
Other private equity activity
A number of Investcorp’s private equity portfolio companies made add-on investments to increase value
as part of their business plans. Such add-on investments enable the companies to increase revenues, for
example by developing market share, by entering new markets and geographies, or by extending services
or product ranges.
August 2018: PE-Tech portfolio company Impero acquired Safeguarding Monitor, Impero’s first
add-on, marking the first inorganic step on the pathway to the broader well-being
strategy.
FY2019: Over the course of the year, Investcorp invested €30 million in its buy-and-build
platform in the German dental sector for the acquisition of additional practices and to
support operational expenses while further investments as part of its wider
consolidation and buy-and-build strategy are progressed.
March 2019: PE-Tech portfolio company, Calligo, acquired Connected Technologies Inc. based in
Brampton, Ontario, a Canadian specialist in outsourced IT and cloud services,
including Microsoft Azure and Office 365. The acquisition complements two previous
acquisitions in Canada – cloud services provider, 3 Peaks, in October 2017 and Mico
Systems, an outsourced IT services company, in May 2020.
Investcorp also provides support funding to its portfolio companies from time to time to help stabilize and
turn around companies that are facing challenging market conditions.
September 2018: PE-Tech portfolio company, Impero, received a further $2 million in follow-on
investment, increasing the fully diluted ownership to 71.1%. Impero is the UK’s
number one provider of online student safety, classroom and school network
management software.
November 2018: PE-Tech portfolio company, Ageras, received additional funding to support the
continued growth of the core business and new product, Meneto. Founded in 2012,
Ageras is a fast-growing online marketplace matching SMEs and micro-businesses
with professional services providers such as accountants and lawyers.
June 2019: Investcorp provided support capital to PE North America portfolio company Sur La
Table as part of a refinancing to help right-size the capital structure and extend debt
maturities
Other add-on investments are summarized below. No additional equity from Investcorp or its investors
was required for these investments.
July 2018: Investcorp and The Riverside Company added German replacement parts supplier,
Ratioparts, to the platform of PE North America’s portfolio company Arrowhead.
Based in Euskirchen, Germany, Ratioparts is a leading European distributor of
aftermarket replacement parts for outdoor power equipment and forestry applications.
.

INVESTMENT ACTIVITY | 43
October 2018: PE MENA portfolio company L’azurde, closed the acquisition of 100% of the equity
of Izdiad, the Saudi Franchisee of the TOUS international jewellery brand, operating
26 TOUS franchise stores in Saudi Arabia. TOUS is an international lifestyle brand
focused on affordable luxury jewelry with more than 620 stores in over 53 countries.
November 2018: PE North America partner company AlixPartners, acquired independent financial
advisory and interim management firm Zolfo Cooper. The transaction follows
AlixPartners' successful acquisition of Zolfo Cooper's European franchise in February
2015 and will further bolster the Firm's turnaround and restructuring credentials.
November 2018: PE North America portfolio company KSI Trading Corp acquired Richmond Bumper,
a leading distributor of automotive aftermarket parts to collision repair shops in Virginia
and North Carolina.
January 2019: PE North America portfolio company ICR closed its first add-on acquisition in its more
than 20-year history with its acquisition of Westwicke Partners. Westwicke is a
healthcare-focused strategic communications firm providing investor relations and
capital markets advisory services. Westwicke will expand ICR's presence in the
healthcare market, while ICR will provide Westwicke with several add-on service
offerings, including PR and digital.
January 2019: PE Europe portfolio company Kee Safety, acquired Scotland-based APS which
provides Kee Safety with a leading market position in Scotland.
February 2019: PE North America portfolio company UTA, acquired leading influencer firm Digital
Brand Architects (DBA). DBA is the leading independent company representing many
of the world’s most impactful and engaging digital influencers. The acquisition further
strengthens and expands UTA’s market-leading efforts in the Digital Media sector and
in the fast-growing Digital Talent marketplace.
February 2019: PE MENA portfolio company NDT CCS, closed the acquisition of International
Inspection Center Co., Kuwait’s largest provider of industrial non-destructive testing
and inspection services.
March 2019: PE Europe portfolio company Kee Safety, acquired UK-based Planet Platform which
provides Kee Safety with an additional product assortment.
June 2019: PE Europe portfolio company Kee Safety, acquired Canada-based Safeguard which
marks its fifth add-on acquisition under Investcorp ownership.
New Acquisitions: Real Estate
Investcorp focuses on the acquisition of existing core and core-plus commercial and residential real estate
assets situated in many of the largest and most diversified markets in the US and Europe. The Firm seeks
properties that can offer investors an attractive current return and the potential for capital appreciation
through hands-on asset management, revenue improvements, expense rationalization and value-added
capital improvements. The majority of real estate investments are structured in a Shari’ah compliant
manner.
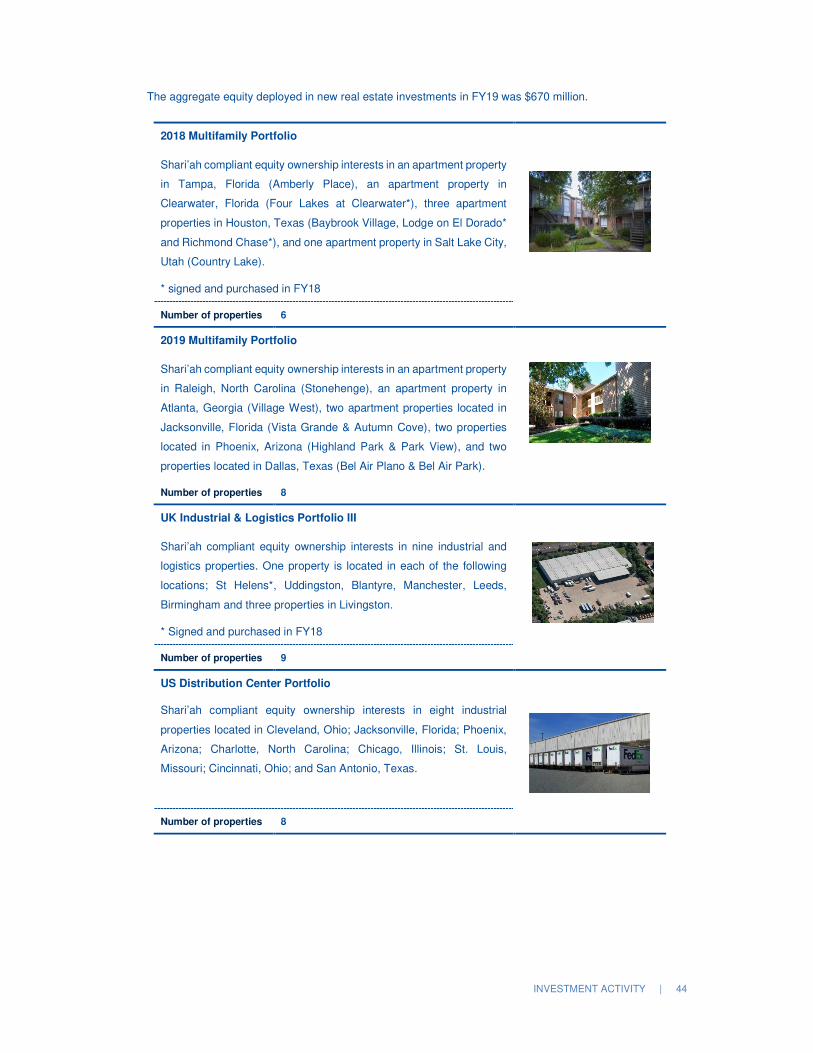
INVESTMENT ACTIVITY | 44
The aggregate equity deployed in new real estate investments in FY19 was $670 million.
2018 Multifamily Portfolio
Shari’ah compliant equity ownership interests in an apartment property
in Tampa, Florida (Amberly Place), an apartment property in
Clearwater, Florida (Four Lakes at Clearwater*), three apartment
properties in Houston, Texas (Baybrook Village, Lodge on El Dorado*
and Richmond Chase*), and one apartment property in Salt Lake City,
Utah (Country Lake).
* signed and purchased in FY18
Number of properties 6
2019 Multifamily Portfolio
Shari’ah compliant equity ownership interests in an apartment property
in Raleigh, North Carolina (Stonehenge), an apartment property in
Atlanta, Georgia (Village West), two apartment properties located in
Jacksonville, Florida (Vista Grande & Autumn Cove), two properties
located in Phoenix, Arizona (Highland Park & Park View), and two
properties located in Dallas, Texas (Bel Air Plano & Bel Air Park).
Number of properties 8
UK Industrial & Logistics Portfolio III
Shari’ah compliant equity ownership interests in nine industrial and
logistics properties. One property is located in each of the following
locations; St Helens*, Uddingston, Blantyre, Manchester, Leeds,
Birmingham and three properties in Livingston.
* Signed and purchased in FY18
Number of properties 9
US Distribution Center Portfolio
Shari’ah compliant equity ownership interests in eight industrial
properties located in Cleveland, Ohio; Jacksonville, Florida; Phoenix,
Arizona; Charlotte, North Carolina; Chicago, Illinois; St. Louis,
Missouri; Cincinnati, Ohio; and San Antonio, Texas.
Number of properties 8

INVESTMENT ACTIVITY | 45
Frankfurt and Hamburg Properties Portfolio
Shari’ah compliant equity ownership interests in two office properties
located in Frankfurt and Hamburg.
Number of properties 2
In addition, 14 residential properties were acquired in the U.S. These properties will form parts of two new
portfolios and a fund which are expected to be offered to clients in FY20.
Credit Management
The aggregate amount of new investments activities associated with CLO assembly during FY19 was
$1.5 billion. This included $436 million related to the assembly and issuance of two new US CLOs,
Jamestown XI and Jamestown XII. It also included $729 million related to the assembly and issuance of
two new European CLOs, Harvest XX and Harvest XXI. In addition, the aggregate amount included
warehousing of $305 million for one new US CLO and two new European CLO which are all expected to
close in H1 FY20.
The European team worked on one reset during this period. The Harvest XVI CLO (originally issued in
June 2014) was reset in September 2018; the total value of this transaction was in excess of $478 million.
Reset activity is beneficial both to clients wanting liquidity and/or an extended investments horizon and
also to the business as a reset effectively allows the CLO manager to extend the lives of the deals, thereby
extending the period over which management fees will be generated. In addition, resets typically provide
additional returns to equity investors.

REALIZATIONS & DISTRIBUTIONS | 46
Realizations & Distributions
Total realization proceeds and other distributions to Investcorp and its clients were $4.0 billion in FY19.
Private Equity Realizations
Total private equity realization proceeds and other distributions to Investcorp and its clients were $2.2
billion in FY19.
Nobel Learning Communities
A leading provider of private education in the US
Date of Investment April 2015
Date of Realization August 2018
Investors Deal-by-deal
Industry Sector Business services – Knowledge & professional
services
Gulf Cryo
A leading manufacturer, distributor and services provider of industrial
gases
Date of Investment November 2009
Date of Realization August 2018
Investors Gulf Opportunities Fund I
Industry Sector Industrial products
ATC Telecom Infrastructure Limited (previously “Viom Networks”)
A leading independent passive telecom infrastructure provider
Date of Investment August 2009
Date of Realization March 2019 / June 2019
Investors IDFC Private Equity Fund III
Industry Sector Telecom
Manipal Integrated Services (previously “Manipal Education and Medical
Group India Private Limited”)
A holding company of the Manipal Group’s healthcare and education
businesses in India
Date of Investment October 2013
Date of Realization March 2019
Investors IDFC Private Equity Fund III
Industry Sector Healthcare, Education

REALIZATIONS & DISTRIBUTIONS | 47
In August 2018, Investcorp announced it had completed the sale of Nobel Learning Communities
(‘Nobel Learning’) to Spring Education Group, the leading Pre K-12 private school operator in the US and
a portfolio company of Primavera Capital Group, a leading Asia-based investment firm. Since acquiring
Nobel Learning in 2015, Investcorp has worked closely with the company to achieve significant growth,
acquiring 25 schools, opening nine greenfields and driving organic enrollment thereby collectively
achieving EBITDA growth of 50% during its period of ownership.
Also, in August, Investcorp completed the sale of its remaining 15.65% equity shareholding in Gulf Cryo
Holding Company K.S.C.C (‘Gulf Cryo’) to other shareholders of the company. Established in 1953, Gulf
Cryo is a leading manufacturer, distributor and service provider of industrial gases in the Middle East. Gulf
Cryo manufactures industrial, medical and specialty gases for a wide range of industries and applications
Deepak Cables (India) Limited
One of the leading players in the power Transmission & Distribution
(T&D) space in India
Date of Investment December 2008
Date of Realization March 2019
Investors IDFC Private Equity Fund III
Industry Sector Power
The Wrench Group
A national leader in home maintenance and repair services
Date of Investment March 2016
Date of Realization April 2019
Investors Deal-by-deal
Industry Sector Consumer services
Leejam
A leading fitness chain operator in Saudi Arabia
Date of Investment July 2013
Date of Realization May 2019
Investors Gulf Opportunities Fund I / Deal-by-deal investors
Industry Sector Consumer services
SecureLink
A leading cybersecurity infrastructure and managed services provider
Date of Investment December 2015
Date of Realization Signed in May 2019
Investors Deal-by-deal
Industry Sector Technology – Security
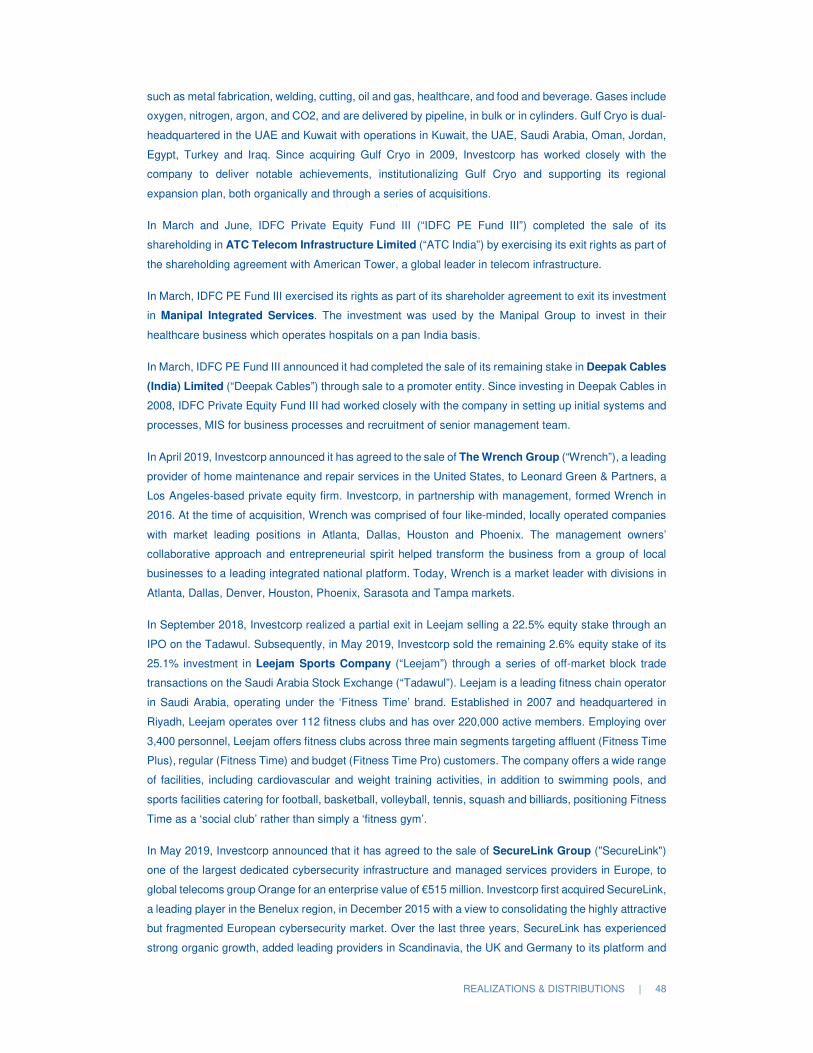
REALIZATIONS & DISTRIBUTIONS | 48
such as metal fabrication, welding, cutting, oil and gas, healthcare, and food and beverage. Gases include
oxygen, nitrogen, argon, and CO2, and are delivered by pipeline, in bulk or in cylinders. Gulf Cryo is dual-
headquartered in the UAE and Kuwait with operations in Kuwait, the UAE, Saudi Arabia, Oman, Jordan,
Egypt, Turkey and Iraq. Since acquiring Gulf Cryo in 2009, Investcorp has worked closely with the
company to deliver notable achievements, institutionalizing Gulf Cryo and supporting its regional
expansion plan, both organically and through a series of acquisitions.
In March and June, IDFC Private Equity Fund III (“IDFC PE Fund III”) completed the sale of its
shareholding in ATC Telecom Infrastructure Limited (“ATC India”) by exercising its exit rights as part of
the shareholding agreement with American Tower, a global leader in telecom infrastructure.
In March, IDFC PE Fund III exercised its rights as part of its shareholder agreement to exit its investment
in Manipal Integrated Services. The investment was used by the Manipal Group to invest in their
healthcare business which operates hospitals on a pan India basis.
In March, IDFC PE Fund III announced it had completed the sale of its remaining stake in Deepak Cables
(India) Limited (“Deepak Cables”) through sale to a promoter entity. Since investing in Deepak Cables in
2008, IDFC Private Equity Fund III had worked closely with the company in setting up initial systems and
processes, MIS for business processes and recruitment of senior management team.
In April 2019, Investcorp announced it has agreed to the sale of The Wrench Group (“Wrench”), a leading
provider of home maintenance and repair services in the United States, to Leonard Green & Partners, a
Los Angeles-based private equity firm. Investcorp, in partnership with management, formed Wrench in
2016. At the time of acquisition, Wrench was comprised of four like-minded, locally operated companies
with market leading positions in Atlanta, Dallas, Houston and Phoenix. The management owners’
collaborative approach and entrepreneurial spirit helped transform the business from a group of local
businesses to a leading integrated national platform. Today, Wrench is a market leader with divisions in
Atlanta, Dallas, Denver, Houston, Phoenix, Sarasota and Tampa markets.
In September 2018, Investcorp realized a partial exit in Leejam selling a 22.5% equity stake through an
IPO on the Tadawul. Subsequently, in May 2019, Investcorp sold the remaining 2.6% equity stake of its
25.1% investment in Leejam Sports Company (“Leejam”) through a series of off-market block trade
transactions on the Saudi Arabia Stock Exchange (“Tadawul”). Leejam is a leading fitness chain operator
in Saudi Arabia, operating under the ‘Fitness Time’ brand. Established in 2007 and headquartered in
Riyadh, Leejam operates over 112 fitness clubs and has over 220,000 active members. Employing over
3,400 personnel, Leejam offers fitness clubs across three main segments targeting affluent (Fitness Time
Plus), regular (Fitness Time) and budget (Fitness Time Pro) customers. The company offers a wide range
of facilities, including cardiovascular and weight training activities, in addition to swimming pools, and
sports facilities catering for football, basketball, volleyball, tennis, squash and billiards, positioning Fitness
Time as a ‘social club’ rather than simply a ‘fitness gym’.
In May 2019, Investcorp announced that it has agreed to the sale of SecureLink Group ("SecureLink")
one of the largest dedicated cybersecurity infrastructure and managed services providers in Europe, to
global telecoms group Orange for an enterprise value of €515 million. Investcorp first acquired SecureLink,
a leading player in the Benelux region, in December 2015 with a view to consolidating the highly attractive
but fragmented European cybersecurity market. Over the last three years, SecureLink has experienced
strong organic growth, added leading providers in Scandinavia, the UK and Germany to its platform and

REALIZATIONS & DISTRIBUTIONS | 49
expanded in China. Investcorp, in partnership with management and founders of the Company, has
successfully executed a targeted buy-and-build strategy and transformed SecureLink from a regional
leader to a leading pan-European provider of cybersecurity services. The sale closed in July 2019.
Other Transactional Activities
December 2018: PE-Tech received an offer from HarbourVest to acquire 100% of the remaining
portfolio companies in Investcorp Technology Partners III, L.P. at the June 2018
valuation. Following the conclusion of an offer period, HarbourVest and Investcorp
entered into a binding agreement and the transfer of the assets completed in
December 2018. Investcorp Technology Partners will remain manager of the assets.
March 2019: PE North America portfolio company PRO Unlimited successfully upsized existing
facilities to pay a dividend to investors.
April 2019: PE Europe has successfully closed a secondary transaction with Coller Capital where
Investcorp has transferred some of its assets from its European private equity
portfolio, under a new fund arrangement. The new fund was capitalized with
approximately $1 billion of aggregate commitments with Investcorp retaining a
continued interest in the portfolio through a meaningful GP commitment to the fund.
The transaction also includes fresh capital for any follow-on investments, future
investments and co-investments.
May 2019: PE North America portfolio company AlixPartners successfully refinanced existing
facilities to pay a dividend to investors. The refinancing is consistent with Investcorp's
initial investment thesis of deriving significant cash yield from interim distributions
given the company's high cash flow generation.
May 2019: PE North America portfolio company Paper Source completed a debt refinancing.
May 2019: PE Europe portfolio company POC successfully completed its refinancing at attractive
market conditions. The package comprises of a term loan, revolving credit facility and
a seasonal facility.
June 2019: PE North America portfolio company Sur La Table completed a debt refinancing.

REALIZATIONS & DISTRIBUTIONS | 50
Real Estate Realizations
Total real estate realization proceeds and other distributions to Investcorp and its clients were $662 million
in FY19.
Six portfolios were fully realized in FY19 with the sale of Fairways at Towson from 2015 Residential I
Portfolio, the sale of Newark Hilton from National Hotel Portfolio, the sale of Highlands Campus Tech
from 2014 Office and Industrial Portfolio, the sale of Oracle & International Centre from 2013
Commercial Properties Portfolio and 2014 Office, and the sale of Villas at Green Valley,
A complete list of real estate properties realized in FY19 can be found below.
Mountaingate Plaza
A grocery-anchored retail center and a medical office building.
Date of Investment August 2013
Date of Realization July 2018
Portfolio Name 2013 US Commercial and 2014 Office Properties
Portfolios
Location Simi Valley, California
114 Old Country Road
One of 3 buildings in the Long Island Office Portfolio
Date of Investment November 2013
Date of Realization August 2018
Portfolio Name 2013 US Commercial and 2014 Office Properties
Portfolios
Location Long Island, New York
Fairways at Towson
An 828-unit multifamily property.
Date of Investment March 2015
Date of Realization August 2018
Portfolio Name 2015 Residential I Portfolio
Location Towson, Maryland
Cherry Creek
A 561-unit multifamily property
Date of Investment September 2015
Date of Realization September 2018
Portfolio Name 2015 Residential II Portfolio
Location Denver, Colorado

REALIZATIONS & DISTRIBUTIONS | 51
Rosemont at Vinings Ridge
A 494-unit multifamily property
Date of Investment August 2015
Date of Realization October 2018
Portfolio Name 2015 Residential II Portfolio
Location Atlanta, Georgia
666 Old Country Road
120,000 square foot office building. Part of Long Island Office
Portfolio
Date of Investment October 2013
Date of Realization October 2018
Portfolio Name 2013 US Commercial and 2014 Office Portfolios
Location Long Island, New York
Newark Hilton
A 253-room hotel
Date of Investment August 2011
Date of Realization October 2018
Portfolio Name National Hotel Portfolio
Location Newark, New Jersey
Highlands Campus Tech
A 201,766 square foot mixed-use campus that includes two flex-use
and/or research and development buildings and one office building
Date of Investment September 2014
Date of Realization December 2018
Portfolio Name 2014 Office and Industrial Portfolio / 2014 Office
and Industrial Expanded Portfolio
Location Bothell, Washington
Canal Center / Building 11
A 77,000 square foot office building
Date of Investment October 2014
Date of Realization December 2018
Portfolio Name Canal Center and 2014 Office & Industrial
Expanded
Location Alexandria, Virginia
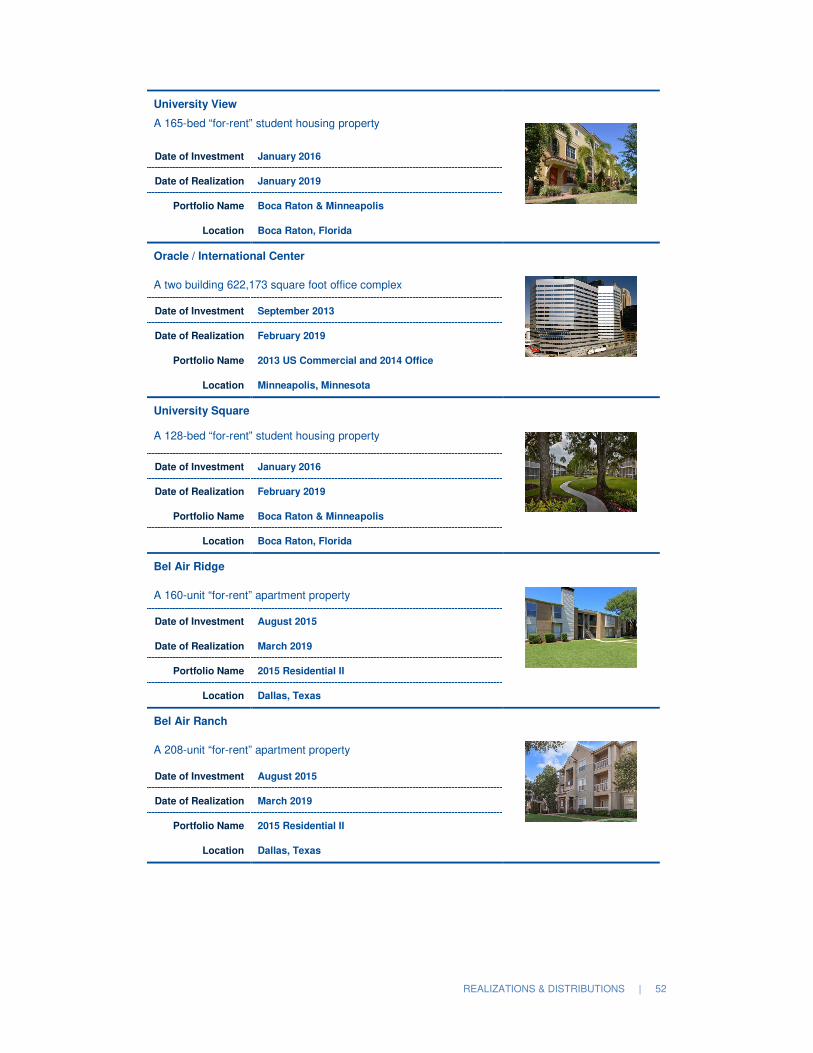
REALIZATIONS & DISTRIBUTIONS | 52
University View
A 165-bed “for-rent” student housing property
Date of Investment January 2016
Date of Realization January 2019
Portfolio Name Boca Raton & Minneapolis
Location Boca Raton, Florida
Oracle / International Center
A two building 622,173 square foot office complex
Date of Investment September 2013
Date of Realization February 2019
Portfolio Name 2013 US Commercial and 2014 Office
Location Minneapolis, Minnesota
University Square
A 128-bed “for-rent” student housing property
Date of Investment January 2016
Date of Realization February 2019
Portfolio Name Boca Raton & Minneapolis
Location Boca Raton, Florida
Bel Air Ridge
A 160-unit “for-rent” apartment property
Date of Investment August 2015
Date of Realization March 2019
Portfolio Name 2015 Residential II
Location Dallas, Texas
Bel Air Ranch
A 208-unit “for-rent” apartment property
Date of Investment August 2015
Date of Realization March 2019
Portfolio Name 2015 Residential II
Location Dallas, Texas

REALIZATIONS & DISTRIBUTIONS | 53
Towne Lake
A 320-unit “for-rent” apartment property
Date of Investment August 2015
Date of Realization March 2019
Portfolio Name 2015 Residential II
Location Dallas, Texas
Westmoor Place
A three-property office park
Date of Investment April 2013
Date of Realization April 2019
Portfolio Name 2013 Office II Portfolio
Location Denver, Colorado
Villa Blanco
A 379-unit “for-rent” apartment property
Date of Investment May 2016
Date of Realization May 2019
Portfolio Name 2016 Residential
Location Tempe, Arizona
Villas at Green Valley
A 609-unit “for-rent” apartment property
Date of Investment December 2016
Date of Realization May 2019
Portfolio Name Villas at Green Valley
Location Las Vegas, Nevada
Stone Mountain Portfolio
A 4.1 million square foot industrial park comprised of 69 buildings
Date of Investment December 2015
Date of Realization May 2019
Portfolio Name 2015 Office & Industrial Portfolio
Location Atlanta, Georgia

REALIZATIONS & DISTRIBUTIONS | 54
Other Realizations and Distributions
A total of $65 million of distributions to Investcorp and its clients was made across all Special Opportunities
Portfolios, primarily from Special Opportunities Portfolios IV and VI.
Total credit management realization proceeds and other distributions to Investcorp and its clients
amounted to $1.0 billion over the period.
Blackstone Science Square
A 76,123 square foot lab/office property
Date of Investment October 2016
Date of Realization June 2019
Portfolio Name Boston & Denver Commercial
Location Cambridge, Massachusetts
Ballardvale Office Portfolio
A three-building suburban office complex
Date of Investment October 2015
Date of Realization June 2019
Portfolio Name 2015 Office & Industrial Portfolio
Location Boston, Massachusetts
Paces West
A seventeen-story suburban office complex
Date of Investment November 2015
Date of Realization June 2019
Portfolio Name 2015 Office & Industrial Portfolio
Location Atlanta, Georgia

AUM & FUNDRAISING | 55
$23.6 90%
$2.1 8%
$0.6 2%
Clients AUM Balance sheet co-investment AUM Affiliates & co-investors AUM
Total AUM$26.3b
Total AUM$28.2b
As of June 30, 2018
$25.4 90%
$2.0 7%
$0.8 3%
As of June 30, 2019
Private Equity Absolute Return Investments Real estate investments
Credit management investments Client monies held in trust
$3.9 16%
$3.5 15%
$4.7 20%
$11.1 47%
$0.4 2%
As of June 30, 2018
Total Client AUM $23.6b
$4.9 19%$3.7
15%
$5.0 20%
$11.2 44%
$0.6 2%
Total Client AUM$25.4b
As of June 30, 2019
AUM & Fundraising
Assets under management (‘AUM’) 1 2
Please refer to the table in Note 2 of the Consolidated Financial Statements of Investcorp Bank B.S.C.,
which summarizes total assets under management in each of the reporting segments.
Total assets under management ($ billions)
Total AUM increased to $28.2 at June 30, 2019 from $26.3 billion at June 30, 2018, largely driven by
growth in PE & CM AUM.
Associate’s assets under management, which is not included in the total AUM numbers shown above,
stands at $5.7 billion as at June 30, 2019. This represents AUM managed by Banque Paris Bertrand, in
which Investcorp holds an indirect ownership and is entitled to a net return based on its ownership.
Total client assets under management ($ billions)
Total client AUM increased by 8% to $25.4 billion at June 30, 2019 from $23.6 billion at June 30, 2018.
1 Includes $2.9 billion (June 30, 2018: $2.4 billion) of hedge fund partnerships (including exposure through multi-manager solutions) managed by third party managers and assets subject to a non-discretionary advisory mandate where Investcorp receives fees calculated on the basis of AUM. 2 Real estate investments AUM is stated at gross asset value.

AUM & FUNDRAISING | 56
The most dominant asset class in client AUM continues to be credit management with 44% of the total.
The increase in total client AUM in FY19 is largely attributable to the 29% increase in private equity client
AUM from $3.8 billion to $4.9 billion, largely due to strong fundraising for the Firm’s first China-focused
investment offering, the final closing of Investcorp’s fourth technology fund, the closing of Investcorp’s
European Buyout Fund 2019 in partnership with Coller Capital and the addition of AUM following the
acquisition of IDFC’s private equity business in India. ARI client AUM has increased by 4% to $3.7 billion,
primarily due to strong fundraising for the Firm’s hedge funds partnerships platform particularly for Nut
Tree Capital Management and Shoals Capital Management, partially offset by the anticipated roll-off of
older, less profitable AUM. Real estate client AUM increased by 6% to $5.0 billion with strong fundraising
for new portfolios as well as the addition of AUM following the acquisition of IDFC’s real estate business
in India. Credit management client AUM has increased by 1% to $11.2 billion.
Private equity investments ($ millions) Jun-19 Jun-18 % Change
B/(W)
Client AUM
Closed-end funds 2,217 1,098 >100%
Deal-by-deal investments 2,544 2,749 (7%)
Special opportunities portfolios 181 - n.m.
Total client AUM – at year-end 4,942 3,847 29%
Average client AUM 4,394 3,760 17%
Real estate investments ($ millions) Jun-19 Jun-18 % Change
B/(W)
Client AUM
Closed-end funds (Mezzanine/debt) 134 6 >100%
Deal-by-deal investments 4,820 4,654 4%
Total client AUM – at year-end 4,954 4,660 6%
Average client AUM 4,807 4,360 10%
Credit management investments ($ millions) Jun-19 Jun-18 % Change
B/(W)
Client AUM
Closed-ended funds 10,975 10,772 2%
Open-ended funds 258 355 (27%)
Total client AUM – at year-end 11,233 11,127 1%
Average total client AUM 11,180 10,855 3%
Absolute returns investments ($ millions) Jun-19 Jun-18 % Change
B/(W)
Client AUM
Multi-manager solutions 1,605 2,004 (20%)
Hedge funds partnerships 1,949 1,371 42%
Special opportunities portfolios 96 121 (21%)
Alternative Risk Premia 38 38 0%
Total client AUM – at year-end 3,688 3,534 4%
Average total client AUM 3,610 3,396 6%

AUM & FUNDRAISING | 57
Geographical split of client assets under management ($ billions)
As at June 30, 2019 61% of the Firm’s client assets under management are from outside of the Gulf
region, broadly in line with 2018.
Fundraising
During FY19, fundraising in Investcorp's core Gulf markets was strong, despite the challenging macro-
economic and political conditions. The strength in fundraising was driven by continued client appetite for
attractive alternative investments. Total deal-by-deal fundraising including new commitments into
institutional investor programs increased by 29% to $1.4 billion, which is an all-time record and marks the
fifth consecutive year that Investcorp has crossed the significant threshold of $1 billion in deal-by-deal
placement activity.
Total private equity deal-by-deal placement was up 54% to $742 million in FY19 from $482 million in
FY18. Private equity placement included for the first time the full placement of United Talent Agency, a
US portfolio company, in the United States, the placement of the Firm’s debut China-focused investment
offering in partnership with China Everbright Limited and the placement of the Firm’s first India-focused
investment offering, the India Consumer Growth Portfolio. It also included new offerings for Cambio,
Health Plus Management and Revature.
Total real estate deal-by-deal placement across six new portfolios and three portfolios carried over from
the previous year increased by 12% to $639 million in FY19 from $569 million in FY19.
Total deal-by-deal placement ($ millions)
1,095 1,017
1,147 1,099
1,416
FY15 FY16 FY17 FY18 FY19
PE ARI & CM RE

AUM & FUNDRAISING | 58
Fundraising continued in FY19 for Investcorp’s fourth technology fund, established to invest in European
lower middle market tech-enabled companies, with the focus shifting to investors outside of the Gulf. An
additional $77 million in new commitments was raised during the first half of FY19. The fund is fully
subscribed as at December 31, 2018 with a final close of $403 million. Furthermore, the Firm has
successfully closed the transfer of its remaining two portfolio companies in ITP Fund III, with a combined
enterprise value of $185 million, to a continuation vehicle, Investcorp Technology Secondary Fund 2018
L.P. which is supported by HarbourVest. In addition, the Firm has successfully closed a fund of
approximately $1 billion with Coller Capital where Investcorp has transferred some of its European private
equity investments that it had previously acquired through various deal-by-deal transactions and obtained
new commitments for follow-on investments, future investments and co-investments.
Fundraising in credit management totaled $2.0 billion in FY19. A total of $1.8 billion was raised from the
issuance of two new CLOs in the US and two new CLOs in Europe. New subscriptions into the two open-
ended senior secured loan funds, the ICM Senior Loan Fund and the ICM Global Floating Rate Income
Fund, totaled $125 million. An additional $86 million (€75 million) was raised from clients at the first close
of a new European risk retention fund for CLOs. The risk retention fund will act as an originator and invest
in CLO warehouse first loss tranches and hold the minimum 5% equity tranche investment required to
meet European risk retention rules for CLOs. The target total fund size for this fund is €200 million with
final close expected in FY20.
Total new subscriptions for ARI products in FY19 amounted to $1.2 billion. ARI fundraising includes $27
million for a new strategic capital product focused on acquiring minority equity stakes in the general
partners of established, mid-sized alternative asset managers, including private equity, private debt, real
estate, venture capital and hedge fund managers. The increase in client AUM during the year of $154
million compared to the $1.2 billion fundraising reflects redemptions in the period largely related to the
anticipated roll-off of older, less profitable AUM. In addition, $267 million of new subscriptions during the
year are client commitments that were not funded at year-end and therefore were not included in year-
end AUM.
Total Fundraising – by product ($ millions)
1,347
2,464 2,673
3,478
5,727
FY15 FY16 FY17 FY18 FY19
CM PE RE ARI

PORTFOLIO PERFORMANCE | 59
Portfolio Performance
Private Equity
At June 30, 2019, the carrying value of Investcorp’s balance sheet co-investment in PE, excluding strategic
investments and underwriting, was $491 million (invested in 41 companies) compared with $609 million at June
30, 2018 (invested in 40 companies). This represents 48% of total balance sheet co-investments at June 30, 2019
(FY18: 52% at June 30, 2018). PE underwriting at June 30, 2019 was $51 million (FY18: $123 million at June 30,
2018).
The private equity portfolio is diversified by sector and geography across North America, Europe, Asia and the
MENA region, including Turkey.
Please refer to the table in Note 12 (A) of the Consolidated Financial Statements of Investcorp Bank B.S.C., which
summarizes the June 30, 2019 and June 30, 2018 carrying values of PE co-investments by region and investment
sector.
At June 30, 2019, Investcorp’s aggregate PE North America co-investments were $207 million invested in 13
portfolio companies (FY18: $242 million at June 30, 2018 invested in 13 portfolio companies). Aggregate PE
Europe co-investments were $106 million invested in 16 portfolio companies and an initial investment in a special
opportunity in the German dental sector (FY18: $216 million at June 30, 2018 invested in 13 portfolio companies).
Aggregate PE MENA co-investments were $174 million invested in 12 portfolio companies (FY18: $151 million at
June 30, 2018 invested in 14 portfolio companies). Aggregate PE Asia co-investments were $4 million invested in
a special opportunity.
For investments in the technology sector, clients participate on a portfolio basis through dedicated technology
funds, in which Investcorp is a co-investor, as well as through direct investments on a deal-by-deal basis. Investcorp
has raised four technology funds to date of which two are currently active. In December, Investcorp announced
that it had successfully closed the transfer of its remaining two portfolio companies in its Technology Fund III to a
continuation vehicle supported by HarbourVest. Investcorp will continue to manage the remaining investments,
however the balance sheet and Investcorp’s clients have fully realized their investments in the fund.
For PE MENA investments, clients participate on a portfolio basis through a dedicated fund, the Gulf Opportunity
Fund I, in which Investcorp is a co-investor, as well as through direct investments on a deal-by-deal basis.
5%
0
0
12%
0
1
28%
23%
19%
3%
23%
3%1%
Consumerproducts
Telecom Industrial products Industrial /Business services
Technology Consumer services Healthcare
Asia MENA and Turkey Europe North America

PORTFOLIO PERFORMANCE | 60
Please refer to the Private Equity Portfolio Listing section in this Business Review which describes each of the PE
North America, PE Europe, PE MENA and PE Asia portfolio companies. Please refer to the Investments and
Realizations section for portfolio company activities during FY19.
On average, Investcorp’s direct investments in mid-market companies in the US and Europe increased their
aggregate EBITDA by 7% year-on-year, benefiting from a supportive economic environment as well as from
Investcorp’s post-acquisition efforts to grow value. Aggregate EBITDA for the MENA portfolio companies also
increased by 7% during the year on a constant currency basis, however companies in Turkey were negatively
impacted on a USD basis by the significant depreciation in the Turkish Lira versus the dollar during the year.
Aggregate EBITDA across the portfolio in all regions was approximately $1.3 billion and the average debt across
the portfolio is relatively modest at 3.5x.
The FY19 add-on investments discussed previously in Investment Activity and realizations discussed previously in
Realizations & Distributions reflect Investcorp's strong post-acquisition focus during its period of ownership.
Other private equity news
July 2018: PE Europe portfolio company Dainese, opened its London store on 56 Commercial Street, a
trendy area close to Old Spitalfields Market. The store is the reference point for those who love
dynamic sports and allows customers to get a hands-on look at Dainese's motorcycle, ski and
bike collections.
August 2018: PE North America portfolio company ICR, launched an Executive Advisory & Corporate
Transformation practice through an exclusive partnership with Elm Street advisors. This
practice will work with Boards, CEO’s, CFO’s and their teams as they navigate complex
situations to accelerate value-creating strategies.
October 2018: Dainese has joined the Altagamma Foundation, the prestigious association that, since 1992,
has been bringing together high-end cultural and creative companies recognized globally as
authentic ambassadors of Italian style. In becoming a member of the Altagamma Foundation,
Dainese joins such Italian players as Ferrari, Maserati, Lamborghini, Riva, and Ducati, as well
as many others from outside the automotive world - companies like Gucci, Cucinelli, Bulgari,
and Versace, that, just like Dainese since 1972, are true ambassadors of Italian style at an
international level.
December 2018: PE Europe portfolio company Dainese, opens their first store dedicated to winter sports in
Cortina, a fashionable resort in the Italian Dolomites. It is a pop-up store which will test the
viability of Dainese’s multi sports range to support a retail store.
December 2018: PE MENA portfolio company Theeb Rent A Car was awarded the 2018 Enterprise Agility
Award for “Best Car Rental Company in Saudi Arabia” by Entrepreneur Middle East. The event
took place at the Habtoor Palace in Dubai, UAE, which honored businesses and individuals
who have established themselves as clear industry innovators in their respective industries and
made prominent contributions across the Middle East.
January 2019: POC, Investcorp’s portfolio company, which has built a reputation on safety, innovation and
design, won esteemed ISPO awards for two of its freshly unveiled 2019/20 snow collections:
an ISPO ‘Gold winner’ award for the POCito VPD air vest + TRAX POC edition, an integrated
PORTFOLIO PERFORMANCE | 61
protection, alert and tracking system, that will allow parents to monitor and keep children safer
in the mountains, and an ISPO ‘Winner’ award for the new Obex BC with NFC chip helmet,
which thanks to the integrated technology, allows the helmet to communicate for you and help
first responders in the critical ‘Golden hour’ after an accident.
April 2019: PE Europe portfolio company ABAX, teamed up with Hitachi Construction Machinery (Europe)
NV (HCME). The new partnership means that ABAX market-leading software solutions will be
included in several of Hitachi's machinery to help owners access operational data via Global e-
Service on their machines, simplifying asset management for Hitachi, their dealers and Hitachi
end customers. This data also enables them to increase productivity, enhance efficiency,
maximize availability and reduce their running costs.
May 2019: Forbes named PE North America portfolio company, AlixPartners, as one of America’s best
management consulting firms. Forbes partnered with market research company Statista to
produce its annual ranking. The list was compiled by surveying 7,500 partners and executives
of management consultancies, as well as 1,000 senior executives who worked with such firms
over the last four years. AlixPartners was noted as a consulting firm best known for its work in
performance improvement.
May 2019: PE Europe portfolio company Dainese opened their first flagship store in Graz, Austria, the
reference point for those who love dynamic sports. Graz is the second Dainese store in Austria,
the other one being located in Vienna. At the end of May, Dainese also extended its presence
in the US by a store opening in Seattle, successfully continuing its retail activities. Further
openings are scheduled in H2 2019.
June 2019: PE Europe portfolio company POC, teamed up with Volvo Cars for a series of world-first crash
tests of bike helmets against cars. The project consists of a number of specially-designed crash
tests at Volvo’s safety research facilities in Gothenburg Sweden, and is part of a wider research
project to understand the types of long-term injuries sustained by cyclists.
June 2019: PE North America portfolio company ICR, has been tapped by indoor fitness startup Peloton
Interactive to handle all communications for its upcoming IPO. ICR will support Peloton, best
known for its exercise bikes and treadmills, on Investor Relations (IR) and Public Relations
(PR).
June 2019: PE MENA portfolio company Bindawood, was featured in the June 2019 issue of Forbes
Middle East, where Ahmad Bindawood, CEO of Saudi-based retail brands Bindawood and
Danube, led the push to digitize their old family-owned stores by embracing the latest trends in
e-commerce while using AI and blockchain to transform the in-store experience.
June: 2019: PE Europe portfolio company, Dainese, has been developing airbag garments for 25-plus
years and currently launched a line of D-Air® racing tracksuits and jackets and touring jackets.
The new Smart Jacket builds on the same D-Air technology used by MotoGP racers and adds
a new feature: stationary impact protection. Stationary impact protection isn’t necessary on
racetracks but offers significant additional protection to non-track riders. The latest innovation,
the Smart Jacket, takes the D-air airbag vest and turns it into a multifunctional item that can be
worn underneath or on top of any jacket, without requiring any form of connection to the bike.

PORTFOLIO PERFORMANCE | 62
The jacket feature, what Dainese are calling a ‘brain’ which is a small electronic control unit
that analyses 1,000 times per second the data from seven sensors hidden within the product.
When the system detects any ‘dangerous situations’ – such as extreme changes in angle, pitch
or yaw – the system is activated.
Absolute Return Investments (‘ARI’)
At June 30, 2019, the balance sheet carrying value of Investcorp’s co-investment in ARI was $112 million compared
with $189 million at June 30, 2018. The amount represents 11% of total balance sheet co-investments at June 30,
2019. Please refer to the table in Note 14 of the Consolidated Financial Statements of Investcorp Bank B.S.C.,
which summarizes the June 30, 2019 and June 30, 2018 carrying values.
Exposure Profile
Investcorp has consistently maintained a co-investment in the ARI business, in-line with its philosophy of co-
investing alongside its clients. Allocations were further reduced from FY18 levels due to the challenges faced by
underlying hedge fund managers in the current market environment.
The balance sheet co-investments in ARI consists of investments in managers who are on Investcorp’s hedge fund
partnerships platform, multi-manager solutions platform, alternative risk premia and co-investments in Investcorp’s
Special Opportunity Portfolios. As of June 30, 2019, Investcorp’s balance sheet co-investment in hedge fund
partnerships was $30 million, investment in multi-manager solutions was $29 million, investment in Special
Opportunities Portfolios was $43 million and investment in alternative risk premia was at $10 million,
Investcorp’s ARI exposure is primarily through customized accounts, similar to the structures created for
Investcorp’s large institutional clients.
Performance
During FY19, Investcorp’s ARI co-investment portfolio delivered returns of +5.8%. During the same period, the
industry benchmark, HFRI Fund of Funds Composite Index, returned +1.3%.
The market environment for Investcorp’s invested managers was mixed during this fiscal year. Conditions were
favorable for fundamental strategies and more challenging for systematic and factor-based strategies. Managers
with whom Investcorp has seed partnership arrangements delivered positive performance of 9.6% in FY19, led by
Steamboat which returned +27.0%. Investments in Special Opportunity Portfolios returned 7.3% and Investcorp’s
external liquid manager portfolio returned 0.7%. Investcorp’s Geo Risk investment generated negative performance
during the fiscal year.
Liquidity
Investcorp’s ARI co-investment portfolio is constructed so that a significant portion of it is available for monetization
within a three to twelve-month window. As of June 30, 2019, approximately 24% of Investcorp’s ARI co-investment
was contractually available for monetization within a three-month window and 68% was available within a twelve-
month window.

PORTFOLIO PERFORMANCE | 63
Absolute Return Investments Portfolio News
Investcorp’s first co-seeding deal has delivered strong performance in FY19 (see above in Performance).
Investcorp partnered with another large institution, that provided acceleration capital to Steamboat Capital
Management LLC (‘Steamboat’), a $300 million New York-based long-short equity, fundamental, value-oriented
investment firm. Steamboat Capital seeks to capitalize on market dislocations while maintaining a margin of safety
for its investors.
Shoals Capital Management (‘Shoals’), an Investcorp hedge fund seed partnership, currently manages
approximately $365 million (as of July 1, 2019). Investcorp and other institutional investors, including a large U.S.
pension plan, provided strategic capital to Shoals. Shoals employs an event-driven strategy focused on investing
across capital structure and sub-sectors in the financial sector, specifically targeting opportunities that arise from
changes in regulatory and capital market conditions.
Investcorp hedge fund seed partnership, Nut Tree, which launched its credit fund in February 2016 with $100
million, continues to perform and investor in-flows fund assets have increased to over $1.3 billion as of July 1,
2019. Nut Tree pursues an all-weather fundamental credit strategy, focusing on mid-market stressed and
distressed credit and value equities across North America.
Membership of Investcorp’s Seeding Club, launched in 2017, now includes family offices, university endowments,
and fund of funds. The club provides a select group of investment partners with potential benefits that include
access to the broad ARI manager sourcing network; access to the ARI infrastructure, expertise and capabilities;
enhanced returns through seed economics; and flexibility through a deal-by-deal opt-in structure.
In FY19 Investcorp launched the Strategic Capital Partners strategy within the Absolute Return Investments Group.
The strategy will focus on acquiring minority equity stakes in the GPs of established, mid-sized alternative asset
managers, including private equity, private debt, real estate, venture capital and hedge fund managers. To guide
the Strategic Capital Partners business, Investcorp hired Anthony Maniscalco who has over 25 years of experience
and was formerly Managing Director and Co-Head of Credit Suisse’s Anteil Capital Partners business. Prior to
Credit Suisse, Anthony was on the leadership team of Blackstone Strategic Capital Holdings, a vehicle focused on
acquiring minority interests in alternative asset managers. Joining Anthony is David Lee, as a Partner, and Dhanraj
Chandiramani, as a Vice President, two of his former colleagues at Credit Suisse.
Special Opportunities Portfolio IV (‘SOP IV’), launched in January 2014, provides investors with access to US non-
performing loans. Approximately 93% of the portfolio is now resolved or performing, and the primary focus is on
returning cash to clients on a regular basis as the portfolio resolutions continue.
Special Opportunities Portfolio V (‘SOP V’) closed in August 2017 and is the first SOP tranche offered exclusively
to institutional investors. SOP V’s objective is to provide investors with access to Italian secured non-performing
loans for commercial and residential real estate that are purchased from regional Italian banks. SOP V has
successfully sourced and acquired twenty-eight (28) pools of NPLs at an aggregate cost of 31% of book value,
deploying 95% of the fund’s committed capital to date. Cash recoveries as at June 30, 2019, were currently in
excess of the base case business plan.
Special Opportunities Portfolio VI (‘SOP VI’) was launched in April 2016 and, like SOP IV, provides investors with
access to US non-performing loans. Approximately 91% of the portfolio is now resolved or performing and the
primary focus is on returning cash to clients on a regular basis as the portfolio resolutions continue.

PORTFOLIO PERFORMANCE | 64
Investcorp launched the Investcorp Geo-Risk Fund in December 2017 from a group of prestigious international
investors. The current AUM is $48 million. The fund is a UCITS-compliant, daily liquidity, discretionary global macro
fund that seeks to dynamically combine quantitative financial models with discretionary macro geopolitical risk
investments. This strategy is driven by a geopolitical risk assessment provided by a panel of global security experts.
Strategy Outlook
Looking forward to H1 FY2020, Investcorp has a neutral outlook for hedged equities funds as markets are trading
in a range bound environment. Investcorp has a slightly negative outlook on US equity managers; upside in equity
is limited with a Fed dovish bias already priced in. Current equity outlook is translated into a neutral view for special
situation managers as well, but the strategy offers diversification from traditional hedged equity funds. In the
merger arbitrage space, spreads have lagged a bit so far and a widening of the volatility may offer a tactical entry
point but Investcorp remains neutral for now. Outlook is slightly positive for equity market neutral as factor volatility
is expected to subside in the coming weeks. Macro discretionary investment style is still a high conviction as a
greater volatility environment offers opportunities for relative value/trading managers. Emerging market managers
are preferred and have diversification potential in a portfolio.
Investcorp remains neutral on macro systematic as this strategy is at risk in a range bound environment.
Opportunities are in foreign exchange and alternative markets rather than in rates where short positioning is
Strategy Outlook Rationale
Hedged equities NeutralExpected range bound markets, play managers with trading skills and be mindful of factor exposures to provide
balanced exposure
USSlightly
negativePath to further upside narrow as markets already price in aggressive Fed easing and limited trade risks here
Euro area ex UK NeutralValuations, monetary support and robust earnings growth. But greater exposure to geopolitical risks (T rade, Italy),
proceed carefully
Japan Neutral Reflation play attractive, support from valuations and strong exposure to global recovery
Asia ex Japan NeutralPositive momentum from global recovery but watch out for tightening in Chinese financial conditions and potential
spill-over effects and developments over trade negotiations
Event driven Neutral Benchmark expectations for higher-beta event-driven managers
Special situations NeutralPotential for diversifying value exposure relative to fundamental L/S funds. Seek diversification from
momentum/growth plays
Merger arbitrage Neutral Widening of volatility may offer tactical entry point but spreads have lagged a bit, stay neutral for now
Equity market neutralSlightly
positive
High factor volatility has been a headwind but could subside in coming weeks, find managers able to monetize
higher volatility amid lower liquidity
Macro discretionary PositiveGreater volatility should offer opportunities for RV/Trading managers but uncertainty over macro trends may limit
upside potential near term. EM still has a place in a diversified portfolio
Macro systematic NeutralTrend following at risk in range bound environment: lower potential in rates with crowded shorts, maybe better in
FX/alternative markets
FI relative value PositiveStrategy has adapted to new environment, less sensitive to balance-sheet scarcity and positioned to profit from
dislocations in funding
Corporate creditSlightly
negative
Limited carry and asymmetric liquidity profile leave us underweight. Few dislocations to capture; prefer niche plays
or wait for better entry points
Corporate distressed NeutralStay out of traditional corporate distressed plays as tight spreads leave very limited risk premium in distressed assets.
Look for idiosyncratic themes & opportunities
Structured credit NeutralTraditional structured credit offers limited carry and upside optionality, however idiosyncratic opportunities across
near CLO refi's and resets, callable RMBS, and near-maturity CMBS offer potentially attractive risk-adjusted reward
Convertible arbitrage Neutral Relatively cheap valuations should offer support. Tepid new issuance and liquidity remain a concern
Vol arbSlightly
positiveHigher volatility environment here to stay, cross-asset & cross region opportunities
PORTFOLIO PERFORMANCE | 65
crowded. Investcorp continues to overweight fixed income relative value as the strategy is now adapted to this
environment and less sensitive to balance sheet scarcity.
Outlook for corporate credit managers is slightly negative and Investcorp prefers to wait for a better entry point
given the limited carry and asymmetric liquidity profile. In distressed, Investcorp maintains its neutral stance.
Spreads continued to tighten and leave very limited risk premium in these markets. Investcorp is also neutral on
convertible arbitrage strategies. The current environment with tepid new issuances is still a headwind. Lastly,
Investcorp keeps its slight overweight on volatility arbitrage managers. Macro and geopolitical uncertainties
should help higher volatility to remain and create trading opportunities across products and geographies.
Real Estate Investment
At June 30, 2019, Investcorp’s RE balance sheet co-investments excluding underwriting totaled $68 million
compared with $76 million at June 30, 2018. The amount represents 7% of total balance sheet co-investments at
June 30, 2019.
Please refer to the table in Note 15 of the Consolidated Financial Statements of Investcorp Bank B.S.C., which
summarizes the June 30, 2019 and June 30, 2018 carrying values by portfolio type. For details on RE underwriting,
please refer to the table in Note 11 of the Consolidated Financial Statements of Investcorp Bank B.S.C.
RE co-investments were comprised of $68 million of marked-to-market equity investments and $0.1 million of debt
investments held at net amortized cost inclusive of any provisions for impairment.
Carrying values for Investcorp’s real estate co-investment by vintage year are shown below. Carrying values reflect
stable values for existing assets as well as the impact of exits and new acquisitions and placements during the
period.
Investcorp currently has 26 active real estate investment portfolios. As at June 30, 2019, 23 properties had been
acquired and were being warehoused for formation into new portfolios to be offered to clients in FY20. At June 30,
2019, 21 of these portfolios were on or ahead of plan. The remaining five have been written down significantly in
value already, are rated behind plan and are generally those holding hotels or offices in regions where the economic
environment has been generally subdued. Overall, the strategy for these portfolios is to position them for medium-
to long-term ownership in stable capital structures with modest or no additional capital investment.

PORTFOLIO PERFORMANCE | 66
Investcorp co-investment Properties # Geographic
by year ($m) vs. current * location Jun-19 Jun-18
Diversified VI 3 / 0 - -
Diversified VII 4 / 1 Industrial E
Hotel 9 / 1 Hotel SW
Vintage FY07 3 3
Commercial VI 3 / 0 - -
Vintage FY11 0 1
Southland & Arundel Mill Mezz n.a. ** Retail SE
Vintage FY12 0 0
2013 Off ice II 5 / 2 Office SE / SW
Vintage FY13 1 2
2013 US Commercial / 2014 Office 9 / 0 - -
Vintage FY14 0 8
Canal Center 4 / 3 Office E
2014 Off ice and Industrial 24 / 0 - -
2015 Residential 4 / 0 - -
Vintage FY15 1 3
2015 Residential II 8 / 1 Residential SW
2015 Off ice & Industrial 79 / 5 Office W
Boca Raton & Minneapolis Residential 5 / 3 Residential SE / MW
733 Tenth Street 1 / 1 Office E
Vintage FY16 5 9
2016 Residential 10 / 9 Residential MW / SE / E
Boston & Denver Commercial 20 / 16 Office / Industrial E / W
901 Fif th Street 1 / 1 Office W
New York & California Multifamily 2 / 2 Residential E / W
Villas at Green Valley 1 / 0 - -
Chicago & Boston Industrial 6 / 6 Industrial MW / E
Vintage FY17 9 10
Florida & Arizona Multifamily 6 / 6 Residential SE / SW
UK Industrial Logistics 9 / 9 Industrial UK
Midtow n Manhattan Off ice 2 / 2 Office E
2018 Residential 5 / 5 Residential SE / SW / MW
UK Industrial Logistics II 9 / 9 Industrial UK
2018 Warehouse 38 / 38 Industrial SE / SW / MW
Vintage FY18 19 20
German Office 2018 2 / 2 Office GER
US Industrial & Logistics 56 / 56 Industrial E / SW / MW
2018 Multifamily 6 / 6 Residential SE / SW / W
2019 Multifamily 8 / 8 Residential SE / SW
Frankfurt and Hamburg 2 / 2 Office / Industrial GER
US Distribution Center 8 / 8 Industrial MW / SW / SE
Vintage FY19 21 8
Others 1 12
Sub-total 349 / 202 60 76
New portfolios under construction 23 / 23 8 N.A.
Total including new portfolios
under construction 372 / 225 68 76
** Mezzanine investments.
W=West, E=East, SW =Southw est, SE=Southeast, MW=Midw est, UK=United Kingdom, GER=Germany
SectorCarrying value end of
* Portfolios w hich have been realized in this current reporting period, ref lecting a current property count of 0 (zero), are retained in this chart
as they contribute to the carrying value of the previous period.

PORTFOLIO PERFORMANCE | 67
Credit Management
At June 30, 2019, Investcorp’s CM balance sheet co-investments totaled $332 million compared with $272 million
at June 30, 2018. The amount represents 33% of total balance sheet co-investments at June 30, 2019.
Please refer to the table in Note 13 of the Consolidated Financial Statements of Investcorp Bank B.S.C., which
summarizes the June 30, 2019 and June 30, 2018 carrying values by geography.
The table below details the Investcorp co-investment exposure and total AUM by geography and by vintage year.
Performance information consists of the cash returned to equity holders to date at a summarized level by vintage
year.
Assets under management – Investcorp credit management ($m)
Fund Name3
Cash returned to
equity to date %1
Total AUM
Jun-19
Investcorp
AUM
Jun-19
FY 2014 83.26% 785 28
FY 2015 75.48% 1,468 56
FY 2016 51.28% 1,407 59
FY 2017 31.95% 945 40
FY 2018 19.40% 909 45
FY 2019 6.27% 910 46
European CLO Funds 6,424 274
FY 2013 95.14% 342 0
FY 2014 68.45% 346 0
FY 2015 10.39% 747 0
FY 2016 48.94% 995 0
FY 2017 40.79% 724 20
FY 2018 15.58% 997 13
FY 2019 N/a 446 15
US CLO Funds 4,597 48
CLO under construction 271 5
Other Funds2
578 44
Other 849 49
Total 11,870 371
1 % of equity cash distribution over par value of equity at launch
3 Fiscal year groupings are based on the closing date of a CLO
2 Other funds include Global Income Fund, European Middle Market Fund and Risk Retention Fund

PORTFOLIO PERFORMANCE | 68
Collateralized Loan Obligations (‘CLOs’)
CLO equity continues to provide investors with attractive current income cash distributions. In Europe, the average
annualized cash distribution on Investcorp’s ongoing 2.0 CLOs as at June 30 were 15.7% and, in the US, were
12.8%.
Global Floating Rate Income Fund (‘GIF’)
The ICM GIF1 produced a net return of 3.62% for FY 2019. Since inception in August 2015, the Fund’s annualized
net return is 4.11%.
Investcorp’s credit team is positioning the portfolio somewhat defensively due to the record length of the US
economic cycle. The team believes a US recession is unlikely this year, however it is carefully selecting loan issuers
that it believes can withstand a trough in the economic cycle with sustainable cash flow and strong asset coverage
to protect against downside risks. As such, the team has reduced the Fund’s exposure to CCC-rated loans from
3.5% at year-end to 1.22% at the end of June. Likewise, loans rated B+ or higher increased from 40.1% to 44.0%
over the same period (see Chart 1). In addition, the team has taken the view that the price stability of European
loans currently offers superior risk-adjusted returns to more volatile US loans. At December 2018 the Fund’s
currency exposure was 78% USD, 17% EUR, and 5% GBP. The team has shifted over the course of the first six
months of calendar 2019 to 72% USD, 24% EUR, and 4% GBP (see Chart 2). The team believes these portfolio
adjustments have enhanced returns this year.
1 USD Share Class
0%
10%
20%
30%
40%
50%
Dec-18 Jan-19 Feb-19 Mar-19 Apr-19 May-19 Jun-19
B+ or higher CCC-rated loans
Chart 1: Quality Exposure
0%
10%
20%
30%
40%
50%
60%
70%
80%
90%
Dec-18 Jan-19 Feb-19 Mar-19 Apr-19 May-19 Jun-19
USD GBP EUR
Chart 2: Currency Exposure

PRIVATE EQUITY PORTFOLIO LISTING | 69
Private Equity Portfolio Listing
As of June 30, 2019, Investcorp’s aggregate balance sheet co-investment amount in private equity investments was
$491 million invested across 41 portfolio companies and three special opportunity investments. The below sections
provide an overview of these portfolio companies and investments.
PE North America
As of June 30, 2019, Investcorp’s aggregate balance sheet co-investment amount in private equity investments in North
America was $207 million invested across 12 companies.
Portfolio Company Name Revature
Acquired February 2019
Industry Sector Business services – Technology enabled
services
Headquarters Virginia, US
Revature is a technology talent development company providing a turn-key talent acquisition solution for corporate
and government partners and no-cost coding immersion programs for university graduates. Revature recruits,
develops and deploys enterprise-ready technology talent, enabling its corporate partners to succeed and grow.
Through in-person, online and on-campus coding immersion programs, Revature creates a pathway for university
graduates with diverse backgrounds to build the knowledge, skills and abilities to reach their potential as technology
professionals. With its unique talent development strategy, Revature successfully serves a wide range of Fortune
500 enterprises, government organizations and top systems integrators.
https://revature.com
Portfolio Company Name Health Plus Management
Acquired January 2019
Industry Sector Business services – Healthcare
Headquarters New York, US
Health Plus Management (‘Health Plus’) is a market leader in clinical practice management in the physical medicine
and rehabilitation market. Health Plus provides independent physician practices with business development,
marketing and back-office support typically seen in much larger organizations, enabling its clients to start up and/or
grow their private practice beyond what might otherwise be feasible while maximizing clinical service and patient
care. Health Plus is based in Long Island, NY and employs approximately 250 dedicated team members.
http://www.healthplusmgmt.com

PRIVATE EQUITY PORTFOLIO LISTING | 70
Portfolio Company Name United Talent Agency
Acquired August 2018
Industry Sector Business services – Media
Headquarters California, US
United Talent Agency (‘UTA’) is the 3rd largest talent agency in the world representing many of the world’s most
acclaimed figures in many current and emerging areas of entertainment and media, including motion pictures,
television, music, digital, broadcast news, books, theatre, video games, fine art and live entertainment. UTA has
offices in Los Angeles, New York, London, Nashville, Miami, and Malmo, Sweden.
www.unitedtalent.com
Portfolio Company Name ICR
Acquired March 2018
Industry Sector Business services – Data & information
services
Headquarters Connecticut, US
ICR is a leading strategic communications and advisory firm. ICR helps companies manage credibility and
reputational risk to optimize shareholder value. ICR specializes in investor relations, public relations, crisis and
special situations communications, digital branding, social media management, and capital advisory solutions. The
firm works with more than 550 clients across its six offices in the US and China.
www.icrinc.com
Portfolio Company Name KS Group
Acquired March 2018
Industry Sector Industrial services – Supply chain services
Headquarters New Jersey, US
KS Group is a value-added, industry-leading distributor of quality replacement auto body parts servicing over 10,000
collision repair shop customers across 25 locations in 14 states. The company provides automotive aftermarket body
parts across several product categories, including headlights, front / rear bumper covers, fenders, hoods, tail lights,
grills, radiators, and mirrors.
www.ksiautoparts.com

PRIVATE EQUITY PORTFOLIO LISTING | 71
Portfolio Company Name AlixPartners
Acquired January 2017
Industry Sector Business services – Knowledge &
professional services
Headquarters New York, US
AlixPartners is a leading global business advisory firm that specializes in creating value and restoring the
performance of businesses around the world. Headquartered in New York City and founded in 1981 by Jay Alix to
handle the turnaround of Electrical Specialties Company, it was a pioneer in providing consulting services to
companies in or near bankruptcy. Over time, AlixPartners has expanded its capabilities and currently offers six
different types of services across a wide range of industries and geographies: Digital Services; Investigations, Risk
& Disputes Services; Mergers & Acquisitions Services; Organizational & Transformative Leadership Services;
Performance Improvement; and Turnaround & Restructuring. The company has nine locations in the US and 15
other locations around the globe including in South America, Europe, the Middle East and Asia. AlixPartners has
over 1,600 employees, approximately 1,150 of whom are professionals, and over 170 Managing Directors.
www.alixpartners.com
Portfolio Company Name Arrowhead Engineered Products
Acquired October 2016
Industry Sector Industrial services – Supply chain services
Headquarters Minnesota, US
Arrowhead Engineered Products (‘Arrowhead’) is a market leading supplier/distributor of mission critical aftermarket
parts primarily for off-highway vehicles. Arrowhead offers the broadest selection of non-discretionary, replacement
vehicle products and services to a diverse set of end users in different markets including
Utility/Powersports/Motorcycle, Agriculture, Industrial, Outdoor Power Equipment, Marine, Auto and Heavy Duty.
Arrowhead has acquired four companies since Investcorp’s investment in October 2016: Stens, J&N Electric,
Interparts and Ratioparts. These add-on acquisitions have significantly increased Arrowhead’s scale in the
aftermarket replacement parts market.
www.arrowheadep.com

PRIVATE EQUITY PORTFOLIO LISTING | 72
Portfolio Company Name PRO Unlimited
Acquired October 2014 / May 2017
Industry Sector Business services – Technology enabled
services
Headquarters Florida, US
Founded in 1991, PRO Unlimited delivers a full range of services to address procurement, management and
compliance issues related to contingent workers, including independent contractors, consultants, temporary workers
and freelancers. PRO Unlimited operates in over 50 countries and provides services to some of the world’s largest
and most prestigious companies through its integrated, vendor-neutral software and services platform.
Investcorp originally invested in PRO Unlimited in October 2014. In May 2017, Investcorp sold a majority stake in
PRO Unlimited to Harvest Partners and retained a minority stake.
www.prounlimited.com
Portfolio Company Name totes»ISOTONER
Acquired May 2014
Industry Sector Consumer products – Specialty retail
Headquarters Ohio, US
Founded in 1923 and headquartered in Cincinnati, Ohio, totes»ISOTONER is a global designer, marketer and
distributor of functional accessories in the rain, cold weather and footwear categories. The company's broad product
portfolio includes umbrellas, gloves, hats, slippers and sandals. In 1997, totes and ISOTONER merged to form the
totes»ISOTONER Corporation. The company offers quality products from two of the most recognized apparel brand
names in the US and has a growing international presence in Europe and Asia.
www.totes-isotoner.com
Portfolio Company Name Paper Source
Acquired September 2013
Industry Sector Consumer products – Specialty retail
Headquarters Illinois, US
Paper Source is a vertically-integrated, cross-channel retailer, offering a premium selection of uniquely designed
and curated gifts, stationery, and crafting supplies. The company operates 130 stores across the US. The company
goes to market through retail stores, direct-to-consumer and wholesale channels. Stores offer workshop classes,
demonstrations, and consultation appointments that drive high customer engagement, conversion, and customer
loyalty.
www.paper-source.com

PRIVATE EQUITY PORTFOLIO LISTING | 73
Portfolio Company Name Sur La Table
Acquired July 2011
Industry Sector Consumer products – Specialty retail
Headquarters Washington, US
Sur La Table is a specialty retailer of culinary merchandise and a leading provider of non-degree culinary courses in
North America. Offering a broad selection of the best culinary brands and an assortment of innovative kitchenware
products, Sur La Table currently operates 134 stores across the US with a widely distributed catalog and a premium
online platform. The company provides items for cooking and entertaining and has a knowledgeable staff that
provides high level service in its stores. Since acquisition, Sur La Table has almost doubled the number of its cooking
class locations, serving well over 500,000 customers annually. Sur La Table has built a multi-channel business in
which each channel is profitable on a standalone basis.
www.surlatable.com
Portfolio Company Name TPx Communications
Acquired April 2000
Industry Sector Telecom
Headquarters California, US
TPx Communications (formerly TelePacific) is a provider of network and communications services headquartered in
Los Angeles. In business since 1998, the company is the nation’s premier managed services provider, delivering
unified communications, managed IT and network connectivity to 55,000 customer locations across the country.
www.tpx.com

PRIVATE EQUITY PORTFOLIO LISTING | 74
PE Europe
As of June 30, 2019, Investcorp’s aggregate balance sheet co-investment amount in private equity investments in
Europe was $90 million invested across eight companies and an initial investment in a special opportunity in the
German dental sector.
Portfolio Company Name Cambio
Acquired February 2019
Industry Sector Business services - Healthcare
Headquarters Stockholm, Sweden
Founded in 1993, Cambio is a Swedish-based provider of Electronic Health Record (EHR) software and services as
well as eHealth solutions to the primary and social care (elderly and disabled care) sector. Cambio is the only Nordic
EHR provider with a pan-European presence, and currently has operations in Sweden, Denmark and the UK. With
a total customer base comprising 155,000 individual users, Cambio has a market share of approximately 30% across
the Nordics. Cambio employs approximately 550 people.
www.cambio.se
Portfolio Company Name Kee Safety
Acquired October 2017
Industry Sector Industrial products
Headquarters Birmingham, United Kingdom
Founded in 1934, Kee Safety’s products have a longstanding reputation for their quality, reliability and safety and
include fall prevention equipment, roof edge protection, barrier and guardrail systems and safe access solutions.
Today, the company has a global presence and sells its products across more than 60 countries worldwide to a
broad range of customers, from multi-national corporations to distributors and installers. Kee Safety employs over
580 people and has established operations in 10 countries, including the US and China.
www.keesafety.com

PRIVATE EQUITY PORTFOLIO LISTING | 75
Portfolio Company Name ABAX
Acquired June 2017
Industry Sector Business services – Technology enabled
services
Headquarters Larvik, Norway
Founded in 2003, ABAX has become the leading telematics solution provider in the Nordics by developing and
delivering sophisticated fleet tracking, electronic triplogs, and equipment & vehicle control systems. Headquartered
in Larvik, Norway, the company has approximately 320 employees and established operations across the Nordic
region as well as in Poland, the Netherlands and the UK.
www.abax.co.uk
Portfolio Company Name Agromillora
Acquired December 2016
Industry Sector Agriculture products
Headquarters Barcelona, Spain
Founded in 1986 in Barcelona, Agromillora is the leading global developer of high yielding plants and trees, with a
key focus on permanent crops, including stone fruits, citrus, nuts, berries, olive trees and grape plants. The company
pioneered the production and marketing of trees for high yielding olive orchards with the disruptive super-high-
density planting solution and has since been promoting similar agronomic improvements for a complete portfolio of
high-quality plants. With a global network of 11 production subsidiaries across nine countries, Agromillora sells to
clients in over 25 countries.
www.agromillora.com
Portfolio Company Name Corneliani
Acquired June 2016
Industry Sector Consumer products – Specialty retail
Headquarters Mantova, Italy
Founded in 1958, Corneliani is a luxury menswear brand. Best known for its men’s suits and chic casualwear, it is
one of the oldest independent Italian luxury brands. Corneliani benefits from a global sales presence in more than
62 countries through 13 directly operated stores, approximately 850 multi-brand stores, more than 69 franchise
stores and approximately 38 store-in-stores, including Harrods, Selfridges, Harvey Nichols, Saks Fifth Avenue and
Bloomingdales.
www.corneliani.com

PRIVATE EQUITY PORTFOLIO LISTING | 76
Portfolio Company Name Dainese
Acquired January 2015
Industry Sector Consumer products
Headquarters Vicenza, Italy
Founded in 1972, Dainese is the most recognized and respected brand for safety and quality in the motorcycle and
other dynamic sports market. Originally known for its competitive motorcycling racing wear, Dainese has
subsequently diversified its product range and today provides protective gear for road and racing use alike, as well
as for use in winter sports, biking and horse riding. In addition, through the AGV brand name, Dainese is one of the
leading protective helmet manufacturers for the motorcycle market. Through its Dainese Technology Centre (‘D-
Tec’), an R&D technical center for the study of protective technology, the company strives to ensure that it remains
at the forefront of innovation.
In October 2015, Investcorp together with Dainese acquired POC, a pioneer in innovative safety concepts for
sportswear to provide athletes and consumers with the highest standard of personal protection. POC's line of
products includes helmets, body armor, goggles, eyewear, gloves and gear, which are currently sold across 25
countries worldwide. Through technical collaboration with partners such as Volvo, POC is pioneering innovative
safety concepts and has won more than 40 prestigious international safety, design, innovation and business awards.
www.dainese.com / www.pocsports.com
Portfolio Company Name SPGPrints
Acquired August 2014
Industry Sector Industrial products
Headquarters Boxmeer, The Netherlands
Based in The Netherlands, SPGPrints is a leading global manufacturer of consumables for printed textiles and labels.
The product offering primarily consists of consumables used in the printing process (rotary screens, lacquers, digital
inks and digital engraving) complemented by a full range of printing systems/equipment and after sales spare-parts,
installation and maintenance services. SPGPrints is represented in more than 100 countries worldwide and
commands a leading market position in each of its segments.
www.spgprints.com

PRIVATE EQUITY PORTFOLIO LISTING | 77
Portfolio Company Name Georg Jensen
Acquired November 2012
Industry Sector Consumer products – Specialty retail
Headquarters Copenhagen, Denmark
Based in Copenhagen, Georg Jensen is a global luxury brand that designs, manufactures and distributes jewelry,
watches, fine silverware and high-end homeware. With a history that spans over 115 years, the Georg Jensen brand
has a deep heritage in silversmithing and represents quality craftsmanship and timeless designs. The brand is also
endorsed by the Queen of Denmark.
www.georgjensen.com

PRIVATE EQUITY PORTFOLIO LISTING | 78
PE Technology
As of June 30, 2019, Investcorp’s aggregate balance sheet co-investment amount in technology investments was $9
million invested across eight companies.
Portfolio Company Name Ubisense
Acquired December 2018
Industry Sector Technology – Big data
Headquarters Cambridge, UK
Ubisense is an enterprise software and sensor platform that generates and interprets vast amounts of location data
to create digital visibility of real-world objects and their interactions in real time, enabling complex manufacturing
processes with high levels of variability to be more flexible, easier to manage and easier to control. Ubisense’s
service solution generates meaningful and demonstrable return on investment to Ubisense’s blue-chip customers.
Ubisense is present in a number of verticals, including Aerospace, Commercial Vehicles, Passenger Vehicles,
General Industry, and Transportation amongst many others.
www.ubisense.net
Portfolio Company Name softgarden
Acquired September 2018
Industry Sector Technology – Big data
Headquarters Berlin, Germany
Founded in 2005, softgarden offers an innovative recruitment technology platform to a diversified set of German
mid-market and enterprise customers. The company’s “Applicant Tracking System” (ATS) - a software-as-a-service
(SaaS) platform covering the entire digital corporate recruitment process - enables companies to streamline and
manage their entire recruitment process in a fully automated and data-privacy compliant manner. In addition to this,
softgarden offers a proprietary jobseeker marketplace, as well as a tool to automate the posting of ads on job boards.
www.softgarden.io
PRIVATE EQUITY PORTFOLIO LISTING | 79
Portfolio Company Name Impero
Acquired July 2017
Industry Sector Technology – Security
Headquarters Nottingham, UK
Founded in 2002, Impero has become a market leader in the UK in integrated safeguarding software with its
comprehensive education solution that enables schools to keep students safe, improves the teaching environment
and maximizes efficiency for school network managers. Headquartered in Nottingham, UK, with an office in Austin,
Texas, the company has a greater than 20% share of the UK secondary school market, currently serving more than
1,400 secondary schools across the country, and with a significant footprint across more than 500 US districts.
Globally, the software is accessed by over 1.5 million devices in over 90 countries, and during the course of 2018/19
the company transitioned from an on-premise solution to a cloud-based SaaS model.
www.imperosoftware.com
Portfolio Company Name Ageras
Acquired March 2017
Industry Sector Technology – Internet/mobility
Headquarters Copenhagen, Denmark
Founded in 2012, Ageras is a fast-growing online marketplace connecting SMEs and micro-businesses with
professional service providers such as accountants and lawyers across Scandinavia and Western Europe. Run by
its founders, the company has successfully entered seven markets (Norway, Sweden, The Netherlands, Germany,
United Kingdom and the US alongside its home market of Denmark). Ageras’ proprietary matching algorithm
allows it to combine automation with high levels of service in order to ensure maximum customer satisfaction.
During 2018, Ageras launched a new arm of its business to focus on monetizing high-simplicity projects through an
automated accounting system. This new product is in start-up mode, but the initial results are showing good
traction.
www.ageras.com
Portfolio Company Name Calligo
Acquired November 2016
Industry Sector Technology – Big data
Headquarters St Helier, Jersey
Calligo is a fast-growing provider of cloud solutions focused on serving the global mid-tier enterprise segment.
Founded in 2012, with the aim of leveraging jurisdictions across the globe that offer a robust data protection
framework, Calligo provides a trusted cloud platform for hosting mid-tier enterprises, their data and applications. The
company’s proprietary cloud platform offers the highest levels of data privacy along with application performance
guarantees, commercial flexibility and a personalized support service.
www.calligo.cloud
PRIVATE EQUITY PORTFOLIO LISTING | 80
Portfolio Company Name eviivo
Acquired March 2011
Industry Sector Technology – Internet / mobility
Headquarters London, UK
eviivo is a leading European software provider for small and medium-sized accommodation businesses to manage
their online and offline bookings, allocate rooms, allow for flexible pricing, invoice and process payments. With
approximately 14,000 customers, eviivo's portfolio covers the breadth of the UK, US, French, German and
Mediterranean markets and includes B&Bs, guest accommodation, inns, farmhouses, cottages, restaurants with
rooms, and smaller boutique hotels.
www.eviivo.com
Portfolio Company Name OpSec Security Group
Acquired March 2010
Industry Sector Technology – Security
Headquarters Newcastle, UK
OpSec Security Group is a global leader in providing anti-counterfeiting technologies, as well as solutions and
services for physical and online brand protection, to over 400 brand owners worldwide. The company operates
manufacturing facilities and laboratories in the US and the UK, and has sales operations in the Americas, Europe
and Asia.
www.opsecsecurity.com
Portfolio Company Name kgb
Acquired April 2006
Industry Sector Technology – Big data
Headquarters New York, US
kgb (formerly InfoNXX) is a global independent provider of directory assistance and enhanced information services.
kgb delivers solutions to wireless and landline carriers, corporations and educational institutions in North America,
handling the majority of the '411' calls in the US that are delivered through a mobile phone. In the UK, kgb’s 'The
Number' 118 has become Britain's leading directory assistance service for consumers and businesses. In addition
to the US and UK, the company also has operations in Ireland, France, Austria, Switzerland, Germany, Morocco,
and Philippines.
www.kgb.com

PRIVATE EQUITY PORTFOLIO LISTING | 81
PE MENA
As of June 30, 2019, Investcorp’s aggregate balance sheet co-investment amount in private equity investments in the
MENA region was $182 million invested across 13 companies. The portfolio listing shown below includes Hydrasun,
even though it is headquartered in Aberdeen, UK, as it is a portfolio company of the Gulf Opportunity Fund.
Portfolio Company Name Reem Integrated Healthcare
Acquired April 2018
Industry Sector Healthcare
Headquarters Abu Dhabi, United Arab Emirates
Reem Integrated Healthcare Holdings is developing a new landmark hospital complex on Reem Island, Abu Dhabi,
UAE. The complex comprises a modern and highly specialized rehabilitation center combined with a children’s and
women’s hospital and a family medical center. The development of the hospital complex will take place in phases:
first, the construction of a more than one hundred bed rehabilitation center and a sizeable family medical center
targeted to open at the end of 2019 and which will be built and operated by VAMED, a leading global provider of
development, design and operational management services for hospitals; and second, the development of a more
than one hundred bed children’s and women’s hospital, providing a full range of general and specialized pediatric
surgery and treatments, as well as comprehensive gynecology and obstetrics services supported by a neonatal
intensive care unit and which will be operated by VAMED in cooperation with Charité from Berlin, Germany, one of
the leading university hospitals in Europe.
Operators website: www.vamed.com and www.charite.de
Portfolio Company Name Al Borg Medical Laboratories
Acquired November 2016
Industry Sector Healthcare
Headquarters Jeddah, Saudi Arabia
Established in 1999 in Jeddah, Al Borg Medical Laboratories (‘Al Borg’) has 64 laboratories across eight countries
in the GCC and Africa, with a clear leadership position in Saudi Arabia. Al Borg employs over 1,200 personnel and
offers a wide range of routine and specialty medical laboratory testing services to hospitals, clinics, corporates and
individuals. In December 2017, Al Borg acquired Proficiency Healthcare Diagnostics, a leading private independent
laboratory network in Abu Dhabi, UAE, operating five laboratories across Abu Dhabi, Dubai, Sharjah and Al Ain.
www.alborglaboratories.com

PRIVATE EQUITY PORTFOLIO LISTING | 82
Portfolio Company Name Bindawood Holding
Acquired December 2015
Industry Sector Consumer products – Grocery retail
Headquarters Jeddah, Saudi Arabia
Established in 1984, with over 30 years of operations and a network of 68 stores across Saudi Arabia, the Bindawood
group operates one of the largest chains of supermarkets and hypermarkets in Saudi Arabia. The company is
predominately focused in the Western regions of Jeddah, Makkah and Madinah, with a growing presence in the
Central and Eastern regions.
www.bindawood.com / www.danubeco.com
Portfolio Company Name NDT Corrosion Control Services Co.
Acquired July 2015
Industry Sector Industrial services
Headquarters Dammam, Saudi Arabia
Established in 1975, NDT Corrosion Control Services Co. LLC (‘NDTCCS’) is the largest non-destructive testing
(‘NDT’) service provider in Saudi Arabia employing over 3,000 technicians in Saudi Arabia, Oman, UAE and Kuwait,
and has recently entered the Bahrain market. NDT is an essential service which involves the evaluation and testing
of pipes, pressure vessels, oil platforms and other key industrial components to identify faults, cracks or defects
without causing damage. NDTCCS provides conventional and advanced NDT services for a range of industrial
sectors including oil and gas, petrochemicals, mining, nuclear and utilities. In February 2019, NDTCCS acquired
International Inspection Center Co. (“Intrex”), Kuwait’s largest provider of industrial NDT and inspection services
employing over 1,100 technicians.
www.ndtcorrosion.com
Portfolio Company Name Arvento Mobile Systems
Acquired March 2015
Industry Sector Business services – Technology enabled
services
Headquarters Istanbul, Turkey
Established in 2005, Arvento Mobile Systems is a provider of telematics solutions, delivered as a software-as-a-
service, which provide fleet operators with visibility into vehicle location, fuel usage, speed and mileage and other
insights into their mobile workforce, enabling them to reduce their operating costs and increase their revenues. The
company designs, develops and sells its own range of hardware products and software applications. The business
is a market leader in Turkey as well as one of the leading players in the Kingdom of Saudi Arabia and the UAE. It is
a multiple award winner for its technology and its rapid growth.
www.arvento.com

PRIVATE EQUITY PORTFOLIO LISTING | 83
Portfolio Company Name Namet
Acquired December 2013
Industry Sector Consumer products
Headquarters Istanbul, Turkey
Established in 1998 and acquired in 2005 by the Kayar family, Namet Gida Sanayi ve Ticaret A.S. (‘Namet’) is the
largest integrated producer of fresh cut and packaged processed red meat products in Turkey. The company
operates an integrated cattle farm in Urfa with 45,000 livestock capacity supplying nearly 25% of the company’s
production needs. The company processes and sells unpacked and packed fresh cut meat, delicatessen products,
frozen products and further processed products. Products are sold under the Namet and Maret (acquired in
September 2014) brands or as private label products to the retail and B2B (hotels/restaurants/catering) channels.
www.namet.com.tr
Portfolio Company Name Al Yusr Industrial Contracting Company
W.L.L
Acquired October 2013
Industry Sector Industrial services
Headquarters Jubail, Saudi Arabia
Al Yusr Industrial Contracting Company W.L.L. (‘AYTB’) was founded in 1979 in Jubail and over its 39-year history
has made a significant contribution to the industrial growth of Saudi Arabia. The company supports the petrochemical
and oil and gas sectors and supplies technical and logistical support, in addition to maintenance, construction,
industrial cleaning as well as facility management, manpower supply, catering and accommodation services. AYTB’s
clients include many of the region’s leading petrochemical and oil and gas companies. The company employs over
5,000 people across its operations in Saudi Arabia and Qatar.
www.aytb.com
Portfolio Company Name Theeb Rent a Car Co.
Acquired June 2013
Industry Sector Consumer services
Headquarters Riyadh, Saudi Arabia
Theeb Rent a Car Co. (‘Theeb’) is a leading car rental company in Saudi Arabia primarily serving the ‘individual’
customer segment with short-term rental services. The company has also recently started offering long-term leasing
to the ‘corporate’ customer segment. Established in 1991 and headquartered in Riyadh, Theeb operates a fleet of
over 14,800 vehicles with a wide network of 43 branches, including 11 at international and regional airports across
Saudi Arabia. Over the years Theeb has built a strong local brand and membership program with over 220,000
members.
www.theeb.com.sa

PRIVATE EQUITY PORTFOLIO LISTING | 84
Portfolio Company Name Hydrasun Group Holdings Ltd.
Acquired March 2013
Industry Sector Industrial services
Headquarters Aberdeen, Scotland
Founded in 1976 in Aberdeen, Scotland, Hydrasun Group Holdings Ltd. (‘Hydrasun’) has international operational
bases in the UK, the Netherlands, the Caspian Sea, West Africa and the Gulf Coast of the US. Hydrasun is engaged
in the integration, manufacture and testing of hydraulic equipment and fluid connectors for the offshore oil and gas
sector. Its products and services are mainly used across the offshore oil and gas sector with further application in
the petrochemical sector. The company employs around 420 personnel and has state-of-the-art engineering,
production, manufacturing, training and warehousing facilities.
www.hydrasun.com
Portfolio Company Name Automak Automotive Company
Acquired October 2012
Industry Sector Industrial services
Headquarters Kuwait
Founded in 2002 by Al Kharafi Projects Co. W.L.L. and Mr. Ghazi Omar, Automak Automotive Company (‘Automak’)
is a leading player in the fleet leasing and rental business in Kuwait. Automak operates a fleet of in excess of 10,000
vehicles leased on a long-term basis (24-36 months) primarily to key companies in the oil, public and corporate
sectors in Kuwait and on a short-term basis in the spot rental market. Automak also provides a wide spectrum of
services and products including quick service and distribution of spare parts, tires and lube oil.
www.automak.com
Portfolio Company Name ORKA Holding
Acquired September 2012
Industry Sector Consumer products – Specialty retail
Headquarters Istanbul, Turkey
ORKA Holding (‘Orka’) is one of the largest menswear retailers in Turkey with 213 directly operated stores (162 in
Turkey and 51 around the world). Founded in 1986 by Süleyman Orakçıoglu, Orka has three brands (Damat, Tween
and D'S Damat) which are suited to a broad customer base. The Damat brand targets the classic/high-end segment,
the Tween brand targets the contemporary/mid to high-end segment and the more affordable D’S Damat targets the
classic and contemporary mid segment. Damat is the #1 apparel brand in Turkey with an estimated 97% brand
awareness.
www.orkagroup.com

PRIVATE EQUITY PORTFOLIO LISTING | 85
Portfolio Company Name Tiryaki Agro
Acquired September 2010
Industry Sector Consumer products – Trading and logistics
Headquarters Istanbul, Turkey
Tiryaki Agro (‘Tiryaki’) is a leading trader and supply chain manager of agro commodities in Turkey. Founded in
Gaziantep, Turkey, in 1965 by the Tiryakioglu family, the company has expanded over two generations to become
one of the most successful family businesses in Turkey with sales operations across the globe. Tiryaki’s business is
in the sourcing, processing, storage and trading of conventional and organic grains, pulses, oil seeds, feed stuff and
nuts across Europe, Africa, the Middle East, the CIS, America and Asia. The company has a team of approximately
690 professionals, has processing and storage facilities in Turkey and serves a broad customer base including food
processors, retailers, governmental agencies and other agro wholesalers.
www.tiryaki.com.tr
Portfolio Company Name L’azurde
Acquired March 2009
Industry Sector Consumer products
Headquarters Riyadh, Saudi Arabia
L'azurde, a family-owned business established in 1980 in Saudi Arabia, is a leading Arab designer, manufacturer
and distributor of gold jewelry for the premium mass market, with two large state-of-the-art industrial plants in Riyadh
and Cairo. The company has high quality products and designs, a diversified regional distribution network, strong
manufacturing capabilities, and significant economies of scale advantages with approximately 1,300 wholesale
relationships that span the MENA region. In October 2018, L’azurde acquired Izdiad, the Saudi franchisee of the
TOUS international jewelry brand, operating 26 TOUS franchise stores in Saudi Arabia.
www.lazurde.com

PRIVATE EQUITY PORTFOLIO LISTING | 86
PE Asia
As of June 30, 2019, Investcorp’s aggregate balance sheet co-investment amount in private equity investments in the
Asia region was $4 million.
Portfolio Company Name China Pre-IPO Technology Portfolio
Acquired September 2018
Industry Sector Technology
Headquarters Predominantly in China, together with one US-
based company with significant China angle
China Pre-IPO Technology Portfolio is a diversified portfolio of leading high-growth pre-IPO technology companies
in China or globally with a significant China angle, in partnership with China Everbright, a reputed sovereign-
backed asset manager. The portfolio currently comprises nine high-growth companies and is expected to continue
to grow and diversify by investing in its active deal pipeline in the Internet Services, Media & Entertainment,
Artificial Intelligence and Consumption Upgrade sectors.
Portfolio Company Name India Consumer Growth Portfolio
Acquired February 2019
Industry Sector Consumer & Retail / Financial Services /
Healthcare
Headquarters India
India Consumer Growth Portfolio is a diversified portfolio of leading high-growth consumer companies in India. The
portfolio currently comprises four high-growth consumer companies and is expected to continue to grow and diversify
by investing in its active deal pipeline in the Consumer & Retail, Financial Services and Healthcare sectors