fy20 mda en vpublished - annual report
TRANSCRIPT

2020 ANNUAL REPORT

At Saputo, we are committed to living up to the values on which our business was founded in 1954.

Saputo produces, markets, and distributes a wide array of dairy products of the utmost quality, including cheese, fluid milk, extended shelf-life milk and cream products, cultured products, and dairy ingredients. Saputo is one of the top ten dairy processors in the world, a leading cheese manufacturer and fluid milk and cream processor in Canada, the top dairy processor in Australia, and the second largest in Argentina. In the USA, Saputo ranks among the top three cheese producers and is one of the largest producers of extended shelf-life and cultured dairy products. In the United Kingdom, Saputo is the largest manufacturer of branded cheese and a top manufacturer of dairy spreads. Saputo products are sold in several countries under market-leading brands, as well as private label brands. Saputo Inc. is a publicly traded company and its shares are listed on the Toronto Stock Exchange under the symbol “SAP”.

Financial Highlights

Approx.17,200
employees
Products sold in over
50countries
* Non-IFRS measures described in the “Glossary” section on page 42 of the Management’s Discussion and Analysis.(1) As compared to fiscal 2019.(2) CAGR, Compound Annual Growth Rate is defined as the year-over-year growth rate over a specified amount of time.(3) Market segmentation impacted by the COVID-19 pandemic and materially different in the last two weeks of fiscal 2020 from what is presented here.
For the fiscal year ended March 31, 2020
For the fiscal year ended March 31, 2020(3)
RETAIL FOODSERVICE INDUSTRIAL
49% 34% 17%
Sales are made to supermarket chains, mass-merchandisers, convenience stores, independent retailers, warehouse clubs and specialty cheese boutiques under
Company-owned or customer brand names.
Sales are made to broadline distributors, restaurants (corporate restaurant chains,
franchisees and individually-owned), hotels and institutions under Company-
owned or customer brand names.
Sales are made to manufacturers and processors who use Saputo’s products as ingredients in the preparation of other
food items or nutritional products.
SECTOR NUMBER OF PLANTS NUMBER OF EMPLOYEES % TOTAL REVENUES
Canada 21 5,600 27%
USA 26 6,500 47%
International 14 4,000 21%
Europe 5 1,100 5%
Fiscal years ended March 31 (in millions of CDN dollars)
REVENUES ADJUSTED EBITDA* NET EARNINGS ADJUSTED NET EARNINGS*
2020 $14,943.5 $1,467.8 $582.8 $653.7 2019 $13,501.9 $1,221.3 $755.3 $623.62018 $11,542.5 $1,264.7 $852.5 $704.2
Fiscal 2020(1) +10.7% +20.2% -22.8% +4.8%Since 2018 +13.8% +7.7% -17.3% -3.7%CAGR(2)
66plants

The Saputo PromiseThe Saputo Promise consists of seven pillars that are the foundation to our approach to social, environmental and economic performance. We believe the future is created by what we do today. And our promise is to never stop building the future we believe in. Here is a summary report of our Promise for the 2020 fiscal year (FY2020).
Our FY2020 Saputo Promise Factsheet – including further details on our non-financial performance – will be published in August 2020.
FOOD QUALITY AND SAFETY
Our Quality Assurance Committee, led by our Chief Executive Officer, continued to provide global governance to ensure our high standards were upheld consistently across our operations. We maintained our number of GFSI*-certified sites at 98%. And for all certified sites, we maintained our high standards with 100% achieving either a Good or Excellent audit rating.
We care about the health and well-being of our people, and endeavour to provide them with the best possible work environment that is safe, diverse, inclusive, and values-driven.
Faci
litie
s ce
rtifi
ed
to G
FSI s
tand
ards
Cer
tifie
d fa
cilit
ies
w
ith
Goo
d or
Exc
elle
nt
GFS
I aud
it r
atin
g
*Global Food Safety Initiative (GFSI)
OUR PEOPLE
16%16% 15%
Percentage of women in senior management
BUSINESS ETHICS
Number of significant fines for non-compliance
20
20
ONE
20
19
20
18
2020
2020
2020
2019
2018
2019
1.771.36
98%
100%
98%
94%
1.962018
2019
2018
100%
100%
Lost Time Injury Frequency Rate
ONE in 2019
ZERO in 2018 20
20

21,221
1%Number of significant fines for non-complianceIn FY2020, we remained committed to investing one per cent of our annual pre-tax profits and encouraging volunteerism in order to build healthier communities where we operate.
ENVIRONMENT
In line with our Animal Welfare Policy, we continued to advocate in all our markets for improved animal welfare standards. We also remained committed to supporting initiatives and training opportunities to help alleviate dairy production welfare issues.
NUTRITION AND HEALTHY LIVING
20% 10% 50%
COMMUNITY
LAUNCHED NEW REDUCED FAT CHEESES WITH NO ADDED SALT IN ARGENTINA
INTRODUCED A LIGHTER CHEDDAR KIDS RANGE IN THE UK
In FY2020, we pledged to accelerate our global climate, water and waste performance and announced clear targets and a formal commitment to make significant and sustainable progress by 2025.
Number of people we reached in FY2020 through our in-house and affiliated animal welfare training programs.
CLIMATE Reduce our CO2 intensity by
Our global action plan includes a three-year investment of CDN$50 million and a governance framework to foster Company-wide accountability and ownership, with Carl Colizza, President and Chief Operating Officer (North America) and by interim Dairy Foods Division (USA), serving as its Executive Champion.
WASTE Reduce our food waste by
WATER Reduce our water intensity by
RESPONSIBLE SOURCING
We continued to respond to consumer trends in nutrition, including expanding our plant-based options and reformulating certain products.

Welcome
MESSAGE FROM THE CHAIR OF THE BOARD AND CHIEF EXECUTIVE OFFICER /

MESSAGE FROM THE CHAIR OF THE BOARD AND CHIEF EXECUTIVE OFFICERLino Saputo, Jr.
A s we look back on fiscal 2020 (FY2020), our global achievements and the resounding dedication of our team mark another impressive
chapter in Saputo’s history. We delivered strong results and maintained a disciplined approach throughout the year, which ended with the unprecedented challenges brought on by COVID-19. Thanks to our solid foundations, operational flexibility, measured risk management, and the resilience of our entire workforce, we stood firm and persevered with distinction.
We’ve always said that our employees are our most import-ant asset, and in times like these, the relevance behind this statement has never been more apparent or more real. Our success is truly a reflection of their commitment to uphold our tradition of care, quality, and passion through food. They take ownership and strive for excellence, which allows us to continually evolve and grow as a leader in our industry. When the COVID-19 pandemic hit, we immediately deployed our global crisis management team and assembled a task force comprised of our Company leaders and representatives from each key function to monitor the evolving situation, mitigate risks, and develop a robust response with clear protocols. As a provider of essential goods, our activities carried on and ensuring the health and well-being of our people was our first and non-negotiable priority. We swiftly implemented numerous measures aimed at safeguarding each and every Saputo employee. These included enhanced sanitation protocols, social distancing measures, travel restrictions, guidelines to self-isolate or quarantine, and required remote working whenever possible. Early on, we also supported our people by providing financial certainty amid the unpredictabili-ty — no layoffs as a result of COVID-19 — because, for us, it was simply the right thing to do for our Saputo family. And at every level of the business, we made sure to keep employees informed and engaged, communicat-ing regular updates, providing virtual training, and sharing tips and tools to stay physically active and alleviate mental stress. It brings me great pride to witness the teamwork and solidarity that pushes us forward, no matter the circumstances.
I’d also like to acknowledge the prudent guidance of our Board of Directors, the structure of which remained un-changed in FY2020 following the re-election of all directors — eight independent and two non-independent. In the role of
/ MESSAGE FROM THE CHAIR OF THE BOARD AND CHIEF EXECUTIVE OFFICER
Chair, I witness first-hand their commitment to integrity, good governance and transparency as they ensure the stewardship of Saputo. With long-term shareholder value top of mind, the Board oversees our Company’s strategic direction, including our practices, guidelines and policies related to environmental, social and governance (ESG) factors. For a full report on our corporate governance practices, please refer to our Manage-ment Information Circular dated June 4, 2020.
Complementing the insight and skills of our Board, the Saputo management team is the steady force that keeps us on the right track year after year. We’re privileged to benefit from their experience and sound judgement as we transition through times of growth, change and global challenges.
To further support our expanding operations, we wel-comed Richard Wallace to the senior leadership team on April 1, 2020, following his appointment as President and Chief Operating Officer, Dairy Division (Australia). He’s been instrumental since the acquisition of Warrnambool Cheese & Butter (WCB) in 2014, and I’m pleased to have Richard guiding our combined Australian platform.
On the North American side, I sincerely thank Paul Corney for his tremendous contribution over the last 19 years. With Paul enjoying a well-deserved retirement starting in July 2020, the Dairy Foods Division (USA) remains in good hands under the leadership of Carl Colizza, President and Chief Operating Officer (North America).

/ MESSAGE FROM THE CHAIR OF THE BOARD AND CHIEF EXECUTIVE OFFICER
While the COVID-19 pandemic has shifted our focus and required us to adjust to a new reality these last few months, I believe it’s important to take the time to properly recognize our FY2020 accomplishments.
It was certainly a busy and productive year on many fronts, including acquisitions. Quite early on, we achieved another milestone by re-establishing our presence in Europe as we welcomed Dairy Crest Group plc into the fold, a solid UK business with size, scope and market-leading brands. The integration of our new Dairy Division (UK) has been seamless, helped along by the similarities in culture and operating styles, as well as the geo-complementarity with our existing activities. We’ve since been focused on aligning processes, systems, and sharing best practices. In Australia, we built on our leadership position by acquiring the spe-cialty cheese business of Lion Dairy & Drinks Pty Ltd, which complements our strong presence in the everyday cheese category. Not only did we inherit established brands, but this acquisition also enabled us to increase our manufacturing footprint in Tasmania, a state where the milk pool is growing. Looking ahead, we remain poised to materialize acquisitions should the right assets become available, and we anticipate there could be heightened activity as a result of COVID-19 hardships. Nevertheless, we’ll stay true to our responsible and thorough approach.
Consistent with our financially prudent approach, we took the opportunity in FY2020 to attend to our debt, paying it down aggressively to maintain our clean balance sheet in or-der to provide ample flexibility to seize future opportunities. We closed a public offering and concurrent private place-ment of Saputo common shares and the net proceeds were used in full to reduce debt incurred in connection with our recent acquisitions. Furthermore, we increased the principal amount available from our North American revolving credit facilities to US$1 billion and these funds remain undrawn.
Central to our business is our ongoing commitment to progressing the Saputo Promise, which has kept us clearly aligned on what matters most as we move forward. Building a healthier future for our employees, consumers, customers, and those living in the communities where we operate is part
Central to our business is our ongoing commitment to the Saputo Promise, which has kept us aligned on what matters most.
of our growth as a global dairy processor. Seeking to create shared value for all our stakeholders, we began executing our Saputo Promise three-year plan (FY2020-FY2022) with efforts deployed across all seven pillars.
Most notably, we took an important step towards safe-guarding the environment. We kicked off the first phase of this journey by updating our Environmental Policy and pledging to achieve new climate, water, and waste targets by 2025. Although ambitious, we put a lot of thought into our planning and I’m confident in our ability to deliver on these targets. In fact, our divisions have already begun laying the groundwork to integrate more renewable electricity, resource conservation, and sustainable packaging initiatives within their operations. To support these projects, we committed to investing CDN$50 million in capital expenditures over the next three years. We’re also keenly aware of environmental considerations within the dairy supply chain and we intend to extend our efforts in this regard as part of the next phase.
Internally, we continued to dedicate significant time and energy to providing the best possible work environment for our people. We implemented several programs and initiatives aimed at fostering Diversity and Inclusion in the workplace, including unconscious bias trainings, expanded parental leave benefits, gender-neutral job descriptions and pilots for flexible working arrangements in advance of a global rollout. We also prioritized and invested in Goal Zero, our focused approach to Health and Safety based on sharing best prac-tices and driving a culture where our employees are an inte-gral part of the solution to safety issues. As a result, we saw an improvement in our global performance indicators, and multi-divisional working groups made significant progress in standardizing processes related to risk assessment, employee onboarding, and indicator tracking.
Moreover, we maintained our industry-leading Food Quality and Safety standards and broadened our involvement with external partners to continue sharing best practices. And, we played an active role in promoting and supporting proper animal care standards, mainly through training and partnerships. We’re very proud of the progress we’ve made since the initial launch of our zero-tolerance Animal Welfare

Policy five years ago, and we will continue to demonstrate leadership in this regard. As our business evolves, so do our sourcing needs. Therefore, we’re revising our Policy, making it more robust and inclusive, to ensure we remain at the fore-front of Animal Welfare in all our geographies.
We also appointed a Senior Vice President, Business De-velopment, Plant-Based Food to lead our efforts to diversify our product portfolio. Consumer interest in plant-based products is increasing worldwide and we see the benefits of expanding our presence in this category. We stand to gain further effi-ciencies by leveraging the overlap in customer base, manufac-turing processes and supply chain. This endeavor will also al-low us to maximize our assets, particularly in highly-regulated countries like Canada. At this stage, we’re primarily focused on securing co-packing arrangements in North America as well as further developing and capitalizing on our dairy-free cheese expertise in the UK. To help us execute these plans, we’ve already earmarked the necessary capital expenditure funds to begin enhancing select facilities. We’re also open to acquisi-tion opportunities that might enable us to grow our branded presence in this space. But let me be clear: these initiatives should not signal a lack of confidence in dairy. We remain very bullish about our industry and believe the runway is still long on what we can achieve in dairy.
Finally, giving back has always been an intrinsic part of our culture and we care deeply about the communities we serve. In FY2020, we remained steadfast in our commitment to building healthier communities, including investing in two new well-being infrastructure projects in the USA, and one in Argentina, as part of the Saputo Legacy Program. It was also a difficult year for many communities in our network and we rallied together to encourage disaster relief efforts. During the Australian bushfires, we partnered with food banks and established a global employee relief and recovery fund in collaboration with the Australian Red Cross, matching every dollar. More recently, our ongoing community contributions in response to the COVID-19 pandemic have reached over CDN$4 million so far across all our divisions. In addition to the support we’ve been giving our employees, we’ve been supplying local food banks and providing additional services and resources to our patron farmers.
A CLOSER LOOK AT OUR FY2020 PROGRESS BY SECTOR:
CANADA In the Dairy Division (Canada), we enhanced our focus on continuous improvement initiatives that helped optimize our cost structure despite competitive market conditions
and the sustained decline in fluid milk consumption. In this context, we announced the difficult decision to close our plants in Trenton, Ontario, and Saint John, New Brunswick, effective in FY2021.
We made considerable investments to grow our cheese production capacity and renew our assets, such as the construction of our state-of-the-art facility in Port Coquitlam, British Columbia. These upgrades to our network open the door to more innovation, increased efficiencies, and best- in-class food safety and health and safety practices.
The proficiency of our sales and operations planning process also helped us strengthen customer relationships, recuperating some lost volume throughout the year. On the consumer side, we concentrated our efforts on value-added segments, like increasing distribution of our Joyya specialty milk. Also, following the Armstrong brand’s packaging revamp last year, we launched a new shredded cheese format in a variety of flavours, voted Best New Product (2020) by Canadian consumers in the shreds category.
USA With competitive market conditions and trade wars placing downward pressure on margins, our Cheese Division (USA) focused on controlling the “controllables” and managing costs. Our products continued to resonate with consumers as we maintained our leadership position in the snacking category (Frigo Cheese Heads) and in specialty cheeses, namely blue (Treasure Cave) and goat cheese (Montchevre). We also reorganized our Cheese Sales Team to better serve our customers and keep growing our business. The first phase of our Cheese Division (USA) Enterprise Resource Planning (ERP) implementation was successfully completed in FY2020, with subsequent phases expected to pick back up post-COVID-19.
Our Dairy Foods Division (USA) had an exceptional year with the challenges of its ERP deployment now firmly in the rear-view mirror. With strong customer confidence, we renewed our focus on cost and service — both oper-ationally and from a commercial standpoint. We earned new business with major customers in both the retail and foodservice spaces, and recouped costs through pricing initiatives. From an operations perspective, we increased productivity and capacity, executed capital investments to service current and future growth, and significantly reduced supply chain costs. Leveraging innovation as a key differ-entiator, we introduced new aseptic packaging, and we’re expanding our offering and developing further capabilities to support the processing of added-value ultrafiltered milk and plant-based products.

/ MESSAGE FROM THE CHAIR OF THE BOARD AND CHIEF EXECUTIVE OFFICER
INTERNATIONAL As international markets regained some stability for most of FY2020, we continued to nurture export relationships from both our Australian and Argentinian platforms.
While the bushfires in Australia were devastating for many, they had a limited impact on our activities and our facilities continued to operate as usual. With the ongoing decline of domestic milk production driving fierce competition among processors, we implemented alternate measures to reduce our exposure and ensure adequate capacity utilization. Such mea-sures included extending the usual shutdown period in certain more seasonal facilities and signing co-packing and toll manu-facturing agreements. We benefitted from investments in plant performance and optimization and captured additional syner-gies from the full integration of our acquired Australian busi-nesses. On the commercial front, we successfully relaunched our established Devondale brand in both our domestic and international markets, keeping it relevant and building upon the consumer trust it has earned.
The Dairy Division (Argentina) continued to perform well despite local inflation levels being at a 28-year high. Like always, we were able to count on our seasoned local management team to make the right decisions for our business despite a volatile landscape. Indeed, we ended the year with higher milk receipt volumes than we did in FY2019.
EUROPE Our new Dairy Division (UK) began increasing production capacity at our Davidstow facility to accommodate the future growth of our market-leading brand Cathedral City. This opens up opportunities to develop sliced, grated, and snacking formats, and to expand overseas. The project also positions our facility for a more sustainable future by reducing its water usage. The functional ingredients business, which produces demineralized whey and galacto-oligosaccharides (GOS), continued to grow.
Despite the uncertainty surrounding Brexit, adverse weather, and trade turmoil, in FY2020, the value of milk in the UK saw its most stable period in more than a decade. We continued to pay our farmer suppliers a leading price and our milk intake grew by 10% over the year, reflecting both organic gains and new recruitment.
Our commitment to our customers, consumers and the communi ties we serve has never been more important.
Innovation remained a key driver as we launched a dairy-free, plant-based product range under our market-leading Vitalite brand that delivers on taste while performing very similarly to traditional cheese when cooked. We also intro-duced Cathedral City 82, a low-fat cheese with 82 calories per portion that aims to reframe nutrition within the cheese sector with a more permissible calorie message.
Our team’s many FY2020 successes didn’t go unnoticed. We were named Processor of the Year (2019) by Dairy Foods magazine, an award we received surrounded by our peers at the International Dairy Foods Association’s annual Dairy Forum. I was also humbled to be recognized as Canada’s Outstanding CEO of the Year® for 2019, an achievement I wholly share with our employees whose passion continues to elevate Saputo to the next level.
In the midst of the COVID-19 pandemic, we were hon-oured to be recognized by Canadian Business for Social Responsibility (CBSR) as one of the businesses responsibly addressing the crisis. In particular, they highlighted our ef-forts to protect our employees and support our communities. This recognition meant a lot to Saputo as we take great pride in leading by example and hope to inspire other businesses to do the same.
In FY2021, we’ll keep leveraging the agility and comple-mentarity of our network. As demand and market condi-tions continue to shift, particularly in light of the COVID-19 pandemic, we will stay nimble and proactive, reshuffling our operations and repurposing or redirecting product as needed. Our commitment to our customers, consumers and the communities we serve has never been more important and I extend my deepest gratitude for their ongoing loyalty. Feeding families is what unites us every day and we have a duty to those who rely on us to provide high-quality, nutri-tious products, a responsibility we remain ready, able, and privileged to honour.
In this unprecedented environment, there is no doubt FY2021 will be another defining year. By standing together and staying the course financially, operationally, and strategi-cally, I firmly believe the next chapter we write will be one we can all be extremely proud of. ■

Management’sDiscussion and Analysis
FY2020
Consolidated Financial Statements
/ JUNE 4, 2020
TABLE OF CONTENTS
MANAGEMENT’S DISCUSSION AND ANALYSIS 3 NON-IFRS MEASURES 3 CAUTION REGARDING FORWARD-LOOKING STATEMENTS 4 SELECTED FINANCIAL INFORMATION 5 FINANCIAL INFORMATION 6 HIGHLIGHTS 8 RECENT DEVELOPMENTS RELATED TO COVID-19 AND OUTLOOK 9 QUARTERLY FINANCIAL INFORMATION BY SECTOR 15
CANADA SECTOR 17 USA SECTOR 18 INTERNATIONAL SECTOR 21 EUROPE SECTOR 23
LIQUIDITY, FINANCIAL AND CAPITAL RESOURCES 24 CONTRACTUAL OBLIGATIONS 27 FINANCIAL POSITION 28 GUARANTEES 28 RELATED PARTY TRANSACTIONS 28 CRITICAL ACCOUNTING ESTIMATES 29 CHANGES IN ACCOUNTING POLICIES 30 RISKS AND UNCERTAINTIES 31 DISCLOSURE CONTROLS AND PROCEDURES 35 INTERNAL CONTROL OVER FINANCIAL REPORTING 35 SENSITIVITY ANALYSIS OF INTEREST RATE AND US CURRENCY FLUCTUATIONS 35 QUARTERLY FINANCIAL INFORMATION 36 ANALYSIS OF EARNINGS FOR THE YEAR ENDED MARCH 31, 2019, COMPARED TO MARCH 31, 2018 38 MEASUREMENT OF RESULTS NOT IN ACCORDANCE WITH INTERNATIONAL FINANCIAL REPORTING STANDARDS 40 GLOSSARY 42 CONSOLIDATED FINANCIAL STATEMENTS 44 NOTES TO THE CONSOLIDATED FINANCIAL STATEMENTS 52

ANNUAL REPORT 2020
- 3 -
Management’s Discussion and Analysis The goal of the management report is to analyze the results of, and the financial position of Saputo Inc. (Saputo or the Company), for the year ended March 31, 2020. It should be read while referring to the audited consolidated financial statements and accompanying notes. The accounting policies of the Company are in accordance with International Financial Reporting Standards (IFRS). All dollar amounts are in Canadian dollars, unless otherwise indicated. This report takes into account material elements between March 31, 2020 and June 4, 2020, the date on which this report was approved by the Company’s Board of Directors. The information in this report is being presented as at March 31, 2020, unless otherwise specified. Additional information about the Company, including its Annual Report and Annual Information Form for the year ended March 31, 2020, can be obtained on SEDAR at www.sedar.com.
NON-IFRS MEASURES
The Company reports its financial results in accordance with IFRS. However, in this Management’s Discussion and Analysis, the following non-IFRS measures are used by the Company: adjusted EBITDA; adjusted net earnings; adjusted net earnings excluding amortization of intangible assets related to business acquisitions; adjusted net earnings per share and adjusted net earnings per share excluding amortization of intangible assets related to business acquisitions. These measures are defined in the “Glossary” section on page 42 of this Management’s Discussion and Analysis. Refer to ‘‘Measurement of Results not in Accordance with International Financial Reporting Standards’’ on page 40 of this Management’s Discussion and Analysis for the reconciliations to IFRS measures.
Management of the Company believes that these non-IFRS measures provide useful information to investors regarding the Company’s financial condition and results of operations as they provide key metrics of its performance. These non-IFRS measures are not recognized under IFRS, do not have any standardized meaning prescribed under IFRS and may differ from similar computations as reported by other issuers, and accordingly may not be comparable. These measures should not be viewed as a substitute for the related financial information prepared in accordance with IFRS.

ANNUAL REPORT 2020
- 4 -
CAUTION REGARDING FORWARD-LOOKING STATEMENTS
This report contains statements which are forward-looking statements within the meaning of applicable securities laws. These forward-looking statements include, among others, statements with respect to the Company’s objectives, outlook, business projects, strategies, beliefs, plans, expectations, targets, commitments and goals, including the Company’s ability to achieve these targets, commitments and goals, and statements other than historical facts. The words “may”, “could”, “should”, “will”, “would”, “believe”, “plan”, “expect”, “intend”, “anticipate”, “estimate”, “foresee”, “objective”, “continue”, “propose”, “aim”, “commit”, “assume”, “forecast”, “seek”, “project”, “potential” or “target”, or the negative of these terms or variations of them, the use of conditional or future tense or words and expressions of similar nature, are intended to identify forward-looking statements. All statements other than statements of historical facts included in this report may constitute forward-looking statements within the meaning of applicable securities laws.
These statements are based, among other things, on Saputo’s assumptions, expectations, estimates, objectives, plans, business strategy and intentions as of the date hereof, as well as other factors it believes are appropriate under these circumstances, regarding the projected revenues and expenses, the economic, industry, competitive and regulatory environments in which the Company operates or which could affect its activities, its ability to attract and retain customers and consumers, its environmental performance, its sustainability efforts, the effectiveness of its environmental and sustainability initiatives, the availability and cost of milk and other raw materials and energy supplies, its operating costs, the pricing of its finished products on the various markets in which it carries on business, and the effects of the COVID-19 pandemic. Such forward-looking statements are intended to provide shareholders with information regarding the Company, including its assessment of future financial plans, and may not be appropriate for other purposes.
By their nature, forward-looking statements are subject to a number of inherent risks and uncertainties. Actual results could differ materially from those stated, implied or projected in such forward-looking statements. As a result, the Company cannot guarantee that any forward-looking statements will materialize, and the Company warns readers that these forward-looking statements are not fact or guarantees of future performance in any way. Assumptions, expectations and estimates made in the preparation of forward-looking statements and risks and uncertainties that could cause actual results to differ materially from current expectations are discussed in the Company’s materials filed with the Canadian securities regulatory authorities from time to time, including the "Risks and Uncertainties" section of the Management’s Discussion and Analysis dated June 4, 2020, available on SEDAR under the Company's profile at www.sedar.com.
Such risks and uncertainties include the following: product liability; the COVID-19 pandemic; the availability of raw materials (including as a result of climate change or extreme weather) and related price variations, along with the ability for the Company to transfer those increases, if any, to its customers in competitive market conditions; the price fluctuation of its products in the countries in which it operates, as well as in international markets, which are based on supply and demand levels for dairy products; the increased competitive environment in the dairy industry; consolidation of clientele; supplier concentration; unanticipated business disruption; the economic environment; changes in environmental laws and regulations; cyber threats and other Information Technology-related risks relating to business disruptions, confidentiality, and data integrity; the Company’s ability to identify, attract and retain qualified individuals; the failure to adequately integrate acquired businesses in a timely and efficient manner; changes in consumer trends. The Company’s ability to achieve its environmental targets, commitments and goals is further subject to, among others, the Company’s ability to access and implement all technology necessary to achieve its targets, commitments and goals, as well as the development and performance of technology and technological innovations and the future use and development of technology and associated expected future results, and environmental regulation.
Forward-looking statements are based on Management’s current estimates, expectations and assumptions, which Management believes are reasonable as of the date hereof, and are inherently subject to significant business, economic, competitive and other uncertainties and contingencies regarding future events, including the duration and severity of the COVID-19 pandemic, and are accordingly subject to changes after such date. Undue importance should not be placed on forward-looking statements, and the information contained in such forward-looking statements should not be relied upon as of any other date.
All forward-looking statements included herein speak only as of the date hereof or as of the specific date of such forward-looking statements. Except as required under applicable securities legislation, Saputo does not undertake to update or revise forward-looking statements, whether written or verbal, that may be made from time to time by itself or on its behalf, whether as a result of new information, future events or otherwise. All forward-looking statements contained herein are expressly qualified by this cautionary statement.

ANNUAL REPORT 2020
- 5 -
SELECTED FINANCIAL INFORMATION Years ended March 31
(in millions of CDN dollars, except per share amounts and ratios)
2020 2019 2018
Revenues 14,943.5 13,501.9 11,542.5 Adjusted EBITDA* 1,467.8 1,221.3 1,264.7
Margin* 9.8 % 9.0 % 11.0 % Net earnings 582.8 755.3 852.5
Basic per share 1.46 1.94 2.21 Diluted per share 1.45 1.93 2.18
Margin 3.9 % 5.6 % 7.4 % Adjusted net earnings* 653.7 623.6 704.2
Basic per share 1.63 1.60 1.82 Diluted per share 1.62 1.59 1.80
Margin* 4.4 % 4.6 % 6.1 % Adjusted net earnings excluding amortization of intangible assets related to business acquisitions* 723.6 655.1 716.4
Basic per share 1.81 1.69 1.85 Diluted per share 1.80 1.67 1.83
Margin* 4.8 % 4.9 % 6.2 % OTHER PER SHARE DATA Dividends declared 0.68 0.66 0.64 Book value 16.05 13.89 12.38 FINANCIAL POSITION DATA Working capital** 1,575.5 1,201.3 1,129.6 Total assets 13,793.1 9,885.6 8,003.0 Net debt** 4,166.2 2,285.0 1,496.4 Total non-current financial liabilities 3,889.5 1,943.9 1,432.6 Equity 6,559.1 5,420.5 4,797.7 FINANCIAL RATIOS Net debt / Equity 0.64 0.42 0.31 Net debt to adjusted EBITDA* 2.84 1.87 1.18 Adjusted return on average equity** 12.3 % 14.2 % 18.3 % Earnings coverage ratio** 6.59 12.69 20.83 STATEMENT OF CASH FLOWS DATA Net cash generated from operations 1,036.9 884.5 809.1 Amount of additions to property, plant and equipment,
intangible assets, net of proceeds on disposal 565.3 274.2 337.4 Business acquisitions 1,929.6 1,471.7 385.1 Proceeds on divestiture - (239.7) - Dividends 269.7 254.6 243.5
* Non-IFRS measures are described in the ‘‘Glossary’’ section on page 42 of this Management’s Discussion and Analysis.
** Refer to the ‘‘Glossary’’ section on page 42 of this Management’s Discussion and Analysis.

ANNUAL REPORT 2020
- 6 -
FINANCIAL INFORMATION (in millions of CDN dollars)
For the three-month periods
ended March 31 For the years
ended March 31
2020 2019 2020 2019
STATEMENT OF EARNINGS
Revenues
Canada 960.1 924.8 4,007.3 4,043.1
USA 1,694.8 1,616.6 7,093.6 6,507.7
International 832.4 695.1 3,076.7 2,951.1
Europe 231.4 - 765.9 -
3,718.7 3,236.5 14,943.5 13,501.9
Operating costs excluding depreciation and amortization
Canada 869.1 834.8 3,602.9 3,629.4
USA 1,600.5 1,482.4 6,478.2 5,963.0
International 765.9 644.2 2,771.8 2,688.2
Europe 184.8 - 622.8 -
3,420.3 2,961.4 13,475.7 12,280.6
Adjusted EBITDA*
Canada 91.0 90.0 404.4 413.7
USA 94.3 134.2 615.4 544.7
International 66.5 50.9 304.9 262.9
Europe 46.6 - 143.1 -
298.4 275.1 1,467.8 1,221.3
Adjusted EBITDA margin* 8.0 % 8.5 % 9.8 % 9.0 %
Depreciation and amortization
Canada 23.4 19.5 91.9 73.9
USA 46.2 41.7 174.2 162.3
International 28.1 19.9 107.8 76.8
Europe 30.1 - 93.3 -
127.8 81.1 467.2 313.0
Gain on disposal of assets - - - (194.5)
Inventory revaluation resulting from a business acquisition - - 40.1 -
Acquisition and restructuring costs 13.8 2.2 46.0 51.4
(Gain) loss on hyperinflation (10.9) 0.9 (27.8) (18.5)
Interest on long-term debt 21.8 16.7 95.6 66.6
Other financial charges 14.5 4.8 47.4 17.7
Earnings before incomes taxes 131.4 169.4 799.3 985.6
Income taxes 42.7 45.2 216.5 230.3
Net earnings 88.7 124.2 582.8 755.3
Net earnings margin 2.4 % 3.8 % 3.9 % 5.6 %
* Non-IFRS measures are described in the ‘‘Glossary’’ section on page 42 of this Management’s Discussion and Analysis.

ANNUAL REPORT 2020
- 7 -
(in millions of CDN dollars, except per share amounts and ratios)
For the three-month periods ended March 31
For the years ended March 31
2020 2019 2020 2019
Net earnings 88.7 124.2 582.8 755.3
Gain on disposal of assets1 - - - (167.8)
Inventory revaluation resulting from a business acquisition1 - - 32.5 -
Acquisition and restructuring costs1 10.1 1.6 38.4 36.1
Adjusted net earnings* 98.8 125.8 653.7 623.6
Margin* 2.7 % 3.9 % 4.4 % 4.6 %
Amortization of intangible assets related to business acquisitions1 17.7 8.0 69.9 31.5
Adjusted net earnings excluding amortization of intangible assets related to business acquisitions* 116.5 133.8 723.6 655.1
Margin* 3.1 % 4.1 % 4.8 % 4.9 %
PER SHARE DATA
Net earnings per share 0.22 0.32 1.46 1.94
Diluted net earnings per share 0.22 0.32 1.45 1.93
Adjusted net earnings per share* 0.24 0.32 1.63 1.60
Adjusted diluted net earnings per share* 0.24 0.32 1.62 1.59
Adjusted net earnings per share excluding amortization of intangible assets related to business acquisitions* 0.29 0.34 1.81 1.69
Adjusted diluted net earnings per share excluding amortization of intangible assets related to business acquisitions* 0.28 0.34 1.80 1.67
1 Net of income taxes.
* Non-IFRS measures are described in the ‘‘Glossary’’ section on page 42 of this Management’s Discussion and Analysis.

ANNUAL REPORT 2020
- 8 -
HIGHLIGHTS Fourth Quarter 2020:
• Revenues amounted to $3.719 billion, an increase of $482.2 million or 14.9%. • Adjusted EBITDA* amounted to $298.4 million, up $23.3 million or 8.5%. • Net earnings totalled $88.7 million and EPS** (basic and diluted) were $0.22, as compared to $124.2 million and
EPS (basic and diluted) of $0.32. • Adjusted net earnings* totalled $98.8 million and adjusted EPS* (basic and diluted) were $0.24, as compared to
$125.8 million and adjusted EPS (basic and diluted) of $0.32. Adjusted EPS excluding amortization of intangible assets related to business acquisitions* (basic and diluted) were $0.29 and $0.28, as compared to $0.34 (basic and diluted).
• Net cash generated from operations amounted to $295.2 million, up $67.0 million or 29.4%. • The shift in consumer demand relative to the COVID-19 pandemic did not significantly affect revenues, while there
was a negative impact on adjusted EBITDA, which includes an amount of $44.8 million comprised of a loss from unsellable inventory and an inventory write-down resulting from the decrease in certain market selling prices in North America.
• USA Market Factors** negatively impacted adjusted EBITDA by approximately $8 million. • The Europe Sector, consisting of the activities of Dairy Crest Group plc acquired on April 15, 2019 (Dairy Crest
Acquisition), increased revenues and adjusted EBITDA by $231.4 million and $46.6 million, respectively. • Higher international selling prices of cheese and dairy ingredients positively impacted adjusted EBITDA. • The specialty cheese business of Lion Dairy & Drinks Pty Ltd (Specialty Cheese Business Acquisition) in Australia,
acquired on October 28, 2019, contributed positively to revenues and adjusted EBITDA. • The adoption of IFRS 16, Leases positively impacted adjusted EBITDA by approximately $15 million. The impact on
net earnings was minimal. • The fluctuation of foreign currencies versus the Canadian dollar had a negative impact on adjusted EBITDA of
approximately $3 million. Fiscal 2020:
• Revenues amounted to $14.944 billion, an increase of $1.442 billion or 10.7%. • Adjusted EBITDA amounted to $1.468 billion, up $246.5 million or 20.2%. • Net earnings totalled $582.8 million and EPS (basic and diluted) were $1.46 and $1.45, as compared to $755.3 million
and EPS (basic and diluted) of $1.94 and $1.93. • Adjusted net earnings totalled $653.7 million and adjusted EPS (basic and diluted) were $1.63 and $1.62, as
compared to $623.6 million and adjusted EPS (basic and diluted) of $1.60 and $1.59. Adjusted EPS excluding amortization of intangible assets related to business acquisitions (basic and diluted) were $1.81 and $1.80, as compared to $1.69 and $1.67 (basic and diluted).
• Net cash generated from operations totalled $1,036.9 million, up $152.4 million or 17.2%. • The shift in consumer demand relative to the COVID-19 pandemic negatively affected adjusted EBITDA late in the
fourth quarter. • USA Sector revenues increased by $585.9 million and adjusted EBITDA increased by $70.7 million, including
approximately $8 million attributable to the positive impact of USA Market Factors. • The Europe Sector, consisting of the Dairy Crest Acquisition, increased revenues and adjusted EBITDA by
approximately $766 million and $143 million, respectively. The Specialty Cheese Business Acquisition in the International Sector also contributed positively to revenues and adjusted EBITDA.
• Higher international selling prices of cheese and dairy ingredients positively impacted adjusted EBITDA. • The adoption of IFRS 16, Leases positively impacted adjusted EBITDA by approximately $62 million. The impact on
net earnings was minimal. • The fluctuation of foreign currencies versus the Canadian dollar had a negative impact on adjusted EBITDA of
approximately $36 million. • Effective May 28, 2020, the Company implemented a dividend reinvestment plan allowing eligible shareholders to
have all or a portion of their cash dividends automatically reinvested into additional common shares. • The Board of Directors approved a dividend of $0.17 per share payable on July 9, 2020, to common shareholders of
record on June 30, 2020. ________________________
* Non-IFRS measures are described in the ‘‘Glossary’’ section on page 42 of this Management’s Discussion and Analysis.
** Refer to the ‘‘Glossary’’ section on page 42 of this Management’s Discussion and Analysis.

ANNUAL REPORT 2020
- 9 -
RECENT DEVELOPMENTS RELATED TO COVID-19 AND OUTLOOK
In March 2020, the COVID-19 outbreak was declared a pandemic by the World Health Organization. The related confinement measures and government-imposed closures significantly impacted consumer demand. In the last two weeks of fiscal 2020, the Company witnessed a shift in consumer demand on a global scale for its products. Orders from customers in the foodservice and industrial segments began to decrease while an increase was felt in the retail segment. The Company also started to face a decrease in export sales as a result of local lockdowns in some of its export markets.
The Company expects sustained retail sales in all its geographic markets but is unable to predict how long or how significant the increased demand levels will remain. The positive impact on EBITDA resulting from increased retail sales volumes will not offset decreased sales volumes in the foodservice and industrial market segments. Efforts dedicated to the foodservice and industrial channels will be aligned and deployed with the objective of responding to customer demand from those segments when such demand begins to recover, although the timing and magnitude of such a recovery of volume are hard to predict. As at the date hereof, all divisions continued to experience sustained retail market segment demand and began to observe signs of a slight recovery of demand in the foodservice and industrial segments, which represented approximately 51% of the Company’s consolidated revenues in fiscal 2020. Also, several countries where export customers are located slowly began easing COVID-19 lockdown measures since the beginning of May 2020. The return to the financial performance levels of fiscal 2020 will likely take more than twelve months and will be gradual and dependent on the recovery of volume in the foodservice and industrial market segments.
In response to the COVID-19 outbreak and business disruption, Saputo has the following priorities:
ensure the health and safety of employees; adapt commercial initiatives, production and supply chain to consumer demand; and, help communities where it operates with food donations and financial support.
As an essential service provider, the Company’s operations have carried on in all regions in which it operates. Saputo has assembled a global task force to actively monitor the COVID-19 crisis in the countries where it operates. Under this global task force’s leadership, and with the support of all divisional teams, the Company has:
despite lower sales and production volumes in North-America and sales into export markets, guaranteed no lay-offs related to the COVID-19 crisis throughout the Company until further notice;
offered its employees additional tools and services to mitigate the physical and mental health impacts caused by this stressful situation;
implemented mandatory remote working, where possible; implemented enhanced sanitation protocols, physical distancing and ensured the availability of personal
protective equipment in certain circumstances; dedicated resources to ensure excess inventory is either donated or repurposed to minimize food waste; adjusted the production of certain products and formats to satisfy orders along with enhanced monitoring of
demand planning and of milk utilization to maximize throughput; enhanced daily monitoring of supply of key materials and secured backup supply of raw materials and
packaging from current and secondary suppliers to meet the surge in retail sales; contributed additional services and resources to its patron farmers; and, as part of its ongoing continuous improvement program, reviewed capital expenditure projects and limited
non-critical expenditures.
While the Company is actively responding to and monitoring the COVID-19 crisis, it is undeniable that it has had a material negative impact on the economy and global markets and will continue to have a negative effect, which will likely be material, on the Company’s business and financial results.
ANNUAL REPORT 2020
- 10 -
Despite the current unprecedented COVID-19 environment, Saputo aims to continue to achieve profitable long-term growth and manages its business accordingly. The Company benefits from a solid financial position and capital structure, supplemented by a high level of cash generated by operations. The Company is well positioned to continue to grow through targeted acquisitions and organically through strategic capital investments, innovation and product portfolio diversification. Profitability enhancement and shareholder value creation remain the cornerstones of its objectives. Saputo has a long-standing commitment to manufacture quality products and will remain focused on operational efficiencies.
The Company intends to seize future acquisition opportunities which it believes constitute the right fit, with the goal to further strengthen its existing business.
The Company will continue to seek opportunities to improve its performance across each of the seven Pillars of the Saputo Promise and to execute its three-year plan, which is currently in its second year. Building on its progress, Saputo intends to maintain its focus on Food Quality and Safety, as well as on employee initiatives related to Health and Safety, and Diversity and Inclusion. As part of its goal to safeguard the environment while pursuing further growth, the Company has begun ramping up efforts to achieve its newly announced climate, water, and waste targets by 2025. Saputo has completed the first year of its three-year capital allocation commitment to pursue initiatives and has implemented processes and accountability systems to track and measure its performance against the set targets.
Saputo is also committed to diversifying its product portfolio by pursuing plant-based opportunities. The Company aims to capitalize on the growing consumer demand, and to leverage commonalities in customer base, technology, manufacturing expertise, assets, and supply chain. Under the leadership of its recently-appointed Senior Vice-President, Business Development, Plant-Based Food, Saputo will continue to look to increase its presence in this category through a series of investments in manufacturing, sales and distribution. Such initiatives should not signal a lack of confidence in the dairy industry. The Company remains very bullish about dairy products and believes that there are vast opportunities for the Company to grow in the dairy space.
In the current COVID-19 environment, each of the Company’s Sectors will continue to actively manage its operations in consideration of the evolution of the COVID-19 crisis and related impact on its activities. This will require the Sectors to continue adapting manufacturing operations to local realities and to changes in consumer demands as they evolve while continuing to maximize operational efficiencies.
The Canada Sector will seek further opportunities to strengthen its customer and consumer relationships and increase loyalty. In an effort to pursue additional efficiencies and right-size both its manufacturing footprint and sales force, Saputo will follow through with the previously announced closures of its Trenton, Ontario, and Saint John, New Brunswick, facilities in Canada. These closures are scheduled to occur during fiscal 2021 and the production of both these sites will be integrated into other Saputo facilities across Canada.
The USA Sector’s long-term objectives have not changed, and it will remain focused on growing its specialty and value-added products business and pursuing operational efficiencies. The recently experienced volatility in the USA dairy commodity markets is expected to continue in fiscal 2021.
After the COVID-19 pandemic was declared, the International Sector experienced relative stability within the domestic markets in Australia and in Argentina, but expects to continue to face a reduction in its export sales volumes as customers continue to experience the effects of local lockdowns. The Company expects the volatility in international ingredient and cheese prices to continue during fiscal 2021. However, it is difficult to predict the impact related to the tariff policies that different countries may put in place on dairy ingredient prices globally.
In fiscal 2021, the Dairy Division (Australia) will continue the integration of the Specialty Cheese Business Acquisition. The Division expects competition in the sourcing of raw milk to persist and to continue to put pressure on margins. The Company aims to further capture opportunities derived from the combination of all its operating activities under a single platform and to leverage the vast portfolio of Australian brands inherited through the Specialty Cheese Business Acquisition.
ANNUAL REPORT 2020
- 11 -
The Company will continue its integration of the Dairy Division (UK) and focus on aligning processes, systems, and sharing best practices. The Division will pursue capital investments in its manufacturing facilities with the objective of increasing its cheesemaking capabilities and driving overall growth through new product development as well as expanding sales overseas.
Although it is impossible to predict with certainty, given over 80% of Dairy Division (UK) sales are derived from the retail segment, the surge in demand stemming from the COVID-19 pandemic is expected to have a positive impact on the Europe Sector’s revenues and EBITDA in fiscal 2021.
Considering the COVID-19 pandemic and related travel restrictions, the Company has re-planned the deployment of the Enterprise Resource Planning (ERP) program, which includes postponing the rollout within the remainder of the Dairy Division (Australia) to fiscal 2022. Having completed the first phase of the implementation within the Cheese Division (USA), the Company plans to continue with subsequent phases up until the end of fiscal 2022. The Company’s plan will evolve with COVID-19 developments. The Dairy Division (Canada) is expected to begin its ERP rollout during the third quarter of fiscal 2021. The Dairy Division (UK) remains out of the scope of Saputo’s global ERP program and will continue to operate under its existing ERP system.
Finally, in these challenging times, the goal remains to continue to improve overall efficiencies in all sectors, pursue growth organically and through acquisitions, and always strive to be a stronger and better operator.
ANNUAL REPORT 2020
- 12 -
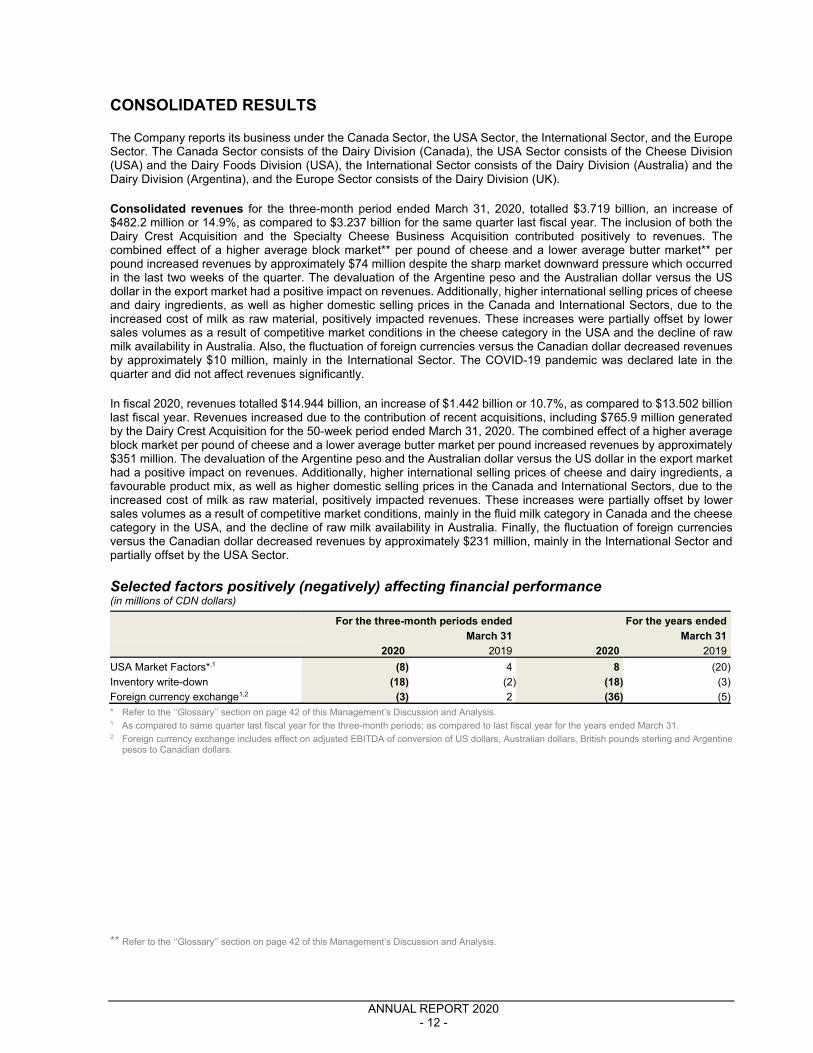
CONSOLIDATED RESULTS
The Company reports its business under the Canada Sector, the USA Sector, the International Sector, and the Europe Sector. The Canada Sector consists of the Dairy Division (Canada), the USA Sector consists of the Cheese Division (USA) and the Dairy Foods Division (USA), the International Sector consists of the Dairy Division (Australia) and the Dairy Division (Argentina), and the Europe Sector consists of the Dairy Division (UK).
Consolidated revenues for the three-month period ended March 31, 2020, totalled $3.719 billion, an increase of $482.2 million or 14.9%, as compared to $3.237 billion for the same quarter last fiscal year. The inclusion of both the Dairy Crest Acquisition and the Specialty Cheese Business Acquisition contributed positively to revenues. The combined effect of a higher average block market** per pound of cheese and a lower average butter market** per pound increased revenues by approximately $74 million despite the sharp market downward pressure which occurred in the last two weeks of the quarter. The devaluation of the Argentine peso and the Australian dollar versus the US dollar in the export market had a positive impact on revenues. Additionally, higher international selling prices of cheese and dairy ingredients, as well as higher domestic selling prices in the Canada and International Sectors, due to the increased cost of milk as raw material, positively impacted revenues. These increases were partially offset by lower sales volumes as a result of competitive market conditions in the cheese category in the USA and the decline of raw milk availability in Australia. Also, the fluctuation of foreign currencies versus the Canadian dollar decreased revenues by approximately $10 million, mainly in the International Sector. The COVID-19 pandemic was declared late in the quarter and did not affect revenues significantly.
In fiscal 2020, revenues totalled $14.944 billion, an increase of $1.442 billion or 10.7%, as compared to $13.502 billion last fiscal year. Revenues increased due to the contribution of recent acquisitions, including $765.9 million generated by the Dairy Crest Acquisition for the 50-week period ended March 31, 2020. The combined effect of a higher average block market per pound of cheese and a lower average butter market per pound increased revenues by approximately $351 million. The devaluation of the Argentine peso and the Australian dollar versus the US dollar in the export market had a positive impact on revenues. Additionally, higher international selling prices of cheese and dairy ingredients, a favourable product mix, as well as higher domestic selling prices in the Canada and International Sectors, due to the increased cost of milk as raw material, positively impacted revenues. These increases were partially offset by lower sales volumes as a result of competitive market conditions, mainly in the fluid milk category in Canada and the cheese category in the USA, and the decline of raw milk availability in Australia. Finally, the fluctuation of foreign currencies versus the Canadian dollar decreased revenues by approximately $231 million, mainly in the International Sector and partially offset by the USA Sector.
Selected factors positively (negatively) affecting financial performance (in millions of CDN dollars)
For the three-month periods ended
March 31
For the years ended
March 31
2020 2019 2020 2019
USA Market Factors*,1 (8) 4 8 (20)
Inventory write-down (18) (2) (18) (3)
Foreign currency exchange1,2 (3) 2 (36) (5)
* Refer to the ‘‘Glossary’’ section on page 42 of this Management’s Discussion and Analysis. 1 As compared to same quarter last fiscal year for the three-month periods; as compared to last fiscal year for the years ended March 31. 2 Foreign currency exchange includes effect on adjusted EBITDA of conversion of US dollars, Australian dollars, British pounds sterling and Argentine
pesos to Canadian dollars.
** Refer to the ‘‘Glossary’’ section on page 42 of this Management’s Discussion and Analysis.

ANNUAL REPORT 2020
- 13 -
Consolidated adjusted EBITDA* for the three-month period ended March 31, 2020, totalled $298.4 million, an increase of $23.3 million or 8.5%, as compared to $275.1 million for the same quarter last fiscal year. The contribution of the Dairy Crest Acquisition increased adjusted EBITDA by $46.6 million, and the Specialty Cheese Business Acquisition also contributed positively to adjusted EBITDA. The COVID-19 pandemic had a negative impact on adjusted EBITDA caused by the shift in consumer demand, mainly in North America, during the last two weeks of the quarter. This includes an amount of $26.9 million, which comprises a loss from unsellable inventory destined to foodservice customers and other expenses in the Canada and USA Sectors, and an inventory write-down of $17.9 million as a result of the decrease in certain market selling prices in the USA Sector. Pricing initiatives in the USA Sector positively affected adjusted EBITDA through a better alignment of selling prices with costs related to warehousing, delivery, and logistics. Higher international dairy ingredient and cheese market prices also positively impacted adjusted EBITDA. However, USA Market Factors decreased adjusted EBITDA by approximately $8 million. Lower cheese sales volumes in the USA resulting from competitive market conditions, combined with lower sales volumes following the decline of raw milk availability in Australia, negatively affected adjusted EBITDA and consequentially operational efficiencies. The adoption of IFRS 16, Leases positively impacted adjusted EBITDA by approximately $15 million. The fluctuation of foreign currencies versus the Canadian dollar had a negative impact on adjusted EBITDA of approximately $3 million.
In fiscal 2020, consolidated adjusted EBITDA totalled $1.468 billion, an increase of $246.5 million or 20.2%, as compared to $1.221 billion last fiscal year. The contribution of the Dairy Crest Acquisition for the 50-week period ended March 31, 2020, increased adjusted EBITDA by $143.1 million. Also, adjusted EBITDA increased due to the contribution of recent acquisitions for the full year, as compared to partial contributions last fiscal year, and the contribution of the Specialty Cheese Business Acquisition for 22 weeks this fiscal year. As described above, the COVID-19 pandemic negatively affected adjusted EBITDA late in the fourth quarter of the fiscal year. Pricing initiatives in the USA Sector positively affected adjusted EBITDA through a better alignment of selling prices with costs related to warehousing, delivery, and logistics. Higher international dairy ingredient and cheese market prices positively impacted adjusted EBITDA. However, lower sales volumes as a result of competitive market conditions, mainly in the fluid milk category in Canada and the cheese category in the USA, and the decline of raw milk availability in Australia negatively affected adjusted EBITDA and consequentially operational efficiencies. Also, USA Market Factors had a favourable impact of approximately $8 million. The adoption of IFRS 16, Leases increased adjusted EBITDA by approximately $62 million. Lastly, the fluctuation of foreign currencies versus the Canadian dollar had an unfavourable impact on adjusted EBITDA of approximately $36 million, mainly in the International Sector.
The consolidated adjusted EBITDA margin increased to 9.8% in fiscal 2020, as compared to 9.0% in fiscal 2019, reflecting higher adjusted EBITDA margins in the International Sector and the new contribution of the Europe Sector.
Depreciation and amortization for the three-month period ended March 31, 2020, totalled $127.8 million, an increase of $46.7 million, as compared to $81.1 million for the same quarter last fiscal year. In fiscal 2020, depreciation and amortization expenses amounted to $467.2 million, an increase of $154.2 million, as compared to $313.0 million for fiscal 2019. These increases were mainly attributable to additional depreciation and amortization related to recent acquisitions and to additions to property, plant and equipment, which increased the depreciable base. Also, as a result of the adoption of IFRS 16, Leases, depreciation of right-of-use assets represented an increase of approximately $12 million and $50 million for the three-month period and fiscal year ended March 31, 2020, respectively.
Inventory revaluation resulting from a business acquisition for the three-month period and fiscal year ended March 31, 2020, amounted to nil and $40.1 million, respectively. These revaluations were mainly related to the Dairy Crest Acquisition, stemming from added value attributed to the acquired inventory as part of the purchase price allocation.
Acquisition and restructuring costs for the three-month period and fiscal year ended March 31, 2020, amounted to $13.8 million and $46.0 million, respectively. For the three-month period ended March 31, 2020, the Company incurred severance and closure costs, and impairment charges for property, plant and equipment relating to the previously announced plant closures in Trenton, Ontario, and Saint-John, New Brunswick. In fiscal 2020, acquisition costs were incurred for the Dairy Crest Acquisition and the Specialty Cheese Business Acquisition, which included approximately $18 million of stamp duty taxes.
* Non-IFRS measures are described in the ‘‘Glossary’’ section on page 42 of this Management’s Discussion and Analysis.

ANNUAL REPORT 2020
- 14 -
Net interest expense for the three-month period and fiscal year ended March 31, 2020, increased by $14.8 million and $58.7 million, respectively, as compared to the same periods last fiscal year. These increases were mainly attributable to new debt related to the Dairy Crest Acquisition and the Specialty Cheese Business Acquisition, as well as higher bank loans denominated in Argentine peso, which bear higher interest rates. Also, as a result of the adoption of IFRS 16, Leases, interest expenses on lease liabilities pertaining to right-of-use assets represented an increase of approximately $3 million and $15 million, respectively.
In accordance with IAS 29, Financial Reporting in Hyperinflationary Economies, Argentina is considered a hyperinflationary economy since July 1, 2018. For the three-month period and fiscal year ended March 31, 2020, the gain on hyperinflation totalled $10.9 million and $27.8 million, respectively. These gains were derived from the indexation of non-monetary assets and liabilities.
Income tax expense for the three-month period ended March 31, 2020, totalled $42.7 million, reflecting an effective tax rate of 32.5% as compared to 26.7% for the same quarter last fiscal year. This 5.8% increase was mainly attributable to the increase of deferred tax liabilities resulting from the effect of the 2% increase in the corporate income tax rate in the United Kingdom, which was enacted on March 17, 2020, and, it also reflects the offsetting impacts from hyperinflation in Argentina and from the decrease in provincial taxes in Canada.
Income tax expense for fiscal 2020 totalled $216.5 million, reflecting an effective tax rate of 27.1% as compared to 23.4% for fiscal 2019. The increase in the effective tax rate in fiscal 2020 was mainly attributable to an income tax expense of $17.3 million due to the increase in the corporate income tax rate in the United Kingdom. The effective tax rate for fiscal 2020 also reflected the income tax benefits of $6.7 million and $3.5 million related to a tax inflation adjustment pursuant to Argentine tax legislation and the decrease in provincial income taxes in Canada, respectively. In fiscal year 2019, the effective tax rate was positively impacted as a portion of a gain on the disposition of assets was not taxable. Excluding the effects of these factors, the effective tax rates for the fiscal years 2020 and 2019 would have been 26.2% and 26.0%, respectively. The effective tax rate varies and could increase or decrease based on the amount and source of taxable income, amendments to tax legislations and income tax rates, changes in assumptions, as well as estimates used by the Company and its affiliates for the computation of current and deferred tax assets and liabilities.
Net earnings for the three-month period ended March 31, 2020, totalled $88.7 million, a decrease of $35.5 million or 28.6%, as compared to $124.2 million for the same quarter last fiscal year. In fiscal 2020, net earnings totalled $582.8 million, a decrease of $172.5 million or 22.8%, as compared to $755.3 million last fiscal year. These decreases were due to the above-mentioned factors, as well as to the non-recurring after-tax gain of $167.8 million from the sale of the Burnaby, British Columbia facility, recorded in fiscal 2019.
Adjusted net earnings* for the three-month period ended March 31, 2020, totalled $98.8 million, a decrease of $27.0 million or 21.5%, as compared to $125.8 million for the same quarter last fiscal year. Adjusted net earnings excluding amortization of intangible assets related to business acquisitions* totalled $116.5 million, a decrease of $17.3 million or 12.9%, as compared to $133.8 million for the same quarter last fiscal year. These decreases were due to the above-mentioned factors.
In fiscal 2020, adjusted net earnings totalled $653.7 million, an increase of $30.1 million or 4.8%, as compared to $623.6 million last fiscal year. Adjusted net earnings excluding amortization of intangible assets related to business acquisitions totalled $723.6 million, an increase of $68.5 million or 10.5%, as compared to $655.1 million last fiscal year. These increases were due to the above-mentioned factors.
* Non-IFRS measures are described in the ‘‘Glossary’’ section on page 42 of this Management’s Discussion and Analysis.

ANNUAL REPORT 2020
- 15 -
QUARTERLY FINANCIAL INFORMATION BY SECTOR
CANADA SECTOR
(in millions of CDN dollars)
Fiscal years 2020 2019
Q4 Q3 Q2 Q1 Q4 Q3 Q2 Q1
Revenues 960.1 1,049.0 1,029.4 968.8 924.8 1,059.6 1,047.7 1,011.0
Adjusted EBITDA* 91.0 111.7 103.2 98.5 90.0 113.8 104.4 105.5
* Non-IFRS measures are described in the ‘‘Glossary’’ section on page 42 of this Management’s Discussion and Analysis.
The Canada Sector consists of the Dairy Division (Canada).
USA SECTOR
(in millions of CDN dollars)
Fiscal years 2020 2019
Q4 Q3 Q2 Q1 Q4 Q3 Q2 Q1
Revenues 1,694.8 1,848.7 1,792.4 1,757.7 1,616.6 1,678.5 1,618.0 1,594.6
Adjusted EBITDA* 94.3 172.1 175.4 173.6 134.2 122.4 133.8 154.3
* Non-IFRS measures are described in the ‘‘Glossary’’ section on page 42 of this Management’s Discussion and Analysis.
Selected factors positively (negatively) affecting financial performance (in millions of CDN dollars)
Fiscal years 2020 2019
Q4 Q3 Q2 Q1 Q4 Q3 Q2 Q1
USA Market Factors*,1 (8) 14 10 (8) 4 (19) (7) 2
Inventory write-down (18) - - - - - - -
US currency exchange1 1 - 1 6 7 6 7 (8)
* Refer to the ‘‘Glossary’’ section on page 42 of this Management’s Discussion and Analysis. 1 As compared to same quarter last fiscal year.
Other pertinent information (in US dollars, except for average exchange rate)
Fiscal years 2020 2019
Q4 Q3 Q2 Q1 Q4 Q3 Q2 Q1
Block market* price
Opening 1.910 1.958 1.858 1.645 1.430 1.690 1.555 1.530
Closing 1.330 1.910 1.958 1.858 1.645 1.430 1.690 1.555
Average 1.835 1.971 1.912 1.711 1.520 1.453 1.605 1.603
Butter market* price
Opening 1.950 2.128 2.410 2.255 2.218 2.320 2.268 2.215
Closing 1.335 1.950 2.128 2.410 2.255 2.218 2.320 2.268
Average 1.799 2.043 2.284 2.330 2.264 2.238 2.264 2.339
Average whey powder market price per pound* 0.353 0.326 0.352 0.370 0.443 0.452 0.387 0.279
Spread* 0.113 (0.018) 0.029 0.061 0.054 0.021 0.095 0.135
US average exchange rate to Canadian dollar1 1.330 1.320 1.320 1.337 1.330 1.321 1.307 1.290
* Refer to the ‘‘Glossary’’ section on page 42 of this Management’s Discussion and Analysis. 1 Based on Bloomberg published information.
The USA Sector consists of the Cheese Division (USA) and the Dairy Foods Division (USA).

ANNUAL REPORT 2020
- 16 -
INTERNATIONAL SECTOR
(in millions of CDN dollars)
Fiscal years 2020 2019
Q4 Q3 Q2 Q1 Q4 Q3 Q2 Q1
Revenues 832.4 797.0 657.0 790.3 695.1 839.1 754.7 662.2
Adjusted EBITDA* 66.5 98.5 80.2 59.7 50.9 85.0 79.3 47.7
* Non-IFRS measures are described in the ‘‘Glossary’’ section on page 42 of this Management’s Discussion and Analysis.
Selected factors positively (negatively) affecting financial performance
(in millions of CDN dollars)
Fiscal years 2020 2019
Q4 Q3 Q2 Q1 Q4 Q3 Q2 Q1
Foreign currency exchange1 (5) (14) (16) (10) (3) (5) - (7)1 As compared to same quarter last fiscal year.
The International Sector consists of the Dairy Division (Australia) and the Dairy Division (Argentina).
EUROPE SECTOR
(in millions of CDN dollars)
Fiscal years 2020 2019
Q4 Q3 Q2 Q1 Q4 Q3 Q2 Q1
Revenues 231.4 196.1 186.8 151.6 - - - -
Adjusted EBITDA* 46.6 34.7 35.6 26.2 - - - -
* Non-IFRS measures are described in the ‘‘Glossary’’ section on page 42 of this Management’s Discussion and Analysis.
The Europe Sector consists of the Dairy Division (UK) following the Dairy Crest Acquisition.

ANNUAL REPORT 2020
- 17 -
CANADA SECTOR
(in millions of CDN dollars)
For the three-month periods ended
March 31
For the years ended
March 31
2020 2019 2020 2019
Revenues 960.1 924.8 4,007.3 4,043.1
Adjusted EBITDA* 91.0 90.0 404.4 413.7
* Non-IFRS measures are described in the ‘‘Glossary’’ section on page 42 of this Management’s Discussion and Analysis.
The Canada Sector consists of the Dairy Division (Canada).
Revenues Revenues for the Canada Sector totalled $960.1 million for the three-month period ended March 31, 2020, an increase of $35.3 million or 3.8%, as compared to $924.8 million for the same quarter last fiscal year. During the quarter, revenues were positively impacted by an increase in selling prices in accordance with the higher cost of milk as raw material. Despite an unfavourable product mix, higher sales volumes, mainly in the fluid milk category, positively impacted revenues.
In connection with the COVID-19 pandemic, the Canada Sector experienced increased demand in the retail segment for both fluid milk and cheese products, whereas demand from customers in the foodservice segment began to decrease. Despite the turbulence of the last two weeks, the COVID-19 crisis did not have a significant impact on revenues for the quarter.
In fiscal 2020, revenues for the Canada Sector totalled $4.007 billion, a decrease of $35.8 million or 0.9%, as compared to $4.043 billion last fiscal year. Revenues were negatively impacted by lower sales volumes in the fluid milk category as a result of Canada's competitive market environment. This decrease was partially offset by a favourable product mix, an increase in selling prices in line with the higher cost of milk as raw material, higher international selling prices of dairy ingredients, and the contribution of the activities of Shepherd Gourmet Dairy (Ontario) Inc. (Shepherd Gourmet Acquisition).
The retail segment of the Dairy Division (Canada) represented approximately 58% of revenues (60% in fiscal 2019) in line with continued demand for dairy products, particularly in the cheese and value-added categories. The Division remained focused on responding to evolving consumer preferences by expanding and innovating through several popular brands. The Armstrong brand recently expanded into the value-added cheese segment through a very successful launch of retail shredded cheeses that increased both distribution and market share nationally. The Division continued to increase the exposure of its entire portfolio of brands through marketing activities, media and local trade marketing. The Dairyland brand benefited from expanded market penetration in Western Canada through new retail listings in response to consumer demand for the traditional brand.
The foodservice segment represented approximately 36% of revenues (35% in fiscal 2019) in the Dairy Division (Canada) and the Division remained committed to delivering innovation, channel expertise and industry-leading quality and service in this segment. The Division recently began collaborating with professional chef contributors who assisted in converting research, insights and consumer trends into innovative product solutions and applications.
The industrial segment represented approximately 6% of revenues (5% in fiscal 2019) in the Dairy Division (Canada).
Adjusted EBITDA Adjusted EBITDA for the Canada Sector totalled $91.0 million for the three-month period ended March 31, 2020, an increase of $1.0 million or 1.1%, as compared to $90.0 million for the same quarter last fiscal year. Adjusted EBITDA was positively impacted by higher sales volumes. The increase in adjusted EBITDA was partially offset by an inventory write-down and other expenses totalling $4.3 million, which were mainly attributable to unsellable inventory resulting from the COVID-19 pandemic’s impact on demand in the foodservice segment beginning in the last two weeks of the quarter. Finally, the adoption of IFRS 16, Leases positively impacted adjusted EBITDA by approximately $2 million.
Adjusted EBITDA in fiscal 2020 totalled $404.4 million, a decrease of $9.3 million or 2.2%, as compared to $413.7 million in fiscal 2019. Adjusted EBITDA was negatively impacted by lower sales volumes in the fluid milk category, as a result of Canada's competitive market environment, and by an inventory write-down and other expenses totalling $4.3 million, mainly attributable to unsellable inventory resulting from the impact of the COVID-19 pandemic late in the fourth quarter of fiscal 2020. This decrease was partially offset by higher international selling prices of dairy ingredients and the positive contribution of the Shepherd Gourmet Acquisition. Lastly, the adoption of IFRS 16, Leases had a favourable impact of approximately $9 million.

ANNUAL REPORT 2020
- 18 -
USA SECTOR
(in millions of CDN dollars)
For the three-month periods ended
March 31
For the years ended
March 31
2020 2019 2020 2019
Revenues 1,694.8 1,616.6 7,093.6 6,507.7
Adjusted EBITDA* 94.3 134.2 615.4 544.7
* Non-IFRS measures are described in the ‘‘Glossary’’ section on page 42 of this Management’s Discussion and Analysis.
Selected factors positively (negatively) affecting financial performance (in millions of CDN dollars)
For the three-month periods ended
March 31
For the years ended
March 31
2020 2019 2020 2019
USA Market Factors*,1 (8) 4 8 (20)
Inventory write-down (18) - (18) -
US currency exchange1 1 7 8 12
* Refer to the ‘‘Glossary’’ section on page 42 of this Management’s Discussion and Analysis. 1 As compared to same quarter last fiscal year for the three-month periods; as compared to last fiscal year for the years ended March 31.
Other pertinent information (in US dollars, except for average exchange rate)
For the three-month periods ended
March 31
For the years ended
March 31
2020 2019 2020 2019
Block market price*
Opening 1.910 1.430 1.645 1.530
Closing 1.330 1.645 1.330 1.645
Average 1.835 1.520 1.857 1.545
Butter market price*
Opening 1.950 2.218 2.255 2.215
Closing 1.335 2.255 1.335 2.255
Average 1.799 2.264 2.114 2.276
Average whey powder market price* 0.353 0.443 0.350 0.392
Spread* 0.113 0.054 0.046 0.076
US average exchange rate to Canadian dollar1 1.330 1.330 1.327 1.311
* Refer to the ‘‘Glossary’’ section on page 42 of this Management’s Discussion and Analysis.
1 Based on Bloomberg published information.
The USA Sector consists of the Cheese Division (USA) and the Dairy Foods Division (USA).
ANNUAL REPORT 2020
- 19 -
Revenues Revenues for the USA Sector totalled $1.695 billion for the three-month period ended March 31, 2020, an increase of $78.2 million or 4.8%, as compared to $1.617 billion for the same quarter last fiscal year. The combined effect of a higher average block market per pound of cheese and a lower butter market per pound increased revenues by approximately $74 million despite the sharp market downward pressure which occurred in the last two weeks of the quarter. However, lower sales volumes in the cheese category, as a result of the USA’s competitive market environment, and lower selling prices in the dairy ingredients market negatively affected revenues. The fluctuation of the US dollar versus the Canadian dollar increased revenues by approximately $17 million.
In connection with the COVID-19 pandemic, the USA Sector experienced increased demand in the retail segment, while demand started to decrease in the foodservice segment. Despite the turbulence of the last two weeks, the COVID-19 crisis did not have a significant impact on revenues for the quarter.
In fiscal 2020, revenues from the USA Sector totalled $7.094 billion, an increase of $585.9 million or 9.0%, as compared to $6.508 billion in fiscal 2019. The combined effect of a higher average block market per pound of cheese and a lower butter market per pound increased revenues by approximately $351 million. Moreover, the contribution of the activities of F&A Dairy Products, Inc. (F&A Acquisition) and higher selling prices in the dairy ingredients market contributed to the increase in revenues. However, the impact of lower sales volumes in the cheese category, as a result of the USA’s competitive market environment, was partially offset by higher sales volumes in the dairy food product categories. Finally, the fluctuation of the US dollar versus the Canadian dollar increased revenues by approximately $89 million.
The retail segment represented approximately 43% of total USA Sector revenues (42% in fiscal 2019). In fiscal 2020, the Cheese Division (USA)’s Frigo Cheese Heads, Treasure Cave and Montchevre retail brands maintained leading market share positions in string cheese, blue cheese and goat cheese, respectively. The Division continued to strengthen its position in the snacking category and convenience stores remained a sizable opportunity for the Frigo Cheese Heads brand with the introduction of new meat and cheese combo offerings and snack bite formats. Stella, the Division’s Italian-style deli brand, continued to promote its line of flavour-rubbed wheels (launched in fiscal 2019), and further expanded its fresh mozzarella, blue cheese, and organic offerings. The Dairy Foods Division (USA) continued to consistently outpace retail market growth in core categories, including both extended shelf-life (ESL) and cultured products, which include creams, half and half, cottage cheese, and sour cream. The growth was driven by strong relationships with key customers, positive trends in private label, and accelerated growth in high dairy fat products, such as whipping cream. The Division also launched new private label products that have clean labels, fit a health and wellness lifestyle, and deliver consumer-preferred flavour line extensions.
The foodservice segment represented approximately 48% of total USA Sector revenues (49% in fiscal 2019). In fiscal 2020, the Cheese Division (USA) kept its focus on growth through continued emphasis on broadline distributors and national account pizza and sandwich chain restaurants. With the F&A Acquisition, the Division benefited from a diversified milk procurement territory in New Mexico. The Division also increased its focus on specialty cheese, allowing it to leverage the branded offerings within its specialty products portfolio. The Dairy Foods Division (USA) foodservice segment consists of two main customer segments: chain restaurants and broadline distributors. Strong partnerships with key customers and new distribution gains drove growth in the chain restaurant segment. In the broadline foodservice distribution segment, core categories, including creams/creamers and sour cream, grew as customers continued to focus on private label development and market penetration.
The industrial segment includes cheese sales and accounted for approximately 9% of revenues.

ANNUAL REPORT 2020
- 20 -
Adjusted EBITDA Adjusted EBITDA for the USA Sector totalled $94.3 million for the three-month period ended March 31, 2020, a decrease of $39.9 million or 29.7%, as compared to $134.2 million for the same quarter last fiscal year. Adjusted EBITDA was negatively impacted due to the decrease in foodservice customer demand during the last two weeks of the quarter as a result of the COVID-19 pandemic. This decrease includes a $22.6 million loss from unsellable inventory destined to foodservice customers and other expenses, and an inventory write-down of $17.9 million as a result of the reduction in certain market selling prices. During the quarter, adjusted EBITDA was also negatively impacted by lower cheese sales volumes, as a result of the USA’s competitive market environment, thereby reducing operational efficiencies. Furthermore, pricing initiatives favourably affected adjusted EBITDA through a better alignment of selling prices with costs related to warehousing, delivery, and logistics.
USA Market Factors negatively impacted adjusted EBITDA by approximately $8 million, mainly due to lower selling prices in the dairy ingredients market. The adoption of IFRS 16, Leases favourably impacted adjusted EBITDA by approximately $2 million. Finally, the fluctuation of the US dollar versus the Canadian dollar had a positive impact on adjusted EBITDA of approximately $1 million.
In fiscal 2020, adjusted EBITDA totalled $615.4 million, an increase of $70.7 million or 13.0%, as compared to $544.7 million last fiscal year. As described above, the COVID-19 pandemic negatively impacted adjusted EBITDA late in the fourth quarter of the fiscal year. Pricing initiatives positively affected adjusted EBITDA through a better alignment of selling prices with costs related to warehousing, delivery and logistics. Adjusted EBITDA was also positively impacted by warehouse, delivery, and logistics efficiencies and by higher sales volumes in the dairy food product categories. This increase was partially offset by the impact of lower cheese sales volumes, as a result of the USA’s competitive market environment.
Finally, USA Market Factors positively impacted adjusted EBITDA by approximately $8 million, mainly due to higher selling prices in the dairy ingredients market. The adoption of IFRS 16, Leases favourably impacted adjusted EBITDA by approximately $9 million. Lastly, the fluctuation of the US dollar versus the Canadian dollar had a positive impact on adjusted EBITDA of approximately $8 million.

ANNUAL REPORT 2020
- 21 -
INTERNATIONAL SECTOR
(in millions of CDN dollars)
For the three-month periods ended
March 31
For the years ended
March 31
2020 2019 2020 2019
Revenues 832.4 695.1 3,076.7 2,951.1
Adjusted EBITDA* 66.5 50.9 304.9 262.9
* Non-IFRS measures are described in the ‘‘Glossary’’ section on page 42 of this Management’s Discussion and Analysis.
Selected factors positively (negatively) affecting financial performance (in millions of CDN dollars)
For the three-month periods ended
March 31
For the years ended
March 31
2020 2019 2020 2019
Foreign currency exchange1 (5) (3) (45) (15)1 As compared to same quarter last fiscal year for the three-month periods; as compared to last fiscal year for the years ended March 31.
The International Sector consists of the Dairy Division (Australia) and the Dairy Division (Argentina).
Revenues Revenues for the International Sector totalled $832.4 million for the three-month period ended March 31, 2020, an increase of $137.3 million or 19.8%, as compared to $695.1 million for the same quarter last fiscal year. Higher selling prices as a result of the increased cost of milk in the Dairy Division (Australia) and the hyperinflationary economy in the Dairy Division (Argentina) positively impacted revenues. The contribution of the Specialty Cheese Business Acquisition in the Dairy Division (Australia) also increased revenues. Moreover, the weakening of the Argentine peso and the Australian dollar versus the US dollar, as well as higher international selling prices of cheese and dairy ingredients in the export market, positively impacted revenues. However, lower export sales volumes in the Dairy Division (Australia) due to reduced milk availability negatively impacted revenues. The fluctuation of the functional currencies used in the International Sector versus the Canadian dollar had a negative impact on revenues of approximately $27 million.
In connection with the COVID-19 pandemic, the International Sector experienced increased demand in the retail segment in the everyday cheese and chilled milk categories. Conversely, customer demand decreased in the foodservice segment, and the export market was also negatively impacted. Despite the turbulence of the last two weeks, the COVID-19 crisis did not have a significant impact on revenues for the quarter.
In fiscal 2020, revenues for the International Sector totalled $3.077 billion, an increase of $125.6 million or 4.3%, as compared to $2.951 billion last fiscal year. Higher selling prices as a result of the increased cost of milk in the Dairy Division (Australia) and the hyperinflationary economy in the Dairy Division (Argentina) positively impacted revenues. The inclusion of the activities of Murray Goulburn Co-Operative Co. Limited (Murray Goulburn Acquisition) for the full year and the contribution of the Specialty Cheese Business Acquisition for 22 weeks also positively impacted revenues. Furthermore, the weakening of the Argentine peso and the Australian dollar versus the US dollar, as well as higher international selling prices of cheese and dairy ingredients in the export market, increased revenues. However, lower sales volumes in the Dairy Division (Australia) due to reduced milk availability negatively impacted revenues. Finally, the fluctuation of the functional currencies used in the International Sector versus the Canadian dollar had a negative impact on revenues of approximately $320 million.
The retail segment, the foodservice segment, and the industrial segment, which includes cheese sales, represented approximately 42%, 7%, and 51%, respectively, of total revenues for the International Sector (39%, 6%, and 55%, respectively, in fiscal 2019).

ANNUAL REPORT 2020
- 22 -
Adjusted EBITDA Adjusted EBITDA for the International Sector totalled $66.5 million for the three-month period ended March 31, 2020, an increase of $15.6 million or 30.6%, as compared to $50.9 million for the same quarter last fiscal year. Higher international cheese and dairy ingredient market prices, as well as the contribution of the Specialty Cheese Business Acquisition, positively impacted adjusted EBITDA. Also, higher selling prices as a result of the hyperinflationary economy in the Dairy Division (Argentina) increased adjusted EBITDA. Adjusted EBITDA was also positively impacted by lower warehousing and logistics costs related to decreased handling and external storage expenses in the Dairy Division (Australia). The increase in adjusted EBITDA was partially offset by the negative impact of lower export sales volumes in the Dairy Division (Australia), resulting from a decline in milk availability. The adoption of IFRS 16, Leases increased adjusted EBITDA by approximately $10 million. The fluctuation of the functional currencies used in the International Sector versus the Canadian dollar had a negative impact on adjusted EBITDA of approximately $5 million. The COVID-19 pandemic did not have a significant impact on adjusted EBITDA for the quarter.
In fiscal 2020, adjusted EBITDA totalled $304.9 million, an increase of $42.0 million or 16.0%, as compared to $262.9 million last fiscal year. Higher international cheese and dairy ingredient market prices, as well as the contribution of the Specialty Cheese Business Acquisition, favourably impacted adjusted EBITDA. Also, higher selling prices as a result of the hyperinflationary economy in the Dairy Division (Argentina) had a positive impact on adjusted EBITDA. Adjusted EBITDA was also positively impacted by lower warehousing and logistics costs related to decreased handling and external storage expenses in the Dairy Division (Australia). The increase in adjusted EBITDA was partially offset by the impact of lower sales volumes in the Dairy Division (Australia), resulting from a decline in milk availability. The adoption of IFRS 16, Leases increased adjusted EBITDA by approximately $44 million. Lastly, the fluctuation of functional currencies used in the International Sector versus the Canadian dollar had a negative impact on adjusted EBITDA of approximately $45 million.

ANNUAL REPORT 2020
- 23 -
EUROPE SECTOR
(in millions of CDN dollars)
For the three-month periods ended
March 31
For the years ended
March 31
2020 2019 2020 2019
Revenues 231.4 - 765.9 -
Adjusted EBITDA* 46.6 - 143.1 -
* Non-IFRS measures are described in the ‘‘Glossary’’ section on page 42 of this Management’s Discussion and Analysis.
The Europe Sector consists of the Dairy Division (UK) following the Dairy Crest Acquisition.
Revenues Revenues for the Europe Sector totalled $231.4 million and $765.9 million for the three-month period and the 50-week period ended March 31, 2020, respectively. The increase in demand within the retail segment due to the COVID-19 pandemic in the last two weeks of fiscal 2020 had a favourable impact on revenues. The retail segment represented approximately 83% of total Europe Sector revenues. The Dairy Division (UK) maintained its position as the largest manufacturer of branded cheese in the United Kingdom, mainly with its market-leading Cathedral City brand, as well as its position as a top manufacturer of dairy spreads with its market-leading Clover brand. In addition, the Division’s retail presence was enhanced by its popular butter and oil brands, Country Life and Frylight, respectively. The foodservice segment and the industrial segment represented approximately 1% and 16%, respectively, of total revenues for the Europe Sector.
Adjusted EBITDA Adjusted EBITDA for the Europe Sector totalled $46.6 million and $143.1 million for the three-month period and the 50-week period ended March 31, 2020, respectively. Adjusted EBITDA for the Europe Sector for the three-month period and the 50-week period ended March 31, 2020, included positive contributions of approximately $4 million and $15 million, respectively, resulting from the adoption of IFRS 16, Leases. The COVID-19 crisis had a favourable impact on adjusted EBITDA for fiscal 2020. Excluding the impact from the adoption of IFRS 16, Leases, adjusted EBITDA for the 50-week period ended March 31, 2020, is in line with Dairy Crest’s results for the same period last fiscal year.

ANNUAL REPORT 2020
- 24 -
LIQUIDITY, FINANCIAL AND CAPITAL RESOURCES
The intent of this section is to provide insight into the cash and capital management strategies of the Company and how they drive operational objectives, as well as to provide details on how the Company manages its liquidity risk to meet its financial obligations as they come due. As a result of uncertainties caused by the COVID-19 pandemic, the Company is reevaluating its capital allocation priorities and is continuing to focus on cash flow generation. The Company’s current capital allocation priorities are focused on investing wisely to support its business operations. Currently, the Company has no intention to repurchase common shares in the course of the fiscal year ending March 31, 2021.
The Company will review and, when appropriate, adjust its overall approach to capital allocation as it seeks to gain more clarity on the length and severity of the COVID-19 pandemic and how the post-pandemic recovery will unfold. The existing debt financing arrangements do not require repayment of capital during fiscal 2021. The Company's cash and cash equivalents totalled $319.4 million as at March 31, 2020. In addition to these funds, the Company has unused credit facilities of US$1.000 billion under the North American bank credit facilities as at March 31, 2020. The Company believes it is well positioned to navigate current market conditions given its strong balance sheet, and it will continue to monitor and assess the impact COVID-19 may have on its business and financial results.
The Company’s liquidity needs are funded from cash generated by operations, unsecured bank credit facilities and unsecured senior notes. These funds are used principally for capital expenditures, dividends, debt repayments and business acquisitions, and are expected to be sufficient to meet the Company’s liquidity requirements. The Company does not foresee any difficulty in securing financing beyond what is currently available through existing arrangements or equity offerings, when appropriate, to fund possible acquisitions and to refinance debt obligations.
The Company’s cash flows are summarized in the following table:
(in millions of CDN dollars)
For the three-month periods ended
March 31
For the years ended
March 31
2020 2019 2020 2019
Cash generated from operating activities 331.9 272.2 1,315.5 1,112.6
Net cash generated from operating activities 295.2 228.2 1,036.9 884.5
Cash used for investing activities (201.4) (141.8) (2,494.9) (1,506.6)
Cash (used for) generated from financing activities (23.7) (133.6) 1,643.8 606.1
Increase (decrease) in cash and cash equivalents 70.1 (47.2) 185.8 (16.0)
For the three-month period ended March 31, 2020, cash generated from operating activities amounted to $331.9 million as compared to $272.2 million for the same quarter last fiscal year, an increase of $59.7 million. In fiscal 2020, cash generated from operating activities amounted to $1.316 billion as compared to $1.113 billion last fiscal year, an increase of $202.9 million.
Net cash generated from operating activities for the three-month period ended March 31, 2020, amounted to $295.2 million in comparison to $228.2 million for the same quarter last fiscal year. This increase of $67.0 million is due to an increase related to changes in non-cash operating working capital items of $44.1 million driven by fluctuations in receivables, inventories, and accounts payable in line with the fluctuation of market prices, an increase in adjusted EBITDA of $23.3 million, and a decrease of $21.0 million in income tax paid. The increase was partially offset by an increase of $10.6 million in non-cash foreign exchange gains on debt and $13.7 million in interest paid.
In fiscal 2020, net cash generated from operating activities amounted to $1.037 billion, as compared to $884.5 million last fiscal year. This increase of $152.4 million is due to an increase in adjusted EBITDA of $246.5 million, lower acquisition costs of $15.9 million, and a decrease of $5.4 million in income tax paid. This increase was partially offset by an increase of $55.9 million in interest paid, $31.2 million in non-cash foreign exchange gains on debt, and changes in non-cash operating working capital items of $23.5 million driven by fluctuations in receivables, inventories, and accounts payable in line with the fluctuation of market prices.

ANNUAL REPORT 2020
- 25 -
Investing activities for the three-month period ended March 31, 2020, were mainly comprised of additions to property, plant and equipment of $187.9 million and additions to intangibles of $16.0 million related to the ERP initiative. In fiscal 2020, investing activities consisted mainly of $1.930 billion disbursed for the Dairy Crest Acquisition and the Specialty Cheese Business Acquisition, additions to property, plant and equipment of $509.9 million, and additions to intangibles of $66.4 million related to the ERP initiative. Of these additions, 37% went into the replacement of property, plant and equipment and 63% was used to implement new technologies and to expand and increase certain manufacturing capacities.
Financing activities for the three-month period ended March 31, 2020, consisted mainly of an increase in bank loans of $66.9 million, and an issuance of shares as part of the stock option plan for $14.7 million. Also, the Company paid $35.0 million in lease liabilities, repaid $0.9 million of long-term debt, and paid $69.4 million in dividends.
Financing activities in fiscal 2020, consisted mainly of additional long-term debt in the amount of $2.062 billion related to the Dairy Crest Acquisition. A portion of the net proceeds from the long-term debt incurred for the Dairy Crest Acquisition was used to repay $451.4 million of debt assumed relative to the acquisition. The net proceeds of $639.9 million from the public offering and concurrent private placement of common shares on September 11, 2019 (the Equity Offering), were used to repay the following: (i) $572.0 million, which represents the balance of the 1-year tranche of the term loan facility incurred in connection with the Dairy Crest Acquisition, and (ii) $67.9 million of the 3-year tranche of the term loan facility incurred in April 2018. Financing activities also included the issuance of $400.0 million related to the issuance of the series 6 medium term notes. The net proceeds of the issuance were used to repay the $300.0 million aggregate principal amount of the Series 1 medium term notes due November 26, 2019. The remainder of the net proceeds was used to repay a portion of the 3-year tranche of the term loan facility incurred in April 2018. Also, the Company paid $90.7 million in lease liabilities and $269.7 million in dividends. Finally, bank loans increased by $404.3 million, and shares were issued as part of the stock option plan for $45.0 million.
Liquidity (in millions of CDN dollars, except ratio)
Fiscal years 2020 2019
Current assets 4,069.0 3,133.8 Current liabilities 2,493.5 1,932.5 Working capital* 1,575.5 1,201.3 Working capital ratio* 1.63 1.62
* Refer to the ‘‘Glossary’’ section on page 42 of this Management’s Discussion and Analysis.
The working capital ratio is an indication of the Company’s ability to cover short-term liabilities with short-term assets, without having excess dormant assets.

ANNUAL REPORT 2020
- 26 -
Capital management The Company’s capital strategy requires a well-balanced financing structure in order to maintain the flexibility required to implement growth initiatives, while allowing it to pursue disciplined capital investments and maximize shareholder value.
Prior to the adoption of IFRS 16, Leases, the Company targeted a long-term leverage of approximately 2.0 times net debt to adjusted EBITDA. With the adoption of IFRS 16, Leases, the Company adapted its long-term leverage target to approximately 2.25 times net debt to adjusted EBITDA. From time to time, the Company may deviate from its long-term leverage target to pursue acquisitions and other strategic opportunities. As at March 31, 2020, the net debt to adjusted EBITDA ratio includes lease liabilities, as presented below.
(in millions of CDN dollars, except ratio and number of shares and options)
Fiscal years 2020 2019
Long-term debt 3,542.3 2,267.3 Bank loans 528.5 130.4 Lease Liabilities 414.8 - Cash and cash equivalents 319.4 112.7 Net debt* 4,166.2 2,285.0 Adjusted EBITDA** 1,467.8 1,221.3 Net debt to adjusted EBITDA** 2.84 1.87 Number of common shares 408,638,373 390,198,386 Number of stock options 20,946,092 20,374,871
* Refer to the ‘‘Glossary’’ section on page 42 of this Management’s Discussion and Analysis.
** Non-IFRS measures are described in the ‘‘Glossary’’ section on page 42 of this Management’s Discussion and Analysis.
The Company implemented a dividend reinvestment plan (DRIP) effective as of May 28, 2020. The DRIP provides eligible shareholders with the opportunity to have all or a portion of their cash dividends automatically reinvested into additional common shares (Reinvestment Shares). Participants in the DRIP will, until further notice, acquire Reinvestment Shares issued from treasury at a price equal to the volume weighted average price of the Company’s common shares on the Toronto Stock Exchange during the five trading days immediately preceding the dividend payment date, less a discount of 2%.
On November 19, 2019, the Company issued Series 6 medium term notes for an aggregate principal amount of $400.0 million due November 19, 2024, bearing interest at 2.88%, and used the net proceeds to repay the $300.0 million aggregate principal amount of the Series 1 medium term notes due November 26, 2019. The remainder of the net proceeds was used to repay a portion of the 3-year tranche of the term loan facility incurred in April 2018.
On November 12, 2019, the Company amended its North American bank credit facilities to increase the principal amount available from the revolving credit facilities to US$1.000 billion and extended the term until November 2024. The additional available bank credit facilities may be used for general corporate purposes, including to finance acquisitions.
On September 11, 2019, the Company completed a public offering and a concurrent private placement raising gross proceeds of $659.0 million through the issuance of 16,642,553 common shares at a price of $39.60 per share. The proceeds, net of commissions and professional fees of $19.1 million, were $639.9 million. The Equity Offering was carried out pursuant to an underwriting agreement dated August 26, 2019, with a syndicate of underwriters. Saputo used the net proceeds of the offering and the concurrent private placement to repay the remaining balance of the 1-year tranche of the term loan incurred in connection with the Dairy Crest Acquisition, as well as a portion of the term loan incurred in April 2018. The Equity Offering was part of the Company’s capital management strategy to deleverage its balance sheet.
As at March 31, 2020, the Company had $319.4 million in cash and cash equivalents and available bank credit facilities of $2.377 billion, of which $528.5 million were drawn. See Notes 11 and 12 to the consolidated financial statements for additional information related to bank loans and long-term debt.
Share capital authorized by the Company is comprised of an unlimited number of common shares. The common shares are voting and participating. As at May 26, 2020, 408,729,435 common shares and 25,366,062 stock options were outstanding.

ANNUAL REPORT 2020
- 27 -
CONTRACTUAL OBLIGATIONS
The Company manages and continually monitors its commitments and contractual obligations to ensure that these can be met with funding provided by operations and capital structure optimization.
The Company’s contractual obligations consist of commitments to repay certain long-term debts in addition to leases of premises, equipment and rolling stock as well as purchase obligations for capital expenditures and service agreements to which the Company is committed. Note 12 to the consolidated financial statements describes the Company’s commitment to repay long-term debt and Note 20 to the consolidated financial statements describes its lease commitments.
(in millions of CDN dollars)
March 31, 2020 March 31, 2019
Long-term
debt Leases
Purchase obligations
Total Long-term
debt Leases
Purchase obligations
Total
Less than 1 year - 96.4 196.5 292.9 323.4 110.4 154.1 587.9
1–2 years 718.8 84.8 20.4 824.0 3.9 85.6 - 89.5
2–3 years 1,336.4 62.3 16.2 1,414.9 502.1 62.7 - 564.8
3–4 years 737.1 46.4 6.5 790.0 300.0 49.7 - 349.7
4–5 years 400.0 59.2 6.0 465.2 787.9 39.3 - 827.2
More than 5 years 350.0 159.8 7.9 517.7 350.0 183.5 - 533.5
3,542.3 508.9 253.5 4,304.7 2,267.3 531.2 154.1 2,952.6 Long-term debt The Company’s long-term debt is described in Note 12 to the consolidated financial statements.
In connection with the Murray Goulburn Acquisition, the Company entered into a credit agreement in April 2018 providing for a non-revolving term facility comprised of three tranches. A total of $1.217 billion was drawn, of which $780.2 million has been repaid. The credit facility bears interest at lenders’ prime rates plus a maximum of 1.00%, or bankers’ acceptance rates or Australian Bank Bill Rate plus 0.80% up to a maximum of 2.00%, depending on the Company’s credit ratings, and has maturities ranging from April 2021 to April 2023.
In connection with the Dairy Crest Acquisition in April 2019, the Company entered into a credit agreement providing for a non-revolving term facility comprised of three tranches. A total of $2.039 billion was drawn, of which $583.4 million has been repaid. The credit facility bears interest at lenders’ prime rates plus a maximum of 1.00% or LIBOR or bankers’ acceptance rates plus 0.80% up to a maximum of 2.00%, depending on the Company’s credit ratings, and has maturities ranging from April 2020 to April 2022.
The Company’s long-term debt also includes five series of unsecured senior notes outstanding under its medium-term program for a total of $1.650 billion, with annual interest rates varying from 1.94% to 3.60% and maturities ranging from June 2021 to August 2025.

ANNUAL REPORT 2020
- 28 -
FINANCIAL POSITION
The main financial position items as at March 31, 2020, varied as compared to those of March 31, 2019, principally due to the inclusion of the Dairy Crest Acquisition and the Specialty Cheese Business Acquisition.
The following table outlines the conversion rates of the respective local operations’ financial position items in foreign currencies as at March 31, 2020, and March 31, 2019.
As at March 31, 2020 As at March 31, 2019
US dollar / Canadian dollar1 1.4062 1.3349
Australian dollar / Canadian dollar1 0.8621 0.9473
Argentine peso / Canadian dollar1 0.0219 0.0308
British pounds sterling / Canadian dollar 1 1.7462 - 2 1 Based on Bloomberg published information. 2 The Dairy Crest Acquisition was completed on April 15, 2019.
The fluctuation of the Canadian dollar versus the US dollar, partially offset by the fluctuation of the Australian dollar, the Argentine peso, and the British pounds sterling, resulted in higher values recorded for the financial position items of the foreign operations.
The net cash (cash and cash equivalents less bank loans) position decreased from negative $17.7 million as at March 31, 2019, to negative $209.1 million as at March 31, 2020, mainly resulting from an increase in bank loans due to the Specialty Cheese Business Acquisition. The change in foreign currency translation adjustments recorded in other comprehensive income (loss) varied mainly due to the fluctuation of foreign currencies versus the Canadian dollar.
The COVID-19 pandemic did not have a significant impact on the Company’s financial position at March 31, 2020, and the Company will continue to monitor and assess the impact it may have on its financial position.
GUARANTEES
From time to time, the Company enters into agreements in the normal course of its business, such as service arrangements and leases, and in connection with business or asset acquisitions or disposals, which by nature may provide for indemnification to third parties. These indemnification provisions may be in connection with breach of representations and warranties and for future claims for certain liabilities. The terms of these indemnification provisions vary in duration. See Note 20 to the consolidated financial statements that discuss the Company’s guarantees.
RELATED PARTY TRANSACTIONS
In the normal course of business, the Company receives services from and provides goods to companies subject to control or significant influence through ownership by its principal shareholder. These goods and services are of an immaterial amount and compensated by a consideration equal to their fair value, comparable to similar arms’ length transactions. The services that are received consist mainly of travel, publicity, lodging, office space rental and management services. The goods that are provided consist mainly of dairy products. Transactions with key management personnel (Management defines key management personnel as all the executive officers who have responsibility and authority for controlling, overseeing, and planning the activities of the Company, as well as the Company’s Directors) are also considered related party transactions and consist of short-term employee benefits, post-employment benefits, stock-based compensation, and payments under the deferred share unit plan. Refer to Note 21 to the consolidated financial statements for further information on related party transactions.

ANNUAL REPORT 2020
- 29 -
CRITICAL ACCOUNTING ESTIMATES
The preparation of the Company’s financial statements requires Management to make certain judgments and estimates about transactions and carrying values that are fulfilled at a future date. Judgments and estimates are subject to fluctuations due to changes in internal and/or external factors and are continuously monitored by Management. A discussion of the judgments and estimates that could have a material effect on the financial statements is provided below.
Economic conditions and uncertainties Current global economic conditions are highly volatile due to the COVID-19 pandemic, which was declared in the last two weeks of fiscal 2020. The magnitude, duration, and severity of the COVID-19 pandemic are hard to predict and could affect the significant estimates and judgments used in the preparation of the consolidated financial statements.
Income Taxes The Company is subject to income taxes in numerous jurisdictions. Significant judgment is required in determining the consolidated provision for income taxes. During the ordinary course of business, there are many transactions and calculations for which the ultimate tax determination is uncertain. The Company recognizes liabilities for anticipated tax audit issues based on estimates of whether additional taxes will be due. Where the final tax outcome of these matters differs from the amounts that were initially recorded, such differences will impact the results for the reporting period and the respective current income tax and deferred income tax provisions in the reporting period in which such determination is made.
Deferred Income Taxes Deferred income tax assets and liabilities are measured using enacted or substantively enacted income tax rates expected to apply to taxable income in the years in which temporary differences are expected to be recovered or settled. As a result, a projection of taxable income is required for those years, as well as an assumption of the ultimate recovery or settlement period for temporary differences. The projection of future taxable income is based on Management’s best estimates and may vary from actual taxable income. Deferred tax assets are reviewed at each reporting date and are reduced to the extent that it is no longer probable that the related tax benefit will be realized. Canadian, US and international tax rules and regulations are subject to interpretation and require judgment on the part of the Company that may be challenged by taxation authorities. The Company believes that it has adequately provided for deferred tax obligations that may result from current facts and circumstances. Temporary differences and income tax rates could change due to fiscal budget changes and/or changes in income tax laws.
Goodwill, Intangible Assets and Business Combinations Goodwill, trademarks and customer relationships have principally arisen as a result of business combinations. The acquisition method, which also requires significant estimates and judgments, is used to account for these business combinations. As part of the allocation process in a business combination, estimated fair values are assigned to the net assets acquired, including trademarks and customer relationships. These estimates are based on forecasts of future cash flows, estimates of economic fluctuations, and an estimated discount rate. The excess of the purchase price over the estimated fair value of the net assets acquired is then assigned to goodwill. In the event that actual net assets fair values are different from estimates, the amounts allocated to the net assets, and specifically to trademarks and customer relationships, could differ from what is currently reported. This would then have a pervasive impact on the carrying value of goodwill. Differences in estimated fair values would also have an impact on the amortization of definite life intangibles.
Property, Plant and Equipment Critical judgment is necessary in the selection and application of depreciation method and useful lives as well as the determination of which components are significant and how they are allocated. Management has determined that the use of the straight-line method of amortization is the most appropriate as its facilities are operating at a similar output potential on a year-to-year basis, which indicates that production is constant. It is Management’s best estimate that the useful lives and policies adopted adequately reflect the pattern in which the assets future economic benefits are expected to be derived.
Impairment of Assets Significant estimates and judgments are required in testing goodwill, intangible assets and other long-lived assets including right-of-use assets, for impairment. Management uses estimates or exercises judgment in assessing indicators of impairment, defining a CGU, forecasting future cash flows and in determining other key assumptions such as discount rates and earnings multipliers used for assessing fair value (less costs of disposal) or value in use. Estimates made for goodwill and intangible assets can be found in Note 9 to the consolidated financial statements. Goodwill is tested for impairment annually as at December 31 and whenever there is an indication of impairment. Other long-lived assets are tested only when indicators of impairment are present.

ANNUAL REPORT 2020
- 30 -
Employee Future Benefits The Company is the sponsor to both defined benefit and defined contribution plans, which provide pension and other post-employment benefits to its employees.
Several estimates and assumptions are required with regards to the determination of the defined benefit expense and its related obligation, such as the discount rate used in determining the carrying value of the obligation and the interest income on plan assets, the duration of the obligation, inflation, the expected health care cost trend rate, the expected mortality rate, expected salary increase, etc. Changes in a number of key assumptions can have a material impact on the calculation of the obligation. Actual results will normally differ from expectations. These gains or losses are presented in the consolidated statements of comprehensive income.
CHANGES IN ACCOUNTING POLICIES
New accounting standards, interpretations and amendments adopted during the year ADOPTION OF IFRS 16, Leases In January 2016, the IASB published a new standard, IFRS 16, Leases, which has replaced IAS 17, Leases. The Company adopted the standard on April 1, 2019. The new standard eliminates the distinction between operating and finance leases and now brings most leases onto the statement of financial position for lessees, except with respect to leases that meet limited exception criteria. For lessors, the accounting remains mostly unchanged and the distinction between operating and finance leases is retained. See Note 3 of the consolidated financial statements for the fiscal year ended March 31, 2020, for more details on the exemptions and practical expedients applied for the adoption of IFRS 16. As permitted in IFRS 16 transition guidance, the Company has not restated comparative figures. As a result of adopting IFRS 16, on April 1, 2019, the Company updated its lease accounting policies and the significant estimates, judgments and assumptions made by Management in Note 3 of the consolidated financial statements for the fiscal year ended March 31, 2020. Please refer to Note 3 to the Company's consolidated financial statements for the fiscal years ended March 31, 2020, and 2019, for more information regarding the effect of other new accounting standards, interpretations and amendments adopted during fiscal 2020. Recent standards, interpretations and amendments not yet implemented Please refer to Note 3 to the Company's consolidated financial statements for the fiscal years ended March 31, 2020, and 2019, for more information regarding the effect of new accounting standards, interpretations and amendments not yet implemented.

ANNUAL REPORT 2020
- 31 -
RISKS AND UNCERTAINTIES
The main risks and uncertainties the Company is exposed to are presented below. The Board of Directors (the Board) delegated to the Audit Committee the responsibility to review, evaluate and discuss with Management and internal audit the risk factors inherent to the Company and ensure that appropriate measures are in place to enable Management to identify and manage these risk factors effectively. Also, the Board delegated to the Corporate Governance and Human Resources Committee the responsibility to oversee the risk management measures related to the human resources risk. The Audit Committee and Corporate Governance and Human Resources Committee receive regular reports from Management on these matters. The Audit Committee and the Board have also adopted and implemented policies and procedures relating to risk assessment and management which are reviewed at least annually. An annual detailed presentation on all risk factors identified, as well as periodic updates, are made by Management to the Audit Committee, the Corporate Governance and Human Resources Committee or to the Board, as the case may be.
While risk management is part of the Company’s transactional, operational and strategic decisions, and overall management approach, risk management does not guarantee that events or circumstances will not occur which could negatively affect the Company’s financial performance and condition.
Product liability Saputo’s operations are subject to certain dangers and risks of liability faced by all food processors, such as the potential contamination of ingredients or products by bacteria or other external agents that may be introduced into products or packaging. The occurrence of such a problem could result in a costly product recall and serious damage to Saputo’s reputation for product quality.
COVID-19 pandemic The COVID-19 pandemic and the related weak economic conditions have had an adverse impact on the Company’s business and are expected to continue to negatively impact the Company’s business and financial performance and condition in a number of ways. This impact will likely be material. The reduced sales in the foodservice and industrial segments that began in the last two weeks of March 2020 are expected to continue to adversely impact the Company. While sales in the retail segment have increased since the pandemic was declared, such increased sales levels may not continue in the longer term and will not offset the reduced sales in the foodservice and industrial segments. Workforce limitations due to illness, quarantines, travel restrictions, and other governmental actions could negatively affect the Company’s operations if a significant number of its employees is unable to work to maintain effective operations. If one or more of the Company’s manufacturing facilities are required to shut down for an extended period, this could disrupt the Company’s production capabilities and have a negative effect on the Company’s results. Increased financial pressure on the Company’s customers has, and may continue to, increase the Company’s credit risk as a result of an increase in trade accounts receivable write-offs. Furthermore, Saputo’s customers and supply chain partners may modify their inventory, fulfillment or shipping practices, which could impact the Company’s production, fulfilment rate and sales, and potentially negatively impact its financial performance. The Company may incur further losses on inventory. The negative impact of the COVID-19 outbreak on the financial markets could adversely affect the availability and cost of capital, preventing the Company from continuing to access preferred sources of liquidity when desired. This could limit Saputo’s ability to fund strategic opportunities or achieve its strategic plans and other initiatives. The increase in the number of employees working remotely has increased demand on information technology resources and systems and increased phishing and other cybersecurity attacks. The implementation of the ERP system upgrade may be further delayed, which could trigger additional costs and hinder the Company’s growth and operational efficiencies. While the Company is actively monitoring the COVID-19 pandemic, its severity, magnitude, duration, and intensity are hard to predict, and so is its impact on the Company’s business and financial performance and condition.

ANNUAL REPORT 2020
- 32 -
Supply of raw materials Saputo purchases raw materials that may represent up to 85% of the cost of products. It processes raw materials into finished edible products intended for resale to a broad range of customers. Availability of raw materials as well as variations in the price of foodstuffs (including as a result of climate change or extreme weather) can impact production costs and capacity utilization and therefore affect the Company’s results. The effect of any increase of foodstuff prices on results depends on the Company’s ability to transfer those increases to its customers and this, in the context of a competitive market. USA and international markets The price of milk as raw material and the price of our products in the USA, Australia, Argentina and the United Kingdom, as well as in international markets, are based on market supply and demand forces. The prices are tied to numerous factors, such as the health of the economy and supply and demand levels for dairy products in the industry. Price fluctuations may affect the Company’s results. The effect of such fluctuations on results will depend on the Company’s ability to implement mechanisms to reduce them. Competition The food processing industry is extremely competitive. The global dairy industry is highly competitive and Saputo competes on a national and international basis with national and multinational competitors. The Company’s performance in all the countries in which it does business will be dependent on its ability to continue to offer quality products at competitive prices. Consolidation of clientele During the last few years, there has been important consolidation in the food industry in all segments. Given that Saputo serves these segments, the consolidation within the industry has resulted in a decrease in the number of customers and an increase in the relative importance of some customers. For fiscal 2020, no customer represented more than 10% of total consolidated revenues. The Company’s ability to continue to service its customers in all the markets that it serves will depend on the quality of its products and services as well as price. Supplier concentration The Company purchases goods and services from a limited number of suppliers as a result of consolidation within the industries in which these suppliers operate. Furthermore, issues with suppliers regarding pricing or performance of the goods and services they supply or the inability of suppliers to supply the required volumes of such goods and services in a timely manner could impact the Company’s financial condition and performance. Any such impact will depend on the effectiveness of the Company’s contingency plan. Unanticipated business disruption Major events, such as systems and equipment failure, health pandemics (including the COVID-19 pandemic) and natural disasters, or increased frequency or intensity of extreme weather conditions (including as a result of climate change), could lead to unanticipated business disruptions at any or certain of the Company’s manufacturing facilities. The effect would be more significant if the Company’s larger manufacturing facilities are affected, in which case, the failure to find alternative suppliers or to replace lost production capacity in a timely manner could negatively affect the Company’s financial performance and condition. Economic environment The Company’s operations could be affected by the economic context should the unemployment level, interest rates, or inflation reach levels that influence consumer trends and consequently impact the Company’s sales and profitability. Environment Saputo’s business and operations are subject to environmental laws and regulations, including those relating to permitting requirements, wastewater discharges, air emissions, greenhouse gases, releases of hazardous substances, and remediation of contaminated sites. The Company believes that its operations are in compliance, in all material respects, with such environmental laws and regulations, except as disclosed in the Annual Information Form dated June 4, 2020, for the fiscal year ended March 31, 2020. Compliance with these laws and regulations requires that the Company continue to incur operating and maintenance costs and capital expenditures, including to control potential impacts of its operations on local communities. Changes in environmental laws and regulations, evolving interpretation thereof or more vigorous regulatory enforcement policies (including as a result of increased concern over climate change, waste management, wastewater discharges, air emissions, greenhouse gases, or release of hazardous substances) could impose additional compliance costs, capital expenditures, as well as other financial obligations, which could have a material adverse effect on the financial position and performance of Saputo. In addition, there is an increased focus on environmental sustainability matters. In that regard, Saputo’s reputation could be affected if the Company or others in the dairy industry do not act, or are perceived not to act, responsibly.

ANNUAL REPORT 2020
- 33 -
Information systems The Company relies upon information technology applications and systems for its business and the reporting of its results. These applications and systems are subject to an increasing number of constantly evolving cyber threats which are becoming more sophisticated. The Company is mainly exposed to risks relating to business disruptions, confidentiality, and data integrity. Therefore, any unavailability or failure, due to security incidents or otherwise, may impede or slow down production, delay or taint certain decisions and result in financial losses for the Company. In addition, any unauthorised access to information systems, proprietary, sensitive or confidential information, or malicious use could compromise the Company’s data integrity or result in disclosure or loss of data which may have adverse effects on the Company’s activities, results, and reputation, including loss of revenues due to a disruption of the business, diminished competitive advantage, litigation or other legal procedures, or liability for failure to comply with privacy and information security laws. Although the Company has measures to reduce the likelihood of disruptions to its information technology applications and systems and to identify, respond to, and manage cybersecurity incidents, there is no assurance that any of these measures will be successful. Also, the Company is currently undertaking technology initiatives regarding an ERP system. There is no guarantee that the implementation of the ERP system will not disrupt or reduce the efficiency of the Company’s operations. Human resources Saputo’s success depends on its ability to identify, attract and retain qualified individuals and to execute appropriate succession planning for Management and key personnel. Although the Company believes that it has good relationships with its employees and a significant number of the Company’s workforce is unionized, a lengthy strike or work stoppage could impact the Company’s operations and performance. The Company’s operations are also subject to health and safety risks as well as laws and regulations in this regard. Notwithstanding Saputo’s existing health and safety systems, serious injury or death of any employee could have a serious impact on Saputo’s reputation and require the Company to incur costs. Growth by acquisitions The Company plans to grow both organically and through acquisitions. Historically, the Company has grown through acquisitions and plans to continue to rely on new acquisitions to pursue its growth. The ability to properly evaluate the fair value of the businesses being acquired and to properly devote the time and human resources required to successfully integrate their activities with those of the Company constitute inherent risks related to acquisitions. The inability to adequately integrate an acquired business in a timely and efficient manner may affect the Company's ability to realize synergies or improvements and to achieve anticipated returns, as well as resulting in higher integration costs and loss of business opportunities. In connection with acquisitions made by the Company, there may also be liabilities and contingencies that the Company discovers after closing, or was unable to quantify in the due diligence conducted prior to closing, and which could have a negative effect on the Company’s business, financial performance and condition. Consumer trends Demand for the Company’s products is subject to changes in consumer trends. These changes may affect earnings. The impact of these changes will depend on the Company’s ability to innovate and develop new products. Intellectual property As the Company is involved in the production, sale and distribution of food products, it relies on brand recognition and loyalty from its clientele in addition to relying on the quality of its products. Also, as innovation forms part of the Company’s growth strategy, its research and development teams develop new technologies, products and process optimization methods. The Company therefore takes measures to protect, maintain and enforce its intellectual property. Any infringement to its intellectual property could damage its value and limit the Company’s ability to compete. In addition, Saputo may have to engage in litigation in order to protect its rights which could result in significant costs. Financial risk exposures Saputo has financial risk exposure to varying degrees relating to the currency of each of the countries where it operates. In fiscal 2020, approximately 27% of sales were realized in Canada, 47% in the USA, 21% internationally, and 5% in the United Kingdom. Cash flows from operations in each of the countries where Saputo operates act, in part, as a natural hedge against the currency exchange risks related to debt denominated in such countries’ currency. The level of the financial risk exposure related to currency fluctuations will depend on the Company’s ability to maintain appropriate protection mechanisms.
ANNUAL REPORT 2020
- 34 -
Pension plans The Company operates both defined benefit and defined contribution plans (collectively, the “Plans”). Contributions to fund the Company's defined benefit Plans are based on actuarial valuations, which themselves are based on assumptions and estimates about the long-term operations of the Plans, including assumptions on inflation, mortality and the discount rates used to determine the liabilities of the Plans. Actual results of actuarial valuations may differ from expectations. The Company cannot predict whether changing markets or economic conditions, changes to pension legislation and regulations or other factors will increase the Company's pension expenses or liabilities or its funding obligations, diverting funds the Company would otherwise apply to other uses. Increases in net pension liabilities or increases in future cash contributions could adversely affect the Company's business, financial condition, results from operations and cash flows. Interest rate and access to capital market A portion of Saputo’s interest-bearing debt is subject to interest rate fluctuations. The impact on the Company’s results will depend on its ability to maintain adequate protections against such interest rate fluctuations. The Company’s growth is driven mainly by acquisitions and is dependent on access to liquidity in the capital markets. Similarly, the Company may be required to access liquidity in the capital markets in order to refinance or retire existing indebtedness. The impact of such financing transactions on the Company’s results will depend on the Company’s ability to secure liquidity in a timely manner and on terms and conditions acceptable to it. Credit risk The Company grants credit to its customers in the normal course of business. Credit valuations are performed on a regular basis and the financial statements take into account an allowance for expected credit loss. The Company considers that it has low exposure to concentration of credit risk with respect to accounts receivable from customers due to its large and diverse customer base operating in three segments, retail, foodservice and industrial, and its geographic diversity. There are no accounts receivable from any individual customer that exceeded 10% of the total balance of accounts receivable as at March 31, 2020. The allowance for expected credit loss and accounts receivable due is reviewed regularly by Management. The Company updates its estimate of the allowance for doubtful accounts based on the evaluation of the recoverability of accounts receivable balances of each customer taking into consideration historic collection trends of past due accounts. Legislative, regulatory, normative and political considerations The Company is subject to local, provincial, state, federal and international laws, regulations, rules and policies as well as to social, economic and political contexts prevailing in places where Saputo conducts its activities. Consequently, the modification or change of any of these elements may have an unfavourable impact on Saputo’s results and operations and may require that important expenses be made in order to adapt or comply. More specifically, the production and distribution of food products are subject to federal, state, provincial and local laws, rules, regulations and policies and to international trade agreements, all of which provide a framework for Saputo’s operations. The impact of new laws and regulations, stricter enforcement or interpretations or changes to enacted laws and regulations will depend on the Company’s ability to adapt thereto, comply therewith, and mitigate. Saputo is currently in compliance in all material respects with all applicable laws and regulations and maintains all material permits and licenses in connection with its operations. Tariff protection Dairy-producing industries in Canada and the USA are still partially protected from imports by tariff-rate quotas which permit a specific volume of imports at a reduced or zero tariff and impose significant tariffs for greater quantities of imports. There is no guarantee that political decisions or amendments to international trade agreements will not result in the removal of tariff protection in the dairy market, resulting in increased competition. The Company’s performance will be dependent on its ability to continue to offer quality products at competitive prices.

ANNUAL REPORT 2020
- 35 -
DISCLOSURE CONTROLS AND PROCEDURES
The Chief Executive Officer (CEO) and the Chief Financial Officer (CFO) are responsible for establishing and maintaining disclosure controls and procedures. The Company’s disclosure controls and procedures are designed to provide reasonable assurance that material information relating to the Company is made known to Management in a timely manner to allow the information required to be disclosed under securities legislation to be recorded, processed, summarized, and reported within the time periods specified in securities legislation.
The CEO and the CFO, along with Management, after evaluating the effectiveness of the Company’s disclosure controls and procedures as at March 31, 2020, have concluded that the Company’s disclosure controls and procedures were effective.
INTERNAL CONTROL OVER FINANCIAL REPORTING
The CEO and the CFO are responsible for establishing and maintaining internal control over financial reporting. The Company’s internal control over financial reporting is designed to provide reasonable assurance regarding the reliability of financial reporting and the preparation of financial statements for external purposes in accordance with IFRS.
The CEO and the CFO, along with Management, evaluated the effectiveness of the Company’s internal control over financial reporting as at March 31, 2020, in accordance with the criteria established in Internal Control – Integrated Framework (2013) issued by the Committee of Sponsoring Organizations of the Treadway Commission (COSO). Based on this evaluation, the CEO and the CFO, along with Management, have concluded that the Company’s internal control over financial reporting was effective.
The Company is taking a phased approach to its migration to a new ERP system, which is currently expected to be completed in fiscal 2023. The appropriate changes to internal controls over financial reporting in relation to divisions which have migrated to the new ERP system have been made to continue to maintain appropriate internal controls over financial reporting. Other than these changes, there were no changes to the Company’s internal control over financial reporting that occurred during the period beginning on January 1, 2020, and ended on March 31, 2020, that have materially affected or are reasonably likely to materially affect the Company’s internal control over financial reporting.
SENSITIVITY ANALYSIS OF INTEREST RATE AND US CURRENCY FLUCTUATIONS
The debt subject to interest rate fluctuations was $2.421 billion as at March 31, 2020. A 1% change in the interest rate would lead to a change in net earnings of approximately $17.7 million. Canadian and US currency fluctuations may affect net earnings, adjusted EBITDA, and revenues. Appreciation of the Canadian dollar compared to the US dollar would have a negative impact on net earnings, adjusted EBITDA and revenues. Conversely, a decrease in the Canadian dollar compared to the US dollar would have a positive impact on net earnings. During the fiscal year ended March 31, 2020, the average US dollar conversion was based on US$1.00 for $1.3264. A fluctuation of $0.10 of the Canadian dollar would have resulted in a change of approximately $18.5 million in net earnings, $46.4 million in adjusted EBITDA, and $533.4 million in revenues.

ANNUAL REPORT 2020
- 36 -
QUARTERLY FINANCIAL INFORMATION
2020 quarterly financial information – consolidated income statement (in millions of CDN dollars, except per share amounts and ratios)
Q4 Q3 Q2 Q1 Fiscal 2020
Revenues 3,718.7 3,890.8 3,665.6 3,668.4 14,943.5
Operating costs excluding depreciation and amortization 3,420.3 3,473.8 3,271.2 3,310.4 13,475.7
Adjusted EBITDA* 298.4 417.0 394.4 358.0 1,467.8 Margin* 8.0 % 10.7 % 10.8 % 9.8 % 9.8 %
Depreciation and amortization 127.8 121.8 108.8 108.8 467.2 Inventory revaluation resulting from a business acquisition - - 12.9 27.2 40.1 Acquisition and restructuring costs 13.8 9.4 0.4 22.4 46.0 Gain on hyperinflation (10.9) (7.3) (1.5) (8.1) (27.8) Interest on long-term debt 21.8 22.8 26.7 24.3 95.6 Other financial charges 14.5 11.3 9.3 12.3 47.4
Earnings before income taxes 131.4 259.0 237.8 171.1 799.3 Income taxes 42.7 61.2 62.9 49.7 216.5
Net earnings 88.7 197.8 174.9 121.4 582.8 Margin 2.4 % 5.1 % 4.8 % 3.3 % 3.9 % Inventory revaluation resulting from a business
acquisition1 - - 10.5 22.0 32.5 Acquisition and restructuring costs1 10.1 6.4 0.4 21.5 38.4
Adjusted net earnings* 98.8 204.2 185.8 164.9 653.7 Margin* 2.7 % 5.2 % 5.1 % 4.5 % 4.4 %
Adjusted net earnings excluding amortization of intangible assets related to business acquisitions* 116.5 229.1 198.3 179.7 723.6
Margin* 3.1 % 5.9 % 5.4 % 4.9 % 4.8 %
Per Share
Net earnings Basic 0.22 0.49 0.44 0.31 1.46 Diluted 0.22 0.48 0.44 0.31 1.45
Adjusted net earnings*
Basic 0.24 0.50 0.47 0.42 1.63 Diluted 0.24 0.50 0.47 0.42 1.62
Adjusted net earnings excluding amortization of
intangible assets related to business acquisitions* Basic 0.29 0.56 0.50 0.46 1.81 Diluted 0.28 0.56 0.50 0.46 1.80
Earnings coverage ratio** 6.59 7.53 9.77 10.76
* Non-IFRS measures are described in the ‘‘Glossary’’ section on page 42 of this Management’s Discussion and Analysis.
** Refer to the ‘‘Glossary’’ section on page 42 of this Management’s Discussion and Analysis. 1 Net of income taxes.
Selected factors positively (negatively) affecting financial performance (in millions of CDN dollars)
Fiscal year 2020 Q4 Q3 Q2 Q1
USA Market Factors*,1 (8) 14 10 (8)
Inventory write-down (18) - - -
Foreign currency exchange1,2 (3) (15) (14) (4)
* Refer to the ‘‘Glossary’’ section on page 42 of this Management’s Discussion and Analysis. 1 As compared to same quarter last fiscal year. 2 Foreign currency exchange includes effect on adjusted EBITDA of conversion of US dollars, Australian dollars, British pounds sterling and Argentine
pesos to Canadian dollars.
.

ANNUAL REPORT 2020
- 37 -
2019 quarterly financial information – consolidated income statement (in millions of CDN dollars, except per share amounts and ratios)
Q4 Q3 Q2 Q1 Fiscal 2019
Revenues 3,236.5 3,577.2 3,420.4 3,267.8 13,501.9
Operating costs excluding depreciation and amortization 2,961.4 3,256.0 3,102.9 2,960.3 12,280.6
Adjusted EBITDA* 275.1 321.2 317.5 307.5 1,221.3 Margin* 8.5 % 9.0 % 9.3 % 9.4 % 9.0 %
Depreciation and amortization 81.1 80.7 77.0 74.2 313.0 Gain on disposal of assets - (194.5) - - (194.5) Acquisition and restructuring costs 2.2 0.3 - 48.9 51.4 (Gain) loss on hyperinflation 0.9 (18.4) (1.0) - (18.5) Interest on long-term debt 16.7 16.4 18.4 15.1 66.6 Other financial charges 4.8 4.7 4.0 4.2 17.7
Earnings before income taxes 169.4 432.0 219.1 165.1 985.6 Income taxes 45.2 90.0 56.0 39.1 230.3
Net earnings 124.2 342.0 163.1 126.0 755.3 Margin 3.8 % 9.6 % 4.8 % 3.9 % 5.6 % Gain on disposal of assets1 - (167.8) - - (167.8) Acquisition and restructuring costs1 1.6 0.2 - 34.3 36.1
Adjusted net earnings* 125.8 174.4 163.1 160.3 623.6 Margin* 3.9 % 4.9 % 4.8 % 4.9 % 4.6 %
Adjusted net earnings excluding amortization of intangible assets related to business acquisitions* 133.8 182.3 170.9 168.1 655.1
Margin* 4.1 % 5.1 % 5.0 % 5.1 % 4.9 %
Per Share
Net earnings Basic 0.32 0.88 0.42 0.32 1.94 Diluted 0.32 0.87 0.42 0.32 1.93
Adjusted net earnings*
Basic 0.32 0.45 0.42 0.41 1.60 Diluted 0.32 0.44 0.42 0.41 1.59
Adjusted net earnings excluding amortization of
intangible assets related to business acquisitions* Basic 0.34 0.47 0.44 0.43 1.69 Diluted 0.34 0.47 0.44 0.43 1.67
Earnings coverage ratio** 12.69 14.20 12.57 15.37
* Non-IFRS measures are described in the ‘‘Glossary’’ section on page 42 of this Management’s Discussion and Analysis.
** Refer to the ‘‘Glossary’’ section on page 42 of this Management’s Discussion and Analysis. 1 Net of income taxes.

ANNUAL REPORT 2020
- 38 -
ANALYSIS OF EARNINGS FOR THE YEAR ENDED MARCH 31, 2019, COMPARED TO MARCH 31, 2018
Consolidated revenues totalled $13.502 billion in fiscal 2019, an increase of approximately $1.959 billion or 17.0% in comparison to $11.543 billion in fiscal 2018. Higher sales volumes, mainly due to recent acquisitions, increased revenues as compared to fiscal 2018. Revenues were negatively impacted by lower international selling prices of cheese and dairy ingredients. Also, a lower average block market per pound of cheese and a lower average butter market per pound decreased revenues by approximately $53 million. Finally, the fluctuation of the Canadian dollar versus foreign currencies decreased revenues by approximately $181 million, mainly due to the devaluation of the Argentine peso.
Consolidated adjusted EBITDA* in fiscal 2019 totalled $1.221 billion, a decrease of approximately $44 million or 3.5%, as compared to $1.265 billion in fiscal 2018. Higher warehousing and logistical costs of approximately $91 million related to additional external storage expenses and higher transportation costs negatively impacted adjusted EBITDA. During fiscal 2019, adjusted EBITDA was also negatively impacted by competitive market conditions and increased operational costs relative to the integration of operations in the recently built facility in Almena, Wisconsin. Furthermore, the combined effects of USA Market Factors and lower international selling prices of cheese and dairy ingredients decreased adjusted EBITDA by approximately $33 million as compared to fiscal 2018. These decreases were partially offset by the favourable impact of adjusted EBITDA generated from recent acquisitions, as well as the fluctuation of the Argentine peso and the Australian dollar versus the US dollar in export markets. Higher sales volumes and a favourable product mix positively impacted adjusted EBITDA. As a result of the decrease in certain market selling prices, inventory was written down by approximately $3 million as compared to approximately $17 million for fiscal 2018. Lastly, the fluctuation of the Canadian dollar versus foreign currencies had an unfavourable impact on adjusted EBITDA of approximately $5 million as compared to fiscal 2018.
The consolidated adjusted EBITDA margin decreased to 9.0% in fiscal 2019, as compared to 11.0% in fiscal 2018, reflecting lower adjusted EBITDA margins in the USA Sector and Canada Sector as compared to fiscal 2018.
Depreciation and amortization in fiscal 2019 amounted to $313.0 million, an increase of $86.7 million, as compared to $226.3 million for fiscal 2018.
These increases were mainly attributed to additional depreciation and amortization expenses related to recent acquisitions, additions to property, plant and equipment, and intangibles related to the ERP initiative, which increased the depreciable base, and trademarks for which amortization started in fiscal 2019.
In fiscal 2019, the Company realized a gain on disposal of assets of $194.5 million ($167.8 million after tax) relating to the sale of its facility in Burnaby, British Columbia. The Company sold the facility for $209.0 million, of which $50.0 million will be received in fiscal 2022. As part of its capital expenditure plan, the Company is building a new state- of-the-art facility, in Port Coquitlam, British Columbia, to better serve the market in Western Canada. The Company has entered into a lease agreement for the Burnaby facility until the construction of the new facility is completed, which is expected to be in fiscal 2021.
Acquisition costs and restructuring costs amounted to $51.4 million for fiscal 2019. Acquisition costs were related to the Murray Goulburn Acquisition, including approximately $39 million in stamp duty taxes, as well as to the Dairy Crest Acquisition, the Shepherd Gourmet Acquisition and the F&A Acquisition. Also, restructuring costs were related to the plant closure in Courtenay, British Columbia.
In accordance with IAS 29, Financial Reporting in Hyperinflationary Economies, Argentina is considered a hyperinflationary economy since July 1, 2018. In fiscal 2019, the gain on hyperinflation totalled $18.5 million. The gain was derived from the indexation of non-monetary assets and liabilities.
Net interest expense for fiscal 2019 increased by $36.4 million, as compared to last fiscal year. These increases were mainly attributed to additional debt related to the Murray Goulburn Acquisition and higher interest rates on debt denominated in Argentine pesos.
* Non-IFRS measures are described in the ‘‘Glossary’’ section on page 42 of this Management’s Discussion and Analysis.

ANNUAL REPORT 2020
- 39 -
Income taxes totalled $230.3 million in fiscal 2019, compared to $97.4 million in fiscal 2018, reflecting an effective tax rate of 23.4% compared to 10.3% in fiscal 2018. Excluding the USA tax reform benefit, income tax expense in fiscal 2018 would have totalled $276.3 million, reflecting an income tax rate of 29.1%. This decrease of the effective rate by 5.7% was mainly due to the reduction of the US federal tax rate and the fact that a portion of the gain realized on disposition of assets during the third quarter of fiscal 2019 was not taxable. The income tax rate varies and could increase or decrease based on the amount and source of taxable income, amendments to tax legislations and income tax rates, changes in assumptions, as well as estimates used to determine income tax assets and liabilities by the Company and its affiliates.
Net earnings for fiscal 2019 totalled $755.3 million, a decrease of $97.2 million or 11.4%, as compared to $852.5 million in fiscal 2018. The decrease in net earnings was due to the above-mentioned factors.
Adjusted net earnings* totalled $623.6 million in fiscal 2019, a decrease of $80.6 million or 11.4%, as compared to $704.2 million in fiscal 2018. Adjusted net earnings excluding amortization of intangible assets related to business acquisitions* totalled $655.1 million in fiscal 2019, a decrease of $61.3 million or 8.6%, as compared to $716.4 million in fiscal 2018. These decreases were due to the above-mentioned factors.
* Non-IFRS measures are described in the ‘‘Glossary’’ section on page 42 of this Management’s Discussion and Analysis.

ANNUAL REPORT 2020
- 40 -
MEASUREMENT OF RESULTS NOT IN ACCORDANCE WITH INTERNATIONAL FINANCIAL REPORTING STANDARDS
In certain instances, the Company makes references to terms in evaluating financial performance measures, such as adjusted EBITDA, adjusted net earnings, adjusted net earnings excluding amortization of intangible assets related to business acquisitions, adjusted net earnings per share and adjusted net earnings per share excluding amortization of intangible assets related to business acquisitions that hold no standardized meaning under IFRS. These non-IFRS measurements are therefore not likely to be comparable to similarly titled or described measures in use by other publicly traded companies nor do they indicate that excluded items are non-recurring.
The Company uses adjusted EBITDA as a performance measure as it is a common industry measure and reflects the ongoing profitability of the Company’s consolidated business operations. The Company also uses adjusted net earnings, adjusted net earnings excluding amortization of intangible assets related to business acquisitions, adjusted net earnings per share and adjusted net earnings per share excluding amortization of intangible assets related to business acquisitions. Management believes that in the context of highly acquisitive companies, adjusted net earnings per share and adjusted net earnings excluding amortization of intangible assets related to business acquisitions per share (due to the application of various accounting policies in relation to the allocation of purchase price to goodwill and intangible assets) are more effective measures to assess performance against its peer group. These non-IFRS measures are defined in the ‘‘Glossary’’ section. The most comparable IFRS financial measures to the ones used by the Company are earnings before income taxes, as well as net earnings and net earnings per share (basic and diluted).
Adjusted EBITDA, adjusted net earnings, adjusted net earnings excluding amortization of intangible assets related to business acquisitions, adjusted net earnings per share, and adjusted net earnings per share excluding amortization of intangible assets related to business acquisitions, as used by Management, provide precision with regards to the Company’s ongoing operation. They also provide readers with a representation of the activities considered of relevance to the Company’s financial performance and additional financial information that can be used to identify trends or additional disclosures about the way the Company operates. They also provide comparability to the Company’s prior year results.
The definitions of the non-IFRS measures used by the Company are used in the context of the results and activities for the three-month period and for the year ended March 31, 2020. They are subject to change based on future transactions and as deemed necessary by Management in order to provide a better understanding and comparability of future results and activities of the Company.
A reconciliation of earnings before income taxes, net earnings and net earnings per share to adjusted EBITDA, adjusted net earnings, adjusted net earnings excluding amortization of intangible assets related to business acquisitions, adjusted net earnings per share and adjusted net earnings per share excluding amortization of intangible assets related to business acquisitions for the three-month periods and the fiscal years in which Management has presented these measures is provided below.
(in millions of CDN dollars)
For the three-month periods ended
March 31
For the years ended
March 31
2020 2019 2020 2019
Earnings before income taxes 131.4 169.4 799.3 985.6
Other financial charges 14.5 4.8 47.4 17.7
Interest on long-term debt 21.8 16.7 95.6 66.6
Gain on hyperinflation (10.9) 0.9 (27.8) (18.5)
Inventory revaluation resulting from a business acquisition - - 40.1 -
Acquisition and restructuring costs 13.8 2.2 46.0 51.4
Gain on disposal of assets - - - (194.5)
Depreciation and amortization 127.8 81.1 467.2 313.0
Adjusted EBITDA 298.4 275.1 1,467.8 1,221.3

ANNUAL REPORT 2020
- 41 -
(in millions of CDN dollars, except per share amounts)
For the three-month periods ended March 31
2020 2019
Per Share Per Share
Total Basic Diluted Total Basic Diluted
Net earnings 88.7 0.22 0.22 124.2 0.32 0.32
Acquisition and restructuring costs1 10.1 0.02 0.02 1.6 - -
Adjusted net earnings 98.8 0.24 0.24 125.8 0.32 0.32
Amortization of intangible assets related to business acquisitions1 17.7 0.04 0.04 8.0 0.02 0.02
Adjusted net earnings excluding amortization of intangible assets related to business acquisitions* 116.5 0.29 0.28 133.8 0.34 0.34
1 Net of income taxes
(in millions of CDN dollars, except per share amounts)
For the years ended March 31
2020 2019
Per Share Per Share
Total Basic Diluted Total Basic Diluted
Net earnings 582.8 1.46 1.45 755.3 1.94 1.93
Gain on disposal of assets1 - - - (167.8) (0.43) (0.43)
Inventory revaluation resulting from a business acquisition1 32.5 0.08 0.08 - - -
Acquisition and restructuring costs1 38.4 0.10 0.10 36.1 0.09 0.09
Adjusted net earnings 653.7 1.63 1.62 623.6 1.60 1.59
Amortization of intangible assets related to business acquisitions1 69.9 0.17 0.17 31.5 0.08 0.08
Adjusted net earnings excluding amortization of intangible assets related to business acquisitions* 723.6 1.81 1.80 655.1 1.69 1.67
1 Net of income taxes
* Non-IFRS measures are described in the ‘‘Glossary’’ section on page 42 of this Management’s Discussion and Analysis.

ANNUAL REPORT 2020
- 42 -
GLOSSARY
Adjusted EBITDA "Adjusted EBITDA" means earnings before interest, income taxes, depreciation, amortization, gain on disposal of assets, inventory revaluation resulting from a business acquisition, acquisition and restructuring costs, and gain on hyperinflation.
Adjusted EBITDA margin "Adjusted EBITDA margin" means adjusted EBITDA expressed as a percentage of revenues.
Adjusted net earnings "Adjusted net earnings" means net earnings prior to the inclusion of inventory revaluation resulting from a business acquisition, and acquisition and restructuring costs, net of applicable income taxes.
Adjusted net earnings excluding amortization of intangible assets related to business acquisitions "Adjusted net earnings excluding amortization of intangible assets related to business acquisitions" means adjusted net earnings prior to the inclusion of amortization of intangible assets related to business acquisitions, net of applicable income taxes.
Adjusted net earnings margin "Adjusted net earnings margin" means adjusted net earnings expressed as a percentage of revenues.
Adjusted net earnings margin excluding amortization of intangible assets related to business acquisitions "Adjusted net earnings margin excluding amortization of intangible assets related to business acquisitions" means adjusted net earnings excluding amortization of intangible assets related to business acquisitions expressed as a percentage of revenues.
Adjusted net earnings per share "Adjusted net earnings per share" (basic and diluted) means adjusted net earnings per basic and diluted common share.
Adjusted net earnings per share excluding amortization of intangible assets related to business acquisitions "Adjusted net earnings per share excluding amortization of intangible assets related to business acquisitions" (basic and diluted) means adjusted net earnings per basic and diluted common share prior to the inclusion of amortization of intangible assets related to business acquisitions, net of applicable income taxes.
Adjusted return on average equity "Adjusted return on average equity" means adjusted net earnings divided by average total equity, not considering the effect of annual fluctuations in foreign currency translation.
Average whey powder market price "Average whey powder market price" means the average daily price for extra grade dry whey published on Dairy Market News.
Block market "Block market" means the price of a 40-pound block of cheddar traded on the Chicago Mercantile Exchange (CME), used as the base price for cheese.
Butter market "Butter market" means the price for Grade AA Butter traded on the CME, used as the base price for butter.
Earnings coverage ratio "Earnings coverage ratio" means net earnings (before interest on long-term debt and other financial charges and income taxes) for the applicable period divided by interest on long-term debt and other financial charges for the applicable period of the fiscal year.
EPS "EPS" means net earnings per share.
Net debt "Net debt" means long-term debt, lease liabilities, and bank loans, including the current portion thereof, net of cash and cash equivalents.
Net debt to adjusted EBITDA "Net debt to adjusted EBITDA" means net debt divided by adjusted EBITDA for the fiscal year.

ANNUAL REPORT 2020
- 43 -
Spread "Spread" means the average block market per pound of cheese less the result of the average cost per hundredweight of Class III milk price in the USA market.
USA Market Factors "USA Market Factors" include, for the USA Sector, the average block market per pound of cheese and its effect on the absorption of fixed costs and on the realization of inventories, the effect of the relationship between the average block market per pound of cheese and the cost of milk as raw material, the market pricing impact related to sales of dairy ingredients, as well as the impact of the average butter market per pound related to dairy food products.
Working capital "Working capital" means the Company’s current assets minus its current liabilities.
Working capital ratio "Working capital ratio" means the Company’s current assets divided by its current liabilities.

ANNUAL REPORT 2020
- 44 -
CONSOLIDATED FINANCIAL STATEMENTS
MANAGEMENT’S STATEMENT OF RESPONSIBILITY FOR FINANCIAL REPORTING
Management is responsible for the preparation and presentation of the consolidated financial statements and the financial information presented in this annual report. This responsibility includes the selection of accounting policies and practices and making judgments and estimates necessary to prepare the consolidated financial statements in accordance with International Financial Reporting Standards.
Management has also prepared the financial information presented elsewhere in this annual report and has ensured that it is consistent with the consolidated financial statements.
Management maintains systems of internal control designed to provide reasonable assurance that assets are safeguarded and that relevant and reliable financial information is being produced.
The Board of Directors is responsible for ensuring that Management fulfills its responsibilities for financial reporting and is responsible for reviewing and approving the consolidated financial statements. The Board of Directors carries out this responsibility principally through its Audit Committee, which is comprised solely of independent directors. The Audit Committee meets periodically with Management and the independent auditors to discuss internal controls, auditing matters and financial reporting issues. It also reviews the annual report, the consolidated financial statements and the independent auditors’ report. The Audit Committee recommends the independent auditors for appointment by the shareholders. The independent auditors have unrestricted access to the Audit Committee. The consolidated financial statements have been audited by the independent auditors Deloitte LLP, whose report follows.
(signed) Lino Saputo, Jr. (signed) Maxime Therrien Lino Saputo, Jr. Maxime Therrien, CPA, CA Chair of the Board Chief Financial Officer and Chief Executive Officer and Secretary
June 4, 2020

ANNUAL REPORT 2020
- 45 -
INDEPENDENT AUDITOR’S REPORT
To the shareholders and the Board of Directors of Saputo Inc.
Opinion
We have audited the consolidated financial statements of Saputo Inc. (the “Company”), which comprise the consolidated statements of financial position as at March 31, 2020 and 2019, and the consolidated income statements, consolidated statements of comprehensive income, changes in equity and cash flows for the years then ended, and notes to the consolidated financial statements, including a summary of significant accounting policies (collectively referred to as the “financial statements”).
In our opinion, the accompanying financial statements present fairly, in all material respects, the financial position of the Company as at March 31, 2020 and 2019, and its financial performance and its cash flows for the years then ended in accordance with International Financial Reporting Standards (“IFRS”).
Basis for Opinion
We conducted our audit in accordance with Canadian generally accepted auditing standards (“Canadian GAAS”). Our responsibilities under those standards are further described in the Auditor’s Responsibilities for the Audit of the Financial Statements section of our report. We are independent of the Company in accordance with the ethical requirements that are relevant to our audit of the financial statements in Canada, and we have fulfilled our other ethical responsibilities in accordance with these requirements. We believe that the audit evidence we have obtained is sufficient and appropriate to provide a basis for our opinion.
Other Information
Management is responsible for the other information. The other information comprises:
Management’s Discussion and Analysis
The information, other than the financial statements and our auditor’s report thereon, in the Annual Report.
Our opinion on the financial statements does not cover the other information and we do not and will not express any form of assurance conclusion thereon. In connection with our audit of the financial statements, our responsibility is to read the other information identified above and, in doing so, consider whether the other information is materially inconsistent with the financial statements or our knowledge obtained in the audit, or otherwise appears to be materially misstated.
We obtained Management’s Discussion and Analysis and the Annual Report prior to the date of this auditor’s report. If, based on the work we have performed on this other information, we conclude that there is a material misstatement of this other information, we are required to report that fact in this auditor’s report. We have nothing to report in this regard.
Responsibilities of Management and Those Charged with Governance for the Financial Statements
Management is responsible for the preparation and fair presentation of the financial statements in accordance with IFRS, and for such internal control as management determines is necessary to enable the preparation of financial statements that are free from material misstatement, whether due to fraud or error.
In preparing the financial statements, management is responsible for assessing the Company’s ability to continue as a going concern, disclosing, as applicable, matters related to going concern and using the going concern basis of accounting unless management either intends to liquidate the Company or to cease operations, or has no realistic alternative but to do so.
Those charged with governance are responsible for overseeing the Company’s financial reporting process.
Auditor’s Responsibilities for the Audit of the Financial Statements
Our objectives are to obtain reasonable assurance about whether the financial statements as a whole are free from material misstatement, whether due to fraud or error, and to issue an auditor’s report that includes our opinion. Reasonable assurance is a high level of assurance, but is not a guarantee that an audit conducted in accordance with Canadian GAAS will always detect a material misstatement when it exists. Misstatements can arise from fraud or error and are considered material if, individually or in the aggregate, they could reasonably be expected to influence the economic decisions of users taken on the basis of these financial statements.

ANNUAL REPORT 2020
- 46 -
As part of an audit in accordance with Canadian GAAS, we exercise professional judgment and maintain professional skepticism throughout the audit. We also:
Identify and assess the risks of material misstatement of the financial statements, whether due to fraud or error, design and perform audit procedures responsive to those risks, and obtain audit evidence that is sufficient and appropriate to provide a basis for our opinion. The risk of not detecting a material misstatement resulting from fraud is higher than for one resulting from error, as fraud may involve collusion, forgery, intentional omissions, misrepresentations, or the override of internal control.
Obtain an understanding of internal control relevant to the audit in order to design audit procedures that are appropriate in the circumstances, but not for the purpose of expressing an opinion on the effectiveness of the Company’s internal control.
Evaluate the appropriateness of accounting policies used and the reasonableness of accounting estimates and related disclosures made by management.
Conclude on the appropriateness of management’s use of the going concern basis of accounting and, based on the audit evidence obtained, whether a material uncertainty exists related to events or conditions that may cast significant doubt on the Company’s ability to continue as a going concern. If we conclude that a material uncertainty exists, we are required to draw attention in our auditor’s report to the related disclosures in the financial statements or, if such disclosures are inadequate, to modify our opinion. Our conclusions are based on the audit evidence obtained up to the date of our auditor’s report. However, future events or conditions may cause the Company to cease to continue as a going concern.
Evaluate the overall presentation, structure and content of the financial statements, including the disclosures, and whether the financial statements represent the underlying transactions and events in a manner that achieves fair presentation.
Obtain sufficient appropriate audit evidence regarding the financial information of the entities or business activities within the Company to express an opinion on the financial statements. We are responsible for the direction, supervision and performance of the group audit. We remain solely responsible for our audit opinion.
We communicate with those charged with governance regarding, among other matters, the planned scope and timing of the audit and significant audit findings, including any significant deficiencies in internal control that we identify during our audit. We also provide those charged with governance with a statement that we have complied with relevant ethical requirements regarding independence, and to communicate with them all relationships and other matters that may reasonably be thought to bear on our independence, and where applicable, related safeguards.
The engagement partner on the audit resulting in this independent auditor’s report is Daniel Viboux.
/s/ Deloitte LLP 1
June 4, 2020
Montréal, Québec
____________________
1 CPA auditor, CA, public accountancy permit No. A114871

ANNUAL REPORT 2020
- 47 -
CONSOLIDATED INCOME STATEMENTS
(in millions of CDN dollars, except per share amounts)
Years ended March 31 2020 2019
Revenues (Note 4) $ 14,943.5 $ 13,501.9
Operating costs excluding depreciation and amortization (Note 6) 13,475.7 12,280.6
Earnings before interest, income taxes, depreciation, amortization, gain on disposal of assets, inventory revaluation resulting from a business acquisition, acquisition and restructuring costs, and gain on hyperinflation 1,467.8 1,221.3
Depreciation and amortization 467.2 313.0
Gain on disposal of assets - (194.5)
Inventory revaluation resulting from a business acquisition (Note 18) 40.1 -
Acquisition and restructuring costs (Note 24) 46.0 51.4
Gain on hyperinflation (27.8) (18.5)
Interest on long-term debt 95.6 66.6
Other financial charges (Note 15) 47.4 17.7
Earnings before income taxes 799.3 985.6
Income taxes (Note 16) 216.5 230.3
Net earnings $ 582.8 $ 755.3
Net earnings per share (Note 17)
Basic $ 1.46 $ 1.94
Diluted $ 1.45 $ 1.93
The accompanying notes are an integral part of these consolidated financial statements.
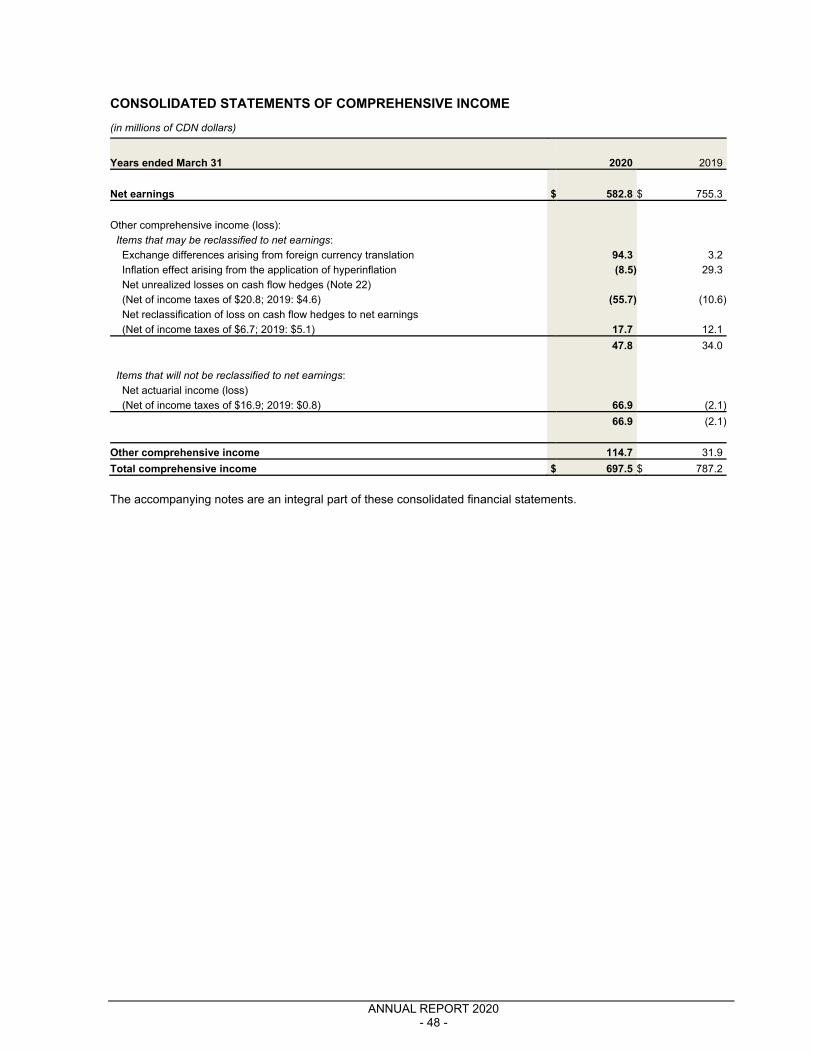
ANNUAL REPORT 2020
- 48 -
CONSOLIDATED STATEMENTS OF COMPREHENSIVE INCOME
(in millions of CDN dollars)
Years ended March 31 2020 2019
Net earnings $ 582.8 $ 755.3
Other comprehensive income (loss):
Items that may be reclassified to net earnings:
Exchange differences arising from foreign currency translation 94.3 3.2
Inflation effect arising from the application of hyperinflation (8.5) 29.3
Net unrealized losses on cash flow hedges (Note 22)
(Net of income taxes of $20.8; 2019: $4.6) (55.7) (10.6)
Net reclassification of loss on cash flow hedges to net earnings
(Net of income taxes of $6.7; 2019: $5.1) 17.7 12.1
47.8 34.0
Items that will not be reclassified to net earnings:
Net actuarial income (loss)
(Net of income taxes of $16.9; 2019: $0.8) 66.9 (2.1)
66.9 (2.1)
Other comprehensive income 114.7 31.9
Total comprehensive income $ 697.5 $ 787.2
The accompanying notes are an integral part of these consolidated financial statements.

ANNUAL REPORT 2020
- 49 -
CONSOLIDATED STATEMENTS OF CHANGES IN EQUITY
(in millions of CDN dollars, except common shares)
For the year ended March 31, 2020
Share capital Reserves
Common Shares
Amount Foreign
Currency Translation
Cash Flow
Hedges
Stock Option Plan
Total
Reserves
Retained Earnings
Total
Equity
Balance, beginning of year 390,198,386 $ 991.7 $ 582.1 $ (2.3) $ 134.0 $ 713.8 $ 3,715.0 $ 5,420.5
Net earnings - - - - - - 582.8 582.8
Other comprehensive income - - 85.8 (38.0) - 47.8 66.9 114.7
Total comprehensive income 697.5
Shares issued under Equity Offering – net of issuance costs (Note 14) 16,642,553 639.9 - - - - - 639.9
Dividends declared (Note 14) - - - - - - (269.7) (269.7)
Stock option plan (Note 14) - - - - 23.7 23.7 - 23.7
Shares issued under stock option plan 1,797,434 45.0 - - - - - 45.0
Amount transferred from reserves to share capital upon exercise of options - 9.1 - - (9.1) (9.1) - -
Excess tax benefit that results from the excess of the deductible amount over the compensation cost recognized - - - - 2.2 2.2 - 2.2
Balance, end of period 408,638,373 $ 1,685.7 $ 667.9 $ (40.3) $ 150.8 $ 778.4 $ 4,095.0 $ 6,559.1
For the year ended March 31, 2019
Share capital Reserves
Common Shares
Amount Foreign
Currency Translation
Cash
Flow Hedges
Stock Option Plan
Total
Reserves
Retained Earnings
Total
Equity
Balance, beginning of year 387,407,403 $ 918.9 $ 549.6 $ (3.8) $ 116.6 $ 662.4 $ 3,216.4 $ 4,797.7
Net earnings - - - - - - 755.3 755.3
Other comprehensive income - - 32.5 1.5 - 34.0 (2.1) 31.9
Total comprehensive income 787.2
Dividends declared (Note 14) - - - - - - (254.6) (254.6)
Stock option plan (Note 14) - - - - 25.1 25.1 - 25.1
Shares issued under stock option plan 2,790,983 60.4 - - - - - 60.4
Amount transferred from reserves to share capital upon exercise of options - 12.4 - - (12.4) (12.4) - -
Excess tax benefit that results from the excess of the deductible amount over the compensation cost recognized - - - - 4.7 4.7 - 4.7
Balance, end of year 390,198,386 $ 991.7 $ 582.1 $ (2.3) $ 134.0 $ 713.8 $ 3,715.0 $ 5,420.5
The accompanying notes are an integral part of these consolidated financial statements.

ANNUAL REPORT 2020
- 50 -
CONSOLIDATED STATEMENTS OF FINANCIAL POSITION
(in millions of CDN dollars)
As at March 31, 2020 March 31, 2019
ASSETS Current assets
Cash and cash equivalents $ 319.4 $ 112.7 Receivables 1,371.8 1,248.2 Inventories (Note 5) 2,220.9 1,681.0 Income taxes receivable (Note 16) 50.3 34.1 Prepaid expenses and other assets 106.6 57.8
4,069.0 3,133.8 Property, plant and equipment (Note 7) 3,850.0 3,095.4 Right-of-use assets (Note 8) 417.9 - Goodwill (Note 9) 3,219.5 2,597.6 Intangible assets (Note 9) 1,640.7 876.2 Other assets (Note 10) 545.3 131.6 Deferred income taxes (Note 16) 50.7 51.0
Total assets $ 13,793.1 $ 9,885.6
LIABILITIES Current liabilities
Bank loans (Note 11) $ 528.5 $ 130.4 Accounts payable and accrued liabilities 1,838.9 1,442.2 Income taxes payable (Note 16) 51.4 36.5 Current portion of long-term debt (Note 12) - 323.4 Current portion of lease liabilities (Note 8) 74.7 -
2,493.5 1,932.5 Long-term debt (Note 12) 3,542.3 1,943.9 Lease liabilities (Note 8) 340.1 -
Other liabilities (Note 13) 98.5 86.4 Deferred income taxes (Note 16) 759.6 502.3
Total liabilities $ 7,234.0 $ 4,465.1
EQUITY
Share capital (Note 14) 1,685.7 991.7 Reserves 778.4 713.8 Retained earnings 4,095.0 3,715.0
Total equity $ 6,559.1 $ 5,420.5
Total liabilities and equity $ 13,793.1 $ 9,885.6 The accompanying notes are an integral part of these consolidated financial statements. On behalf of the Board, (signed) Lino Saputo, Jr. (signed) Tony Meti Lino Saputo, Jr. Tony Meti Chair of the Board Director and Chief Executive Officer

ANNUAL REPORT 2020
- 51 -
CONSOLIDATED STATEMENTS OF CASH FLOWS
(in millions of CDN dollars)
Years ended March 31 2020
2019
Cash flows related to the following activities:
Operating Net earnings $ 582.8 $ 755.3 Adjustments for:
Stock-based compensation 33.5 41.0 Interest and other financial charges 143.0 84.3 Income tax expense 216.5 230.3 Depreciation and amortization 467.2 313.0 Gain on disposal of property, plant and equipment and asset held for sale (2.0) (195.1) Impairment charges related to plant closure 12.9 0.2 Inventory revaluation resulting from a business acquisition 40.1 - Foreign exchange gain on debt (47.2) (16.0) Share of joint venture earnings, net of dividends received 11.5 1.0 Gain on hyperinflation (27.8) (18.5) Difference between funding of employee plans and costs (8.3) 0.3
Changes in non-cash operating working capital items (106.7) (83.2)
Cash generated from operating activities 1,315.5 1,112.6 Interest and other financial charges paid (139.0) (83.1) Income taxes paid (139.6) (145.0)
Net cash generated from operating activities $ 1,036.9 $ 884.5
Investing
Business acquisitions, net of cash acquired (1,929.6) (1,471.7) Proceeds on divestiture - 239.7 Additions to property, plant and equipment (509.9) (370.5) Additions to intangible assets (66.4) (65.5) Proceeds from disposal of asset held for sale - 157.3 Proceeds from disposal of property, plant and equipment 11.0 4.5 Other - (0.4)
Net cash used for investing activities $ (2,494.9) $ (1,506.6)
Financing
Bank loans 404.3 (45.6) Proceeds from issuance of long-term debt 2,461.5 1,633.6 Repayment of long-term debt (1,546.5) (787.7) Repayment of lease liabilities (90.7) - Net proceeds from issuance of share capital 684.9 60.4 Dividends (269.7) (254.6)
Net cash generated from financing activities $ 1,643.8 $ 606.1
Increase (Decrease) in cash and cash equivalents 185.8 (16.0) Cash and cash equivalents, beginning of year 112.7 122.2 Effect of inflation 25.4 15.8 Effect of exchange rate changes (4.5) (9.3)
Cash and cash equivalents, end of year $ 319.4 $ 112.7 The accompanying notes are an integral part of these consolidated financial statements.

ANNUAL REPORT 2020
- 52 -
NOTES TO THE CONSOLIDATED FINANCIAL STATEMENTS
Years ended March 31, 2020 and 2019 (Tabular amounts are in millions of CDN dollars except information on options, units and shares.)
NOTE 1 CORPORATE INFORMATION
Saputo Inc. (the Company) is a publicly traded company incorporated and domiciled in Canada. The Company’s shares are listed on the Toronto Stock Exchange under the symbol “SAP.” The Company produces, markets, and distributes a wide array of dairy products from Canada, the United States, Australia, Argentina, and the United Kingdom. The address of the Company’s head office is 6869 Metropolitain Blvd. East, Montréal, Québec, Canada, H1P 1X8. The consolidated financial statements (financial statements) of the Company for the fiscal year ended March 31, 2020, comprise the financial results of the Company and its subsidiaries.
The financial statements for the fiscal year ended March 31, 2020, were authorized for issuance by the Board of Directors on June 4, 2020.
NOTE 2 BASIS OF PRESENTATION
STATEMENT OF COMPLIANCE The consolidated financial statements of the Company have been prepared in accordance with International Financial Reporting Standards (IFRS).
BASIS OF MEASUREMENT The Company’s financial statements have been prepared on a historical cost basis except for certain financial instruments that are measured at fair value as described in Note 3, Significant accounting policies.
FUNCTIONAL AND PRESENTATION CURRENCY The Company’s consolidated financial statements are presented in Canadian dollars, which is also the consolidated entity’s functional currency. All financial information has been rounded to the nearest million unless stated otherwise.
NOTE 3 SIGNIFICANT ACCOUNTING POLICIES
CONSOLIDATED FINANCIAL STATEMENTS The consolidated financial statements include the accounts of the Company and entities under its control. Control exists when an entity is exposed, or has rights, to variable returns from its involvement with investees and has the ability to affect those returns through its power over them. All intercompany transactions and balances have been eliminated. Investments over which the Company has effective control are consolidated. The operating results of acquired businesses, from their respective acquisition dates, are included in the consolidated income statements.
CASH AND CASH EQUIVALENTS Cash and cash equivalents consist primarily of cash and short-term investments having an initial maturity of three months or less at the time of acquisition.
INVENTORIES Finished goods, raw materials and work in process are valued at the lower of cost and net realizable value, cost being determined using the first in, first out method.
ANNUAL REPORT 2020
- 53 -
NOTE 3 SIGNIFICANT ACCOUNTING POLICIES (CONT’D)
PROPERTY, PLANT AND EQUIPMENT Property, plant and equipment are stated at cost less accumulated depreciation and any impairment losses and are depreciated using the straight-line method over their estimated useful lives as described below: Buildings 15 to 40 yearsFurniture, machinery and equipment 3 to 20 yearsRolling stock 5 to 10 years based on estimated kilometers traveled
Where components of an item of building or furniture, machinery and equipment are individually significant, they are accounted for separately within the categories described above.
Assets held for sale are recorded at the lower of their carrying amount or fair value less costs to sell, and no depreciation is recorded. Assets under construction are not depreciated. Borrowing costs are capitalized to qualifying property, plant and equipment, if any, where the period of construction of those assets takes a substantial period of time to get ready for their intended use. Borrowing costs, if incurred, are added to the cost of those assets until such time as the assets are substantially ready for their intended use.
For the purposes of impairment testing, property, plant and equipment are tested at the cash-generating unit (CGU) level. Write-downs, if any, are included in “depreciation and amortization” or “restructuring costs” in the consolidated income statements.
RIGHT-OF-USE ASSETS AND LEASE LIABILITIES Leases are recognized as a right-of-use asset and a corresponding lease liability at the commencement date. Each lease payment is allocated between a reduction of the liability and finance cost. The finance cost is recognized in ‘‘Other financial charges’’ in the consolidated income statements over the lease period so as to produce a constant periodic rate of interest on the remaining balance of the liability for each period. The lease liability is measured at the present value of lease payments to be made, discounted using the incremental borrowing rate at the lease commencement date if the interest rate implicit in the lease is not readily available. The period over which the lease payments are discounted is the non-cancellable period for which the lessee has the right to use the underlying asset together with the renewal options that the Company is reasonably certain to exercise. The period needs to also consider termination options that the Company is reasonably certain not to exercise. Renewal options are included in a number of leases across the Company. Lease payments include fixed payments less any lease incentives receivable, variable lease payments that depend on an index or a rate and amounts expected to be paid under residual value guarantees. The lease payments also include the exercise price of a purchase option reasonably certain to be exercised and payment of penalties for termination of a lease.
Right-of-use assets are measured at cost, which is calculated as the amount of the initial measurement of lease liability plus any lease payments made at or before the lease commencement date, any initial direct costs and related restoration costs. The right-of-use asset is depreciated over the shorter of the asset's useful life and the lease term on a straight-line basis. If a lease transfers ownership of the underlying asset or the cost of the right-of-use asset reflects that the Company expects to exercise a purchase option, the related right-of-use asset is depreciated over the useful life of the underlying asset. The depreciation starts at the commencement date of the lease.
Payments associated with short-term leases and leases of low-value assets are recognized on a straight-line basis as an expense in the consolidated income statements.

ANNUAL REPORT 2020
- 54 -
NOTE 3 SIGNIFICANT ACCOUNTING POLICIES (CONT’D)
GOODWILL AND INTANGIBLE ASSETS Goodwill represents the excess of the consideration transferred in a given acquisition over the fair value of the identifiable net assets acquired and is initially recorded at that value. Goodwill is subsequently carried at cost less any impairment.
Intangible assets include trademarks, customer relationships, and software that is not an integral part of the related hardware. Intangible assets are initially recorded at their transaction fair values. Definite life intangible assets are subsequently carried at cost less accumulated amortization and less impairment losses, if any. Indefinite life intangible assets, including goodwill, are not amortized. However, they are tested for impairment annually or more frequently if events or changes in circumstances indicate that the assets might be impaired.
When testing goodwill for impairment, the carrying values of the CGU’s or group of CGU’s, including goodwill, are compared with their respective recoverable amounts (higher of fair value less costs of disposal and value in use) and an impairment loss, if any, is recognized for the excess.
Trademarks are considered to be definite life intangible assets and are amortized using the straight-line method over their useful lives which vary from 15 to 25 years and are reviewed for indicators of impairment at each reporting period. Customer relationships and software are considered to be definite life intangible assets and are amortized using the straight-line method over their useful lives which vary from 3 to 15 years and are reviewed for indicators of impairment at each reporting period.
Refer to “Impairment Testing of Cash-Generating Units” in Note 9 for a discussion of the CGU levels at which goodwill and intangible assets are tested.
IMPAIRMENT OF OTHER LONG-LIVED ASSETS Other long-lived assets are subject to an “indicators of impairment” test at each reporting period. In the event of an indication of impairment, the asset or group of assets (referred to as CGU’s), for which identifiable cash flows that are largely independent of the cash inflows from other assets or group of assets exist, are tested for impairment. An impairment loss is recorded in net earnings when the carrying value exceeds the recoverable amount. The recoverable amount is defined as the greater of fair value less costs of disposal and value in use.
BUSINESS COMBINATIONS The Company accounts for its business combinations using the acquisition method of accounting. Under this method, the Company allocates the purchase price to tangible and intangible assets acquired and liabilities assumed based on estimated fair values at the date of acquisition, with the excess of the purchase price amount allocated to goodwill.
Significant debt issuance costs directly related to the funding of business acquisitions are included in the carrying value of the debt and are amortized over the related debt term using the effective interest rate method. Acquisition costs are expensed as incurred.
EMPLOYEE FUTURE BENEFITS The cost of defined benefit pension and other post-retirement benefits is actuarially determined annually on March 31 using the projected unit credit method and using Management’s best estimates of rates of compensation increases, retirement ages of employees, and expected health care costs. Key assumptions made when valuing the defined benefit obligation include the discount rate, duration of the plan, inflation, and mortality, amongst others. Actuarial gains or losses, the effect of an adjustment, if any, on the maximum amount recognized as an asset and the impact of the minimum funding requirements, are recorded in other comprehensive income (loss) and immediately recognized in retained earnings without subsequent reclassification to the consolidated income statements. Current service costs and past service costs are recognized in the income statement. Past service costs are recognized at the earlier of the date of the plan amendment or curtailment. Interest on obligations offset by interest income on plan assets are expensed in the year. The net pension expenditure under defined contribution pension plans is generally equal to the contributions made by the employer.

ANNUAL REPORT 2020
- 55 -
NOTE 3 SIGNIFICANT ACCOUNTING POLICIES (CONT’D)
REVENUE RECOGNITION The Company recognizes revenue when control of the asset is transferred to the customer, the vast majority upon shipment of products. Revenue is measured at the amount of consideration to which the Company expects to be entitled to. Sales are net of a provision for variable consideration of estimated allowances and sales incentives provided to customers, such that it is highly probable that a significant reversal will not occur once the uncertainty related to the variable consideration is subsequently resolved.
The value of sales incentives provided to customers are estimated using historical trends and are recognized at the time of sale as a reduction of revenue. Sales incentives include discounts, promotions, advertising allowances, and other volume-based incentives. In subsequent periods, the Company monitors the performance of customers against agreed upon obligations related to sales incentive programs and makes any adjustments to both revenue and sales incentive accruals as required.
FOREIGN CURRENCY TRANSLATION The Company’s functional currency is the Canadian dollar. Accordingly, the financial position accounts of foreign operations are translated into Canadian dollars using the exchange rates at the financial position dates and income statements accounts are translated into Canadian dollars using the average monthly exchange rates in effect during the periods. The foreign currency translation adjustment (CTA) reserve presented in the consolidated statements of comprehensive income and the consolidated statements of changes in equity, represents accumulated foreign currency gains (losses) on the Company’s net investments in companies operating outside Canada. The change in the unrealized gains (losses) on translation of the financial statements of foreign operations for the periods presented resulted from the fluctuation in value of the Canadian dollar as compared to the US dollar, the Australian dollar, the Argentine peso and the British pound.
Foreign currency accounts of the Company and its subsidiaries are translated using the exchange rates at the financial position dates for monetary assets and liabilities, and at the prevailing exchange rates at the time of transactions for income and expenses. Non-monetary items are translated at the historical exchange rates. Gains or losses resulting from this translation are included in operating costs.
STOCK-BASED COMPENSATION The Company offers an equity settled stock option plan to certain employees within the organization pursuant to which options are granted over a five-year vesting period with a ten-year expiration term. The fair value of each instalment of an award is determined separately and recognized over the vesting period. When stock options are exercised, any consideration paid by employees and the related compensation expense recorded as a stock option plan reserve are credited to share capital.
The Company allocates deferred share units (DSU) to eligible Directors of the Company which are based on the market value of the Company’s common shares. DSUs are granted on a quarterly basis, vest upon award and entitle Directors to receive a cash payment for the value of the DSUs they hold following cessation of functions as a Director of the Company. The Company recognizes an expense in its consolidated income statements and a liability in its consolidated statement of financial positions for each grant. The liability and related expense are subsequently re-measured at each reporting period.
The Company offers performance share units (PSU) and restricted share units (RSU) to senior management which are based on the market value of the Company’s common shares. On April 1, 2019, RSUs were granted for the first time. The PSU and RSU plans are non-dilutive and are settled in cash. These awards are considered cash-settled share-based payment awards. A liability is recognized for the employment service received and is measured initially, on the grant date, at the fair value of the liability. The liability is then subsequently remeasured at each reporting period with any change in value recorded in net earnings. Compensation expense is recognized over the three-year performance cycle for PSUs and over the three-year restriction period for RSUs.
JOINT VENTURES Joint ventures are accounted for using the equity method and represent those entities in which the Company exercises joint control over and for which it is exposed to variable returns from its involvement in the arrangement. Joint control is the contractually agreed sharing of control of an arrangement, which exists only when decisions about the relevant activities require the unanimous consent of the parties sharing control.

ANNUAL REPORT 2020
- 56 -
NOTE 3 SIGNIFICANT ACCOUNTING POLICIES (CONT’D)
INCOME TAXES Income tax expense represents the sum of current and deferred income tax and is recognized in the consolidated income statements with the exception of items that are recognized in the consolidated statements of comprehensive income or directly in equity.
Current income taxes are determined in relation to taxable earnings for the year and incorporate any adjustments to current taxes payable in respect of previous years.
Deferred income tax assets and liabilities are determined based on temporary differences between the carrying amount of an asset or liability in the consolidated statement of financial position and its tax basis. They are measured using the enacted or substantively enacted tax rates that are expected to apply when the asset is realized, or the liability is settled. A deferred income tax asset is recognized to the extent that it is probable that taxable profit will be available against which the deductible temporary difference can be used.
FINANCIAL INSTRUMENTS Financial assets and liabilities are initially measured at fair value. Subsequently, financial instruments classified as Fair Value through Profit or Loss (FVTPL) and fair value through other comprehensive income, part of a hedging relationship or not, continue to be measured at fair value on the statement of financial position at each reporting date, whereas other financial instruments are measured at amortized cost using the effective interest method.
The Company has made the following classifications:
- Cash and cash equivalents are classified as amortized cost and are subsequently measured at amortized cost.
- Receivables are classified as amortized cost and are subsequently measured at amortized cost.
- Other assets that meet the definition of a financial asset are classified as amortized cost and are subsequently measured at amortized cost.
- Bank loans, accounts payable and accrued liabilities, other liabilities and long-term debt are classified as amortized cost and are measured at amortized cost, with the exception of the liability related to DSUs and PSUs which is measured at the fair value of common shares on the financial position dates.
Certain derivative instruments are utilized by the Company to manage exposure to variations in interest rate payments and to manage foreign exchange rate risks, including foreign exchange forward contracts, currency swaps and interest rate swaps. Derivatives are initially recognized at fair value at the date the derivative contracts and currency swaps are entered into and are subsequently remeasured to their fair value at the end of each reporting period. The resulting gain or loss is immediately recognized in net earnings unless the derivative is designated as a hedging instrument.
HEDGING The Company designates certain financial instruments as cash flow hedges. At the inception of the hedging relationship, the Company designates and formally documents the relationship between the hedging instrument and the hedged item, the risk management objective, and its strategy for undertaking the hedge.
For derivatives instruments designated as cash flow hedges, the change in fair value related to the effective portion of the hedge is recognized in other comprehensive income (loss), and the accumulated amount is presented as a hedging reserve in the consolidated statement of changes in equity. Any ineffective portion is immediately recognized in net earnings. Gains or losses from cash flow hedges included in other components of equity are reclassified to net earnings, when the hedging instrument has come due or is settled, as an offset to the losses or gains recognized on the underlying hedged items.
The Company formally assesses at inception and quarterly thereafter, the effectiveness of the hedging instruments’ ability to offset variations in the cash flow risks associated with the hedged item. Where a hedging relationship is no longer effective, hedge accounting is discontinued and any subsequent change in the fair value of the hedging instrument is recognized in net earnings.

ANNUAL REPORT 2020
- 57 -
NOTE 3 SIGNIFICANT ACCOUNTING POLICIES (CONT’D)
FAIR VALUE HIERARCHY All financial instruments measured at fair value are categorized into one of three hierarchy levels, described below, for disclosure purposes. Fair value is defined as the price that would be received to sell an asset or paid to transfer a liability in an orderly transaction between market participants at the measurement date.
Each level reflects the inputs used to measure the fair values of assets and liabilities:
Level 1 – Inputs are unadjusted quoted prices of identical instruments in active markets. Level 2 – Inputs other than quoted prices included in Level 1 that are observable for the asset or liability, either directly
or indirectly. Level 3 – One or more significant inputs used in a valuation technique are not based on observable market data in
determining fair values of the instruments.
Determination of fair value and the resulting hierarchy requires the use of observable market data whenever available. The classification of a financial instrument in the hierarchy is based upon the lowest level of input that is significant to the measurement of fair value.
USE OF ESTIMATES AND JUDGMENTS IN THE APPLICATION OF ACCOUNTING POLICIES The preparation of the Company’s financial statements requires Management to make certain judgments and estimates about transactions and carrying values that are fulfilled at a future date. Judgments and estimates are subject to fluctuations due to changes in internal and/or external factors and are continuously monitored by Management. A discussion of the judgments and estimates that could have a material effect on the financial statements is provided below.
SIGNIFICANT ESTIMATES AND JUDGMENTS
Economic conditions and uncertainties Current global economic conditions are highly volatile due to the COVID-19 pandemic, which was declared in the last two weeks of fiscal 2020. The magnitude, duration and severity of the COVID-19 pandemic are hard to predict and could affect the significant estimates and judgments used in the preparation of the consolidated financial statements.
Income Taxes The Company is subject to income taxes in numerous jurisdictions. Significant judgment is required in determining the consolidated provision for income taxes. During the ordinary course of business, there are many transactions and calculations for which the ultimate tax determination is uncertain. The Company recognizes liabilities for anticipated tax audit issues based on estimates of whether additional taxes will be due. Where the final tax outcome of these matters differs from the amounts that were initially recorded, such differences will impact the results for the reporting period and the respective current income tax and deferred income tax provisions in the reporting period in which such determination is made.
Deferred Income Taxes Deferred income tax assets and liabilities are measured using enacted or substantively enacted income tax rates expected to apply to taxable income in the years in which temporary differences are expected to be recovered or settled. As a result, a projection of taxable income is required for those years, as well as an assumption of the ultimate recovery or settlement period for temporary differences. The projection of future taxable income is based on Management’s best estimates and may vary from actual taxable income. Deferred tax assets are reviewed at each reporting date and are reduced to the extent that it is no longer probable that the related tax benefit will be realized. Canadian, US and international tax rules and regulations are subject to interpretation and require judgment on the part of the Company that may be challenged by taxation authorities. The Company believes that it has adequately provided for deferred tax obligations that may result from current facts and circumstances. Temporary differences and income tax rates could change due to fiscal budget changes and/or changes in income tax laws.

ANNUAL REPORT 2020
- 58 -
NOTE 3 SIGNIFICANT ACCOUNTING POLICIES (CONT’D)
Goodwill, Intangible Assets and Business Combinations Goodwill, trademarks and customer relationships have principally arisen as a result of business combinations. The acquisition method, which also requires significant estimates and judgments, is used to account for these business combinations. As part of the allocation process in a business combination, estimated fair values are assigned to the net assets acquired, including trademarks and customer relationships. These estimates are based on forecasts of future cash flows, estimates of economic fluctuations and an estimated discount rate. The excess of the purchase price over the estimated fair value of the net assets acquired is then assigned to goodwill. In the event that actual net assets fair values are different from estimates, the amounts allocated to the net assets, and specifically to trademarks and customer relationships, could differ from what is currently reported. This would then have a pervasive impact on the carrying value of goodwill. Differences in estimated fair values would also have an impact on the amortization of definite life intangibles.
Property, Plant and Equipment Critical judgment is necessary in the selection and application of depreciation method and useful lives as well as the determination of which components are significant and how they are allocated. Management has determined that the use of the straight-line method of amortization is the most appropriate as its facilities are operating at a similar output potential on a year to year basis, which indicates that production is constant. It is Management’s best estimate that the useful lives and policies adopted adequately reflect the pattern in which the assets future economic benefits are expected to be derived.
Impairment of Assets Significant estimates and judgments are required in testing goodwill, intangible assets and other long-lived assets, including right-of-use assets, for impairment. Management uses estimates or exercises judgment in assessing indicators of impairment, defining a CGU, forecasting future cash flows and in determining other key assumptions such as discount rates and earnings multipliers used for assessing fair value (less costs of disposal) or value in use. Estimates made for goodwill and intangible assets can be found in Note 9. Goodwill is tested for impairment annually as at December 31 and whenever there is an indication of impairment. Other long-lived assets are tested only when indicators of impairment are present.
Employee Future Benefits The Company is the sponsor to both defined benefit and defined contribution plans, which provide pension and other post-employment benefits to its employees.
Several estimates and assumptions are required with regards to the determination of the defined benefit expense and its related obligation, such as the discount rate used in determining the carrying value of the obligation and the interest income on plan assets, the duration of the obligation, inflation, the expected health care cost trend rate, the expected mortality rate, expected salary increase, etc. Changes in a number of key assumptions can have a material impact on the calculation of the obligation. Actual results will normally differ from expectations. These gains or losses are presented in the consolidated statements of comprehensive income.
EFFECT OF NEW ACCOUNTING STANDARDS, INTERPRETATIONS AND AMENDMENTS ADOPTED DURING THE YEAR
The following standards, amendments to existing standards and interpretation of standards were adopted by the Company on or after April 1, 2019:
IFRS 3, Business Combinations In December 2017, the IASB issued an amendment to IFRS 3 to clarify that when an entity obtains control of a business that is a joint operation, it remeasures previously held interests in that business at fair value.
IFRS 9, Financial Instruments In October 2017, the IASB further amended IFRS 9 to address concerns about how this standard classifies particular prepayable financial assets.
IFRS 11, Joint Arrangements In December 2017, the IASB issued an amendment to IFRS 11 to clarify that when an entity obtains joint control of a business that is a joint operation, the entity does not remeasure previously held interests in that business.

ANNUAL REPORT 2020
- 59 -
NOTE 3 SIGNIFICANT ACCOUNTING POLICIES (CONT’D)
IAS 19, Employee Benefits In February 2018, the IASB issued an amendment to IAS 19 to specify how an entity shall determine pension expenses when changes to a pension plan occur. When an amendment, curtailment or settlement to a plan takes place, IAS 19 requires an entity to remeasure its net defined benefit liability or asset. The amendments require an entity to use the updated assumptions from this remeasurement to determine the current service cost and net interest for the remainder of the reporting period after the change to the plan. In addition, amendments have been included to clarify the effect of a plan amendment, curtailment or settlement on the requirements regarding the asset ceiling.
IAS 23, Borrowing Costs In December 2017, the IASB issued an amendment to IAS 23 clarifying that if any specific borrowing remains outstanding after the related asset is ready for its intended use or sale, it becomes part of the funds that an entity borrows generally when calculating the capitalization rate on general borrowings.
IAS 28, Investments in Associates In October 2017, the IASB issued an amendment to IAS 28 to clarify that an entity should apply IFRS 9 to long-term interests in an associate or joint venture that form part of the net investment in the associate or joint venture but to which the equity method is not applied.
IFRIC 23, Uncertainty Over Income Tax Treatments In June 2017, the IFRS Interpretations Committee issued IFRIC 23 which clarifies how the recognition and measurement requirements of IAS 12, Income Taxes, are applied where there is uncertainty over income tax treatments.
IFRS 16, Leases In January 2016, the IASB published a new standard, IFRS 16, Leases, which has replaced IAS 17, Leases. The Company adopted the standard on April 1, 2019. The new standard eliminates the distinction between operating and finance leases and now brings most leases onto the statement of financial position for lessees, except with respect to leases that meet limited exception criteria. For lessors, the accounting remains mostly unchanged and the distinction between operating and finance leases is retained. Except for IFRS 16, the amendments and interpretation listed above did not have a significant impact on the Company’s financial statements.

ANNUAL REPORT 2020
- 60 -
NOTE 3 SIGNIFICANT ACCOUNTING POLICIES (CONT’D)
ADOPTION OF IFRS 16, Leases IFRS 16 was applied on April 1, 2019, using the modified retrospective approach and the Company therefore did not restate comparative information. Previously, the Company used IAS 17, Leases to account for leases. In addition, the Company applied the following exemptions and practical expedients on adoption:
Use of a single discount rate for a portfolio of leases with reasonably similar characteristics; Exemption from recognizing a right-of-use asset and a lease liability when the lease term ends within 12 months
of the date of initial application; Exemption from recognizing a right-of-use asset and a lease liability when the underlying asset is of low value; Exclusion of initial direct costs from the measurement of the right-of-use assets at the date of initial application.
The following table summarizes the adjustments to opening balances resulting from the adoption of IFRS 16:
(in millions of CDN dollars)
As reported
March 31, 2019 IFRS 16 transition
impact After IFRS 16 adoption
April 1, 2019
Assets
Property, plant and equipment 3,095.4 (34.9) 3,060.5
Right-of-use assets - 440.6 440.6
Total 3,095.4 405.7 3,501.1
Liabilities
Long-term debt including short term portion 2,267.3 (29.4) 2,237.9
Lease liabilities including short term portion - 445.9 445.9
Accounts payable and accrued liabilities 1,442.2 (10.8) 1,431.4
Total 3,709.5 405.7 4,115.2
The following table reconciles lease commitments as at March 31, 2019, to lease liabilities recognized in the consolidated statement of financial position as at April 1, 2019: (in millions of CDN dollars)
Operating lease commitments as at March 31, 2019 531.2
Exemption for short-term and low value leases (28.1)
Extension and termination options reasonably certain to be exercised 72.4
Finance leases already recognized on the balance sheet 29.4
Service contracts and non-lease components (81.3)
Discounted using the weighted average incremental borrowing rate as at March 31, 2019 (77.7)
Leases liabilities recognized as at April 1, 2019 445.9
Current portion of lease liabilities 68.6
Lease liabilities 377.3
Total lease liabilities recognized as at April 1, 2019 445.9
Upon adoption of IFRS 16, the Company recognized lease liabilities for leases which had been previously classified as operating leases under IAS 17. These liabilities were measured at the present value of the remaining lease payments and discounted using the lessee’s incremental borrowing rate as of March 31, 2019. The weighted average incremental borrowing rate applied was 3.48%. Right-of-use assets are depreciated over the shorter of the asset's useful life and the lease term on a straight-line basis. Lease extension and termination options are included in the lease term only when it is reasonably certain that the Company will exercise the option.

ANNUAL REPORT 2020
- 61 -
NOTE 3 SIGNIFICANT ACCOUNTING POLICIES (CONT’D)
Effect of new accounting standards, Interpretations and amendments not yet implemented
The following standards, amendments to standards and interpretations have been issued and are applicable to the Company for its annual periods beginning on and after April 1, 2020, with an earlier application permitted:
IFRS 9, Financial Instruments, IFRS 7, Financial Instruments disclosure and IAS 39, Financial Instruments: recognition and measurement In September 2019, the IASB issued amendments to IFRS 9, IAS 39, and IFRS 7 to address the implications of the Interbank offered rates (IBOR) reform for specific hedge accounting requirements which require forward-looking analysis and additional disclosure requirements.
IAS 1, Presentation of Financial Statements and IAS 8, Accounting Policies, Changes in Estimates and Errors In October 2018, the IASB issued an amendment to IAS 1 and IAS 8 to clarify the definition of ‘material’ and to align the definition used in the Conceptual Framework and the standards themselves.
IFRS 3, Business Combinations In October 2018, the IASB issued an amendment to IFRS 3 to clarify the definition of a business, to resolve the difficulties that arise when an entity determines whether it has acquired a business or a group of assets.
IAS 1, Presentation of Financial Statements In January 2020, the IASB issued an amendment to clarify how to classify debt and other liabilities as current or non-current. The amendments help to determine whether, in the statement of financial position, debt and other liabilities with an uncertain settlement date should be classified as current (due or potentially due to be settled within one year) or non-current. The amendments also include clarifying the classification requirements for debt an entity might settle by converting it into equity.
The adoption of these amendments will not have a significant impact on the Company’s financial statements.

ANNUAL REPORT 2020
- 62 -
NOTE 4 REVENUES
Revenues by market segment are as follows:
2020 2019
Retail $ 7,360.2 $ 6,342.3
Foodservice 5,061.4 4,794.7
Industrial 2,521.9 2,364.9
Total $ 14,943.5 $ 13,501.9
NOTE 5 INVENTORIES
March 31, 2020 March 31, 2019
Finished goods $ 1,256.3 $ 1,134.1
Raw materials, work in progress and supplies 964.6 546.9
Total $ 2,220.9 $ 1,681.0
The amount of inventories recognized as an expense in operating costs for the year ended March 31, 2020, is $11.637 billion ($10.677 billion for the year ended March 31, 2019).
NOTE 6 OPERATING COSTS EXCLUDING DEPRECIATION AND AMORTIZATION
2020 2019
Changes in inventories of finished goods and work in process $ (108.3) $ (25.4)
Raw materials and consumables used 10,289.0 9,204.2
Foreign exchange loss 15.6 11.9
Employee benefits expense 1,751.3 1,577.7
Selling costs 670.2 648.8
Other general and administrative costs 857.9 863.4
Total $ 13,475.7 $ 12,280.6
Operating costs include a loss from unsellable inventory destined to foodservice customers and other expenses totalling $26.9 million ($nil in 2019) and an inventory write-down of $17.9 million ($3.2 million in 2019) resulting from the decrease in certain market selling prices. The loss from unsellable inventory was due to lower demand from customers in the foodservice segment in North America in the last two weeks of fiscal 2020 in connection with the COVID-19 pandemic.

ANNUAL REPORT 2020
- 63 -
NOTE 7 PROPERTY, PLANT AND EQUIPMENT
For the year ended March 31, 2020
Land Buildings
Furniture, machinery
and equipment
Rolling stock Leases Total
Cost
As at March 31, 2019 $ 119.3 $ 1,232.4 $ 3,389.7 $ 18.7 $ 39.1 $ 4,799.2
Adjustment on initial application – IFRS 16 (Note 3) - - (2.1) -
(39.1)
(41.2)
Business acquisitions (Note 18) 64.0 108.5 375.2 -
-
547.7
Additions 25.7 103.1 381.0 0.1 - 509.9
Disposals (1.1) (14.1) (31.9) (2.4) - (49.5)
Transfers (1.5) 1.3 22.3 - - 22.1
Foreign currency and hyperinflation adjustments (3.0) 11.7 57.7 (1.1)
-
65.3
As at March 31, 2020 $ 203.4 $ 1,442.9 $ 4,191.9 $ 15.3 $ - $ 5,853.5
Accumulated depreciation
As at March 31, 2019 $ - $ 336.1 $ 1,352.6 $ 10.5 $ 4.6 $ 1,703.8
Adjustment on initial application – IFRS 16 (Note 3) (1.7)
(4.6)
(6.3)
Depreciation1 - 57.1 233.9 2.2 - 293.2
Disposals - (7.9) (30.5) (2.1) - (40.5)
Foreign currency and hyperinflation adjustments - 10.5 43.5 (0.7)
-
53.3
As at March 31, 2020 $ - $ 395.8 $ 1,597.8 $ 9.9 $ - $ 2,003.5
Net book value at March 31, 2020 $ 203.4 $ 1,047.1 $ 2,594.1 $ 5.4 $ - $ 3,850.0 1 Depreciation includes impairment of assets related to plant closure (Note 24)
The net book value of property, plant and equipment under construction amounts to $362.1 million as at March 31, 2020, ($276.9 million as at March 31, 2019) and consists mainly of machinery and equipment.
In the third quarter of fiscal 2019, the Company realized a gain on disposal of assets of $194.5 million ($167.8 million after tax) relating to the sale of its facility in Burnaby, British Columbia. The Company sold the facility for $209.0 million, and provided a vendor take-back (VTB) mortgage in the amount of $50.0 million (Note 10). The VTB mortgage bears interest at a rate of 3% per annum and matures in fiscal 2022, where the full amount of capital will be repaid. The Company has entered into a lease agreement for the Burnaby facility until the construction of the new facility is completed, which is expected to be in fiscal 2021.

ANNUAL REPORT 2020
- 64 -
NOTE 7 PROPERTY, PLANT AND EQUIPMENT (CONT’D)
For the year ended March 31, 2019
Land Buildings
Furniture, machinery
and equipment
Rolling stock Leases Total
Cost
As at March 31, 2018 $ 70.2 $ 924.4 $ 2,678.5 $ 17.7 $ 29.6 $ 3,720.4
Adjustment on initial application - IAS 29 0.2 12.2 59.3 0.3
-
72.0
Business acquisitions (Note 18) 54.1 245.7 402.4 1.4 - 703.6
Additions 0.6 85.9 282.6 1.4 11.5 382.0
Disposals (5.4) (35.6) (90.2) (1.0) - (132.2)
Transfers - (9.0) 8.6 (0.8) (3.1) (4.3)
Foreign currency adjustments (0.4) 8.8 48.5 (0.3) 1.1 57.7
As at March 31, 2019 $ 119.3 $ 1,232.4 $ 3,389.7 $ 18.7 $ 39.1 $ 4,799.2
Accumulated depreciation
As at March 31, 2018 $ - $ 312.2 $ 1,178.2 $ 8.9 $ 1.1 $ 1,500.4
Adjustment on initial application - IAS 29 - 4.3 32.0 0.3
-
36.6
Depreciation¹ - 41.6 195.2 2.9 3.8 243.5
Disposals - (28.9) (85.3) (1.4) - (115.6)
Transfers - - 0.4 - (0.4) 0.0
Foreign currency and hyperinflation adjustments - 6.9 32.1 (0.2)
0.1
38.9
As at March 31, 2019 $ - $ 336.1 $ 1,352.6 $ 10.5 $ 4.6 $ 1,703.8
Net book value at March 31, 2019 $ 119.3 $ 896.3 $ 2,037.1 $ 8.2 $ 34.5 $ 3,095.4 1 Depreciation includes impairment of assets related to plant closure (Note 24)

ANNUAL REPORT 2020
- 65 -
NOTE 8 RIGHT-OF-USE ASSETS AND LEASE LIABILITIES
The following table presents changes in right-of-use assets during fiscal 2020:
Real Estate Equipment Total Balance as at April 1, 2019 $ 299.2 $ 141.4 $ 440.6 Business acquisitions (Note 18) 11.0 62.4 73.4 New leases / leases modifications 10.8 6.1 16.9 Transfers to Property, plant and equipment - (22.5) (22.5) Depreciation (29.7) (34.3) (64.0) Foreign currency (17.7) (8.8) (26.5) Balance at March 31, 2020 $ 273.6 $ 144.3 $ 417.9 The following table presents changes in lease liabilities during fiscal 2020:
Total Balance as at April 1, 2019 $ 445.9 Business acquisitions (Note 18) 70.4 New leases / lease modifications 14.4 Interest expense 16.1 Payments (106.8) Foreign currency (25.2) 414.8 Current portion (74.7) Balance at March 31, 2020 $ 340.1 The following maturity analysis of the Company’s lease liabilities outstanding at March 31, 2020 is based on the expected undiscounted contractual cash flows until the contractual maturity date:
Less than 1 year $ 87.2 1-2 years 78.0 2-3 years 58.9 3-4 years 45.5 4-5 years 58.8 More than 5 years 159.7 $ 488.1
Expenses relating to short-term leases and leases of low value were not significant for the fiscal year ended March 31, 2020.

ANNUAL REPORT 2020
- 66 -
NOTE 9 GOODWILL AND INTANGIBLE ASSETS For the year ended March 31, 2020
Definite Life
Goodwill Trademarks1 Customer
relationships2 Software3 and other
Total Intangible
Assets
Cost
As at March 31, 2019 $ 2,597.6 $ 464.4 $ 319.4 $ 273.8 $ 1,057.6
Business acquisitions (Note 18) 541.5 688.5 92.9 26.1 807.5
Additions - - - 66.4 66.4
Transfer - - (9.3) 0.5 (8.8)
Foreign currency and hyperinflation adjustments 80.4 3.1 9.6 6.0 18.7
As at March 31, 2020 $ 3,219.5 $ 1,156.0 $ 412.6 $ 372.8 $ 1,941.4
Accumulated Amortization
As at March 31, 2019 - $ 21.7 $ 125.5 $ 34.2 $ 181.4
Amortization - 51.9 34.5 27.1 113.5
Foreign currency and hyperinflation adjustments - 1.5 4.4 (0.1) 5.8
As at March 31, 2020 $ - $ 75.1 $ 164.4 $ 61.2 $ 300.7
Net book value at March 31, 2020 $ 3,219.5 $ 1,080.9 $ 248.2 $ 311.6 $ 1,640.7
For the year ended March 31, 2019
Goodwill
Definite Life
Trademarks1 Customer
relationships2 Software3 Total Intangible
Assets
Cost
As at March 31, 2018 $ 2,417.3 $ 433.5 $ 303.7 $ 195.6 $ 932.8
Adjustment on initial application - IAS 29 - - - 2.9 2.9
Business acquisitions (Note 18) 127.8 27.5 10.5 6.1 44.1
Additions - - - 65.5 65.5
Transfer - - - 4.3 4.3
Foreign currency and hyperinflation adjustments 52.5 3.4 5.2 (0.6) 8.0
As at March 31, 2019 $ 2,597.6 $ 464.4 $ 319.4 $ 273.8 $ 1,057.6
Accumulated Amortization
As at March 31, 2018 - - 102.5 7.2 109.7
Adjustment on initial application - IAS 29 - - - 0.6 0.6
Amortization - 21.6 21.1 27.0 69.7
Foreign currency and hyperinflation adjustments - 0.1 1.9 (0.6) 1.4
As at March 31, 2019 $ - $ 21.7 $ 125.5 $ 34.2 $ 181.4
Net book value at March 31, 2019 $ 2,597.6 $ 442.7 $ 193.9 $ 239.6 $ 876.2 1 Trademarks are amortized straight-line over their useful lives which vary from 15 to 25 years. 2 Customer relationships are amortized straight-line over their useful lives which vary from 3 to 15 years. 3 None of the software additions were internally generated.

ANNUAL REPORT 2020
- 67 -
NOTE 9 GOODWILL AND INTANGIBLE ASSETS (CONT’D)
IMPAIRMENT TESTING OF CASH-GENERATING UNITS
Goodwill In determining whether goodwill is impaired, the Company is required to estimate the recoverable amount of CGUs or groups of CGUs to which goodwill is allocated. Management considers the sectors below to be CGUs or groups of CGUs as they represent the smallest identifiable group of assets that generates cash inflows that are largely independent of the cash inflows from other assets or groups of assets.
The Company reports its operations under four geographic sectors. The Canada Sector consists of the Dairy Division (Canada). The USA Sector includes the Cheese Division (USA) and the Dairy Foods Division (USA). The International Sector combines the Dairy Division (Australia) and the Dairy Division (Argentina). Finally, the Europe Sector consists of the Dairy Division (UK) following the Dairy Crest Acquisition.
Goodwill has been allocated to each CGU or group of CGUs as follows:
Allocation of goodwill March 31, 2020 March 31, 2019
Canada Dairy Division (Canada) $ 401.5 $ 401.5
USA Cheese Division (USA) 1,393.1 1,327.7 Dairy Foods Division (USA) 672.9 638.8
International Dairy Division (Australia) 200.3 220.1 Dairy Division (Argentina) 8.7 9.5
Europe Dairy Division (UK) 543.0 -
$ 3,219.5 $ 2,597.6
Recoverable amounts for the Dairy Division (Canada), the Cheese Division (USA), and the Dairy Foods Division (USA) were estimated using an earnings multiplier valuation model (fair value less costs of disposal). The key assumptions used in these models consist mainly of earnings multipliers for market comparables that are applied to the results of each CGU or group of CGUs tested.
Recoverable amounts for the Dairy Division (Australia), the Dairy Division (Argentina), and the Dairy Division (UK) have been estimated using a discounted cash flow (value in use) model based on the following key assumptions:
Cash flows: Cash flow forecasts for a given CGU are based on earnings before interest, income taxes, depreciation and amortization, and are adjusted for a growth rate and income tax rates. The cash flow forecast does not exceed a period of five years with a terminal value calculated as a perpetuity in the final year.
Terminal growth rate: Management uses a terminal growth rate to adjust its forecasted cash flows based on expected increases in inflation and revenues for the CGU.
Discount rate: Cash flows are discounted using pre-tax discount rates.
The Company performed its annual impairment test, and, in all cases, the recoverable amounts exceeded their respective carrying values including goodwill. The Company has designated December 31 as the date for the annual impairment test. As at December 31, 2019, goodwill was not considered to be impaired.
In light of highly volatile current economic conditions caused by the COVID-19 pandemic, the Company assessed the presence of impairment indicators in its various CGUs and concluded that there were no indicators of impairment as of March 31, 2020.

ANNUAL REPORT 2020
- 68 -
NOTE 9 GOODWILL AND INTANGIBLE ASSETS (CONT’D)
Trademarks Trademarks are included in the following CGU or group of CGUs:
Allocation of trademarks by sectors March 31, 2020 March 31, 2019
Canada $ 228.6 $ 241.1 USA 152.8 151.8 International 45.1 49.8 Europe 654.4 -
$ 1,080.9 $ 442.7
The assessment of the estimated useful life of trademarks is reviewed annually. Since the beginning of fiscal 2019, trademarks are amortized using the straight-line method over their estimated useful lives, which vary from 15 to 25 years. Since the majority of our trademarks are in the retail market segment, the Company concluded that no triggering event had occurred during fiscal 2020 in relation to the COVID-19 pandemic.
NOTE 10 OTHER ASSETS
March 31, 2020 March 31, 2019
Joint ventures $ 36.9 $ 45.2
Financial loan (Note 7) 50.0 50.0
Derivative financial assets 22.5 -
Employee benefits (Note 19) 381.2 -
Other 54.7 36.4
$ 545.3 $ 131.6
The Company holds interests in joint ventures, which are all accounted for using the equity method. The Company recognized $1.9 million in net earnings, representing its share of earnings in the joint ventures for the year ended March 31, 2020 ($8.5 million for the year ended March 31, 2019). Dividends received from the joint ventures amounted to $13.4 million for the year ended March 31, 2020 ($9.5 million for the year ended March 31, 2019).

ANNUAL REPORT 2020
- 69 -
NOTE 11 BANK LOANS
The Company has available bank credit facilities providing for bank loans as follows:
Available for use Amount drawn
Credit Facilities Maturity
Canadian Currency
Equivalent Base Currency March 31, 2020 March 31, 2019
North America-USA November 20241 421.9 300.0 USD $ - $ -
North America-Canada November 20241 984.3 700.0 USD - -
Canada January 20212 26.0 26.0 CAD 24.9 -
Australia Yearly3 271.6 315.0 AUD 238.4 38.0
Australia Yearly3 140.6 100.0 USD 128.5 23.8
Japan Yearly4 104.8 8,000.0 JPY 24.8 -
United Kingdom Yearly5 131.0 75.0 GBP 17.5 -
Argentina Yearly6 161.7 115.0 USD 53.4 45.4
Argentina Yearly7 134.8 6,155.0 ARS 41.0 23.2
Total 2,376.7 $ 528.5 $ 130.4 1 Bears monthly interest at rates ranging from lender’s prime rates plus a maximum of 1.00% or LIBOR or BBSY or banker’s acceptance rate plus
0.80% up to a maximum of 2.00% depending on the Company credit ratings. 2 Bears monthly interest at Bank’s Prime Rate plus 0.25% or Banker’s Acceptance Rate plus 1.25%. 3 Bear monthly interest at LIBOR or Australian Bank Bill Rate plus up to 1.00% and can be drawn in AUD or USD. 4 Bears monthly interest at TIBOR plus 0.70% and can be drawn in JPY. 5 Bears monthly interest at rates ranging from base rate plus 0.70% or LIBOR plus 0.70% and can be drawn in GBP. 6 Bear monthly interest at local rate and can be drawn in USD. 7 Bear monthly interest at local rate and can be drawn in ARS.
On November 12, 2019, the Company amended its North American bank credit facilities to increase the principal amount available from the revolving credit facilities to US$1.000 billion and extend the term until November 2024.

ANNUAL REPORT 2020
- 70 -
NOTE 12 LONG-TERM DEBT
March 31, 2020 March 31, 2019
Unsecured bank term loan facilities Obtained April 2018 ($300.0 million) and due in April 20211 $ - $ 200.0
Obtained April 2018 (AU$600.0 million) and due in April 20231 437.1 487.9
Obtained April 2019 ($426.0 million) and due in April 20212 418.8 -
Obtained April 2019 (£600.0 million) and due in April 20223 1,036.4 -
Unsecured senior notes4,5
2.65%, issued in November 2014 and due in November 2019 (Series 1) - 300.0
2.20%, issued in June 2016 and due in June 2021 (Series 2) 300.0 300.0
2.83%, issued in November 2016 and due in November 2023 (Series 3) 300.0 300.0
1.94%, issued in June 2017 and due in June 2022 (Series 4) 300.0 300.0
3.60%, issued in August 2018 and due in August 2025 (Series 5) 350.0 350.0
2.88%, issued in November 2019 and due in November 2024 (Series 6) 400.0 -
Finance lease obligations6 - 29.4
$ 3,542.3 $ 2,267.3
Current portion - 323.4
$ 3,542.3 $ 1,943.9
Principal repayments are as follows:
Less than 1 year $ - $ 323.4
1-2 years 718.8 3.9
2-3 years 1,336.4 502.1
3-4 years 737.1 300.0
4-5 years 400.0 787.9
More than 5 years 350.0 350.0
$ 3,542.3 $ 2,267.3 1 Bear monthly interest at rates ranging from lender's prime plus a maximum of 1.00%, or banker’s acceptance rates or Australian Bank Bill Rate plus
0.80% up to a maximum of 2.00%, depending on the Company’s credit ratings. Interest is paid every one, two, three or six months, as selected by the Company.
2 Bears monthly interest at lender’s prime rates plus a maximum of 1.00% or LIBOR or banker’s acceptance rates plus 0.80% up to a maximum of 2.00%, depending on the Company’s credit ratings, and can be drawn in CAD, USD or £. As at March 31, 2020, US$297.9 million was drawn and its foreign currency risk was offset with a cross currency swap.
3 Bears monthly interest at lender’s prime rates plus a maximum of 1.00% or LIBOR or banker’s acceptance rates plus 0.80% up to a maximum of 2.00%, depending on the Company’s credit ratings, and can be drawn in CAD, USD or £.
4 Interest payments are semi-annual. 5 On December 12, 2018, the Company renewed its medium term note program and filed a short form base shelf prospectus qualifying an offering of
medium term notes for distribution to the public in the provinces of Canada over a 25-month period. 6 Due to the adoption of IFRS 16, this amount was reclassified as lease liabilities (Note 8).
On November 19, 2019, the Company issued Series 6 medium term notes for an aggregate principal amount of $400.0 million and used the net proceeds to repay the $300.0 million aggregate principal amount of the Series 1 medium term notes due November 26, 2019, and the remainder of the net proceeds was used to repay a portion of the term loan facility obtained in April 2018. On February 21, 2019, the Company entered into a credit agreement providing for a non-revolving term facility, denominated in British pounds sterling in the aggregate amount of $2.209 billion (£1.265 billion) (Dairy Crest Acquisition Facility), consisting of three tranches: a 1-year tranche of $698.5 million (£400.0 million), which was fully repaid in fiscal 2020; a 2-year tranche of $462.7 million (£265.0 million); and a 3-year tranche of $1.048 billion (£600.0 million). On April 15, 2019, an aggregate amount of $2.118. billion (£1.213 billion) was drawn on the Dairy Crest Acquisition Facility. On November 12, 2019, the 2-year tranche of £265.0 million ($456.5 million) was converted to a Canadian dollar denominated facility of $426.0 million.

ANNUAL REPORT 2020
- 71 -
NOTE 13 OTHER LIABILITIES
March 31, 2020 March 31, 2019
Employee benefits (Note 19) $ 36.9 $ 36.6
Derivative financial liabilities 7.1 -
Stock-based compensation, net of current portion 33.1 21.8
Other 21.4 28.0
$ 98.5 $ 86.4
NOTE 14 SHARE CAPITAL
AUTHORIZED The authorized share capital of the Company consists of an unlimited number of common shares. The common shares are voting and participating.
Number of
shares Common Shares
$
Balance at April 1, 2019 390,198,386 $ 991.7
Issued with Equity Offering 16,642,553 639.9
Transferred from reserves, upon exercise of options - 9.1
Issued on exercise of options 1,797,434 45.0
Balance at March 31, 2020 408,638,373 $ 1,685.7
On September 11, 2019, the Company completed a public offering and a concurrent private placement for an aggregate of 16,642,553 common shares at a price of $39.60 per share for aggregate gross proceeds of $659 million (the Equity Offering). The proceeds, net of commissions, legal, and accounting fees of $19.1 million, were $639.9 million.
SHARE OPTION PLAN The Company has an equity settled share option plan to allow for the purchase of common shares by key employees and officers of the Company. The total number of common shares which may be issued pursuant to this plan cannot exceed 45,698,394 common shares. As at March 31, 2020, 18,335,893 common shares are available for future grants under this plan and 20,946,092 common shares are underlying options outstanding. During fiscal 2020, a total of 1,797,434 common shares were issued following the exercise of options. Options may be exercised at a price not less than the weighted average market price for the five trading days immediately preceding the date of grant. The options vest at 20% per year and expire ten years from the grant date.
Options issued and outstanding as at year end are as follows:
March 31, 2020 March 31, 2019
Granting period Exercise
price Number of
options Number of
exercisable options Number of
options Number of
exercisable options
2010 $ 10.70 - - 11,728 11,728
2011 $ 14.66 39,840 39,840 576,714 576,714
2012 $ 21.61 543,390 543,390 637,317 637,317
2013 $ 21.48 1,122,735 1,122,735 1,271,036 1,271,036
2014 $ 25.55 1,479,140 1,479,140 1,706,074 1,706,074
2015 $ 27.74 1,941,956 1,941,956 2,282,620 1,688,226
2016 $ 35.08 2,056,423 1,565,767 2,362,317 1,293,545
2017 $ 41.40 3,357,766 1,974,026 3,663,707 1,429,421
2018 $ 46.29 3,345,835 1,347,563 3,607,186 728,176
2019 $ 41.02 3,949,185 765,219 4,256,172 -
2020 $ 45.30 3,109,822 - - -
20,946,092 10,779,636 20,374,871 9,342,237

ANNUAL REPORT 2020
- 72 -
NOTE 14 SHARE CAPITAL (CONT’D)
Changes in the number of outstanding options are as follows:
2020 2019
Number of
options
Weighted average exercise
price Number of
options
Weighted average exercise
price
Balance, beginning of year 20,374,871 $ 35.96 19,510,123 $ 32.95
Options granted 3,319,450 $ 45.30 4,536,208 $ 41.02
Options exercised (1,797,434) $ 25.04 (2,790,983) $ 21.62
Options cancelled (950,795) $ 43.17 (880,477) $ 42.71
Balance, end of year 20,946,092 $ 38.05 20,374,871 $ 35.96
The weighted average exercise price of the options granted in fiscal 2020 is $45.30 which corresponds to the weighted average market price for the five trading days immediately preceding the date of the grant ($41.02 in fiscal 2019).
The weighted average fair value of options granted in fiscal 2020 was estimated at $7.67 per option ($7.12 in fiscal 2019), using the Black-Scholes option pricing model with the following assumptions:
March 31, 2020 March 31, 2019
Weighted average:
Risk-free interest rate 1.61 % 1.95 %
Expected life of options 6.2 years 5.6 years
Volatility1 18.41 % 18.42 %
Dividend rate 1.45 % 1.54 % 1 The expected volatility is based on the historic share price volatility over a period similar to the life of the options.
A compensation expense of $23.7 million ($21.3 million net of taxes) relating to stock options was recorded in the consolidated income statements for the year ended March 31, 2020. A compensation expense of $25.1 million ($22.7 million net of taxes) relating to stock options was recorded in the consolidated income statements for the year ended March 31, 2019.
Options to purchase 4,637,830 common shares at a price of $33.35 per share were granted on April 1, 2020.
DEFERRED SHARE UNIT PLAN FOR DIRECTORS In accordance with the DSU plan, all eligible Directors of the Company are allocated an annual retainer payable 50% in DSUs and 50% in cash or 100% in DSUs, at the election of the Director. Until the ownership threshold is met by the Director, the Director must receive the entire compensation in DSUs. The number of DSUs granted quarterly to each Director is determined based on the market value of the Company’s common shares at the date of each grant. When they cease to be a Director of the Company, a cash payment equal to the market value of the accumulated DSUs will be disbursed. The liability relating to these units is adjusted by taking the number of units outstanding multiplied by the market value of common shares at the Company’s year-end. The Company includes the cost of the DSU plan in “Operating costs excluding depreciation and amortization”.
2020 2019
Units Liability Units Liability
Balance, beginning of year 349,648 $ 15.9 294,630 $ 12.2
Annual retainer 48,185 1.8 50,047 2.1
Dividends reinvested 6,186 0.2 4,971 0.2
Variation due to change in stock price - (4.2) - 1.4
Balance, end of year 404,019 $ 13.7 349,648 $ 15.9
The Company enters into equity forward contracts in order to mitigate the compensation costs associated with its DSU plan. As at March 31, 2020, the Company had equity forward contracts on 320,000 common shares (320,000 as of March 31, 2019) with a notional value of $13.1 million ($13.5 million as of March 31, 2019). The net compensation expense related to the DSU plan was $2.0 million for the year ended March 31, 2020 ($2.9 million for March 31, 2019), including the effect of the equity forward contracts.

ANNUAL REPORT 2020
- 73 -
NOTE 14 SHARE CAPITAL (CONT’D)
PERFORMANCE SHARE UNIT PLAN The Company offers senior-level management a performance share unit (PSU) plan to form part of long-term incentive compensation. The PSU plan is non-dilutive and is settled in cash only. Under the PSU plan, each performance cycle shall consist of three fiscal years of the Company. At the time of the grant of a PSU, the Company determines the performance criteria which must be met by the Company. The Corporate Governance and HR Committee has discretion to award compensation absent the achievement of the vesting criteria established. Following completion of a three-year performance cycle, the PSUs for which the performance criteria have been achieved will vest and the value that will be paid out is the price of the common shares at such time, multiplied by the number of PSUs for which the performance criteria have been achieved. The amount potentially payable to eligible employees is recognized as a payable and is revised at each reporting period. The expense is included in employee benefits under the “Operating costs excluding depreciation and amortization” caption.
2020
Units
2019
Units
Balance, beginning of year 770,922 771,707
Annual grant 313,273 298,819
Cancelled (27,379) (30,809)
Payment (237,160) (268,795)
Balance, end of year 819,656 770,922 As at March 31, 2020, a long-term obligation related to PSUs of $13.6 million was recorded ($17.9 million as at March 31, 2019) in addition to $6.5 million that was recorded in short-term liabilities ($10.7 million as at March 31, 2019). On April 1, 2020, 501,811 PSUs were granted at a price of $33.35 per unit ($45.30 in 2019).
The Company enters into equity forward contracts in order to mitigate the compensation costs associated with its PSU plan. As at March 31, 2020, the Company had equity forward contracts on 770,000 common shares (770,000 as of March 31, 2019) with a notional value of $31.3 million ($34.7 million as of March 31, 2019). The net compensation expense related to PSUs was $10.2 million for the year ended March 31, 2020 ($10.8 million for the year ended March 31, 2019), including the effect of the equity forward contracts.
RESTRICTED SHARE UNIT PLAN The Company also offers a restricted share unit (RSU) plan to form part of long-term incentives compensation for senior-level management. The RSU plan is non-dilutive and is settled in cash only. Under the RSU plan, each restriction period shall consist of three fiscal years of the Company. At the time of the grant of a RSU, the Company determines the vesting criteria which must be met by the participants. Such criteria may include, without limitation, continuing employment through all or part of the restriction period. The Corporate Governance and HR Committee has discretion to award compensation absent the achievement of the vesting criteria established. Following completion of a three-year restriction period, the RSUs for which the vesting criteria have been achieved will vest and the value that will be paid out is the price of the common shares at such time, multiplied by the number of RSUs for which the vesting criteria have been achieved. The amount potentially payable to eligible employees will be recognized as a payable and will be revised at each reporting period. The expense will be included in employee benefits under the “Operating costs excluding depreciation and amortization” caption.
On April 1, 2020, 205,119 RSUs were granted at a price of $33.35 per unit. During fiscal 2019, 132,967 RSUs were granted at a price of $45.30 per unit. The compensation expense related to RSUs was $1.5 million for the year ended March 31, 2020 ($nil in 2019).
DIVIDENDS AND DIVIDEND REINVESTMENT PLAN During the year ended March 31, 2020, the Company paid dividends totalling $269.7 million, or $0.68 per share ($254.6 million, or $0.66 per share for the year ended March 31, 2019).
The Company implemented a dividend reinvestment plan (DRIP) effective as of May 28, 2020. The DRIP provides eligible shareholders with the opportunity to have all or a portion of their cash dividends automatically reinvested into additional common shares (Reinvestment Shares). Participants in the DRIP will, until further notice, acquire Reinvestment Shares issued from treasury at a price equal to the volume weighted average price of the Company’s common shares on the Toronto Stock Exchange during the five trading days immediately preceding the dividend payment date, less a discount of 2%.

ANNUAL REPORT 2020
- 74 -
NOTE 15 OTHER FINANCIAL CHARGES
2020 2019
Finance costs $ 42.1 $ 23.1
Interest on lease liabilities 16.1 -
Finance income (5.2) (5.4)
Net interest revenue from defined benefit obligation (Note 19) (5.6) $ 47.4 $ 17.7
NOTE 16 INCOME TAXES
Income tax expense is comprised of the following:
2020 2019
Current tax expense $ 145.1 $ 177.4
Deferred tax expense 71.4 52.9
Income tax expense $ 216.5 $ 230.3
RECONCILIATION OF THE EFFECTIVE TAX RATE The effective income tax rate was 27.1% in 2020 (23.4% in 2019). The Company’s income tax expense differs from the one calculated by applying Canadian statutory rates for the following reasons:
2020 2019
Earnings before tax $ 799.3 $ 985.6
Income taxes, calculated using Canadian statutory income tax rates of 26.3% (26.4% in 2019)
209.9 260.4
Adjustments resulting from the following:
Effect of tax rates for foreign subsidiaries 5.7 1.8
Changes in tax laws and rates 7.1 2.4
Benefit arising from investment in subsidiaries (9.1) (13.9)
Manufacturing and processing deduction (0.8) (0.4)
Stock-based compensation 3.8 4.0
Disposal of asset held for sale 1.3 (25.8)
Tax losses for which no deferred income tax asset was recognized - 0.8
Adjustments in respect of prior years and other (1.4) 1.0
Income tax expense $ 216.5 $ 230.3
INCOME TAX RECOGNIZED IN OTHER COMPREHENSIVE INCOME Income tax on items recognized in other comprehensive income in 2020 and 2019 were as follows:
2020 2019
Deferred tax expense (benefit) on actuarial losses on employee benefit obligations $ 16.9 $ (0.8)
Deferred tax expense (benefit) on cash flow hedge (14.1) 0.5
Total income tax expense recognized in other comprehensive income $ 2.8 $ (0.3)

ANNUAL REPORT 2020
- 75 -
NOTE 16 INCOME TAXES (CONT’D)
INCOME TAX RECOGNIZED IN EQUITY Income tax on items recognized in equity in 2020 and 2019 were as follows:
2020 2019
Excess tax benefit that results from the excess of the deductible amount over the stock-based compensation recognized in net earnings $ (2.2) $ (4.7)
Total income tax benefit recognized in equity $ (2.2) $ (4.7)
CURRENT TAX ASSETS AND LIABILITIES 2020 2019
Income taxes receivable $ 50.3 $ 34.1
Income taxes payable (51.4) (36.5)
Income taxes (payable) receivable (net) $ (1.1) $ (2.4)
DEFERRED TAX ASSETS AND LIABILITIES The deferred income taxes are presented as follows on the consolidated statements of financial position, as at March 31:
2020 2019
Deferred tax assets $ 50.7 $ 51.0
Deferred tax liabilities (759.6) (502.3)
Deferred tax liabilities (net) $ (708.9) $ (451.3)
The movement of deferred tax assets and liabilities are shown below:
For the year ended March 31, 2020
Accounts payable and
accrued liabilities
Income tax
losses
Net assets of pension
plans
Inventories Property, plant and
equipment
Other Net deferred tax liabilities
Balance, beginning of the year $ 58.1 $ 1.1 $ 9.3 $ 1.2 $ (274.8) $ (246.2) $ (451.3)
Charged/credited to net earnings 8.4 11.2 (6.9) 3.0 (43.1) (44.0) (71.4)
Charged/credited to other comprehensive income - - (16.9) - - 14.1 (2.8)
Acquisitions 3.6 29.7 (48.1) (8.7) (6.4) (122.9) (152.8)
Translation and other (2.1) 0.3 - (0.5) (12.7) (15.6) (30.6)
Balance, end of the year $ 68.0 $ 42.3 $ (62.6) $ (5.0) $ (337.0) $ (414.6) $ (708.9)
For the year ended March 31, 2019
Accounts payable and
accrued liabilities
Income tax
losses
Net assets of pension
plans
Inventories Property, plant and
equipment
Other Net deferred tax liabilities
Balance, beginning of the year $ 45.7 $ 6.4 $ 8.1 $ 2.4 $ (241.6) $ (211.4) $ (390.4)
Charged/credited to net earnings (2.7) (5.3) 0.3 (0.2) (6.7) (38.3) (52.9)
Charged/credited to other comprehensive income - - 0.8 - - (0.5) 0.3
Acquisitions 16.7 - - - (7.5) 5.9 15.1
Translation and other (1.6) - 0.1 (1.0) (19.0) (1.9) (23.4)
Balance, end of the year $ 58.1 $ 1.1 $ 9.3 $ 1.2 $ (274.8) $ (246.2) $ (451.3)
As at March 31, 2020, the Company had $253.4 million in capital losses for which no deferred tax assets had been recognized. These capital losses can be carried forward indefinitely but can only be used against future taxable capital gains.

ANNUAL REPORT 2020
- 76 -
NOTE 17 NET EARNINGS PER SHARE
2020 2019
Net earnings $ 582.8 $ 755.3
Weighted average number of common shares outstanding 400,328,334 388,554,458
Dilutive options 2,121,698 2,696,750
Weighted average diluted number of common shares outstanding 402,450,032 391,251,208
Basic net earnings per share $ 1.46 $ 1.94
Diluted net earnings per share $ 1.45 $ 1.93
When calculating diluted net earnings per share for the year ended March 31, 2020, 13,762,608 options were excluded from the calculation because their exercise price is higher than the average market value of common shares (7,270,893 options, were excluded for the year ended March 31, 2019).
Shares purchased under the normal course issuer bid, if any, are excluded from the calculation of net earnings per share as of the date of purchase.
NOTE 18 BUSINESS ACQUISITIONS
LION DAIRY & DRINKS PTY LTD On October 28, 2019, the Company acquired the specialty cheese business of Lion Dairy & Drinks Pty Ltd (the Specialty Cheese Business). The Specialty Cheese Business is conducted at two manufacturing facilities located in Burnie and King Island, Tasmania (Australia) and employs approximately 400 people. The Specialty Cheese Business produces, markets and distributes a variety of specialty cheeses under a wide portfolio of Australian brands, including South Cape, Tasmanian Heritage, Mersey Valley and King Island Dairy.
The purchase price of $248.1 million (AU$277.9 million), on a cash-free and debt-free basis, was paid in cash from cash on hand and available credit facilities. In connection with this acquisition, the Company incurred acquisition-related costs of approximately $9 million mainly comprised of stamp duty taxes.
The purchase price allocation is dependent upon certain valuations, assumptions, judgments and estimates. At this time, the Company is still gathering information in order to make a definitive allocation. The final allocation of the purchase price may vary from the preliminary allocation presented below.
DAIRY CREST GROUP PLC On April 15, 2019, the Company completed the acquisition of Dairy Crest Group plc (Dairy Crest), based in the United Kingdom. Dairy Crest manufactures and markets cheese, butter, spreads, oils, and value-added dairy ingredients. The acquisition enables Saputo to enter the UK market.
The total consideration of $2.122 billion (£1.218 billion), was financed through the Dairy Crest Acquisition Facility (Note 12) and available cash. This consideration includes the purchase price for the entire issued ordinary share capital of $1.695 billion (£973.1 million) and $426.8 million (£245.1 million) of assumed debt.

ANNUAL REPORT 2020
- 77 -
NOTE 18 BUSINESS ACQUISITIONS (CONT’D)
The allocation of each purchase price is presented below.
April 15 Dairy
Crest
October 28 Specialty Cheese
Business Fiscal 2020
Total
Assets acquired Cash $ 7.0 $ 13.0 $ 20.0
Receivables 54.6 36.9 91.5
Inventories 369.4 45.8 415.2
Income taxes receivable 1.5 - 1.5
Prepaid expenses and other assets 12.1 0.4 12.5
Property, plant and equipment 369.1 178.6 547.7
Right-of-use assets 73.4 - 73.4
Goodwill 541.5 - 541.5
Intangible assets 802.8 4.7 807.5
Other assets 283.1 2.6 285.7
Liabilities assumed Accounts payable and accrued liabilities (151.7) (27.5) (179.2)
Lease liabilities (70.4) - (70.4)
Other liabilities (8.3) (6.4) (14.7)
Long-term debt (436.6) - (436.6)
Deferred income taxes (152.8) - (152.8)
Net assets acquired $ 1,694.7 $ 248.1 $ 1,942.8
Other assets listed above are comprised of the acquired net pension surplus of $283.1 million (£162.6 million) on the acquisition date. As at April 15, 2019, the fair value of plan assets and defined benefit pension plan obligations were $2.031 billion (£1.166 billion) and $1.748 billion (£1.004 billion), respectively. The plan assets are composed mainly of bonds and cash. The value of the defined benefit pension plan obligations was calculated using a discount rate of 2.6%. For further detail on the plan assets, please refer to Note 19. The Company recorded charges of $40.1 million during fiscal 2020, related to the non-cash fair value inventory adjustment as part of the Dairy Crest Acquisition purchase price allocation. In connection with this acquisition, the Company incurred acquisition-related costs of approximately $23 million, which includes approximately $9 million in stamp duty taxes.
Recognized goodwill reflects the value assigned to the European platform enabling growth and an assembled workforce within the Dairy Division (UK) CGU.
F&A DAIRY PRODUCTS, INC. On November 30, 2018, the Company completed the acquisition of the activities of F&A Dairy Products, Inc. (F&A). Its activities are currently conducted at a manufacturing facility located in Las Cruces, New Mexico, and until May 2019, activities were also conducted at a facility in Dresser, Wisconsin (USA). F&A manufactures a variety of natural cheeses, including mozzarella and provolone, which are distributed in the United States and Mexico.
The purchase price of $108.1 million (US$81.4 million), on a debt-free basis, was paid in cash from cash on hand and available credit facilities.
Recognized goodwill reflects the value assigned to expected future synergies and an assembled workforce within the Cheese Division (USA) CGU. The purchase price allocation was completed in the first quarter of fiscal 2020.
SHEPHERD GOURMET DAIRY (ONTARIO) INC. On June 19, 2018, the Company completed the acquisition of the activities of Shepherd Gourmet Dairy (Ontario) Inc. (Shepherd Gourmet). Its activities are conducted at one manufacturing facility located in St. Marys, Ontario (Canada). Shepherd Gourmet manufactures, markets and distributes a variety of specialty cheeses, yogurt, as well as Skyr Icelandic-style yogurt in Canada.
The purchase price was $99.8 million, on a debt-free-basis, of which $89.8 million was paid in cash from cash on hand and available credit facilities.
Recognized goodwill reflects the value assigned to expected future synergies and an assembled workforce within the Dairy Division (Canada) CGU.

ANNUAL REPORT 2020
- 78 -
NOTE 18 BUSINESS ACQUISITIONS (CONT’D)
MURRAY GOULBURN CO-OPERATIVE CO. LIMITED On May 1, 2018, the Company completed the acquisition of the business of Murray Goulburn Co-Operative Co. Limited (Murray Goulburn or MG), based in Australia. The MG acquisition complements the activities of the Dairy Division (Australia) and enables the Company to strengthen its presence in Australia. MG produces a full range of dairy foods, including fluid milk, milk powder, cheese, butter and dairy beverages, as well as a range of ingredient and nutritional products, such as infant formula. MG supplies the retail and foodservice industries globally with its flagship Devondale, Liddells and Murray Goulburn Ingredients brands.
The purchase price for the transaction was $1.276 billion (AU$1.311 billion) on a debt-free basis and was financed through the MG Acquisition Facility (Note 12). Included in the purchase price, the Company assumed liabilities of $76.7 million.
On August 17, 2018, the Company completed the sale of the Koroit plant in Victoria for a selling price of $239.7 million (AU$250.9 million). This divestiture was required pursuant to the undertaking entered into with the Australian Competition and Consumer Commission in connection with the acquisition of the activities of MG. The assets held for sale of the Koroit plant included inventory, property, plant and equipment and intangible assets. These assets were valued at fair value less costs to sell. There was no gain or loss related to this transaction.
Recognized goodwill reflects the value assigned to expected future synergies and an assembled workforce within the Dairy Division (Australia) CGU.
The allocation of each purchase price is presented below.
Murray
Goulburn Shepherd Gourmet F&A
Fiscal 2019 Total
Assets acquired Cash $ 7.4 $ - $ - $ 7.4
Receivables 244.8 5.1 18.5 268.4
Inventories 382.9 3.2 8.7 394.8
Prepaid expenses and other assets 10.4 0.5 0.1 11.0
Assets held for sale 240.3 - - 240.3
Property, plant and equipment 632.1 12.8 60.0 704.9
Goodwill 10.5 78.3 37.7 126.5
Intangible assets 38.9 5.2 - 44.1
Other assets 3.9 - - 3.9
Deferred income taxes 16.6 - - 16.6
Liabilities assumed Accounts payable and accrued liabilities (280.9) (3.7) (15.4) (300.0)
Other liabilities (30.6) - (1.5) (32.1)
Deferred income taxes - (1.6) - (1.6)
Net assets acquired and total consideration $ 1,276.3 $ 99.8 $ 108.1 $ 1,484.2

ANNUAL REPORT 2020
- 79 -
NOTE 19 EMPLOYEE POST-EMPLOYMENT BENEFIT PLANS
The Company sponsors various post-employment benefit plans. These include both defined contribution and defined benefit pension plans, and other post-employment benefit plans.
DEFINED CONTRIBUTION PLANS The Company offers and participates in defined contribution pension plans of which 99% of its active employees are members. The net pension expense under these types of plans is generally equal to the contributions made by the employer and constitutes an expense for the year in which they are due. For fiscal 2020, the defined contribution expenses for the Company amounted to $71.7 million ($63.4 million in fiscal 2019). The Company expects to contribute approximately $73.8 million to its defined contribution plans for fiscal 2021.
DEFINED BENEFIT PLANS The Company offers and participates in defined benefit pension plans in which the remaining active employees are members. Under the terms of the defined benefit pension plans, pensions are based on years of service and the retirement benefits are up to 2% of the average eligible earnings of the last employment years multiplied by years of credited service.
There are no active employees in the Dairy Division (UK) Defined Benefit Pension Fund, which is a final salary scheme in the UK that was closed to future service accrual from April 1, 2010 and had been closed to new joiners from June 30, 2006. The Fund is administered by a corporate trustee which is legally separate from the Company; the directors of the corporate trustee comprise representatives of both the employer and employees as well as a professional trustee. The corporate trustee is responsible for the day to day administration of the benefits and the Investment Policy.
The registered pension plans must comply with statutory funding requirements in the jurisdiction in which they are registered. Funding valuations are required on an annual or triennial basis, depending on the jurisdiction, and employer contributions must include amortization payments for any deficit, over a period of 5 to 15 years. Contribution holidays are allowed and subject to certain thresholds. Other non-registered pension plans and benefits other than pension are not subject to any minimum funding requirements.
The cost of pension benefits earned by employees is actuarially determined using the projected unit credit method and using a discount rate based on high quality corporate bonds and Management’s assumptions bearing on, among other things, rates of compensation increase and retirement age of employees. All of these estimates and assessments are formulated with the help of external consultants. The plan assets and benefit obligations were valued as at March 31 with the assistance of the Company’s external actuaries. The Company also offers complementary retirement benefits programs, such as health insurance, life insurance and dental plans to eligible employees and retired employees. The Company expects to contribute approximately $3.7 million to its defined benefit plans in 2021.
The principal risks associated with the Company's defined benefit pension plans are as follows:
Investment risk The respective present values of the defined benefit plans’ obligations are calculated using a discount rate determined with reference to high-quality corporate bond yields; if assets underperform this yield, this will create a deficit.
Changes in Bond Yields A decrease in the corporate bond yields will increase the value of the defined benefit plans’ liabilities although this will be partially offset by an increase in the value of the defined benefit plans’ debt securities holdings.
Inflation Risk A significant portion of the defined benefit plans’ obligations are linked to inflation, and higher expected future inflation will lead to higher liabilities. The majority of the assets are either unaffected by or only loosely correlated with inflation, meaning that an increase in expected future inflation will also increase the deficit.
Longevity Risk The majority of the defined benefit plans’ obligations are to provide benefits for the life of the member; increases in life expectancy of plan participants will result in an increase in liabilities.

ANNUAL REPORT 2020
- 80 -
NOTE 19 EMPLOYEE POST-EMPLOYMENT BENEFIT PLANS (CONT’D)
The Company’s net surplus (liability) for defined benefit pension plans comprises the following:
March 31, 2020 March 31, 2019
Dairy Division (UK) Defined
Benefit Pension Fund Other Plans Total Total
Fair value of assets $ 2,114.5 63.7 2,178.2 $ 66.3
Present value of funded obligations 1,733.3 66.3 1,799.6 71.2
Present value of net surplus (obligations) for funded plans 381.2 (2.6) 378.6 (4.9)
Present value of unfunded obligations - (34.0) (34.0) (30.9)
Present value of net surplus (obligations) 381.2 (36.6) 344.6 (35.8)
Asset ceiling test - (0.3) (0.3) (0.8)
Accrued pension/benefit cost 381.2 (36.9) 344.3 (36.6)
Presented in the statement of financial position as follows:
Other Assets (Note 10) $ 381.2 $ -
Other Liabilities (Note 13) (36.9) (36.6)
Total net surplus (liability) $ 344.3 $ (36.6)
The changes in the present value of the defined benefit obligations are as follows:
March 31, 2020 March 31, 2019
Dairy Division (UK) Defined
Benefit Pension Fund Other Plans Total Total
Defined benefit obligation, beginning of year $ - 102.1 102.1 $ 99.3
Dairy Crest Acquisition (Note 18) 1,747.7 - 1,747.7 -
Current service costs - 5.8 5.8 5.2
Interest cost 41.4 3.3 44.7 3.5
Actuarial (gains) losses due to change in experience (5.4) 0.4 (5.0) 0.1
Actuarial (gains) losses due to changes in financial assumptions 17.7 (7.1) 10.6 3.3
Actuarial losses due to changes in demographic assumptions - - - (0.1)
Effects of settlement1 - - - (5.6)
Exchange differences 4.2 0.5 4.7 0.5
Benefits paid (72.3) (4.7) (77.0) (4.1)
Defined benefit obligation, end of year $ 1,733.3 100.3 1,833.6 $ 102.1 1 Annuities were purchased to release the plan from its liability with regards to retirees.

ANNUAL REPORT 2020
- 81 -
NOTE 19 EMPLOYEE POST-EMPLOYMENT BENEFIT PLANS (CONT’D)
The changes in the fair value of plan assets are as follows: March 31, 2020 March 31, 2019
Dairy Division (UK) Defined
Benefit Pension Fund
Other Plans Total Total
Fair value of plan assets, beginning of year $ - 66.3 66.3 $ 67.0
Dairy Crest Acquisition (Note 18) 2,030.8 - 2,030.8 -
Interest income on plan assets 48.1 2.2 50.3 2.3
Return on plan assets, excluding interest income 89.7 (4.3) 85.4 0.5
Administration costs (1.4) (0.2) (1.6) (0.3)
Contributions by employer 11.3 4.4 15.7 6.4
Effects of settlement1 - - - (5.7)
Exchange differences 8.3 - 8.3 0.2
Benefits paid (72.3) (4.7) (77.0) (4.1)
Fair value of plan assets, end of year $ 2,114.5 63.7 2,178.2 $ 66.3 1 Annuities were purchased to release the plan from its liability with regards to retirees.
For fiscal 2020, actual return on plan assets amounted to a gain of $134.1 million ($2.5 million in fiscal 2019). The fair value of plan assets, which does not include assets of the Company, consist of the following (all assets have a quoted market value in an active market with the exception of property, annuity policy, which is valued based on the corresponding liability, and cash). March 31, 2020 March 31, 2019
Dairy Division (UK) Defined
Benefit Pension Fund
Other Plans Total Total
Bonds, LDI and cash¹ $ 1,431.5 49.0 1,480.5 $ 50.4
Annuity contract 422.9 - 422.9 -
Property and other 260.1 - 260.1
Equity Instruments - 14.7 14.7 15.9
Total $ 2,114.5 63.7 2,178.2 $ 66.3 1 The Liability Driven Investment ('LDI') portfolio is managed by an external party. The objective is to hedge a proportion of the Fund's liabilities against
changes in interest rates and inflation expectations by investing in assets that are similarly sensitive to changes in interest rates and inflation expectations. Market yields are monitored against a number of pre-set yield triggers; the level of hedging will be increased as and when triggers are met.

ANNUAL REPORT 2020
- 82 -
NOTE 19 EMPLOYEE POST-EMPLOYMENT BENEFIT PLANS (CONT’D)
The Consolidated Income Statements include the following:
March 31, 2020 March 31, 2019
Dairy Division (UK) Defined
Benefit Pension Fund
Other Plans Total Total
Recognized in “Operating costs excluding depreciation and amortization” (Note 6):
Employer current service cost $ - 5.8 5.8 $ 5.2
Effect of settlement - - - 0.1
Administration costs 1.4 0.2 1.6 0.3
1.4 6.0 7.4 5.6
Recognized in “Other financial charges” (Note 15):
Interest costs 41.4 3.3 44.7 3.4
Interest income on plan assets (48.1) (2.2) (50.3) (2.3)
(6.7) 1.1 (5.6) 1.1
Net defined benefits plans expense $ (5.3) 7.1 1.8 $ 6.7 The Company recognizes actuarial gains and losses in the period in which they occur, for all its defined benefit plans. These actuarial gains and losses are recognized in other comprehensive income and are presented below:
March 31, 2020 March 31, 2019
Dairy Division (UK) Defined
Benefit Pension Fund
Other
Plans Total Total
Return on plan assets (excluding interest income) $ 89.7 (4.3) 85.4 $ 0.5
Actuarial gains (losses) due to change in experience 5.4 (0.4) 5.0 (0.1)
Actuarial gains due to changes in demographic assumptions - - - 0.1
Actuarial gains (losses) due to changes in financial assumptions (17.7) 7.1 (10.6) (3.3)
Effect of the asset ceiling test - 0.6 0.6 -
Amount recognized in other comprehensive income $ 77.4 3.0 80.4 $ (2.8)

ANNUAL REPORT 2020
- 83 -
NOTE 19 EMPLOYEE POST-EMPLOYMENT BENEFIT PLANS (CONT’D) Weighted average assumptions used in computing the benefit obligations at the financial position date are as follows:
March 31, 2020 March 31, 2019
Dairy Division (UK) Defined
Benefit Pension Fund Other Plans Other Plans
Discount rate 2.30 % 3.83% 3.36 %
Duration of the obligation 18.00 17.68 18.40
Inflation Rate 1.80 % 2.0% 2.0 %
Future salary increases n/a 3.0% 3.00 %
Mortality table
S2P base tables with the following
scaling factors: Pens (M/F): 109%/103%
Defs (M/F):
110%/99%
2014 Private Sector Canadian
Pensioners’ Mortality Table,
projected generationally
using Scale MI-2017
2014 Private Sector Canadian
Pensioners’ Mortality Table,
projected generationally
using Scale MI-2017
It has been assumed that the Dairy Division (UK) Defined Benefit Pension Fund members exchange 25% of their pension for a cash lump sum at retirement, on terms 8% lower than the funding basis. 30% of deferred members are assumed to take a pension increase exchange option at retirement which is available under the Fund.
SENSITIVITY TO CHANGES IN ASSUMPTIONS The impact of an increase (decrease) of 0.1% of the discount rate would be a decrease of $27.3 million of the amount of the obligation (increase of $34.4 million). A one-year increase in life expectancy would increase the obligation by approximately $90.7 million. Specifically, for the Dairy Division (UK) Defined Benefit Penson Fund, the impact of an increase of 0.1% of the inflation rate would be an increase of approximately $26.2 million of the amount of the obligation. Specifically pertaining to the Other plans, an increase of 0.1% of the percentage of future salary increases would be an increase of approximately $0.4 million of the amount of the obligation.

ANNUAL REPORT 2020
- 84 -
NOTE 20 COMMITMENTS AND CONTINGENCIES
COMMITMENTS The table and paragraphs below present the future minimum payments for contractual commitments that are not recognized as liabilities for the next fiscal years:
Leases¹ Purchase obligations2 Total
Less than 1 year $ 9.2 $ 196.5 $ 205.7
1-2 years 6.8 20.4 27.2
2-3 years 3.4 16.2 19.6
3-4 years 0.9 6.5 7.4
4-5 years 0.4 6.0 6.4
More than 5 years 0.1 7.9 8.0
$ 20.8 $ 253.5 $ 274.3 1 Commitments related to leases represent short-term and low-value leases that do not meet the definition of a lease under IFRS 16
2 Purchase obligations are the contractual obligations for capital expenditures and service agreements to which the Company is committed.
CLAIMS The Company is a defendant to certain claims arising from the normal course of its business. The Company is also a defendant in certain claims and/or assessments from tax authorities in various jurisdictions. The Company believes that the final resolution of these claims and/or assessments will not have a material adverse effect on its consolidated income statements or consolidated statement of financial position.
INDEMNIFICATIONS The Company from time to time offers indemnifications to third parties in the normal course of its business, in connection with business or asset acquisitions or disposals. These indemnification provisions may be in connection with breach of representations and warranties, and for future claims for certain liabilities. The terms of these indemnification provisions vary in duration. At March 31, 2020, given that the nature and amount of such indemnifications depend on future events, the Company is unable to reasonably estimate its maximum potential liability under these agreements. The Company has not made any significant indemnification payments in the past, and as at March 31, 2020, and March 31, 2019, the Company had not recorded any significant liabilities associated with these indemnifications.
LETTERS OF CREDIT As at March 31, 2020, the Company had issued letters of credit in an aggregate amount of $63.2 million pursuant to a banking facility authorizing the issuance of letters of credit in an aggregate amount of $110.1 million (as at March 31, 2019, the Company had issued letters of credit in an aggregate amount of $58.4 million pursuant to a banking facility authorizing the issuance of letters of credit in an aggregate amount of $109.5 million).

ANNUAL REPORT 2020
- 85 -
NOTE 21 RELATED PARTY TRANSACTIONS
The Company receives services from and provides goods to companies subject to control or significant influence through ownership by its principal shareholder. These transactions, which are not significant to the Company’s financial position or financial results, are made in the normal course of business and have been recorded at the fair value, consistent with market values for similar transactions. The services that are received consist mainly of travel, publicity, lodging, office space rental and management services. The goods that are provided consist mainly of dairy products.
Transactions with key management personnel (short-term employee benefits, post-employment benefits, stock-based compensation and payments under the DSU plan) are also considered related party transactions. Management defines key management personnel as all the executive officers who have responsibility and authority for controlling, overseeing and planning the activities of the Company, as well as the Company’s Directors.
Transactions with related parties are as follows:
2020 2019
Entities subject to control or significant influence through ownership by its principal shareholder $ 6.2 $ 5.9
Key management personnel
Directors 2.5 2.4
Executive officers 32.4 26.0
$ 41.1 $ 34.3
Dairy products provided by the Company were the following:
2020 2019
Entities subject to control or significant influence through ownership by its principal shareholder $ 0.3 $ 0.3
Outstanding receivables and accounts payable and accrued liabilities for the transactions above are the following:
Receivables Accounts payable and
accrued liabilities
March 31, 2020 March 31, 2019 March 31, 2020 March 31, 2019
Entities subject to control or significant influence through ownership by its principal shareholder $ 0.1 $ 0.1 $ 0.2 $ 0.2
Key management personnel
Directors - - 13.7 15.9
Executive officers - - 39.7 33.7
$ 0.1 $ 0.1 $ 53.6 $ 49.8
The amounts payable to the Directors consist entirely of balances payable under the Company’s DSU plan. Refer to Note 14 for further details. The amounts payable to executive officers consist of short-term employee incentives, share-based awards, and post-retirement benefits.

ANNUAL REPORT 2020
- 86 -
NOTE 21 RELATED PARTY TRANSACTIONS (CONT’D)
KEY MANAGEMENT PERSONNEL COMPENSATION The compensation expense for transactions with the Company’s key management personnel consists of the following:
2020 2019
Directors
Cash-settled payments $ 0.4 $ 0.1
Stock-based compensation 2.1 2.3
$ 2.5 $ 2.4
Executive officers
Short-term employee benefits 16.4 12.1
Post-employment benefits 3.1 3.3
Stock-based compensation 12.9 10.6
$ 32.4 $ 26.0
Total compensation $ 34.9 $ 28.4
SUBSIDIARIES All the Company’s subsidiaries are wholly owned. The following information summarizes the Company’s significant subsidiaries which produce a wide array of dairy products including cheese, fluid milk, extended shelf-life milk and cream products, cultured products, and dairy ingredients:
Percentage Owned Location
Saputo Dairy Products Canada G.P. 100.00% Canada
Saputo Cheese USA Inc. 100.00% USA
Saputo Dairy Foods USA, LLC 100.00% USA
Saputo Dairy Australia Pty LTD 100.00% Australia
Warrnambool Cheese and Butter Factory Company Holdings Limited 100.00% Australia
Lion Dairy & Drinks Pty Ltd 100.00% Australia
Molfino Hermanos S.A. 100.00% Argentina
Dairy Crest Ltd 100.00% UK
ANNUAL REPORT 2020
- 87 -
NOTE 22 FINANCIAL INSTRUMENTS
In the normal course of business, the Company uses various financial instruments which by their nature involve risk, including credit risk, liquidity risk, interest rate risk, foreign exchange risk and price risk (including commodity price risk). These financial instruments are subject to normal credit conditions, financial controls and risk management and monitoring strategies.
Occasionally, the Company may enter into derivative financial instrument transactions in order to mitigate or hedge risks in accordance with risk management strategies. The Company does not enter into these arrangements for speculative purposes.
CREDIT RISK Financial instruments that potentially subject the Company to concentrations of credit risk consist of cash equivalents and receivables.
Cash equivalents consist mainly of short-term investments. The Company has deposited these cash equivalents in reputable financial institutions.
The Company also offers credit to its customers in the normal course of business for trade receivables. Credit valuations are performed on a regular basis and reported results take into account expected credit losses.
Due to its large and diverse customer base and its geographic diversity, the Company has low exposure to credit risk concentration with respect to customer’s receivables. There are no receivables from any individual customer that exceeded 10% of the total balance of receivables as at March 31, 2020, and March 31, 2019. No customer represented more than 10% of total consolidated revenues for the fiscal years ended March 31, 2020, and March 31, 2019.
Allowances for expected credit loss are reviewed by Management at each financial position date. The Company updates its estimate of the allowance for expected credit loss based on the evaluation of the recoverability of trade receivables with each customer base, taking into account historical collection trends of past due accounts and current economic conditions. The accounts receivable from our export sales benefit from payment terms that are longer than our standard payment terms applicable to domestic sales.
The amount of the allowance for expected credit loss is sufficient to cover the carrying amount of receivables considered past due and at risk. The amount of the loss is recognized in the consolidated income statements within operating costs. Subsequent recoveries of amounts previously written off are credited against operating costs in the consolidated income statements. However, Management does not believe that these allowances are significant.
LIQUIDITY RISK Liquidity risk is the risk that the Company will not be able to meet its financial obligations as they fall due. The Company manages liquidity risk through the management of its capital structure and financial leverage, as outlined in Note 23 relating to capital disclosures. It also manages liquidity risk by continuously monitoring actual and projected cash flows. The Board of Directors reviews and approves the Company’s operating and capital budgets, as well as any material transactions out of the normal course of business.
Contractual maturities for the significant financial liabilities as at March 31, 2020, are as follows: accounts payable and accrued liabilities, bank loans, lease liabilities and long-term debt. All items included in accounts payable and accrued liabilities are less than one year. For maturities on bank loans, lease liabilities and the long-term debt, please refer to Note 11, Note 8, and Note 12, respectively.
INTEREST RATE RISK The Company is exposed to interest rate risks through its financial obligations that bear variable interest rates. Bank loans and unsecured bank term loans facilities bear interest at fluctuating rates and thereby expose the Company to interest rate risk on cash flows associated to interest payments. The senior notes bear interest at fixed rates and, as a result, no interest rate risk exists on these cash flows.
For the fiscal year ended March 31, 2020, the interest expense on long-term debt totalled $95.6 million ($66.6 million in fiscal 2019). The interest accrued as at March 31, 2020, was $13.2 million ($11.0 million as at March 31, 2019).
As at March 31, 2020, the net amount exposed to short-term rates fluctuations was approximately $2,101.4 million. Based on this exposure, an assumed 1% increase in the interest rate would have an unfavourable impact of approximately $14.7 million on net earnings with an equal but opposite effect for an assumed 1% decrease.

ANNUAL REPORT 2020
- 88 -
NOTE 22 FINANCIAL INSTRUMENTS (CONT’D)
FOREIGN EXCHANGE RISK The Company operates internationally and is exposed to foreign exchange risk resulting from various foreign currency transactions. Foreign exchange transaction risk arises primarily from future commercial transactions that are denominated in a currency that is not the functional currency of the Company’s business unit that is party to the transaction, as well as the unsecured bank term loan facilities that can be drawn in US dollars, Australian dollars, Argentine Peso, British pounds sterling, and Japanese Yen. The Company enters into forward exchange contracts to sell US dollars and buy Australian dollars in order to mitigate market fluctuations in the USD/AUD exchange rates on receivables. Similarly, the Company also enters into forwards exchange contracts to sell EUR and buy GBP. During the fiscal year, the cash flow hedges were highly effective and accordingly, the Company recognized an unrealized loss of $30.6 million (net of tax of $11.9 million) in other comprehensive income as a result. A loss of $13.0 million (net of tax of $5.0 million) was reclassified to net earnings during fiscal 2020 related to these forward exchange contracts. These cash flow hedges were also deemed to be highly effective during fiscal 2019, and an unrealized loss of $10.9 million (net of tax of $4.7 million), was recorded in other comprehensive income. A loss of $9.9 million (net of tax of $4.2 million) was reclassified to net earnings during fiscal 2019 related to these forward exchange contracts. The Company entered into forward exchange contracts in order to offset market fluctuations in the USD/CAD exchange rates in connection with US dollar intercompany financing from our USA to Canada divisions. The foreign exchange hedges will settle in November 2020 for US$250.0 million. These cash flow hedges were highly effective and accordingly, the Company recognized an unrealized gain of $0.6 million (net of tax of $0.1 million) in other comprehensive income. During fiscal 2020, amounts reclassified to net earnings related to these forward exchange contracts were minimal. The Company’s largest exposure comes from the US dollar fluctuations. The following table details the Company’s sensitivity to a $0.10 weakening against the US dollar on net earnings and comprehensive income. For a $0.10 appreciation against the US dollar, there would be an equal and opposite impact on net earnings and comprehensive income.
2020 2019
Change in net earnings $ 18.5 $ 14.8
Change in comprehensive income $ 455.8 $ 310.6
COMMODITY PRICE RISK In certain instances, the Company enters into futures contracts to hedge against fluctuations in the price of commodities.
The Company applies hedge accounting for certain of these transactions. During the fiscal year, these hedges (designated as cash flow hedges) were highly effective and accordingly, an unrealized loss of $25.7 million (net of tax of $9.0 million) was recorded in other comprehensive income. The gains recorded in the consolidated statement of comprehensive income are transferred to the consolidated statement of net earnings when the related inventory is ultimately sold. These hedges (designated as cash flow hedges) were assessed to be highly effective and accordingly, an unrealized loss of $1.3 million (net of tax of $0.2 million) was recorded, during fiscal 2019, in other comprehensive income.
FAIR VALUE OF FINANCIAL INSTRUMENTS The Company has determined that the fair value of its financial assets and financial liabilities with short-term maturities approximates their carrying value. These financial instruments include cash and cash equivalents, receivables, bank loans, accounts payable and accrued liabilities. The table below shows the fair value and the carrying value of other financial instruments as at March 31, 2020, and March 31, 2019. Since estimates are used to determine fair value, they must not be interpreted as being realizable in the event of a settlement of the instruments.

ANNUAL REPORT 2020
- 89 -
NOTE 22 FINANCIAL INSTRUMENTS (CONT’D)
March 31, 2020 March 31, 2019
Fair value Carrying value Fair value Carrying value
Cash flow hedges
Commodity derivatives (Level 2) $ (28.7) $ (28.7) $ 0.3 $ 0.3
Foreign exchange derivatives (Level 2) (9.1) (9.1) 0.2 0.2
Derivatives not designated in a formal hedging relationship
Equity forward contracts (Level 2) (7.4) (7.4) 1.8 1.8
Commodity derivatives (Level 2) (10.1) (10.1) 0.3 0.3
Long-term debt (Level 2) $ 3,505.7 $ 3,542.2 $ 2,266.9 $ 2,267.3
Lease liabilities (Level 2) $ 414.8 $ 414.8 $ - $ -
The following table summarizes the financial instruments measured at fair value in the consolidated statement of financial position as at March 31, 2020 and March 31, 2019, classified using the fair value hierarchy described in Note 3.
March 31, 2020 Level 1 Level 2 Level 3 Total
Commodity futures contracts $ - $ (38.8) $ - $ (38.8)
Foreign exchange contracts - (9.1) - (9.1)
Equity forward contracts - (7.4) - (7.4)
$ - $ (55.3) $ - $ (55.3)
March 31, 2019 Level 1 Level 2 Level 3 Total
Commodity futures contracts $ - $ 0.6 $ - $ 0.6
Foreign exchange contracts - 0.2 - 0.2
Equity forward contracts - 1.8 - 1.8
$ - $ 2.6 $ - $ 2.6
For the years ended March 31, 2020, and 2019, there were no changes in valuation techniques and in inputs used in the fair value measurements and there were no transfers between the levels of the fair value hierarchy.
Fair values of other assets, long-term debt, lease liabilities, and derivative financial instruments are determined using discounted cash flow models based on market inputs prevailing at the financial position date and are also obtained from financial institutions. Where applicable, these models use market-based observable inputs including interest-rate-yield curves, volatility of certain prices or rates and credit spreads. If market based observable inputs are not available, judgment is used to develop assumptions used to determine fair values. The fair value estimates are significantly affected by assumptions including the amount and timing of estimated future cash flows and discount rates. The Company’s derivatives transactions are accounted for on a fair value basis.
NOTE 23 CAPITAL DISCLOSURES
The Company’s objective in managing capital is to ensure sufficient liquidity to pursue its growth strategies and undertake selective acquisitions, while at the same time taking a conservative approach towards financial leverage and management of financial risk. An additional objective includes a target for long-term leverage of 2.25 times net debt to Earnings before interest, income taxes, depreciation, amortization, gain on disposal of assets, inventory revaluation resulting from a business acquisition, acquisition and restructuring costs, and gain on hyperinflation. From time to time, the Company may deviate from its long-term leverage target to pursue acquisitions and other strategic opportunities. Should such a scenario arise, the Company expects to deleverage over a reasonable period of time in order to seek to maintain its investment grade ratings. Also, the Company seeks to provide an adequate return to its shareholders. The Company believes that the purchases of its own shares may, under appropriate circumstances, be a responsible use of its capital.
The Company’s capital is composed of net debt and equity. Net debt consists of long-term debt, lease liabilities and bank loans, net of cash and cash equivalents. The Company’s primary use of capital is to finance acquisitions.

ANNUAL REPORT 2020
- 90 -
NOTE 23 CAPITAL DISCLOSURES (CONT’D)
The primary measure used by the Company to monitor its financial leverage is its ratio of net debt to earnings before interest, income taxes, depreciation, amortization, gain on disposal of assets, inventory revaluation resulting from a business acquisition, acquisition and restructuring costs, and gain on hyperinflation. The net debt-to-Earnings before interest, income taxes, depreciation, amortization, gain on disposal of assets, inventory revaluation resulting from a business acquisition, acquisition and restructuring costs, and gain on hyperinflation ratios as at March 31, 2020, and March 31, 2019, are as follows:
2020 2019
Bank loans $ 528.5 $ 130.4
Lease liabilities 414.8 -
Long-term debt, including current portion 3,542.3 2,267.3
Cash and cash equivalents (319.4) (112.7)
Net debt $ 4,166.2 $ 2,285.0
Earnings before interest, income taxes, depreciation, amortization, gain on disposal of assets, inventory revaluation resulting from a business acquisition, acquisition and restructuring costs, and gain on hyperinflation $ 1,467.8 $ 1,221.3
Net debt-to-earnings before interest, income taxes, depreciation, amortization, gain on disposal of assets, inventory revaluation resulting from a business acquisition, acquisition and restructuring costs, and gain on hyperinflation 2.84 1.87
The Company has existing credit facilities which require a quarterly review of financial ratios and the Company is not in violation of any such ratio covenants as at March 31, 2020.
The Company is not subject to capital requirements imposed by a regulator.
NOTE 24 ACQUISITION AND RESTRUCTURING COSTS
Acquisition and restructuring costs are summarized as follows:
2020 2019
Restructuring costs $ 13.6 $ 1.2
Acquisition costs 32.4 50.2
Total $ 46.0 $ 51.4
RESTRUCTURING COSTS In fiscal 2020, the Company announced the closure of two facilities in the Dairy Division (Canada). The closures are expected to occur in fiscal 2021.
Costs associated with plant closures are summarized in the table below:
2020 2019
Impairment of property plant and equipment $ 3.5 $ 0.2
Closure costs 10.1 1.0
Total $ 13.6 $ 1.2
Impairment charges to property, plant and equipment were recorded to reduce the carrying value of those assets to their estimated recoverable amount. The total after tax costs for fiscal 2020 are $10.0 million ($0.8 million in fiscal 2019).
The restructuring costs recorded in fiscal 2020 represent estimated expenses required to restructure these operations. Liabilities related to severance expenditures have been grouped within current liabilities on the consolidated statement of financial position.
ACQUISITION COSTS In connection with the Dairy Crest Acquisition and the Specialty Cheese Business Acquisition, (Note 18), the Company incurred acquisition costs of $32.4 million ($28.4 million after tax) in fiscal 2020. In fiscal 2019, acquisition costs incurred were $50.2 million ($35.3 million after tax).

ANNUAL REPORT 2020
- 91 -
NOTE 25 SEGMENTED INFORMATION
The Company reports under four geographic sectors. The Canada Sector consists of the Dairy Division (Canada). The USA Sector consists of the Cheese Division (USA) and the Dairy Foods Division (USA). The International Sector consists of the Dairy Division (Australia) and the Dairy Division (Argentina). The Europe Sector consists of the Dairy Division (UK). These reportable sectors are managed separately as each sector represents a strategic business unit that offers different products and serves different markets. The Company measures geographic and sector performance based on Earnings before interest, income taxes, depreciation, amortization, gain on disposal of assets, inventory revaluation resulting from a business acquisition, acquisition and restructuring costs, and gain on hyperinflation. Management has aggregated the Cheese Division (USA) and the Dairy Foods Division (USA) due to similarities in long-term average returns and correlated market factors driving pricing strategies that affect the operations of both divisions. The divisions within the International Sector have been combined due to similarities in global market factors and production processes. The accounting policies of the sectors are the same as those described in Note 3 relating to significant accounting policies.
INFORMATION ON REPORTABLE SECTORS
Years ended March 31
2020 2019
Revenues
Canada $ 4,007.3 $ 4,043.1
USA 7,093.6 6,507.7
International 3,076.7 2,951.1
Europe 765.9 -
$ 14,943.5 $ 13,501.9
Earnings before interest, income taxes, depreciation, amortization, gain on disposal of assets, inventory revaluation resulting from a business acquisition, acquisition and restructuring costs, and gain on hyperinflation
Canada $ 404.4 $ 413.7
USA 615.4 544.7
International 304.9 262.9
Europe 143.1 -
$ 1,467.8 $ 1,221.3
Depreciation and amortization
Canada $ 91.9 $ 73.9
USA 174.2 162.3
International 107.8 76.8
Europe 93.3 -
$ 467.2 $ 313.0
Gain on disposal of assets - (194.5)
Inventory revaluation resulting from a business acquisition 40.1 -
Acquisition and restructuring costs 46.0 51.4
Gain on hyperinflation (27.8) (18.5)
Financial charges, net 143.0 84.3
Earnings before income taxes 799.3 985.6
Income taxes 216.5 230.3
Net earnings $ 582.8 $ 755.3

ANNUAL REPORT 2020
- 92 -
NOTE 25 SEGMENTED INFORMATION (CONT’D)
GEOGRAPHIC INFORMATION
March 31, 2020 March 31, 2019
Revenues
Canada $ 4,007.3 $ 4,043.1
USA 7,093.6 6,507.7
Australia 2,353.9 2,301.0
Argentina 722.8 650.1
United Kingdom 765.9 -
$ 14,943.5 $ 13,501.9
Net book value of property, plant and equipment
Canada $ 795.2 $ 679.3
USA 1,664.1 1,499.2
Australia 916.1 818.4
Argentina 106.4 98.5
United Kingdom 368.2 -
$ 3,850.0 $ 3,095.4
Intangibles
Canada $ 326.9 $ 342.9
USA 444.3 429.8
Australia 94.0 91.9
Argentina 10.5 11.6
United Kingdom 765.0 -
$ 1,640.7 $ 876.2

CORPORATE HEADQUARTERS Saputo Inc.6869 Métropolitain Blvd. EastMontréal, QC Canada H1P 1X8Telephone: 514-328-6662www.saputo.com
ANNUAL MEETING OF SHAREHOLDERSThursday, August 6, 2020, at 10 a.m.Virtual-only formathttps://web.lumiagm.com/177229360
INVESTOR RELATIONSSandy VassiadisTelephone: 1-514-328-3141 1-866-648-5902Email: [email protected]
STOCK EXCHANGEToronto Stock ExchangeSymbol: SAP
TRANSFER AGENTComputershare Trust Company of Canada1500 Robert-Bourassa Blvd., Suite 700Montréal, QC Canada H3A 3S8Telephone: 514-982-7888 Email: [email protected]
DIVIDEND REINVESTMENT PLANSaputo provides eligible shareholders with the opportunity to have all or a portion of the cash dividends declared on their common shares automatically reinvested into additional Saputo common shares. For enrolment materials or to learn more about the DRIP, please visit: www.saputo.com/investor-toolkit/drip.
EXTERNAL AUDITORSDeloitte LLP Montréal, QC Canada
DIVIDEND POLICYSaputo Inc. declares quarterly cash dividends on common shares at $0.17 per share, representing a yearly dividend of $0.68 per share. The Board of Directors reviews the Company’s dividend policy from time to time, but at least once annually, based on financial condition, financial performance, capital requirements and such other factors as are deemed relevant by the Board in its sole discretion.
