fy2006 consolidated financial results for the year ended
TRANSCRIPT

FY2006 Consolidated Financial Results For the Year Ended March 31, 2007
English Translation from the Original Japanese-Language DocumentApril 27, 2007
Company Name : Mazda Motor Corporation (Tokyo Stock Exchange/Code No. 7261)URL : http://www.mazda.co.jpRepresentative Person : Hisakazu Imaki, Representative Director, President and CEO Contact Person : Tetsuya Fujimoto, General Manager, Accounting Department, Phone (082) 282-111General Meeting of the Shareholders : Scheduled for June 26, 2007Payment of Dividends : Scheduled for starting from June 27, 2007Filing of Yuka Shoken Hokokusho, statutory annual business and financial report : Scheduled for June 27, 2007
(in Japanese yen rounded to millions, except amounts per share)1. Consolidated Financial Highlights (April 1, 2006 through March 31, 2007) (1) Consolidated Financial Results
Sales Operating Income Ordinary Income Net Incomemillion yen % million yen % million yen % million yen %
FY2006 FY2005 Note: Changes in sales, operating income, ordinary income, and net income from the previous period are shown in percentage.
Net Income Net Income Ordinary Income Operating Incomeper Share per Share (Diluted) to Total Assets to Sales
yen yen % % %
FY2006 FY2005 Notes: Equity in net income of unconsolidated subsidiaries and affiliated companies FY2006 million yen
FY2005 million yen
(2) Consolidated Financial PositionEquity
Per Sharemillion yen million yen % yen
FY2006 FY2005 Notes on shareholders' equity, equity ratio and equity per share of FY2006:
1) Equity for calculation of equity ratio and equity per share FY2006 million yen 2) Presentation of the minority interests in consolidated subsidiaries: Commencing in the year ended March 31, 2007, the minority interests are presented as a separate component of the shareholders' equity; however, the minority interests are excluded from the calculation of the equity ratio and the equity per share. See Adoption of New Accounting Standards in the notes to the consolidated financial statements.
3) Recognition of the stock acquisition rights in the shareholder's equity: Commencing in the year ended March 31, 2007, the fair value of stock option is recognized, as stock acquisition rights, in the shareholder's equity as a separate component for the amounts amortized in expense. However, the stock acquisition rights are excluded from the calculation of the equity ratio and the equity per share. See the Adoption of New Accounting Standards in the notes to the consolidated financial statements.
(3) Consolidated Cash FlowsCash Flows from Cash Flows from Cash Flows from Ending Cash &
Operating Activities Investing Activities Financing Activities Cash Equivalentsmillion yen million yen million yen million yen
FY2006 FY2005
2. DividendsDividends per share Amount of Dividends Annual Dividends
Interim Year-end Full-Year Annual Dividends Payout Ratio per equity(Consolidated) (Consolidated)
yen yen yen million yen % %
FY2005 - 5.00 5.00 7,001 2.0 FY2006 - 6.00 6.00 8,442 1.9 FY2007 (Forecast) 3.00 3.00 6.00
3. FY2007 Consolidated Financial Forecast (April 1, 2007 through March 31, 2008)Net Incomeper Share
million yen % million yen % million yen % million yen % yen
1st. Half Full Year Note: Changes in sales, operating income, ordinary income, and net income from the previous period are shown in percentage.
Sales Operating Income Ordinary Income Net Income
3,320,000 160,0002.2
Return on Equity
Total Assets Shareholders' Equity Equity Ratio
52.5951.53
52.1947.25
15.3 60.41140,000 85,000
4.94.2
24.822.3
336.45284.28
16.920.0
6.95.7
1,907,7521,788,659
479,882398,024
73,744 10.566,711 45.7
127,753 25.9101,470 38.9
158,532 28.4123,435 48.8
3,247,4852,919,823 8.3
11.2
1,580,000 60,000 50,000 25,000 17.773.8 (14.0) (11.6) (8.1)
116,358114,598
(95,363)(80,987)
0.9 9.6
8,9766,151
9,346(43,452)
242,505208,658
473,403
9.711.49.9
- 1 -

4. Other
(1) Changes in Consolidation scope: None
(2) Accounting changes:
1) Adoption of new accounting standards Yes 2) Other None Note: See Adoption of New Accounting Standards in the notes to the consolidated financial statements.
(3) Common Stock
1) Shares issued (including treasury stock) FY2006 shares FY2005 shares 2) Treasury shares FY2006 shares FY2005 shares
(Reference)
1. Unconsolidated Financial Highlights (April 1, 2006 through March 31, 2007) (1) Unconsolidated Financial Results
Sales Operating Income Ordinary Income Net Incomemillion yen % million yen % million yen % million yen %
FY2006 FY2005 Note: Changes in sales, operating income, ordinary income, and net income from the previous period are shown in percentage.
Net Income Net Incomeper Share per Share (Diluted)
yen yen FY2006 FY2005
(2) Unconsolidated Financial PositionEquity
Per Sharemillion yen million yen % yen
FY2006 FY2005 Notes on shareholders' equity, equity ratio, and equity per share of FY2006:
1) Equity for calculation of equity ratio and equity per share FY2006 million yen
2) Recognition of the stock acquisition rights in the shareholder's equity: Commencing in the year ended March 31, 2007, the fair value of stock option is recognized, as stock acquisition rights, in the shareholder's equity as a separate component for the amounts amortized in expense. However, the stock acquisition rights are excluded from the calculation of the equity ratio and the equity per share. See the Adoption of New Accounting Standards in the notes to the consolidated financial statements.
2. FY2007 Unconsolidated Financial Forecast (April 1, 2007 through March 31, 2008)
Net Incomeper Share
million yen % million yen % million yen % million yen % yen 1st. Half Full Year Note: Changes in sales, operating income, ordinary income, and net income from the previous period are shown in percentage.
The financial projection is the judgment of our management based on the information presently available. By nature, such financial projection is subject to uncertainty and a risk. Therefore, we advise against making an investment decision by solely relying on this projection. Variables that could affect the actual financial results include, but are not limited to, economic environments related to our business areas and fluctuations in yen-to-dollar and other exchange rates.For further information on the above financial projection, please refer to pages from 4 to 5.
Sales Operating Income Ordinary Income Net Income
Total Assets Shareholders' Equity Equity Ratio
332.44
7,845,9341,407,342,954
7,248,9171,414,878,813
84,464
2.7 19.4 16.0 13.6
2,327,073 14.5 88,803 32.6 40.4 51,062 364.92,032,115 9.8 66,961 165.8 60,177 253.8 10,984 78.7
36.147.78
36.418.48
1,496,657 509,663 34.0 362.171,395,553 465,460 33.4
(1.2) (9.6) (10.3)37,000 21,000
509,596
14.922,390,000 106,000 98,000 58,000 41.221,090,000 39,000 (23.1)
- 2 -

1. Financial Results The Japanese economy has experienced a long-term stable growth period that has surpassed the Izanagi economic boom period, known to be the longest sustained economic growth period in postwar Japan. Private consumption, however, has not fully recovered. This is especially true in the automotive market in which concerns about sluggish new car sales (registered vehicles) and other issues still remain. Overseas, U.S. housing loan issues have created some anxiety regarding future economic trends. In other parts of the world, there are geopolitical risks in Asia and the Middle East which impact the world financial markets. Correspondingly, the world economy has experienced dynamic changes during the past year. In addition, though the price escalation of crude oil and other materials have stabilized, prices still remain high, creating uncertainty in the future. In the domestic automotive industry, total demand declined to 5.62 million units, down 4% from the prior year, due to weakening of registered vehicle performance, which declined 8%. Conversely, micro car demand increased 4%. Demand in the U.S. was at 16.51 million units, down 3%, 18.77 million units for Europe, up 2%, and 4.53 million units for China, up 29% from the previous fiscal year. In this environment, the Mazda Group continued its product-lead growth strategy from the prior fiscal year. During this fiscal year, in May of 2006, we introduced the CX-7, the new crossover SUV, first in North America followed by Australia and Japan. The North American-specific model CX-9, the 7-passenger crossover SUV, went into production in October and sales started in January of 2007. In the commercial vehicle segment, we launched the new Familia Van in January of 2007 with an enlarged cargo space and improved interior versatility. The Titan small truck went through a full redesign and now offers greater convenience and fully meets the latest environment and fuel economy standards. Mazda is undertaking several initiatives to respond to future environmental concerns that our company is facing. In May 2006, an industry-government-academia joint research project, in which Mazda participated, developed a industry-first bioplastic made of natural materials for use in vehicle interior parts. This new bioplastic uses less amounts of fossil fuels and consequently emits lower amounts of carbon dioxide. The bioplastic will be used for some of our products to be sold from the next fiscal year. We have fully introduced the Three Layer Wet Paint System at paint shops in our plants, and achieved the lowest CO2 level in the automotive industry. We plan to continue our efforts on our unique water-based paints to achieve cleaner paint shops. We have also been independently developing a rotary hydrogen vehicle that does not emit CO2 gases. As the Mazda RX-8 Hydrogen RE vehicle runs on either gasoline or hydrogen, it is considered highly practical. Also, as the vehicle can be manufactured at relatively low cost, it is considered to have high potential to make contributions to commercialization of hydrogen energy. Since March 2006, Mazda has supplied seven of these vehicles to government and private enterprises. In February this year, with the cooperation of the Hokkaido Regional Development Bureau of the Japanese government’s Ministry of Land, Infrastructure and Transport (MLIT), Mazda conducted cold weather testing of the hydrogen-powered vehicle near the city of Muroran, where it was also utilized in various events and work-related activities.
(1) Analysis of Financial Results (Financial Results for the Year Ended March 31, 2007) As for the retail volume by market during this fiscal year, retail volume in Japan was 261,000 units, down 8.6% year over year. In North America, the volume was 380,000 units, up 8.0 % from the previous year, driven by the introduction of new models. The volume in Europe was 301,000 units, up 6.7%, with effects of sales of new
- 3 -

diesel engine vehicles. The volume in China was 129,000 units, down 0.7 percent from the prior year, and the volume in the other regions was 231,000 units, up 1.5%. The global retail volume totaled 1,302,000 units, up 2.0% year over year. Consolidated sales revenue increased ¥327.7 billion or 11 .2% year-on-year to ¥3,247.5 billion. With volume and mix improvements due to the introduction of the CX-7 and CX-9, the impact of the yen’s depreciation, and cost reduction efforts including offsets to raw material price hikes, consolidated operating profit was ¥158.5 billion, an increase of ¥35.1 billion or 28.4 % year over year. Operating ROS increased 0.7 percentage points from the previous year to 4.9%. The consolidated ordinary profit was up ¥26.3 billion or 25.9% to ¥127.8 billion, and the consolidated net income was up ¥7.0 billion or 10.5% to ¥73.7 billion. The net income of the previous fiscal year, however, included the one-time impact of extraordinary items such as gains from the transfer of retirement benefit obligations of the substitutional portion to the government, and impairment losses. Excluding the extraordinary profit and loss, net income would be 26.2% higher than the prior year. We achieved record high profits at all levels. We also recorded an extraordinary loss of ¥2 billion for the loss on appraisal for vehicles onboard the car-carrying vessel, Cougar Ace, which listed and became stricken at sea to the south of the Aleutian Islands in late July 2006. (Financial Projections for the Year Ending March 31, 2008) Our global retail volume is projected to be 1,350,000 units next fiscal year, up 3.7 % from this fiscal year. Looking at retail volume projection by market, the volume in Japan is projected to be almost flat year on year at 262,000 units or up 0.5%, and in North America the volume is expected to be 403,000 units, up 6.1 % due to the full-year contribution of new models launched this year. In Europe, the volume is projected to increase 5.6% to 321,000 units, while in China it is projected to decrease 18.7% to 105,000 units. In other regions, projected volume is 259,000 units, up 13.7% from this year. The exchange rate assumption is ¥115 to the US dollar, and ¥153 to the Euro. As for consolidated financial projections for next fiscal year, sales revenue is projected at ¥3,320.0 billion, up2.2%, and operating profit is projected to increase 0.9% to ¥160 billion (operating ROS is expected to be almost flat at 4.8%). These forecasts reflect volume and mix improvements partially offset by cost increases such as development costs and depreciation. Consolidated ordinary profit is expected to increase 9.6% to ¥140 billion, and consolidated net income is projected to be ¥85 billion, up 15.3%. Research and development costs are projected to be ¥120 billion.
- 4 -

First half Compared to the
prior year
Full year Compared to the
prior year
Consolidated Sales
Revenue
¥1,580 billion up 3.8% Sales
Revenue
¥3,320 billion up 2.2%
Operating
Profit
¥60 billion down 14.0% Operating
Profit
¥160 billion up 0.9%
Ordinary
Profit
¥50 billion down 11.6% Ordinary
Profit
¥140billion up 9.6%
Net
Income
¥25 billion down 8.1% Net
Income
¥85 billion up 15.3%
First half Compared to the
prior year
Full year Compared to the
prior year
Unconsolidated Sales
Revenue
¥1,090 billion down 1.2% Sales
Revenue
¥2,390 billion up 2.7%
Operating
Profit
¥39 billion down 9.6% Operating
Profit
¥106 billion up 19.4%
Ordinary
Profit
¥37 billion down 10.3% Ordinary
Profit
¥98 billion up 16.0%
Net
Income
¥21 billion down 23.1% Net
Income
¥58 billion up 13.6%
(2) Analysis on Financial Position
(Analysis on Assets, Liabilities, Shareholders’ Equity and Cash Flows) Total assets as of March 31, 2007 were ¥1,907.8 billion, ¥119.1 billion more than a year ago. Total financial debt at the end of the fiscal year was ¥474.7 billion, ¥19.3 billion more than a year ago. Total liabilities amounted to ¥1,427.9 billion, up ¥46.4 billion from a year ago. Total shareholders’ equity at the end of the fiscal year increased ¥81.9 billion to ¥479.9 billion. The equity ratio rose 2.5 percentage points to 24.8%. Net cash provided by operating activities was ¥116.4 billion, primarily due to income before income taxes of ¥118.5 billion that includes depreciation and amortization expense of ¥47 billion. Net cash used in investing activities amounted to ¥95.4 billion, mainly reflecting ¥79.6 billion capital investments in facilities and equipment. As a result, consolidated cash flow (operating and investing activities) was ¥21 billion. Net cash provided by financing activities was ¥9.3 billion, mainly reflecting issuance of bonds of ¥40 billion and long-term loans of ¥55.1 billion, despite repayment of loans and payment of dividends. After deducting cash and cash equivalents of ¥242.5 billion at the end of the fiscal year from financial debt, net financial debt at the end of the fiscal year totaled ¥232.2 billion, an improvement of ¥14.6 billion compared to the previous fiscal year-end. The net debt-to-equity ratio improved 13 percentage points year on year to 49%.
- 5 -

(Trends of Cash Flow Related Data)
March 31,
2003 March 31,
2004 March 31,
2005 March 31,
2006 March 31,
2007
Equity Ratio 11.1% 12.4% 15.1% 22.3% 24.8%
Fair Value Equity Ratio 14.8% 23.5% 25.2% 56.0% 48.1%
Cash-Flow-To-Total-Debt Ratio
7.6 6.8 3.9 4.0 4.1
Interest Coverage Ratio 5.3 5.0 9.7 9.8 7.2
Equity Ratio: Shareholders’ Equity / Total Assets
Fair Value Equity Ratio: Gross Market Capitalization / Total Assets
Cash flow to Total debt: Total Debt / Cash Flow
Interest Coverage Ratio: Cash Flow / Interest Payments
1) All indicators are calculated on the basis of consolidated financial values.
2) Gross Market Capitalization is based on the total number of shares issued excluding treasury stock.
3) Cash Flow means the cash flow provided by operating activities
4) Total Debt includes all debts that interests are paid on among debts booked in consolidated balance sheet. (Projections for Assets, Liabilities, Shareholders’ Equity and Cash Flows for the Next Fiscal Year) Finance Lease, which does not involve ownership transfer and was treated off-balance previously, is treated on-balance and assets and liabilities are expected to increase about ¥40 billion in the next fiscal year. We do not expect any other critical changes to the balance sheet. As capital investment in facilities and equipment is an important strategic move for further future growth, we plan capital expenditures of ¥94.0 billion in the next fiscal year, which exceeds the capital investment we spent in this fiscal year. We will continue to achieve positive free cash flow in the next fiscal year and further promote a healthier and more robust balance sheet in a steady manner.
(3) Our Basic Policy on Distribution of Earnings and Dividends for This and Next Fiscal Years Our policy on distribution of earnings is to declare dividends by carefully considering each fiscal year’s financial results and business environment. Our intent is to provide our stockholders with dividends on a stable basis. We will increase the year-end dividend by ¥1 to ¥6 per share to reward our shareholders for their continuing support. We plan to declare an interim dividend of ¥3 per share and a year-end dividend of ¥3 per share next fiscal year. Our policy on earnings retained in the company is to utilize the financial resources to enhance our business competitiveness, e.g., capital investment in facilities and equipment and investments in research and development.
(4) Risks (Cautionary Statement with Respect to Forward-Looking Statements) Information included in this material with respect to the Mazda Group’s current plans, estimates, strategies and beliefs and other statements that are not historical facts are forward-looking statements about the future performance of the Mazda Group. We caution you that a number of important risks and uncertainties could cause actual results to differ materially from those discussed in the forward-looking statements. Therefore, you should not place undue reliance on them. In addition, you should not rely on any obligation of us to update or
- 6 -

revise any forward-looking statements, whether as a result of new information, future events or otherwise. We disclaim any such obligation. Risks and uncertainties that might affect the Mazda Group include, but are not limited to:
1) The global economic environment related to the Mazda Group’s business The Mazda Group sells products in Japan and around the world, including North America, Europe and Asia. An economic downturn or declining demand in these markets could adversely affect Mazda’s business results and financial position.
2) Exchange rates, particularly between the yen and the U.S. dollar and euro. Mazda Group exports products from Japan to the rest of the world and consequently its business results and financial position are exposed to the effects of fluctuations in exchange rates. An appreciation of the yen, particularly against the U.S. dollar and euro, could lower the Mazda Group’s profitability and ability to compete on price.
Mazda uses forward-exchange contracts and other instruments in some of its transactions to minimize the impact of exchange rate risk. However, a weakening of the yen could result in a loss of contingent gains.
3) The success of the Mazda Group’s joint ventures and alliances The Mazda Group is involved in joint activities with other companies under technology alliances, joint ventures and in other forms with respect to the development, production and sales of products. These joint activities are designed to optimize resources, facilitate their prioritization and generate synergies. However, a disagreement over management, financial or other matters between the parties involved could mean that the joint activities fail to deliver the results expected. This could adversely affect the Mazda Group’s business results and financial position.
4) Environmental and other public regulations The Mazda Group’s operations in each country where it does business are subject to various government regulations such as those pertaining to environmental problems, automobile safety, fuel consumption and exhaust emissions. Observance of new regulations could result in substantial additional costs which could adversely affect the Mazda Group’s business results and financial position.
5) Market competitiveness The Mazda Group competes with a large number of companies in the global automobile market. Maintaining and enhancing the Group’s ability to compete in this environment is crucial to ensuring growth. Consequently, the Mazda Group is implementing a range of initiatives to boost its competitiveness in product development, manufacturing, sales and other areas. However, the Mazda Group’s business results and financial position could be affected in the event that it fails to launch appealing products at opportune times, due to a failure to accurately ascertain market trends or as a result of issues related to technological capabilities and manufacturing. The same holds true if the Mazda Group fails to take effective steps to respond to customer sense of value or changes thereof through its dealership network or sales methods. Under those circumstances, its sales shares and product prices could also deteriorate.
6) Procurement of raw materials and parts The Mazda Group relies on numerous suppliers outside the Group for the procurement of materials and components. However, due to tight supply-demand balances, constraints at suppliers, or changes to and breaches of supply contracts, the Mazda Group may face difficulties in procuring the necessary level of
- 7 -

materials and components for volume production, leading to a rapid increase in the price of materials procured. Any failure to cover the cost of these increases through internal efforts to boost productivity, pass on price rises to customers or other measures, may lead to a deterioration in output or higher costs, which could adversely affect the Mazda Group’s business results and financial position.
7) Risks associated with international business activities In addition to Japan, the Mazda Group sells its products and carries out business activities in markets around the world, including the United States and Europe, as well as developing and emerging markets overseas. In these markets, the Group is subject to the following potential risks, which could affect the Mazda Group’s business results and financial position if manifested. • Adverse political and economic developments • Impediments arising from changes in laws and regulations • Potential adverse impact from tax regulations • Difficulties in attracting and securing personnel • Undeveloped infrastructure • Strikes and other labor disputes • Terrorist incidents, war, disease and other factors leading to social disorder
8) Protection of intellectual property In order to maintain competitiveness, the Mazda Group is working to accumulate and protect technologies and expertise that help it to develop unique products, and also working to prevent itself from infringing on third-party intellectual property rights. Nonetheless, in the event of a disputed infringement of third-party intellectual property rights by the Mazda Group, the Group may be subject to substantial damages claims or be forced to halt the production and sale of products. This could also adversely affect the Mazda Group’s business results and financial position.
The Group’s intellectual property is not subject to complete protection in certain regions. In the event that third parties use the Mazda Group’s intellectual property on an unauthorized basis to produce similar products, the Group may have to pay substantial expenses for litigation, or experience a decline in sales due to an inability to offer unique products. This could adversely affect the Mazda Group’s business results and financial position.
9) Defective products While striving to improve the quality of its products to meet the requirements of the market, the Mazda Group also does its utmost to ensure the safety of its products. However, the Group cannot guarantee that large-scale product recalls or other issues will not occur due to product defects arising from unforeseen circumstances. Such events may lead to significant costs or a loss of trust in the Group, which could adversely affect the Mazda Group’s business results and financial position.
10) Risks associated with natural disasters and accidents In addition to measures to protect its manufacturing sites and other important facilities against fire and earthquakes, the Mazda Group has concluded natural disaster insurance contracts and taken other steps to minimize the financial risk of such events. However, the ability of the Group to supply products may be severely disrupted in the event of a major earthquake, typhoon or other natural disaster, fire and other accidents, which could adversely affect the Mazda Group’s business results and financial position.
- 8 -

2. Mazda Group of Companiess
Mazda group of companies consists of Mazda Motor Corporation, 58 consolidated subsidiaries and 13 equity method-appliedcompanies and is mainly engaged in the manufacturing and sales of automobiles and automotive parts as well as in otherautomobile-related businesses.
In Japan, Mazda Motor Corporation manufactures automobiles. Mazda Motor Corporation, Kurashiki Kako Co., Ltd. and other companies manufacture automotive parts. In overseas, AutoAlliance International, Inc. and other companies manufacture automobiles and automotive parts. The automobiles and automotive parts manufactured by our group of companies are sold to customers by our sales companies. In Japan, Mazda Autozam, Inc., Kanto Mazda Co., Ltd. and other companies sell our automobiles and automotive parts to customers. To certain corporate customers, Mazda Motor Corporation directly sells our automobiles. In overseas, Mazda Motor of America, Inc., Mazda Motor(Deutschland) GmbH and other companies sell our automobiles and automotive parts to customers
In addition, Mazda Motor Corporation, having an equity relationship with Ford Motor Company, has expanded its relationship with Ford to a strategic cooperative relationship on a global scale.
The following diagram approximately illustrates the roles of Mazda Motor Corporation and its main related companies in conducting the group's business:
Customers
Other Related Companies Overseas Sales CompaniesS) Mazda Autozam, Inc. S) Mazda Motor of America, Inc. S) Kanto Mazda Co., Ltd. S) Mazda Canada, Inc. S) Tokai Mazda Hanbai Co., Ltd. S) Mazda Motors (Deutschland) GmbHS) Kansai Mazda Co., Ltd. S) Mazda Motor Logistics Europe N.V.S) Kyusyu Mazda Co., Ltd. S) Mazda Australia Pty. Ltd. and others E) FAW Mazda Motor Sales Co., Ltd.
and others
Mazda Motor Corporation
Other Automobile-Related Business Overseas Automobile Manufacturers Companies E) AutoAlliance International, Inc.S) MALOX Co., Ltd. E) AutoAlliance (Thailand) Co., Ltd. S) Mazda Engineering and E) Changan Ford Mazda Automobile Co., Ltd. Technology Co., Ltd. E) Changan Ford Mazda Engine Co., Ltd.S) Mazda Chuhan, Co., Ltd. S) Compania Colombiana Automotriz S.A. and others
Domestic Automotive Parts ManufacturersS) Kurashiki Kako Co., Ltd. S) Microtechno Corp. E) Japan Climate Systems Corp. and others S) Consolidated subsidiaries E) Companies accounted for Flows of automobiles and automotive parts
by equity method Flows of services
Note: None of the consolidated subsidiaries is listed at a stock exchange in Japan. Also, there have been no material changes to the consolidation scope and application of equity method since the filing of the latest Yuka Shoken Hokokusho on June 28, 2006. Therefore, the information on the consolidation scope and the application of equity method is omitted.
Domestic Sales Companies
Ford Motor Company
- 9 -

3. Management Policy (1) Our Corporate Vision, Mission and Values
Mazda’s Corporate Vision is comprised of a “Vision” (corporate objectives) along with a statement of “Mission” (roles and responsibilities) and “Value” (the values Mazda seeks to produce). These principles help express the ways in which Mazda and Mazda’s employees understand their roles and responsibilities as they press toward the achievement of these aims. Through the realization of this Corporate Vision, we aim to consistently augment corporate value, which we view as leading to meeting the expectations of our stakeholders -- including shareholders, customers, suppliers, employees and the community -- and also leading to realizing sustainable development for society and for Mazda.
Vision : To create new value, excite and delight our customers through the best automotive products
and services. Mission : With passion, pride and speed, we actively communicate with our customers to deliver
insightful automotive products and services that exceed their expectations. Value : We value integrity, customer focus, creativity, efficient and nimble actions and respect highly
motivated people and team sprit. We positively support environmental matters, safety and society. Guided by these values, we provide superior rewards to all people associated with Mazda.
(2) Issues to be addressed and the long- and mid-term corporate business strategy (Status of the mid-term plan and issues to be addressed)
We built the foundation for future full-scale growth and product-led growth under the “Mazda Momentum” mid-term plan, which covered fiscal years 2004 through the end of fiscal year 2006. We implemented the four key initiatives, which are Reinforcement of R&D, Strengthening of Key Markets, Enhancement of global efficiencies and synergies and Personnel Development.
As a result of implementation of these four initiatives to build the foundation for the future, we achieved two targets, operating profit of more than ¥100 billion and net debt-to-equity below 100%, one year early during the Mazda Momentum period. However, our consolidated wholesale volume was 1.18 million units as compared with the target of 1.25 million units, reflecting lower industry demand in Japan as well as increasing competition in key markets, and our focus to strengthen the Mazda brand. The Mazda Group achieved various positive results during Mazda Momentum. However, under these circumstances, we fully understand that there are still challenges we need to address from next fiscal year, which include:
- Continue to Strengthen the Brand, Owner Loyalty and Quality - Improve Business Efficiency in All Areas - Build the Global Production Framework - Further Reinforce Research and Development
- 10 -
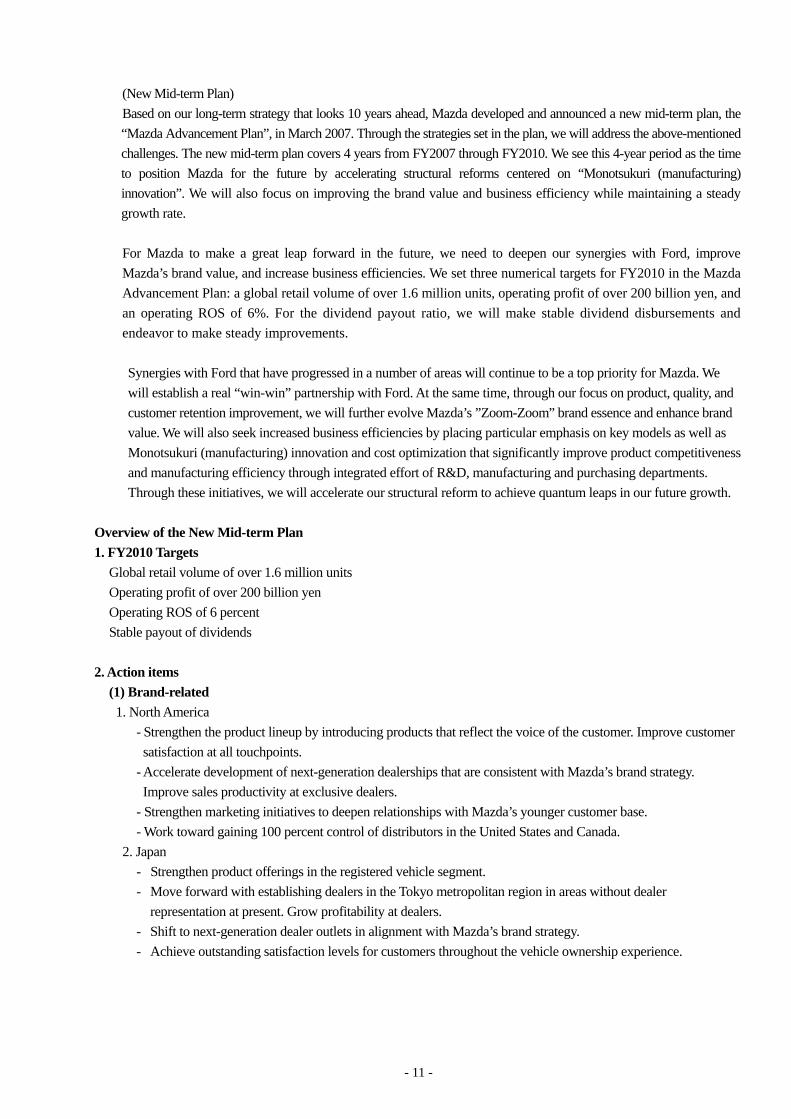
(New Mid-term Plan) Based on our long-term strategy that looks 10 years ahead, Mazda developed and announced a new mid-term plan, the “Mazda Advancement Plan”, in March 2007. Through the strategies set in the plan, we will address the above-mentioned challenges. The new mid-term plan covers 4 years from FY2007 through FY2010. We see this 4-year period as the time to position Mazda for the future by accelerating structural reforms centered on “Monotsukuri (manufacturing) innovation”. We will also focus on improving the brand value and business efficiency while maintaining a steady growth rate.
For Mazda to make a great leap forward in the future, we need to deepen our synergies with Ford, improve Mazda’s brand value, and increase business efficiencies. We set three numerical targets for FY2010 in the Mazda Advancement Plan: a global retail volume of over 1.6 million units, operating profit of over 200 billion yen, and an operating ROS of 6%. For the dividend payout ratio, we will make stable dividend disbursements and endeavor to make steady improvements. Synergies with Ford that have progressed in a number of areas will continue to be a top priority for Mazda. We will establish a real “win-win” partnership with Ford. At the same time, through our focus on product, quality, and customer retention improvement, we will further evolve Mazda’s ”Zoom-Zoom” brand essence and enhance brand value. We will also seek increased business efficiencies by placing particular emphasis on key models as well as Monotsukuri (manufacturing) innovation and cost optimization that significantly improve product competitiveness and manufacturing efficiency through integrated effort of R&D, manufacturing and purchasing departments. Through these initiatives, we will accelerate our structural reform to achieve quantum leaps in our future growth.
Overview of the New Mid-term Plan 1. FY2010 Targets Global retail volume of over 1.6 million units Operating profit of over 200 billion yen Operating ROS of 6 percent Stable payout of dividends 2. Action items (1) Brand-related 1. North America
- Strengthen the product lineup by introducing products that reflect the voice of the customer. Improve customer satisfaction at all touchpoints.
- Accelerate development of next-generation dealerships that are consistent with Mazda’s brand strategy. Improve sales productivity at exclusive dealers.
- Strengthen marketing initiatives to deepen relationships with Mazda’s younger customer base. - Work toward gaining 100 percent control of distributors in the United States and Canada.
2. Japan - Strengthen product offerings in the registered vehicle segment. - Move forward with establishing dealers in the Tokyo metropolitan region in areas without dealer
representation at present. Grow profitability at dealers. - Shift to next-generation dealer outlets in alignment with Mazda’s brand strategy. - Achieve outstanding satisfaction levels for customers throughout the vehicle ownership experience.
- 11 -

3. Europe - Deliver advanced powertrains which will improve customer satisfaction. - Sustain profitability in key mature markets by improving sales productivity and forging ahead with dealer
openings in major urban areas. - Enter selected emerging markets.
4. China - Achieve a smooth launch of operations at the Nanjing plant. - Develop the China dealer network to support sales of 300,000 units per year. - Execute efficient product launches.
5. ASEAN and Australia - Strengthen the ASEAN market(s) model lineup and launch the CX-7 and CX-9 models in Australia. - Reinforce sales in growth markets by focusing on urban areas. - Strengthen the ASEAN regional sales company. Improve customer satisfaction levels in Australia.
(2) Products and Technology
- Over the course of the next four years, annually increase R&D investment by 30 percent as well as raise capital investment expenditures by 50 percent compared to the last four years.
- Enhance Mazda’s business structure through an evolution of current key model lineups and by promoting a new business model.
- With evolved Zoom-Zoom attributes, accelerate the development of next-generation technology for further business growth after 2011.
(3) Production System
1. Increase production capacity in Japan - Expand production capacity in Japan to 996,000 units in FY2007 through increasing production at the
Hiroshima plant by 31,000 units and by 67,000 units at the Hofu plant. - Concurrently raise engine production capacity.
2. Overseas production facilities - Smoothly launch the Nanjing plant in China that will introduce an evolved Mazda Manufacturing System. - Improve quality and cost competitiveness at production facilities in Thailand and the U.S.
3. Future production capacity expansion policy - Build sales in all markets and develop overseas production capacity by taking into account the balance in each
market of sales demand and resource availability. - Maintain domestic production capacity levels and transfer the technical excellence developed in Japan to
other regions. (4) Human Resources Development
1. Promote the training of people who can drive globally-oriented, ‘One Mazda’-style growth. 2. Develop people who energize each workplace. 3. Foster a dynamic work environment where employees can thrive.
- 12 -

4. Consolidated Financial Statements
(1) Consolidated Statement of Income For the Years Ended March 31, 2007 and 2006
FY2005 FY2006 Increase/For the years ended March 31, 2006 March 31, 2007 (Decrease)
Net sales 1 2,919,823 3,247,485 327,662 Costs of sales 2 2,110,934 2,322,644 211,710
Gross profit on sales 3 808,889 924,841 115,952 4 685,454 766,309 80,855
Operating income 5 123,435 158,532 35,097
6 2,359 2,877 518
subsidiaries and affiliates 7 8,976 6,151 (2,825) Other 8 6,584 5,575 (1,009)
Total 9 17,919 14,603 (3,316)
Interest expense 10 11,662 16,254 4,592 Foreign exchange loss 11 19,088 19,914 826 Other 12 9,134 9,214 80
Total 13 39,884 45,382 5,498 Ordinary income 14 101,470 127,753 26,283
15 309 1,361 1,052 16 1,409 43 (1,366)
Compensation received for the exercise of eminent domain 17 472 - (472) Insurance claim income 18 996 - (996) Gain on the transfer to the government of the substitutional portion of employee pension fund liabilities 19 59,611 - (59,611) Other 20 237 44 (193)
Total 21 63,034 1,448 (61,586)
22 6,742 4,741 (2,001) 23 36,650 3,356 (33,294) 24 2 59 57
Inventory valuation loss related to car-carrying vessel accident 25 - 1,979 1,979 Other 26 3,642 616 (3,026)
Total 27 47,036 10,751 (36,285) Income before income taxes 28 117,468 118,450 982
Current 29 26,439 36,776 10,337 Prior year 30 10,201 3,229 (6,972) Deferred 31 12,454 2,973 (9,481)
32 1,663 1,728 65 Net income 33 66,711 73,744 7,033
Non-operating income
Minority interests of consolidated subsidiaries
Loss on retirement and sale of tangible fixed assets Loss on impairment of fixed assets Loss on sale of investment securities
Income taxes
(in millions of yen)
Extraordinary losses
Extraordinary profits
Profit on sale of tangible fixed assets Profit on sale of investment securities
Interest and dividend income Equity in net income of unconsolidated
Non-operating expenses
Selling, general and administrative expenses
- 13 -
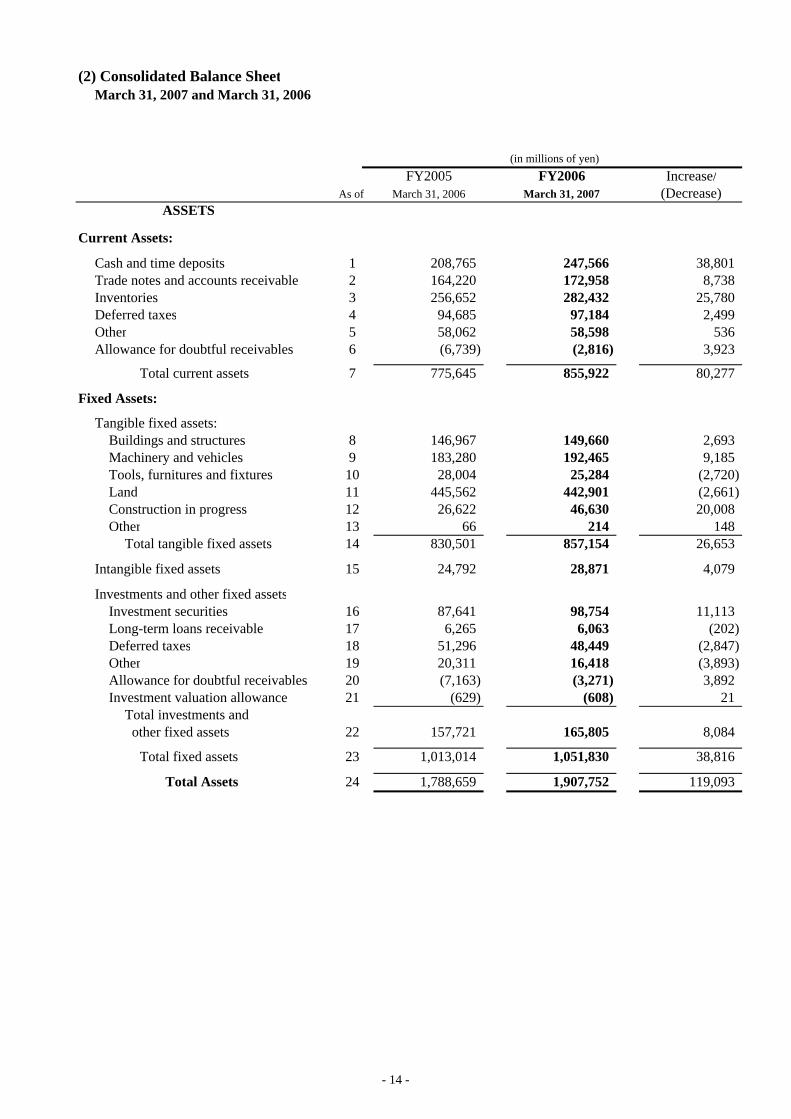
(2) Consolidated Balance SheetMarch 31, 2007 and March 31, 2006
FY2005 FY2006 Increase/As of March 31, 2006 March 31, 2007 (Decrease)
ASSETS
Current Assets:
1 208,765 247,566 38,8012 164,220 172,958 8,7383 256,652 282,432 25,780
Deferred taxes 4 94,685 97,184 2,499Other 5 58,062 58,598 536
6 (6,739) (2,816) 3,923
7 775,645 855,922 80,277
Fixed Assets:
Tangible fixed assets: 8 146,967 149,660 2,6939 183,280 192,465 9,185
Tools, furnitures and fixtures 10 28,004 25,284 (2,720)Land 11 445,562 442,901 (2,661)
12 26,622 46,630 20,008Other 13 66 214 148
14 830,501 857,154 26,653
15 24,792 28,871 4,079
Investments and other fixed assets16 87,641 98,754 11,11317 6,265 6,063 (202)
Deferred taxes 18 51,296 48,449 (2,847)Other 19 20,311 16,418 (3,893)
20 (7,163) (3,271) 3,89221 (629) (608) 21
Total investments and 22 157,721 165,805 8,084
23 1,013,014 1,051,830 38,816
Total Assets 24 1,788,659 1,907,752 119,093
(in millions of yen)
Cash and time deposits Trade notes and accounts receivable Inventories
Allowance for doubtful receivables
Total current assets
Buildings and structures Machinery and vehicles
Construction in progress
Total tangible fixed assets
Intangible fixed assets
Investment securities
Total fixed assets
Long-term loans receivable
Allowance for doubtful receivables Investment valuation allowance
other fixed assets
- 14 -

FY2005 FY2006 Increase/As of March 31, 2006 March 31, 2007 (Decrease)
Current Liabilities: Trade notes and accounts payable 1 307,217 300,577 (6,640) Short-term loans payable 2 82,134 70,340 (11,794) Long-term loans payable due within one year 3 62,373 42,164 (20,209) Bonds due within one year 4 200 20,200 20,000 Bonds with stock acquisition rights due within one year 5 - 1,131 1,131 Other accounts payable 6 104,668 97,758 (6,910) Accrued expenses 7 187,096 219,367 32,271 Reserve for warranty expenses 8 29,088 42,555 13,467 Other 9 64,087 71,144 7,057
Total current liabilities 10 836,863 865,236 28,373
Fixed Liabilities:
Bonds 11 65,200 85,000 19,800 Bonds with stock acquisition rights 12 3,437 - (3,437) Long-term loans payable 13 242,065 255,849 13,784 Deferred tax liability related to land revaluation 14 93,713 93,773 60 Employees' and executive officers' severance and retirement benefits 15 125,004 111,565 (13,439) Directors' and corporate auditors' retirement benefits 16 1,590 1,460 (130) Other 17 13,579 14,987 1,408
Total fixed liabilities 18 544,588 562,634 18,046 Total Liabilities 19 1,381,451 1,427,870 46,419
Minority Interests in Consolidated Subsidiaries 20 9,184 - -
Common stock 21 148,360 - - Capital surplus 22 132,385 - - Retained earnings 23 24,005 - - Land revaluation 24 135,372 - - Net unrealized gain on available-for-sale securities 25 1,285 - - Foreign currency translation adjustments 26 (41,072) - - Treasury stock 27 (2,311) - -
Total Shareholders' Equity 28 398,024 - -
29 1,788,659 - -
Paid-In Capital and Retained Earnings:
Common stock 30 - 149,513 - Capital surplus 31 - 133,393 - Retained earnings 32 - 90,024 - Treasury stock 33 - (3,338) -
Total paid-in capital and retained earnings 34 - 369,592 -
Valuation and Translation Adjustments: Net unrealized gain on available-for-sale securities 35 - 1,034 - Net loss on derivative instruments 36 - (865) - Land revaluation 37 - 136,097 - Foreign currency translation adjustments 38 - (31,528) - Pension adjustments recognized by an overseas consolidated subsidiary 39 - (927) -
Total valuation and translation adjustments 40 - 103,811 -
Stock Acquisition Rights 41 - 67 - Minority Interests in Consolidated Subsidiaries 42 - 6,412 -
Total Shareholders' Equity 43 - 479,882 - 44 - 1,907,752 -
(in millions of yen)
SHAREHOLDERS' EQUITY
Total Liabilities and Shareholders' Equity
LIABILITIES
SHAREHOLDERS' EQUITY
Total Liabilities, Minority Interests and Shareholders' Equity
- 15 -

(3) Consolidated Statement of Capital Surplus and Retained EarningsAnd Consolidated Statement of Shareholder's Equity
Consolidated Statement of Capital Surplus and Retained EarningsFor the year ended March 31, 2006
(in millions of yen)FY2005
For the years ended March 31, 2006
CAPITAL SURPLUS
Balance at the beginning of the period 1 104,435
Increases due to:
Issuance of new shares for the exercise of bonds with stock acquition rights 2 28,065
Decreases due to:
Treasury stock transactions 3 115
Balance at the end of the period 4 132,385
RETAINED EARNINGS
Balance at the beginning of the period 5 (34,581)
Increases due to:
Net income 6 66,711Decreases due to:
Dividends 7 3,648
Land revaluation 8 4,477
Balance at the end of the period 9 24,005
- 16 -

Consolidated Statement of Shareholders' Equity
For the Years Ended March 31, 2007
(In millions of yen)
Total Paid-In Capital
Common Capital Retained Treasury and Retained stock surplus earnings stock Earnings
Balance at March 31, 2006 1
Changes during the period:
Exercise of stock acquisition rights 2
Cash dividends paid 3
Net income 4
Acquisition of treasury stock 5
Re-issuance of treasury stock 6
Land revaluation 7
Net changes in accounts other than
paid-in capital and retained earnings 8
Net changes during the period 9
Balance at March 31, 2007 10
(In millions of yen)
Net unrealized Net Foreign Pension adjustments Total Minoritygain on loss currency recognized by an valuation and Stock Interests in Total
available-for- on derivative Land translation overseas consolidated translation Acquistion Consolidated Shareholders'sale securities instruments revaluation adjustments subsidiary adjustments Rights Subsidiaries Equity
Balance at March 31, 2006 11
Changes during the period
Exercise of stock acquisition rights 12
Cash dividends paid 13
Net income 14
Acquisition of treasury stock 15
Re-issuance of treasury stock 16
Land revaluation 17
Net changes in accounts other than
paid-in capital and retained earnings 18
Net changes during the period 19
Balance at March 31, 2007 20
(927)
(927)
(927)
90,024 (3,338) 369,592
-
(724) (724)
-
(1,672)
(145) 645 500
(1,672)
(7,001)
73,744 73,744
(7,001)
302,439
1,153 2,306
24,005 (2,311)
Paid-In Capital and Retained Earnings
Valuation and Translation Adjustments
73,744
(1,672)
9,184
-
-
500
(724)
(2,772)
(2,772)
6,412
407,208
2,306
(7,001)
5,521
72,674
479,882
67
67
67
8,226
8,226
103,811
-
-
95,585
-
-
(251)
1,034
725
725
136,097
(865)
(865)
(251)
(41,072)1,285
149,513
1,153 1,008
133,393
(865)
135,372
148,360
1,153
132,385
-
9,544
66,019 (1,027) 67,153
(31,528)
9,544
-
- 17 -

(4) Consolidated Statement of Cash Flows For the Years Ended March 31, 2007 and 2006
FY2005 FY2006For the years ended March 31, 2006 March 31, 2007
Cash flows from operating activitiesIncome before income taxes 1 117,468 118,450 Adjustments to reconcile income before income taxes to net cash provided by operating activities:
Depreciation and amortization 2 45,805 47,045 Loss on impairment of fixed assets 3 36,650 3,356 Allowance for doubtful receivables 4 (206) (981) Investment valuation allowance 5 (115) (21) Reserve for warranty expenses 6 4,734 13,281 Employees' and executive officers' severance and retirement benefits 7 (71,087) (13,479) Interest and dividend income 8 (2,359) (2,877) Interest expense 9 11,662 16,254 Equity in net income of unconsolidated subsidiaries and affiliates 10 (8,976) (6,151) Loss/(gain) on sale of fixed assets 11 5,961 3,380 Loss/(gain) on sale of investment securities 12 (1,407) 16 Insurance proceeds 13 (996) - Decrease/(increase) in trade notes and accounts receivable 14 (17,577) (3,061) Decrease/(increase) in inventories 15 10,332 (14,741) Increase/(decrease) in trade notes and accounts payable 16 10,974 (16,654) Increase/(decrease) in other current liabilities 17 (15,989) 22,313 Other 18 (243) 3,323 Subtotal 19 124,631 169,453
Interest and dividends received 20 2,838 5,445 Interest paid 21 (11,292) (16,358) Insurance proceeds received 22 15,554 - Income taxes paid 23 (17,133) (42,182)
Net cash provided by operating activities 24 114,598 116,358
Cash flows from investing activities:Purchase of investment securities 25 (8,875) (5,876) Sale of investment securities 26 2,823 92 Purchase of investments in subsidiaries affecting scope of consolidation 27 31 - Acquisition of tangible fixed assets 28 (75,548) (77,131) Proceeds from sale of tangible fixed assets 29 3,949 5,031 Decrease/(increase) in short-term loans receivable 30 228 (1,280) Long-term loans receivable made 31 (110) (60) Collections of long-term loans receivable 32 162 317 Other 33 (3,647) (16,456)
Net cash used in investing activities 34 (80,987) (95,363)
Cash flows from financing activitiesIncrease/(decrease) in short-term loans payable 35 (8,845) (11,689) Proceeds from long-term loans payable 36 67,102 55,091 Repayment of long-term loans payable 37 (89,102) (61,933) Proceeds from issuance of bonds 38 25,000 40,000 Redemption of bonds 39 (30,400) (200) Cash dividends paid 40 (3,648) (7,000) Other 41 (3,559) (4,923)
Net cash (used in)/provided by financing activities 42 (43,452) 9,346
Effects of exchange rate fluctuations on cash and cash equivalents 43 3,860 3,506 Net increase/(decrease) in cash and cash equivalents 44 (5,981) 33,847 Cash and cash equivalents at beginning of the period 45 214,639 208,658 Cash and cash equivalents at end of the period 46 208,658 242,505
(in millions of yen)
- 18 -

Notes to Consolidated Financial Statements 1. Consolidation Scope and Application of Equity Method
1) Consolidated Subsidiaries 58 Overseas 22 Mazda Motor of America, Inc., Mazda Motors (Deutchland) GmbH and other Domestic 36 18 dealers and 18 other
2) Equity Method-Applied Companies 13 Overseas 5 Auto Alliance International, Inc., Auto Alliance (Thailand) Co., Ltd. and other Domestic 8 3 automotive parts sales companies and 5 other
2. Changes in Consolidation Scope and Application of Equity Method
1) Consolidated Subsidiaries Newly added: 1 Overseas 1 Mazda South East Asia, Limited (established) Excluded: 1 Domestic 1 Mazda Enfini Okayama Co., Ltd. (liquidated)
2) Equity Method-Applied Companies Excluded: 1 Domestic 1 Nagaoka Mazda Co., Ltd. (liquidated)
3. Accounting Periods of Consolidated Subsidiaries
The year-end consolidated balance sheet date is March 31. Among the consolidated subsidiaries, 8 companies, Compania Colombiana Automotriz S.A., Mazda Sales (Thailand) Co., Ltd., Mazda Motor (China) Co., Ltd., P.T. Mazda Motor Indonesia, Mazda South East Asia, Limited, Mazda Motor de Mexico, S. de R.L de C.V., Mazda Servicios de Mexico, S. de R.L de C.V., and Mazda Motor Rus, OOO have a year-end balance sheet date different from the year-end consolidated balance sheet date, all of which are December 31.
In preparing the consolidated financial statements, for 5 of the 8 companies, Compania Colombiana Automotriz S.A., Mazda Sales (Thailand) Co., Ltd., Mazda Motor (China) Co., Ltd., P.T. Mazda Motor Indonesia and Mazda South East Asia, Limited, the financial statements of each of these companies with the December 31 year-end balance sheet date are used; however, adjustments necessary in consolidation were made for material transactions that occurred between the balance sheet dates of these subsidiaries and the consolidated balance sheet date. On the other hand, for the other 3 companies, Mazda Motor de Mexico, S. de R.L de C.V., Mazda Servicios de Mexico, S. de R.L de C.V., and Mazda Motor Rus, OOO, special purpose financial statements prepared for consolidation as of the consolidated balance sheet date are used to supplement the companies’ statutory financial statements. Until the year ended March 31, 2006, Mazda Motors of New Zealand Limited had a year-end different from the consolidated year-end of March 31. However, commencing in the year ended of March 31, 2007, Mazda Motors of New Zealand Limited changed its fiscal year-end to match the consolidated fiscal year-end of March 31. Accordingly, the consolidated operating results for the year ended March 31, 2007 consisted of 15 months of operations from January 1, 2006 to March 31, 2007 for Mazda Motors of New Zealand Limited. The effects of this change on the consolidated statement of income for the year ended March 31, 2007 were immaterial.
4. Accounting Policies
1) Valuation Standards and Methods of Significant Assets a) Securities
Available-for-sale securities With available fair value: Recorded at fair value estimated based on quoted market prices on the
balance sheet date, with unrealized gains and losses excluded from income and reported in a separate component of shareholders’ equity net of tax. The bases of cost are on a historical cost basis mainly based on a moving average method.
Without available fair value: Recorded at cost on a historical cost basis mainly on a moving average
- 19 -
method b) Derivative instruments: Mainly fair value method c) Inventories: Mainly a historical cost basis based on an average method
2) Depreciation and Amortization Methods of Significant Fixed Assets
a) Tangible Fixed Assets Mainly straight-line method. Useful lives and residual values are estimated by a method equivalent to the provisions of the Japanese income tax law.
b) Intangible Fixed Assets
Straight-line method with periods of useful life estimated by a method equivalent to the provisions of the Japanese income tax law. Software for internal use is amortized on a straight-line basis over the period of internal use, i.e., 5 years.
3) Standards for Recognition of Reserves a) Reserve for warranty expenses
Reserve for warranty expenses provides for after-sales expenses of products (vehicles). The amount is estimated per product warranty provisions and actual costs incurred in the past, taking future prospects into consideration.
b) Employees’ and executive officers’ severance and retirement benefits
Employees’ and executive officers’ severance and retirement benefits provide for the costs of severance and retirement benefits to employees and executive officers. For employees’ severance and retirement benefits, the amount estimated to have been incurred as of the end of the current fiscal year is recognized based on the estimated amount of liabilities for severance and retirement benefits and the estimated fair value of the pension plan assets at the end of the current fiscal year. The recognition of prior service cost is deferred on a straight-line basis over a period equal to or less than the average remaining service period of employees at the time such cost is incurred (mainly 12 years). The recognition of actuarial differences is also deferred on the straight-line basis over a period equal to or less than the average remaining service period of employees at the time such gains or losses are realized (mainly 13 years). The amortization of net gains or losses starts from the fiscal year immediately following the year in which such gains or losses are realized. For executive officers’ retirement benefits, the liability is provided for the amount that would be required by the internal corporate policy if all the eligible executive officers retired at the balance sheet date.
c) Directors’ and corporate auditors’ retirement benefits Directors’ and corporate auditors’ retirement benefits provide for the payment of retirement benefits to directors and corporate auditors. The equivalent of the amount that would be required by the internal corporate policy if all the directors and corporate auditors retired at the end of this fiscal year is recognized.
d) Allowance for doubtful receivables Allowance for doubtful receivables provides for the losses from bad debt. The amount estimated to be uncollectible is recognized. For receivables at an ordinary risk, the amount is estimated based on the past default ratio. For receivables at a high risk and receivables from debtors under bankruptcy proceedings, the amount is estimated based on the financial standing of the debtor.
e) Investment valuation allowance
Investment valuation allowance provides for losses from investments. The amount is estimated in light of the financial standings of the investee companies.
4) Accounting policies of foreign consolidated subsidiaries Among the foreign consolidated subsidiaries, Compania Colombiana Automotriz S.A. prepares its financial statements based on the accounting principles generally accepted in Colombia to reflect adjustments for the country’s inflationary economy and changing prices.
- 20 -

5) Foreign currency translation Receivables and payables denominated in foreign currencies are translated into Japanese yen at the exchange rate on the fiscal year end; gains and losses in foreign currency translation are included in the income of the current period. Balance sheets of consolidated overseas subsidiaries are translated into Japanese yen at the rates on the fiscal year ends of the subsidiaries’ accounting periods except for shareholders’ equity accounts, which are translated at the historical rates. Income statements of consolidated overseas subsidiaries are translated at average rates of the subsidiaries’ fiscal years, with the translation differences prorated and included in the shareholders’ equity as foreign currency translation adjustments and minority interests.
6) Accounting for Leases
Lease transactions other than those finance leases with an unconditional title transfer clause are accounted for by the method equivalent to rental transactions.
7) Accounting for Hedging Activities
Full-deferral hedge accounting is mainly applied. Also, for certain interest swap contracts that are used as hedges and meet certain hedging criteria, the net amount to be paid or received under the interest swap contract is added to or deducted from the interest on the assets or liabilities for which the swap contract was executed.
8) Accounting for Consumption Taxes Tax-excluding method
5. Valuation of Assets and Liabilities of Consolidated Subsidiaries The assets and liabilities of consolidated subsidiaries are valued at fair value at the time of acquisition and are recognized in the consolidated balance sheet in the entirety.
6. Amortization of Goodwill Goodwill is amortized on a straight-line basis over a period (primarily 5 years) during which each investment is expected to generate benefits.
7. Cash and Cash Equivalents in the Consolidated Statement of Cash Flows Cash and cash equivalents consist of cash on hand, bank deposits that can be readily withdrawn, and short-term, highly liquid investments with maturities of three months or less at the time of acquisition that present insignificant risk of changes in value.
- 21 -

Adoption of New Accounting Standards 1. Presentation of Shareholders’ Equity in the Consolidated Balance Sheet
Commencing in the year ended March 31, 2007, Mazda Motor Corporation (“the Company”) and its consolidated domestic subsidiaries (together the “Domestic Companies”) adopted the Accounting Standards Board of Japan (“ASBJ”) Statement No. 5, Accounting Standard for Presentation of Net Assets in the Balance Sheet, and the ASBJ Guidance No. 8, Guidance on Accounting Standard for Presentation of Net Assets in the Balance Sheet, both issued by the ASBJ on December 9, 20051. Also, commencing in the year ended March 31, 2007, the Domestic Companies adopted the ASBJ Statement No.1 (revised 2006), Accounting Standard for Treasury Shares and Appropriation of Legal Reserve, and the ASBJ Guideline No.2 (revised 2006), Guidance on Accounting Standard for Treasury Shares and Appropriation of Legal Reserve, both last revised by the ASBJ on August 11, 2006. The adoption of the new standards has no impacts in income. If the shareholders’ equity of the consolidated balance sheet at March 31, 2007 had been presented under the standards effective until the prior period, the total shareholders’ equity would have been 475,195 million yen. As the accounting standards for the preparation of the consolidated financial statements were revised, commencing in the year ended March 31, 2007, the consolidated financial statements were prepared in accordance with the revised standards.
2. Accounting for Share-based Payment
Commencing in the year ended March 31, 2007, the Domestic Companies adopted the ASBJ Statement No. 8, Accounting Standard for Share-based Payment, issued by the ASBJ on December 27, 2005 and the ASBJ Guidance No. 11 (revised 2006), Guidance on Accounting Standard for Share-based Payment, last revised by the ASBJ on May 31, 20062. The effects of adopting the new standard for the year ended March 31, 2007 were to decrease operating income, ordinary income and income before income taxes by 67 million yen. The effects of adopting the new standards on the segment information are discussed in the applicable section of the notes to the consolidated financial statements.
1 Presentation of the minority interests in consolidated subsidiaries: Until the year ended March 31, 2006, the minority interests in consolidated subsidiaries were presented in the “mezzanine” section of the consolidated balance sheet between the liabilities and the shareholders’ equity. Commencing in the year ended March 31, 2007, the minority interests are presented in the balance sheet as a separate component of the shareholders’ equity. In the calculation of the equity ratio and the equity per share, however, the minority interests are excluded from the shareholders’ equity. 2 Recognition of the stock acquisition rights in the shareholder's equity: Commencing in the year ended March 31, 2007,the fair value of stock option is recognized, as stock acquisition rights, in the shareholder's equity as a separate component for the amounts amortized in expense. However, the stock acquisition rights are excluded from the calculation of the equity ratio and the equity per share.
- 22 -

Footnotes(in millions of yen)
(Consolidated Statement of Income) FY2005 FY2006March 31, 2006 March 31, 2007
1. The aggregate amounts of research and development expenses 95,730 107,553
2. Prior year income taxesPrior year income taxes recorded in the year ended March 31, 2007 are primarily for the taxes that the Company expects to pay on transactions between the Companyand its domestic dealerships. The Company bears part of the expenses that its dealerships incur for sales and promotional activities. Recent internal investigation has unveiled transactions that are not deductible for the purpose of income tax filing due to inappropriate documentation for invoices and payments as well as unclear grounds for the determination of the amounts to be borne by the Company.As a result, the Company has recognized the estimated additional taxes for the prior three yearsof 3,229 million yen, as prior year income taxes in the consolidated statement of income for the year ended March 31, 2007. The estimated amount of 3,229 million yen is net of deferred taxes of 293 million yen on those portions of prefectural taxes that are deductible in the future federal income tax filings.
(Consolidated Balance Sheet)
1. Accumulated depreciation on tangible fixed assets 1,040,875 1,045,146
2. In accordance with the Law to Partially Revise the Land Revaluation Law (Law No. 19, enacted on March 31, 2001), land owned by Mazda for business useswas revalued. The unrealized gains on the revaluation are included in the shareholders'equity as "Land Revaluation" for the amount net of deferred taxes. The deferred taxes on the unrealized gains are included in the liabilities as "DeferredTax Liability Related to Land Revaluation". Timing of revaluation: As of March 31, 2001
Method of revaluation:The fair value of land is determined based on official notice prices that are assessed and published by the Commissioner of the National Tax Administration,
as stipulated in Article 2-4 of the Ordinance Implementing the Law Concerning Land Revaluation (Article 119 of 1998 Cabinet Order,promulgated on March 31, 1998). Reasonable adjustments, including those for the timing of assessment, are made to the official notice prices.
The amount of difference between the aggregate fair value of the revalued land as of the end of this period and that at the time of revaluation as stipulated inArticle 10 of the Land Revaluation Law is:
84,197 million yen
3. Assets offered as collateral and collateralized loansAssets offered as collateral 476,513 463,142Collateralized loans 107,884 87,520
4. Contingent liabilities for guarantee and similar agreements 35,712 30,435
5. Notes and other receivables discountedDiscounted notes receivable 63 348Factoring of receivables with recourse 23,391 24,471
6. Pension adjustments recognized by an overseas consolidated subsidiary
Commencing in the year ended March 31, 2007, the consolidated subsidiary in the United States adopted the Statement of Financial Accounting Standards No. 158, Employers' Accounting for Defined Benefit Pension and Other Postretirement Plans .The amount (net of tax) that the consolidated subsidiary recognized, in the balance sheet, as a component of the other accumulated comprehensive income in the shareholders' equity is recognized, in the consolidated balance sheet, as "pension adjustments recognized by an overseas consolidated subsidiary" as a separate component of the valuation and translation adjustments of the shareholders' equity.
- 23 -

(Consolidated Statement of Shareholders' Equity)
1. Stock issued (In thousands of shares)
The number of shares issued increased during the period due to:Exercise of stock acquisition right thousand shares
2. Treasury stock (In thousands of shares)
The number of treasury shares increased during the period due to:Acquisition of treasury stock to meet the needs related to stock options thousand shares Purchase of less-than-one-unit shares from shareholders thousand shares
The number of treasury shares decreased during the period due to:Re-issuance of treasury stock to meet the needs related to stock options thousand shares Requests for additional purchase of less-than-one-unit shares by shareholders thousand shares
3. Stock acquisition rights
Detail Type of stock
Stock acquisitionrights granted as Common stock
stock options
Stock acquisition rights granted as stock options was not vested.
4. DividendsDividend payment
Total amountResolution Type of stock of dividends Reference date Effective date
(Million yen)Ordinary General Meeting
of Shareholders held on Common stock 7,001 5 Mar. 31, 2006 Jun. 28, 2006June 27, 2006
Dividend whose reference date is attributable to the current period but to be effective after the current period. Total amount
Resolution of dividends Reference date Effective date (Million yen)
Ordinary General Meetingof Shareholders held on Common stock 8,442 6 Mar. 31, 2007 Jun. 27, 2007
June 26, 2007
(In millions of yen)
(Consolidated Statement of Cash Flows)
1. Reconciliation of cash and time deposits in the consolidated balance sheet to cash and cash equivalents in the consolidated statement of cash flows
Cash and time deposits Time deposits with original maturities that exceed 3 months Cash and cash equivalents
2. Significant non-cash transactions: Exercise of stock acquisitions rights
Increases in common stock Increases in capital surplus Decreases in bonds with stock acquisition rights
MazdaMotor
Type of stock
Number ofshares at
Mar. 31, 2007
1,608
Mar. 31, 2006 Increase
Number of shares at
Number of treasury
March 31, 2007 Increases Decreases shares at
Number of sharesissued at
March 31, 2007- 1,414,878
Number of shares issued at
March 31, 2006 Increases Decreases
208,658(107)
208,765
242,505(5,061)
FY2005 FY2006(March 31, 2007)
7,845
2,103
1,603
Thousands of shares
102
5
2,205
7,536
247,566
56,13028,06528,065 1,153
1,1532,306
7,536
(March 31, 2006)
Balance atMar. 31, 2007(Million yen)
Company name
67----
Decrease
Type of stock
Type of stock
1,407,342
Number of treasury shares at
March 31, 20067,248
Corporation
Common stock
Common stock
Dividends per share(Yen)
Dividends per share(Yen)
Retainedearnings
Resource ofdividends
- 24 -

Segment Information
1. Information by Industry Segment
Mazda Motor Corporation and its consolidated subsidiaries are primarily engaged in the manufacture and sale of passenger and commercial vehicles. Net sales, operating income (loss) and assets related to this industryhave exceeded 90% of the respective consolidated amounts. Accordingly, information by industrysegment is not shown.
2. Information by Geographic Areas
(in millions of yen)FY2006 North Other Elimination(Year ended March 31, 2007) Japan America Europe areas Total or corporate ConsolidatedNet sales:
Outside Customers 1,226,988 991,192 774,837 254,468 3,247,485 - 3,247,485Inter-area 1,347,406 7,074 19,899 1,638 1,376,017 (1,376,017) -
Total 2,574,394 998,266 794,736 256,106 4,623,502 (1,376,017) 3,247,485Costs and expenses 2,451,263 982,810 779,242 246,517 4,459,832 (1,370,879) 3,088,953Operating income (loss) 123,131 15,456 15,494 9,589 163,670 (5,138) 158,532Total identifiable assets 1,663,264 219,947 166,276 56,074 2,105,561 (197,809) 1,907,752
(in millions of yen)FY2005 North Other Elimination(Year ended March 31, 2006) Japan America Europe areas Total or corporate ConsolidatedNet sales:
Outside Customers 1,213,283 823,447 655,370 227,723 2,919,823 - 2,919,823Inter-area 1,056,948 7,397 18,275 1,106 1,083,726 (1,083,726) -
Total 2,270,231 830,844 673,645 228,829 4,003,549 (1,083,726) 2,919,823Costs and expenses 2,169,998 816,941 664,074 220,237 3,871,250 (1,074,862) 2,796,388Operating income (loss) 100,233 13,903 9,571 8,592 132,299 (8,864) 123,435Total identifiable assets 1,556,200 202,238 143,626 48,148 1,950,212 (161,553) 1,788,659
Notes:1) Method of segmentation and principal countries or regions belonging to each segment
a) Method: Segmentation by geographic adjacencyb) Principal countries or regions belonging to each segment North America: U.S.A. and Canada Europe: Germany, Belgium and U.K. Other areas: Australia and Colombia
2) As discussed in the accounting for share-based payment section of the adoption of new accounting standards, commencing in the year ended March 31, 2007, the Domestic Companies adopted the ASBJ Statement No. 8, Accounting Standard for Share-based Payment , issued by the ASBJ on December 27, 2005and the ASBJ Guidance No. 11 (revised 2006), Guidance on Accounting for Share-based Payment , last revisedby the ASBJ on May 31, 2006.
The effects of adopting the new standard on the consolidated statement of income for the year ended March 31, 2007were to increase the operating expenses and to decrease the operating income in the Japan segment by 67 million yen.
- 25 -

3. Overseas Sales
FY2006 (in millions of yen)(Year ended March 31, 2007) North America Europe Other areas TotalOverseas sales 1,017,874 789,135 553,149 2,360,158Consolidated sales - - - 3,247,485Percentage of overseas sales to % % % %
consolidated sales 31.3 24.4 17.0 72.7
FY2005 (in millions of yen)(Year ended March 31, 2006) North America Europe Other areas TotalOverseas sales 843,988 668,941 519,232 2,032,161Consolidated sales - - - 2,919,823Percentage of overseas sales to % % % %
consolidated sales 28.9 22.9 17.8 69.6
Notes:1) Overseas sales include exports by Mazda Motor Corporation and its domestic consolidated subsidiaries
as well as sales (other than exports to Japan) by overseas consolidated subsidiaries.
2) Method of segmentation and principal countries or regions belonging to each segmenta) Method: Segmentation by geographic adjacencyb) Principal countries or regions belonging to each segment
North America: U.S.A. and Canada Europe: Germany and U.K. Other areas: Australia, Thailand and China
Footnotes that are omitted.
The following footnotes are omitted from the timely disclosure of the consolidated financial results since the Company judges the needs to include these footnotes in the timely disclosure to be less significant.
- Lease transactions- Related party transactions- Income taxes- Fair Value Information of Securities - Derivatives- Retirement benefits- Share-based payment
- 26 -

Information on Amounts Per Share of Common Stock
FY2005 FY2006Year Ended Year Ended
March 31, 2006 March 31, 2007(Yen) (Yen)
Equity per share of common stock 284.28 336.45Net income per share of common stock:
Basic 51.53 52.59Diluted 47.25 52.19
Note: Bases of calculation of net income (basic and diluted) per share of common stock are as follows:
FY2005 FY2006Year Ended Year Ended
March 31, 2006 March 31, 2007(Million Yen) (Million Yen)
(Thousand Shares) (Thousand Shares)
Net income as reported in the consolidated statement of income 66,711 73,744Net income on common stock 66,711 73,744Average number of shares of common stock outstanding 1,294,533 1,402,315Adjustments made on net income - -
Increase in the number of shares of common stock used in calculating FY2005 FY2006 net income per share of common stock, diluted: Year Ended Year Ended
March 31, 2006 March 31, 2007(Thousand Shares) (Thousand Shares)
Convertible bonds type-bonds with stock acquisition rights 115,998 8,442Stock options 1,455 2,272
Increase in the number of shares of common stock 117,453 10,714
Numbers of potential shares of common stock that are excluded from the calculation of net income per share of common stock, diluted, due to a lack of dilution effects:
Stock options by the method to issue stock acquisition rights FY2005 FY2006in accordance with the resolution of the 140th general meeting Year Ended Year Ended
of the shareholders held on June 27, 2006 March 31, 2006 March 31, 2007(Thousand Shares) (Thousand Shares)
Number of shares of common stock - 2,043,000Type of potential shares of stock Common stockExercise period From July 1, 2008
To June 30, 2011Exercise conditions
(FY2006)The stock acquisition rights are exercised in exchange for payment of 776 yen per share. Otherconditions are in accordance with the resolutions of the general meeting of the shareholders andthe board of directors as well as the contracts between the Company and the holders of the stock acquisition rights.
- 27 -

Unconsolidated Statement of Income For the Years Ended March 31, 2007 and 2006
(in Japanese yen rounded to millions)FY2005 FY2006 Increase/
(Apr.2005-Mar.2006) (Apr.2006-Mar.2007) (Decrease)
Net sales 1 2,032,115 2,327,073 294,958Cost of sales 2 1,675,976 1,925,901 249,925 Gross profit on sales 3 356,139 401,172 45,033
Selling, general and administrative expenses 4 289,178 312,370 23,192
Operating income 5 66,961 88,803 21,842
Non-operating income Interest and dividend income 6 12,506 18,246 5,740Other 7 5,345 5,388 43
Total 8 17,851 23,634 5,782
Non-operating expensesInterest expense 9 5,453 5,577 124Exchange loss 10 16,603 19,716 3,112Other 11 2,578 2,679 101
Total 12 24,635 27,972 3,337,Ordinary income 13 60,177 84,464 24,287
Extraordinary profitsProfit on sale of tangible fixed assets 14 22 133 111Profit on sale of investment securities for affiliates 15 920 - (920)Compensation received for the exercise of eminent domain 16 472 - (472)Insurance proceeds 17 996 - (996)Gain on the transfer to the Government of the substitutional portion of employee pension fund liabilities 18 55,191 - (55,191)Other 19 225 - (225)
Total 20 57,826 133 (57,693)
Extraordinary lossesLoss on sale of tangible fixed assets 21 46 190 144Loss on retirement of tangible fixed assets 22 4,917 3,660 (1,257)Loss on impairment of fixed assets 23 19,375 695 (18,680)Loss on sale of investment securities for affiliates 24 - 59 59Valuation loss on investment securities 25 255 29 (226)Valuation loss on investment securities for affiliates 26 556 193 (363)Valuation loss on investments 27 268 - (268)Loss on restructuring of affiliates 28 3,013 1,206 (1,807)Reserve for loss on restructuring of affiliates 29 584 - (584)Loss on investment valuation 30 30,005 3,759 (26,246)Other 31 133 14 (119)
Total 32 59,151 9,804 (49,347)
Income before income taxes 33 58,852 74,794 15,941Income taxes
Current 34 14,867 20,510 5,643Prior year 35 10,166 3,229 (6,937)Deferred 36 22,835 (7) (22,842)
Net income 37 10,984 51,062 40,077Retained earnings/(deficit) brought forward 38 15,099 - -Reversal of land revaluation 39 (4,477) - -Reversal of earned surplus reserve 40 15,752 - -
Unappropriated retained earnings/(deficit) 41 37,357 - -
- 28 -
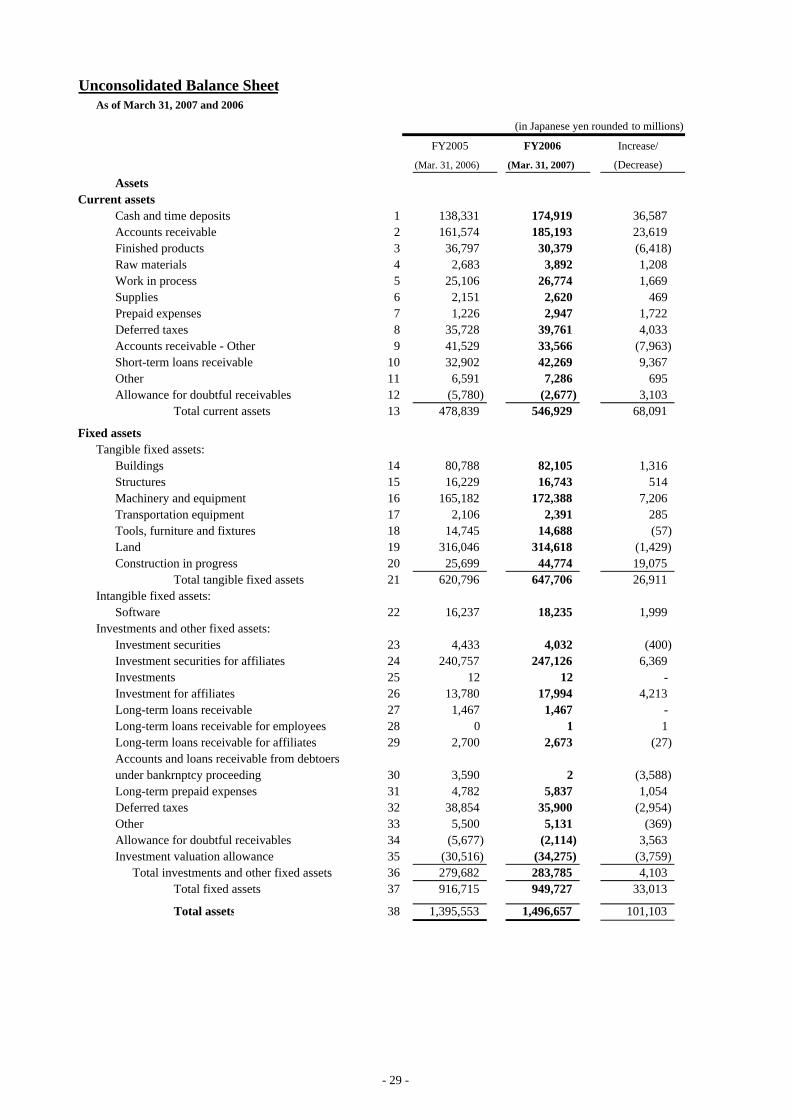
Unconsolidated Balance SheetAs of March 31, 2007 and 2006
(in Japanese yen rounded to millions)
FY2005 FY2006 Increase/
(Mar. 31, 2006) (Mar. 31, 2007) (Decrease)
AssetsCurrent assets
Cash and time deposits 1 138,331 174,919 36,587Accounts receivable 2 161,574 185,193 23,619Finished products 3 36,797 30,379 (6,418)Raw materials 4 2,683 3,892 1,208Work in process 5 25,106 26,774 1,669Supplies 6 2,151 2,620 469Prepaid expenses 7 1,226 2,947 1,722Deferred taxes 8 35,728 39,761 4,033Accounts receivable - Other 9 41,529 33,566 (7,963)Short-term loans receivable 10 32,902 42,269 9,367Other 11 6,591 7,286 695Allowance for doubtful receivables 12 (5,780) (2,677) 3,103
Total current assets 13 478,839 546,929 68,091
Fixed assetsTangible fixed assets:
Buildings 14 80,788 82,105 1,316Structures 15 16,229 16,743 514Machinery and equipment 16 165,182 172,388 7,206Transportation equipment 17 2,106 2,391 285Tools, furniture and fixtures 18 14,745 14,688 (57)Land 19 316,046 314,618 (1,429)Construction in progress 20 25,699 44,774 19,075
Total tangible fixed assets 21 620,796 647,706 26,911Intangible fixed assets:
Software 22 16,237 18,235 1,999Investments and other fixed assets:
Investment securities 23 4,433 4,032 (400)Investment securities for affiliates 24 240,757 247,126 6,369Investments 25 12 12 -Investment for affiliates 26 13,780 17,994 4,213Long-term loans receivable 27 1,467 1,467 -
28 0 1 1Long-term loans receivable for affiliates 29 2,700 2,673 (27)Accounts and loans receivable from debtoers
30 3,590 2 (3,588)Long-term prepaid expenses 31 4,782 5,837 1,054Deferred taxes 32 38,854 35,900 (2,954)Other 33 5,500 5,131 (369)Allowance for doubtful receivables 34 (5,677) (2,114) 3,563Investment valuation allowance 35 (30,516) (34,275) (3,759)
Total investments and other fixed assets 36 279,682 283,785 4,103Total fixed assets 37 916,715 949,727 33,013
Total assets 38 1,395,553 1,496,657 101,103
Long-term loans receivable for employees
under bankrnptcy proceeding
- 29 -

(in Japanese yen rounded to millions)
FY2005 FY2006 Increase/(Mar. 31, 2006) (Mar. 31, 2007) (Decrease)
LiabilitiesCurrent liabilities
Trade notes payable 1 941 278 (663)Accounts payable - Trade 2 228,491 228,171 (320)Short-term loans payable 3 1,640 730 (910)Long-term loans payable due within one year 4 45,243 28,388 (16,855)Bonds due within one year 5 - 20,000 20,000Bonds with stock acquisition right due within one year 6 - 1,131 1,131Other accounts payable 7 13,727 16,960 3,234Income tax payable 8 21,196 16,867 (4,328)Accrued expenses 9 75,982 84,192 8,210Unearned revenue 10 1,672 1,883 211Deferred revenue 11 - 2 2Deposit received 12 15,970 20,393 4,422Reserve for warranty expenses 13 26,671 40,705 14,034Reserve for loss on restructuring of affiliates 14 584 - (584)Other 15 4,324 3,870 (454)
Total current liabilities 16 436,441 463,571 27,130
Fixed liabilitiesBonds 17 65,000 85,000 20,000Bonds with stock acquisition rights 18 3,437 - (3,437)Long-term loans payable 19 226,907 249,929 23,022Deferred tax liability related to land revaluation 20 93,713 93,773 60Employees' and executive officers' severance and retirement benefits 21 100,036 89,843 (10,193)Directors' and corporate auditors'
retirement benefits 22 837 744 (93)Guaranty money received 23 2,324 2,773 449Other 24 1,398 1,361 (37)
Total fixed liabilities 25 493,652 523,423 29,771Total liabilities 26 930,093 986,993 56,901
Shareholders' equityCommon stock 27 148,360 - -
Capital surplusCapital reserve 28 58,250 - -Other capital surplus 29 74,135 - - Surplus from decrease in Capital reserve 30 74,135 -
Total Capital surplus 31 132,385 - -Earned surplus
Appropriated for optional purpose 32 13,274 - - Appropriated for advanced depreciation deduction of fixed assets 33 12,442 - - Appropriated for special depreciation 34 796 - - Appropriated for World Exposition 35 36 - -Unappropriated retained earnings/(deficit) 36 37,357 - -
Total earned surplus 37 50,631 - -
Land revaluation 38 135,372 - -Net unrealized gain/(loss) on
available-for-sale securities 39 1,018 - -Treasury stock 40 (2,306) - -
Total shareholders' equity 41 465,460 - -Total liabilities and shareholders' Equity 42 1,395,553 - -
- 30 -

(in Japanese yen rounded to millions)FY2005 FY2006 Increase/
(March 31, 2006) (March 31, 2007) (Decrease)
Shareholders' EquityPaid-In Capital and Retained Earnings:
Common stock 43 - 149,513 -Capital surplus Capital reserve 44 - 59,403 - Other capital surplus 45 - 73,990 -
Total Capital surplus 46 - 133,393 -Retained earnings Other earned surplus 47 - 93,968 - Appropriated for deduction of fixed assets 48 - 10,778 -
Appropriated for special depreciation 49 - 421 - Unappropriated retained earnings 50 - 82,770 - Total retained earnings 51 - 93,968 -
Treasury Stock 52 - (3,333) - Total paid-in capital and retained earnings 53 - 373,541 -
Valuation and Translation Adjustments:
Net unrealized gain onavailable-for-sale securities 54 - 803 -
Net loss on derivative instruments 55 - (845) -Land revaluation 56 - 136,097 - Total valuation and translation adjustments 57 - 136,055 -
Stock Acquisition Rights 58 - 67 - Total Shareholders' Equity 59 - 509,663 -Total Liabilities and Shareholders' Equity 60 - 1,496,657 -
- 31 -

Appropriation of retained earnings and Unconsolidated Statement of Shareholders' Equity
Appropriation of retained earnings
For the Years Ended March 31, 2006 and 2005 (in Japanese yen rounded to millions)
FY 2005Mar. 31, 2006
Unappropriated retained earnings/(deficit) 37,357
Reversal of reserve for advanced depreciation deduction of fixed assets 856
Reversal of reserve for special depreciation 205
Reversal of reserve for World Exposition 36
Total 38,455
They will be appropriated as follows:
Dividends 7,001(5 yen per share)
Reserve for advanced depriciation deduction of fixed assets 258
Reserve for special depreciation 33
Retained earnings/(deficit) carried forward 31,163
- 32 -

Balance at March 31, 2006 1Changes during the period:
Exercise of stock acquisition rights 23456789
Balance at March 31, 2007 10
Balance at March 31, 2006 11Changes during the period:
Exercise of stock acquisition rights 12131415161718
1920
Balance at March 31, 2007 21
Balance at March 31, 2006 22Changes during the period:
23
24
25
26
27
2829303132
Balance at March 31, 2007 33*1 Breakdown of transfer to and from reserve (deduction of fixed assets)
As approved by the general meeting of shareholders in June 2006 :As of the year ended March 31, 2007:
*2 Breakdown of transfer to and from reserve (special depreciation)As approved by the general meeting of shareholders in June 2006 :As of the year ended March 31, 2007:
*3 Breakdown of transfer to and from reserve (World exposition)As approved by the general meeting of shareholders in June 2006 :
Otherearned
surplus*
(335)
136,055
136,390
43,33793,968
(2,306)
Transfer to reserve - million yen Transfer from reserve 36 million yen
Retained earningsCapital and
Transfer to reserve - million yenTransfer to reserve 33 million yen Transfer from reserve 205 million yen
Transfer from reserve 203 million yen
--
Reserve fordeduction offixed assets
Transfer to reserve 258 million yen Transfer from reserve 856 million yenTransfer to reserve 17 million yen Transfer from reserve 1,083 million yen
(7,001)
10,778(1,664)
Unappropriatedretainedearnings
(1,940)
(145)(145)
73,990
12,442
Net unrealized gain (loss) onavailable-for-
securities
Reserve forspecial
depreciation
(215)
Net changes during the period
Reserve for land revaluation
(335)
37,357
(7,001)
(276)
1,940
(33)Transfer to reserve *2(special depreciation)Transfer from reserve *2(special depreciation)
Net income
Transfer from reserve *3(World exposition)
Reversal for land revaluation
Cash dividends paidTransfer to reserve *1(deduction of fixed assets)Transfer from reserve *1(deduction of fixed assets)
803 136,097
(in Japanese yen rounded to millions)* breakdown of other earned surplus
Net changes during the period
149,513 59,403
(in Japanese yen rounded to millions)
Re-issuance of treasury stock
Cash dividends paid
1,018 135,372
724(215)
Re-issuance of treasury stock
Cash dividends paid
Reversal for land revaluation
Net changes during the period
Reserve for land revaluation
Unconsolidated Statement of Shareholders' Equity
148,360
Paid-In Capital and Retained Earnings
58,250
Commonstock
OtherCapital
Capitalsurplus
Retainedearnings
Capitalreserve
Net income
Landrevaluation
Acquisition of treasury stock
Reserve for land revaluation
(in Japanese yen rounded to millions)
1,153 1,153
Reversal for land revaluation
Total paid - In
surplus Treasury
stock
Net incomeAcquisition of treasury stock
74,135
The year ended March 31, 2007
Valuation and Translation AdjustmentsTotal
Valuation andtranslation
adjustments
(845)
Net changes in accounts other thanpaid- in capital and retained earnings 724
-
(376)
1,153
-
Netgain (loss)
on derivativeinstruments
(845)(845)
276
421
Reserve forWorld
exposition36
(36)
(36)-
796
33
(409)
50,631
(7,001)(790)
6551,062
(1,672)
----
409
36(790)
6551,06245,41382,770
Stockacquisition
rights-
676767
Otherearnedsurplus
50,631
51,06243,337
-
-
-
-
50144,471
(790)65
646(1,026)(3,333)
(1,672)501
-
465,460
2,306
93,968
329,070
2,306(7,001)
(790)65
51,062(1,672)
(268)44,203
509,663
1,153
(7,001)(790)
6551,062
373,541
TotalShareholders'
Equity
- 33 -

6. Other
Production and Sales Information
1. Production Volume
Type
units units unitsPassenger cars 838,760 912,110 73,350
Trucks 65,460 55,121 (10,339)
Vehicles Total 904,220 967,231 63,011
Note: Production volume figures do not include those Mazda-brand vehicles produced by the following joint venture assembly plants with Ford (that are accounted for by the equity method):
Increase/ FY2005 FY2006 (Decrease)
AutoAlliance International, Inc. 74,260 units 71,534 (2,726) unitsAutoAlliance (Thailand) Co., Ltd. 35,003 units 43,566 8,563 units
2. Sales Volume and Revenue
Type
Volume Revenue Volume Revenue Volume Revenue
units million yen units million yen units million yen
1,148,653 2,121,485 1,176,673 2,385,710 28,020 264,225
- 123,812 - 102,467 - (21,345)
- 227,671 - 257,853 - 30,182
- 446,855 - 501,455 - 54,600
Total - 2,919,823 - 3,247,485 - 327,662
Sales Volume by Market
Type
units units units
Japan 290,012 263,673 (26,339)
North America 350,780 395,658 44,878
Europe 291,529 297,499 5,970
Others 216,332 219,843 3,511
Overseas Total 858,641 913,000 54,359
Total 1,148,653 1,176,673 28,020
Note: Above volume indicates consolidated wholesales volume by market.
FY2005
(April 2005 to March 2006)
FY2005
Vehicles
Parts
Others
Increase/
(Decrease)
Knockdown Parts (Overseas)
Increase/(Decrease)
Increase/
(Decrease)
FY2005(April 2005 to March 2006)
(April 2005 to March 2006)
FY2006
(April 2006 to March 2007)
FY2006(April 2006 to March 2007)
FY2006
(April 2006 to March 2007)
- 34 -

FY2006 Financial Summary (Consolidated)April 27, 2007
Mazda Motor Corporation
(in 100 millions of yen) FY2005 FY2006(in thousands of units) (Apr.05-Mar.06) (Apr.06-Mar.07)
(Upper left: Ratio on sales)% % %
Domestic 1 8,877 5.0 8,873 (0.0) 8,900 0.3
Overseas 2 20,321 9.8 23,602 16.1 24,300 3.0
Net sales 3 29,198 8.3 32,475 11.2 33,200 2.2
4.2% 4.9% 4.8%Operating income 4 1,234 48.8 1,585 28.4 1,600 0.9
3.5% 3.9% 4.2%Ordinary income 5 1,015 38.9 1,278 25.9 1,400 9.6
4.0% 3.6% 3.9%Income before taxes 6 1,175 59.1 1,185 0.8 1,300 9.8
2.3% 2.3% 2.6%Net income 7 667 45.7 737 10.5 850 15.3
Operating Japan 8 1,002 1,231income/(loss) North America 9 139 155by geographic Europe 10 96 155area Other 11 86 96Operating Profit Change
Volume & Mix 12 311 149Exchange Rate 13 400 (12)Product Enrichment 14 (187) (133)Cost Reduction 15 121 246Marketing Expense 16 1 (50)Other 17 (295) (185)
Total 18 351 15
Capital investment 21 721 796 940Depreciation and amortization 22 458 470 650R & D cost 23 957 1,076 1,200Total assets 24 17,887 19,078Shareholders' equity 25 3,980 4,799Financial debt 26 4,554 4,747Net financial debt 27 2,468 2,322Cash flow 28 336 210
Domestic 30 285 0.4 261 (8.6) 262 0.5
North America 31 352 3.2 380 8.0 403 6.1
Europe 32 282 3.4 301 6.7 321 5.6
China 33 130 35.4 129 (0.7) 105 (18.7)
Other 34 227 8.8 231 1.5 259 13.7
Overseas 35 991 7.9 1,041 5.0 1,088 4.5
Global retail volume 36 1,276 6.1 1,302 2.0 1,350 3.7
Number of employees(excluding dispatches) 36,626 38,004Notes:
- Commencing in the year ended March 31, 2007, the ASBJ Statement No.5, Accounting Standard for Presentation of Net Assetsin the Balance Sheet, was adopted. See Adoption of New Accounting Standards in the notes to the consolidated financial statements.
- Global retail volume refers to the total retail units of Mazda-brand vehicles sold on a global basis.North American volume includes the retail units of Mexico and Puerto Rico. Also, commencing in the year ending March 31, 2008, European volume includes the retail units of Turkey.(The year-over-year ratio for FY2007 is calculated by including the volume of Turkey in European volume of FY2006.)
117 yen/US$ 115 yen/US$Average rate for the period
all levels.Highest ever profits at
Sales and profits to increase for7 consecutive years.Highest ever profits at
all levels.
6 consecutive years.
Transaction rate
Performance of operations
138 yen/EUR113 yen/US$
19
20
FY2007 (Apr.07-Mar.08)
Projection
Sales and profits increased for
115 yen/US$ 115 yen/US$145 yen/EUR 151 yen/EUR
150 yen/EUR 153 yen/EUR
37
29
110 yen/US$137 yen/EUR

FY 2006 Financial Summary (Unconsolidated)Apr.27, 2007
Mazda Motor Corporation
( in 100 millions of yen) FY2007( in thousands of units) (Apr.07-Mar.08)
(Upper left: ratio on sales) Projection% % %
Domestic 1 6,708 +6.5 6,738 +0.5 6,800 +0.9
NetSales Export 2 13,613 +11.5 16,533 +21.4 17,100 +3.4
Total 3 20,321 +9.8 23,271 +14.5 23,900 +2.7
3.3% 3.8% 4.4%
Operating income 4 670 +165.8 888 +32.6 1,060 +19.4
3.0% 3.6% 4.1%
Ordinary income 5 602 +253.8 845 +40.4 980 +16.0
2.9% 3.2% 3.8%
Income before taxes 6 589 +287.8 748 +27.1 910 +21.7
0.5% 2.2% 2.4%
Net income 7 110 +78.7 511 +364.9 580 +13.6
113Yen/US$ 117Yen/US$ 115Yen/US$ Average rate for the period 8 138Yen/EUR 150Yen/EUR 153Yen/EUR
110Yen/US$ 115Yen/US$ 115Yen/US$ Transaction rate 9 137Yen/EUR 145Yen/EUR 151Yen/EUR
Capital investment 10 567 623 790
Depreciation and amortization 11 308 313 490
R & D cost 12 800 947 1,080
Total assets 13 13,956 14,967
Shareholders' Equity 14 4,655 5,097
Financial debts 15 3,485 3,884
Net financial debts 16 2,101 2,185
Domestic 17 311 +0.7 285 (8.4) 282 (1.0)
North America 18 296 +13.3 383 +29.1 356 (6.9)
Europe 19 260 +7.9 276 +6.3 318 +14.9
Others 20 196 +6.9 202 +3.2 223 +10.7
Wholesales 21 1,063 +6.9 1,146 +7.8 1,179 +2.9
Domestic production units 22 904 +11.3 967 +7.0 1,034 +6.9
Number of employees(Excluding dispatchees) 23 18,995 19,772
* Commencing in the year ended March 31, 2007 in the Mazda Motor Corporation (“the Company”) adopted the AccountingStandards Board of Japan (“ASBJ”) Statement No.5, Accounting Standards for Presentation of Net Assets in the Balance Sheet ,and the ASBJ Guidance No.8, Guidance on Accounting Standards for Presentation of Net Assets in the Balance Sheet , both issuedby the ASBJ on December 9, 2005.
FY2006 FY2005(Apr.06-Mar.07)(Apr.05-Mar.06)