fy2015 2nd quarter financial results ended september 30, 2014 · composition in asia & oceania...
TRANSCRIPT

FY2015 2nd Quarter Financial Results ended September 30, 2014
FY2015 2nd Quarter FY2015 2nd Quarter Financial ResultsFinancial Results ended September 30, 2014ended September 30, 2014
Quantum LeapQuantum Leap

1. FY2015 2nd Quarter Financial ResultsFY2015 2nd Quarter Financial Results 1) Overview of 2nd Quarter financial results 2) 2nd Quarter financial results for FY2015 3) Forecast for FY2015
2. Activities for Profit Improvement 1) By region (The Americas, Europe & Africa)
3. Improvement Efforts on Manufacturing 1) Initiatives to strengthen business foundation 2) New technology activities
Quantum LeapQuantum Leap

1. FY2015 2nd Quarter Financial ResultsFY2015 2nd Quarter Financial Results
Quantum LeapQuantum Leap
1) Overview of 2nd Quarter financial results
2) 2nd Quarter financial results for FY2015
3) Forecast for FY2015
1-1) Overview of 2nd Quarter financial results
1/20
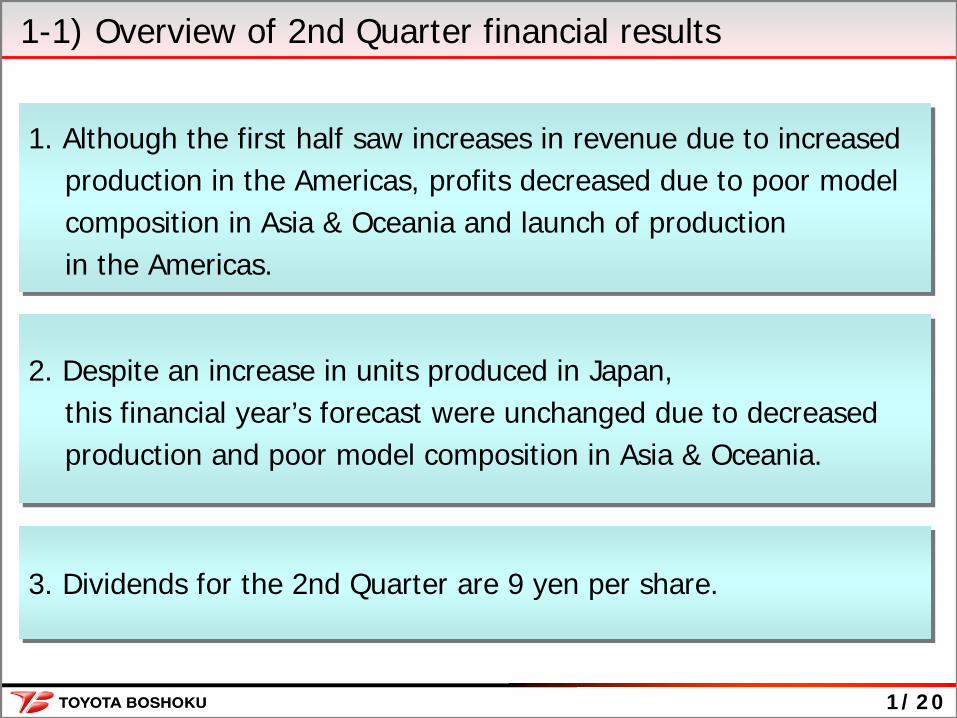
1. Although the first half saw increases in revenue due to increased production in the Americas, profits decreased due to poor model composition in Asia & Oceania and launch of production in the Americas.
1. Although the first half saw increases in revenue due to increased production in the Americas, profits decreased due to poor model composition in Asia & Oceania and launch of production in the Americas.
3. Dividends for the 2nd Quarter are 9 yen per share.3. Dividends for the 2nd Quarter are 9 yen per share.
2. Despite an increase in units produced in Japan, this financial year’s forecast were unchanged due to decreased production and poor model composition in Asia & Oceania.
2. Despite an increase in units produced in Japan, this financial year’s forecast were unchanged due to decreased production and poor model composition in Asia & Oceania.

1-2) 2nd Quarter financial results for FY2015
FY2014 2Q FY2015 2Q Fluctuation 1Q Estimate
Net Sales 5,921 100.0% 6,257 100.0% 335 5.7% 5,800 100.0%
Operating Income 161 2.7% 145 2.3% -16 -10.1% 90 1.6%
Ordinary Income 228 3.9% 189 3.0% -39 -17.2% 100 1.7%
Net Income 114 1.9% 87 1.4% -27 -24.0% 20 0.3%
Exchange Rate
US $ 99 yen 103 yen 4 yen(weak yen)
Euro 130 yen 139 yen 9 yen(weak yen)
Per Share Net Income 62.00 yen 47.15 yenPer Share CashDividend
9.00 yen 9.00 yen
2nd Quarter financial results for FY2015 (
100 million yen )
2/20

1-2) 2nd Quarter financial results for FY2015
0
400
Seat assembly productionSeat assembly production
FY2014 2Q FY2015 2Q
TotalTotal
(10,000 Units)
350 349
-1-0.3%
166156
6456
105 103
23 26
-10-6.0%
+8+14.3%
-2-1.9%
+3+13.0%
By regionBy region
3/20
FluctuationFluctuation Rate
(10,000 Units)
JapanAsia & Oceania
Europe & Africa
The Americas
Unit production by region
1-2) 2nd Quarter financial results for FY2015
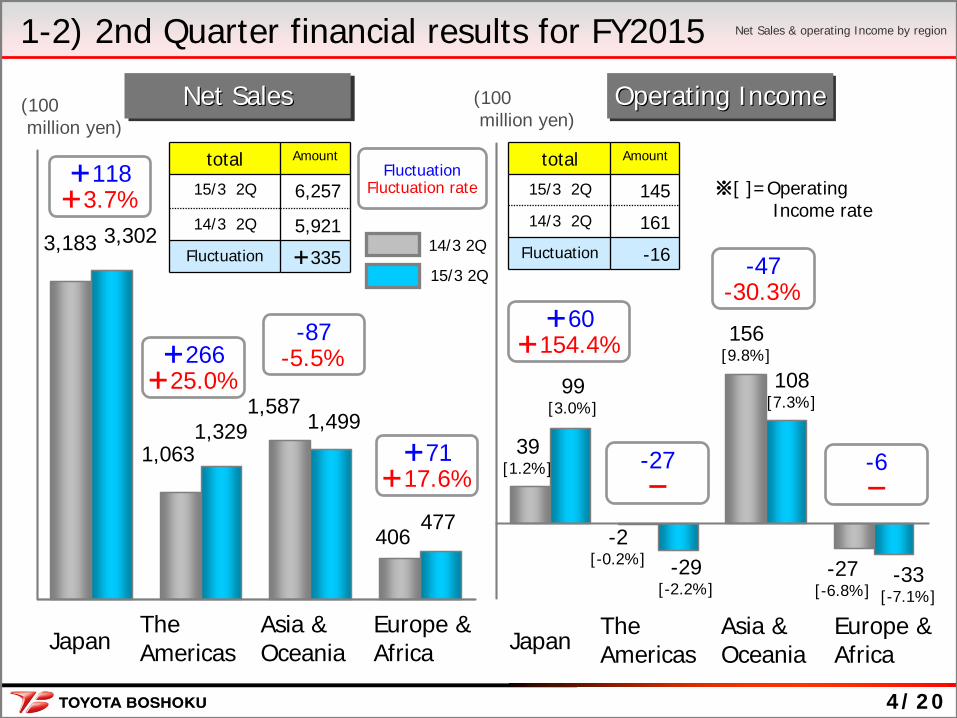
total Amount
15/3 2Q 6,257
14/3 2Q 5,921Fluctuation +335
total Amount
15/3 2Q 14514/3 2Q 161
Fluctuation -16
1,063
3,3023,183
1,3291,587
1,499
406477
+118+3.7%
+266+25.0%
-87-5.5%
+71+17.6%
39[1.2%]
99[3.0%]
-29[-2.2%]
-2[-0.2%]
156[9.8%]
108[7.3%]
-27[-6.8%]
-33[-7.1%]
+60+154.4%
-27-
-6-
-47-30.3%
Net SalesNet SalesNet Sales Operating IncomeOperating IncomeOperating Income
4/20
15/3 2Q
14/3 2Q
(100 million yen)
(100 million yen)
JapanAsia &Oceania
Europe & Africa
The Americas Japan
Asia &Oceania
Europe & Africa
The Americas
※[ ]=OperatingIncome rate
FluctuationFluctuation rate
Net Sales & operating Income by region

1-2) 2nd Quarter financial results for FY2015
228
-6
-40
Ordinary Income -39 (-17.2%)
14/3 2Q 15/3 2Q
189+81 -23
-5
-42-4
Operating Income -16 (-10.1%)
5/20
(100 million yen)
Effects ofdecreased production
Effectsfrom changes inproductprice Increased
overheadcosts
Effects of FOREX rate
Rationalization
Non-operatingincome
Effects of changes in accounting period
Ordinary Income Increase & Decrease Analysis

1-3) Forecast for FY2015
FY2014 Results
FY2015 Forecast Fluctuation Estimate at
1Q
Net Sales 12,183 100.0% 12,000 100.0% -183 -1.5% 12,000 100.0 %
Operating Income 288 2.4% 270 2.3% -18 -6.3% 270 2.3%
Ordinary Income 402 3.3% 290 2.4% -112 -28.0% 290 2.4%
Net Income 126 1.0% 120 1.0% -6 -4.8% 120 1.0%
Exchange Rate
US $ 100 yen 104 yen 4 yen(weak yen)
101 yen
Euro 134 yen 137 yen 3 yen(weak yen)
136 yen
Per Share Net Income 68.05 yen 64.76 yen 64.76 yenPer Share Cash Dividend
18.00 yen 18.00 yen 18.00 yen
Forecast for FY2015
6/20
(100 million yen)

1-3) Forecast for FY2015
0
100
200
300
400
500
600
700
800
900
1,000 +20+2.8%
707 727
-17-5.1%
+16+14.4%
+12+5.6%
+9+17.6%
332 315
127111
225
60
213
51
7/20
Seat assembly productionSeat assembly production
TotalTotal By RegionBy Region
(10,000 Units) (10,000 Units)
FY2014 FY2015(Forecast)
Japan Asia &Oceania
Europe & Africa
The Americas
Unit production by region
FluctuationFluctuation Rate
1-3) Forecast for FY2015
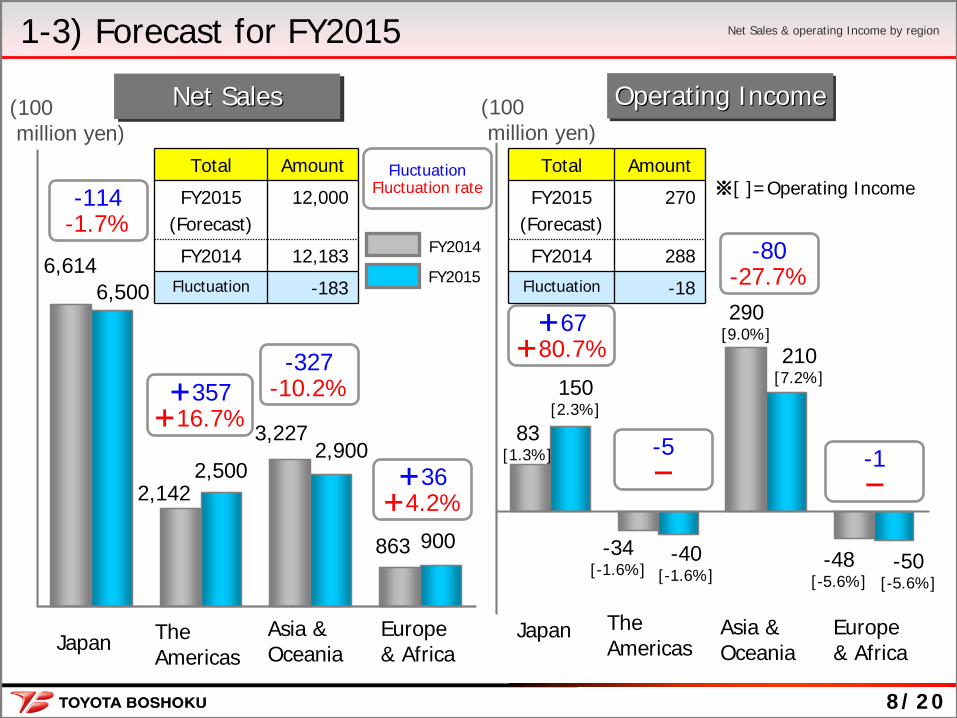
Total Amount
FY2015(Forecast)
12,000
FY2014 12,183
Fluctuation -183
Total Amount
FY2015(Forecast)
270
FY2014 288
Fluctuation -186,614
6,500
-114-1.7%
2,5002,142
2,9003,227
863 900
+36+4.2%
-327-10.2%+357
+16.7%150
[2.3%]
83[1.3%]
-34[-1.6%]
-40[-1.6%]
-48[-5.6%]
-50[-5.6%]
290[9.0%]
210[7.2%]
+67+80.7%
-5-
-80-27.7%
-1-
8/20
FY2015
FY2014
(100 million yen)
Net SalesNet SalesNet Sales Operating IncomeOperating IncomeOperating Income(100 million yen)
※[ ]=Operating Income
JapanAsia &Oceania
Europe& Africa
TheAmericas
Japan Asia &Oceania
Europe& Africa
TheAmericas
Net Sales & operating Income by region
FluctuationFluctuation rate

402
290
-33+186
-65
-94+2-102
-6
FY2014 FY2015(Forecast)
Ordinary Income -112 (-28.0%)
Operating Income -18 (-6.3%)
9/20
(100 million yen)
Effects ofdecreased income
Effectsfrom changes inproductprice
Increasedoverheadcosts
Effects of FOREX rate
Rationalization
Non-operatingincome
Effects of changes in accounting period
Ordinary Income Increase & Decrease Analysis1-3) Forecast for FY2015 Ordinary Income
Increase & Decrease Analysis

1) By region (The Americas, Europe & Africa)
2. Activities for Profit Improvement
Quantum LeapQuantum Leap

In-depth look at regional issues in the AmericasIn-depth look at regional issues in the Americas
2-1) By region (The Americas)
-32
-2
First-half Second-half
Operating income
-15
FY2014 Three target regions Three target regions
0
-29
-11
target results
(100 million yen)
First-half
target forecast
Second-half
1. Indiana1. Indiana
2. Mexico2. Mexico
3. Brazil3. Brazil
FY2015
Company unable to make up losses from launching production in Indiana and Mexico[Labor costs and rush shipping costs, etc.]
Company unable to make up losses from launching production in Indiana and Mexico[Labor costs and rush shipping costs, etc.]
Activities for profit improvement effective in reducing operatinglosses
Activities for profit improvement effective in reducing operatinglosses
10/20

Three target regions—solid implementation of activities for profit improvementThree target regions—solid implementation of activities for profit improvement
2-1) By region (The Americas)
FY2014 FY2015 FY2014 FY2015 FY2014 FY2015
1) Labor costs and rush shipping costs in response to changes in customers' quality standards
2) Delayed reduction in labor costs
1. Indiana1. Indiana 2. Mexico2. Mexico 3. Brazil3. Brazil
Follow-up on status of improvement progress at Profit Improvement Committee and active support by headquarters' functions
1) Borrowings for external warehousing needed due to insufficient space
2) Low employee retention rate, low work attendance
1) Production lower than forecast2) Delayed reduction in labor costs3) Increased costs for support of
new production
11/20
First-half Second-halfFirst-half Second-half First-half Second-halfFirst-half Second-half First-half Second-halfFirst-half Second-half

2-1) By region (Europe & Africa)
-21-27 -33 -17-25 -15
First-half Second-half
FY2014 FY2015Optimization of personnel
BAE headquarters' functions integrated with Europe RM&CH* TBEU so as to reduce scale and increase efficiency(2014.4)
Strongly promoting plant improvements
1. Headquarters' functions 1. Headquarters' functions
2. Manufacturing sector2. Manufacturing sector
Apart from effects of changes in accounting period, variations in currency exchange rates, and other transient factors, results roughly according to plan
Apart from effects of changes in accounting period, variations in currency exchange rates, and other transient factors, results roughly according to plan
( ): Effects of changesin accounting periodand FOREX rate
12/20
1) Improve productivity(Move from 3 to 2 shifts,Rationalization of workforce)
2) Enhancing Manufacturing sector,human resources development
((--7)7)
((--1)1)
(100 million yen)
Promoting Europe & Africa profit structure reform according to planPromoting Europe & Africa profit structure reform according to plan
First-half Second-half
target results target forecast
Operating income
*RM&CH = Regional Management & Collaboration Hubs

1) Initiatives to strengthen business foundation 2) New technology activities
3. Improvement Efforts on Manufacturing
Quantum LeapQuantum Leap

Measures targeting upcoming global modelsMeasures targeting upcoming global models3-1) Initiatives to strengthen business foundation [1]
《Target》Steady development and preparations for production to meet continued launch of production globally《Target》
Steady development and preparations for production to meet continued launch of production globally
Rapidly resolving problems globally at identical sites
Key personnel from production, development and technical departments worldwide meet together, confirm and work on issues using actual seats
Before:
After:Linking headquarters with each
production site, building in quality and resolving problems with each model launched
GMH
production entity
RM&CH*2Each production entity
production entity A
13/20
Standardize globalmodelsStandardize globalStandardize globalmodelsmodels
Reconsidering past modelsReconsidering past models
Reform process of development and preparations for production through upcoming global models
Reform process of development and Reform process of development and preparations for production through preparations for production through upcoming global modelsupcoming global models
production entity production entity
production entity
production entity
*1,2 GMH = Global Mainstay Hub (HQ); RM&CH = Regional Management & Collaboration Hubs
GMH*1
production entity B
production entity C

Strengthen optimized production system within global regions (Domestic)Strengthen optimized production system within global regions (Domestic)
3-1) Initiatives to strengthen business foundation [2]
1. Reorganize plants to secure profits
・
FHS product
・
Melt-blow product
・
Foam In Place seat
・
Leather seat cover
Consolidating operations to create free space
・Aggregates outdated supply processes・More compact volume production process
〔Before measures 〕 〔After measures 〕
Sub plantSub plant
Main plant
Main plant
2) Production of high value-added parts
2) Production of high value-added parts
Production process B
Production process A
Supplementary process A
Production process A B
Supplementary process A B
Supplementary process B
1) Condense processes1) Condense processes
14/20

3-1)
足元固めの取り組み②
15/20
2. Securing competitiveness in seat covers by optimizing assignment of production sites
労働集約型の縫製工程を分離移転することで労務費低減を図る労働集約型の縫製工程を分離移転することで労務費低減を図る
Close to customer
Reorganization of sewing processesReorganization of sewing processes
Car manufacturers
Seat assembly Cover sewing
J I T* Plant
*Just in time
Cover sewingdistribution
New production entity
Turkey :
TB Sewtech TurkeyAsia & Oceania
:
Toyota Boshoku LaoChina :
Heyuan Toyota BoshokuAutomotive parts
3-1)
足元固めの取り組み②
労働集約型の縫製工程を分離移転することで労務費低減を図る労働集約型の縫製工程を分離移転することで労務費低減を図る労働集約型の縫製工程を分離移転することで労務費低減を図る労働集約型の縫製工程を分離移転することで労務費低減を図る
3-1) Initiatives to strengthen business foundation [2]
Reducing labor costs by distributing labor-intensive sewing processes
Reducing labor costs by distributing labor-intensive sewing processes
Strengthen optimized production system within global regions (Overseas)Strengthen optimized production system within global regions (Overseas)

3-1) Initiatives to strengthen business foundation [2]
16/20
3. Measures for more efficient logistics in North America
North American regionsNorth American regions
Efforts to create optimal intra-regional logistics from North American regions Aiming to reduce logistics costs and CO2 emissions in each region
Efforts to create optimal intra-regional logistics from North American regions Aiming to reduce logistics costs and CO2 emissions in each region
North American regionsNorth American regions
Now:
Independent logistics for each plant
NowNow::
Independent logistics Independent logistics for each plantfor each plant
Plan:
Optimized within region(joint logistics)
Plan::
Optimized within regionOptimized within region(joint logistics)(joint logistics)
Plant A
Plant B
Plant C
Supplier A
Supplier B
Supplier C
Plant A
Plant B
Plant C
Supplier A
Supplier B
Supplier C
Transfer point
Transfer point▲
Strengthen optimized production system within global regions (Logistics)Strengthen optimized production system within global regions (Logistics)

LEXUS IS (2013)Sporty Sedan
LEXUS RC (2014)Coupe
LEXUS NX (2014)SUV
Promoting development of seats using the Foam In Place methodto enhance both design and hold performance
Use now increasing
Expanded use of Foam In Place seats Expanded use of Foam In Place seats
17/20
LEXUS RC-F (2014)
3-2) New technology activities [1]

Through vehicular testing on our proving ground,we perform dynamic evaluations with the aim of developing competitive, attractive products.
Name :
Toyota Boshoku Tajimi Technical Center
Location :
Tajimi City, Gifu Prefecture, Japan Area :
Site area is approx. 360,000 m2
the test course area is approx. 140,000 m2
Test course :
Track (total length: 1,800 m with a 670 m straight-line stretch of road)Course that recreates a wide variety of road surfaces
Trial operations have commenced at the Tajimi Technical Center proving groundTrial operations have commenced at the Tajimi Technical Center proving ground
3-2) New technology activities [2]
18/20

Expanding business by enhancing core technologiesExpanding business by enhancing core technologies
3-2) New technology activities [3]
Motor core for HVMotor core for HV
Round reclinersRound recliners
Seat framesSeat frames
Low pollution
Low fuel consumption
FHS
Method (Fine Hold Stamping)Precision stamping process
FHS
Method (Fine Hold Stamping)Precision stamping process
Expand business fields to Expand business fields to meet trend needsmeet trend needs
Competitive capacities in Competitive capacities in functional seat componentsfunctional seat components
Precise
Enhanced production
High-quality
Utilizing in next-generation key
automotive com
ponents U
tilizing in nextU
tilizing in next -- generation key generation key
automotive com
ponentsautom
otive components
19/20

3-2) New technology activities [3]Creation of high value-
added products Creation of high valueCreation of high value --
added productsadded products
Control of fiber diameter Producing even thinner fibers
Blending hybrid materials Developing fiber spinning technology Cabin air filtersCabin air filters
High performance filtersHigh performance filters
Hybrid materials
Fiber spinning
technology
Melt-blow methodUltra-precise fiber spinning technology
Melt-blow methodUltraUltra--precise fiber spinning technologyprecise fiber spinning technology
20/20
Low costFine fibers
Superior function
Expanding business by enhancing core technologiesExpanding business by enhancing core technologies

DisclaimerThis report contains forecasts and expectations that relate to future plans andstrategies in addition to the expected financial results of the Toyota BoshokuCorporation and the Toyota Boshoku group.Within are estimates based on assumptions and opinions that have been formedby the company from the information available at the time of writing. They involve risks and uncertainties. Accordingly, actual results may differ from the company's forecasts.
Design Your Passion