fy2016 trends in fisheries fy2017 fisheries policy … trends in fisheries fy2017 fisheries policy...
TRANSCRIPT
FY2016 Trends in Fisheries
FY2017 Fisheries Policy
White Paper on Fisheries: Summary

This document is a report on fisheries trends and the policyimplemented during FY2016 in accordance with the provisions ofArticle 10, paragraph (1) of the Fisheries Basic Act (Act No. 89 of2001) as well as the policy to be implemented in FY2017 inaccordance with the provisions of paragraph (2) of said Article.
Table of Contents
..........................................................................................................1....................................................1
.........................................................................................1...............................................................................2
.............................................................................................3
.....................................................................................................................................3.............................................................3
...............................................................................3......................................................................................3
..........................................................4......................................................4
........................................................................................5
...................................................................................................5
....................................................................................................................................5.........................................................................7
........................................................................................................7....................................................................8.....................................................................8
................................................................................8................................8
Chapter I Special FeatureJapan‘s Fisheries Connect to the World-An Answer to the International Sustainable Use of Fishery Resources-
FY2016 Trends in Fisheries
Section 1 Status of World Fisheries(1) The World’s Increasing Demands for Fish and Fishery Products(2) Trends in the World Fisheries Resources(3) Production of World Fisheries and Aquaculture(4) World’s Fisheries Production Structure(5) Global Fisheries Sustainable Development and International Resource
ManagementSection 2 International Situation Surrounding Japan’s Fisheries
(1) International Situation on Distant Water Fishery(2) International Situation on Offshore Fishery(3) International Situation Surrounding Japan’s Coastal Fishery(4) Japan’s Fisheries Being Strongly Tied to International Society
Section 3 International Fisheries Management(1) International Framework for Fisheries Management based on the “UN
Convention on the Law of the Sea”(2) International Resource Management by Regional Fisheries Management
Organizations(3) Marine Environmental Conservation and Fisheries(4) Implementation of International Conservation and Management Measures
Undertaken by Country/RegionSection 4 Sustainable Fisheries in the International Society
(1) Resource Management in Pursuit of Sustainable Use(2) Establishing a Robust Implementation System(3) Japan, As a Responsible Fishing Nation/Fishery Product Consuming Nation
..................................9...........................................................................9
......................................................................................9..........................................................10
....................................................................11.........................................................................................11
..............................................................................12.................................................................................................12
.............................................................................................12.....................................................................................................13
..........................................................................................................14...........................................15
.............................................................................................................15..................................................................................................15
.....................................16
.................................................................................................................17...............................................................17.............................................................17
........................................................................................................................18........................................................................19
...................................................20
...................................................20.........................................................................20
...........................21................................................................................................21
.......................................................21
.....................................................................................................................21
....................................................................................................................................23
.................................................24
Chapter II Trends in Japan’�s Fisheries Since FY2015
Section 1 Trends in Fisheries Resources and the Fishing Ground Environment(1) Fisheries Resources in the Waters around Japan(2) Japan’s Fisheries Resource Management(3) Approaches to Practical, Effective Resource Management(4) Measures to Actively Enhance Fisheries Resources(5) Trends in Fishing Ground Environment(6) Effects and Measures of Wildlife on Fisheries
Section 2 Trends in Japan�’s Fisheries(1) Trends in Fisheries and Aquaculture(2) Trends in Fishery Management(3) Trends in Number of Fishers(4) Provision of a Safe and Healthy Working Environment for Fisheries(5) Development of New Technologies and Introduction into Actual Fisheries in
Fisheries and Aquaculture(6) Trends in Fisheries Cooperatives(7) Trends in the Distribution and Processing of Fish and Fishery Products
Section 3 Trends in the Supply-Demand and Consumption of Fish and Fishery Products in Japan
(1) Supply-demand Situation in Fish and Fishery Products(2) Status of the Consumption of Fish and Fishery Products(3) Approaches to Ensuring Information Provision to Consumers and to Protecting
Intellectual Property(4) Trends in the Trade of Fish and Fishery Products(5) Situations in Trade Negotiations on Fish and Fishery Products
Section 4 Development of Safe and Dynamic Fishing Communities(1) Current Status and Role of Fishing Communities(2) Development of Safe Fishing Communities Where People Can Live in Peace(3) Activation of Fishing Communities
Section 5 Reconstruction from the Great East Japan Earthquake(1) Conditions of the Restoration/Reconstruction from the Earthquake Damages in
the Fisheries Industry(2) Response to the Impact of the Accident at TEPCO’s Fukushima Daiichi Nuclear
Power Plant
Prize winners at the 2016 Agriculture, Forestry, and Fisheries Festival
“FY 2017 Fisheries Policy” Overview 25Note: The maps in this document do not necessarily inclusively show Japan�s territory.
Chapter 1 Special Feature Japanese Fisheries Connect to the World -An Answer to the International Sustainable Use of Fishery Resources-
Section 1 Status of World Fisheries(1) The World’s Increasing Demands for Fish and Fishery Products
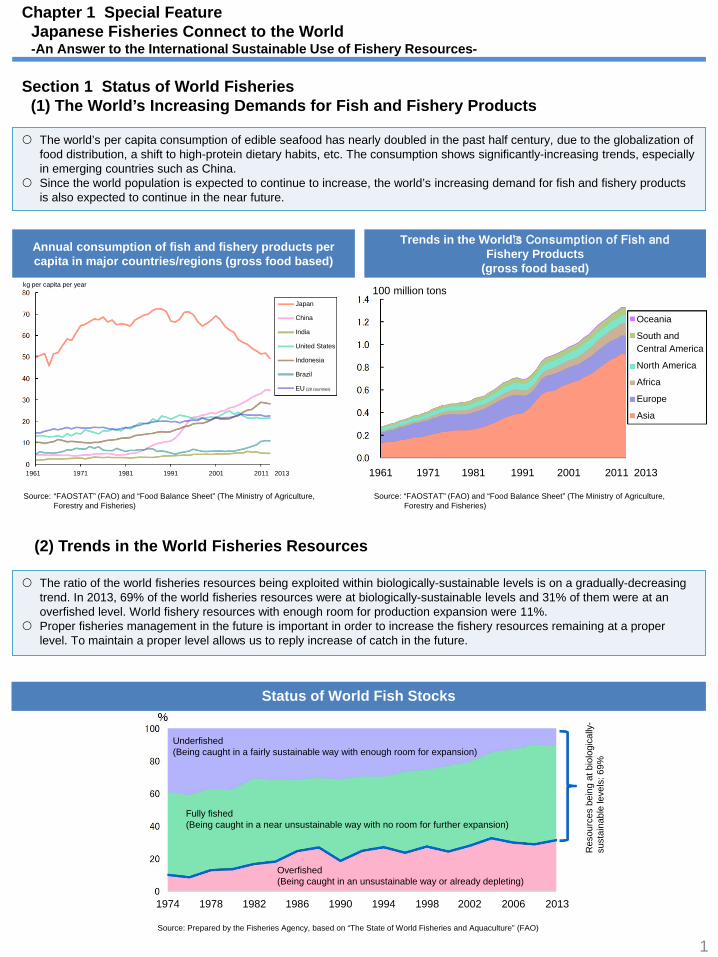
The world’s per capita consumption of edible seafood has nearly doubled in the past half century, due to the globalization of food distribution, a shift to high-protein dietary habits, etc. The consumption shows significantly-increasing trends, especially in emerging countries such as China.
Since the world population is expected to continue to increase, the world’s increasing demand for fish and fishery products is also expected to continue in the near future.
Source: “FAOSTAT” (FAO) and “Food Balance Sheet” (The Ministry of Agriculture, Forestry and Fisheries)
1
Status of World Fish Stocks
Source: Prepared by the Fisheries Agency, based on “The State of World Fisheries and Aquaculture” (FAO)
Trends in the World�’s Consumption of Fish and Fishery Products
(gross food based)
The ratio of the world fisheries resources being exploited within biologically-sustainable levels is on a gradually-decreasing trend. In 2013, 69% of the world fisheries resources were at biologically-sustainable levels and 31% of them were at an overfished level. World fishery resources with enough room for production expansion were 11%.
Proper fisheries management in the future is important in order to increase the fishery resources remaining at a proper level. To maintain a proper level allows us to reply increase of catch in the future.
(2) Trends in the World Fisheries Resources
Annual consumption of fish and fishery products per capita in major countries/regions (gross food based)
Source: “FAOSTAT” (FAO) and “Food Balance Sheet” (The Ministry of Agriculture, Forestry and Fisheries)
kg per capita per year
Japan
China
India
United States
Indonesia
Brazil
EU (28 countries)
1961 1971 1981 1991 2001 2011 2013 1961 1971 1981 1991 2001 2011 2013
100 million tons
Oceania
South and Central America
North America
Africa
Europe
Asia
1974 1978 1982 1986 1990 1994 1998 2002 2006 2013
Underfished(Being caught in a fairly sustainable way with enough room for expansion)
Fully fished(Being caught in a near unsustainable way with no room for further expansion)
Overfished(Being caught in an unsustainable way or already depleting)
Res
ourc
es b
eing
at b
iolo
gica
lly-
sust
aina
ble
leve
ls: 6
9%
(3) Production of World Fisheries and Aquaculture
Source: “Fishstat” (FAO) and “Fisheries and Aquaculture Production Statistics” (The Ministry of Agriculture, Forestry and Fisheries, Japan)Note: Distinguishing between developed and developing countries was based on the definition by the United Nations.
2
Trends in Catches in the World’s Major Fishing Countries and Regions
Source: “Fishstat” (FAO) and “Fisheries and Aquaculture Production Statistics” (The Ministry of Agriculture, Forestry and Fisheries, Japan)
Trends in Production Volume of World’s Fisheries and Aquaculture
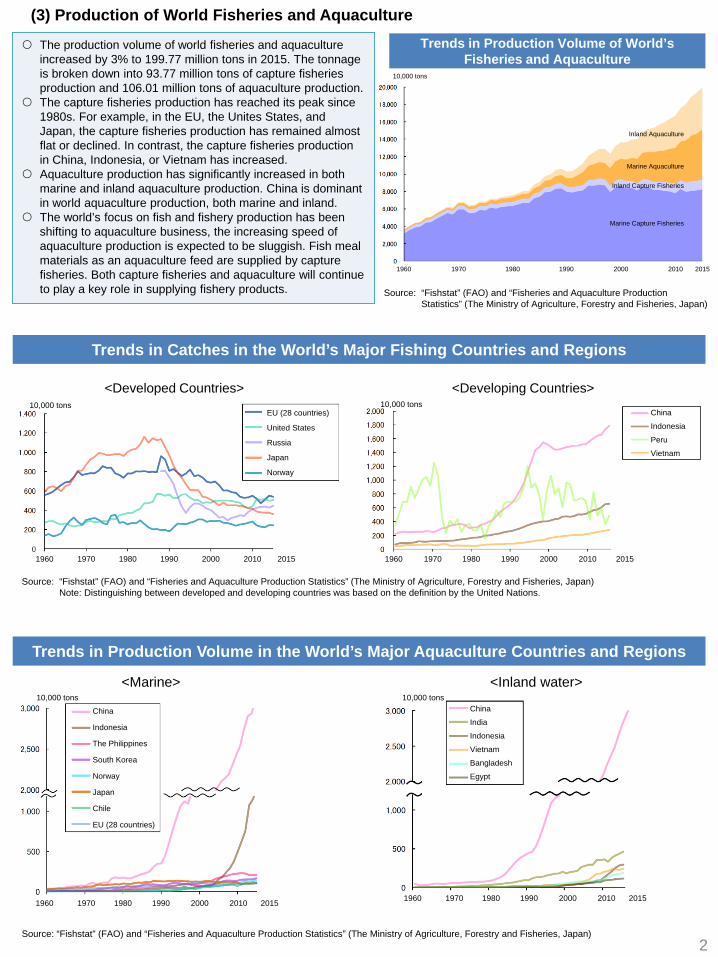
The production volume of world fisheries and aquaculture increased by 3% to 199.77 million tons in 2015. The tonnage is broken down into 93.77 million tons of capture fisheries production and 106.01 million tons of aquaculture production.
The capture fisheries production has reached its peak since 1980s. For example, in the EU, the Unites States, and Japan, the capture fisheries production has remained almost flat or declined. In contrast, the capture fisheries production in China, Indonesia, or Vietnam has increased.
Aquaculture production has significantly increased in both marine and inland aquaculture production. China is dominant in world aquaculture production, both marine and inland.
The world’s focus on fish and fishery production has been shifting to aquaculture business, the increasing speed of aquaculture production is expected to be sluggish. Fish meal materials as an aquaculture feed are supplied by capture fisheries. Both capture fisheries and aquaculture will continue to play a key role in supplying fishery products.
Trends in Production Volume in the World’s Major Aquaculture Countries and Regions
Source: “Fishstat” (FAO) and “Fisheries and Aquaculture Production Statistics” (The Ministry of Agriculture, Forestry and Fisheries, Japan)
<Developed Countries> <Developing Countries>
<Marine> <Inland water>
10,000 tons
1960 1970 1980 1990 2000 2010 2015
Inland Aquaculture
Marine Aquaculture
Inland Capture Fisheries
Marine Capture Fisheries
1960
10,000 tons
1970 1980 1990 2000 2010 2015
EU (28 countries)
United States
Russia
Japan
Norway
1960 1970 1980 1990 2000 2010 2015
10,000 tonsChina
Indonesia
Peru
Vietnam
10,000 tons 10,000 tons
1960 1970 1980 1990 2000 2010 2015
China
Indonesia
The Philippines
South Korea
Norway
Japan
Chile
EU (28 countries)
1960 1970 1980 1990 2000 2010 2015
China
India
Indonesia
Vietnam
Bangladesh
Egypt
(4) World’s Fisheries Production Structure
3
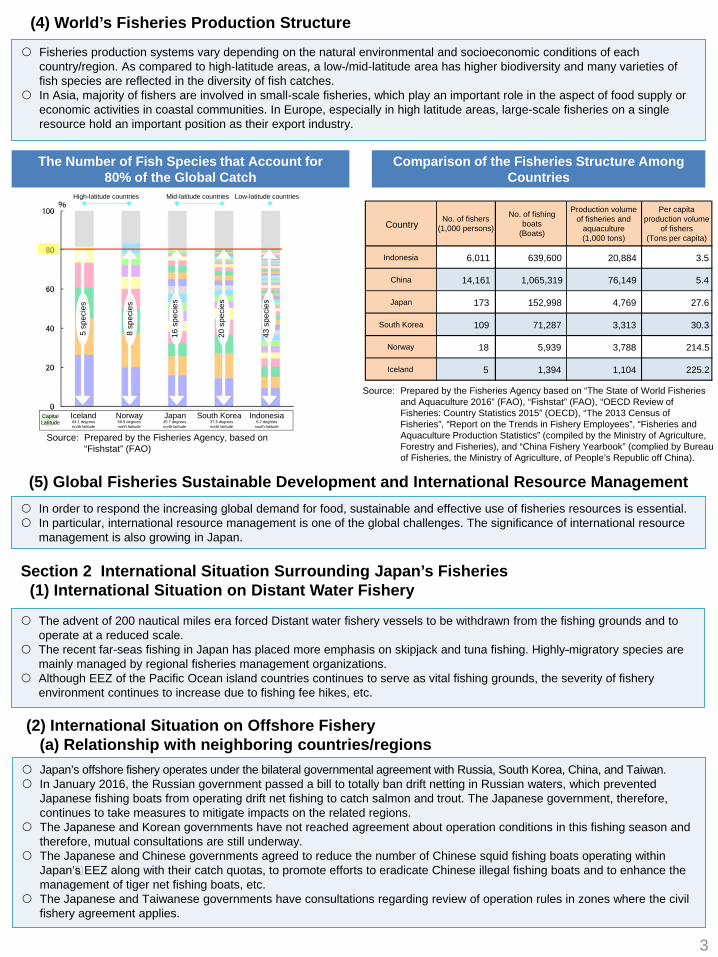
Fisheries production systems vary depending on the natural environmental and socioeconomic conditions of each country/region. As compared to high-latitude areas, a low-/mid-latitude area has higher biodiversity and many varieties of fish species are reflected in the diversity of fish catches.
In Asia, majority of fishers are involved in small-scale fisheries, which play an important role in the aspect of food supply oreconomic activities in coastal communities. In Europe, especially in high latitude areas, large-scale fisheries on a single resource hold an important position as their export industry.
Section 2 International Situation Surrounding Japan’s Fisheries(1) International Situation on Distant Water Fishery
The advent of 200 nautical miles era forced Distant water fishery vessels to be withdrawn from the fishing grounds and to operate at a reduced scale.
The recent far-seas fishing in Japan has placed more emphasis on skipjack and tuna fishing. Highly-migratory species are mainly managed by regional fisheries management organizations.
Although EEZ of the Pacific Ocean island countries continues to serve as vital fishing grounds, the severity of fishery environment continues to increase due to fishing fee hikes, etc.
The Number of Fish Species that Account for 80% of the Global Catch
Source: Prepared by the Fisheries Agency based on “The State of World Fisheries and Aquaculture 2016” (FAO), “Fishstat” (FAO), “OECD Review of Fisheries: Country Statistics 2015” (OECD), “The 2013 Census of Fisheries”, “Report on the Trends in Fishery Employees”, “Fisheries and Aquaculture Production Statistics” (compiled by the Ministry of Agriculture, Forestry and Fisheries), and “China Fishery Yearbook” (complied by Bureau of Fisheries, the Ministry of Agriculture, of People’s Republic off China).
Comparison of the Fisheries Structure Among Countries
Source: Prepared by the Fisheries Agency, based on “Fishstat” (FAO)
In order to respond the increasing global demand for food, sustainable and effective use of fisheries resources is essential. In particular, international resource management is one of the global challenges. The significance of international resource
management is also growing in Japan.
(5) Global Fisheries Sustainable Development and International Resource Management
(2) International Situation on Offshore Fishery(a) Relationship with neighboring countries/regions
Japan’s offshore fishery operates under the bilateral governmental agreement with Russia, South Korea, China, and Taiwan. In January 2016, the Russian government passed a bill to totally ban drift netting in Russian waters, which prevented
Japanese fishing boats from operating drift net fishing to catch salmon and trout. The Japanese government, therefore, continues to take measures to mitigate impacts on the related regions.
The Japanese and Korean governments have not reached agreement about operation conditions in this fishing season and therefore, mutual consultations are still underway.
The Japanese and Chinese governments agreed to reduce the number of Chinese squid fishing boats operating within Japan’�s EEZ along with their catch quotas, to promote efforts to eradicate Chinese illegal fishing boats and to enhance the management of tiger net fishing boats, etc.
The Japanese and Taiwanese governments have consultations regarding review of operation rules in zones where the civil fishery agreement applies.
High-latitude countries Mid-latitude countries Low-latitude countries
5 sp
ecie
s
8 sp
ecie
s
16 s
peci
es
20 s
peci
es
43 s
peci
es
Capital Latitude
Iceland Norway Japan South Korea Indonesia64.1 degrees north latitude
35.7 degrees north latitude
37.5 degrees north latitude
6.2 degrees south latitude
59.9 degrees north latitude
Country No. of fishers(1,000 persons)
Indonesia 6,011 639,600 20,884 3.5
China 14,161 1,065,319 76,149 5.4
Japan 173 152,998 4,769 27.6
South Korea 109 71,287 3,313 30.3
Norway 18 5,939 3,788 214.5
Iceland 5 1,394 1,104 225.2
No. of fishing boats
(Boats)
Production volume of fisheries and
aquaculture(1,000 tons)
Per capita production volume
of fishers(Tons per capita)
4
In recent years, increasing numbers of foreign large scale purse seine boats significantly raised the catches of skipjack in the western and central Pacific. This pointed out the possibility of having reduced migration of this species in the seas around Japan through its range contraction.
(c) Impact of Skipjack Catches in Tropical Waters on Japan
(3) International Situation Surrounding Japan’s Coastal Fishery In Japan, coastal fishing harvests Pacific saury, mackerels, skipjack, Pacific bluefin tuna, and other finfish species. In the
management and use of these fishery resources, taking actions with global perspectives will play a key role. The most urgent issue facing Pacific bluefin tuna is recovering the stock under international cooperation initiatives.
Management of this stock needs to be strengthened on step-by-step basis, in accordance with the international agreement made at the Western and Central Pacific Fisheries Commission (WCPFC).
In 2018 and beyond, Japan will apply the TAC system to Pacific bluefin tuna, so that the catches can be quickly and correctly grasped and further can be suitably managed.
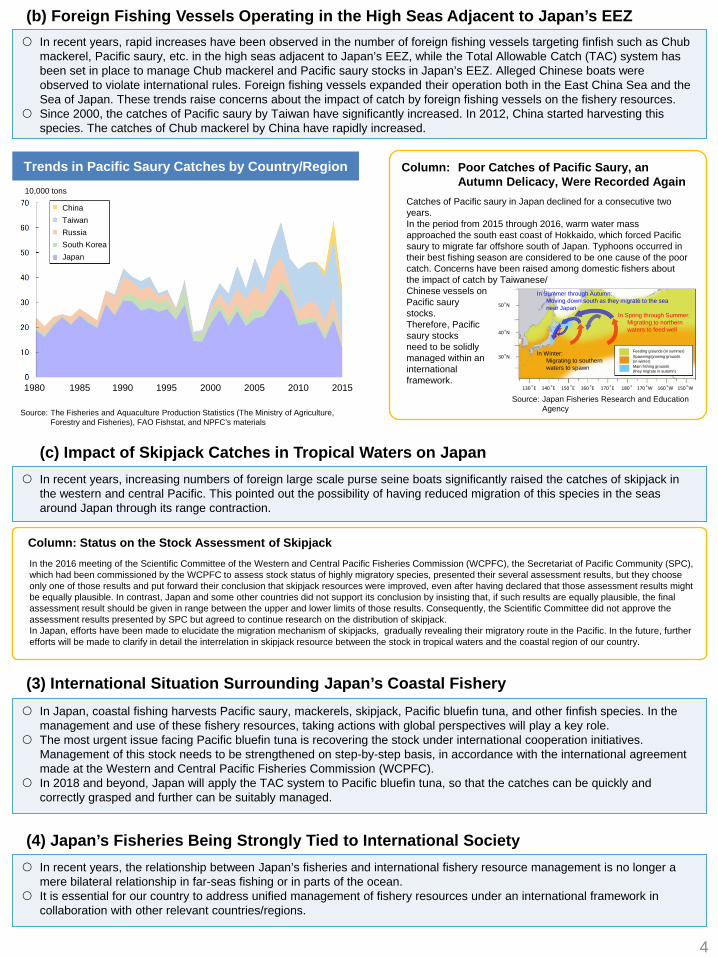
(b) Foreign Fishing Vessels Operating in the High Seas Adjacent to Japan’s EEZ In recent years, rapid increases have been observed in the number of foreign fishing vessels targeting finfish such as Chub
mackerel, Pacific saury, etc. in the high seas adjacent to Japan’s EEZ, while the Total Allowable Catch (TAC) system has been set in place to manage Chub mackerel and Pacific saury stocks in Japan’s EEZ. Alleged Chinese boats were observed to violate international rules. Foreign fishing vessels expanded their operation both in the East China Sea and the Sea of Japan. These trends raise concerns about the impact of catch by foreign fishing vessels on the fishery resources.
Since 2000, the catches of Pacific saury by Taiwan have significantly increased. In 2012, China started harvesting this species. The catches of Chub mackerel by China have rapidly increased.
Trends in Pacific Saury Catches by Country/Region
Source: The Fisheries and Aquaculture Production Statistics (The Ministry of Agriculture, Forestry and Fisheries), FAO Fishstat, and NPFC’s materials
Column: Poor Catches of Pacific Saury, an Autumn Delicacy, Were Recorded Again
Catches of Pacific saury in Japan declined for a consecutive two years.In the period from 2015 through 2016, warm water mass approached the south east coast of Hokkaido, which forced Pacific saury to migrate far offshore south of Japan. Typhoons occurred in their best fishing season are considered to be one cause of the poor catch. Concerns have been raised among domestic fishers about the impact of catch by Taiwanese/Chinese vessels on Pacific saury stocks. Therefore, Pacific saury stocks need to be solidlymanaged within an international framework.
In recent years, the relationship between Japan’s fisheries and international fishery resource management is no longer a mere bilateral relationship in far-seas fishing or in parts of the ocean.
It is essential for our country to address unified management of fishery resources under an international framework in collaboration with other relevant countries/regions.
(4) Japan’s Fisheries Being Strongly Tied to International Society
Column: Status on the Stock Assessment of SkipjackIn the 2016 meeting of the Scientific Committee of the Western and Central Pacific Fisheries Commission (WCPFC), the Secretariat of Pacific Community (SPC), which had been commissioned by the WCPFC to assess stock status of highly migratory species, presented their several assessment results, but they choose only one of those results and put forward their conclusion that skipjack resources were improved, even after having declared that those assessment results might be equally plausible. In contrast, Japan and some other countries did not support its conclusion by insisting that, if such results are equally plausible, the final assessment result should be given in range between the upper and lower limits of those results. Consequently, the Scientific Committee did not approve the assessment results presented by SPC but agreed to continue research on the distribution of skipjack.In Japan, efforts have been made to elucidate the migration mechanism of skipjacks, gradually revealing their migratory route in the Pacific. In the future, further efforts will be made to clarify in detail the interrelation in skipjack resource between the stock in tropical waters and the coastal region of our country.
Source: Japan Fisheries Research and Education Agency
1980 1985 1990 1995 2000 2005 2010 2015
10,000 tons
ChinaTaiwanRussiaSouth KoreaJapan
In Summer through Autumn:Moving down south as they migrate to the sea near Japan
In Spring through Summer:Migrating to northern waters to feed well
In Winter: Migrating to southern waters to spawn
Feeding grounds (in summer)Spawning/growing grounds (in winter)Main fishing grounds (they migrate in autumn)
140 °E 150 °E 160 °E 170°E 180° 160 °W170°W130 °E 150°W
30°N
40°N
50°N
(2) International Resource Management by Regional Fisheries ManagementOrganizations
(a) Regional Fisheries Management Organizations Managing Tunas Species
5
The “United Nations Convention on the Law of the Sea” which forms the basis of maritime order also provides the basic rules for fisheries. The coastal State exercises its sovereign right for fisheries resources within EEZ, States concerned cooperate to manage highly migratory fish stocks via international organizations, and the flag States are responsible for fishing vessels in the high seas.
The “UN Fish Stocks Agreement”, which is an agreement to implementing the “UN Convention on the Law of the Sea”, is a basic framework for the management of fisheries in the high seas and internationally-utilized fishery resources. The UN Fish Stocks Agreement articulates that regional fisheries management organizations shall play a central role in international fisheries resource management. In addition, the agreement introduces the concepts of “the precautionary approach” and “the ecosystem approach”.
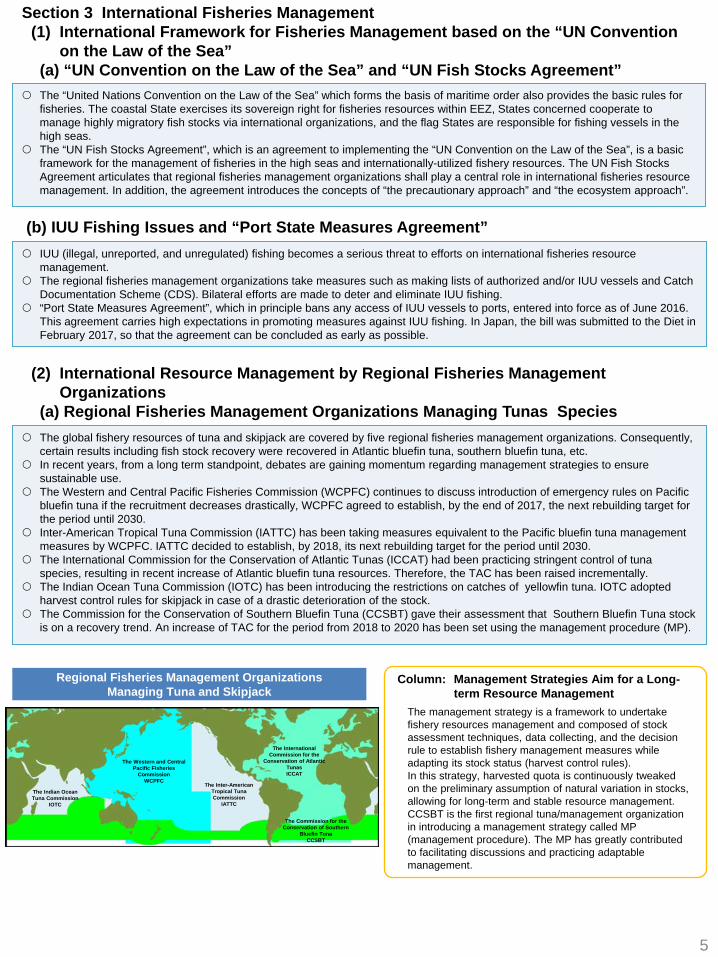
The global fishery resources of tuna and skipjack are covered by five regional fisheries management organizations. Consequently,certain results including fish stock recovery were recovered in Atlantic bluefin tuna, southern bluefin tuna, etc.
In recent years, from a long term standpoint, debates are gaining momentum regarding management strategies to ensure sustainable use.
The Western and Central Pacific Fisheries Commission (WCPFC) continues to discuss introduction of emergency rules on Pacific bluefin tuna if the recruitment decreases drastically, WCPFC agreed to establish, by the end of 2017, the next rebuilding target for the period until 2030.
Inter-American Tropical Tuna Commission (IATTC) has been taking measures equivalent to the Pacific bluefin tuna management measures by WCPFC. IATTC decided to establish, by 2018, its next rebuilding target for the period until 2030.
The International Commission for the Conservation of Atlantic Tunas (ICCAT) had been practicing stringent control of tuna species, resulting in recent increase of Atlantic bluefin tuna resources. Therefore, the TAC has been raised incrementally.
The Indian Ocean Tuna Commission (IOTC) has been introducing the restrictions on catches of yellowfin tuna. IOTC adopted harvest control rules for skipjack in case of a drastic deterioration of the stock.
The Commission for the Conservation of Southern Bluefin Tuna (CCSBT) gave their assessment that Southern Bluefin Tuna stock is on a recovery trend. An increase of TAC for the period from 2018 to 2020 has been set using the management procedure (MP).
Section 3 International Fisheries Management(1) International Framework for Fisheries Management based on the “UN Convention
on the Law of the Sea”(a) “UN Convention on the Law of the Sea” and “UN Fish Stocks Agreement”
(b) IUU Fishing Issues and “Port State Measures Agreement” IUU (illegal, unreported, and unregulated) fishing becomes a serious threat to efforts on international fisheries resource
management. The regional fisheries management organizations take measures such as making lists of authorized and/or IUU vessels and Catch
Documentation Scheme (CDS). Bilateral efforts are made to deter and eliminate IUU fishing. “Port State Measures Agreement”, which in principle bans any access of IUU vessels to ports, entered into force as of June 2016.
This agreement carries high expectations in promoting measures against IUU fishing. In Japan, the bill was submitted to the Diet in February 2017, so that the agreement can be concluded as early as possible.
Column: Management Strategies Aim for a Long-term Resource Management
The management strategy is a framework to undertake fishery resources management and composed of stock assessment techniques, data collecting, and the decision rule to establish fishery management measures while adapting its stock status (harvest control rules).In this strategy, harvested quota is continuously tweaked on the preliminary assumption of natural variation in stocks, allowing for long-term and stable resource management.CCSBT is the first regional tuna/management organization in introducing a management strategy called MP (management procedure). The MP has greatly contributed to facilitating discussions and practicing adaptable management.
Regional Fisheries Management Organizations Managing Tuna and Skipjack
The Indian Ocean Tuna Commission
IOTC
The Western and Central Pacific Fisheries
CommissionWCPFC
The Inter-American Tropical Tuna Commission
IATTC
The International Commission for the
Conservation of Atlantic TunasICCAT
The Commission for the Conservation of Southern
Bluefin TunaCCSBT
(c) IWC Managing Whale Resources
6
New regional fisheries management organizations for fishery resources other than tuna and skipjack were established one after another.
The North Pacific Fisheries Commission (NPFC) was established in 2015 under the leadership of Japan, whose purpose is to manage fishery species such as Pacific saury, chub mackerel, North Pacific armorhead, etc. in the high sea area adjacent to the Japan’s EEZ in the North Pacific.
The NPFC agreed to refrain from a rapid increase in the number of saury fishing vessels operating in the high seas until the introduction of a new conservation and management measure based on the stock assessment (scheduled to take place in 2017). The NPFC also agreed to complete the stock assessment on chub mackerel as soon as possible, and until then encourages the Members to refrain from an increase in the number of chub mackerel fishing vessels operating in the high seas. NPFC is moving forward for the introduction of full-fledged conservation and management measures.
Japan considers that whales are, like other fisheries resources, important food resources that can be used in a sustainable manner. Japan has been working through the International Whaling Commission (IWC) to resume sustainable commercial whaling. But regrettably, due to the fundamental differences in positions between those countries who support sustainable use of whales and anti-whaling countries, IWC cannot adopt any conservation and management measures for sustainable commercial whaling.
In order to obtain scientific evidences necessary for the resuming of sustainable commercial whaling, Japan is conducting scientific whale research programs. Japan undertook the second year of the New Scientific Whale Research Program in the Antarctic Ocean (NEWREP-A) during the period from December 2016 to March 2017. In addition, the proposal for the Research Plan for New Scientific Whale Research Program in the western North Pacific (NEWREP-NP) was submitted to IWC’s scientific committee, of which objectives are to contribute to optimizing the catch limits of common minke whales around the coastal waters of Japan as well as to calculating catch limits of sei whales offshore the country.
Bearing in mind that there is fundamental differences in positions regarding whales and whaling among the members of the IWC, in IWC Commission meeting 2016, Japan made a proposal to discuss a way forward of the IWC. Japan will lead future discussions on this subject.
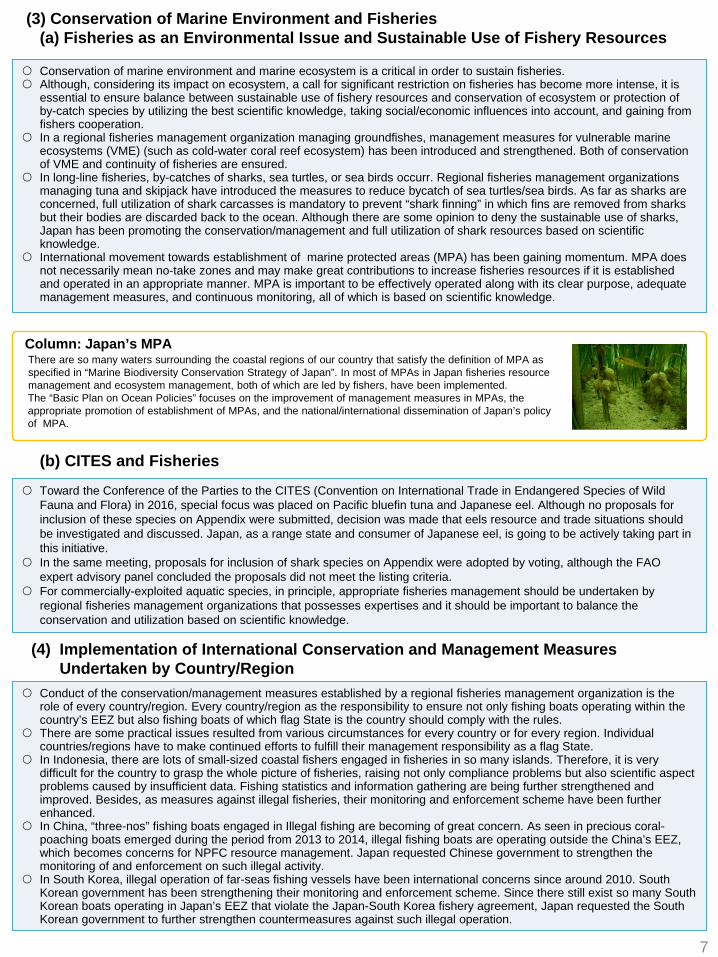
(b) Regional Fisheries Management Organizations Managing Resources other thanTunas Species
Major Regional Fisheries Management Organizations Managing Other Resources than Tunas and Skipjacks
Note: Japan is neither currently a member of SPRFMO nor of NEAFC.
Column: Stock Assessment on Pacific Bluefin Tuna
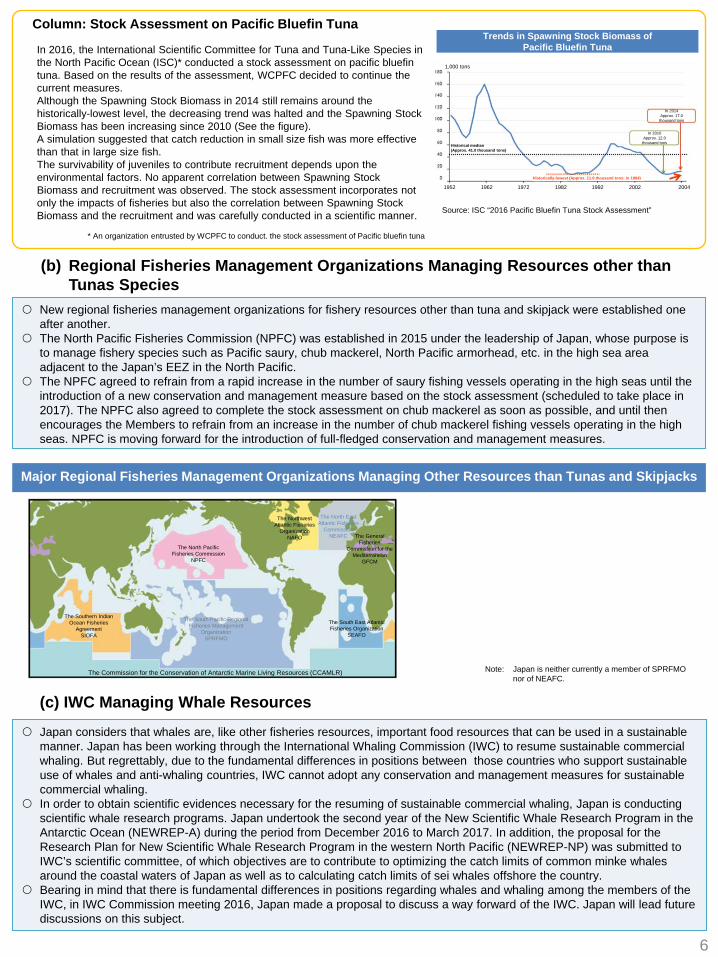
In 2016, the International Scientific Committee for Tuna and Tuna-Like Species in the North Pacific Ocean (ISC)* conducted a stock assessment on pacific bluefintuna. Based on the results of the assessment, WCPFC decided to continue the current measures.Although the Spawning Stock Biomass in 2014 still remains around the historically-lowest level, the decreasing trend was halted and the Spawning Stock Biomass has been increasing since 2010 (See the figure).A simulation suggested that catch reduction in small size fish was more effective than that in large size fish.The survivability of juveniles to contribute recruitment depends upon the environmental factors. No apparent correlation between Spawning Stock Biomass and recruitment was observed. The stock assessment incorporates not only the impacts of fisheries but also the correlation between Spawning Stock Biomass and the recruitment and was carefully conducted in a scientific manner.
Trends in Spawning Stock Biomass of Pacific Bluefin Tuna
* An organization entrusted by WCPFC to conduct. the stock assessment of Pacific bluefin tuna
Source: ISC “2016 Pacific Bluefin Tuna Stock Assessment”
1,000 tons
Historical median (Approx. 41.0 thousand tons)
Historically-lowest (Approx. 11.0 thousand tons: in 1984)
In 2014Approx. 17.0
thousand tons
In 2010Approx. 12.0
thousand tons
1952 1962 1972 1982 1992 2002 2004
The Southern Indian Ocean Fisheries
AgreementSIOFA
The North Pacific Fisheries Commission
NPFC
The South Pacific Regional Fisheries Management
OrganizationSPRFMO
The Northwest Atlantic Fisheries
OrganizationNAFO
The North East Atlantic Fisheries
CommissionNEAFC The General
Fisheries Commission for the
MediterraneanGFCM
The South East Atlantic Fisheries Organization
SEAFO
The Commission for the Conservation of Antarctic Marine Living Resources (CCAMLR)
7
Conservation of marine environment and marine ecosystem is a critical in order to sustain fisheries. Although, considering its impact on ecosystem, a call for significant restriction on fisheries has become more intense, it is
essential to ensure balance between sustainable use of fishery resources and conservation of ecosystem or protection of by-catch species by utilizing the best scientific knowledge, taking social/economic influences into account, and gaining from fishers cooperation.
In a regional fisheries management organization managing groundfishes, management measures for vulnerable marine ecosystems (VME) (such as cold-water coral reef ecosystem) has been introduced and strengthened. Both of conservation of VME and continuity of fisheries are ensured.
In long-line fisheries, by-catches of sharks, sea turtles, or sea birds occurr. Regional fisheries management organizations managing tuna and skipjack have introduced the measures to reduce bycatch of sea turtles/sea birds. As far as sharks are concerned, full utilization of shark carcasses is mandatory to prevent “shark finning” in which fins are removed from sharks but their bodies are discarded back to the ocean. Although there are some opinion to deny the sustainable use of sharks, Japan has been promoting the conservation/management and full utilization of shark resources based on scientific knowledge.
International movement towards establishment of marine protected areas (MPA) has been gaining momentum. MPA does not necessarily mean no-take zones and may make great contributions to increase fisheries resources if it is established and operated in an appropriate manner. MPA is important to be effectively operated along with its clear purpose, adequate management measures, and continuous monitoring, all of which is based on scientific knowledge.
(3) Conservation of Marine Environment and Fisheries(a) Fisheries as an Environmental Issue and Sustainable Use of Fishery Resources
Toward the Conference of the Parties to the CITES (Convention on International Trade in Endangered Species of Wild Fauna and Flora) in 2016, special focus was placed on Pacific bluefin tuna and Japanese eel. Although no proposals for inclusion of these species on Appendix were submitted, decision was made that eels resource and trade situations should be investigated and discussed. Japan, as a range state and consumer of Japanese eel, is going to be actively taking part in this initiative.
In the same meeting, proposals for inclusion of shark species on Appendix were adopted by voting, although the FAO expert advisory panel concluded the proposals did not meet the listing criteria.
For commercially-exploited aquatic species, in principle, appropriate fisheries management should be undertaken by regional fisheries management organizations that possesses expertises and it should be important to balance the conservation and utilization based on scientific knowledge.
(b) CITES and Fisheries
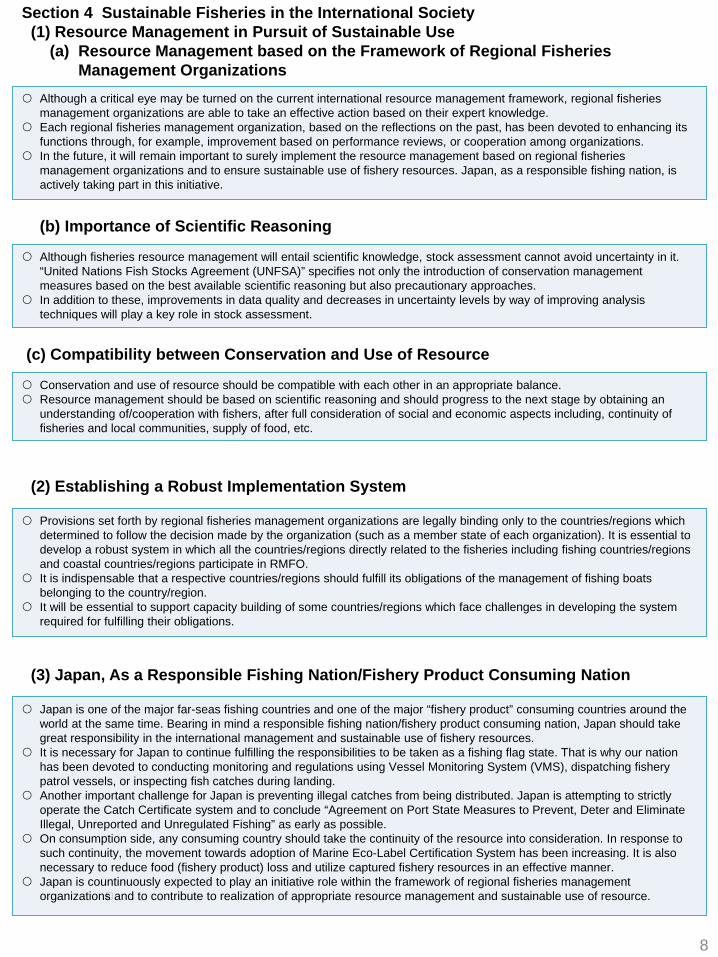
Column: Japan’s MPAThere are so many waters surrounding the coastal regions of our country that satisfy the definition of MPA as specified in “Marine Biodiversity Conservation Strategy of Japan”. In most of MPAs in Japan fisheries resource management and ecosystem management, both of which are led by fishers, have been implemented.The “Basic Plan on Ocean Policies” focuses on the improvement of management measures in MPAs, the appropriate promotion of establishment of MPAs, and the national/international dissemination of Japan’s policy of MPA.
Conduct of the conservation/management measures established by a regional fisheries management organization is the role of every country/region. Every country/region as the responsibility to ensure not only fishing boats operating within the country’s EEZ but also fishing boats of which flag State is the country should comply with the rules.
There are some practical issues resulted from various circumstances for every country or for every region. Individual countries/regions have to make continued efforts to fulfill their management responsibility as a flag State.
In Indonesia, there are lots of small-sized coastal fishers engaged in fisheries in so many islands. Therefore, it is very difficult for the country to grasp the whole picture of fisheries, raising not only compliance problems but also scientific aspect problems caused by insufficient data. Fishing statistics and information gathering are being further strengthened and improved. Besides, as measures against illegal fisheries, their monitoring and enforcement scheme have been further enhanced.
In China, “three-nos” fishing boats engaged in Illegal fishing are becoming of great concern. As seen in precious coral-poaching boats emerged during the period from 2013 to 2014, illegal fishing boats are operating outside the China’s EEZ, which becomes concerns for NPFC resource management. Japan requested Chinese government to strengthen the monitoring of and enforcement on such illegal activity.
In South Korea, illegal operation of far-seas fishing vessels have been international concerns since around 2010. South Korean government has been strengthening their monitoring and enforcement scheme. Since there still exist so many South Korean boats operating in Japan’s EEZ that violate the Japan-South Korea fishery agreement, Japan requested the South Korean government to further strengthen countermeasures against such illegal operation.
(4) Implementation of International Conservation and Management MeasuresUndertaken by Country/Region
8
Section 4 Sustainable Fisheries in the International Society(1) Resource Management in Pursuit of Sustainable Use
(a) Resource Management based on the Framework of Regional FisheriesManagement Organizations
Although a critical eye may be turned on the current international resource management framework, regional fisheries management organizations are able to take an effective action based on their expert knowledge.
Each regional fisheries management organization, based on the reflections on the past, has been devoted to enhancing its functions through, for example, improvement based on performance reviews, or cooperation among organizations.
In the future, it will remain important to surely implement the resource management based on regional fisheries management organizations and to ensure sustainable use of fishery resources. Japan, as a responsible fishing nation, is actively taking part in this initiative.
(b) Importance of Scientific Reasoning
Although fisheries resource management will entail scientific knowledge, stock assessment cannot avoid uncertainty in it. “United Nations Fish Stocks Agreement (UNFSA)” specifies not only the introduction of conservation management measures based on the best available scientific reasoning but also precautionary approaches.
In addition to these, improvements in data quality and decreases in uncertainty levels by way of improving analysis techniques will play a key role in stock assessment.
(c) Compatibility between Conservation and Use of Resource
Conservation and use of resource should be compatible with each other in an appropriate balance. Resource management should be based on scientific reasoning and should progress to the next stage by obtaining an
understanding of/cooperation with fishers, after full consideration of social and economic aspects including, continuity of fisheries and local communities, supply of food, etc.
(2) Establishing a Robust Implementation System
Provisions set forth by regional fisheries management organizations are legally binding only to the countries/regions which determined to follow the decision made by the organization (such as a member state of each organization). It is essential to develop a robust system in which all the countries/regions directly related to the fisheries including fishing countries/regions and coastal countries/regions participate in RMFO.
It is indispensable that a respective countries/regions should fulfill its obligations of the management of fishing boats belonging to the country/region.
It will be essential to support capacity building of some countries/regions which face challenges in developing the system required for fulfilling their obligations.
(3) Japan, As a Responsible Fishing Nation/Fishery Product Consuming Nation
Japan is one of the major far-seas fishing countries and one of the major “fishery product” consuming countries around the world at the same time. Bearing in mind a responsible fishing nation/fishery product consuming nation, Japan should take great responsibility in the international management and sustainable use of fishery resources.
It is necessary for Japan to continue fulfilling the responsibilities to be taken as a fishing flag state. That is why our nation has been devoted to conducting monitoring and regulations using Vessel Monitoring System (VMS), dispatching fishery patrol vessels, or inspecting fish catches during landing.
Another important challenge for Japan is preventing illegal catches from being distributed. Japan is attempting to strictly operate the Catch Certificate system and to conclude “Agreement on Port State Measures to Prevent, Deter and Eliminate Illegal, Unreported and Unregulated Fishing” as early as possible.
On consumption side, any consuming country should take the continuity of the resource into consideration. In response to such continuity, the movement towards adoption of Marine Eco-Label Certification System has been increasing. It is also necessary to reduce food (fishery product) loss and utilize captured fishery resources in an effective manner.
Japan is countinuously expected to play an initiative role within the framework of regional fisheries management organization�s and to contribute to realization of appropriate resource management and sustainable use of resource.
Chapter II Trends in Japan’s Fisheries Since FY2015
Section 1 Trends in Fisheries Resources and the Fishing Ground Environment(1) Fisheries Resources in the Waters around Japan
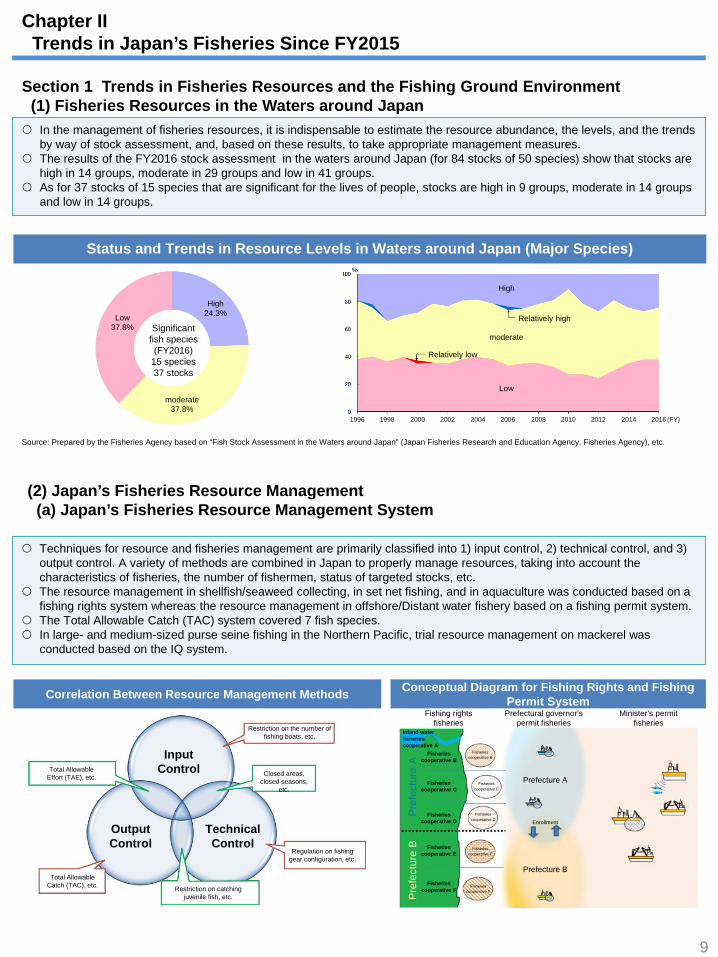
In the management of fisheries resources, it is indispensable to estimate the resource abundance, the levels, and the trends by way of stock assessment, and, based on these results, to take appropriate management measures.
The results of the FY2016 stock assessment in the waters around Japan (for 84 stocks of 50 species) show that stocks are high in 14 groups, moderate in 29 groups and low in 41 groups.
As for 37 stocks of 15 species that are significant for the lives of people, stocks are high in 9 groups, moderate in 14 groups and low in 14 groups.
Source: Prepared by the Fisheries Agency based on “Fish Stock Assessment in the Waters around Japan” (Japan Fisheries Research and Education Agency, Fisheries Agency), etc.
Techniques for resource and fisheries management are primarily classified into 1) input control, 2) technical control, and 3)output control. A variety of methods are combined in Japan to properly manage resources, taking into account the characteristics of fisheries, the number of fishermen, status of targeted stocks, etc.
The resource management in shellfish/seaweed collecting, in set net fishing, and in aquaculture was conducted based on a fishing rights system whereas the resource management in offshore/Distant water fishery based on a fishing permit system.
The Total Allowable Catch (TAC) system covered 7 fish species. In large- and medium-sized purse seine fishing in the Northern Pacific, trial resource management on mackerel was
conducted based on the IQ system.
(2) Japan’s Fisheries Resource Management(a) Japan’s Fisheries Resource Management System
Conceptual Diagram for Fishing Rights and Fishing Permit System
9
Status and Trends in Resource Levels in Waters around Japan (Major Species)
Fishing rights fisheries
Correlation Between Resource Management Methods
Low 37.8%
High 24.3%
moderate 37.8%
Significant fish species (FY2016)
15 species37 stocks
High
Relatively high
moderate
Relatively low
Low
1996 1998 2000 2002 2004 2006 2008 2010 2012 2014 2016
Restriction on the number of fishing boats, etc.
Input Control Closed areas,
closed seasons, etc.
Technical Control
Regulation on fishing gear configuration, etc.
Restriction on catching juvenile fish, etc.
Output Control
Total Allowable Catch (TAC), etc.
Total Allowable Effort (TAE), etc.
Prefectural governor’s permit fisheries
Minister’s permit fisheries
Inland water fisheries cooperative A
Fisheries cooperative B
Fisheries cooperative C
Fisheries cooperative D
Fisheries cooperative E
Fisheries cooperative F
Fisheries cooperative B
Fisheries cooperative C
Fisheries cooperative D
Fisheries cooperative E
Fisheries cooperative F
Pre
fect
ure
AP
refe
ctur
e B
Prefecture A
Prefecture B
Enrollment
(FY)
(b) Fishers’ Voluntary Resource Management In Japan, not only statutory regulations but also fisher’s� voluntary management, which imposes limits on fishing periods, fish
lengths, operating time, or fishing areas, play a key role in fisheries resource management. The central and prefectural governments set the Resource Management Guidelines from 2011, based on which the groups
of fishers developed and implemented their own resource management plans. The resource management and income stability measure is provided for fishers who are systematically engaged in resource management.
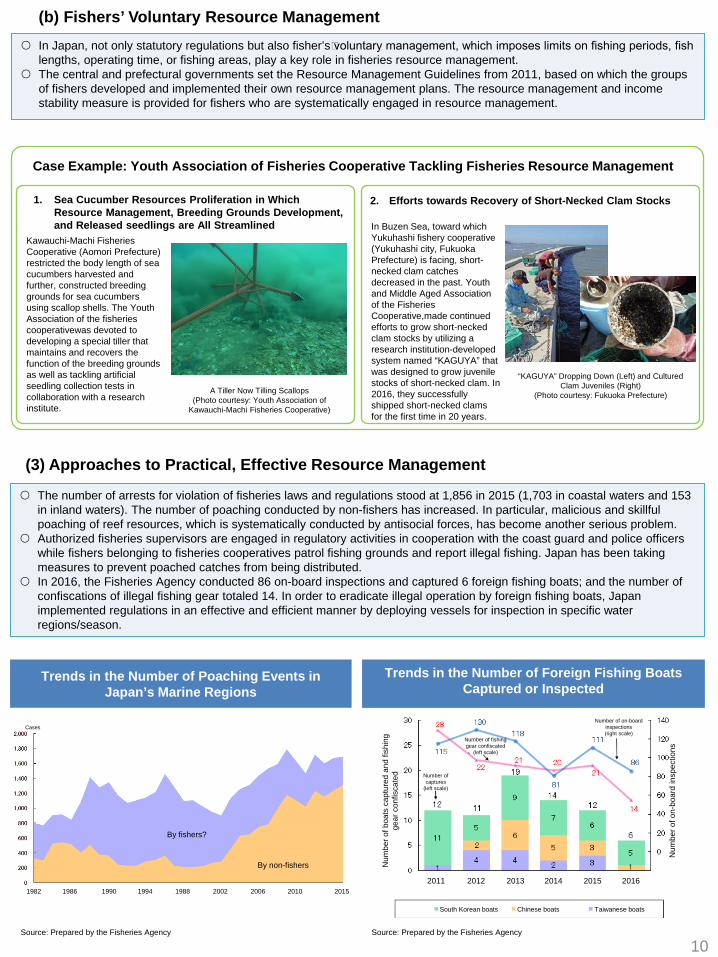
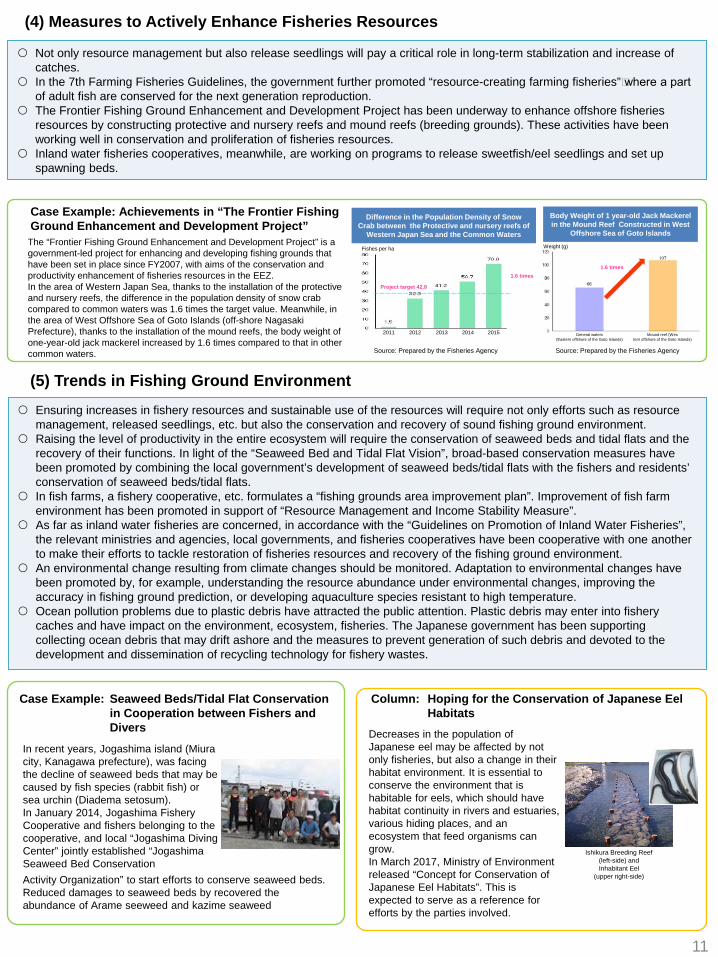
The number of arrests for violation of fisheries laws and regulations stood at 1,856 in 2015 (1,703 in coastal waters and 153in inland waters). The number of poaching conducted by non-fishers has increased. In particular, malicious and skillful poaching of reef resources, which is systematically conducted by antisocial forces, has become another serious problem.
Authorized fisheries supervisors are engaged in regulatory activities in cooperation with the coast guard and police officerswhile fishers belonging to fisheries cooperatives patrol fishing grounds and report illegal fishing. Japan has been taking measures to prevent poached catches from being distributed.
In 2016, the Fisheries Agency conducted 86 on-board inspections and captured 6 foreign fishing boats; and the number of confiscations of illegal fishing gear totaled 14. In order to eradicate illegal operation by foreign fishing boats, Japan implemented regulations in an effective and efficient manner by deploying vessels for inspection in specific water regions/season.
(3) Approaches to Practical, Effective Resource Management
Case Example: Youth Association of Fisheries Cooperative Tackling Fisheries Resource Management
1. Sea Cucumber Resources Proliferation in WhichResource Management, Breeding Grounds Development,and Released seedlings are All Streamlined
Kawauchi-Machi Fisheries Cooperative (Aomori Prefecture) restricted the body length of sea cucumbers harvested and further, constructed breeding grounds for sea cucumbers using scallop shells. The Youth Association of the fisheries cooperativewas devoted to developing a special tiller that maintains and recovers the function of the breeding grounds as well as tackling artificial seedling collection tests in collaboration with a research institute.
2. Efforts towards Recovery of Short-Necked Clam Stocks
In Buzen Sea, toward which Yukuhashi fishery cooperative (Yukuhashi city, Fukuoka Prefecture) is facing, short-necked clam catches decreased in the past. Youth and Middle Aged Association of the Fisheries Cooperative,made continued efforts to grow short-necked clam stocks by utilizing a research institution-developed system named “KAGUYA” that was designed to grow juvenile stocks of short-necked clam. In 2016, they successfully shipped short-necked clams for the first time in 20 years.
10
Trends in the Number of Foreign Fishing Boats Captured or Inspected
Source: Prepared by the Fisheries Agency
Trends in the Number of Poaching Events in Japan’s Marine Regions
Source: Prepared by the Fisheries Agency
A Tiller Now Tilling Scallops (Photo courtesy: Youth Association of
Kawauchi-Machi Fisheries Cooperative)
“KAGUYA” Dropping Down (Left) and Cultured Clam Juveniles (Right)
(Photo courtesy: Fukuoka Prefecture)
Cases
By fishers?
By non-fishers
1982 1986 1990 1994 1988 2002 2006 2010 2015
Number of fishing gear confiscated
(left scale)
Num
ber o
f boa
ts c
aptu
red
and
fishi
ng
gear
con
fisca
ted
Number of on-board inspections (right scale)
Num
ber o
f on-
boar
d in
spec
tions
Number of captures
(left scale)
South Korean boats Chinese boats Taiwanese boats
2011 2012 2013 2014 2015 2016
(4) Measures to Actively Enhance Fisheries Resources
Not only resource management but also release seedlings will pay a critical role in long-term stabilization and increase of catches.
In the 7th Farming Fisheries Guidelines, the government further promoted “resource-creating farming fisheries”� where a part of adult fish are conserved for the next generation reproduction.
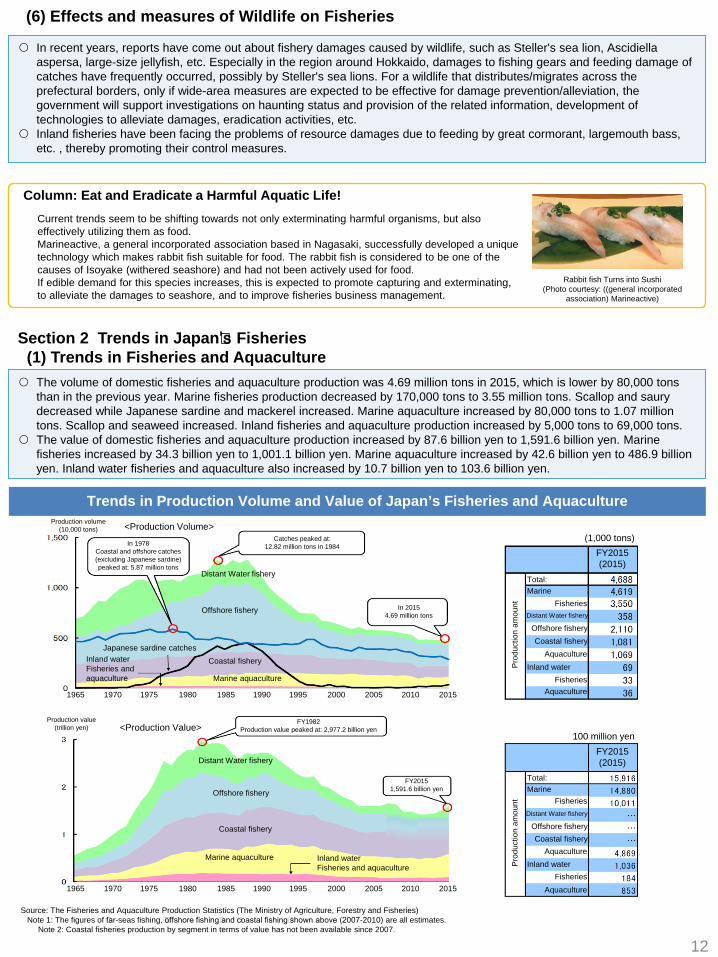
The Frontier Fishing Ground Enhancement and Development Project has been underway to enhance offshore fisheries resources by constructing protective and nursery reefs and mound reefs (breeding grounds). These activities have been working well in conservation and proliferation of fisheries resources.
Inland water fisheries cooperatives, meanwhile, are working on programs to release sweetfish/eel seedlings and set up spawning beds.
Column: Hoping for the Conservation of Japanese Eel Habitats
Decreases in the population of Japanese eel may be affected by not only fisheries, but also a change in their habitat environment. It is essential to conserve the environment that is habitable for eels, which should have habitat continuity in rivers and estuaries, various hiding places, and an ecosystem that feed organisms can grow.In March 2017, Ministry of Environment released “Concept for Conservation of Japanese Eel Habitats”. This is expected to serve as a reference for efforts by the parties involved.
Ensuring increases in fishery resources and sustainable use of the resources will require not only efforts such as resource management, released seedlings, etc. but also the conservation and recovery of sound fishing ground environment.
Raising the level of productivity in the entire ecosystem will require the conservation of seaweed beds and tidal flats and the recovery of their functions. In light of the “Seaweed Bed and Tidal Flat Vision”, broad-based conservation measures have been promoted by combining the local government’s development of seaweed beds/tidal flats with the fishers and residents’ conservation of seaweed beds/tidal flats.
In fish farms, a fishery cooperative, etc. formulates a “fishing grounds area improvement plan”. Improvement of fish farm environment has been promoted in support of “Resource Management and Income Stability Measure”.
As far as inland water fisheries are concerned, in accordance with the “Guidelines on Promotion of Inland Water Fisheries”, the relevant ministries and agencies, local governments, and fisheries cooperatives have been cooperative with one another to make their efforts to tackle restoration of fisheries resources and recovery of the fishing ground environment.
An environmental change resulting from climate changes should be monitored. Adaptation to environmental changes have been promoted by, for example, understanding the resource abundance under environmental changes, improving the accuracy in fishing ground prediction, or developing aquaculture species resistant to high temperature.
Ocean pollution problems due to plastic debris have attracted the public attention. Plastic debris may enter into fishery caches and have impact on the environment, ecosystem, fisheries. The Japanese government has been supporting collecting ocean debris that may drift ashore and the measures to prevent generation of such debris and devoted to the development and dissemination of recycling technology for fishery wastes.
(5) Trends in Fishing Ground Environment
11
Case Example: Achievements in “The Frontier Fishing Ground Enhancement and Development Project”
The “Frontier Fishing Ground Enhancement and Development Project” is a government-led project for enhancing and developing fishing grounds that have been set in place since FY2007, with aims of the conservation and productivity enhancement of fisheries resources in the EEZ.In the area of Western Japan Sea, thanks to the installation of the protective and nursery reefs, the difference in the population density of snow crab compared to common waters was 1.6 times the target value. Meanwhile, in the area of West Offshore Sea of Goto Islands (off-shore Nagasaki Prefecture), thanks to the installation of the mound reefs, the body weight of one-year-old jack mackerel increased by 1.6 times compared to that in other common waters.
Case Example: Seaweed Beds/Tidal Flat Conservation in Cooperation between Fishers and Divers
In recent years, Jogashima island (Miura city, Kanagawa prefecture), was facing the decline of seaweed beds that may be caused by fish species (rabbit fish) or sea urchin (Diadema setosum).In January 2014, Jogashima Fishery Cooperative and fishers belonging to the cooperative, and local “Jogashima Diving Center” jointly established “Jogashima Seaweed Bed Conservation
Body Weight of 1 year-old Jack Mackerel in the Mound Reef Constructed in West
Offshore Sea of Goto Islands
Source: Prepared by the Fisheries Agency Source: Prepared by the Fisheries Agency
Difference in the Population Density of Snow Crab between the Protective and nursery reefs of
Western Japan Sea and the Common Waters
Ishikura Breeding Reef (left-side) andInhabitant Eel
(upper right-side)Activity Organization” to start efforts to conserve seaweed beds.Reduced damages to seaweed beds by recovered the abundance of Arame seeweed and kazime seaweed
Fishes per ha
2011 2012 2013 2014 2015
Project target 42.8
1.6 times1.6 times
Weight (g)
General waters (Eastern offshore of the Goto Islands)
Mound reef (Western offshore of the Goto Islands)
Source: The Fisheries and Aquaculture Production Statistics (The Ministry of Agriculture, Forestry and Fisheries) Note 1: The figures of �far-seas fishing,� �offshore fishing� and �coastal fishing� shown above (2007-2010) are all estimates.
Note 2: Coastal fisheries production by segment in terms of value has not been available since 2007.
(6) Effects and measures of Wildlife on Fisheries
In recent years, reports have come out about fishery damages caused by wildlife, such as Steller's sea lion, Ascidiella aspersa, large-size jellyfish, etc. Especially in the region around Hokkaido, damages to fishing gears and feeding damage of catches have frequently occurred, possibly by Steller's sea lions. For a wildlife that distributes/migrates across the prefectural borders, only if wide-area measures are expected to be effective for damage prevention/alleviation, the government will support investigations on haunting status and provision of the related information, development of technologies to alleviate damages, eradication activities, etc.
Inland fisheries have been facing the problems of resource damages due to feeding by great cormorant, largemouth bass, etc. , thereby promoting their control measures.
Column: Eat and Eradicate a Harmful Aquatic Life!Current trends seem to be shifting towards not only exterminating harmful organisms, but also effectively utilizing them as food.Marineactive, a general incorporated association based in Nagasaki, successfully developed a unique technology which makes rabbit fish suitable for food. The rabbit fish is considered to be one of the causes of Isoyake (withered seashore) and had not been actively used for food.If edible demand for this species increases, this is expected to promote capturing and exterminating, to alleviate the damages to seashore, and to improve fisheries business management.
The volume of domestic fisheries and aquaculture production was 4.69 million tons in 2015, which is lower by 80,000 tons than in the previous year. Marine fisheries production decreased by 170,000 tons to 3.55 million tons. Scallop and saury decreased while Japanese sardine and mackerel increased. Marine aquaculture increased by 80,000 tons to 1.07 million tons. Scallop and seaweed increased. Inland fisheries and aquaculture production increased by 5,000 tons to 69,000 tons.
The value of domestic fisheries and aquaculture production increased by 87.6 billion yen to 1,591.6 billion yen. Marine fisheries increased by 34.3 billion yen to 1,001.1 billion yen. Marine aquaculture increased by 42.6 billion yen to 486.9 billion yen. Inland water fisheries and aquaculture also increased by 10.7 billion yen to 103.6 billion yen.
Trends in Production Volume and Value of Japan’s Fisheries and Aquaculture
12
Section 2 Trends in Japan�’s Fisheries(1) Trends in Fisheries and Aquaculture
Rabbit fish Turns into Sushi(Photo courtesy: ((general incorporated
association) Marineactive)
<Production Volume>
<Production Value>
Production volume (10,000 tons)
In 1978Coastal and offshore catches (excluding Japanese sardine) peaked at: 5.87 million tons
Catches peaked at:12.82 million tons in 1984
In 20154.69 million tons
Marine aquaculture
Japanese sardine catchesInland waterFisheries and aquaculture
1965 1970 1975 1980 1985 1990 1995 2000 2005 2010 2015
Production value (trillion yen)
FY1982Production value peaked at: 2,977.2 billion yen
FY20151,591.6 billion yen
Marine aquaculture Inland waterFisheries and aquaculture
1965 1970 1975 1980 1985 1990 1995 2000 2005 2010 2015
Distant Water fishery
Offshore fishery
Coastal fishery
Distant Water fishery
Offshore fishery
Coastal fishery
(1,000 tons)FY2015(2015)
Total:Marine
Fisheries
Offshore fisheryCoastal fishery
AquacultureInland water
FisheriesAquaculture
Pro
duct
ion
amou
nt
100 million yen
Total:Marine
Fisheries
AquacultureInland water
FisheriesAquaculture
Pro
duct
ion
amou
nt
FY2015(2015)
Offshore fisheryCoastal fishery
Distant Water fishery
Distant Water fishery
(2) Trends in Fishery Management(a) Trends in the Local Prices of Fish and Fishery Products
The price of fishery products will vary depending on the multiple factors including the condition of each species fishery, the status of overseas fishery production, domestic and overseas demand for the species.
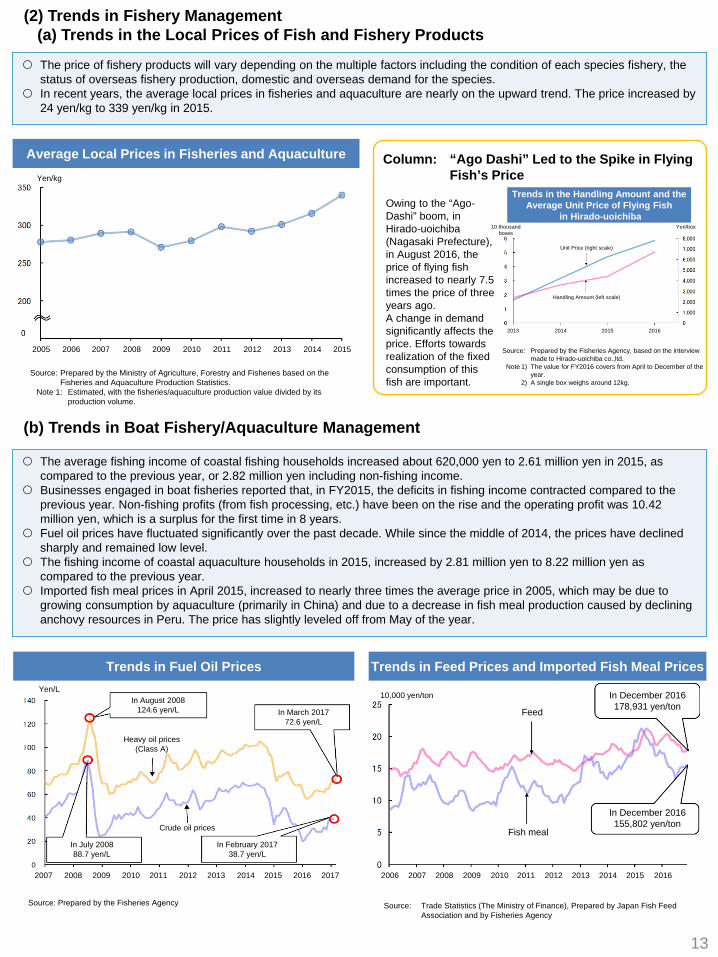
In recent years, the average local prices in fisheries and aquaculture are nearly on the upward trend. The price increased by24 yen/kg to 339 yen/kg in 2015.
Column: “Ago Dashi” Led to the Spike in Flying Fish’s Price
Owing to the “Ago-Dashi” boom, in Hirado-uoichiba (Nagasaki Prefecture), in August 2016, the price of flying fish increased to nearly 7.5 times the price of three years ago.A change in demand significantly affects the price. Efforts towards realization of the fixed consumption of this fish are important.
Average Local Prices in Fisheries and Aquaculture
The average fishing income of coastal fishing households increased about 620,000 yen to 2.61 million yen in 2015, as compared to the previous year, or 2.82 million yen including non-fishing income.
Businesses engaged in boat fisheries reported that, in FY2015, the deficits in fishing income contracted compared to the previous year. Non-fishing profits (from fish processing, etc.) have been on the rise and the operating profit was 10.42 million yen, which is a surplus for the first time in 8 years.
Fuel oil prices have fluctuated significantly over the past decade. While since the middle of 2014, the prices have declined sharply and remained low level.
The fishing income of coastal aquaculture households in 2015, increased by 2.81 million yen to 8.22 million yen as compared to the previous year.
Imported fish meal prices in April 2015, increased to nearly three times the average price in 2005, which may be due to growing consumption by aquaculture (primarily in China) and due to a decrease in fish meal production caused by declining anchovy resources in Peru. The price has slightly leveled off from May of the year.
Trends in Fuel Oil Prices
13
(b) Trends in Boat Fishery/Aquaculture Management
Source: Prepared by the Fisheries Agency, based on the interview made to Hirado-uoichiba co.,ltd.
Note 1) The value for FY2016 covers from April to December of the year.
2) A single box weighs around 12kg.
Trends in the Handling Amount and the Average Unit Price of Flying Fish
in Hirado-uoichiba
Trends in Feed Prices and Imported Fish Meal Prices
Source: Prepared by the Fisheries Agency Source: Trade Statistics (The Ministry of Finance), Prepared by Japan Fish Feed Association and by Fisheries Agency
Source: Prepared by the Ministry of Agriculture, Forestry and Fisheries based on the Fisheries and Aquaculture Production Statistics.
Note 1: Estimated, with the fisheries/aquaculture production value divided by its production volume.
Yen/kg
2005 2006 2007 2008 2009 2010 2011 2012 2013 2014 2015
10 thousand boxes
Yen/box
Unit Price (right scale)
Handling Amount (left scale)
2013 2014 2015 2016
Yen/LIn August 2008
124.6 yen/L In March 201772.6 yen/L
In July 200888.7 yen/L
In February 201738.7 yen/L
2007 2008 2009 2010 2011 2012 2013 2014 2015 2016 2017
Heavy oil prices (Class A)
Crude oil prices
10,000 yen/ton
Feed
Fish meal
In December 2016178,931 yen/ton
In December 2016155,802 yen/ton
2006 2007 2008 2009 2010 2011 2012 2013 2014 2015 2016
(c) “Seashore Revitalization Plan” to Boost Incomes The “Seashore Revitalization Plan” aims to boost fishing incomes by at least 10% in five years with voluntary efforts to come
up with measures and implement them. 635 cases entered into an implementation stage by the end of March 2017. In FY2015, the “Wide-Area Seashore Revitalization Plan” has also started, in which efforts are made for enhancing wide
range competitiveness. As of the end of March 2017, 113 cases were established and carried out.
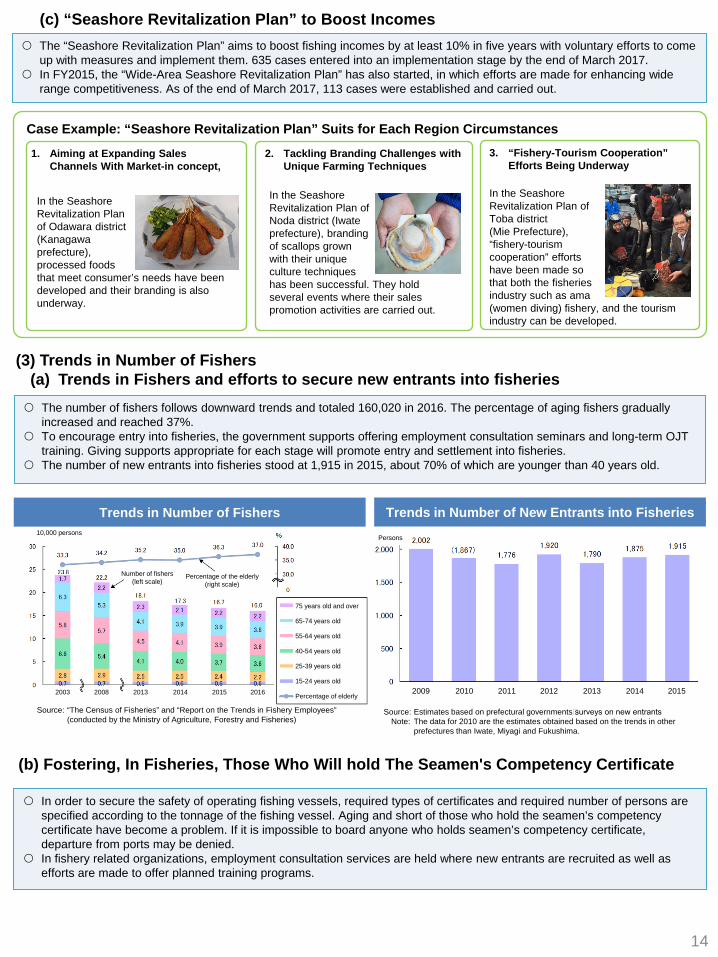
The number of fishers follows downward trends and totaled 160,020 in 2016. The percentage of aging fishers gradually increased and reached 37%.
To encourage entry into fisheries, the government supports offering employment consultation seminars and long-term OJT training. Giving supports appropriate for each stage will promote entry and settlement into fisheries.
The number of new entrants into fisheries stood at 1,915 in 2015, about 70% of which are younger than 40 years old.
(3) Trends in Number of Fishers(a) Trends in Fishers and efforts to secure new entrants into fisheries
14
Case Example: “Seashore Revitalization Plan” Suits for Each Region Circumstances
1. Aiming at Expanding SalesChannels With Market-in concept,
In the Seashore Revitalization Plan of Odawara district (Kanagawa prefecture), processed foods that meet consumer’s needs have been developed and their branding is also underway.
2. Tackling Branding Challenges withUnique Farming Techniques
In the Seashore Revitalization Plan of Noda district (Iwate prefecture), branding of scallops grown with their unique culture techniques has been successful. They hold several events where their sales promotion activities are carried out.
In order to secure the safety of operating fishing vessels, required types of certificates and required number of persons arespecified according to the tonnage of the fishing vessel. Aging and short of those who hold the seamen’s competency certificate have become a problem. If it is impossible to board anyone who holds seamen’s competency certificate, departure from ports may be denied.
In fishery related organizations, employment consultation services are held where new entrants are recruited as well as efforts are made to offer planned training programs.
(b) Fostering, In Fisheries, Those Who Will hold The Seamen's Competency Certificate
Trends in Number of New Entrants into Fisheries
Source: Estimates based on prefectural governments� surveys on new entrantsNote: The data for 2010 are the estimates obtained based on the trends in other
prefectures than Iwate, Miyagi and Fukushima.
3. “Fishery-Tourism Cooperation”Efforts Being Underway
In the Seashore Revitalization Plan of Toba district (Mie Prefecture), “fishery-tourism cooperation” efforts have been made so that both the fisheries industry such as ama(women diving) fishery, and the tourism industry can be developed.
Trends in Number of Fishers
Source: “The Census of Fisheries” and “Report on the Trends in Fishery Employees” (conducted by the Ministry of Agriculture, Forestry and Fisheries)
10,000 persons
Number of fishers (left scale)
Percentage of the elderly (right scale)
75 years old and over
65-74 years old
55-64 years old
40-54 years old
25-39 years old
15-24 years old
Percentage of elderly2003 2008 2013 2014 2015 2016
Persons
2009 2010 2011 2012 2013 2014 2015
(4) Provision of a Safe and Healthy Working Environment for Fisheries
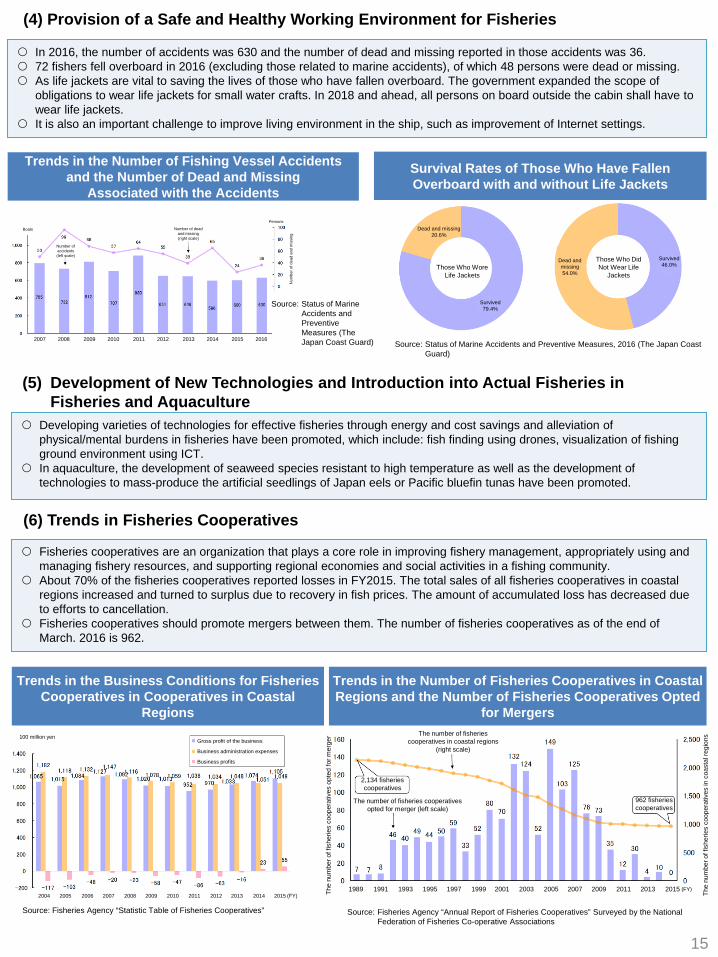
In 2016, the number of accidents was 630 and the number of dead and missing reported in those accidents was 36. 72 fishers fell overboard in 2016 (excluding those related to marine accidents), of which 48 persons were dead or missing. As life jackets are vital to saving the lives of those who have fallen overboard. The government expanded the scope of
obligations to wear life jackets for small water crafts. In 2018 and ahead, all persons on board outside the cabin shall have towear life jackets.
It is also an important challenge to improve living environment in the ship, such as improvement of Internet settings.
Developing varieties of technologies for effective fisheries through energy and cost savings and alleviation of physical/mental burdens in fisheries have been promoted, which include: fish finding using drones, visualization of fishing ground environment using ICT.
In aquaculture, the development of seaweed species resistant to high temperature as well as the development of technologies to mass-produce the artificial seedlings of Japan eels or Pacific bluefin tunas have been promoted.
(5) Development of New Technologies and Introduction into Actual Fisheries inFisheries and Aquaculture
15
Fisheries cooperatives are an organization that plays a core role in improving fishery management, appropriately using and managing fishery resources, and supporting regional economies and social activities in a fishing community.
About 70% of the fisheries cooperatives reported losses in FY2015. The total sales of all fisheries cooperatives in coastal regions increased and turned to surplus due to recovery in fish prices. The amount of accumulated loss has decreased due to efforts to cancellation.
Fisheries cooperatives should promote mergers between them. The number of fisheries cooperatives as of the end of March. 2016 is 962.
(6) Trends in Fisheries Cooperatives
Source: Status of Marine Accidents and Preventive Measures, 2016 (The Japan Coast Guard)
Survival Rates of Those Who Have Fallen Overboard with and without Life Jackets
Trends in the Number of Fishing Vessel Accidents and the Number of Dead and Missing
Associated with the Accidents
Trends in the Business Conditions for Fisheries Cooperatives in Cooperatives in Coastal
Regions
Trends in the Number of Fisheries Cooperatives in Coastal Regions and the Number of Fisheries Cooperatives Opted
for Mergers
Source: Fisheries Agency “Statistic Table of Fisheries Cooperatives” Source: Fisheries Agency “Annual Report of Fisheries Cooperatives” Surveyed by the National Federation of Fisheries Co-operative Associations
Source: Status of Marine Accidents and Preventive Measures (The Japan Coast Guard)
Boats
Number of accidents(left scale)
Number of dead and missing(right scale)
Persons
Num
ber o
f dea
d an
d m
issi
ng
2007 2008 2009 2010 2011 2012 2013 2014 2015 2016
Those Who Wore Life Jackets
Dead and missing20.6%
Survived79.4%
Those Who Did Not Wear Life
Jackets
Dead and missing54.0%
Survived46.0%
100 million yenGross profit of the business
Business administration expenses
Business profits
2004 2005 2006 2007 2008 2009 2010 2011 2012 2013 2014 2015 The
num
ber o
f fis
herie
s co
oper
ativ
es o
pted
for m
erge
r
The
num
ber o
f fis
herie
s co
oper
ativ
es in
coa
stal
regi
onsThe number of fisheries
cooperatives in coastal regions (right scale)
The number of fisheries cooperatives opted for merger (left scale)
2,134 fisheries cooperatives
962 fisheries cooperatives
1989 1991 1993 1995 1997 1999 2001 2003 2005 2007 2009 2011 2013 2015(FY)
(FY)
(7) Trends in the Distribution and Processing of Fish and Fishery Products(a) Trends in the Distribution of Fish and Fishery Products
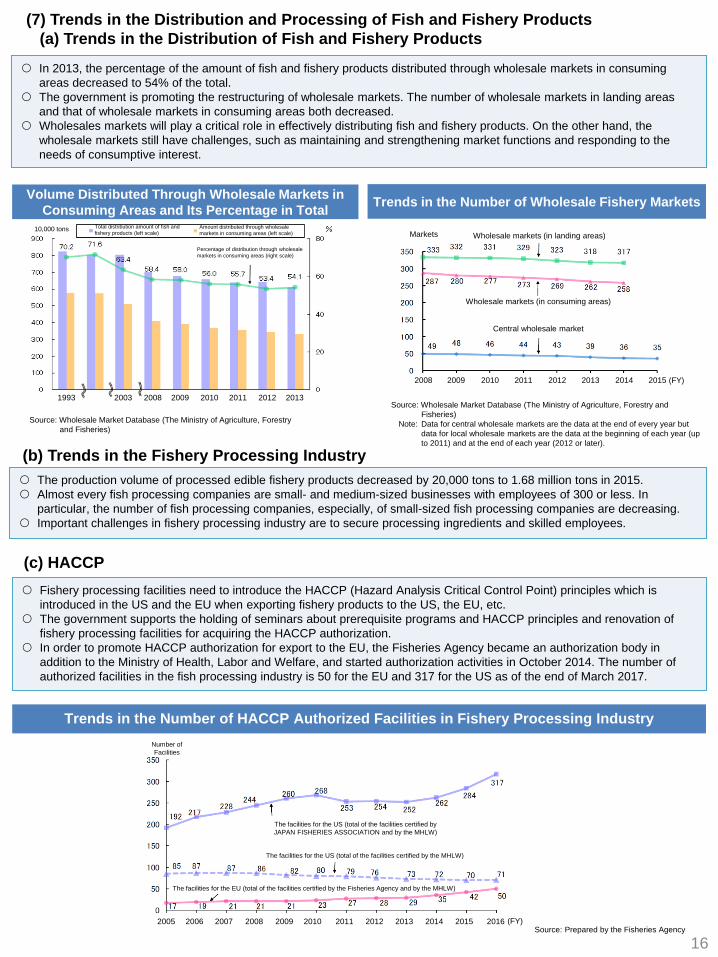
In 2013, the percentage of the amount of fish and fishery products distributed through wholesale markets in consuming areas decreased to 54% of the total.
The government is promoting the restructuring of wholesale markets. The number of wholesale markets in landing areas and that of wholesale markets in consuming areas both decreased.
Wholesales markets will play a critical role in effectively distributing fish and fishery products. On the other hand, the wholesale markets still have challenges, such as maintaining and strengthening market functions and responding to the needs of consumptive interest.
Trends in the Number of Wholesale Fishery Markets
The production volume of processed edible fishery products decreased by 20,000 tons to 1.68 million tons in 2015. Almost every fish processing companies are small- and medium-sized businesses with employees of 300 or less. In
particular, the number of fish processing companies, especially, of small-sized fish processing companies are decreasing. Important challenges in fishery processing industry are to secure processing ingredients and skilled employees.
(b) Trends in the Fishery Processing Industry
16
Fishery processing facilities need to introduce the HACCP (Hazard Analysis Critical Control Point) principles which is introduced in the US and the EU when exporting fishery products to the US, the EU, etc.
The government supports the holding of seminars about prerequisite programs and HACCP principles and renovation of fishery processing facilities for acquiring the HACCP authorization.
In order to promote HACCP authorization for export to the EU, the Fisheries Agency became an authorization body in addition to the Ministry of Health, Labor and Welfare, and started authorization activities in October 2014. The number of authorized facilities in the fish processing industry is 50 for the EU and 317 for the US as of the end of March 2017.
(c) HACCP
Volume Distributed Through Wholesale Markets in Consuming Areas and Its Percentage in Total
Source: Wholesale Market Database (The Ministry of Agriculture, Forestry and Fisheries)
Source: Wholesale Market Database (The Ministry of Agriculture, Forestry and Fisheries)
Note: Data for central wholesale markets are the data at the end of every year but data for local wholesale markets are the data at the beginning of each year (up to 2011) and at the end of each year (2012 or later).
Trends in the Number of HACCP Authorized Facilities in Fishery Processing Industry
10,000 tons Total distribution amount of fish and fishery products (left scale)
Amount distributed through wholesale markets in consuming areas (left scale)
Percentage of distribution through wholesale markets in consuming areas (right scale)
1993 2003 2008 2009 2010 2011 2012 2013
Markets Wholesale markets (in landing areas)
Wholesale markets (in consuming areas)
Central wholesale market
2008 2009 2010 2011 2012 2013 2014 2015
Number of Facilities
The facilities for the US (total of the facilities certified by JAPAN FISHERIES ASSOCIATION and by the MHLW)
The facilities for the US (total of the facilities certified by the MHLW)
Source: Prepared by the Fisheries Agency
The facilities for the EU (total of the facilities certified by the Fisheries Agency and by the MHLW)
2005 2006 2007 2008 2009 2010 2011 2012 2013 2014 2015 2016
(FY)
(FY)
Section 3 Trends in the Supply-Demand and Consumption of Fish and Fishery Products in Japan
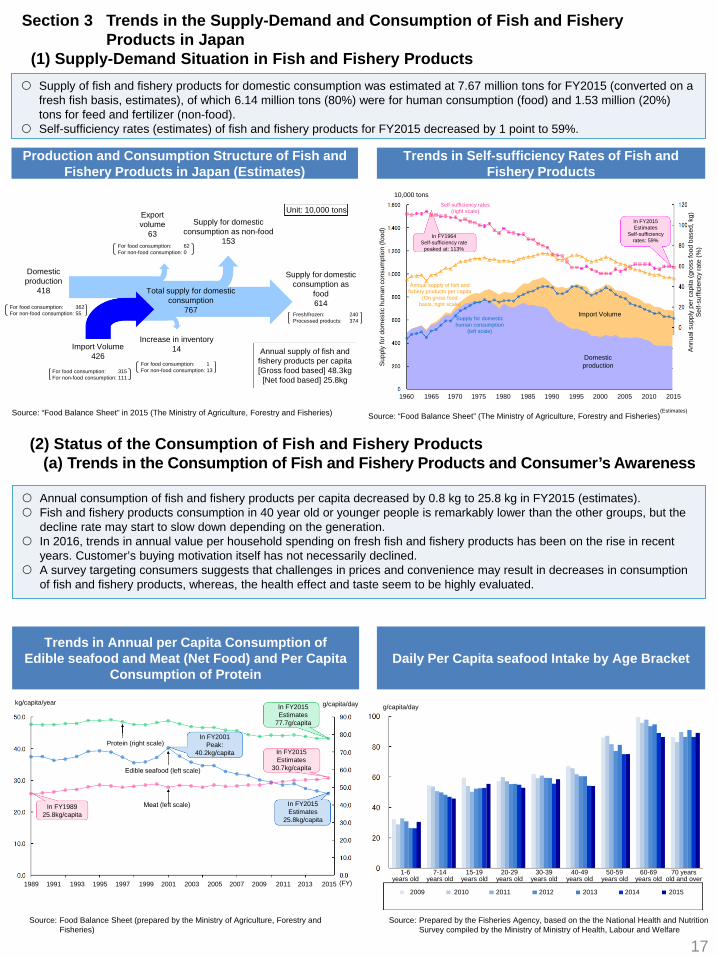
(1) Supply-Demand Situation in Fish and Fishery Products Supply of fish and fishery products for domestic consumption was estimated at 7.67 million tons for FY2015 (converted on a
fresh fish basis, estimates), of which 6.14 million tons (80%) were for human consumption (food) and 1.53 million (20%) tons for feed and fertilizer (non-food).
Self-sufficiency rates (estimates) of fish and fishery products for FY2015 decreased by 1 point to 59%.
Production and Consumption Structure of Fish and Fishery Products in Japan (Estimates)
Source: “Food Balance Sheet” in 2015 (The Ministry of Agriculture, Forestry and Fisheries)
Annual consumption of fish and fishery products per capita decreased by 0.8 kg to 25.8 kg in FY2015 (estimates). Fish and fishery products consumption in 40 year old or younger people is remarkably lower than the other groups, but the
decline rate may start to slow down depending on the generation. In 2016, trends in annual value per household spending on fresh fish and fishery products has been on the rise in recent
years. Customer’s buying motivation itself has not necessarily declined. A survey targeting consumers suggests that challenges in prices and convenience may result in decreases in consumption
of fish and fishery products, whereas, the health effect and taste seem to be highly evaluated.
(2) Status of the Consumption of Fish and Fishery Products(a) Trends in the Consumption of Fish and Fishery Products and Consumer’s Awareness
Source: Food Balance Sheet (prepared by the Ministry of Agriculture, Forestry and Fisheries)
17
Trends in Self-sufficiency Rates of Fish and Fishery Products
Source: Prepared by the Fisheries Agency, based on the the National Health and Nutrition Survey compiled by the Ministry of Ministry of Health, Labour and Welfare
Source: “Food Balance Sheet” (The Ministry of Agriculture, Forestry and Fisheries)
Unit: 10,000 tonsExport volume
63For food consumption: 62For non-food consumption: 0
Supply for domestic consumption as non-food
153
Domestic production
418
For food consumption: 362For non-food consumption: 55
Total supply for domestic consumption
767
Supply for domestic consumption as
food614
Fresh/frozen: 240Processed products: 374
Import Volume426
For food consumption: 315For non-food consumption: 111
Increase in inventory14
For food consumption: 1For non-food consumption: 13
Annual supply of fish and fishery products per capita[Gross food based] 48.3kg[Net food based] 25.8kg
10,000 tons
Supp
ly fo
r dom
estic
hum
an c
onsu
mpt
ion
(food
)
Self-sufficiency rates (right scale)
In FY1964Self-sufficiency rate
peaked at: 113%
In FY2015Estimates
Self-sufficiency rates: 59%
Annual supply of fish and fishery products per capita
(On gross food basis, right scale)
Supply for domestic human consumption
(left scale)
Import Volume
Domestic production
Annu
al s
uppl
y pe
r cap
ita (g
ross
food
bas
ed, k
g)Se
lf-su
ffici
ency
rate
(%)
(Estimates)
1960 1965 1970 1975 1980 1985 1990 1995 2000 2005 2010 2015
kg/capita/year g/capita/day
Protein (right scale)
Edible seafood (left scale)
Meat (left scale)
1989 1991 1993 1995 1997 1999 2001 2003 2005 2007 2009 2011 2013 2015
g/capita/day
1-6 years old
7-14 years old
15-19 years old
20-29 years old
30-39 years old
40-49 years old
50-59 years old
60-69 years old
70 years old and over
2009 2010 2011 2012 2013 2014 2015
Daily Per Capita seafood Intake by Age BracketTrends in Annual per Capita Consumption of
Edible seafood and Meat (Net Food) and Per Capita Consumption of Protein
(FY)
In FY2015Estimates
77.7g/capita
In FY2001Peak:
40.2kg/capita In FY2015Estimates
30.7kg/capita
In FY2015Estimates
25.8kg/capita
In FY198925.8kg/capita
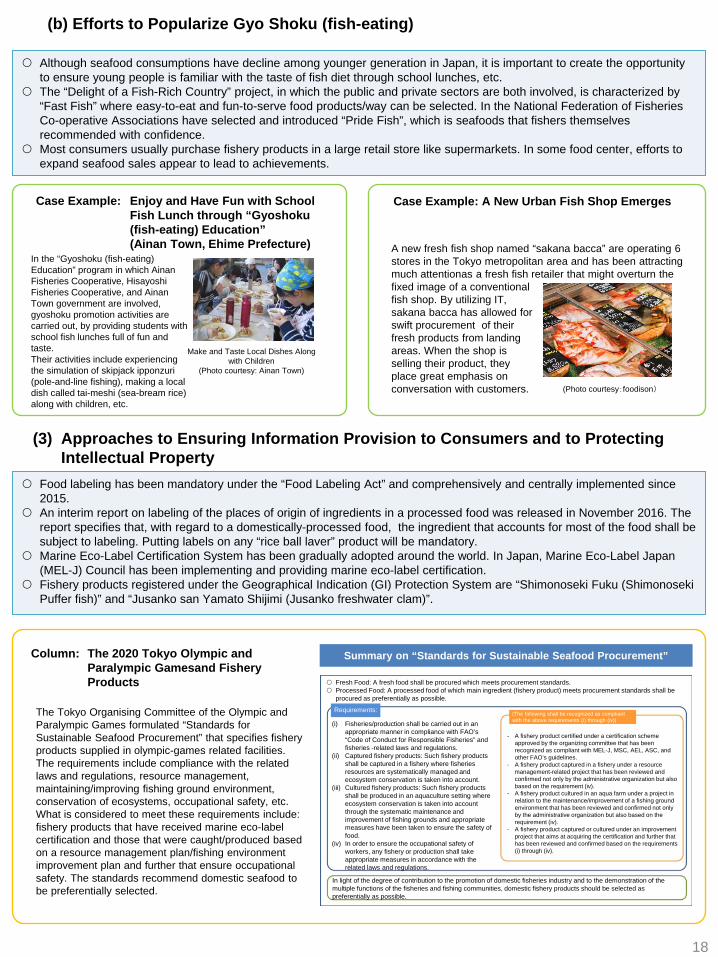
Although seafood consumptions have decline among younger generation in Japan, it is important to create the opportunity to ensure young people is familiar with the taste of fish diet through school lunches, etc.
The “Delight of a Fish-Rich Country” project, in which the public and private sectors are both involved, is characterized by “Fast Fish” where easy-to-eat and fun-to-serve food products/way can be selected. In the National Federation of Fisheries Co-operative Associations have selected and introduced “Pride Fish”, which is seafoods that fishers themselves recommended with confidence.
Most consumers usually purchase fishery products in a large retail store like supermarkets. In some food center, efforts to expand seafood sales appear to lead to achievements.
Food labeling has been mandatory under the “Food Labeling Act” and comprehensively and centrally implemented since 2015.
An interim report on labeling of the places of origin of ingredients in a processed food was released in November 2016. The report specifies that, with regard to a domestically-processed food, the ingredient that accounts for most of the food shall besubject to labeling. Putting labels on any “rice ball laver” product will be mandatory.
Marine Eco-Label Certification System has been gradually adopted around the world. In Japan, Marine Eco-Label Japan (MEL-J) Council has been implementing and providing marine eco-label certification.
Fishery products registered under the Geographical Indication (GI) Protection System are “Shimonoseki Fuku (Shimonoseki Puffer fish)” and “Jusanko san Yamato Shijimi (Jusanko freshwater clam)”.
(3) Approaches to Ensuring Information Provision to Consumers and to Protecting Intellectual Property
18
(b) Efforts to Popularize Gyo Shoku (fish-eating)
Case Example: Enjoy and Have Fun with School Fish Lunch through “Gyoshoku (fish-eating) Education” (Ainan Town, Ehime Prefecture)
In the “Gyoshoku (fish-eating) Education” program in which Ainan Fisheries Cooperative, Hisayoshi Fisheries Cooperative, and Ainan Town government are involved, gyoshoku promotion activities are carried out, by providing students with school fish lunches full of fun and taste.Their activities include experiencing the simulation of skipjack ipponzuri (pole-and-line fishing), making a local dish called tai-meshi (sea-bream rice) along with children, etc.
Column: The 2020 Tokyo Olympic and Paralympic Gamesand Fishery Products
The Tokyo Organising Committee of the Olympic and Paralympic Games formulated “Standards for Sustainable Seafood Procurement” that specifies fishery products supplied in olympic-games related facilities.The requirements include compliance with the related laws and regulations, resource management, maintaining/improving fishing ground environment, conservation of ecosystems, occupational safety, etc. What is considered to meet these requirements include: fishery products that have received marine eco-label certification and those that were caught/produced based on a resource management plan/fishing environment improvement plan and further that ensure occupational safety. The standards recommend domestic seafood to be preferentially selected.
Summary on “Standards for Sustainable Seafood Procurement”
Make and Taste Local Dishes Along with Children
(Photo courtesy: Ainan Town)
A new fresh fish shop named “sakana bacca” are operating 6 stores in the Tokyo metropolitan area and has been attracting much attentionas a fresh fish retailer that might overturn the fixed image of a conventional fish shop. By utilizing IT, sakana bacca has allowed for swift procurement of their fresh products from landing areas. When the shop is selling their product, they place great emphasis on conversation with customers.
Case Example: A New Urban Fish Shop Emerges
(Photo courtesy:foodison)
Fresh Food: A fresh food shall be procured which meets procurement standards. Processed Food: A processed food of which main ingredient (fishery product) meets procurement standards shall be
procured as preferentially as possible.
Requirements:
(i) Fisheries/production shall be carried out in an appropriate manner in compliance with FAO’s “Code of Conduct for Responsible Fisheries” and fisheries -related laws and regulations.
(ii) Captured fishery products: Such fishery products shall be captured in a fishery where fisheries resources are systematically managed and ecosystem conservation is taken into account.
(iii) Cultured fishery products: Such fishery products shall be produced in an aquaculture setting where ecosystem conservation is taken into account through the systematic maintenance and improvement of fishing grounds and appropriate measures have been taken to ensure the safety of food.
(iv) In order to ensure the occupational safety of workers, any fishery or production shall take appropriate measures in accordance with the related laws and regulations.
(The following shall be recognized as compliant with the above requirements (i) through (iv))
- A fishery product certified under a certification scheme approved by the organizing committee that has been recognized as compliant with MEL-J, MSC, AEL, ASC, and other FAO’s guidelines.
- A fishery product captured in a fishery under a resource management-related project that has been reviewed and confirmed not only by the administrative organization but also based on the requirement (iv).
- A fishery product cultured in an aqua farm under a project in relation to the maintenance/improvement of a fishing ground environment that has been reviewed and confirmed not only by the administrative organization but also based on the requirement (iv).
- A fishery product captured or cultured under an improvement project that aims at acquiring the certification and further that has been reviewed and confirmed based on the requirements (i) through (iv).
In light of the degree of contribution to the promotion of domestic fisheries industry and to the demonstration of the multiple functions of the fisheries and fishing communities, domestic fishery products should be selected as preferentially as possible.
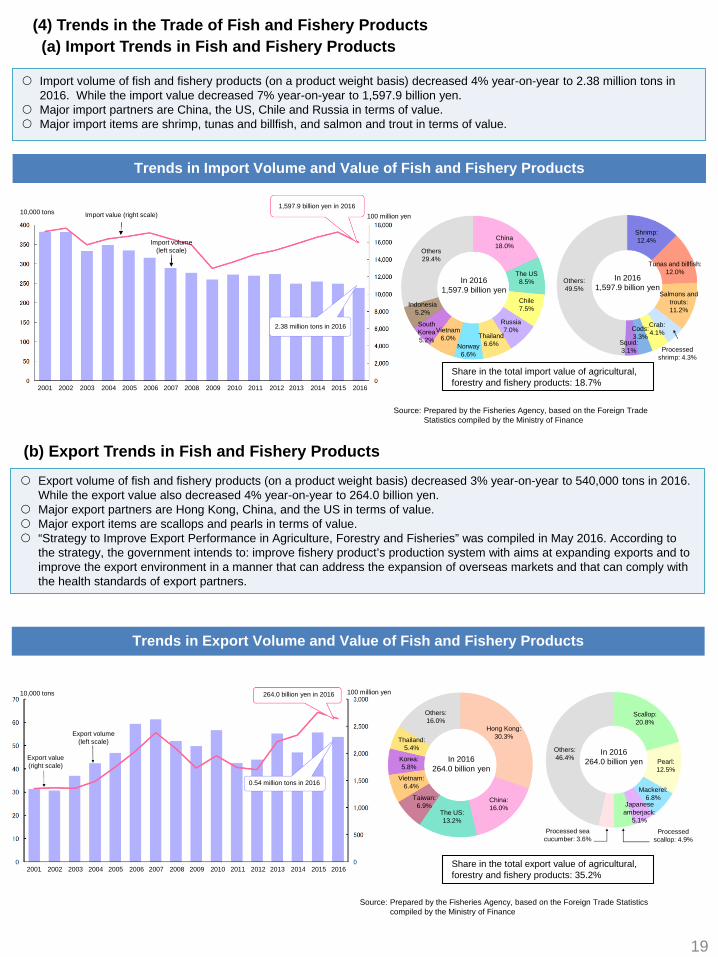
Import volume of fish and fishery products (on a product weight basis) decreased 4% year-on-year to 2.38 million tons in 2016. While the import value decreased 7% year-on-year to 1,597.9 billion yen.
Major import partners are China, the US, Chile and Russia in terms of value. Major import items are shrimp, tunas and billfish, and salmon and trout in terms of value.
Trends in Import Volume and Value of Fish and Fishery Products
Source: Prepared by the Fisheries Agency, based on the Foreign Trade Statistics compiled by the Ministry of Finance
Export volume of fish and fishery products (on a product weight basis) decreased 3% year-on-year to 540,000 tons in 2016. While the export value also decreased 4% year-on-year to 264.0 billion yen.
Major export partners are Hong Kong, China, and the US in terms of value. Major export items are scallops and pearls in terms of value. “Strategy to Improve Export Performance in Agriculture, Forestry and Fisheries” was compiled in May 2016. According to
the strategy, the government intends to: improve fishery product’s production system with aims at expanding exports and to improve the export environment in a manner that can address the expansion of overseas markets and that can comply with the health standards of export partners.
Trends in Export Volume and Value of Fish and Fishery Products
Source: Prepared by the Fisheries Agency, based on the Foreign Trade Statistics compiled by the Ministry of Finance
19
(b) Export Trends in Fish and Fishery Products
Share in the total export value of agricultural, forestry and fishery products: 35.2%
Share in the total import value of agricultural, forestry and fishery products: 18.7%
2001 2002 2003 2004 2005 2006 2007 2008 2009 2010 2011 2012 2013 2014 2015 2016
10,000 tons Import value (right scale)
Import volume (left scale)
1,597.9 billion yen in 2016
2.38 million tons in 2016
100 million yen
Others29.4%
China18.0%
The US8.5%
Chile7.5%
Russia7.0%
Thailand6.6%Norway
6.6%
Vietnam6.0%
South Korea5.2%
Indonesia5.2%
In 20161,597.9 billion yen
Shrimp: 12.4%
Tunas and billfish: 12.0%
Salmons and trouts: 11.2%
Processed shrimp: 4.3%
Crab: 4.1%Cods:
3.3%Squid: 3.1%
Others: 49.5%
In 20161,597.9 billion yen
10,000 tons 100 million yen
2001 2002 2003 2004 2005 2006 2007 2008 2009 2010 2011 2012 2013 2014 2015 2016
Export value(right scale)
Export volume(left scale)
264.0 billion yen in 2016
0.54 million tons in 2016
Hong Kong: 30.3%
China: 16.0%
The US: 13.2%
Taiwan: 6.9%
Vietnam: 6.4%
Korea: 5.8%
Thailand: 5.4%
Others: 16.0%
In 2016264.0 billion yen
Scallop: 20.8%
Pearl: 12.5%
Mackerel: 6.8%
Japanese amberjack:
5.1%
Processed scallop: 4.9%
Processed sea cucumber: 3.6%
Others: 46.4%
In 2016264.0 billion yen
(4) Trends in the Trade of Fish and Fishery Products(a) Import Trends in Fish and Fishery Products
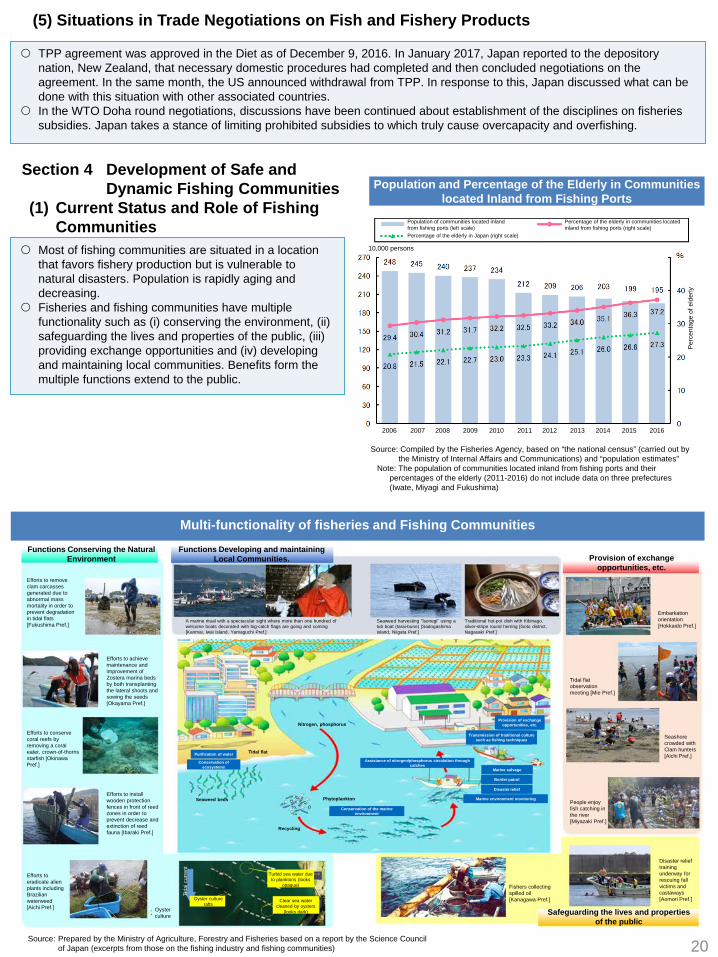
Section 4 Development of Safe and Dynamic Fishing Communities
(1) Current Status and Role of Fishing Communities
Most of fishing communities are situated in a location that favors fishery production but is vulnerable to natural disasters. Population is rapidly aging and decreasing.
Fisheries and fishing communities have multiple functionality such as (i) conserving the environment, (ii) safeguarding the lives and properties of the public, (iii) providing exchange opportunities and (iv) developing and maintaining local communities. Benefits form the multiple functions extend to the public.
Population and Percentage of the Elderly in Communities located Inland from Fishing Ports
Source: Compiled by the Fisheries Agency, based on “the national census” (carried out by the Ministry of Internal Affairs and Communications) and “population estimates”
Note: The population of communities located inland from fishing ports and their percentages of the elderly (2011-2016) do not include data on three prefectures (Iwate, Miyagi and Fukushima)
20
(5) Situations in Trade Negotiations on Fish and Fishery Products
TPP agreement was approved in the Diet as of December 9, 2016. In January 2017, Japan reported to the depository nation, New Zealand, that necessary domestic procedures had completed and then concluded negotiations on the agreement. In the same month, the US announced withdrawal from TPP. In response to this, Japan discussed what can be done with this situation with other associated countries.
In the WTO Doha round negotiations, discussions have been continued about establishment of the disciplines on fisheries subsidies. Japan takes a stance of limiting prohibited subsidies to which truly cause overcapacity and overfishing.
Multi-functionality of fisheries and Fishing Communities
Source: Prepared by the Ministry of Agriculture, Forestry and Fisheries based on a report by the Science Council of Japan (excerpts from those on the fishing industry and fishing communities)
2006 2007 2008 2009 2010 2011 2012 2013 2014 2015 2016
Population of communities located inland from fishing ports (left scale) Percentage of the elderly in Japan (right scale)
Percentage of the elderly in communities located inland from fishing ports (right scale)
10,000 persons
Perc
enta
ge o
f eld
erly
Functions Conserving the Natural Environment
Efforts to remove clam carcasses generated due to abnormal mass mortality in order to prevent degradation in tidal flats [Fukushima Pref.]
Efforts to achieve maintenance and improvement of Zostera marina beds by both transplanting the lateral shoots and sowing the seeds [Okayama Pref.]
Efforts to conserve coral reefs by removing a coral eater, crown-of-thorns starfish [Okinawa Pref.]
Efforts to install wooden protection fences in front of reed zones in order to prevent decrease and extinction of reed fauna [Ibaraki Pref.]
Efforts to eradicate alien plants including Brazilian waterweed [Aichi Pref.]
Functions Developing and maintaining Local Communities.
A marine ritual with a spectacular sight where more than one hundred of welcome boats decorated with big-catch flags are going and coming[Kanmai, Iwai Island, Yamaguchi Pref.]
Seaweed harvesting “Isonegi” using a tub boat (tarai-bune) [SadogashimaIsland, Niigata Pref.]
Traditional hot-pot dish with Kibinago, silver-stripe round herring [Goto district, Nagasaki Pref.]
Purification of water
Conservation of ecosystems
Tidal flat
Seaweed beds
Nitrogen, phosphorus
Phytoplankton
Recycling
Assistance of nitrogen/phosphorus circulation through catches
Conservation of the marine environment
Provision of exchange opportunities, etc.
Transmission of traditional culture such as fishing techniques
Marine salvage
Border patrol
Disaster relief
Marine environment monitoring
Oyster culture
Tida
l cur
rent
Oyster culture rafts
Turbid sea water due to planktons (looks
opaque)
Clear sea water cleaned by oysters
(looks dark)
Provision of exchange opportunities, etc.
Embarkation orientation [Hokkaido Pref.]
Tidal flat observation meeting [Mie Pref.]
Seashore crowded with Clam hunters [Aichi Pref.]
People enjoy fish catching in the river [Miyazaki Pref.]
Safeguarding the lives and properties of the public
Fishers collecting spilled oil [Kanagawa Pref.]
Disaster relief training underway for rescuing fall victims and castaways [Aomori Pref.]
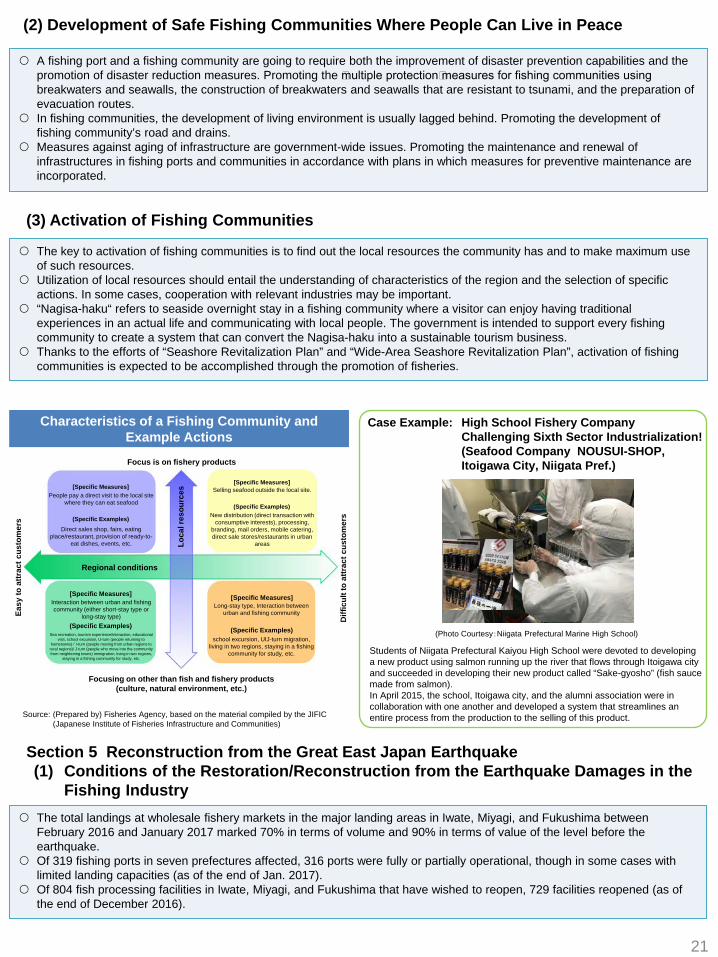
(2) Development of Safe Fishing Communities Where People Can Live in Peace
A fishing port and a fishing community are going to require both the improvement of disaster prevention capabilities and the promotion of disaster reduction measures. Promoting the �multiple protection� measures for fishing communities using breakwaters and seawalls, the construction of breakwaters and seawalls that are resistant to tsunami, and the preparation of evacuation routes.
In fishing communities, the development of living environment is usually lagged behind. Promoting the development of fishing community’s road and drains.
Measures against aging of infrastructure are government-wide issues. Promoting the maintenance and renewal of infrastructures in fishing ports and communities in accordance with plans in which measures for preventive maintenance are incorporated.
The key to activation of fishing communities is to find out the local resources the community has and to make maximum use of such resources.
Utilization of local resources should entail the understanding of characteristics of the region and the selection of specificactions. In some cases, cooperation with relevant industries may be important.
“Nagisa-haku“ refers to seaside overnight stay in a fishing community where a visitor can enjoy having traditional experiences in an actual life and communicating with local people. The government is intended to support every fishing community to create a system that can convert the Nagisa-haku into a sustainable tourism business.
Thanks to the efforts of “Seashore Revitalization Plan” and “Wide-Area Seashore Revitalization Plan”, activation of fishing communities is expected to be accomplished through the promotion of fisheries.
(3) Activation of Fishing Communities
Characteristics of a Fishing Community and Example Actions
Source: (Prepared by) Fisheries Agency, based on the material compiled by the JIFIC (Japanese Institute of Fisheries Infrastructure and Communities)
21
Case Example: High School Fishery Company Challenging Sixth Sector Industrialization! (Seafood Company NOUSUI-SHOP, Itoigawa City, Niigata Pref.)
Students of Niigata Prefectural Kaiyou High School were devoted to developing a new product using salmon running up the river that flows through Itoigawa city and succeeded in developing their new product called “Sake-gyosho” (fish sauce made from salmon).In April 2015, the school, Itoigawa city, and the alumni association were in collaboration with one another and developed a system that streamlines an entire process from the production to the selling of this product.
The total landings at wholesale fishery markets in the major landing areas in Iwate, Miyagi, and Fukushima between February 2016 and January 2017 marked 70% in terms of volume and 90% in terms of value of the level before the earthquake.
Of 319 fishing ports in seven prefectures affected, 316 ports were fully or partially operational, though in some cases with limited landing capacities (as of the end of Jan. 2017).
Of 804 fish processing facilities in Iwate, Miyagi, and Fukushima that have wished to reopen, 729 facilities reopened (as of the end of December 2016).
Section 5 Reconstruction from the Great East Japan Earthquake(1) Conditions of the Restoration/Reconstruction from the Earthquake Damages in the
Fishing Industry
(Photo Courtesy:Niigata Prefectural Marine High School)
Focus is on fishery products
[Specific Measures][Specific Measures]
[Specific Measures] [Specific Measures]
People pay a direct visit to the local site where they can eat seafood
(Specific Examples)Direct sales shop, fairs, eating
place/restaurant, provision of ready-to-eat dishes, events, etc. Lo
cal r
esou
rces
(Specific Examples)
(Specific Examples)
(Specific Examples)
Selling seafood outside the local site.
New distribution (direct transaction with consumptive interests), processing,
branding, mail orders, mobile catering, direct sale stores/restaurants in urban
areas
Easy
to a
ttrac
t cus
tom
ers
Regional conditions
Diff
icul
t to
attr
act c
usto
mer
s
Interaction between urban and fishing community (either short-stay type or
long-stay type)
Sea recreation, tourism experience/interaction, educational visit, school excursion, U-turn (people returning to
hometowns) / I-turn (people moving from urban regions to rural regions)/ J-turn (people who move into the community from neighboring towns) immigration, living in two regions,
staying in a fishing community for study, etc.
Long-stay type, Interaction between urban and fishing community
school excursion, UIJ-turn migration, living in two regions, staying in a fishing
community for study, etc.
Focusing on other than fish and fishery products (culture, natural environment, etc.)
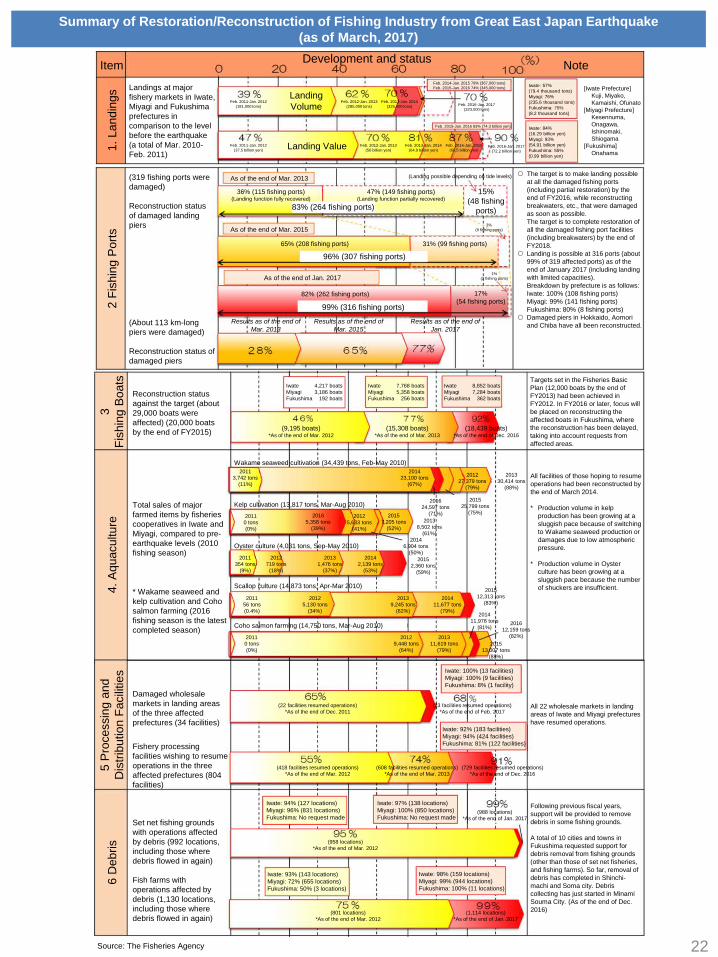
22
Summary of Restoration/Reconstruction of Fishing Industry from Great East Japan Earthquake (as of March, 2017)
Source: The Fisheries Agency
Item Development and status Note
2 Fi
shin
g P
orts
Landings at major fishery markets in Iwate, Miyagi and Fukushima prefectures in comparison to the level before the earthquake (a total of Mar. 2010-Feb. 2011)
Feb. 2014-Jan. 2015 79% (367,000 tons)Feb. 2015-Jan. 2016 74% (345,000 tons)
Feb. 2011-Jan. 2012 (181,000 tons)
Landing Volume
Feb. 2012-Jan. 2013 (285,000 tons)
Feb. 2013-Jan. 2014 (325,000 tons) Feb. 2016-Jan. 2017
(323,000 tons)
Feb. 2015-Jan. 2016 93% (74.3 billion yen)
Feb. 2011-Jan. 2012 (37.5 billion yen) Landing Value Feb. 2012-Jan. 2013
(56 billion yen)Feb. 2013-Jan. 2014
(64.9 billion yen)Feb. 2014-Jan. 2015
(69.5 billion yen)Feb. 2016-Jan. 2017
(72.2 billion yen)
Iwate: 57% (79.4 thousand tons)Miyagi: 76% (235.6 thousand tons)Fukushima: 75% (8.2 thousand tons)
Iwate: 84% (16.29 billion yen)Miyagi: 93% (54.91 billion yen)Fukushima: 55% (0.99 billion yen)
[Iwate Prefecture]Kuji, Miyako, Kamaishi, Ofunato
[Miyagi Prefecture]Kesennuma, Onagawa, Ishinomaki, Shiogama
[Fukushima]Onahama
1. L
andi
ngs
(319 fishing ports were damaged)
Reconstruction status of damaged landing piers
(About 113 km-long piers were damaged)
Reconstruction status of damaged piers
As of the end of Mar. 2013
36% (115 fishing ports)(Landing function fully recovered)
47% (149 fishing ports)(Landing function partially recovered)
83% (264 fishing ports)
(Landing possible depending on tide levels)
15% (48 fishing
ports)
As of the end of Mar. 2015
65% (208 fishing ports)
96% (307 fishing ports)31% (99 fishing ports)
3% (9 fishing ports)
As of the end of Jan. 2017
82% (262 fishing ports)
99% (316 fishing ports)
17% (54 fishing ports)
1% (2 fishing ports)
Results as of the end of Mar. 2013
Results as of the end of Mar. 2015
Results as of the end of Jan. 2017
The target is to make landing possible at all the damaged fishing ports (including partial restoration) by the end of FY2016, while reconstructing breakwaters, etc., that were damaged as soon as possible.The target is to complete restoration of all the damaged fishing port facilities (including breakwaters) by the end of FY2018.
Landing is possible at 316 ports (about 99% of 319 affected ports) as of the end of January 2017 (including landing with limited capacities).Breakdown by prefecture is as follows:Iwate: 100% (108 fishing ports)Miyagi: 99% (141 fishing ports)Fukushima: 80% (8 fishing ports)
Damaged piers in Hokkaido, Aomori and Chiba have all been reconstructed.
3 Fi
shin
g B
oats
Reconstruction status against the target (about 29,000 boats were affected) (20,000 boats by the end of FY2015)
Iwate 4,217 boatsMiyagi 3,186 boatsFukushima 192 boats
(9,195 boats)*As of the end of Mar. 2012
Iwate 7,768 boatsMiyagi 5,358 boatsFukushima 256 boats
(15,308 boats)*As of the end of Mar. 2013
Iwate 8,852 boatsMiyagi 7,284 boatsFukushima 362 boats
(18,439 boats)*As of the end of Dec. 2016
Targets set in the Fisheries Basic Plan (12,000 boats by the end of FY2013) had been achieved in FY2012. In FY2016 or later, focus will be placed on reconstructing the affected boats in Fukushima, where the reconstruction has been delayed, taking into account requests from affected areas.
4. A
quac
ultu
re
Total sales of major farmed items by fisheries cooperatives in Iwate and Miyagi, compared to pre-earthquake levels (2010 fishing season)
* Wakame seaweed and kelp cultivation and Coho salmon farming (2016 fishing season is the latest completed season)
Wakame seaweed cultivation (34,439 tons, Feb-May 2010)2011
3,742 tons(11%)
201227,379 tons
(79%)
201330,414 tons
(88%)
201423,100 tons
(67%)
201525,799 tons
(75%)
201624,597 tons
(71%)Kelp cultivation (13,817 tons, Mar-Aug 2010)
20110 tons(0%)
20125,633 tons
(41%)2013
8,502 tons(61%)
20146,904 tons
(50%)
20157,205 tons
(52%)
20165,358 tons
(39%)
Oyster culture (4,031 tons, Sep-May 2010)
2011354 tons
(9%)
2012719 tons
(18%)
20131,476 tons
(37%)
20142,139 tons
(53%)
20152,360 tons
(59%)
Scallop culture (14,873 tons, Apr-Mar 2010)
201156 tons(0.4%)
20125,130 tons
(34%)
20139,245 tons
(62%)
201411,677 tons
(79%)
201512,313 tons
(83%)
Coho salmon farming (14,750 tons, Mar-Aug 2010)
20110 tons(0%)
20129,448 tons
(64%)
201311,619 tons
(79%)
201411,978 tons
(81%)
201513,007 tons
(88%)
201612,159 tons
(82%)
All facilities of those hoping to resume operations had been reconstructed by the end of March 2014.
* Production volume in kelp production has been growing at a sluggish pace because of switching to Wakame seaweed production or damages due to low atmospheric pressure.
* Production volume in Oyster culture has been growing at a sluggish pace because the number of shuckers are insufficient.
5 P
roce
ssin
g an
d D
istri
butio
n Fa
cilit
ies
Damaged wholesale markets in landing areas of the three affected prefectures (34 facilities)
(22 facilities resumed operations)*As of the end of Dec. 2011
(23 facilities resumed operations)*As of the end of Feb. 2017
Iwate: 100% (13 facilities)Miyagi: 100% (9 facilities)Fukushima: 8% (1 facility)
Fishery processing facilities wishing to resume operations in the three affected prefectures (804 facilities)
(418 facilities resumed operations)*As of the end of Mar. 2012
(608 facilities resumed operations)*As of the end of Mar. 2013
(729 facilities resumed operations)*As of the end of Dec. 2016
Iwate: 92% (183 facilities)Miyagi: 94% (424 facilities)Fukushima: 81% (122 facilities)
All 22 wholesale markets in landing areas of Iwate and Miyagi prefectures have resumed operations.
6 D
ebris
Set net fishing grounds with operations affected by debris (992 locations, including those where debris flowed in again)
Iwate: 94% (127 locations)Miyagi: 96% (831 locations)Fukushima: No request made
Iwate: 97% (138 locations)Miyagi: 100% (850 locations)Fukushima: No request made
(988 locations)*As of the end of Jan. 2017
(958 locations)*As of the end of Mar. 2012
Fish farms with operations affected by debris (1,130 locations, including those where debris flowed in again)
Iwate: 93% (143 locations)Miyagi: 72% (655 locations)Fukushima: 50% (3 locations)
Iwate: 98% (159 locations)Miyagi: 99% (944 locations)Fukushima: 100% (11 locations)
(801 locations)*As of the end of Mar. 2012
(1,114 locations)*As of the end of Jan. 2017
Following previous fiscal years, support will be provided to remove debris in some fishing grounds.
A total of 10 cities and towns in Fukushima requested support for debris removal from fishing grounds (other than those of set net fisheries, and fishing farms). So far, removal of debris has completed in Shinchi-machi and Soma city. Debris collecting has just started in Minami Souma City. (As of the end of Dec. 2016)
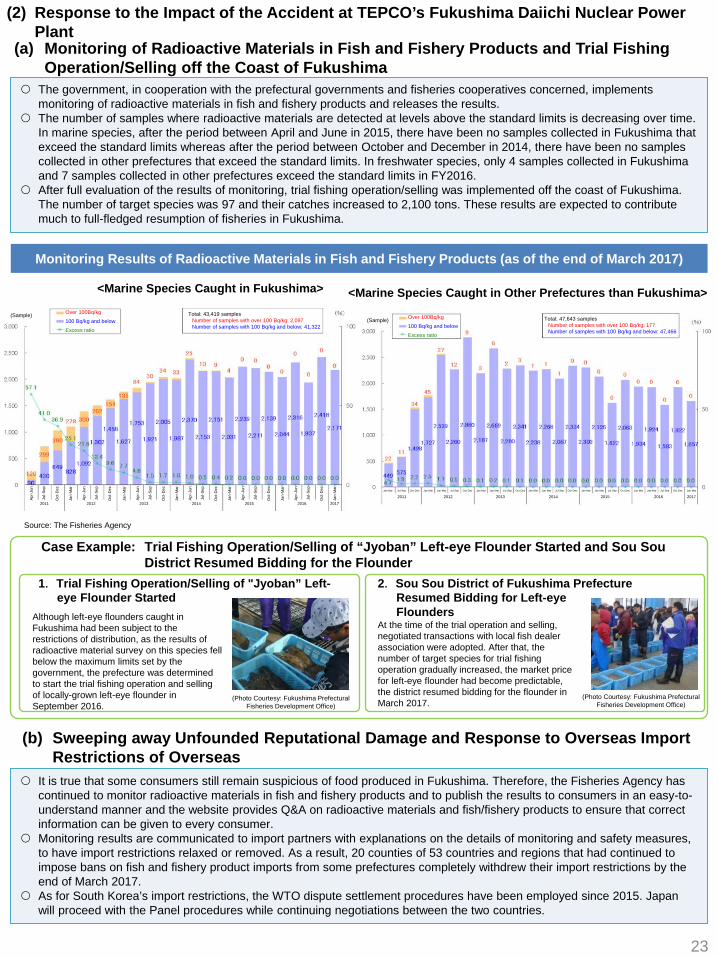
The government, in cooperation with the prefectural governments and fisheries cooperatives concerned, implements monitoring of radioactive materials in fish and fishery products and releases the results.
The number of samples where radioactive materials are detected at levels above the standard limits is decreasing over time. In marine species, after the period between April and June in 2015, there have been no samples collected in Fukushima that exceed the standard limits whereas after the period between October and December in 2014, there have been no samples collected in other prefectures that exceed the standard limits. In freshwater species, only 4 samples collected in Fukushima and 7 samples collected in other prefectures exceed the standard limits in FY2016.
After full evaluation of the results of monitoring, trial fishing operation/selling was implemented off the coast of Fukushima. The number of target species was 97 and their catches increased to 2,100 tons. These results are expected to contribute much to full-fledged resumption of fisheries in Fukushima.
It is true that some consumers still remain suspicious of food produced in Fukushima. Therefore, the Fisheries Agency has continued to monitor radioactive materials in fish and fishery products and to publish the results to consumers in an easy-to-understand manner and the website provides Q&A on radioactive materials and fish/fishery products to ensure that correct information can be given to every consumer.
Monitoring results are communicated to import partners with explanations on the details of monitoring and safety measures, to have import restrictions relaxed or removed. As a result, 20 counties of 53 countries and regions that had continued to impose bans on fish and fishery product imports from some prefectures completely withdrew their import restrictions by the end of March 2017.
As for South Korea’s import restrictions, the WTO dispute settlement procedures have been employed since 2015. Japan will proceed with the Panel procedures while continuing negotiations between the two countries.
Monitoring Results of Radioactive Materials in Fish and Fishery Products (as of the end of March 2017)
23
Source: The Fisheries Agency
(b) Sweeping away Unfounded Reputational Damage and Response to Overseas Import Restrictions of Overseas
Case Example: Trial Fishing Operation/Selling of “Jyoban” Left-eye Flounder Started and Sou SouDistrict Resumed Bidding for the Flounder
Although left-eye flounders caught in Fukushima had been subject to the restrictions of distribution, as the results of radioactive material survey on this species fell below the maximum limits set by the government, the prefecture was determined to start the trial fishing operation and selling of locally-grown left-eye flounder in September 2016.
<Marine Species Caught in Fukushima> <Marine Species Caught in Other Prefectures than Fukushima>
At the time of the trial operation and selling, negotiated transactions with local fish dealer association were adopted. After that, the number of target species for trial fishing operation gradually increased, the market price for left-eye flounder had become predictable, the district resumed bidding for the flounder in March 2017.
1. Trial Fishing Operation/Selling of "Jyoban” Left-eye Flounder Started
2. Sou Sou District of Fukushima Prefecture Resumed Bidding for Left-eye Flounders
(Photo Courtesy: Fukushima Prefectural Fisheries Development Office)
(Photo Courtesy: Fukushima Prefectural Fisheries Development Office)
(Sample)(Sample)
Over 100Bq/kg
100 Bq/kg and below
Excess ratio
Total: 43,419 samplesNumber of samples with over 100 Bq/kg: 2,097Number of samples with 100 Bq/kg and below: 41,322
Jan-
Mar
Apr-
Jun
Jul-S
ep
Oct
-Dec
Apr-
Jun
Jul-S
ep
Oct
-Dec
Jan-
Mar
Apr-
Jun
Jul-S
ep
Oct
-Dec
Jan-
Mar
Apr-
Jun
Jul-S
ep
Oct
-Dec
Jan-
Mar
Apr-
Jun
Jul-S
ep
Oct
-Dec
Jan-
Mar
Apr-
Jun
Jul-S
ep
Oct
-Dec
Jan-
Mar
2011 2012 2013 2014 2015 2016 2017
Over 100Bq/kg
100 Bq/kg and below
Excess ratio
Total: 47,643 samplesNumber of samples with over 100 Bq/kg: 177Number of samples with 100 Bq/kg and below: 47,466
Jan-Mar Jul-Sep Oct-Dec Jan-Mar Jan-Mar Jul-Sep Oct-Dec Jan-Mar Jan-Mar Jul-Sep Oct-Dec Jan-Mar Jan-Mar Jul-Sep Oct-Dec Jan-Mar Jan-Mar Jul-Sep Oct-Dec Jan-Mar Jan-Mar Jul-Sep Oct-Dec Jan-Mar
2017201620152014201320122011
(2) Response to the Impact of the Accident at TEPCO’s Fukushima Daiichi Nuclear Power Plant
(a) Monitoring of Radioactive Materials in Fish and Fishery Products and Trial Fishing Operation/Selling off the Coast of Fukushima
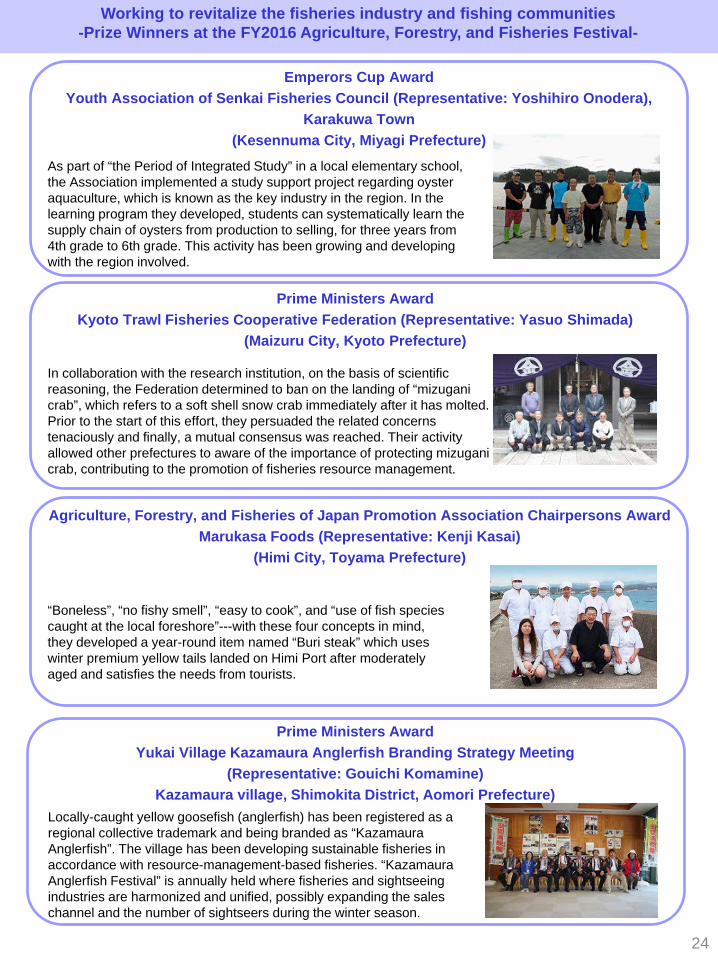
Emperors Cup AwardYouth Association of Senkai Fisheries Council (Representative: Yoshihiro Onodera),
Karakuwa Town(Kesennuma City, Miyagi Prefecture)
Prime Ministers AwardKyoto Trawl Fisheries Cooperative Federation (Representative: Yasuo Shimada)
(Maizuru City, Kyoto Prefecture)
Agriculture, Forestry, and Fisheries of Japan Promotion Association Chairpersons AwardMarukasa Foods (Representative: Kenji Kasai)
(Himi City, Toyama Prefecture)
Working to revitalize the fisheries industry and fishing communities-Prize Winners at the FY2016 Agriculture, Forestry, and Fisheries Festival-
Prime Ministers AwardYukai Village Kazamaura Anglerfish Branding Strategy Meeting
(Representative: Gouichi Komamine)Kazamaura village, Shimokita District, Aomori Prefecture)
24
“Boneless”, “no fishy smell”, “easy to cook”, and “use of fish species caught at the local foreshore”---with these four concepts in mind, they developed a year-round item named “Buri steak” which uses winter premium yellow tails landed on Himi Port after moderately aged and satisfies the needs from tourists.
Locally-caught yellow goosefish (anglerfish) has been registered as a regional collective trademark and being branded as “Kazamaura Anglerfish”. The village has been developing sustainable fisheries in accordance with resource-management-based fisheries. “Kazamaura Anglerfish Festival” is annually held where fisheries and sightseeing industries are harmonized and unified, possibly expanding the sales channel and the number of sightseers during the winter season.
In collaboration with the research institution, on the basis of scientific reasoning, the Federation determined to ban on the landing of “mizuganicrab”, which refers to a soft shell snow crab immediately after it has molted. Prior to the start of this effort, they persuaded the related concerns tenaciously and finally, a mutual consensus was reached. Their activity allowed other prefectures to aware of the importance of protecting mizuganicrab, contributing to the promotion of fisheries resource management.
As part of “the Period of Integrated Study” in a local elementary school, the Association implemented a study support project regarding oyster aquaculture, which is known as the key industry in the region. In the learning program they developed, students can systematically learn the supply chain of oysters from production to selling, for three years from 4th grade to 6th grade. This activity has been growing and developing with the region involved.
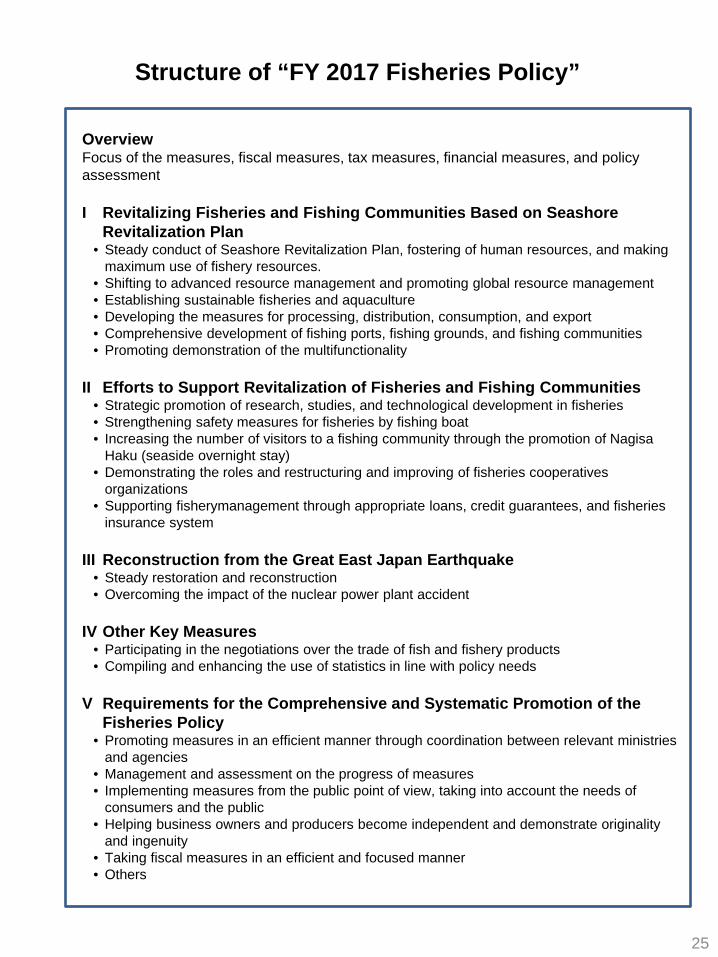
25
Structure of “FY 2017 Fisheries Policy”
OverviewFocus of the measures, fiscal measures, tax measures, financial measures, and policy assessment
I Revitalizing Fisheries and Fishing Communities Based on Seashore Revitalization Plan
• Steady conduct of Seashore Revitalization Plan, fostering of human resources, and making maximum use of fishery resources.
• Shifting to advanced resource management and promoting global resource management• Establishing sustainable fisheries and aquaculture• Developing the measures for processing, distribution, consumption, and export• Comprehensive development of fishing ports, fishing grounds, and fishing communities• Promoting demonstration of the multifunctionality
II Efforts to Support Revitalization of Fisheries and Fishing Communities• Strategic promotion of research, studies, and technological development in fisheries• Strengthening safety measures for fisheries by fishing boat• Increasing the number of visitors to a fishing community through the promotion of Nagisa
Haku (seaside overnight stay)• Demonstrating the roles and restructuring and improving of fisheries cooperatives
organizations• Supporting fisherymanagement through appropriate loans, credit guarantees, and fisheries
insurance system
III Reconstruction from the Great East Japan Earthquake• Steady restoration and reconstruction• Overcoming the impact of the nuclear power plant accident
IV Other Key Measures• Participating in the negotiations over the trade of fish and fishery products• Compiling and enhancing the use of statistics in line with policy needs
V Requirements for the Comprehensive and Systematic Promotion of the Fisheries Policy
• Promoting measures in an efficient manner through coordination between relevant ministries and agencies
• Management and assessment on the progress of measures• Implementing measures from the public point of view, taking into account the needs of
consumers and the public• Helping business owners and producers become independent and demonstrate originality
and ingenuity• Taking fiscal measures in an efficient and focused manner• Others