fy2017 financial results ended march31, 2018...fy16 fy17 xtandi/oab products dermatology business...
TRANSCRIPT

FY2017 FINANCIAL RESULTSENDED MARCH 31, 2018
Kenji Yasukawa, Ph.D
President and CEO
Astellas Pharma Inc.
April 26, 2018

CAUTIONARY STATEMENT REGARDING FORWARD-LOOKING INFORMATION
In this material, statements made with respect to current plans, estimates, strategies and beliefs and other
statements that are not historical facts are forward-looking statements about the future performance of
Astellas Pharma. These statements are based on management’s current assumptions and beliefs in light of
the information currently available to it and involve known and unknown risks and uncertainties. A number of
factors could cause actual results to differ materially from those discussed in the forward-looking statements.
Such factors include, but are not limited to: (i) changes in general economic conditions and in laws and
regulations, relating to pharmaceutical markets, (ii) currency exchange rate fluctuations, (iii) delays in new
product launches, (iv) the inability of Astellas to market existing and new products effectively, (v) the inability
of Astellas to continue to effectively research and develop products accepted by customers in highly
competitive markets, and (vi) infringements of Astellas’ intellectual property rights by third parties.
Information about pharmaceutical products (including products currently in development) which is included
in this material is not intended to constitute an advertisement or medical advice.
2

AGENDA 3
IReview of Strategic Plan
2015-2017
II
III
FY2017 Financial Results and
FY2018 Forecasts
Initiatives to Build Resilience
for Sustainable Growth
I
II
III
I
II
III

4
Achieved profit targets despite net sales behind assumptions
Net sales (CAGR*):+1.4%
Core OP (CAGR*):+7.5%
R&D investment: 16-17% of net sales / improvement of cost structure
Core EPS (CAGR*) :+13.2%
Achieved EPS CAGR exceeding CAGR of Core OP along with enhancement of capital
efficiency
ROE (Full basis) : 15.1% (average for three years, FY2015 – FY2017)
*CAGR for 3 years starting from FY2014 results
Shareholder return: Dividend per share increased by 2 yen per year (planned for FY17)
Average total return ratio for three years including share buybacks was 98.4%
Financial overview
REVIEW OF STRATEGIC PLAN 2015-2017 (FINANCIAL)

5
戦略課題への取り組み
REVIEW OF STRATEGIC PLAN 2015-2017 (STRATEGIC INITIATIVES)
Steady progress in 3 strategic initiatives
• Maximized sales of XTANDI in the current indications and steadily progressed development in earlier stages of prostate cancer
• Shifted resources from Vesicare to Betanis/ Myrbetriq/ BetmigaAdvancing development for pediatric indication and combination therapy of solifenacin and mirabegron
• Launched Repatha and Linzess in Japan
Maximizing the Product Value
Creating Innovation
Pursuing Operational Excellence
GEs impacts in Japanexceeded our expectations
Further pressure on prices in EU and the US
• Transferred US manufacturing subsidiary
• Transferred dermatology business and 16 long-listed Japanese products
• Enhanced global management structure
• Steadily progressed late-stage pipeline including gilteritinib, enfortumab vedotin and roxadustat
• Expanded pipeline through acquisition of Ganymed and Ogeda
• Unique development programs with various modality and biology into clinical study
• Pursued strategic outsourcing
• Wind-down of Agensys research operations
• Optimized EMEA organizational structure

AGENDA 6
IReview of Strategic Plan
2015-2017
II
III
FY2017 Financial Results and
FY2018 Forecasts
Initiatives to Build Resilience
for Sustainable Growth
I
II
III
I
II
III

(billion yen) FY16 FY17 ChangeFY17
FCST*Achieve-
ment
Excl impactsfrom Fx and
business transfer
Net sales 1,311.7 1,300.3 -0.9% 1,297.0 100.3% -1.2%
Cost of sales
% of sales
320.5
24.4%
294.2
22.6%
-8.2%
SG&A expenses
% of sales
470.8
35.9%
478.3
36.8%
+1.6%
R&D expenses
% of sales
208.1
15.9%
220.8
17.0%
+6.1% 218.0
16.8%
101.3%
Amortisation of intangible 35.8 35.8 +0.0%
Share of associates/JVs losses ‐1.9 - 2.4 ‐
Core operating profit 274.6 268.7 -2.1% 258.0 104.1% +4.6%
Core profit for the period 213.3 204.3 -4.2% 201.0 101.7%
Core EPS (yen) 101.15 100.64 -0.5% 98.43 102.2%
FY2017 FINANCIAL RESULTS (CORE BASIS) 7
* Revised in Oct. 2017

FY16
FY17
XTANDI/OAB products
Dermatology businesstransfer *
Fx impacts
Long listed drug transfer**
SALES ANALYSIS (YEAR ON YEAR) 8
(billion yen)
Growth drivers in good shape despite slight decrease in net sales due to
mainly GEs impacts in Japan
1.2% decrease(excl. Fx and business transfers)
GEs impacts in Japan, etc.
*Dermatology business transfer: Decrease in amortisation of deferred revenue
Decrease in
amortisation of deferred revenue
**Long listed drug transfer: Amortisation of deferred revenue in FY17 – Sales of transferred products in FY16
OAB:Overactive bladder, OAB products:Vesicare+Betanis/Myrbetriq/BETMIGA
Others
1,311.7
1,300.3
43.3

FY16
FY17
Gross profit*(excl. business transfer)
R&D expenses*
Others*
Business transfers*
SG&A expenses*
CORE OP ANALYSIS (YEAR ON YEAR) 9
(billion yen)
Increased operating profit excluding impacts of Fx and business transfers,
while increased development costs for late-stage projects, etc.
4.6% increase(excl. Fx and business transfers)
Efficient spending andoptimal resource allocation
Increase in late-stage developmentContinue to invest in new opportunities
Fx impacts
*Fx impacts excluded from each item
Gross profit decrease due to dermatology business and long listed drug transfers
Increase in COGs by impact of unrealized profit elim. : +0.3 ppt
268.7
274.6
13.1

(billion yen) FY16 FY17 Change FY17FCST*Achieve-
ment
Core operating profit 274.6 268.7 -2.1% 258.0 104.1%
Other income 9.6 11.9 +23.7%
Other expenses 23.3 67.3 +188.7%
Operating profit 260.8 213.3 -18.2% 222.0 96.1%
Financial income 22.9 6.6 -71.0%
Financial loss 2.0 1.8 -9.8%
Profit before tax 281.8 218.1 -22.6% 228.0 95.7%
Profit for the period 218.7 164.7 -24.7% 180.0 91.5%
EPS (yen) 103.69 81.11 -21.8% 88.15 92.0%
FY2017 FINANCIAL RESULTS (FULL BASIS) 10
Booked other expenses for business restructuring and impairment loss
* Revised in Oct. 2017

XTANDI and OAB franchise increase globally
SALES IN KEY AREAS 11
Transplantation: Prograf, Advagraf/Graceptor/ASTAGRAF XL CER:Constant Exchange Rate
(billion yen) FY16 FY17 Change CER growthFY17
FCST*Achieve-
ment
XTANDI 252.1 294.3 +16.8% +11.7% 291.3 101.0%
OAB in Urology 214.9 228.1 +6.1% +2.7% 232.3 98.2%
Vesicare 116.1 102.3 -11.9% -15.2% 106.2 96.3%
Betanis/Myrbetriq/BETMIGA 98.8 125.7 +27.2% +23.7% 126.1 99.7%
Transplantation 186.2 198.5 +6.6% +1.5% 194.8 101.9%
* Revised in Oct. 2017

XTANDI 12
FY2016
Steadily increasing XTANDI sales in all regions
FY2017
23.426.1 (+11.4%)
4.0
5.8 (+47.3%)
+42.4%(CER basis)
Sales by region
Japan(billion yen)
EMEA(million euro)
Americas(million USD)
Asia/Oceania(billion yen)
FY2016 FY2017
1,2861,404 (+9.2%)
718823 (+14.6%)

OAB FRANCHISE IN UROLOGY 13
51% 49% 64%36% 37%
63%
55%45%
FY2016 FY2017
50% 50%
31%
69%
Betanis/ Myrbetriq/ BETMIGA
Vesicare
Japan
EMEAAmericas
Proportion of Betanis/Myrbetriq/BETMIGA sales steadily expanding by shifting resources from Vesicare
Sales composition ratio by product(FY2016 vs FY2017:local currency basis)

FY2018 FORECASTS:SUMMARY 14
Net sales
XTANDI & OAB franchise to continue growth on a global basis.Prograf to show steady progress
Decrease in sales in Japan due to NHI price revision and GEs impacts Negative impacts on sales due to decrease in deferred revenue of
dermatology business transfer and long-listed drug business transfer
Continue to invest in R&D and business development for future growth R&D expenses: 214.0 bil.yen (Ratio to sales 16.7%)
Pursue operational excellence through zero-based budgeting and continuous enhancement of organization structure
Fx impact on Core OP to be minimal while negative impact on net sales is anticipated : USD 105 yen, Euro 130 yen
Dividends per share:Forecasted 2 yen increase to 38 yen

(billion yen) FY2017 ACT FY2018 FCST Change
Net sales 1,300.3 1,278.0 -1.7%
R&D expenses
as % of sales
220.8
17.0%
214.0
16.7%
-3.1%
-0.3ppt
Core operating profit 268.7 262.0 -2.5%
Core profit for the year 204.3 210.0 +2.8%
Core EPS(yen) 100.64 106.27 +5.6%
FY2018 FORECASTS 15
Operating profit 213.3 265.0 +24.3%
Profit for the year 164.7 213.0 +29.3%
EPS(yen) 81.11 107.79 +32.9%
Core basis: Profit for the year and EPS to increase, while operating profit to decrease

-1.9
268.71,300.3
1,278.0
-23.9
FY2017
FY2018
Business transfers*
Fx impacts
XTANDI/OAB
FY2018 FCST: NET SALES/CORE OP 16
Flat net sales and Core OP adjusted for business transfer and Fx impacts despite NHI price revision
Net sales Core OP
Excludingfollowing factors
262.0
FY2017
FY2018
Business transfers*
Fx impacts
Excludingfollowing factors
Incl. impact of NHI price revision
-17.0bil.yen
(billion yen) (billon yen)
*Dermatology business and long-listed drugs transfer: Amortisation of deferred revenue for this year - PY amortisation of deferred revenue
31.1

FY2018 FCST: XTANDI 17
FY16 FY17
XTANDI sales to increase in all regions on a local currency basis
FY18Forecasts
Further penetration in earlier treatment within the current indications
Utilize solid evidence obtained in clinical trials and our strong presence in the urology field
Cooperation with Pfizer in the US
Further maximize the value of XTANDI through expanded indication
Sales by region
Asia/Oceania
EMEA
Americas
Japan
(billion yen)
Year on Year sales growth (FY17 vs FY18)
Japan: +8%
EMEA: +12%(EUR basis)
Americas: +5%(USD basis)
Asia/Oceania: +34%(CER basis)23.4 26.1 28.2
139.4 155.6 154.7
85.3
106.7 119.74.0
5.87.7
252.1
294.3 (+16.8%)310.3 (+5.5%)

FY2018 FCST: OAB FRANCHISE IN UROLOGY 18
FY16 FY17
Betanis/Myrbetriq/BETMIGA growth enhances OAB Franchise
60% 40%
FY18Forecasts
Sales by productsSales composition ratio by product
(FY18 FCST: yen basis)
Vesicare
Betanis/
Myrbetriq/
BETMIGA
Vesicare
Betanis/
Myrbetriq/
BETMIGA
Year on Year sales growth (FY17 vs FY18)
Japan: +3%
EMEA: +3%(EUR basis)
Americas: +15%(USD basis)
Asia/Oceania: +18%(CER basis)
(billion yen)
116.1 102.3 96.9
98.8 125.7 146.2
214.9228.1 (+6.1%)
243.1 (+6.6%)

AGENDA 19
IReview of Strategic Plan
2015-2017
II
III
FY2017 Financial Results and
FY2018 Forecasts
Initiatives to Build Resilience
for Sustainable Growth
I
II
III
I
II
III

INITIATIVES TO BUILD RESILIENCE FOR SUSTAINABLE GROWTH
PIPELINE

21ROBUST PIPELINE OF ASTELLAS
●enfortumab vedotin (ASG-22ME) (Urothelial cancer)
● AGS-16C3F (Renal cell carcinoma)
● YM311/FG-2216 (Renal anemia)
● ASP8232 (Diabetic kidney disease)
● ASP6294 (BPS/IC)
● ASP8302 (Underactive bladder)
●bleselumab (ASKP1240) (rFSGS)
peficitinib (ASP015K)(Rheumatoid arthritis, US/EU)
● ASP8062 (Fibromyalgia)
● ASP0819 (Fibromyalgia)
● ASP4070 (Pollinosis caused by
Japanese red cedar)
● ASP5094(Rheumatoid arthritis)
● ASP4345(CIAS)
●fezolinetant (ESN364) (MR-VMS)
●reldesemtiv(CK-2127107) (SMA, COPD, ALS)
● ASP7317 (Dry AMD etc.)
enzalutamide (M0 BCR:US/EU/Asia, M1 HSPC:US/EU/JP/Asia,)
gilteritinib (ASP2215)(AML, US/EU/JP/Asia)
●
zolbetuximab(IMAB362)(Gastric and gastroesophagealjunction adenocarcinoma, US/EU/JP/Asia)
mirabegron(Pediatric NDO, EU)
●roxadustat(ASP1517/FG-4592)(Anemia associated with CKD, EU/JP)
●peficitinib (ASP015K)(Rheumatoid arthritis, JP/Asia)
fidaxomicin(Pediatric, EU)
enzalutamide (M0 CRPC: US/EU)
● gilteritinib(R/R AML: US/JP)
●blinatumomab (AMG 103)(Acute lymphoblastic leukemia, JP)
degarelix (3-month, JP)
solifenacin(Pediatric NDO, US)
solifenacin/mirabegron(Concomitant use, US)
tacrolimus (granule for pediatric, US)
●romosozumab (AMG 785) (Osteoporosis, JP)
ipragliflozin(Type 1 diabetes, JP)
fidaxomicin(Infectious enteritis, JP)
linaclotide(Chronic constipation, JP)
● AGS67E
● AGS62P1
● ASP8374/PTZ-201
● ASP7713
● MA-0217
● ASP0892
● ASP1807/CC8464
● ASP6981
● MA-0211
THERAPEUTIC AREA:
Oncology
Urology, Nephrology
Immunology, Neuroscience
Others
Outline of the projects are shown.Please refer to pipeline list for details including target disease.
● New molecular/biological entity
BPS/IC: Bladder pain syndrome/Interstitial cystitis, rFSGS: Recurrence of focal segmental glomerulosclerosis, CIAS: Cognitive impairment associated with schizophrenia, MR-VMS: Menopause-related vasomotor symptoms, SMA: Spinal muscular atrophy, COPD: Chronic obstructive pulmonary disease, ALS: Amyotrophic lateral sclerosis, AMD: Age-related macular degeneration, M0 BCR: Non-metastatic biochemical recurrence, M1 HSPC: Metastatic hormone sensitive prostate cancer, M0 CRPC: Non-metastatic castration-resistant prostate cancer, AML: Acute myeloid leukemia, NDO: Neurogenic detrusor overactivity, CKD: Chronic kidney disease, R/R: Relapsed and refractory
Phase 1 Phase 2 Phase 3 Filed
Evaluating ~30 new molecular/biological entities as potential drivers of future growth

22STEADY PROGRESS IN DEVELOPMENTSUMMARY OF PROGRAM PROGRESS FROM JAN 2018 TO APR 2018
P3 Entry
P2 Entry
P1 Entry
Note: Phase 1 entry is defined as confirmation of IND open. Phase transition is defined by approval of company decision body for entering to next clinical phase. Filing is defined as submission of application to health authorities. Discontinuation is defined by the decision of company decision body.
Steady progression of pipeline
Discontinuation (in a part of
indications) etc.
Filing
gilteritinibMar 2018 (JP)Mar 2018 (US)
Relapsed or refractory AML
ASP0113: Cytomegalovirus reactivation in hematopoietic cell transplant recipients (P3)ASP1707: Rheumatoid arthritis, Endometriosis (P2)
Regulatory Decision
ipragliflozin/
sitagliptinApproved in Mar 2018 (JP)
Fixed dose for Type 2 diabetes
solifenacinApproved inFeb 2018 (EU)
NDO in pediatric
enzalutamideApproved in Feb 2018 (JP)
Tablets for CRPC

Hormone sensitive
23ENZALUTAMIDE: MAXIMIZE THE VALUE FOR PROSTATE CANCER PATIENTS
>>>>>>
>>>>>>
Asymptomatic
Cabazitaxel
Castration Resistant
Symptoms
PSA/Tumor volume
Time
Post-chemo(AFFIRM)
Chemo-naive(PREVAIL)
M0 CRPCPROSPER
Castration Anti-Androgens ChemotherapyLocalizedTherapy*
M0 BCREMBARK
M1 HSPCARCHES**
P. Mulders et al. EAU2012, modified by Astellas * Radiotherapy, prostatectomy, ** Metastatic at the time of diagnosis
PSA: Prostate-specific antigen, PDUFA: the prescription drug user fee act
EMBARK studyP3
M0 BCRNon-metastatic prostate cancer, biochemical recurrence
To compare with ADT and combination, n=1,860
First Patient In:Jan. 2015
ARCHES studyP3
M1 HSPCMetastatic hormone-sensitive prostate cancer
Placebo-controlled, combination with ADT, n=1,100
Enrollment completed
PROSPER studyP3
M0 CRPCNon-metastatic CRPC
Placebo-controlled, combination with ADT, n=1,440
Accepted for review(US/EU)
Castration resistant
Acceptance of application from FDA/EMA were received. PDUFA date is Jul 2018.
M1 CRPC M1 CRPC

ENZALUTAMIDE: PROSPER STUDY RESULTS 24
Enzalutamide decreased the risk of metastasis or death by 71% and delayed median metastasis-free survival by approximately 3 years in M0 CRPC patients.
M0 CRPC
enzalutamide (160mg/day) + ADT
(n= 933)
Primary endpoints:
• Metastasis Free Survival (MFS)
Secondary endpoints:• Safety• Overall Survival (OS)• Time to PSA progression• Time to use of new antineoplastic therapy• PSA response• Quality of Life
Study design:
Placebo + ADT (n= 468)
Conclusion:
In men with M0 CRPC with rapid PSA doubling time (median 3.7 months), enzalutamide resulted in a clinically meaningful and statistically significant 71% reduction in the relative risk of developing M1 CRPC or death.
Enzalutamide showed consistent improvement across the secondary endpoints compared to placebo.
Median OS was not reached in either group in the interim analysis, though a trend toward benefit was observed.(HR = 0.80 [95% CI: 0.58-1.09]; p = 0.1519)
Therapy was well tolerated; adverse events were generally consistent with those reported in prior clinical trials in men with metastatic CRPC.
ADT: Androgen deprivation therapy, PSA: Prostate-specific antigen, HR: hazard ration, CI: Confidence interval

ENZALUTAMIDE: PROSPER STUDY RESULTS 25
Median MFS was approximately 3 years with enzalutamide compared to 14.7 months for placebo (71% reduction in relative risk of radiographic progression or death)
Primary endpoint: Metastatic Free Survival (MFS)*
ENZA: enzalutamide, PBO: placebo, CI: confidence interval, NR: not reached, HR: hazard ratio, mo: monthMaha Hussain, et. al., ASCO Genitourinary Cancer symposium 2018
*MFS: a measure of the amount of time that passes until a cancer can be radiographically detected as having metastasized, or until death, within 112 days of treatment discontinuation.

GILTERITINIB: RELAPSED AND REFRACTORY(R/R) AML 26
Salvage Therapy(n=5000-6000)1, 2
ADMIRAL
AML Patients (~30,000)1
mFLT3 ~30% (~10,000)
1: Annual incidence in U.S., EU5, JP, KantarHealth CancerMPact 2016, 2: 2016 ClearView Market Research, 2016 ZS Market ResearchCR: complete remission, CRh: CR with partial hematological recovery
High-Intensity Induction / Consolidation Low-Intensity Chemo
Chemo Consolidation
Transplant
Maintenance Maintenance
Phase 1 study LACEWING
GOSSAMER MORPHO
ADMIRAL study• Enrollment completed
• Submission was made based on
interim analysis of CR/CRh rate
• Study is being continued to obtain
the final data analysis including
OS co-primary endpoint.
Japan: • Filed in Mar 2018 for R/R AML in
Japan ahead of global submission
under Sakigake designation.
US: • NDA submitted in Mar 2018 for
R/R AML. Fast track designation was
granted by FDA.
Application for market authorization for R/R AML was submitted to PMDA in Mar 2018under SAKIGAKE designation. NDA submission in US followed in Mar 2018

ENFORTUMAB VEDOTIN: METASTATIC UROTHELIAL CANCER 27
P3: EV-301 study Pts with prior CPI treatment Open-label, randomized, n=550 First Patient in: 2H/2018
P2: EV-201 study Pts with prior CPI treatment Open-label, single arm, n=120 First Patient in: Oct 2017
P1b: EV-103 study Combination with CPI Open-label, single arm, n=85 First Patient In: Nov 2017
P1: EV-101 studymUC pts (Part A)Pts with renal insufficiency (Part B)Pts with prior CPI treatment (Part C)
Open-label, dose-escalation/expansion, n=185
First Patient In: Jun 2014
Locally advanced and metastatic urothelial cancer
Exploration in other solid tumor
P1: EV-101 studymetastatic NSCLC (Part B)metastatic ovarian cancer (Part B)
Open-label, dose-expansion, n= 30 First Patient in: Jun 2014
FDA granted “Breakthrough therapy designation” for locally advanced or metastatic urothelial cancer (mUC) with prior checkpoint inhibitor (CPI) treatment
• Targeting Nectin-4 which is a type I transmembrane
protein that belongs to the Nectin family of adhesion
molecules.
• Highly expressed in bladder cancer with more
moderate expression in breast, pancreatic, lung and
ovarian cancer tissue microarrays (TMA)
Target: Nectin-4
• enfortumab vedotin is utilizing ADC technology*.
Antibody Drug Conjugate (ADC)
*: ADC technology is license-in from Seattle Genetics, Inc.

28ROXADUSTAT: ROBUST PHASE 3 PROGRAM TO SUPPORT FILING AND REIMBURSEMENT IN EUROPE AND JAPAN
Dialysis Non-dialysis
Global
HIMALAYAS:Incident dialysis, vs epoetin alfa
DOLOMITES, vs darbepoetinEnrollment completedData readout planned in 4Q/2018
SIERRAS: Stable dialysis, vs epoetin alfa
ALPS, vs placeboStudy completedData readout in 2018
PYRENEES:Stable dialysis, vs epoetin alfa or darbepoetinEnrollment completedData readout planned in 3Q/2018
ANDES, vs placeboEnrollment completedData readout planned in 4Q/2018
Japan
HD: Conversion, vs darbepoetinStudy completedData readout planned in 2Q/2018 Conversion, vs darbepoetin
HD: Conversion, long-termStudy completed (TLR obtained in Feb 2018)
HD: Correction (ESA-naïve)Study completed (TLR obtained in Feb 2018) Correction
Enrollment completedData readout planned in 4Q/2018PD:
Study completed (TLR obtained in Oct 2017)
Note: Company logo in the table shows the sponsor of studiesHD: Hemodialysis, PD: Peritoneal dialysis, ESA: Erythropoietin stimulation agents
Steady progress of Phase 3 program in dialysis and non-dialysis patients

ROXADUSTAT: JAPANESE STUDIES IN DIALYSIS PATIENTS 29
Hemodialysis: ESA-conversion, long-termHemodialysis: Correction (ESA-naive)
Positive results obtained from 2 Phase 3 studies in Japanese dialysis patients
Study design: multi-center, open-label, non-comparator study
Enrolled patients: 164
Dose: 70 mg or 100 mg for initial dose3
Treatment : 3 times/week, up to 52 weeks
Key outcome measure:
Maintenance rate of target Hb level4 for Week 18-24 and for Week 46-52.
Results:
Hb maintenance rate was 79.1% for Week 18-24 and 71.2% for Week 46-52.
roxadustat was well tolerated. The long-term treatment with roxadustat was consistent with the previously known safety profile.
Study design: multi-center, open-label, randomized, non-comparator study
Enrolled patients: 75
Dose: 50 mg or 70 mg for initial dose1
Treatment : 3 times/week, up to 24 weeks
Key outcome measure:
Hemoglobin (Hb) response rate2 from baseline to End of Treatment (EOT)
Results: Hb response rate from baseline to EOT
was 86.5% in starting 50 mg group and 89.2% in starting 70 mg group.
roxadustat was well tolerated and in line with the safety data available to date.
1: Dose adjustment was allowed between 20 to 300 mg. 2: Proportion of subjects who achieve Hb response (Hb ≥ 10.0 g/dL and a Hb increase from baseline by ≥ 1.0 g/dL). 3: Subjects were assigned to 70 mg or 100 mg initial dose based on the average weekly dose of previous ESA. Dose adjustment was allowed between 20-300 mg. 4: Proportion of subjects who achieve the target Hemoglobin (Hb) level (10.0 g/dL to 12.0 g/dL) based on the average Hb level which was measured every two weeks.
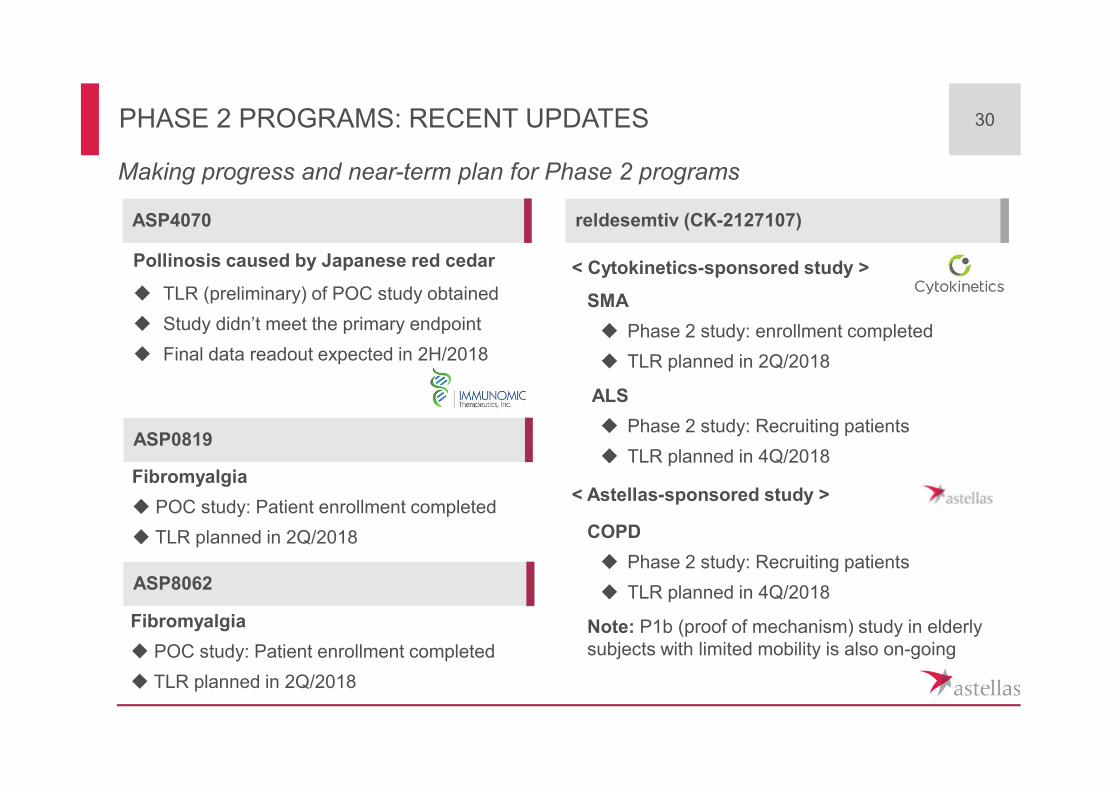
PHASE 2 PROGRAMS: RECENT UPDATES 30
ASP4070
ASP0819
ASP8062
Pollinosis caused by Japanese red cedar
TLR (preliminary) of POC study obtained
Study didn’t meet the primary endpoint
Final data readout expected in 2H/2018
Fibromyalgia
POC study: Patient enrollment completed
TLR planned in 2Q/2018
Fibromyalgia
POC study: Patient enrollment completed
TLR planned in 2Q/2018
Making progress and near-term plan for Phase 2 programs
reldesemtiv (CK-2127107)
< Cytokinetics-sponsored study >
SMA
Phase 2 study: enrollment completed
TLR planned in 2Q/2018
ALS
Phase 2 study: Recruiting patients
TLR planned in 4Q/2018
< Astellas-sponsored study >
COPD
Phase 2 study: Recruiting patients
TLR planned in 4Q/2018
Note: P1b (proof of mechanism) study in elderly subjects with limited mobility is also on-going

EXPECTED KEY PIPELINE EVENTS IN FY2018 31
Data Readouts Filing*
Regulatory Decisions
enzalutamideM0 CRPC (US, EU)
gilteritinibRelapsed and refractory AML
(US, Japan)
solifenacin/mirabegronconcomitant use in OAB (US)
blinatumomabALL (Japan)
*Subject to internal assessment, decision and regulatory consultation, as appropriate
gilteritinibR/R AML (ADMIRAL study)**
roxadustat
EU: Non-dialysis pts
ALPS study
DOLOMITE studyANDES study
EU: Dialysis pts
HIMALAYA study
SIERRA study
PYRENEES study
JP: Dialysis pts
Conversion in HD pts
JP: Non-dialysis pts
Correction study (ESA-naive)
peficitinibRheumatoid arthritis (Japan)
Phase 3 studyPhase 2 (POC) study
ASP0819Fibromyalgia
ASP8062Fibromyalgia
reldesemtiv
(CK-2127107)SMA
COPD
ALS
ASP5094Rheumatoid arthritis
Important milestones from POC through registration
degarelixProstate cancer, 3M (Japan)
romosozumabOsteoporosis (Japan)
linaclotideChronic constipation (Japan)
ipragliflozinType 1 diabetes (Japan)
fidaxomicinInfectious enteritis (Japan)
Phase 2b study
fezolinetantMR-VMS
**: event-driven study, SMA: Spinal muscular atrophy, COPD: Chronic obstructive pulmonary disease, ALS: Amyotrophic lateral sclerosis, MR-VMS: Menopause-related vasomotor symptoms, R/R: Relapsed and refractory, AML: Acute myeloid leukemia, HD: hemodialysis, M0 CRPC: Non-metastatic castration-resistant prostate cancer, OAB: overactive bladder,ALL: Acute lymphoblastic leukemia

POTENTIAL GROWTH DRIVERS 32
Near term growth drivers
(Filed or Filing expected in FY2018)
Growth drivers/new products
Mid-termgrowth drivers
(FY2019- )
Subject to internal assessment, decision and regulatory consultation, as appropriate
Oncology, Urology, Nephrology, Immunology, Neuroscience, Others
Future growth driven by compounds that already have achieved POC
POC; Proof of Concept
enzalutamide(M0 CRPC)
gilteritinib(Relapsed and Refractory AML)
solifenacin/mirabegron(Combination therapy)
roxadustat(JP: Dialysis)
peficitinib
linaclotide(Chronic constipation)
romosozumab
enzalutamide(label expansion)
gilteritinib(Other AML patient segments)
enfortumab vedotin
zolbetuximab (IMAB362)
roxadustat(EU: Dialysis/Non-dialysis)
(JP: Non-dialysis)
fezolinetant

INITIATIVES TO BUILD RESILIENCE FOR SUSTAINABLE GROWTH
STRATEGIC INITIATIVES

MODALITY: ACQUISITION OF UNIVERSAL CELLS
34
Reinforce focus on cell therapy by acquiring Universal Donor Cell technology
Strength of Universal Donor Cell technology
Technology to create stem cell therapies that overcome immune rejection
Universal Donor Cell technology can be administered to any recipient without the need for Human Leukocyte Antigen (HLA) matching
Expands research potential to wide range of differentiated cells
*Astellas Institute for Regenerative Medicine
Universal Donor Cell technology is essential for expansion to systemic diseases such as autoimmune diseases and blood diseases
Further strengthens R&D focus in cell therapy by combining capability of AIRM* with Universal Donor Cell technology

35MODALITY: LICENSE AGREEMENT WITH TOTTORI UNIVERSITY
Immuno-oncolytic virus with multiple trans-genes to evoke anti-tumor immunity
NK cell: Natural Killer cell, DC: Dendritic Cell, APC: Antigen Presenting Cell
cancer ≠ foreign body
anti-tumor ⋘ immune suppression
cancer = foreign body
immune suppression ⋘ anti-tumor

INITIATIVES TO BUILD RESILIENCE FOR SUSTAINABLE GROWTH
PURSUE OPERATIONAL EXCELLENCE

OPTIMIZATION OF ORGANIZATION / STRUCTUREIN EMEA
37
Evolve operating model with changes in external environment
R&D activities in Netherlands consolidated in Japan and the U.S.
Further improving efficiency of finance function in EMEA through outsourcing and reorganization
Enhancing sales & marketing efficiency and strategy quality in EMEA through the optimization of sales & marketing organization / structure

SCHEDULE 38
Information meeting on Strategic PlanMay 22, 2018
2:00 pm – 3:30 pm (JST)

APPENDIX

FY2017: SALES BY REGION
FY16 FY17 Change
Japan (billion yen) 480.8 421.2 -12.4%
of sales in Japanese market 452.7 383.4 -15.3%
Americas (million USD) 3,805 3,909 +2.7%
EMEA (million EUR) 2,785 2,651 -4.8%
Asia/Oceania (billion yen) 87.7 102.0 +16.3%
40

FY2018 FCST: SALES BY REGION
FY17 FY18 FCST Change
Japan (billion yen) 421.2 396.8 -5.8%
of sales in Japanese market 383.4 365.3 -4.7%
Americas (million USD) 3,909 4,042 +3.4%
EMEA (million EUR) 2,651 2,645 -0.2%
Asia/Oceania (billion yen) 102.0 112.9 +10.7%
41

FY2018 FCST: SALES IN KEY AREAS
(billion yen) FY17 FY18 FCST Change CER growth
XTANDI 294.3 310.3 +5.5% +8.4%
OAB in Urology 228.1 243.1 +6.6% +9.6%
Vesicare 102.3 96.9 -5.2% -3.2%
Betanis/Myrbetriq/BETMIGA 125.7 146.2 +16.3% +20.1%
Transplantation 198.5 190.7 -3.9% -3.3%
42
Transplantation: Prograf, Advagraf/Graceptor/ASTAGRAF XL CER:Constant Exchange Rate

FY2018 SALES FCST: XTANDI 43
FY12 FY13 FY14 FY15 FY16 FY17 FY12 FY13 FY14 FY15 FY16 FY17 FY18Forecasts
FY18Forecasts
Sales since launch by region
Japan Americas
EMEA Asia&Oceania
(billion yen) (million USD)
(million euro) (billion yen)
US
ex-US
-20
80
180
280 -11%*+11% +8%
-100
400
900
1400
-2% +7% +4%
+1%+9% +5%
0
500
+35%+15%
+12%
5x% 4x%
0
50
100
+67%
+47%
+31%
*+19% excl. NHI drug price cut impacts

44
Currency FY16 FY17 Change
USD 108 111 +2
EUR 119 130 +11
Average rate for the period
Currency FY16 FY17
USD -0 -6
EUR -8 +11
Change in closing rate from PY end
(yen)
FX RATE (ACTUAL)
Exchange rate change +: Yen Weakening, - : Yen Strengthening

FY2018 FCST:FX RATE & FX SENSITIVITY 45
Currency
Average rate1 yen higher than assumption
Year-end rate1 yen higher than
assumption
Net sales Core OP Core OP
USD Approx. -5.1 bil yen Approx. -1.2 bil yen Approx. +0.6 bil yen
EUR Approx. -2.6 bil yen Approx. -1.1 bil yen Approx. +0.3 bil yen
Estimated Fx sensitivity of FY2018 forecasts by 1 yen appreciation
Currency FY17 FY18 FCST Change
USD 111 105 -6
EUR 130 130 +0
Average rate for the period
Currency FY17 FY18 FCST
USD -6 -1
EUR +11 -1
Change in closing rate from PY end
(yen)

BALANCE SHEET/CASH FLOW HIGHLIGHTS
(billion yen) FY2016 end FY2017 end
Total assets 1,814.1 1,858.2
Cash and cash equivalents 340.9 331.7
Total net assetsEquity ratio (%)
1,271.870.1%
1,268.368.3%
46
(billion yen) FY16 FY17
Cash flows from operating activities 235.6 312.6
Cash flows from investing activities (73.4) (121.8)
Free cash flows 162.2 190.8
Cash flows from financing activities (166.2) (203.4)
Acquisition of treasury shares (92.2) (130.7)
Dividends paid (70.1) (71.6)

FY2016 FY2017FY2018
(Forecast)
EPS (yen) 103.69 81.11 107.79
Divided per share (yen)
34 36 (planned) 38 (forecast)
ROE 17.3% 13.0% -
DOE 5.6% 5.7% -
Share buyback60 million shares
91.4 billion yen
88 million shares
129.9 billion yen-
Treasury stock cancellation
68 million shares 85 million shares89 million shares
(planned)
47PROFIT DISTRIBUTION

ON THE FOREFRONT OF HEALTHCARE CHANGE