fy2017/2018 results announcement · 18% net d/e ratio (fy17:15%) ... nilai bbr 1 bukit jelutong...
TRANSCRIPT

FY2017/2018 Results AnnouncementFourth Quarter ended 30 June 2018
28 August 2018

2
FY2017/2018 Financial Performance
3
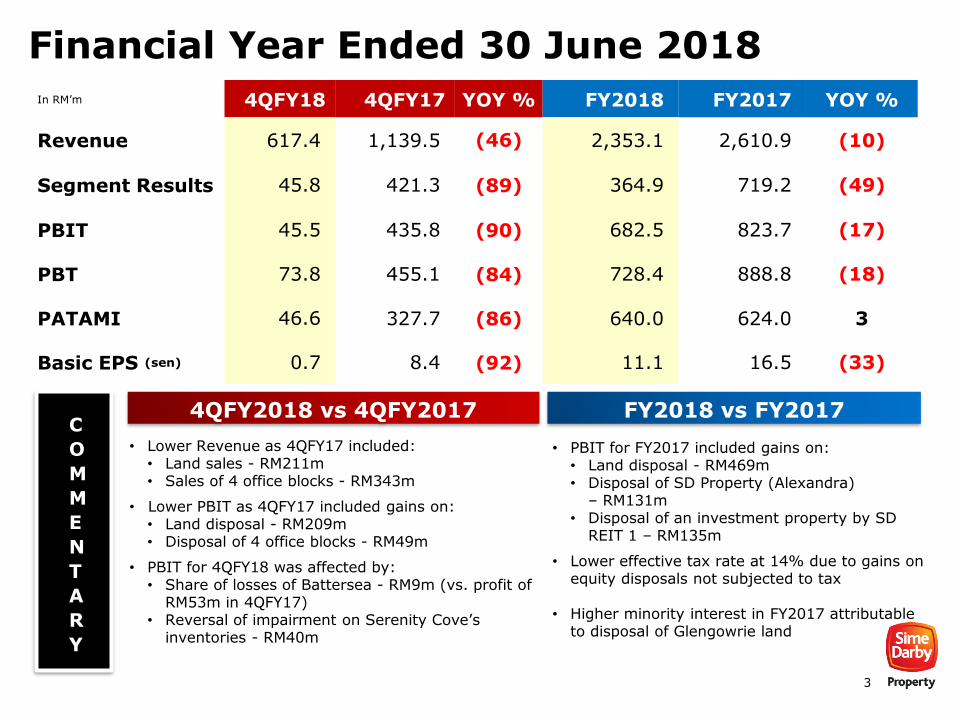
Financial Year Ended 30 June 2018In RM’m 4QFY18 4QFY17 YOY % FY2018 FY2017 YOY %
Revenue 617.4 1,139.5 (46) 2,353.1 2,610.9 (10)
Segment Results 45.8 421.3 (89) 364.9 719.2 (49)
PBIT 45.5 435.8 (90) 682.5 823.7 (17)
PBT 73.8 455.1 (84) 728.4 888.8 (18)
PATAMI 46.6 327.7 (86) 640.0 624.0 3
Basic EPS (sen) 0.7 8.4 (92) 11.1 16.5 (33)
• Lower Revenue as 4QFY17 included: • Land sales - RM211m• Sales of 4 office blocks - RM343m
• Lower PBIT as 4QFY17 included gains on: • Land disposal - RM209m • Disposal of 4 office blocks - RM49m
• PBIT for 4QFY18 was affected by: • Share of losses of Battersea - RM9m (vs. profit of
RM53m in 4QFY17) • Reversal of impairment on Serenity Cove’s
inventories - RM40m
• PBIT for FY2017 included gains on:• Land disposal - RM469m• Disposal of SD Property (Alexandra)
– RM131m• Disposal of an investment property by SD
REIT 1 – RM135m
• Lower effective tax rate at 14% due to gains on equity disposals not subjected to tax
• Higher minority interest in FY2017 attributable to disposal of Glengowrie land
C
O
M
M
E
N
T
A
R
Y
4QFY2018 vs 4QFY2017 FY2018 vs FY2017

4
Core Earnings Improvement
Excluding one-off items of RM406m in FY2018, core
PBIT higher by 143% driven by higher sales and
development activities and profit from Concession Arrangement
Compulsory acquisition / land disposal gains 469
Gain on disposal of SD Property (Alexandra) 131
Project abortive cost on the termination of Saizen REIT
(25)
Share of gains from the disposal of an investment property by SD REIT 1
135
Total one-off items (86% of total PBIT) 710
FY2017 Core PBIT: 114
Land disposal gains 88
Gain on disposal of MLDC and Seriemas 318
Total one-off items (59% of total PBIT) 406
FY2018 Core PBIT 277
One-off items in FY2018:
One-off items in FY2017:
277
114
406 710
FY2018 FY2017
PBIT
PBIT excluding one-offs
One-Offs
RM824mil
RM683mil
Lower one-off gains in
FY2018 by RM304mil
143%
R E V E N U E
RM’m FY2018 FY2017
Reported revenue
2,353 2,611
Land sales (89) (482)
Revenue excluding land sales
2,264 2,129
10%
6%
5
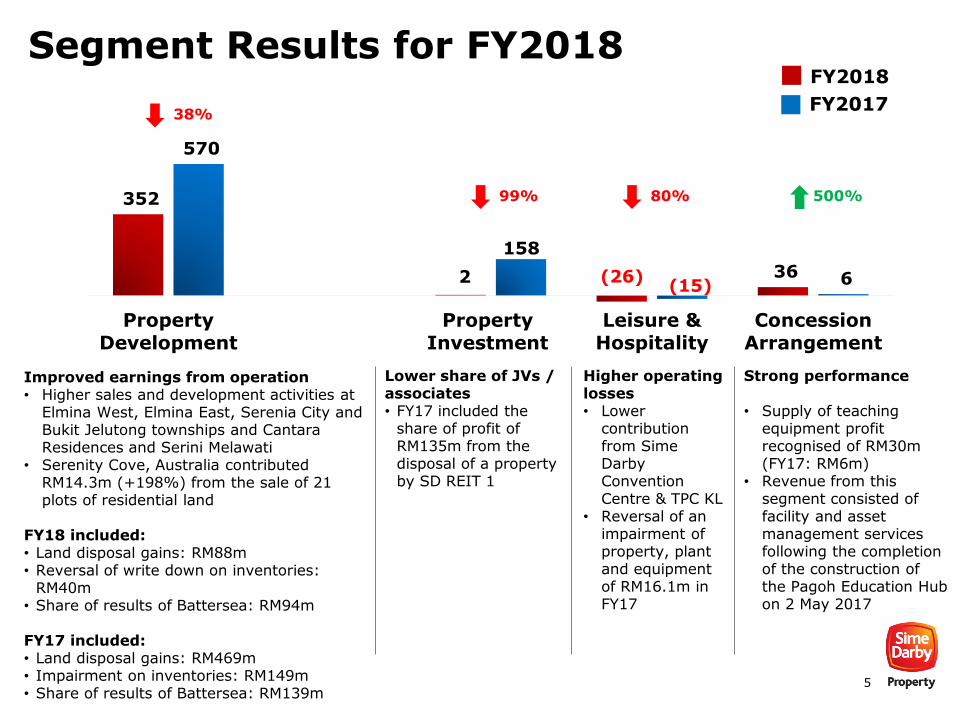
FY2017
FY2018
352
2 (26) 36
570
158
(15) 6
PropertyDevelopment
PropertyInvestment
Leisure &Hospitality
ConcessionArrangement
Improved earnings from operation• Higher sales and development activities at
Elmina West, Elmina East, Serenia City and Bukit Jelutong townships and Cantara Residences and Serini Melawati
• Serenity Cove, Australia contributed RM14.3m (+198%) from the sale of 21 plots of residential land
FY18 included:• Land disposal gains: RM88m• Reversal of write down on inventories:
RM40m• Share of results of Battersea: RM94m
FY17 included: • Land disposal gains: RM469m• Impairment on inventories: RM149m• Share of results of Battersea: RM139m
38%
99% 80% 500%
Lower share of JVs / associates• FY17 included the
share of profit of RM135m from the disposal of a property by SD REIT 1
Higher operating losses• Lower
contribution from Sime Darby Convention Centre & TPC KL
• Reversal of an impairment of property, plant and equipment of RM16.1m in FY17
Strong performance
• Supply of teaching equipment profit recognised of RM30m (FY17: RM6m)
• Revenue from this segment consisted of facility and asset management services following the completion of the construction of the Pagoh Education Hub on 2 May 2017
Segment Results for FY2018
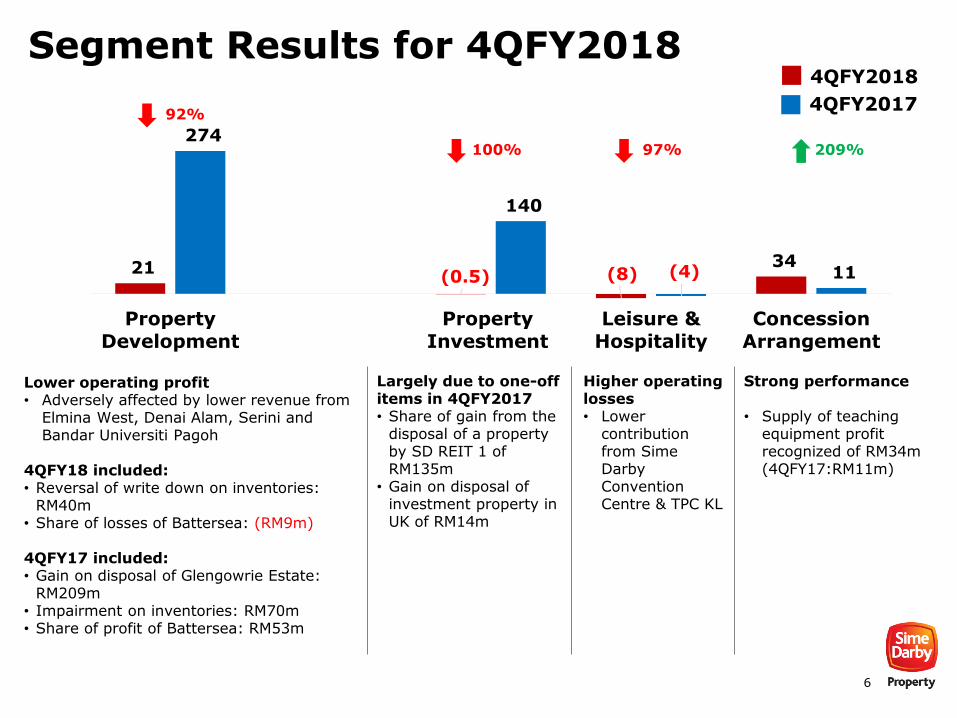
6
21 (0.5) (8)
34
274
140
(4) 11
PropertyDevelopment
PropertyInvestment
Leisure &Hospitality
ConcessionArrangement
Lower operating profit• Adversely affected by lower revenue from
Elmina West, Denai Alam, Serini and Bandar Universiti Pagoh
4QFY18 included:• Reversal of write down on inventories:
RM40m• Share of losses of Battersea: (RM9m)
4QFY17 included: • Gain on disposal of Glengowrie Estate:
RM209m• Impairment on inventories: RM70m• Share of profit of Battersea: RM53m
92%
4QFY2018
4QFY2017
100% 97% 209%
Largely due to one-off items in 4QFY2017• Share of gain from the
disposal of a property by SD REIT 1 of RM135m
• Gain on disposal of investment property in UK of RM14m
Higher operating losses• Lower
contribution from Sime Darby Convention Centre & TPC KL
Strong performance
• Supply of teaching equipment profit recognized of RM34m (4QFY17:RM11m)
Segment Results for 4QFY2018
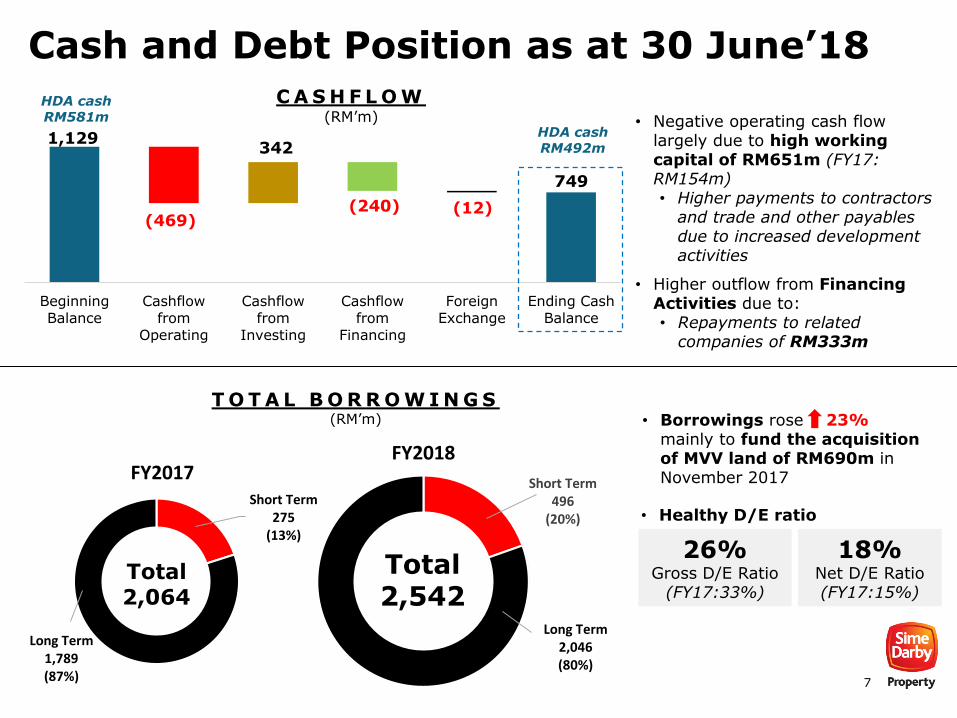
7
Short Term496
(20%)
Long Term2,046(80%)
FY2018
1,129
749
(469)
342
(240) (12)
BeginningBalance
Cashflowfrom
Operating
Cashflowfrom
Investing
Cashflowfrom
Financing
ForeignExchange
Ending CashBalance
C A S H F L O W(RM’m) • Negative operating cash flow
largely due to high working capital of RM651m (FY17: RM154m)• Higher payments to contractors
and trade and other payables due to increased development activities
• Higher outflow from Financing Activities due to: • Repayments to related
companies of RM333m
Short Term275
(13%)
Long Term1,789(87%)
FY2017
• Borrowings rose 23%mainly to fund the acquisition of MVV land of RM690m in November 2017
T O T A L B O R R O W I N G S(RM’m)
Total2,064
Total2,542
26%Gross D/E Ratio
(FY17:33%)
18%Net D/E Ratio (FY17:15%)
• Healthy D/E ratio
Cash and Debt Position as at 30 June’18
HDA cashRM581m
HDA cashRM492m
8
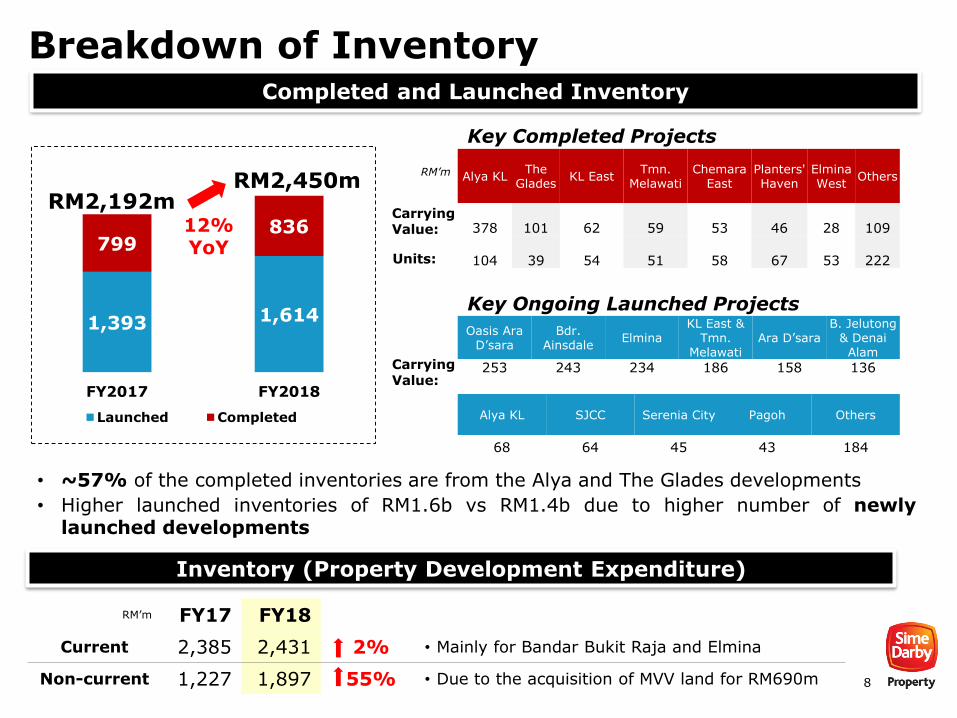
Breakdown of Inventory
1,393 1,614
799836
FY2017 FY2018
Launched Completed
• ~57% of the completed inventories are from the Alya and The Glades developments
• Higher launched inventories of RM1.6b vs RM1.4b due to higher number of newlylaunched developments
RM’m
Units:
RM2,192mRM2,450m
12%YoY
Key Completed Projects
Carrying Value:
Alya KLThe
GladesKL East
Tmn. Melawati
ChemaraEast
Planters' Haven
Elmina West
Others
378 101 62 59 53 46 28 109
104 39 54 51 58 67 53 222
Oasis Ara D’sara
Bdr. Ainsdale
ElminaKL East &
Tmn. Melawati
Ara D’saraB. Jelutong
& DenaiAlam
253 243 234 186 158 136Carrying Value:
Alya KL SJCC Serenia City Pagoh Others
68 64 45 43 184
Key Ongoing Launched Projects
Completed and Launched Inventory
Inventory (Property Development Expenditure)
RM’m FY17 FY18
Current 2,385 2,431 2% • Mainly for Bandar Bukit Raja and Elmina
Non-current 1,227 1,897 55% • Due to the acquisition of MVV land for RM690m

9
FY2017/2018 Operational Highlights

10
Gross Sales Value
1,933
2,250
16%
• FY2018 Sales Value: RM2.3bn 16%
• Units sold: 3,045 72% (includes 731
statutory units with GSV of RM150m)
• Units sold excl. statutory: 2,314 74%
Sales Performance
• 91% of sales originated from Selangor,followed by Negeri Sembilan (7%) andJohor (2%)
386
294
279
277
228
173
122
111
101
55
52
50
47
38
26
11
BBR 2&3
Elmina East
Elmina West
Putra Heights
Denai Alam & Bukit Subang
Serenia City
Ara D'sara
SJCC
Nilai
BBR 1
Bukit Jelutong
Bdr. Ainsdale
Pagoh & Tmn. Pasir Putih
KL East
Tmn Melawati
Others*
FY2018 Year-on-Year Performance FY2018 Sales Breakdown by Township
RM’m
* Others: USJ Heights and Saujana Impian
Klang
Guthrie Corridor
Greater Klang Valley
Negeri Sembilan
Johor
1,766
3,045
RM’m
72%
Units Sold
2017 2018 2017 2018
11
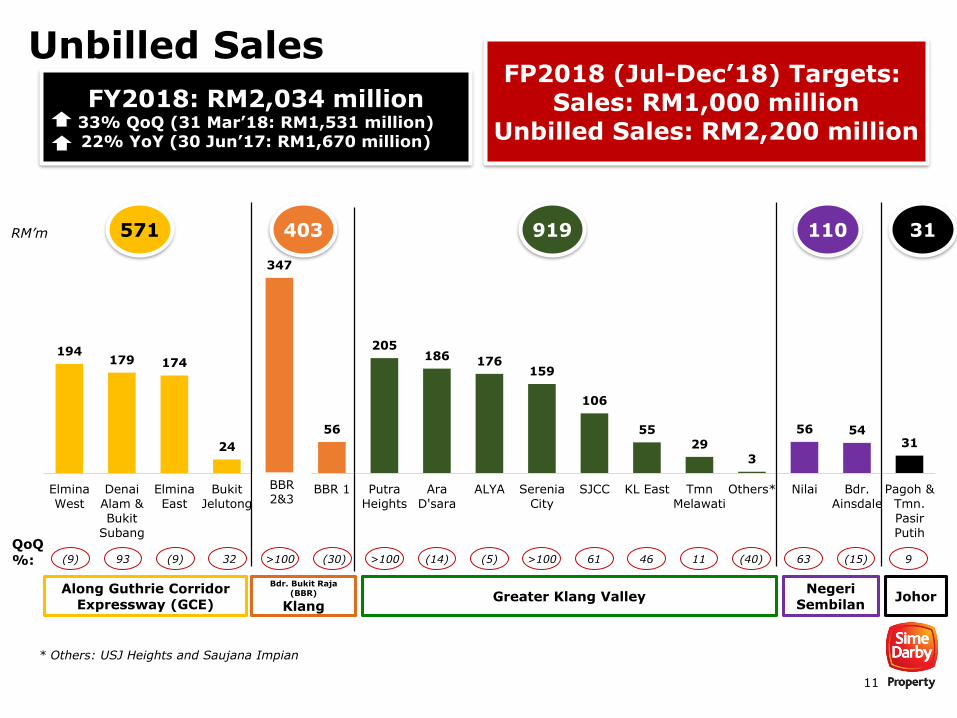
Unbilled Sales
194179 174
24
347
56
205186 176
159
106
5529
3
56 5431
Elmina
West
Denai
Alam &
Bukit
Subang
Elmina
East
Bukit
Jelutong
BBR 2&3 BBR 1 Putra
Heights
Ara
D'sara
ALYA Serenia
City
SJCC KL East Tmn
Melawati
Others* Nilai Bdr.
Ainsdale
Pagoh &
Tmn.
Pasir
Putih
FY2018: RM2,034 million33% QoQ (31 Mar’18: RM1,531 million)22% YoY (30 Jun’17: RM1,670 million)
Along Guthrie Corridor Expressway (GCE)
Bdr. Bukit Raja (BBR)
KlangGreater Klang Valley
NegeriSembilan
Johor
* Others: USJ Heights and Saujana Impian
QoQ%: (9) 93 (9) 32 >100 (30) >100 (14) (5) >100 61 46 11 (40) 63 (15) 9
RM’m
FP2018 (Jul-Dec’18) Targets: Sales: RM1,000 million
Unbilled Sales: RM2,200 million
BBR 2&3
571 403 919 110 31
12
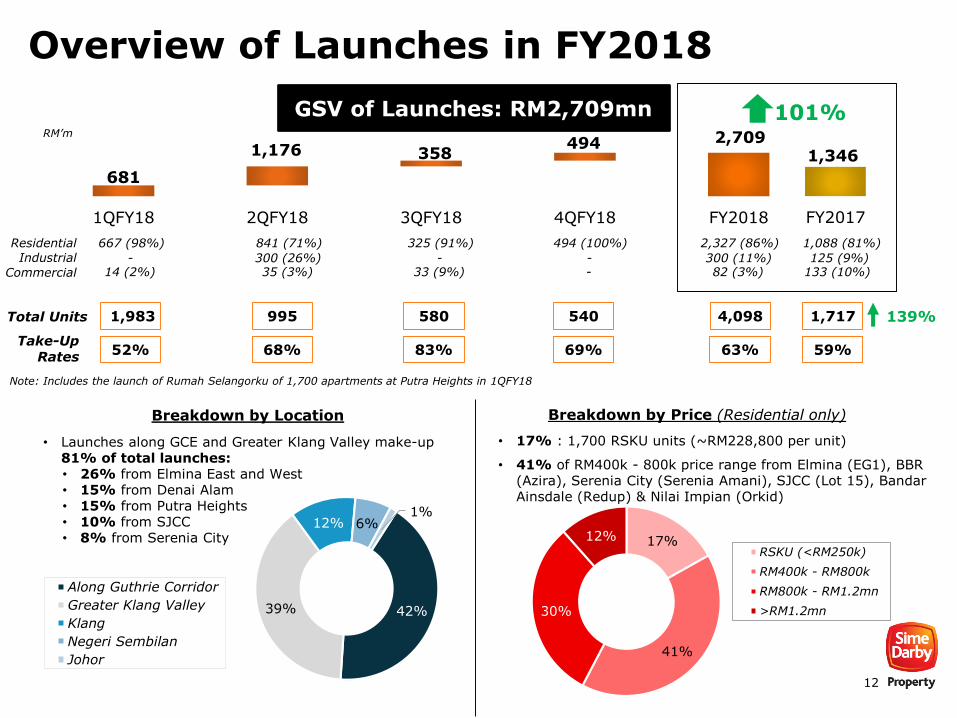
Overview of Launches in FY2018
681
2,7091,176 358
494
1QFY18 2QFY18 3QFY18 4QFY18 FY2018
GSV of Launches: RM2,709mn
17%
41%
30%
12%RSKU (<RM250k)
RM400k - RM800k
RM800k - RM1.2mn
>RM1.2mn42%39%
12% 6%1%
Along Guthrie Corridor
Greater Klang Valley
Klang
Negeri Sembilan
Johor
Total Units 1,983 995 580 540
Note: Includes the launch of Rumah Selangorku of 1,700 apartments at Putra Heights in 1QFY18
Take-Up Rates
52% 68% 83% 69%
RM’m
Breakdown by Location Breakdown by Price (Residential only)
1,346
FY2017
4,098
63%
1,717
59%
• 17% : 1,700 RSKU units (~RM228,800 per unit)
• 41% of RM400k - 800k price range from Elmina (EG1), BBR (Azira), Serenia City (Serenia Amani), SJCC (Lot 15), Bandar Ainsdale (Redup) & Nilai Impian (Orkid)
101%
• Launches along GCE and Greater Klang Valley make-up 81% of total launches:• 26% from Elmina East and West• 15% from Denai Alam• 15% from Putra Heights• 10% from SJCC• 8% from Serenia City
139%
Residential 667 (98%) 841 (71%) 325 (91%) 494 (100%) 2,327 (86%) 1,088 (81%)
14 (2%) 35 (3%) 33 (9%) - 82 (3%) 133 (10%)- 300 (26%) - - 300 (11%) 125 (9%)Industrial
Commercial
13
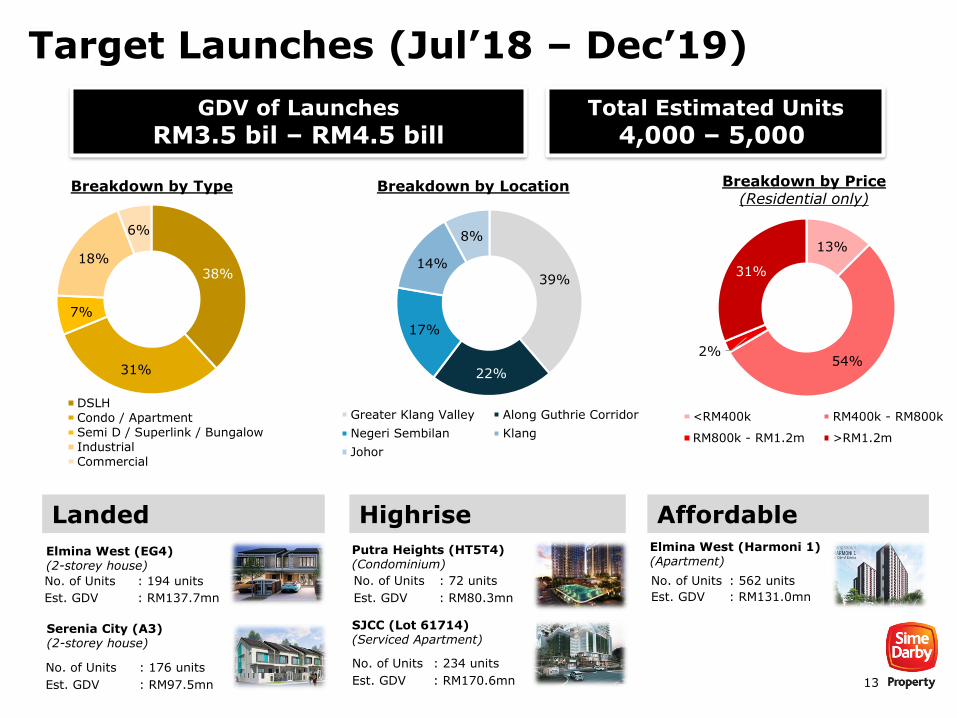
Target Launches (Jul’18 – Dec’19)
Breakdown by Type Breakdown by Location Breakdown by Price(Residential only)
38%
31%
7%
18%
6%
DSLH
Condo / Apartment
Semi D / Superlink / Bungalow
Industrial
Commercial
39%
22%
17%
14%
8%
Greater Klang Valley Along Guthrie Corridor
Negeri Sembilan Klang
Johor
13%
54%2%
31%
<RM400k RM400k - RM800k
RM800k - RM1.2m >RM1.2m
Elmina West (EG4)(2-storey house)
No. of Units : 194 units
Est. GDV : RM137.7mn
No. of Units : 176 units
Est. GDV : RM97.5mn
Serenia City (A3)(2-storey house)
Elmina West (Harmoni 1)(Apartment)
No. of Units : 562 units
Est. GDV : RM131.0mn
No. of Units : 234 units
Est. GDV : RM170.6mn
SJCC (Lot 61714)(Serviced Apartment)
No. of Units : 72 units
Est. GDV : RM80.3mn
Putra Heights (HT5T4)(Condominium)
Landed Highrise Affordable
GDV of Launches
RM3.5 bil – RM4.5 billTotal Estimated Units
4,000 – 5,000
14
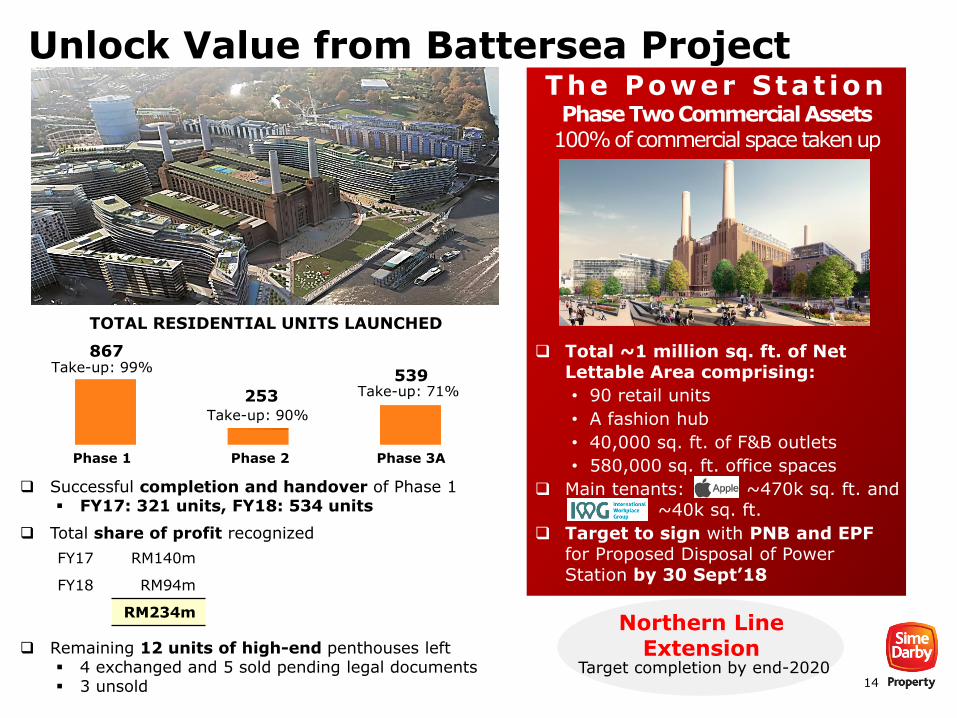
Unlock Value from Battersea Project
Northern Line Extension
TOTAL RESIDENTIAL UNITS LAUNCHED
867
253
539Take-up: 99%
Take-up: 90%
Take-up: 71%
Target completion by end-2020
Phase 1 Phase 2 Phase 3A
The Power Stat ionPhase Two Commercial Assets
100% of commercial space taken up
Total ~1 million sq. ft. of Net Lettable Area comprising:
• 90 retail units
• A fashion hub
• 40,000 sq. ft. of F&B outlets
• 580,000 sq. ft. office spaces
Main tenants: ~470k sq. ft. and~40k sq. ft.
Target to sign with PNB and EPF for Proposed Disposal of Power Station by 30 Sept’18
Successful completion and handover of Phase 1 FY17: 321 units, FY18: 534 units
Total share of profit recognized
Remaining 12 units of high-end penthouses left 4 exchanged and 5 sold pending legal documents 3 unsold
FY17 RM140m
FY18 RM94m
RM234m
15
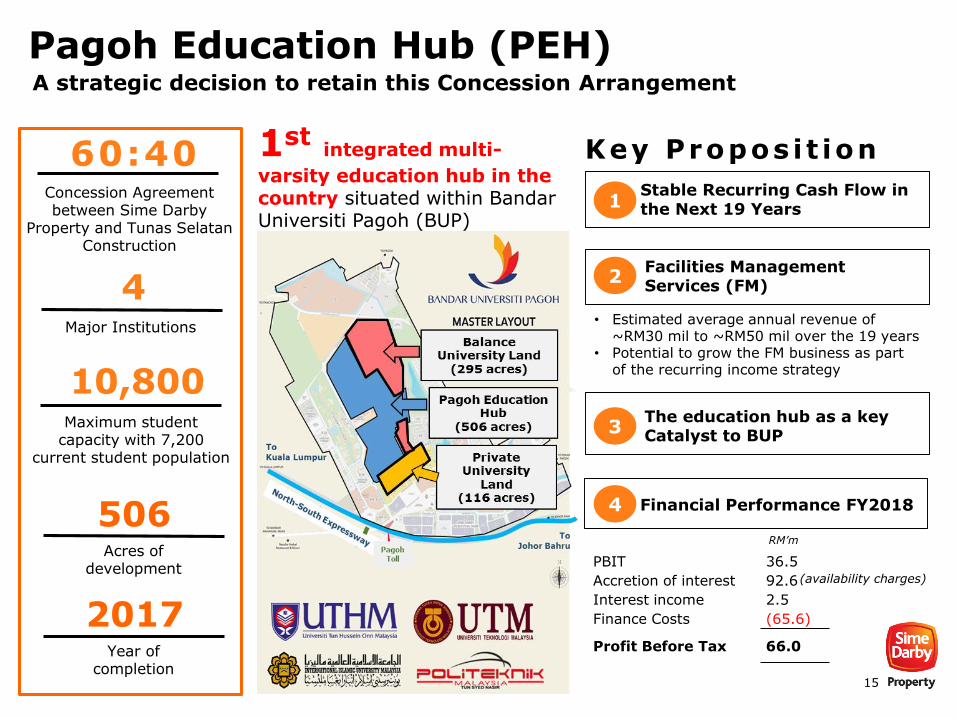
Pagoh Education Hub (PEH)
506
1
• Estimated average annual revenue of ~RM30 mil to ~RM50 mil over the 19 years
• Potential to grow the FM business as part of the recurring income strategy
1stintegrated multi-
varsity education hub in the country situated within Bandar Universiti Pagoh (BUP)
Key Propos i t ion
Facilities Management Services (FM)
2
Stable Recurring Cash Flow in the Next 19 Years
3The education hub as a keyCatalyst to BUP
2017
Concession Agreement between Sime Darby
Property and Tunas Selatan Construction
Acres of development
4Major Institutions
60:40
10,800Maximum student
capacity with 7,200 current student population
Year of completion
4 Financial Performance FY2018
RM’m
PBIT 36.5
Accretion of interest 92.6
Interest income 2.5
Finance Costs (65.6)
Profit Before Tax 66.0
(availability charges)
A strategic decision to retain this Concession Arrangement
16
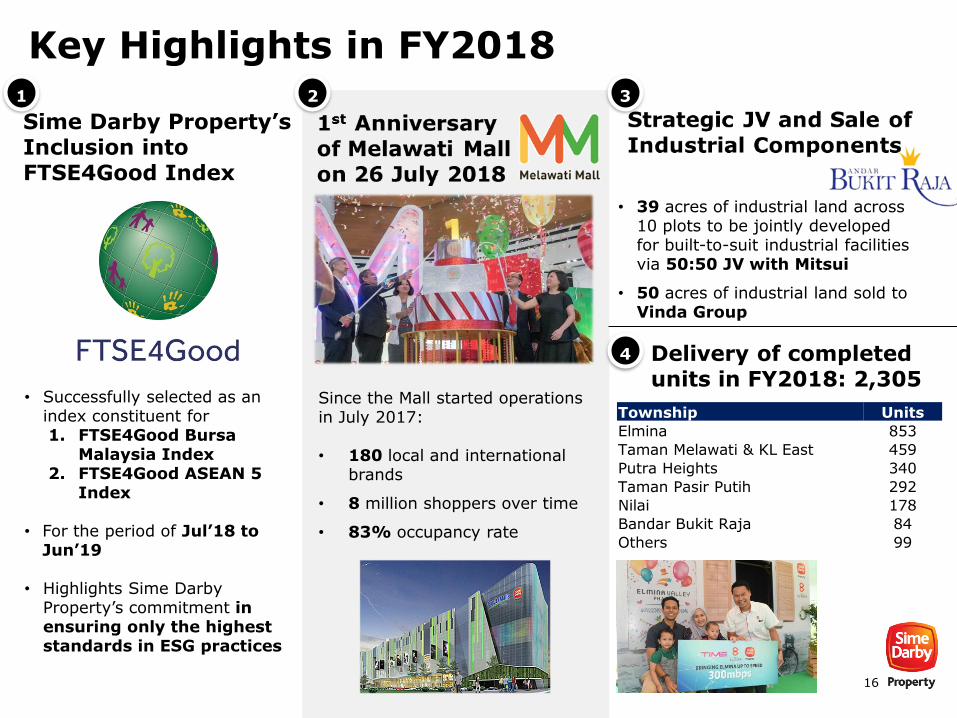
Key Highlights in FY2018
Since the Mall started operations in July 2017:
• 180 local and international brands
• 8 million shoppers over time
• 83% occupancy rate
• 39 acres of industrial land across 10 plots to be jointly developed for built-to-suit industrial facilities via 50:50 JV with Mitsui
• 50 acres of industrial land sold to Vinda Group
Sime Darby Property’s Inclusion into FTSE4Good Index
• Successfully selected as an index constituent for 1. FTSE4Good Bursa
Malaysia Index2. FTSE4Good ASEAN 5
Index
• For the period of Jul’18 to Jun’19
• Highlights Sime Darby Property’s commitment in ensuring only the highest standards in ESG practices
Delivery of completed units in FY2018: 2,305
Township Units
Elmina 853
Taman Melawati & KL East 459
Putra Heights 340
Taman Pasir Putih 292
Nilai 178
Bandar Bukit Raja 84
Others 99
1 2 3
4
17
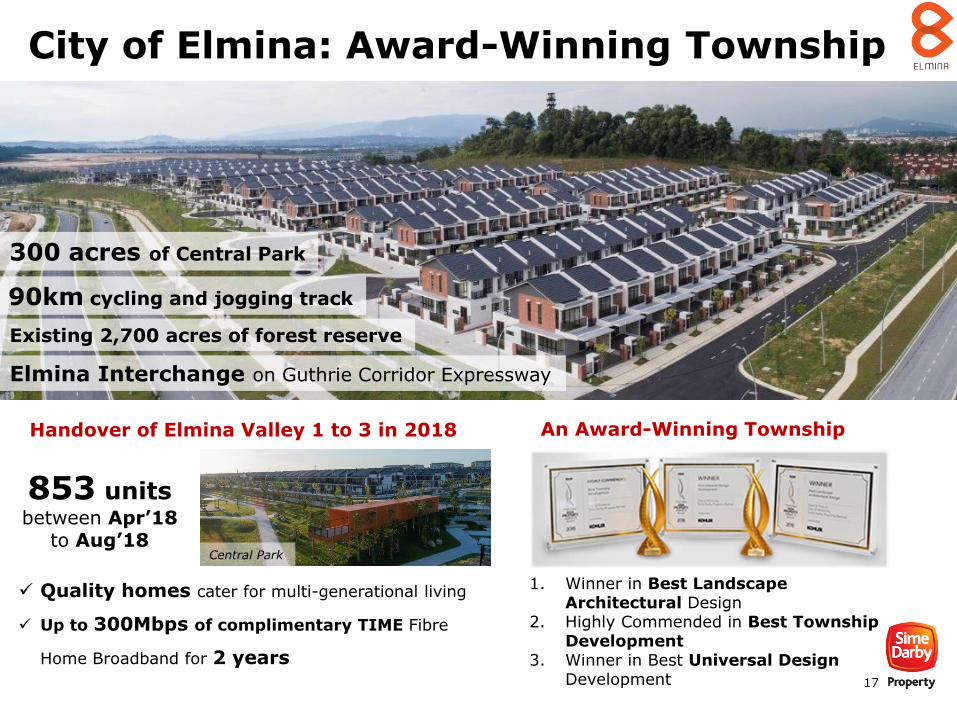
City of Elmina: Award-Winning Township
1. Winner in Best Landscape Architectural Design
2. Highly Commended in Best Township Development
3. Winner in Best Universal Design Development
300 acres of Central Park
90km cycling and jogging track
Existing 2,700 acres of forest reserve
Elmina Interchange on Guthrie Corridor Expressway
853 units between Apr’18
to Aug’18
Quality homes cater for multi-generational living
Up to 300Mbps of complimentary TIME Fibre
Home Broadband for 2 years
An Award-Winning TownshipHandover of Elmina Valley 1 to 3 in 2018
Central Park

18
Moving Forward

19
Headwinds in 2018 - 2019
Re-introduction of Sales and Service Tax (SST)
National Housing Policy
Oversupply of high-rise medium range properties• Industry is producing
faster than the absorption rate
• High number of unsold inventory in Selangor may affect the sales volume of ongoing / new launches
Slowdown in Malaysian economy • Revised GDP growth forecast of 5% from 5.5%
01
03
02
04
• Clarity on the details and uncertainty on the effect of the implementation
• Buyers adopt “wait and see” approach
• Expect moderation in sales performance
• Catalyst to ease the affordability of home buyers
• Waiting for clear scope and parameters of proposed policy
• Streamline effort to deliver affordable houses
20
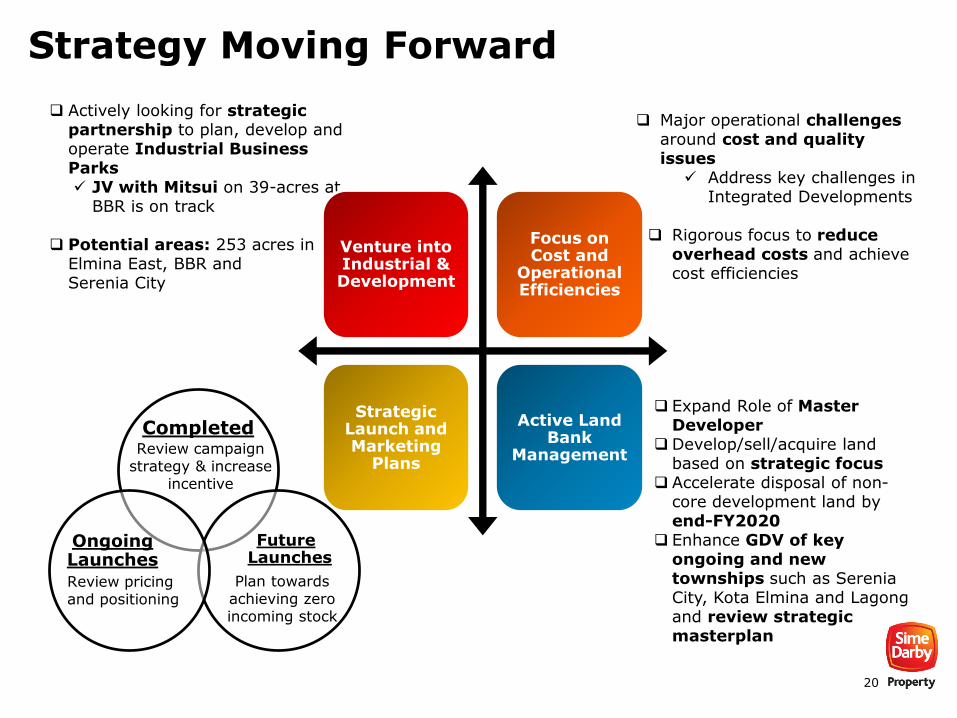
Strategy Moving Forward
Completed
Future Launches
Ongoing Launches
Major operational challengesaround cost and quality issues
Address key challenges in Integrated Developments
Rigorous focus to reduce overhead costs and achieve cost efficiencies
Expand Role of Master Developer
Develop/sell/acquire land based on strategic focus
Accelerate disposal of non-core development land by end-FY2020
Enhance GDV of key ongoing and new townships such as Serenia City, Kota Elmina and Lagong and review strategic masterplan
Actively looking for strategic partnership to plan, develop and operate Industrial Business Parks JV with Mitsui on 39-acres at
BBR is on track
Potential areas: 253 acres in Elmina East, BBR and Serenia City
Venture into Industrial & Development
Focus on Cost and
Operational Efficiencies
Strategic Launch and Marketing
Plans
Active Land Bank
Management Review campaign strategy & increase
incentive
Plan towards achieving zero incoming stock
Review pricing and positioning

21
THANK YOUSIME DARBY PROPERTY INVESTOR RELATIONS
Email Address : [email protected]
Telephone : +(603) 7849 5000
Website : https://www.simedarbyproperty.com/investor-relations

22
APPENDIX
23
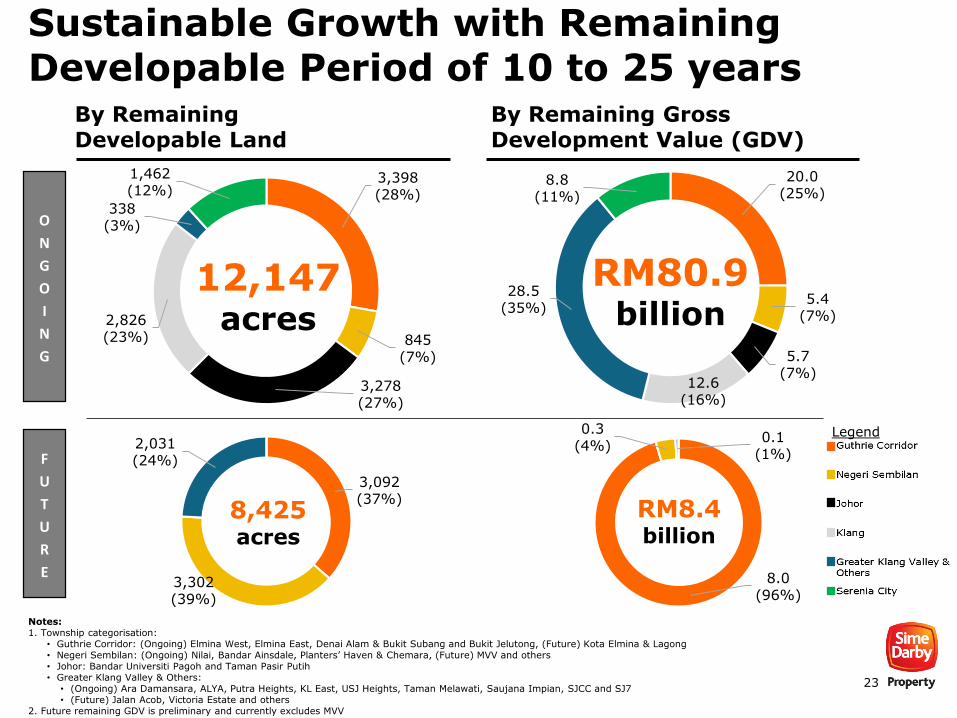
Sustainable Growth with Remaining Developable Period of 10 to 25 years
Notes:1. Township categorisation:
• Guthrie Corridor: (Ongoing) Elmina West, Elmina East, Denai Alam & Bukit Subang and Bukit Jelutong, (Future) Kota Elmina & Lagong• Negeri Sembilan: (Ongoing) Nilai, Bandar Ainsdale, Planters’ Haven & Chemara, (Future) MVV and others• Johor: Bandar Universiti Pagoh and Taman Pasir Putih• Greater Klang Valley & Others:
• (Ongoing) Ara Damansara, ALYA, Putra Heights, KL East, USJ Heights, Taman Melawati, Saujana Impian, SJCC and SJ7• (Future) Jalan Acob, Victoria Estate and others
2. Future remaining GDV is preliminary and currently excludes MVV
By Remaining Developable Land
By Remaining Gross Development Value (GDV)
O
N
G
O
I
N
G
F
U
T
U
R
E
Legend
3,398(28%)
845(7%)
3,278(27%)
2,826(23%)
338(3%)
1,462(12%)
3,092(37%)
3,302(39%)
2,031(24%)
20.0(25%)
5.4(7%)
5.7(7%)
12.6(16%)
28.5(35%)
8.8(11%)
8.0(96%)
0.3(4%)
0.1(1%)
12,147acres
RM80.9billion
8,425acres
RM8.4billion
24
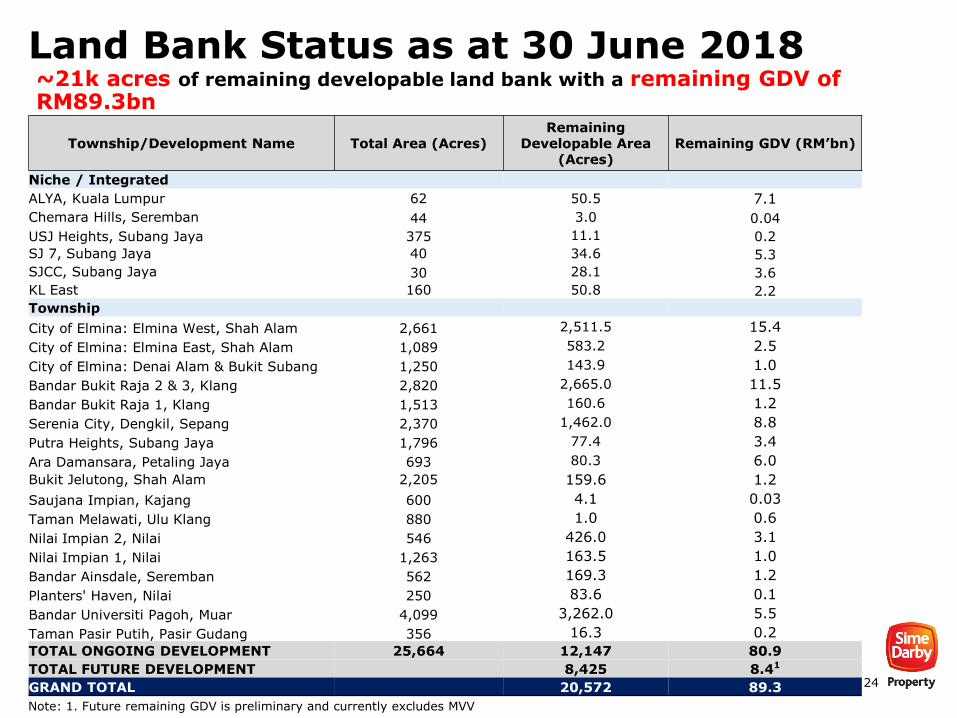
Land Bank Status as at 30 June 2018~21k acres of remaining developable land bank with a remaining GDV of RM89.3bn
Township/Development Name Total Area (Acres)Remaining
Developable Area (Acres)
Remaining GDV (RM’bn)
Niche / Integrated
ALYA, Kuala Lumpur 62 50.5 7.1
Chemara Hills, Seremban 44 3.0 0.04
USJ Heights, Subang Jaya 375 11.1 0.2
SJ 7, Subang Jaya 40 34.6 5.3
SJCC, Subang Jaya 30 28.1 3.6
KL East 160 50.8 2.2
Township
City of Elmina: Elmina West, Shah Alam 2,661 2,511.5 15.4
City of Elmina: Elmina East, Shah Alam 1,089 583.2 2.5
City of Elmina: Denai Alam & Bukit Subang 1,250 143.9 1.0
Bandar Bukit Raja 2 & 3, Klang 2,820 2,665.0 11.5
Bandar Bukit Raja 1, Klang 1,513 160.6 1.2
Serenia City, Dengkil, Sepang 2,370 1,462.0 8.8
Putra Heights, Subang Jaya 1,796 77.4 3.4
Ara Damansara, Petaling Jaya 693 80.3 6.0
Bukit Jelutong, Shah Alam 2,205 159.6 1.2
Saujana Impian, Kajang 600 4.1 0.03
Taman Melawati, Ulu Klang 880 1.0 0.6
Nilai Impian 2, Nilai 546 426.0 3.1
Nilai Impian 1, Nilai 1,263 163.5 1.0
Bandar Ainsdale, Seremban 562 169.3 1.2
Planters' Haven, Nilai 250 83.6 0.1
Bandar Universiti Pagoh, Muar 4,099 3,262.0 5.5
Taman Pasir Putih, Pasir Gudang 356 16.3 0.2
TOTAL ONGOING DEVELOPMENT 25,664 12,147 80.9
TOTAL FUTURE DEVELOPMENT 8,425 8.41
GRAND TOTAL 20,572 89.3
Note: 1. Future remaining GDV is preliminary and currently excludes MVV